Access and Coverage for Mental Health Care for Women

Published: May 6, 2025

Mental health continues to be a growing area of health concern for people, with 90% of Americans saying there is a mental health crisis in the U.S. in a 2023 KFF-CNN poll. Women’s mental health often differs from men’s, with women experiencing some mental health symptoms more commonly than men but also conditions that are unique to women, such as perinatal and perimenopausal depression.

This brief analyzes data from the 2024 KFF Women’s Health Survey (WHS), a nationally representative survey of 6,246 adults ages 18 to 64, including 5,055 women and 1,191 men, conducted from May 15 to June 18, 2024. In addition to several topics related to reproductive health and well-being, the survey asked respondents about their mental health and their experiences accessing mental health services in the past year. This issue brief presents KFF WHS data on access to mental health services among women and men ages 18 to 64, and it also takes a closer look at mental health coverage among women. See the Methodology section for details.

Key Takeaways

  • Nearly three in ten women ages 18 to 64 (28%) describe their mental health or emotional well-being as “fair” or “poor”, including higher shares of women with low incomes (38%) and those who identify as LGBT+ (45%). Nearly three quarters of those who say they have a mental health-related disability (73%) report having “fair/poor” mental well-being.
  • Three in ten (29%) women say they received mental health services in the past 12 months. About half of women who describe their mental health as “fair/poor” say they received mental health care in the past year (48%). While eight in 10 ten women with a self-reported mental health-related disability (81%) say they received care, one in five did not.
  • Among women who report receiving mental health services, the most commonly reported services are one-on-one care with a provider, in-person (60%) and/or via telehealth (55%). Just over half of this group report receiving a prescription for medication (52%). Few women say they received care through a mental health therapy app (7% of those who report receiving services) or other services like in-patient hospitalization or group therapy (8%).
  • Four in ten women overall (38%) say it is difficult for women to get mental health services in their state. One-third (32%) of all women say they did not get mental health services despite needing them, citing barriers such as cost, stigma, or inability to get time off from work.
  • Among women who were able to get mental health care, half (50%) say it is difficult for women to access mental health services in their state, and more than half say they experienced barriers during care-seeking (55%). These challenges include trouble finding a provider that was accepting new patients (25%) or one that accepted their insurance (21%). The large majority of women with Medicaid say their most recent mental health care visit was covered completely by Medicaid (85%), whereas most women with private insurance had to pay some (48%) or all (14%) costs out-of-pocket.
  • Cost is a significant barrier to obtaining mental health services. More than one in ten women 18 to 64 (13%) say they did not get mental health care or could not continue to afford the mental health care they were receiving because of cost. More than twice as many women without insurance (29%) cite cost as a reason for not getting care.

Self-Described Mental Health

In general, slightly larger shares of women describe their mental health status as “fair” or “poor” compared to men (28% vs. 23%). Most women (72%) and men (77%) describe their mental health as either “good” or “excellent/very good” (Figure 1).

As other research has found, younger adults report mental health challenges at higher rates than older adults. Over one third of younger women ages 18 to 25 describe their mental health status as “fair” or “poor” (36%), compared to a smaller share of women ages 50 to 64 (21%). A higher share of 50 to 64 — about half (49%) – describe their mental well-being as “excellent” or “very good,” which is considerably higher than just three in ten (30%) younger women ages 18 to 25.

About 4 in 10 women (38%) who have low incomes (below 200% of the federal poverty level (FPL)) report fair or poor mental health status, nearly double the rate reported by those with higher incomes (21%). Nearly two times as many women who identify as LGBT+ (45%) say their mental health is “fair” or “poor” compared to those who do not identify as LGBT+ (24%). Not surprisingly, nearly three-quarters of women who identify as having a mental health-related disability (73%) say they have “fair” or “poor” mental health, three times the rate of those who do not identify as being disabled (24%) or who have another non-mental health disability (27%).

Nearly Three Quarters of Women Who Identify as Having a Mental Health-Related Disability Report Fair/Poor Mental Health

Mental Health Care Utilization

Not only do a slightly larger share of women than men report poorer mental health status, but compared to men, a somewhat larger share of women report receiving mental health care in the past 12 months (Figure 2). Roughly three in the ten women (29%) say they received mental health services from a mental health professional, compared to 22% of men.

Younger women are also more likely to use mental health services than older women. One in three women under the age of 50 say they received professional mental health care in the past year, compared to just 22% of women between age 50 and 64. Compared to their White counterparts (31%), smaller shares of Asian (19%) and Hispanic (24%) women say they received mental health care in the past year, consistent with previous mental health findings from KFF polling. Black (30%) and White women report obtaining mental health care at similar rates.

Consistent with the findings on self-described mental well-being, nearly twice as many women who identify as LGBT+ (45%) than those who do not (27%) say they received mental health care in the past 12 months. Similarly, eight in ten women who identify as having a mental health-related disability (81%) say they received mental health services, compared to 27% of women who identify as having another disability and 18% of women who do not identify as disabled.

Higher shares of women with lower incomes and those covered by Medicaid say they obtained mental health services compared to their higher income and privately insured counterparts. While mental health services can be very costly and private insurance coverage is often limited and associated with high out-of-pocket costs, Medicaid, a program designed for people with low incomes, typically has nominal or very low out-of-pocket costs for enrollees.

While use of mental health services is higher among many of the subpopulations that rate their mental health lower, still about half (48%) of women who rate their mental health as “fair” or “poor” say they obtained mental health care, suggesting that many women with “fair” or “poor” mental health who could benefit from care are not getting it. The survey also shows that mental health services are used by people across the mental health continuum. Three in ten (31%) women who rate their mental health as “good” and more than one in ten (13%) who describe it as “excellent” or “very good” say they received care in the past year.

Less Than Half of Women With Fair or Poor Mental Health Report Receiving Mental Health Services in the Past 12 Months

When asked what kind of mental health services they received in the past 12 months, most women who say they received care say they received 1-on-1 care with a provider, either in-person (60%) or via telehealth (55%). About half of women who say they received mental health care in the past year report getting a prescription for a medication (52%).

Fewer than one in ten women who report receiving care (7%) say they received care through a mental health therapy app, like BetterHelp or Talkspace, which connect patients to a clinician for virtual appointments but outside of the traditional medical system, or through another avenue (8%) such as inpatient hospitalization or group therapy (Table 1).

The types of mental health services women use vary by demographics. While similar shares of women across all age groups say they received in-person 1-on-1 care with a provider, larger shares of women ages 26 to 35 compared to women ages 50 to 64 say they used digital services for care, such as telehealth services (59% vs. 49%, respectively) and care through a mental health therapy app (8% vs. 3%, respectively). One in ten women ages 18 to 25 who say they received care say they received care through a mental health therapy app. There were no statistically significant differences by age for prescription medications and other mental health services.

Among those who report receiving mental health services in the past year, nearly six in ten (59%) women who rate their mental health as “fair” or “poor” report receiving a prescription medication, as do half (50%) of women who describe their mental health as “good” and more than a third (37%) of those who rate it as “excellent/very good.”

Among those who report receiving mental health care, larger shares of women who identify as LGBT+ than those are not LGBT+ say they accessed mental health care through telehealth service (65% vs. 52%) or through a mental health therapy app (12% vs 6%). More women who identify as LGBT+ also say they received a prescription for a medication compared to their non-LGBT+ counterparts (60% vs. 50%).

Over half of women say they received more than one type of mental health service in the past 12 months (58%). Higher shares of women with “fair” or “poor” mental health (65%) and/or who identify as having a mental health-related disability (73%) say they received more than one type of service in the past year.

Mental Health Services Used By Women 18 to 64

Coverage of Mental Health Services

While federal laws require parity for insurance coverage of mental health care, gaps in coverage remain. All state Medicaid programs provide coverage for mental health services for beneficiaries with low incomes, and the Affordable Care Act (ACA) requires most individual and small group insurance insurers to cover behavioral health care, which includes mental health services. However, the scope of coverage varies, provider networks are limited in many plans, and mental health providers may not accept all insurance plans or in some cases, any insurance.

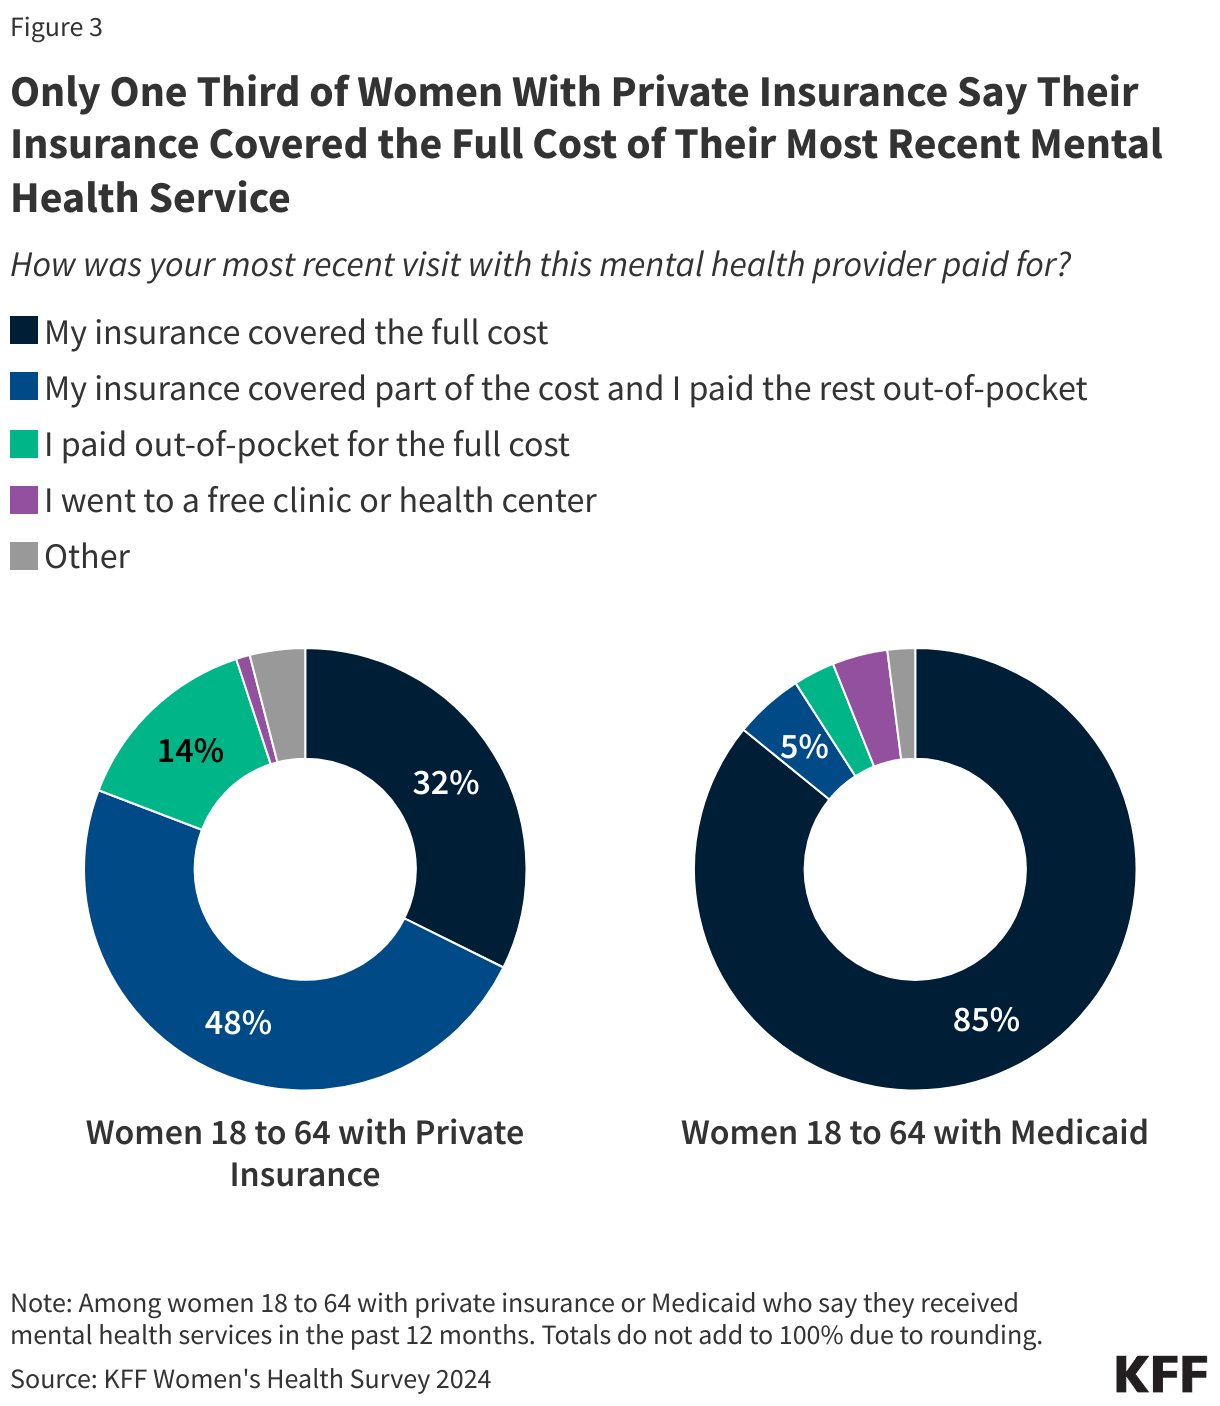
The large majority of women with Medicaid coverage who access care say their most recent visit was completely covered by Medicaid (85%) (Figure 3). Of the remaining 15%, 4% say they received free services at a clinic or health center. Medicaid is the single largest payer of behavioral health services, which includes mental health care and substance use services. By design, Medicaid charges very little cost-sharing.

Most women with private insurance say they had to pay at least some out-of-pocket costs for their most recent mental health care. Nearly half (48%) paid some of the cost out-of-pocket while their insurance covered part of the cost and 14% paid the full cost out-of-pocket. About one in three (32%) women with private insurance say their most recent visit was completely covered by their insurance plan.

Only One Third of Women With Private Insurance Say Their Insurance Covered the Full Cost of Their Most Recent Mental Health Service

Barriers to Accessing Mental Health Care

Overall, four in ten women (38%) say it is difficult to access mental health services in their state, but this share rises to half (49%) among women who say they recently received mental health care in the past year (Figure 4).

Among Women Who Say They Received Mental Health Care in the Past 12 Months, Half Say It Is Difficult to Get Mental Health Services in Their State

One in three women (32%) say they did not get mental health services in the past year even though they needed them (Figure 5). More than one third of women younger than 50 say they did not get the care they needed compared to 22% of women 50 to 64. Four in ten uninsured women (40%) say they needed mental health care but did not get it, compared to 31% of women with private insurance. Half of women who identify as LGBT+ (50%) say they needed mental health care but did not get it, compared to three in ten who do not identify as LGBT+ (29%). Similarly, nearly half of women with a mental health disability (47%) say they did not get mental health care even though they needed it. More than half of women with “fair” or “poor” mental health did not get the care they say they needed (55%).

One in Three Women Say They Did Not Get Mental Health Services Even Though They Needed Them, Including Over Half of Those Who Describe Their Mental Health as Fair or Poor

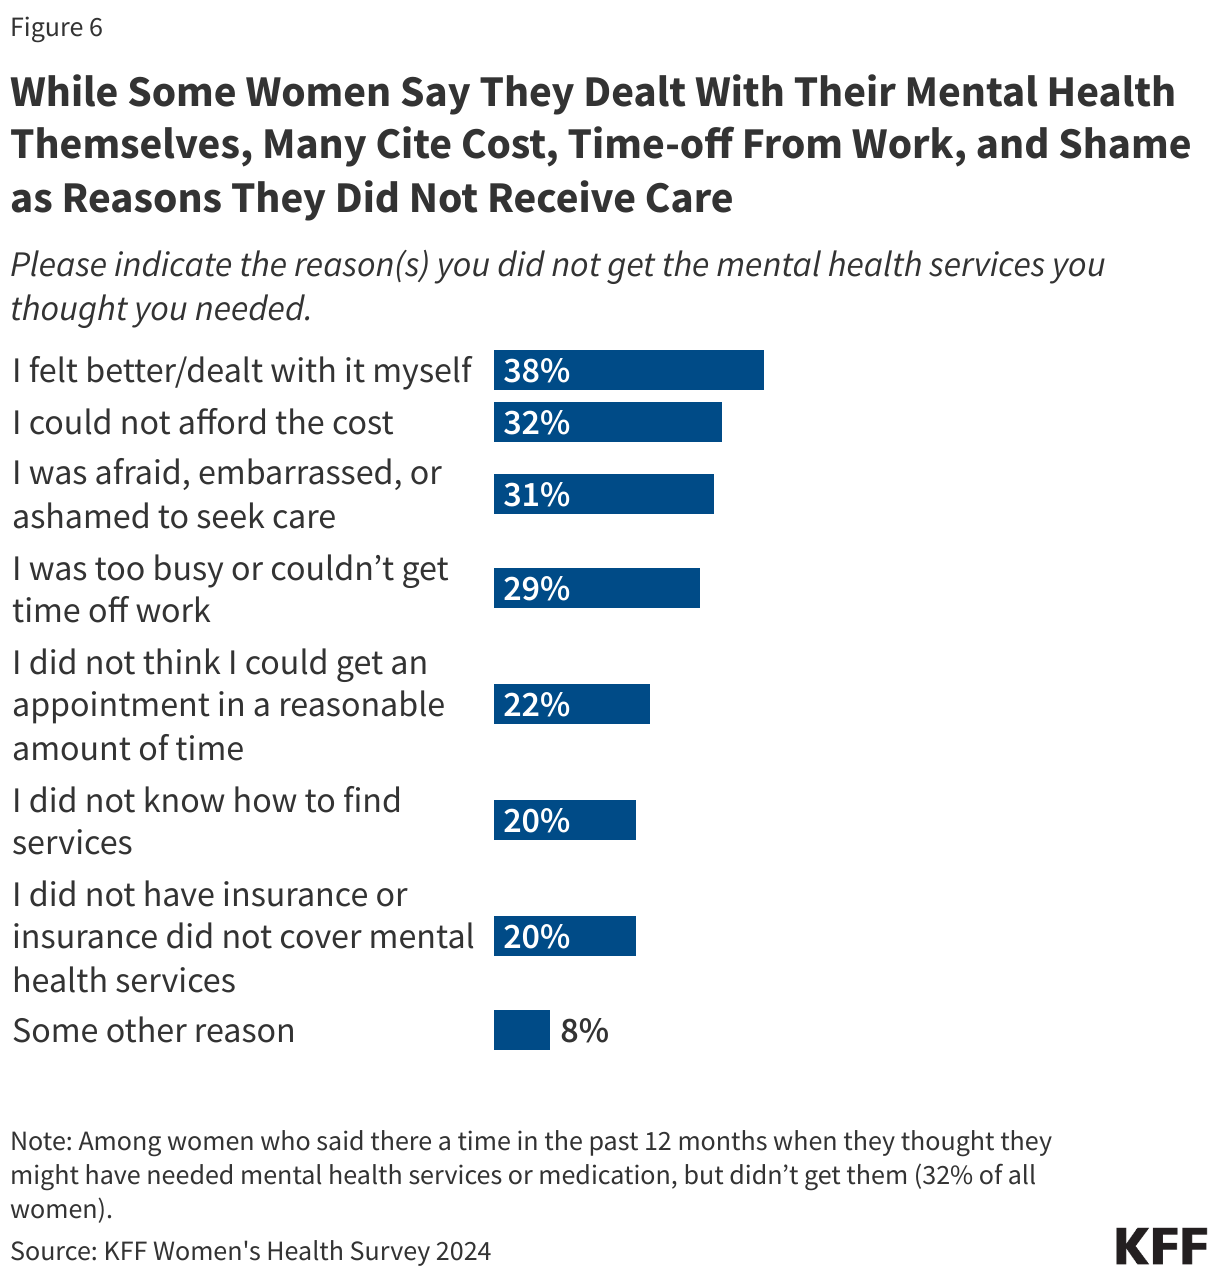
When asked to indicate the reason(s) why they did not get the care they needed, many women say they did not get care because they felt better or dealt with their mental health issues by themselves (38%) (Figure 6). However, three in ten women who say they did not get needed care cite cost (32%), being unable to take time off from work or being too busy (29%), or feeling afraid, embarrassed, or ashamed to seek care (31%). A small share of women cites some other reason (8%), such as transportation barriers or challenges with reaching providers to coordinate a visit.

While Some Women Say They Dealt With Their Mental Health Themselves, Many Cite Cost, Time-off From Work, and Shame as Reasons They Did Not Receive Care

It is not uncommon for those who receive care to also experience challenges while trying to find care. Among women who received mental health care in the past 12 months, more than half (55%) say they experienced a barrier during their care seeking journey (Figure 7). One in four women who say they received care say they had trouble finding a provider that was accepting new patients (25%) and about one in five had trouble finding a provider that accepted their insurance (21%). One in four women who received mental health care in the past year say they had trouble scheduling an appointment in a reasonable amount of time (24%).

There were few differences between women of different subgroup, with the exception of higher shares of LGBT+ women experienced challenges getting mental health services (66%) compared to 52% of women who do not identify as LGBT+, including trouble finding a provider, and affording the cost. These findings reflect well documented shortages, burnout, and high demand among clinicians in the mental health profession.

More Than Half of Women Say They Experienced Barriers When Trying To Get Care

While only 5% of all women say they had difficulty finding a provider who spoke their language or one from a similar racial or ethnic background as themselves, these findings vary by race/ethnicity. Significantly larger shares of Hispanic (11%) and Black (8%) women report facing this challenge, compared to just 1% of White women (Figure 7). These findings are consistent with previous KFF polling, underscoring the additional and disproportionate challenges people of color face when accessing mental health care.

Larger Shares of Women of Color Say They Had Difficulty Finding a Mental Health Care Provider From a Similar Racial/Ethnic Background As Themselves

Cost continues to be a commonly reported barrier to mental health care. More than one in ten women 18 to 64 (13%) say they did not get mental health care or could not continue to afford the mental health care they were receiving because of cost (Figure 9). Thirteen percent (13%) of women with private insurance say they did not get care because of cost, and more than twice as many women without insurance (29%) cite cost as reason for not getting care. The share is lower among women with Medicaid, reflecting the program’s important role in providing access to mental health services, but still 8% cite cost as a barrier. The barriers are multi-pronged. Insurance networks can be very narrow for mental health care, and a significant portion of mental health clinicians do not participate in insurance networks. These findings on cost barriers underscore the ongoing challenges with affordable mental health care, especially among the uninsured, but even for those with coverage.

Cost Of Mental Health Services Is A Barrier to Care Especially For Uninsured Women, But Also For Those With Insurance
Poll Finding

KFF Tracking Poll on Health Information and Trust: Vaccine Safety and Trust

Published: May 6, 2025

Findings

Key Findings

  • As the Trump administration attempts to overhaul many government health agencies, the latest KFF Tracking Poll on Health Information and Trust finds that partisans’ trust in these agencies as sources of reliable vaccine information has shifted from where it stood under the Biden administration with trust declining among Democrats and rising among Republicans. While Democrats remain more likely than Republicans to trust the U.S. Centers for Disease Control and Prevention (CDC) and U.S. Food and Drug Administration (FDA), the share of Republicans who have a “great deal” or “fair amount” of trust in these agencies to provide vaccine information has increased by about 10 percentage points from 2023. Concurrently, trust in these agencies as reliable sources of vaccine information has fallen among Democrats by double digits, including for the CDC (70% now v. 88% in 2023) and the FDA (67% v. 86%).
  • Less than half of the public express confidence in government health agencies like the CDC and FDA to carry out many of their core responsibilities, including just three in ten (32%) who have confidence in them to act independently without interference from outside interests. Six in ten adults — including three in four Democrats and nearly half of Republicans — say these agencies are not paying enough attention to science when it comes to making decisions and recommendations about vaccines. In addition, at least three in ten say these agencies are paying “too much attention” to the beliefs of officials running the agencies (34%) and the interests of pharmaceutical companies (30%) when making vaccine-related decisions.
  • Most adults say they are at least “somewhat confident” in the safety of many routine vaccines, including those for measles (83%), the flu (74%), and — among adults ages 50 and older for whom these vaccines are recommended — pneumonia (82%) and shingles (79%). The public, however, remains less confident in the safety of the COVID-19 vaccine amid continued partisan disagreement. Just over half (56%) of adults say they are at least “somewhat confident” that the COVID-19 vaccines are safe, including nearly nine in ten Democrats (87%), about half of independents (55%), but just three in ten Republicans.
  • With the public split in their confidence of the safety of COVID-19 vaccines, the oft-politicized mRNA technology that many of these vaccines rely on remains obscure to much of the public. About twice as many adults think vaccines that use mRNA technology are “generally safe” (32%) as say they are “generally unsafe” (16%), but about half (52%) report not knowing enough about this technology to say. In addition, nearly half of the public (45%) report having heard the false claim that mRNA vaccines can alter a person’s DNA – a myth related to COVID-19 vaccines that began circulating early in the pandemic. While just 3% think this claim is “definitely true,” most are uncertain, saying it is either “probably true” (26%) or “probably false” (45%). However, there are important differences by party identification and ethnicity when it comes to believing or leaning toward believing the myth that mRNA vaccines alter DNA, with at least one-third of Republicans (37%), independents (33%), and Hispanic adults (38%) saying the claim is either “definitely true” or “probably true.”

Partisan Trust in Government Health Agencies and Officials as Reliable Sources of Vaccine Information

The latest Tracking Poll on Health Information and Trust finds that partisan trust in government health agencies on vaccines has shifted notably since the Biden administration, with trust declining among Democrats and rising among Republicans.

Overall, doctors remain the most trusted source of reliable vaccine information among the public with eight in ten adults (83%) saying they trust their doctor or health care provider a “great deal” or “fair amount” to provide reliable information about vaccines and a similar share (81%) of parents saying they trust their child’s pediatrician. Smaller shares of the public, but still a majority, say they trust government health agencies, including their local public health department (66%), the U.S. Centers for Disease Control and Prevention, or CDC (59%), or the U.S. Food and Drug Administration, or FDA (57%) to provide reliable information about vaccines. About half of the public (51%) say they trust pharmaceutical companies at least a “fair amount” as source of reliable vaccine information. Fewer than half of adults – or about four in ten – say they trust Health and Human Services Secretary Robert F. Kennedy Jr. (41%) or President Trump (37%) to provide reliable information about vaccines.

Doctors and Pediatricians Are the Most Trusted Sources of Vaccine Information Among the Public and Parents, While Fewer Than Half Trust Trump or RFK Jr. on Vaccines

The share of adults who say they have a “great deal” or “fair amount” of trust in the CDC and the FDA to provide reliable information about vaccines is similar to the share who said so in September 2023. However, this apparent stability masks some notable shifts in partisan trust amid a change in leadership at these agencies. Fewer Democrats – though still a majority — now say they have a “great deal” or “fair amount” of trust in the CDC (70% now v. 88% in 2023) and the FDA (67% v. 86%) to provide reliable information on vaccines. Conversely, the share of Republicans who express trust in these agencies has risen by about ten percentage points, with about half of Republicans now saying they trust the CDC (51% now up from 40% in 2023) and the FDA (52% v. 42%) to provide information on vaccines.

While Democrats are still more likely than Republicans to trust either the CDC or FDA as a source of vaccine information, the shifts in trust mark a notable reversal in partisan trends first observed during the start of the COVID-19 pandemic. In 2022, KFF tracking polls showed declining trust in government health agencies to provide information about COVID-19 vaccines – a change largely driven by declining trust among Republicans alongside consistently higher levels of trust among Democrats. More recent KFF polling has shown declining trust in government agencies to provide health information in general among the public, with trust declining among both Democrats and Republicans in some cases. The most recent uptick among Republicans and decline among Democrats in trust of the CDC and FDA may be a reflection of polarized views on the Trump administration’s efforts to overhaul government health agencies and shift vaccine policy and messaging, including the way vaccines are tested.

The Share of Democrats Who Trust the CDC and FDA as a Source of Reliable Vaccine Information Has Declined Significantly, While Republican Trust Has Risen

While individual doctors garner the highest shares of trust across partisan groups, there are partisan gaps in trust in nearly all sources of vaccine information. At least eight in ten Democrats, independents and Republicans say they trust their own doctor or health care provider “a great deal” or “fair amount” to provide reliable information about vaccines; however, Democrats are more likely than Republicans to say this (93% v. 78%). Similarly, while majorities of parents regardless of partisanship trust their child’s pediatrician at least a fair amount to provide reliable vaccine information, Democratic parents are more likely than Republican parents to say so (91% v. 73%). Notably, about one in four (27%) Republican parents say they trust their child’s pediatrician “not much” or “not at all” to provide reliable information about vaccines.

Beyond the CDC and FDA, there are additional divides in trust between Democrats and Republicans on the share who trust their local public health department (83% of Democrats v. 51% of Republicans), pharmaceutical companies (69% v. 39%), and among parents, their child’s school or day care (71% v. 33%). These partisan divides in trust are consistent with findings from previous KFF polling.

Republicans are much more likely than both independents and Democrats to say they trust President Trump and Health and Human Services Secretary Robert F. Kennedy Jr. as reliable sources of vaccine information. Three quarters of Republicans say they have a “great deal” or “fair amount” of trust in President Trump (74%) and Robert F. Kennedy Jr. (73%) to provide reliable information about vaccines. This is considerably larger than the share of independents and Democrats who say they trust either as reliable sources of vaccine information: 30% of independents and 10% of Democrats say they trust President Trump, while 35% of independents and 16% of Democrats say they trust Secretary Kennedy.

Notably, Republicans are as likely to say they trust President Trump and Secretary Kennedy as they are to say they trust their own doctor as a source of reliable vaccine information.

Interactive DataWrapper Embed

Confidence in Federal Government Health Agencies To Carry Out Responsibilities

Even as majorities of the public express trust in government health agencies to provide information on vaccines, less than half of the public express at least some confidence in agencies like the CDC and FDA to carry out many of their responsibilities, such as ensuring the safety and effectiveness of prescription drugs (46%) or to ensure the safety and effectiveness of vaccines approved for use in the U.S. (45%). About four in ten (42%) have confidence in government health agencies to respond to outbreaks of infectious diseases. Even fewer, or one-third (32%), express at least “some” confidence in government health agencies to act independently without interference from outside interests. Fewer than one in five adults say they have “a lot” of trust in these agencies to fulfill each of these tasks.

Fewer Than Half of the Public Express Confidence in Government Health Agencies To Ensure Safety of Prescription Drugs or Vaccines, Respond to Disease Outbreaks, or Act Independently

Less than half of Democrats, independents, and Republicans have at least “some” confidence in government health agencies to ensure the safety of prescription drugs, respond to infectious disease outbreaks, or act independently without outside interference. Democrats, however, are more likely than Republicans to say they have “some” trust in government health agencies to ensure the safety and effectiveness of vaccines (52% v. 43%). However, similar shares of Democrats and Republicans express confidence in these agencies to ensure the safety of prescription drugs, respond to infectious disease outbreaks, or act independently.

Across Partisanship, Half or Fewer Are Confident in Government Health Agencies To Carry Out Key Responsibilities, but Democrats Are More Likely Than Republicans To Express Confidence on Vaccine Safety

One reason behind a lack of confidence in government health agencies may be that most of the public, including larger shares of Democrats, say that under the Trump administration, government health agencies like the CDC and FDA are not paying enough attention to science when making decisions about vaccines. Six in ten adults say these agencies are not paying enough attention to science when making decisions about vaccines, while one-third say they are paying “about the right amount of attention” (34%) and fewer than one in ten say they pay “too much attention” to science (6%). The share of adults who now say government health agencies are not paying enough attention to science when making decisions about vaccines is higher than the share who expressed similar sentiments in September 2020, when just under half of adults said that under the Trump administration, the CDC and FDA were not paying enough attention to science when reviewing and approving treatments for coronavirus.

Health and Human Services Secretary Robert F. Kennedy Jr. has raised question about pharmaceutical companies’ influence and conflicts of interest within government health agencies, while Kennedy himself has faced criticisms over how his own views on vaccines might influence government policy. The public is split over whether government health agencies are paying the right amount of attention to pharmaceutical companies or the beliefs of officials running the agencies when making decisions about vaccines. Three in ten adults say government health agencies are paying “too much attention” to the interests of pharmaceutical companies and similar shares say they are paying “about the right amount of attention,” while four in ten say they are paying “not enough attention.” Adults are similarly divided over whether government health agencies are paying the right amount of attention to the beliefs of officials running these agencies, with similar shares saying they’re either paying “too much attention” (34%), “not enough attention” (36%) or “about the right amount of attention” (29%) when it comes to making decisions or recommendations about vaccines.

Six in Ten Adults Say Government Health Agencies Like the CDC and FDA Are Not Paying Enough Attention to Science

Democrats are much more likely than Republicans to say government health agencies like the CDC and FDA are not paying enough attention to science when making decisions about vaccines (73% v. 45%). On the other hand, Republicans are more than twice as likely as Democrats to say government health agencies are paying about the “right amount of attention” to the beliefs of officials running these agencies (45% v. 19%).

Most Democrats and Independents Say Government Health Agencies Are Not Paying Enough Attention to Science Compared to Just Under Half of Republicans

Confidence in Vaccine Safety and Views of mRNA Vaccines

A majority of the public continues to express confidence in the safety of most routine vaccines; however, nearly four years since they were first approved for use, views on the COVID-19 vaccines remain divisive and largely partisan, consistent with prior KFF polling.

At least three in four adults, including majorities across partisans, say they are either “very confident” or “somewhat confident” that vaccines for measles, mumps, rubella (83%) or the flu (74%) are safe. Among adults ages 50 and older – for whom the CDC currently recommends both the pneumonia and shingles vaccines – eight in ten say they think vaccines for pneumonia (82%) or shingles (79%) are safe, including majorities across partisans.

However, confidence in the safety of the COVID-19 vaccine is much lower than these other routine vaccines. About half (56%) of adults say they are at least “somewhat confident” that the COVID-19 vaccines are safe, including nine in ten (87%) Democrats compared to just three in ten Republicans. The share of the public and partisans who express confidence in the safety in the flu and COVID-19 vaccines has not changed notably since September 2023. For more information on the public’s views on measles and the MMR vaccines, see KFF’s prior release from the April Tracking Poll on Health Information and Trust.

Majorities Are Confident in the Safety of Many Routine Vaccinations, but the Safety of COVID-19 Vaccines Remain Divisive

Many of the COVID-19 vaccines – including other vaccines under development for diseases including cancer – rely on a vaccine technology known as messenger-RNA (mRNA). COVID-19 vaccines that use mRNA technology have been proven safe and effective but have long been the subject of misinformation and recently come under attack, with Republican legislators in some states recently attempting to ban or limit the use of mRNA vaccines and the National Institutes of Health (NIH) reportedly urging scientists to remove references to the technology from their grant applications.

The latest poll finds that while few adults think mRNA vaccines are unsafe, many say they don’t know enough about the technology to have an opinion. Overall, one-third (32%) of adults say vaccines that use mRNA technology are “generally safe” compared to about one in six (16%) who say they are “generally unsafe.” But at the same time, about half of the public (52%) say they do not know enough about this technology to say. At least one in five Republicans (23%) and independents (18%) say they think mRNA vaccines are “generally unsafe” compared to far fewer Democrats (3%), but still, most Republicans (61%) and roughly half of independents and Democrats say they do not know enough to say whether mRNA vaccines are safe or not.

At Least Half of the Public and Partisans Don’t Know Enough About mRNA Vaccines To Say Whether They Are Safe, Though Democrats Are Less Likely To Believe They Are Unsafe

Large shares of the public report having heard the false claim that mRNA vaccines alter your DNA – a persistent myth that began circulating early on during the COVID-19 pandemic — and while few think this is definitely true, most are uncertain. Exposure to and uncertainty surrounding this false claim has existed since early on in the COVID-19 pandemic, when KFF polling found that about one in five adults who had heard the claim believed or were unsure whether COVID-19 vaccines could change your DNA.

About half of the public (45%) say they have read or heard the false claim that mRNA vaccines can change your DNA, including about half of Republicans (48%) and independents (47%) and four in ten Democrats (38%). Exposure to the false claim also differs across race and ethnicity. About half (51%) of White adults say they have heard the myth that mRNA vaccines can alter DNA compared to fewer Hispanic adults (35%) and Black adults (27%).

About Half of the Public Say They Have Heard the False Claim That mRNA Vaccines Can Change Your DNA, Including Larger Shares of Republicans, Independents, and White Adults

With about half the public saying they have heard the myth that mRNA vaccines alter your DNA, just 3% of all adults say they think this claim is “definitely true,” and a quarter (24%) say it is “definitely false.” However, as previous KFF polling has found on a wide array of misinformation topics, most adults express uncertainty and fall in the “malleable middle” with seven in ten saying it is either “probably true” (26%) or “probably false” (45%) including majorities of Republicans and independents, and about half of Democrats.

While at least four in ten across party and race and ethnicity say they think this false claim is “probably false,” larger shares of Republicans, independents, and Hispanic adults believe or lean toward believing it, saying it is “probably true” or “definitely true.” Overall, three in ten adults say it is “definitely” or “probably true” that mRNA vaccines can change your DNA, but this increases to 37% of Republicans and one in three independents (compared to 13% of Democrats). About four in ten (38%) Hispanic adults believe or lean toward believing the myth that mRNA technology alters DNA, compared to about a quarter of White adults (28%) and Black adults (26%).

Large Majorities of the Public and Partisans Are Uncertain if the Myth That mRNA Vaccines Can Change Your DNA Is True

Believing or leaning toward believing the myth that mRNA vaccines can alter your DNA is tied to negative perceptions of the COVID-19 vaccines’ safety. Among those who say it is “definitely true” or “probably true” that mRNA vaccines change your DNA, a large majority (77%) say they are not confident that the COVID-19 vaccines are safe, including half (51%) who say they are “not at all confident.” While the vast majority of those who say it is “definitely false” that mRNA vaccines alter DNA in turn express confidence in the safety of the COVID-19 vaccines (86%), confidence drops among those who lean toward thinking this is false, with just six in ten (63%) of those who say this myth is “probably false” expressing confidence in the COVID-19 vaccine’s safety.

Adults Who Believe or Lean Toward Believing the Myth That mRNA Vaccines Alter Your DNA Largely Lack Confidence in the COVID-19 Vaccine's Safety

Methodology

This KFF Health Tracking Poll/KFF Tracking Poll on Health Information and Trust was designed and analyzed by public opinion researchers at KFF. The survey was conducted April 8-15, 2025, online and by telephone among a nationally representative sample of 1,380 U.S. adults in English (1,322) and in Spanish (58). The sample includes 1,022 adults (n=48 in Spanish) reached through the SSRS Opinion Panel either online (n=997) or over the phone (n=25). The SSRS Opinion Panel is a nationally representative probability-based panel where panel members are recruited randomly in one of two ways: (a) Through invitations mailed to respondents randomly sampled from an Address-Based Sample (ABS) provided by Marketing Systems Groups (MSG) through the U.S. Postal Service’s Computerized Delivery Sequence (CDS); (b) from a dual-frame random digit dial (RDD) sample provided by MSG. For the online panel component, invitations were sent to panel members by email followed by up to three reminder emails.

Another 358 (n=17 in Spanish) adults were reached through random digit dial telephone sample of prepaid cell phone numbers obtained through MSG. Phone numbers used for the prepaid cell phone component were randomly generated from a cell phone sampling frame with disproportionate stratification aimed at reaching Hispanic and non-Hispanic Black respondents. Stratification was based on incidence of the race/ethnicity groups within each frame. Among this prepaid cell phone component, 194 were interviewed by phone and 164 were invited to the web survey via short message service (SMS).

Respondents in the prepaid cell phone sample who were interviewed by phone received a $15 incentive via a check received by mail. Respondents in the prepaid cell phone sample reached via SMS received a $10 electronic gift card incentive. SSRS Opinion Panel respondents received a $5 electronic gift card incentive (some harder-to-reach groups received a $10 electronic gift card). In order to ensure data quality, cases were removed if they failed two or more quality checks: (1) attention check questions in the online version of the questionnaire, (2) had over 30% item non-response, or (3) had a length less than one quarter of the mean length by mode. Based on this criterion, no cases were removed.

The combined cell phone and panel samples were weighted to match the sample’s demographics to the national U.S. adult population using data from the Census Bureau’s 2024 Current Population Survey (CPS), September 2023 Volunteering and Civic Life Supplement data from the CPS, and the 2024 KFF Benchmarking Survey with ABS and prepaid cell phone samples. The demographic variables included in weighting for the general population sample are sex, age, education, race/ethnicity, region, civic engagement, frequency of internet use, political party identification by race/ethnicity, and education. The weights account for differences in the probability of selection for each sample type (prepaid cell phone and panel). This includes adjustment for the sample design and geographic stratification of the cell phone sample, within household probability of selection, and the design of the panel-recruitment procedure.

The margin of sampling error including the design effect for the full sample is plus or minus 3 percentage points Numbers of respondents and margins of sampling error for key subgroups are shown in the table below. For results based on other subgroups, the margin of sampling error may be higher. Sample sizes and margins of sampling error for other subgroups are available on request. Sampling error is only one of many potential sources of error and there may be other unmeasured error in this or any other public opinion poll. KFF public opinion and survey research is a charter member of the Transparency Initiative of the American Association for Public Opinion Research.

GroupN (unweighted)M.O.S.E.
Total1,380± 3 percentage points
Parents of children under 18457± 6 percentage points
Party ID
Democrats469± 6 percentage points
Independents466± 5 percentage points
Republicans361± 6 percentage points


News Release

As COVID-19 Divisions, Attacks, and Misinformation Take Their Toll, Less Than Half of the Public Is Confident That the CDC and FDA Can Carry Out Core Functions 

Under the Trump Administration, Democrats’ Confidence in Federal Agencies’ Vaccine Information Falls Sharply, While Republicans’ Trust Increases

Published: May 6, 2025

Five years after the start of  COVID-19 pandemic and the communications challenges, divisions, and false claims that followed, less than half of the public say they have at least some confidence in the federal government’s health agencies like the Centers for Disease Control and Prevention (CDC) and the Food and Drug Administration (FDA) to carry out many of their core responsibilities, a new KFF Tracking Poll on Health Information and Trust finds.The low levels of confidence apply to federal agencies’ ability to ensure the safety and effectiveness of prescription drugs (46% express at least some confidence) and vaccines (45%), and to respond to outbreaks of infectious diseases (42%). Even fewer (32%) express at least “some” confidence in the agencies to act independently without interference from outside interests. 

When it comes to vaccines specifically, close to six in 10 adults have at least “a fair amount” of trust in either the FDA (57%) or CDC (59%) to provide reliable information. That leaves about four in 10 who say they trust the two institutions “not much” or “not at all” when it comes to vaccines (43% for the FDA, 41% for the CDC).The overall level of trust in each case is similar to where it stood in September 2023, though the poll reveals significant partisan shifts as the second Trump administration and Health and Human Services Secretary Robert F. Kennedy Jr. have started to change vaccine policies and messaging.The shares of Democrats who say they trust the FDA and CDC have fallen by nearly 20 percentage points since 2023, while the shares of Republicans who trust each of the agencies have increased by about 10 points. While those shifts have narrowed a partisan divide on trust, Democrats remain more likely than Republicans to say they trust each agency’s vaccine information.

“There are remarkably low levels of trust in the nation’s scientific agencies, shaped by partisan perspectives, and that presents a real danger for the country if and when another pandemic hits,” KFF President and CEO Drew Altman said. 

Amid the Trump administration’s ongoing changes to vaccine policy that could affect COVID-19 vaccines relying on mRNA technology, the poll finds that nearly half (45%) of the public say they’ve heard or read about the false claim that the mRNA vaccines such as those used for COVID-19 can change their DNA. 

Very few (3%) say the false claim is “definitely true,” while a quarter (24%) say it is “definitely false.” Most are unsure, saying the claim is “probably true” (26%) or “probably false” (45%).

About a third (32%) of adults say vaccines that use mRNA technology are “generally safe” compared to about one in six (16%) who say they are “generally unsafe.” At the same time, about half of the public (52%) say they do not know enough about this technology to say. At least one in five Republicans (23%) and independents (18%) say they think mRNA vaccines are unsafe compared to far fewer Democrats (3%).

Other findings include:

  • Six in 10 adults (60%) say that under the Trump administration, federal health agencies are not paying enough attention to science. This includes most Democrats (73%) and independents (63%) but less than half of Republicans (45%).
  • Large majorities of the public are at least somewhat confident in the safety of most vaccines, including those for measles, mumps and rubella (83%), the flu (74%), and, among those ages 50 and older, pneumonia (82%) and shingles (79%). A narrower majority (56%) has confidence in the safety of COVID-19 vaccines, reflecting low confidence among Republicans (30%). 

The poll is part of KFF’s Health Information and Trust Initiative, which is aimed at tracking health misinformation in the U.S., analyzing its impact on the American people, and mobilizing media to address the problem. 

Designed and analyzed by public opinion researchers at KFF, this survey was conducted April 8-15, 2025, online and by telephone among a nationally representative sample of 1,380 U.S. adults in English and in Spanish. The margin of sampling error is plus or minus 3 percentage points for the full sample. For results based on other subgroups, the margin of sampling error may be higher.

Medicaid Covers at Least One in Five Hospital Inpatient Days in Nearly Every State

Published: May 5, 2025

The House and Senate are working on legislation to meet the requirements in the budget resolution, specifying cuts to Medicaid of up to $880 billion or more over 10 years. Large reductions in Medicaid spending are likely to have direct implications for the 83 million people covered by Medicaid, state budgets, and health care providers, including hospitals. Medicaid accounted for about one fifth (19%) of all spending on hospital care in 2023 and cuts to payments for care or loss of coverage could have implications for hospitals’ finances, the cost and quality of care, and people’s ability to access hospital services. There could be consequences for the broader economy too given that hospitals are the sixth largest employer in the country across industry subsectors.

To inform these discussions, this analysis describes the percent of inpatient hospital days that are covered by Medicaid (also referred to as the “Medicaid inpatient share”), nationally and by state. The analysis uses Medicare cost report data from 2023 (the most recent year available) and focuses on hospitals that are non-federal (see Methods for more details about the hospitals included and analysis).

Medicaid covered at least one in five inpatient hospital days in 48 states and the District of Columbia (hereafter referred to as a state) in 2023. Medicaid covered at least 25% of inpatient days in 30 states and at least 30% of days in 10 states (see Figure 1). The Medicaid share ranged from 11% in Wyoming to 37% in New Mexico. Medicaid covered about one in four (26% of) inpatient days nationally. Variation across states is driven by Medicaid eligibility levels—including whether a state has opted to expand under the Affordability Care Act—as well as demographics. Medicaid’s share of hospital use is likely higher than its share of hospital revenues in part because Medicaid payment rates are generally lower than what commercial insurers pay.

States with the highest Medicaid shares included a mixture of red and blue states. For example, among the 10 states with Medicaid shares of at least 30%, five were states that voted for President Trump in the 2024 election (Alaska, Kentucky, Louisiana, Nevada, and Oklahoma) and five were states that voted for Vice President Harris (California, Colorado, DC, New Mexico, and New York).

Medicaid covered about four in ten (41% of) births nationally in 2023, almost half (47%) of births in rural areas, and at least 40% of births in 26 states according to prior KFF analysis. The vast majority of births occur in hospitals.

Medicaid Covered 26% of Hospital Inpatient Days Nationally, and at Least 20% in Nearly All States

With hospital care accounting for about one third of Medicaid spending in 2023, large Medicaid cuts would be likely to affect hospitals. Some policy options under discussion would affect hospitals directly by reducing the payments made to hospitals through managed care organizations (by limiting what are known as state directed payments) or restricting states’ ability to fund Medicaid through provider taxes, which often support higher payments for hospitals. Also being considered are options to reduce federal spending on the Affordable Care Act (ACA) Medicaid expansion, which has helped improve hospital finances and may have especially benefited rural hospitals. The hospital industry has been lobbying Congress against proposed cuts, arguing that reductions in Medicaid spending would threaten access to hospital care for all patients—not just Medicaid beneficiaries—and the National Rural Health Association has argued that Medicaid spending reductions would lead rural hospitals to reduce or eliminate the services they offer or close altogether.

Also on the horizon is the expiration of the enhanced Affordable Care Act (ACA) subsidies in 2026; there would likely be implications for hospitals if the subsidies are allowed to expire, as the number of uninsured people would increase by 3.8 million per year on average according to Congressional Budget Office (CBO) projections.

This work was supported in part by Arnold Ventures. KFF maintains full editorial control over all of its policy analysis, polling, and journalism activities.

Methods

Data and Hospital Inclusion Criteria: This analysis relied on the RAND Hospital Data, a cleaned and processed version of the annual cost reports that Medicare-certified hospitals are required to submit to the federal government. The analysis included non-federal general short-term hospitals in the 50 states and the District of Columbia. The analysis excluded 47 hospitals that did not report total inpatient days, reported negative total Medicaid or inpatient days, or had a Medicaid share greater than 100%. These hospitals together represented 1% of non-federal general short-term hospitals in the 50 states and the District of Columbia (ranging from 0% in several states to 7% in Connecticut). The final sample included 4,400 hospitals.

We conducted a sensitivity analysis to assess how restricting to hospitals reimbursed under the inpatient prospective system (IPPS) would affect the results and found that it would have changed the results in each state by at most, one percentage point. Most IPPS hospitals directly report their Medicaid inpatient share, which is used for determining eligibility for Medicare disproportionate share hospital (DSH) status and the amount of DSH payments.

Calculation of Medicaid Shares: The analysis used the Medicaid inpatient share reported by hospitals to the federal government for the purposes of establishing Medicare DSH status and determining the amount of DSH payments for the 63% of hospitals in sample that reported that measure. For the 37% of hospitals that did not directly report their shares, the share was calculated from other lines in the cost reports. Medicaid days (the numerator) include Medicaid paid days and Medicaid eligible unpaid days. State shares reflect hospital shares weighted by the denominator (total inpatient days). When calculating shares or inpatient days, lines that were blank were treated as 0, including some instances where hospitals did not report any Medicaid days. Some hospitals had cost report periods that were less than or greater than 365 days, in which case days were scaled up or down to reflect a full year. Hospital data were sorted into fiscal year 2023 based on the mid-point of the reporting period.

Limitations: Cost report data are reported by hospitals and likely have some degree of inaccuracy. For example, it is possible that hospitals that are not part of the Medicare DSH program—which account for 41% of the hospitals in the sample and 7% of inpatient days—may have less incentive to fully account for Medicaid days, given that they do not receive Medicare DSH payments. In that case, the estimates in this analysis would be conservative. It is also possible that the data are inaccurate in other ways that could lead to this analysis overreporting shares, and reporting issues could vary by state.


White House Releases FY26 Budget Request

Published: May 2, 2025

On May 2, 2025, the White House released preliminary details of its FY26 budget request, including funding for global health activities at the State Department, U.S. Agency for International Development (USAID), Centers for Disease Control and Prevention (CDC), and the Fogarty International Center (FIC) at National Institutes of Health (NIH). While funding amounts for most areas (e.g., HIV, tuberculosis, maternal and child health, etc.) were not specified (more detailed budget information is expected later this month or in June), the proposed budget includes significant reductions in global health funding overall. It also includes proposed rescissions to prior year funding amounts. As specified in the request:

State/USAID:

  • Global Health Programs (GHP) account: Totals $3.8 billion, $6.2 billion below the FY25 amount ($10.0 billion).
  • States that the budget focuses on “lifesaving assistance and preventing infectious diseases from reaching the United States.”
  • President’s Emergency Plan for AIDS Relief (PEPFAR): States that funding is preserved for any current beneficiaries.
  • Family Planning & Reproductive Health (FP/RH): Suggests that the administration is proposing to eliminate funding for FP/RH programs in line with previous actions (see here and here).
  • World Health Organization (WHO): In line with the Trump Administration’s executive order Withdrawing The United States From The World Health Organization, “pauses” assessed and voluntary contributions to WHO.

Centers for Disease Control and Prevention (CDC): Eliminates the CDC’s Global Health Center, which was funded at $693 million in FY25.

Fogarty International Center (FIC): Eliminates FIC, which is at NIH and was funded at $95 million in FY25.

Table: KFF Analysis of Global Health Funding in the FY 2026 Budget Request
Department / Agency / ProgramFY25 CR (based on FY24 Final, millions)FY26 Request (millions) 1Difference (FY26 Request – FY25 CR, millions)Notes: 1
State Department & USAID
Global Health Programs (GHP)


$10,030.5


$3,797.5


-$6,232.5


The United States is the largest global contributor to programs that provide so-called family planning services through liberal NGOs, and have funded abortions. This stands in direct conflict with the President’s action reinstating the “Mexico City Policy.” The Budget protects life and prevents a proabortion agenda from being promoted abroad with taxpayer dollars. The Budget focuses on lifesaving assistance and preventing infectious diseases from reaching the United States. The U.S. President’s Emergency Plan for AIDS Relief funding is preserved for any current beneficiaries.
Family Planning & Reproductive Health (FP/RH) 2$607.5$0-$607.5
World Health Organization (WHO)3$118.9$0-$118.9The Budget pauses most assessed and all voluntary contributions to UN and other international organizations, including for the UN Regular Budget, UN Educational, Scientific and Cultural Organization, and the World Health Organization. This is consistent with Executive Order 14199, “Withdrawing the United States From and Ending Funding to Certain United Nations Organizations and Reviewing United States Support to All International Organizations.” To preserve maximum negotiating leverage, the President can choose to fund these international organizations out of the A1OF if he chooses.
Health & Human Services (HHS)
CDC Global Health Programs$692.8$0-$692.8The Budget refocuses CDC’s mission on core activities such as emerging and infectious disease surveillance, outbreak investigations, and maintaining the Nation’s public health infrastructure, while streamlining programs and eliminating waste. The Budget proposes merging multiple programs into one grant program and giving States more flexibility to address local needs. Specifically, the Budget proposes consolidating funding for Infectious Disease and Opioids, Viral Hepatitis, Sexually Transmitted Infections, and Tuberculosis programs into one grant program funded at $300 million.The Budget eliminates duplicative, DEI, or simply unnecessary programs, including: the National Center for Chronic Diseases Prevention and Health Promotion; National Center for Environmental Health; National Center for Injury Prevention and Control; the Global Health Center; Public Health Preparedness and Response, which can be conducted more effectively by States; and the Preventive Health and Human Services Block Grant, the purposes for which can be best funded by States. The Budget refocuses CDC on emerging and infectious disease surveillance, outbreak investigations, preparedness and response, and maintaining the Nation’s public health infrastructure. The Budget maintains more than $4 billion for CDC.
NIH Fogarty International Center (FIC)$95.16$0-$95.16The Administration is committed to restoring accountability, public trust, and transparency at the NIH. NIH has broken the trust of the American people with wasteful spending, misleading information, risky research, and the promotion of dangerous ideologies that undermine public health. While evidence of the origins of the COVID-19 pandemic leaking from a laboratory is now confirmed by several intelligence agencies, the NIH’s inability to prove that its grants to the Wuhan Institute of Virology were not complicit in such a possible leak, or get data and hold recipients of Federal funding accountable is evidence that NIH has grown too big and unfocused. Further, the NIH has been involved in dangerous gain-of-function research and failed to adequately address it, which further undermines public confidence in NIH. The NIH has also promoted radical gender ideology to the detriment of America’s youth. For example, the NIH funded a study titled “Psychosocial Functioning in Transgender Youth after 2 Years of Hormones,” in which two participants tragically committed suicide. The Budget proposes to reform NIH and focus NIH research activities in line with the President’s commitment to MAHA, including consolidating multiple overlapping and ill-focused programs into five new focus areas with associated spending reforms: the National Institute on Body Systems Research; National Institute on Neuroscience and Brain Research; National Institute of General Medical Sciences; National Institute of Disability Related Research; and National Institute on Behavioral Health. The Budget also eliminates funding for the National Institute on Minority and Health Disparities (-$534 million), which is replete with DEI expenditures, the Fogarty International Center (-$95 million), the National Center for Complementary and Integrative Health (-$170 million), and the National Institute of Nursing Research (-$198 million). NIH research would align with the President’s priorities to address chronic disease and other epidemics, implementing all executive orders, and eliminating research on climate change, radical gender ideology, and divisive racialism. This new structure retains the Advanced Research Projects Agency for Health. The Budget maintains $27 billion for NIH research.

1 – Based on information provided in the “Fiscal Year 2026 Discretionary Budget Request – Major Discretionary Funding Changes” released by OMB on May 2, 2025.

2 – The family planning & reproductive health total includes bilateral funding and U.S. contributions to the United Nations Population Fund (UNFPA).

3 – In addition to the assessed amounts, the U.S. provides voluntary contributions to WHO for specific projects/activities determined on an annual basis. These voluntary contributions are not represented here. The Trump Administration has indicated it is cancelling all contributions (assessed and voluntary) to WHO. The FY25 amounts are based on the FY24 levels, which are based on estimates listed in the FY25 Department of State, Foreign Operations, and Related Programs Congressional Budget Justification.

Responding to Federal Medicaid Reductions: Which States Are Most at Risk?

Published: May 2, 2025

Issue Brief

Medicaid Watch

The House and the Senate have now passed a budget resolution that implies big, but unspecified, cuts to Medicaid. The House Energy and Commerce Committee is instructed to reduce the federal deficit by at least $880 billion over 10 years, with nearly all those cuts expected to come from Medicaid. The targets in the Senate are less clear, but Senate Majority Leader John Thune has suggested the Senate will seek at least $1.5 trillion in overall spending cuts, which again would have to include substantial cuts to Medicaid.

Medicaid is the primary program providing comprehensive health and long-term care to one in five people living in the U.S and accounts for nearly $1 out of every $5 spent on health care. There are not yet detailed proposals under consideration by Congress to achieve federal Medicaid spending reductions. Because Medicaid financing is shared between the states and the federal government, any reduction in federal Medicaid spending would leave states with tough choices about how to offset reductions through tax increases or cuts to other programs, like education, corrections, and economic development. If states are not able to offset the loss of federal funds, they would have to make cuts to their Medicaid programs by reducing coverage, restricting benefits, or lowering provider reimbursement rates.

Because states have some flexibility to determine which populations and services to cover, how to deliver care, and how much to reimburse providers, there is significant variation in Medicaid per enrollee spending across states. Some notable differences in policy choices include whether states have implemented the Medicaid expansion under the Affordable Care Act (ACA) as well as decisions about optional coverage for children, pregnancy, people with disabilities and people who need long-term care. State flexibility to cover benefits deemed optional by the federal government leads to significant variation in covered services, particularly the adoption of optional home care benefits. Because of this variation in state policy choices, some states may be disproportionately impacted by federal cuts depending on the specific federal policy changes pursued. For example, the effects of federal policy changes to reduce federal spending for the ACA expansion group would be limited to expansion states while a cap on per enrollee spending for all eligibility groups would impact all states.

States’ ability to respond to federal spending reductions and how they will be affected by any cuts is complicated and depends on an array of factors. The cuts will be made in the context of states’ existing Medicaid programs, but other factors, including population demographic characteristics, health status of Medicaid enrollees, available revenue and state budget choices, and measures of health care costs and access to care, that drive demand for Medicaid as well as states ability to raise revenue or reduce spending will also play a role. This analysis examines a range of measures within these four broad categories to identify states that may have greater difficulty responding to federal Medicaid spending reductions (Figure 1).

The measures used in the analysis were selected from many possible data points because of the availability of state-level data and because they highlight both the capacity of states to respond to federal reductions and the possible implications of federal reductions and state responses on specific populations. Choosing different measures would likely lead to different state rankings. To identify states most at risk, states were ranked separately for each measure, with ties receiving the same rank. Rankings were then summed across each measure within a category to produce a cumulative score, which was used to determine each state’s aggregate ranking for the category. For the full state aggregate ranking for each category, see the Appendix tables. State specific data for these measures as well as other key Medicaid program characteristics can be found in a data collection on State Health Facts.

Measures to Identify States at Greater Risk if Federal Medicaid Spending Is Reduced

All states will likely face challenges responding to federal Medicaid cuts and caps to varying degrees, but states with certain characteristics are more at risk. Six states (Kentucky, Mississippi, Missouri, New Mexico, South Carolina, and West Virginia) rank in the top five for multiple risk categories and another nine states (Alabama, Alaska, Arkansas, District of Columbia, Louisiana, New York, Oklahoma, Pennsylvania, Washington) rank in the top five for at least one category of risk factors.

Fifteen States Rank in the Top Five for One or More Categories of Risk Factors for Responding to Federal Medicaid Reductions

Demographics

Higher rates of poverty and unemployment among state residents as well as a growing share of individuals over age 85, increase demand for Medicaid, making it more difficult for states to respond to federal Medicaid reductions. Because Medicaid serves low-income populations, states with higher shares of residents in poverty or higher unemployment rates would likely experience continued enrollment in Medicaid even as they make cuts in response to federal funding reductions. Similarly, Medicaid is the largest provider of long-term care services, and an aging population could contribute to increased need for these services. Medicaid also disproportionately covers people with disabilities and finances 41% of births overall so states with higher shares of people ages 18 to 64 who have a disability and higher shares of the female population of reproductive age who have low incomes could face more challenges making program cuts. New Mexico, Kentucky, Louisiana, South Carolina, Arkansas, and Mississippi rank in the top 5 for states with population demographics that could make it difficult to respond to federal Medicaid reductions.

The measures used to rank states on population demographics include:

  • Higher Share of Population Below 100% FPL
  • Higher Unemployment Rate, March 2025
  • Higher Projected 5-Year Change in Population Ages 85+
  • Higher Share of Female Population Ages 18-49 Who Have Income Below 200% FPL
  • Higher Disability Rate for Working-Age Adults (18-64)
Demographics

Health Status

Medicaid cuts in states with Medicaid enrollees who have higher health care needs could undermine efforts to improve overall health status. Because Medicaid is a key source of coverage for individuals with significant health care needs, states with higher shares of Medicaid enrollees who are children with special health care needs, who have a disability, serious mental illness, or multiple chronic conditions, or who need long-term care may face greater challenges in restricting program coverage or benefits. Additionally, any cuts to Medicaid programs in states with sicker Medicaid enrollees could have more negative effects on individuals’ health and potentially the health status of the overall population. Missouri, West Virginia, Kentucky, Pennsylvania, and Mississippi rank in the top 5 for states with poor Medicaid enrollee health status that could worsen in the face of Medicaid program cuts made in response to federal funding reductions.

The measures used to rank states based on the health status of Medicaid enrollees include:

  • Higher Share of Children with Special Health Care Needs Covered by Medicaid/CHIP
  • Higher Share of Medicaid Enrollees Who Reported a Disability
  • Higher Share of Medicaid Enrollees with Serious Mental Illness (SMI)
  • Higher Share of Medicaid Enrollees Using Long-Term Care
  • Higher Share of Medicaid Enrollees Who Have Three or More Chronic Conditions
Health Status

State Revenue and Budgets

States that are more reliant on federal Medicaid and other federal funding and those that have more limited ability to raise revenue may have a harder time responding to federal funding reductions. Medicaid financing is shared by states and the federal government. For states that have a higher federal medical match rate (FMAP) replacing lost federal funding will require more state dollars than for states with the minimum FMAP. With broader federal funding reductions at play, states that rely more heavily on federal funding beyond Medicaid could face even deeper reductions in federal funding. States that currently spend less per capita may have a harder time reallocating spending across programs to offset federal reductions. While it is difficult for all states to increase revenue by raising taxes, states with lower taxable resources or lower tax collections per capita could experience greater challenges offsetting cuts. Mississippi, Alabama, South Carolina, Missouri, and Oklahoma rank in the top 5 for states with high reliance on federal funding and limited ability to raise revenue or reduce spending that could make it difficult to offset federal Medicaid funding reductions.

The measures used to rank states on their ability to raise revenue or reduce spending include:

  • Higher Federal Medical Assistance Percentage (FMAP) for Medicaid and Multiplier
  • Higher Share of State Spending from Federal Funds
  • Lower Total State Expenditures per Capita
  • Lower Total Taxable Resources per Capita
  • Lower State Government Tax Collections per Capita
State Revenue and Budgets

Health Care Costs and Access

States that face higher health care costs and related access issues could have a harder time cutting Medicaid spending without exacerbating existing access to care and provider shortage issues. Medicaid operates within the broader health care system. In higher cost markets, states have to spend more to pay for health care services needed by Medicaid enrollees and can make it harder to reduce spending. High health care costs can also be a barrier to accessing needed care for people who are un- or underinsured. In states with higher shares of residents reporting access to care issues and larger numbers of people living in primary care shortage areas, cutting provider reimbursement rates or scaling back on coverage or benefits in response to federal Medicaid spending reductions could worsen these issues. Alaska, West Virginia, District of Columbia, New York, New Mexico, and Washington rank in the top 5 for states with high health care costs and access barriers that could make it difficult to respond to Medicaid reductions.

The measures used to rank states on overall health costs and access to care include:

  • Higher Health Care Expenditures per Capita by State of Residence
  • Higher Average Annual Family Premium per Enrolled Employee for Employer-Based Health Insurance
  • Higher Share of Children (Ages 3-17) Who Faced Difficulties Obtaining Mental Health Care
  • Higher Share of Adults Who Report Not Seeing a Doctor in the Past 12 Months Because of Cost
  • Higher Share of the Population in a Primary Care Health Professional Shortage Areas (HPSAs)
Health Care Costs and Access

Appendix Tables

Demographics

Health Status

State Revenue and Budgets

Health Care Costs and Access

Section 1115 Waiver Watch: Early Signs Point to New Directions Under Trump Administration

Published: May 2, 2025

1115 waivers generally reflect priorities identified by states as well as changing priorities from one presidential administration to another. The Biden administration encouraged states to propose waivers that expand coverage, address health-related social needs (or “HRSN”), and assist individuals with reentry from incarceration. In contrast, the first Trump administration focused on work requirements and eligibility restrictions with a limited focus on enrollee social determinants of health; however, the administration approved a first-of-its kind waiver in North Carolina that allowed the state to provide limited housing and nutrition supports to targeted Medicaid enrollees. In addition, the Biden administration expanded waiver financing tools that had been limited under the first Trump administration.

While the future direction of demonstration waivers is uncertain, recent actions from the Trump administration could signal efforts to curtail waivers related to social determinants of health and to limit waiver financing tools and flexibility. Two major changes demonstrate this shift: (1)  rescinding Biden-era guidance on covering health-related social needs (HRSN) services, and (2) phasing out federal funding for “Designated State Health Programs” (DSHP) in waivers. This waiver watch examines these recent actions in the context of the recent history of Medicaid waivers aimed at addressing enrollee social determinants of health and DSHP.

Use of 1115 Waivers to Address Social Determinants of Health Under Biden and Trump Administrations

The first Trump administration generally had a limited focus on enrollee social determinants of health. Historically states have had limited ability to use Medicaid to help address social determinants of health. Social determinants of health (SDOH) are the conditions in which people are born, grow, live, work and age. SDOH include but are not limited to housing, food, education, employment, healthy behaviors, transportation, and personal safety. Despite a limited focus in general on SDOH, in 2018 the first Trump administration approved North Carolina’s “Healthy Opportunities Pilots,” allowing the state to cover certain non-medical services that target social needs, including housing, nutrition, transportation, and interpersonal relationship supports to specific and limited enrollees. The Pilots operated in three regions of the state and did not go as far as to provide coverage of rent/temporary housing or meal supports equivalent to three meals a day. The Trump administration later released guidance in 2021 highlighting existing federal authorities and opportunities for states to use Medicaid to address enrollee social determinants of health, including under Section 1115 authority.

The Biden administration moved to a more expansive 1115 “health-related social needs” framework and approved 18 waivers authorizing evidence-based housing and nutrition services for specific high-need populations under this framework. (Figure 1). Under the Biden administration, the Centers for Medicare and Medicaid Services (CMS) released a series of guidance documents (which were updated in 2024) on a new waiver opportunity to expand the tools available to states to address enrollee health-related social needs (or “HRSN”). The guidance included federal guardrails and requirements related to expenditure limits, service delivery requirements, and monitoring and evaluation requirements. The HRSN framework allowed for coverage of rent/temporary housing and utilities for up to six months and meal support up to three meals per day, departing from longstanding prohibitions on payment of “room and board” in Medicaid. CMS indicated broadening the availability of HRSN services was “expected to promote coverage and access to care, improve health outcomes, reduce health disparities, and create long-term, more cost-effective alternatives or supplements to traditional medical services.” CMS stressed new HRSN initiatives were not intended to replace other federal, state, and local social service programs but rather to complement and coordinate with these efforts. One of the final Biden administration HRSN approvals was an extension of North Carolina’s waiver under the new HRSN-framework. Reflecting findings from the evaluations of the initial waiver (discussed below in Box 1), the renewal expands the Healthy Opportunities program statewide, introduces new HRSN-framework services (e.g., short-term rental assistance, nutrition supports that were equivalent to three meals a day), and includes new DSHP funding authority.

Box 1. Evidence from North Carolina

Evaluations of the North Carolina “Healthy Opportunity Pilots” waiver approved by the first Trump administration show lower costs over time and largely positive outcomes. At the time of the waiver evaluation study period (March 2022 – November 2023), over 13,000 individuals had been enrolled in the three pilot regions within the state (most recent state data shows enrollment has since increased to about 42,000 as of March 2025). Services are targeted; enrollees must have at least one qualifying behavioral or physical health condition and one qualifying “social risk factor” (e.g., housing insecurity, food insecurity) to qualify for covered housing, nutrition, transportation, or interpersonal violence services.

Nearly 200,000 services had been delivered at the time of the evaluation, with food services representing more than 85% of all services delivered. While housing services were a lower share of services delivered, the average amount billed per housing service was higher at $532, compared to $131 per food service, $199 per transportation service, and $105 per IPV/toxic stress service. Examples of covered services include home remediation services, one-time payment of first month’s rent, medically tailored home-delivered meals, and violence intervention services. Comparing those who received Pilot services to Medicaid enrollees who screened positive for social risks but lived in regions not covered by the Pilots, the interim evaluation found:

  • Spending (including both Pilot service spending and spending for medical care) was, on average, $85 less per Pilot participant per month. Even with an increase in spending at enrollment, HOP participation resulted in lower overall spending over time.
  • Emergency department visits decreased following Pilot enrollment (an estimated reduction of 6 emergency department visits per 1,000 beneficiary months). Inpatient hospitalizations also decreased for non-pregnant adults (an estimated reduction of two admissions per 1,000 beneficiary months).
  • Participation in the Pilots reduced the number of unmet housing, nutrition, and transportation needs reported by enrollees.
  • No significant change was found on the impact of Pilot enrollment on inpatient admissions for children and pregnant adults, outpatient visits, and prenatal and postpartum care use. Due to a lack of data on clinical outcomes, the interim evaluation was unable to investigate whether Pilot participation affected clinical outcomes (e.g., diabetes, hypertension); subsequent evaluations may provide more information.

Use of DSHP Under Biden and Trump Administrations

Spending on certain Designated State Health Programs (DSHP) have been used to draw down federal matching dollars, but support for this policy has varied across the Trump and Biden administrations. HHS has authorized states to access federal Medicaid matching funds for certain types of state-funded health programs in waivers pre-dating the first Trump administration. Generally, this policy may expand available resources by freeing up state funds to finance new Section 1115 waiver initiatives. These state health programs (called DSHPs) do not otherwise qualify for federal funding, must have existed prior to 1115 waiver implementation, and often provide safety-net health care services for low-income or uninsured individuals (such as addiction recovery treatment or support for individuals with intellectual and developmental disabilities). With DSHP authority, states can claim federal match (up to set limits) for state programs approved by CMS.

The first Trump administration announced in 2017 it would no longer accept state proposals for new or renewing 1115 demonstrations that rely on federal matching funds for DSHP. In the guidance, the administration noted oversight concerns and stated there was no “compelling case that federal DSHP funding is a prudent federal investment.” At the time, authority for DSHP in active / current demonstrations was not affected but they could not be extended or renewed. Prior to the Trump administration, DSHP was often used to help finance Delivery System Reform Incentive Payment (DSRIP) waivers, which provided states with significant federal funding to support hospitals and other providers in changing how they provide care to Medicaid beneficiaries. Along with phasing out DSHP funding, the first Trump administration reduced funding for DSRIP renewals and did not approve new DSRIP demonstrations.

The Biden administration rescinded the 2017 DSHP guidance and approved 1115 demonstrations in eight states (nine total demonstrations) that provide federal funding for DSHPs (Figure 1). CMS only approved DSHP expenditure authority in a subset of states with HRSN 1115 approval (in waivers including CalAIM, New York’s Medicaid Redesign, and MassHealth). CMS approved the use of “freed up” state funds for HRSN initiatives (in all states with DSHP expenditure authority) and approved limited other uses (e.g., reentry and workforce initiatives) that varied across state approvals. In waiver approvals, CMS notes that only new waiver initiatives that were determined to promote the objectives of the Medicaid program (such as by “improving access to high-quality covered services”) could be financed with freed up state funds; new DSHP-funded initiatives were expected to not supplant existing services or programs. DSHP authority was described as time-limited and states were expected to submit sustainability plans that describe the state’s strategy to fund and maintain these initiatives beyond the current demonstration approval period. With these DSHP approvals, the Biden administration also introduced new guardrails, including that federal funding for DSHPs could not exceed 1.5 percent of the state’s total Medicaid spending and that states must use non-federal funding sources for at least 15 percent of the state’s share of the cost of new waiver initiatives. Similar to its guidance for HRSN programs, as a condition of DSHP approval CMS required states to meet provider payment rate requirements for core Medicaid services.

Health-Related Social Needs (HRSN) Waivers Approved as of January 20, 2025

In recent months, the Trump administration rescinded HRSN guidance issued by the Biden administration and announced it would be phasing out DSHP funding authority. Neither action affects currently approved / existing waivers but both may limit new HRSN / SDOH state waiver requests or waiver extension requests. CMS indicates in its March 2025 letter that rescinding HRSN guidance does not nullify existing HRSN approvals but going forward they will consider HRSN / SDOH requests on a “case-by-case” basis. The Trump administration also announced in April 2025 that it does not intend to approve new or extend existing requests for federal matching funds for state expenditures for DSHP. The guidance also says it does not intend to renew a funding mechanism for state health programs specific to Tennessee’s waiver called “designated state investment programs” or DSIP, approved by the Trump administration in 2021 and renegotiated by the Biden administration in 2023. Similar to the 2017 letter, the 2025 letter notes that federal DSIP and DSHP funding have “appeared to serve primarily as a financing mechanism for states” rather than as an integral part of demonstrations. The CMS press release said that “DSHPs and DSIPs have grown from approximately $886 million in 2019 to nearly $2.7 billion in eligible expenditures in 2025, representing increasing costs to the federal government without a sustainable state contribution.” Phasing out DSHP authority may limit states’ ability to finance new 1115 initiatives.

Future waiver approvals and CMS guidance will provide additional insight into the waiver priorities and financing approach of the new Trump administration.  With regard to waiver financing, in addition to phasing out DSHP the first Trump administration made other changes to 1115 waiver budget neutrality policy in 2018 designed to limit the amount of federal funds that could be used for waiver spending. Limits included changing the amount of savings states can carry over between demonstrations and establishing new rules on spending trend rates used in budget neutrality calculations. The Biden administration made changes to Section 1115 budget neutrality policies that provided greater flexibility for states to design and implement 1115 demonstration programs, including HRSN initiatives (such as not requiring offsetting savings for HRSN services). More broadly, the first Trump administration’s Section 1115 waiver policy emphasized work requirements – which were challenged in court – and other eligibility restrictions and capped financing. Since the Trump administration has taken office, some states are again pursuing Medicaid work requirements through Medicaid demonstration waivers. Work requirements in Medicaid are also being considered as part of a broader federal legislative package of potential changes to Medicaid designed to significantly reduce federal Medicaid spending. The future of work requirement waivers may depend on the outcome of these legislative debates, as legislation may mandate work requirements.

Breaking Down the U.S. Global Health Budget by Program Area

Published: May 1, 2025
Note: Starting on the first day of his second term, President Trump issued several executive actions that have fundamentally changed foreign assistance. These included: an executive order which called for a 90-day review of foreign aid; a subsequent “stop-work order” that froze all payments and services for work already underway; the dissolution of USAID; and the cancellation of most foreign assistance awards. The Trump administration has also been working to restructure several government departments and agencies, many of which carry out U.S. global health activities. As a result, U.S. global health programs have been disrupted and, in some cases, ended. While Congress has provided FY 2025 funding to these global health programs through a continuing resolution (CR), which maintains funding at the FY 2024 level, it is important to note that the impacts of the Trump administration changes to foreign assistance are not fully clear. As such, the data presented below are based on Congressional appropriations.

This fact sheet provides a historical overview of U.S. funding for global health by program area over the past decade. Funding totals are based on amounts specified by Congress in annual appropriations bills, as well as some amounts that are determined at the agency level. See our Budget Tracker for more detail on historical funding and our Budget Summaries for the latest on ongoing appropriations discussions.

U.S. Global Health Budget: Overview

The U.S. Government is the largest donor to global health in the world and includes support for both disease (HIV, tuberculosis, malaria, and neglected tropical diseases) and population (maternal and child health, nutrition, and family planning and reproductive health) specific activities as well as global health security. Most U.S. funding for global health is provided bilaterally (approximately 80%). Of the multilateral share, the majority is provided to The Global Fund to Fight AIDS, Tuberculosis and Malaria (Global Fund). The U.S. investment in global health grew significantly in the early 2000s, largely due to the creation of new initiatives including the President’s Emergency Plan for AIDS Relief (PEPFAR) and the President’s Malaria Initiative (PMI). However, over the last decade, U.S. funding for global health has remained relatively flat, with spikes in some years due to emergency supplemental funding for disease outbreaks, including Ebola, Zika, and COVID-19. In FY 2025, global health funding was provided through a continuing resolution (CR) which maintained the prior year (FY 2024) amount of $12.4 billion.

Figure 1

U.S. Global Health Funding, FY 2016 - FY 2025

Figure 2

U.S. Global Health Funding (in millions), By Program Area, FY 2025

Table 1

Historical Funding by Agency for Global Health, in millions

Back to top


U.S. Global Health Budget: Global HIV Funding, Including PEPFAR

The U.S. first provided funding to address the global HIV epidemic in 1986. U.S. efforts and funding increased slowly over time until the launch of the U.S. President’s Emergency Plan for AIDS Relief (PEPFAR) in 2003, which initiated a period of significant increases and is the largest effort devoted to a single disease in the world. The majority of U.S. global HIV funding is for PEPFAR bilateral efforts (89%) with additional funding for UNAIDS and international HIV research activities. As part of its global HIV response, the U.S. also provides funding to the Global Fund (see below for details). PEPFAR funding is specified by Congress in annual appropriations bills and is largely provided to the Department of State, which is responsible, through the Bureau for Global Health Security and Diplomacy (GHSD), for coordinating all U.S. programs, activities, and funding for global HIV efforts. Other agencies that receive HIV funding under PEPFAR include the U.S. Agency for International Development (USAID), Centers for Disease Control and Prevention (CDC), and Department of Defense (DoD). In addition, the National Institutes of Health (NIH) supports international HIV research activities, (funding which is not counted as part of PEPFAR). Global HIV funding through regular appropriations1  has historically accounted for the largest share of the U.S. global health budget (ranging from 42% to 50% between FY 2016 and FY 2025). In FY 2025, global HIV funding was provided through a continuing resolution, which maintained the prior year (FY 2024) amount and totaled $5.4 billion, of which $4.9 billion is for PEPFAR2  ($4.8 billion for bilateral HIV and $50 million for UNAIDS), and approximately $575 million is for international HIV research activities at NIH.

Figure 3

U.S. Funding for Global HIV, FY 2016 - FY 2025

Table 2

Historical Funding by Agency and Account for Global HIV, in millions

Back to top


U.S. Global Health Budget: Tuberculosis (TB)

Since 1998, when the U.S. Agency for International Development (USAID) began a global tuberculosis (TB) control program, U.S. involvement in global TB efforts has grown and it is now one of the largest donors to global TB control in the world. U.S. bilateral TB funding is provided through USAID and includes U.S. contributions to the TB Drug Facility (additional U.S. support for TB activities is provided through its contribution to the Global Fund to Fight AIDS, Tuberculosis and Malaria). U.S. funding for TB has grown over the past decade, with much of the increase occurring in more recent years. U.S. funding for TB rose from $240 million in FY 2016 to $406 million in FY 2025 and currently accounts for approximately 3% of the U.S. global health budget. FY 2025 funding was provided through a continuing resolution, which maintained the prior year (FY 2024) amount.

Figure 4

U.S. Funding for Global Tuberculosis (TB), FY 2016 - FY 2025

Table 3

Historical Funding by Agency and Account for Global Tuberculosis (TB), in millions

Back to top


U.S. Global Health Budget: Malaria/PMI

The U.S. government has been involved in global malaria activities since the 1950s and, today, is the second largest donor to global malaria efforts in the world (the largest is the Global Fund to Fight AIDS, Tuberculosis and Malaria). The U.S. response to malaria is driven by the President’s Malaria Initiative (PMI), an interagency initiative to address global malaria that was led by the U.S. Agency for International Development (USAID), and co-implemented together with the Centers for Disease Control and Prevention (CDC), with additional activities provided by the National Institutes of Health (NIH) and Department of Defense (DoD). In addition to its bilateral programs, the U.S. also supports malaria programs through its contribution to the Global Fund to Fight AIDS, Tuberculosis and Malaria. U.S. bilateral funding for malaria increased over the past decade from $873 million in FY 2016 to approximately $1 billion in FY 2025; while funding increased over the period, it has been relatively flat in recent years. In FY 2025, malaria accounted for 9% of the U.S. global health budget. FY 2025 funding was provided through a continuing resolution, which maintained the prior year (FY 2024) amount.

Figure 5

U.S. Funding for Global Malaria, FY 2016 - FY 2025

Table 4

Historical Funding by Agency and Account for Global Malaria, in millions

Back to top


U.S. Global Health Budget: The Global Fund to Fight AIDS, Tuberculosis and Malaria

The Global Fund to Fight AIDS, Tuberculosis and Malaria (Global Fund) is an independent, public-private, multilateral institution which finances HIV, TB, and malaria programs in low- and middle-income countries. The Global Fund receives contributions from public and private donors and in turn provides funding to countries based on country-defined proposals. The U.S. provided the Global Fund with its founding contribution in 2001 and has since been its largest single donor (U.S. contributions to the Global Fund are counted as part of PEPFAR). However, Congress places a number of restrictions on U.S. contributions, including a funding match requirement that limits the amount the U.S. can contribute. The U.S. contribution to the Global Fund through regular appropriations has fluctuated over the past decade but reached its highest level to date ($2.0 billion) in FY 2023. In FY 2025, funding for the Global Fund was $1.7 billion, flat compared to the FY 2024 level, as funding was carried over due to the continuing resolution, and $375 million less than the FY 2023 level, though Congress stated the decline was due to the funding match requirement that limits the amount the U.S. can contribute. In addition to regular appropriations, Congress provided $3.5 billion in emergency supplemental funding to the Global Fund to address the impacts of COVID-19 on HIV programs in FY 2021.

Figure 6

U.S. Funding for The Global Fund, FY 2016 - FY 2025

Table 5

Interactive DataWrapper Embed

Back to top


U.S. Global Health Budget: Maternal & Child Health (MCH)

The U.S. has been involved in Maternal & Child Health (MCH) efforts since the 1960s (and is the largest donor government to MCH activities in the world). MCH funding, which includes funding for polio and U.S. contributions to Gavi, the Vaccine Alliance (GAVI) and the United Nations Children’s Fund (UNICEF), is provided through the U.S. Agency for International Development (USAID), Centers for Disease Control and Prevention (CDC), and the State Department. U.S. funding for MCH increased slightly from $1.14 billion in FY 2016 to $1.30 billion in FY 2025. This was primarily driven by increased funding to GAVI and polio during the period. In fact, when these are removed, bilateral MCH funding has remained relatively level for several years over the period. In FY 2025, MCH accounted for the third largest share of U.S. funding for global health (10%). FY 2025 funding was provided through a continuing resolution, which maintained the prior year (FY 2024) amount.

Figure 7

U.S. Funding for Global Maternal & Child Health (MCH), FY 2016 - FY 2025

Table 6

Historical Funding by Agency and Account for Global Maternal and Child Health (MCH), in millions

Back to top


U.S. Global Health Budget: Nutrition

The U.S. has a long history of supporting global efforts to improve nutrition and is the largest donor to nutrition efforts in the world. Historically, support for U.S. global nutrition activities was included as part of broader maternal and child health (MCH) funding; starting in 2010, Congress began to designate funding for nutrition activities, all of which is provided through the U.S. Agency for International Development (USAID).3  U.S. funding for nutrition increased from $144 million in FY 2016 to $165 million in FY 2025 and has accounted for approximately 1% of the total U.S. global health budget over the period. FY 2025 funding was provided through a continuing resolution, which maintained the prior year (FY 2024) amount.

Figure 8

U.S. Funding for Global Nutrition, FY 2016 - FY 2025

Table 7

Historical Funding by Agency and Account for Global Nutrition, in millions

Back to top


U.S. Global Health Budget: Family Planning & Reproductive Health (FP/RH)

The U.S. has been involved in Family Planning & Reproductive Health (FP/RH) efforts since the 1960s and is currently the largest donor to global FP/RH in the world. The majority of U.S. FP/RH funding is provided through the U.S. Agency for International Development (USAID) for bilateral activities, with additional funding provided through the State Department for the U.S. contribution to the United Nations Population Fund (UNFPA).4  U.S. funding for FP/RH rose steadily in its first two decades5  and more recently, has remained relatively flat at just about $600 million, accounting for approximately 5-6% of the U.S. global health budget each year from FY 2016-FY 2025. FY 2025 funding was provided through a continuing resolution, which maintained the prior year (FY 2024) amount.

Figure 9

U.S. Funding for International Family Planning/Reproductive Health (FP/RH), FY 2016 - FY 2025

Table 8

Historical Funding by Agency and Account for International Family Planning and Reproductive Health (FP/RH), in millions

Back to top


U.S. Global Health Budget: Global Health Security

Since the 1990s, there has been growing concern about new infectious diseases that threaten human health including, in more recent years, the emergence and spread of threats such as Ebola, Zika, H1N1 influenza, COVID-19, and antibiotic resistance. U.S. global health security efforts aim to reduce the threat of emerging infectious diseases by supporting preparedness, detection, and response capabilities worldwide. Funding designated by Congress for global health security through both emergency and regular appropriations has fluctuated over time, rising largely in response to outbreaks, including Ebola, Zika, and COVID-19.6  The share of global health funding that global health security represents has increased over time, rising from 4% in FY 2016 to 10% in FY 2025. In FY 2025, funding for global health security was $1.3 billion. FY 2025 funding was provided through a continuing resolution, which maintained the prior year (FY 2024) amount.

Figure 10

U.S. Funding for Global Health Security, FY 2016 - FY 2025

Table 9

Historical Funding by Agency and Account for Global Health Security, in millions

Back to top


U.S. Global Health Budget: Neglected Tropical Diseases (NTDs)

NTDs are a group of parasitic, bacterial, and viral infectious diseases that primarily affect the most impoverished and vulnerable populations in the world. The U.S. Congress first designated funding to address NTDs in 2006, through the U.S. Agency for International Development (USAID).7  Funding was flat at around $100 million for several years before rising to a peak of $115 million in FY 2023 and remained flat in FY 2024 and FY 2025. Funding for NTDs accounts for a relatively small share of the U.S. global health budget (1% in FY 2025). FY 2025 funding was provided through a continuing resolution, which maintained the prior year (FY 2024) amount.

Figure 11

U.S. Funding for Global Neglected Tropical Diseases (NTDs), FY 2016 - FY 2025

Table 10

Historical Funding by Agency and Account for Neglected Tropical Diseases (NTDs), in millions

Back to top

  1. In addition to regular appropriations, Congress provided $250 million in emergency supplemental funding to address the impacts of COVID-19 on U.S. bilateral HIV programs in FY 2021. ↩︎
  2. Total PEPFAR funding in FY 2025 is $6.5 billion ($4.8 billion for bilateral HIV, $50 million for UNAIDS, and $1.7 billion for the Global Fund). ↩︎
  3. Totals do not include funding provided through Food for Peace (FFP) due to the unique nature of the program. ↩︎
  4. Under current law, any U.S. funding withheld from UNFPA is to be made available to other family planning, maternal health, and reproductive health activities (see the KFF fact sheet on U.S. government international family planning and reproductive health statutory requirements and policies). ↩︎
  5. PAI. Cents and Sensibility: U.S. International Family Planning Assistance from 1965 to the Present. Accessed September 2022 at https://pai.org/cents-and-sensibility. ↩︎
  6. In FY15, Congress provided $5.4 billion in emergency funding to address the Ebola outbreak, of which $909.0 million was specifically designated for global health security. In FY16, Congress provided $1.1 billion in emergency funding to address the Zika outbreak, of which $145.5 million was specifically designated for global health security. In FY18, Congress provided $100 million in unspent Emergency Ebola funding for “programs to accelerate the capabilities of targeted countries to prevent, detect, and respond to infectious disease outbreaks.” In FY19, Congress provided $38 million in unspent Emergency Ebola funding for “programs to accelerate the capacities of targeted countries to prevent, detect, and respond to infectious disease outbreaks.” In FY20, Congress provided $1.235 billion in emergency COVID-19 funding to “prevent, prepare for, and respond to coronavirus” globally, and in FY21, Congress provided $9.4 billion in emergency COVID-19 funding “to prevent, prepare for, and respond to coronavirus, including for vaccine procurement and delivery.” While none of the FY20 funding was designated for global health security, all of the FY21 funding provided through CDC ($750 million) was designated by CDC as global health security. ↩︎
  7. Additional NTD funding is used for NTD research at the Centers for Disease Control and Prevention (CDC) and National Institutes of Health (NIH), although this funding is not specified by Congress. ↩︎
Poll Finding

KFF Health Tracking Poll April 2025: Public’s View on Major Cuts to Federal Health Agencies

Published: May 1, 2025

Findings

Key Takeaways

  • Amid sweeping overhauls of federal health agencies in the first 100 days of President Trump’s second term, majorities of the public oppose major cuts to staff and spending at these agencies (61%) and say recent actions by the administration and Elon Musk’s Department of Government Efficiency (DOGE) have gone too far (54%). In addition, six in ten (59%) say the administration is “recklessly making broad cuts to programs and staff, including some that are necessary for agencies to function,” while a smaller share (41%) say “the administration is carefully making cuts to programs and staff to reduce fraud and waste, and to improve government efficiency.”
  • Views of cuts to staff and spending are largely partisan with most Democrats and independents opposing the cuts and thinking they go “too far,” while a majority of Republicans support the cuts and six in ten (63%) say the extent has been “about right.” In addition, nine in ten Democrats and two-thirds of independents categorize the cuts as reckless while eight in ten Republicans think the administration is carefully making the cuts. Across the board, the strongest proponents of these cuts are MAGA supporters, a group that constitutes about three-quarters of all Republicans and Republican-leaning independents. Large majorities of MAGA supporters say they support the cuts and a quarter say the cuts haven’t gone far enough. Much smaller shares of Republicans and Republican-leaning independents whose views don’t align with the MAGA movement approve of the current actions by the Trump administration.
  • Most of the public also see the negative consequences from these cuts, with majorities saying cuts to staff and spending at federal health agencies will have a negative impact on health care for veterans, research to find cures and treatments for cancer and other diseases, efforts to combat the spread of infectious diseases, and food safety. Once again, views are partisan with most Democrats and independents saying the cuts will have a negative impact in these areas while Republicans are more likely to say the cuts won’t have an impact.
  • There is partisan agreement when it comes to funding cuts to Medicare, Medicaid, and Social Security with more than nine in ten Democrats, eight in ten independents, and more than half of Republicans opposing federal funding cuts to each of the three government programs. In addition, majorities across partisanship oppose funding cuts to states for mental health and addiction prevention services and for tracking infectious disease outbreaks. Another seven in ten oppose cuts to federal funding for research at universities and medical centers, including nine in ten (92%) Democrats, seven in ten (69%) independents, and almost half (44%) of Republicans. Overall, two-thirds (65%) oppose cutting funding to help people who purchase health coverage through the ACA to pay their premiums (65%), but about six in ten Republicans support major cuts in this area.
  • Most of the public agree with the Trump administration that fraud, waste, and abuse are a problem in health care in the U.S., yet partisans disagree on whether the cuts will make any difference and on who is responsible for it. Roughly four in ten (43%) of the public say cuts to staff and spending at government health agencies will negatively impact reducing fraud, waste, and abuse in health care, which is similar to the share (38%) who say there will be a positive impact. Additionally, while majorities (57%) think fraud, waste and abuse are a “major problem” in private health insurance plans, fewer – about half – think fraud is a problem in Medicaid (52%), Social Security (51%), and Medicare (50%). Half of Democrats identify private health insurance companies as the group most responsible for fraud, waste, and abuse in government health programs while four in ten Republicans place the blame on government employees running the programs.

Most Oppose Trump Administration Cuts to Federal Health Agencies

The first few months of President Donald Trump’s second term have been punctuated by a wave of cuts to the federal workforce and government funded programs, especially in health care agencies. At least 20,000 jobs have been lost from the Department of Health and Human Services and its sub-agencies since Robert F. Kennedy Jr. assumed his job as secretary of the agency.

Most of the public (61%) oppose major cuts to staff and spending at federal health agencies, while two in five (38%) support such cuts. Views on the cuts to staff and spending are expectedly partisan, with the majority of Republicans supporting major cuts (72% support, 27% oppose), while nine in ten Democrats oppose the cuts (89% oppose, 10% support). Two-thirds of independents oppose the cuts (67%) while a third are in support (32%).

Support for major changes at federal government health agencies is driven by the most enthusiastic segment of President Trump’s political base – Republicans and Republican-leaning independents who identify as supporters of the Make America Great Again (MAGA) movement. This group, which makes up 75% of Republicans and leaners (31% of total U.S. adults) are demographically similar to other Republicans and Republican-leaning independents when it comes to race/ethnicity, gender, and income, but tend to be older. Roughly eight in ten MAGA-aligned Republicans say they generally support major cuts to staff and spending at federal health agencies, while non-MAGA Republicans are more divided (48% support and 52% oppose).

Six in Ten Oppose Major Cuts to Staff and Spending at Federal Health Agencies, With Nearly Nine in Ten Democrats in Opposition

Perhaps a reflection of the entrenched partisan views, hearing arguments for and against major cuts to staff and spending for federal government health agencies causes few people to change their views. When those who support cuts to the agencies hear that the cuts would negatively impact these agencies’ abilities to serve the public, about a quarter change their view, dropping overall support for the cuts to agencies nine percentage points, from 38% to 27%.

When opponents of the major cuts to federal government health agencies hear that it would help save money and reduce the size and scope of the federal government, about one in ten change their view, increasing overall support eight percentage points to about half (46%) of the public, while 53% remain opposed to the change. On many health issues, polls find that arguments can lead to large shifts in opinion, but that doesn’t seem to be the case here, with majorities continuing to oppose cuts in the face of arguments for them.

Majorities Oppose Cuts to Staff and Spending at Federal Health Agencies, Few Shift in Opposition When Presented With Argument for Cuts

Most of the public (54%) say cuts to staff and spending at federal government health agencies by the Trump administration and Musk’s Department of Government Efficiency (DOGE) go “too far” while three in ten (31%) think the cuts are “about right” and 14% say the cuts haven’t gone far enough. Republicans are largely in favor of the level of cuts at the federal government health agencies with six in ten (63%) saying the cuts have been “about right.” This is in stark comparison to the nine in ten Democrats (90%) and six in ten independents (57%) who say the cuts to health agencies have gone “too far.” MAGA Republicans are also much more likely than non-MAGA Republicans to say the cuts to staff and spending at federal government health agencies so far are “about right”, (64% vs. 46%). In fact, one-third (33%) of non-MAGA Republicans think the cuts have gone “too far.”

Half of Adults Say They Think Cuts to Federal Health Agencies Have Gone Too Far, Including One in Three Non-MAGA Republicans

In addition to believing the cuts have gone “too far,” the public expresses generally negative views about the manner in which the administration has approached these cuts. Asked which comes closer to their view, six in ten (59%) say “the administration is recklessly making broad cuts to programs and staff, including some that are necessary for agencies to function,” while a smaller share (41%) say “the administration is carefully making cuts to programs and staff to reduce fraud and waste, and to improve government efficiency.” Overall sentiment on this question is largely driven by partisanship. Large majorities of both Democrats (92%) and independents (65%) say the cuts have been reckless, while this view is shared by only one in five Republicans (18%). On the other hand, eight in ten (82%) Republicans think the administration is carefully making the cuts. MAGA supporters are much more likely to say that the administration is “carefully making cuts to programs and staff to reduce fraud and waste, and to improve government efficiency” compared to non-MAGA Republicans and Republican-leaning independents (87% vs. 57%). Notably, four in ten non-MAGA Republicans (42%) say the cuts have been reckless.

Six in Ten Adults Say the Trump Administration Is Recklessly Making Cuts to Federal Health Agencies, but Views Are Polarized Across Partisan Lines

There is Large Opposition to Funding and Staff Cuts at Government Health Agencies

With tepid support for cuts generally, very few also support major cuts to federal funding for specific programs such as Medicaid, Medicare, and Social Security. The House budget resolution is targeting federal cuts to Medicaid for up to $880 billion or more over the next 10 years, representing 29% of state-financed Medicaid spending per resident. Trump has promised not to cut Social Security, Medicare, and Medicaid benefits.

At least three-quarters of the public oppose major cuts to funding for Social Security (84%), for Medicare (79%), and for Medicaid (76%). Beyond these major programs, large shares of the public also oppose cuts in other areas of public health, research, and disease prevention. At least two-thirds oppose cutting funding to states for mental health and addiction prevention services (74%), for tracking infectious disease outbreaks (71%), for research at universities and medical centers (69%), for HIV prevention programs (65%), and to help people who purchase health coverage through the ACA to pay their premiums (65%). About one-third or fewer support major cuts to federal funding in each of these areas.

Majorities Oppose Major Cuts to Federal Funding for Public Health Programs, With at Least Three in Four Opposing Cuts to Social Security, Medicare, and Medicaid

Views on cuts to federal health spending are predictably partisan, with about nine in ten Democrats and at least two-thirds of independents opposed to funding cuts in each area included on the survey. On the other hand, about six in ten Republicans support major cuts to federal funding to help people who purchased coverage through the ACA to pay their premiums (61%) and for HIV prevention programs (61%), while about half of Republicans support cutting funding for research at universities and medical centers (56%) and for tracking infectious disease outbreaks (49%).

But majorities of Republicans oppose major cuts to funding for Social Security (73%), Medicare (64%), and Medicaid (55%). Additionally, a majority of Republicans (58%) oppose cuts to funding to states for mental health and addiction prevention services.

Majorities Across Partisans Oppose Major Cuts to Social Security, Medicare, Medicaid, and Mental Health Services

Many agencies have already undergone major staffing cuts under the Trump administration, including the Department of Veterans Affairs, or VA, which announced a plan to cut 83,000 jobs in March. Majorities of the public oppose major staffing cuts at government agencies with responsibilities in health. The largest opposition is to staffing cuts at the VA, which three-quarters of the public oppose.

At least six in ten of the public also oppose cuts to staff at the Centers for Medicare and Medicaid Services, or CMS (67%), the Social Security Administration, or SSA (66%), the Food and Drug Administration, or FDA (63%), the Centers for Disease Control and Prevention, or CDC (63%), HHS Office of Infectious Disease & HIV/AIDS Policy (62%), and the National Institute of Health, or NIH (62%).

At Least Six in Ten Oppose Major Cuts to Staff and Spending at Federal Health Agencies

At least nine in ten Democrats oppose major staffing cuts at each of the health agencies included in the survey, while majorities of Republicans (between 58% and 77%) approve of such cuts at most agencies. One exception is staffing cuts at the Department of Veterans Affairs, or VA, with Republicans divided on the issue, with half supporting the cuts (46%) and half (54%) opposing.

Majorities of Democrats and Independents Oppose Cuts to Staff at Major Federal Health Agencies

Republicans and Republican-leaning independents who support the MAGA movement largely support the cuts to federal funding and staff, with a few notable exceptions.

Majorities of MAGA Republicans support major cuts to federal funding for HIV programs (66%), to help pay ACA premiums (64%), and for research at universities and medical centers (62%). About half support major cuts for tracking infectious disease outbreaks (51%), for Medicaid (51%), and to states for mental health and addiction prevention services (46%). Yet, fewer than four in ten MAGA Republicans support cutting funding for Medicare (38%) and just three in ten support cutting funding for Social Security.

When it comes to cutting staff, three-quarters support major cuts to staff at the HHS Office of Infectious Disease & HIV/AIDS policy (78%), CDC (78%), NIH (77%), and the FDA (75%). Another two-thirds support major cuts to staff at SSA (65%) and CMS (65%). Notably, less than half of MAGA-supporting Republicans (47%) support cuts to the VA.

Large Shares of MAGA Supporters Favor Many Cuts, But Mixed On Others

Concerns About Fraud, Waste, and Abuse in Federal Health Programs

The Trump administration and DOGE have framed the cuts occurring throughout the federal government as eliminating “fraud, waste, and abuse”, implementing DOGE’s cost efficiency initiative. Large majorities of the public think fraud, waste, and abuse are a major problem facing our country’s health care programs, though most don’t view the problem as being limited to public health insurance programs. About six in ten (57%) think fraud, waste and abuse are a “major problem” in private health insurance plans, while about half say the same about Medicaid (52%), Social Security (51%), and Medicare (50%). Close to a third say fraud, waste, and abuse are a “minor problem” in each of these, while about one in ten say fraud, waste, and abuse are “not a problem”.

About Half of Adults Say They Think Was, Fraud and Abuse Are a Major Problem in Private Insurance Plans, Medicare, Medicaid and the Social Security Program

Republicans are about three times as likely as Democrats to say fraud, waste, and abuse are a major problem in Social Security (80% vs. 26%), Medicaid (75% vs. 25%) and Medicare (72% vs. 24%). There is a much smaller partisan difference in the share seeing fraud, waste, and abuse as a major problem in private health insurance, with two-thirds of Republicans (66%), six in ten independents (61%), and nearly half of Democrats (45%) sharing this view. MAGA-supporting Republicans are much more likely than non-MAGA Republicans to say fraud, waste, and abuse are major problem in private health insurance plans (69% vs. 58%), Medicaid (80% vs. 57%), Social Security (84% vs. 54%), and Medicare (77% vs. 53%).

Partisans Split on Whether Fraud, Waste, and Abuse Are a Major Problem, Though Almost Half of Democrats Agree With the Problem in Private Health Insurance

Adults in the U.S. are divided when identifying culprits of fraud, waste, and abuse in government health programs. One in three (33%) say that private health insurance companies are most often responsible for fraud, waste, and abuse in government health programs, with a similar share (29%) saying government employees running the programs are most responsible. One in five (20%) think hospitals, doctors, and other health care providers are responsible for most fraud, waste, and abuse in government health programs, while one in six (17%) say the same about people enrolled in the programs.

Less than a quarter across partisans blame people enrolled in the programs or hospitals, doctors, and health care providers for fraud, waste, and abuse in government health programs. Instead, half (49%) of Democrats identify private health insurance companies as the group most responsible for fraud, waste, and abuse while four in ten (42%) Republicans place the blame on government employees running the programs.

One in Three Say They Think Private Health Insurance Companies Are Most Responsible for Fraud, Waste, and Abuse in Government Health Programs

The Public Is Concerned How Cuts May Impact Services, but Some Think They Will Reduce Fraud and Waste and Bring Down the Deficit

Majorities of the public believe that cuts to staff and spending at federal health agencies will have negative impacts in a variety of areas. Six in ten say these cuts will have a “mostly negative” impact on health care for veterans (62%) and on research to find cures and treatments for cancer and other diseases (60%). More than half of adults say there will be “mostly negative” impacts on efforts to combat the spread of infectious diseases like measles and bird flu (55%) as well as food safety (53%). Half believe the cuts will have a negative impact on racial disparities in health care. Fewer than one in six expect the cuts to have positive impacts in any of these areas.

While President Trump and Elon Musk have framed many of the recent cuts as necessary to curb fraud and waste and reduce the federal budget deficit, the public is divided in their views of whether these goals are likely to be achieved. About four in ten (38%) say staff and spending cuts at federal health agencies will have a “mostly positive” impact on reducing fraud, waste, and abuse in health care, but a similar share (43%) say these cuts will have a “mostly negative” impact on reducing fraud, waste, and abuse. Similarly, while four in ten say cuts will have a positive impact on reducing the U.S. budget deficit, nearly as many (34%) say they will have a “mostly negative” impact.

Half or More Think Cuts to Staff and Spending at Federal Health Agencies Will Have Negative Impacts on Most Aspects, but Remain Split on the Impact Cuts Will Have on Budget

Most Democrats say the cuts to staff and spending will negatively impact health care for veterans (91%), food safety (91%), research to find cures and treatments for cancer and other diseases (90%), efforts to combat the spread of infectious diseases like measles and bird flu (88%), and racial disparities in health care (87%).

Republicans are more positive about how the cuts will impact the budget and waste in health care, with at least seven in ten saying the cuts will have a “mostly positive” impact on reducing the U.S. budget deficit (73%) and reducing fraud, waste, and abuse in health care (71%). Most Democrats say the cuts to staff and spending will have a “mostly negative” impact in these areas while independents are divided in how they think the cuts will impact fraud and waste as well as reducing the U.S. budget deficit.

Republicans Say the Cuts Will Have a Positive Impact on Budget Issues, Reducing Fraud, Waste, and Abuse in Health Care

Republicans are also more likely than both independents and Democrats to think that the cuts to staff and spending will not have any impact on the areas that affect public health, like racial disparities in health care (65%), food safety (57%), efforts to combat infectious disease (56%), and research to find cures for treatments for cancer and other diseases (52%). Majorities of independents and Democrats think the cuts will have “mostly negative” impacts in each of these areas.

Partisans Split on the Impact of Cuts to Staff and Spending at Federal Health Agencies

Methods

This KFF Health Tracking Poll/KFF Tracking Poll on Health Information and Trust was designed and analyzed by public opinion researchers at KFF. The survey was conducted April 8-15, 2025, online and by telephone among a nationally representative sample of 1,380 U.S. adults in English (1,322) and in Spanish (58). The sample includes 1,022 adults (n=48 in Spanish) reached through the SSRS Opinion Panel either online (n=997) or over the phone (n=25). The SSRS Opinion Panel is a nationally representative probability-based panel where panel members are recruited randomly in one of two ways: (a) Through invitations mailed to respondents randomly sampled from an Address-Based Sample (ABS) provided by Marketing Systems Groups (MSG) through the U.S. Postal Service’s Computerized Delivery Sequence (CDS); (b) from a dual-frame random digit dial (RDD) sample provided by MSG. For the online panel component, invitations were sent to panel members by email followed by up to three reminder emails.

Another 358 (n=17 in Spanish) adults were reached through random digit dial telephone sample of prepaid cell phone numbers obtained through MSG. Phone numbers used for the prepaid cell phone component were randomly generated from a cell phone sampling frame with disproportionate stratification aimed at reaching Hispanic and non-Hispanic Black respondents. Stratification was based on incidence of the race/ethnicity groups within each frame. Among this prepaid cell phone component, 194 were interviewed by phone and 164 were invited to the web survey via short message service (SMS).

Respondents in the prepaid cell phone sample who were interviewed by phone received a $15 incentive via a check received by mail. Respondents in the prepaid cell phone sample reached via SMS received a $10 electronic gift card incentive. SSRS Opinion Panel respondents received a $5 electronic gift card incentive (some harder-to-reach groups received a $10 electronic gift card). In order to ensure data quality, cases were removed if they failed two or more quality checks: (1) attention check questions in the online version of the questionnaire, (2) had over 30% item non-response, or (3) had a length less than one quarter of the mean length by mode. Based on this criterion, no cases were removed.

The combined cell phone and panel samples were weighted to match the sample’s demographics to the national U.S. adult population using data from the Census Bureau’s 2024 Current Population Survey (CPS), September 2023 Volunteering and Civic Life Supplement data from the CPS, and the 2024 KFF Benchmarking Survey with ABS and prepaid cell phone samples. The demographic variables included in weighting for the general population sample are sex, age, education, race/ethnicity, region, civic engagement, frequency of internet use, political party identification by race/ethnicity, and education. The weights account for differences in the probability of selection for each sample type (prepaid cell phone and panel). This includes adjustment for the sample design and geographic stratification of the cell phone sample, within household probability of selection, and the design of the panel-recruitment procedure.

The margin of sampling error including the design effect for the full sample is plus or minus 3 percentage points Numbers of respondents and margins of sampling error for key subgroups are shown in the table below. For results based on other subgroups, the margin of sampling error may be higher. Sample sizes and margins of sampling error for other subgroups are available on request. Sampling error is only one of many potential sources of error and there may be other unmeasured error in this or any other public opinion poll. KFF public opinion and survey research is a charter member of the Transparency Initiative of the American Association for Public Opinion Research.

GroupN (unweighted)M.O.S.E.
Total1,380± 3 percentage points
Parents of children under 18457± 6 percentage points
Party ID
Democrats469± 6 percentage points
Independents466± 5 percentage points
Republicans361± 6 percentage points
News Release

Most of the Public Oppose Major Federal Cuts to Health Agencies and Programs and Say They Have Been Made “Recklessly”

The Public, Including Most Republicans, Oppose Medicaid Cuts; MAGA Supporters Are Divided

Published: May 1, 2025

As the Trump administration and Congress pursue broad cuts to federal health agencies and budgets, most of the public, including some Republicans, oppose deep budget and staffing cuts to federal health programs and agencies, a new KFF Health Tracking Poll finds.

Across a range of questions, large majorities of Democrats and independents oppose the Trump administration’s major cuts to federal health agencies and programs, while Republicans are more supportive. Those who identify with President Trump’s Make America Great Again movement are even more supportive of cuts to health agency’s staff and budget but still split on cuts to funding for Medicaid and a few other programs.

For example, most of the public (61%), including large shares of Democrats (89%) and independents (67%), oppose major health spending and staff cuts at federal health agencies. In contrast, MAGA supporters overwhelmingly support such cuts (78%), while Republicans and Republican-leaning independents who don’t align with MAGA are divided (48% support the cuts, 52% oppose).

Similarly, most (59%) of the public, including large majorities of Democrats (92%) and independents (65%), say the Trump administration and its Department of Government Efficiency (DOGE) have been “recklessly making broad cuts to programs and staff.”  

In contrast, the vast majority of MAGA supporters (87%), and a narrower majority of non-MAGA Republicans and Republican leaners (57%), say that the administration is “carefully making cuts to programs and staff to reduce fraud and waste.”

On Medicaid, a contentious issue as the Trump administration and Congressional Republicans weigh budget cuts to help finance tax cuts, three quarters (76%) of the public say they oppose major federal funding cuts.

A narrow majority of Republicans (55%), as well as larger majorities of Democrats (95%) and independents (79%), oppose major Medicaid cuts. MAGA supporters are closely divided on major funding cuts to Medicaid, with similar shares in favor (51%) and opposed (49%) to major cuts.

Large Majorities Oppose Specific Cuts to Federal Health Programs and Agencies

The poll also gauges the public’s views on federal funding cuts for other health programs. In each case, more than six in 10 oppose specific federal health cuts.  For example:

  • About three quarters (74%) oppose major cuts to states for mental health and addiction prevention services. This includes a narrow majority of Republicans (58%), and large majorities of Democrats (89%) and independents (75%).
  • Most (71%) oppose major cuts to funding to track infectious disease outbreaks. This includes half of Republicans (51%), and large majorities of Democrats (89%) and independents (74%).
  • Seven in 10 (69%) oppose major cuts to research at universities and medical centers. This includes large majorities of Democrats (92%) and independents (69%). In contrast, most Republicans (56%) favor such cuts.
  • Nearly two thirds (65%) oppose reduced federal funding to help people pay the premiums for health coverage purchased through the Affordable Care Act marketplaces. This includes large majorities of Democrats (88%) and independents (65%). In contrast, most Republicans, (61%) favor such cuts.

Most of the public also opposes major staffing cuts to key federal health agencies such as the Department of Veteran Affairs (74% oppose), Centers for Medicare & Medicaid Services (67%), the Centers for Disease Control and Prevention (63%), the Food and Drug Administration (63%), and the National Institutes of Health (62%).

Republicans and MAGA supporters narrowly oppose major staffing cuts for Veterans Affairs but favor them at each of the other agencies.

Partisans See Different Drivers of Fraud and Waste in Government Health Program

About half of the public say that fraud, waste, and abuse are a major problem in Medicaid (52%), Social Security (51%), and Medicare (50%), and a slightly larger majority say it is a major problem in private health insurance (57%).

Partisans choose different groups when asked who is most responsible for fraud, waste, and abuse in government health programs. About half of Democrats (49%) say private health insurers are most responsible, while Republicans most often name government workers (42%). Fewer across partisans blame people enrolled in the programs or hospitals, doctors and other health providers.

Designed and analyzed by public opinion researchers at KFF, this survey was conducted April 8-15, 2025, online and by telephone among a nationally representative sample of 1,380 U.S. adults in English and in Spanish. The margin of sampling error is plus or minus 3 percentage points for the full sample. For results based on other subgroups, the margin of sampling error may be higher.