State Variation in Medicaid LTSS Policy Choices and Implications for Upcoming Policy Debates
Executive Summary
Medicaid is a key source of coverage for seniors and people with disabilities, including those who need long-term services and supports (LTSS) to meet daily needs. Waivers are the primary way that states expand financial eligibility and offer home and community-based services (HCBS) benefit packages to seniors and people with disabilities. Unlike Medicaid state plan authorities, which require states to cover (and provide federal matching funds for) everyone who meets the associated eligibility criteria, waivers allow states to limit the number of people served. States’ ability to cap HCBS waiver enrollment can result in waiting lists when the number of people seeking services exceeds the number of waiver slots available.
Waiting lists are one proxy for unmet need for HCBS, but waiting lists alone are an incomplete measure. Most eligibility pathways based on old age or disability, and nearly all HCBS benefits, are optional, creating a great deal of variation among states. This brief draws on several KFF state-level surveys to examine multiple measures, beyond waiting lists, to evaluate state choices about optional Medicaid eligibility pathways, spending, and services for seniors and people with disabilities.
Our review of a range of measures finds substantial state variation in adoption of policies to expand Medicaid for seniors and people with disabilities. While there has been some criticism that the ACA Medicaid expansion might crowd out other benefits, states’ ACA expansion status does not appear to be a strong predictor of policy choices related to seniors and people with disabilities. In some cases, a state’s choice to adopt the ACA expansion is associated with state take-up of options to expand eligibility and services for seniors and people with disabilities, while in many cases, state variation in policies for seniors and people with disabilities appears to be entirely unrelated to ACA expansion status.
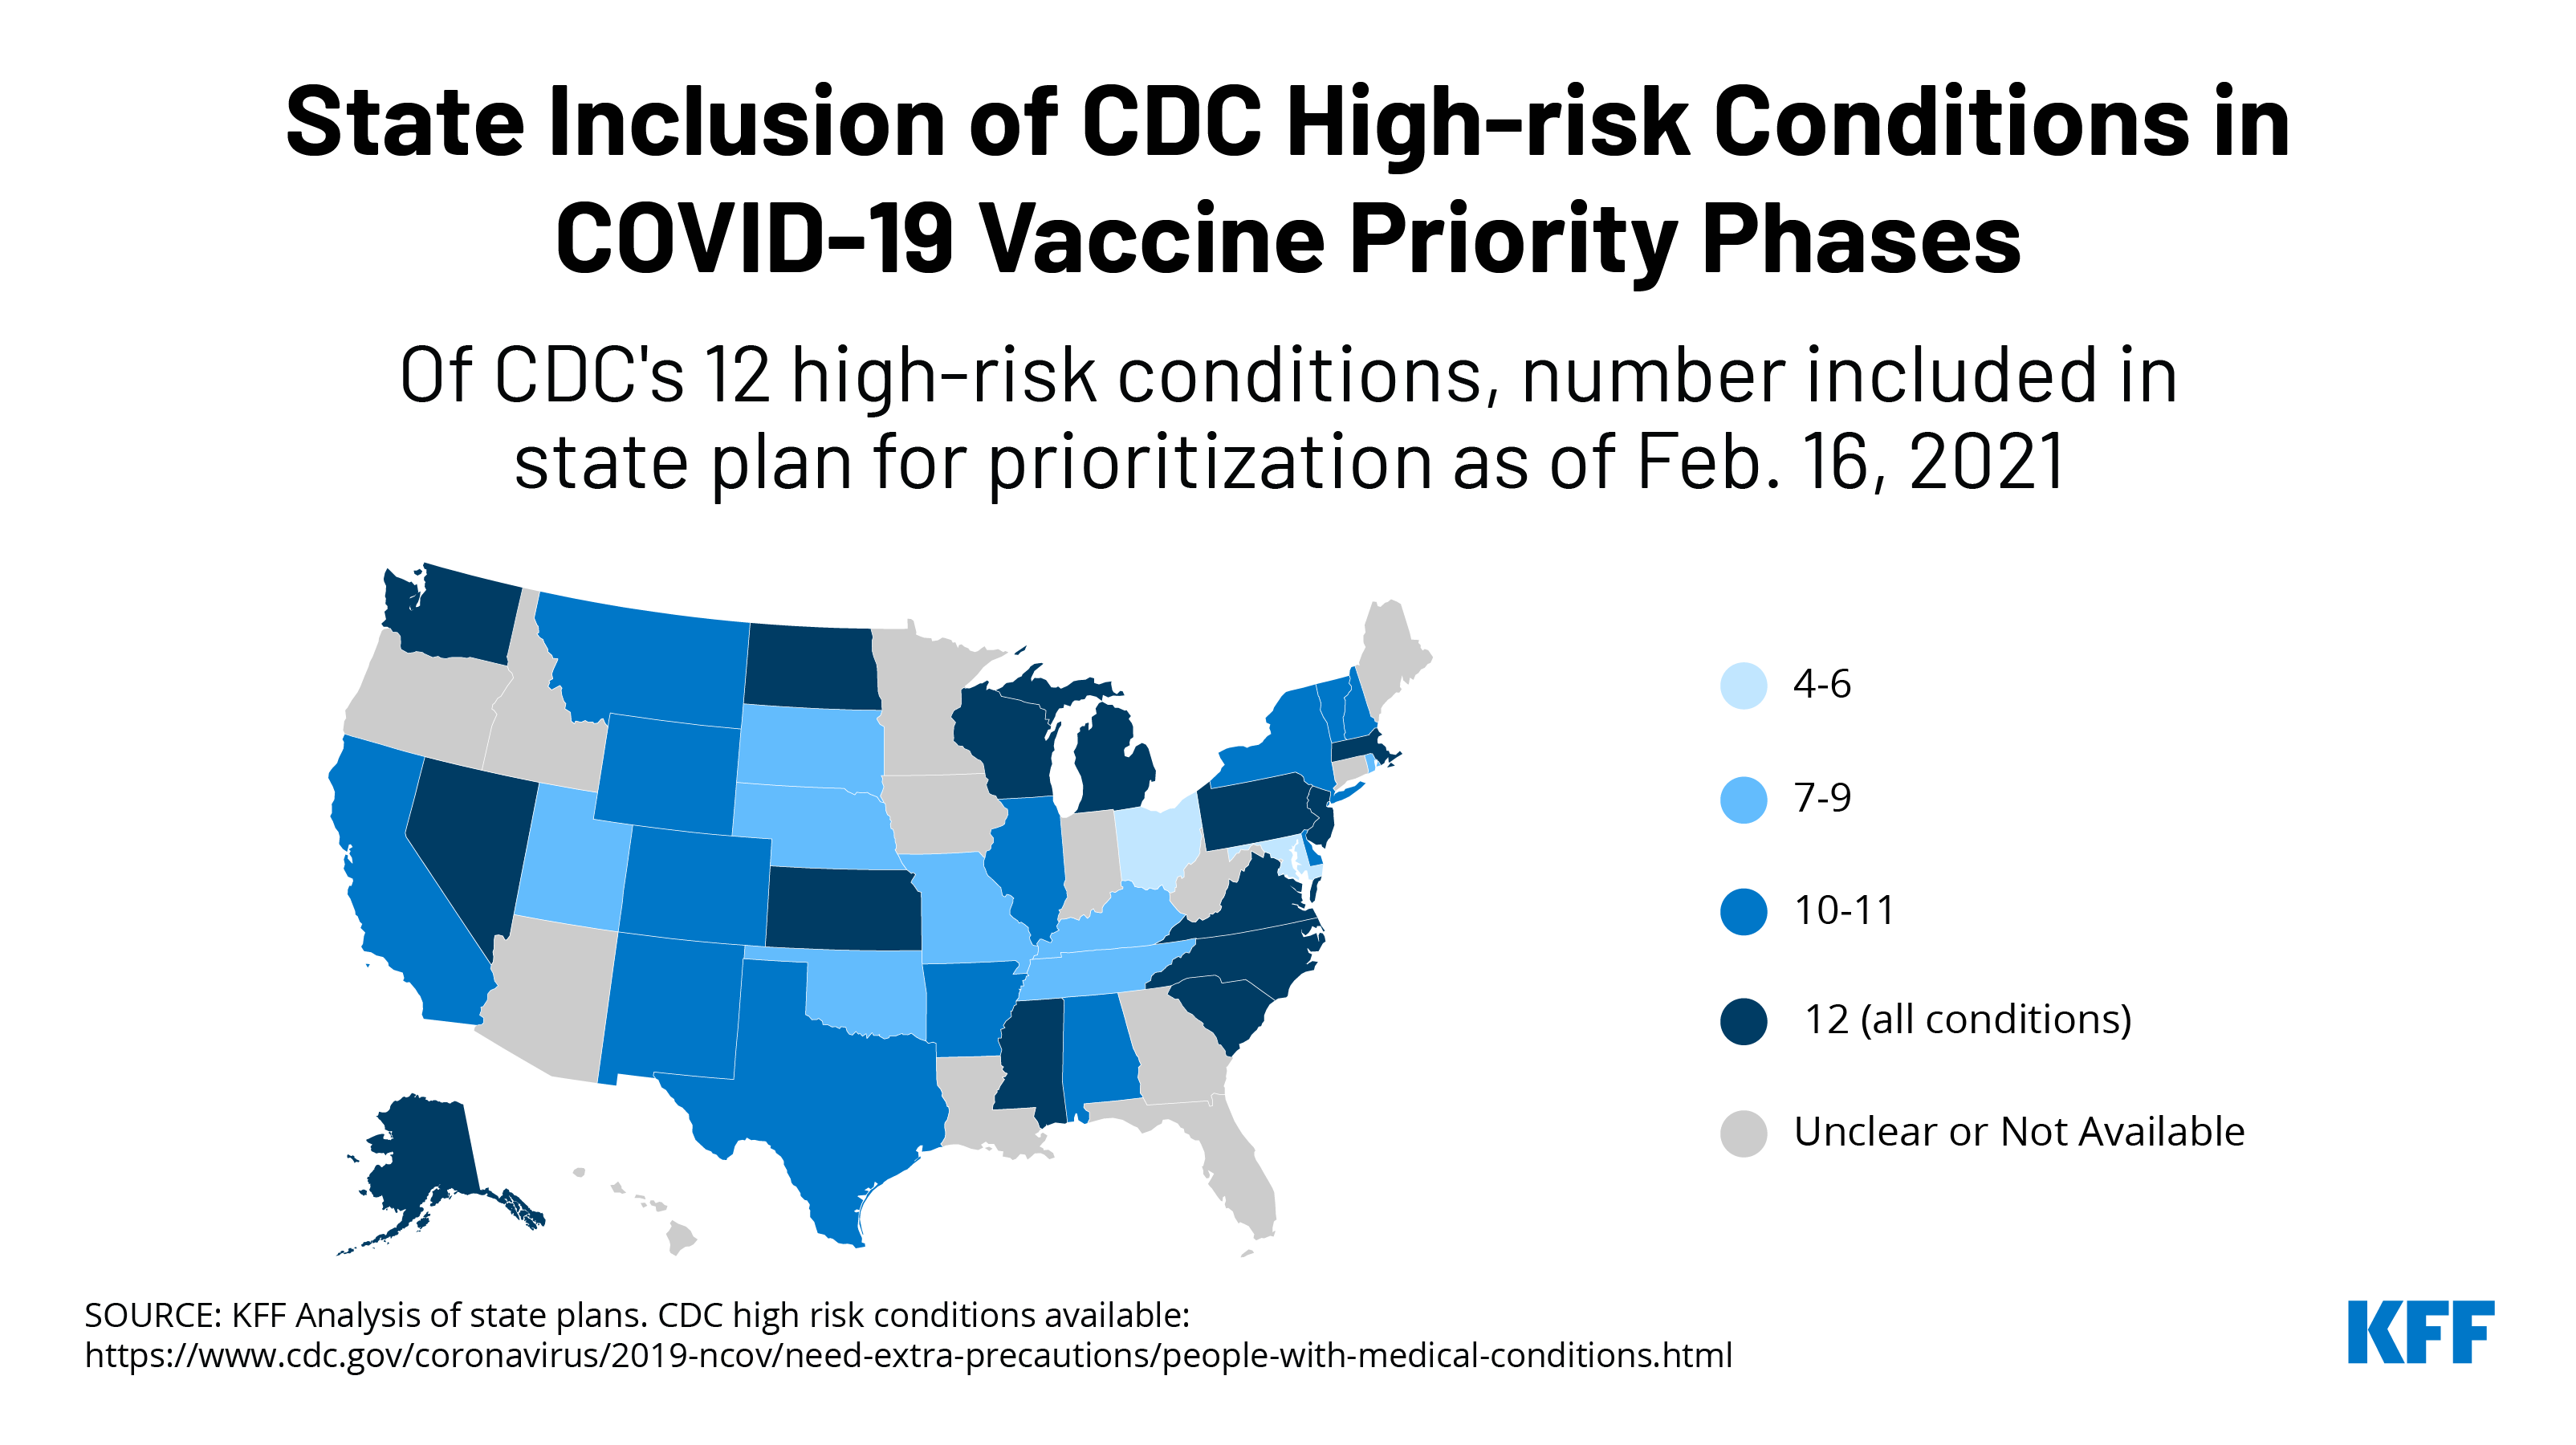
Understanding current state-level variation in Medicaid eligibility, spending, and services for seniors and people with disabilities is important to inform upcoming policy debates. The Biden Administration supports expanding Medicaid HCBS through legislative changes to eliminate waiver waiting lists. COVID relief legislation being discussed in Congress would provide a time-limited 7.35 percentage point increase in federal Medicaid matching funds for state spending on HCBS, to fund a variety of activities to expand access to HCBS and support direct care providers during the COVID-19 public health emergency. Policymakers also may consider legislation to end Medicaid’s historical institutional bias by making HCBS a mandatory benefit, a policy that has garnered more interest in the recent months, given COVID-19’s disproportionate impact on people in institutional settings.
Issue Brief
Introduction
Medicaid is a key source of coverage for seniors and people with disabilities, including those who need long-term services and supports (LTSS) to meet daily self-care and independent living needs. Many of the Medicaid eligibility pathways that are based on old age or disability, and nearly all home and community-based services (HCBS), are offered at state option, resulting in variation among states. Waivers continue to be the primary way that states expand financial eligibility and offer HCBS benefit packages to seniors and people with disabilities.
Unlike Medicaid state plan authorities, which require states to cover (and provide federal matching funds for) everyone who meets the associated eligibility criteria, waivers allow states to limit the number of people served. States’ ability to cap HCBS waiver enrollment can result in waiting lists when the number of people seeking services exceeds the number of waiver slots available. More than three-quarters of states (41) reported a HCBS waiver waiting list in 2018 (the most current year for which data are available).1
Waiting lists are one proxy for unmet need for HCBS, but waiting lists alone are an incomplete measure of state capacity and unmet need. Waiting lists reflect the populations a state chooses to serve and how the state defines those populations, as well as the resources it commits. In addition, states’ waiting list management approaches differ with regard to prioritization and eligibility screening processes, making comparisons across states difficult. While some Affordable Care Act (ACA) opponents cite waiver waiting lists to argue that expansion diverts funds from seniors and people with disabilities in need of HCBS, research shows that the ACA Medicaid expansion has led to gains in coverage for people with disabilities and chronic illnesses. The ACA expansion is a pathway to Medicaid eligibility for people with disabilities, many of whom previously were ineligible for coverage (Box 1). In addition, HCBS waiver waiting lists predate the ACA Medicaid expansion, which became effective in most states in 2014. Waiver enrollment caps have existed since HCBS waiver authority was added to federal Medicaid law in the early 1980s, and states have reported waiver waiting lists in each year of the KFF 50-state Medicaid HCBS waiver program survey, dating back to 2002. Among the nearly 820,000 people on an HCBS waiver waiting list nationally, two-thirds reside in a non-expansion state.2
This brief takes a closer look at multiple measures beyond waiver waiting lists to evaluate state choices about optional Medicaid eligibility pathways, spending, and services for seniors and people with disabilities as of 2018.3 The analysis draws on several KFF resources, including 50-state surveys of Medicaid financial eligibility pathways for seniors and people with disabilities, HCBS waiver programs, and state plan benefits offered, as well as state Medicaid LTSS expenditures reported by Mathematica.4 We find substantial state variation in adoption of policies to expand Medicaid for seniors and people with disabilities, with states’ ACA expansion status not a strong predictor of policy choices related to seniors and people with disabilities. The Appendix contains detailed data tables. Understanding current state-level variation in Medicaid eligibility, spending, and services for seniors and people with disabilities will be important to inform upcoming policy debates about proposals, including those supported by President Biden during the campaign, to expand HCBS and eliminate Medicaid’s historical institutional bias.
Box 1: ACA Expansion as an Eligibility Pathway for People with Disabilities5
The ACA Medicaid expansion includes – and provides a new coverage pathway for –people with disabilities and chronic conditions, some of whom previously were ineligible and may have been uninsured. Prior to the ACA, income limits for parents were very low, and there was no Medicaid eligibility pathway for childless adults. Many expansion adults have disabilities and/or chronic health conditions that may not rise to the stringent level required to establish eligibility for federal Supplemental Security Income (SSI) benefits. They also may have income and/or assets above the SSI limits: the maximum SSI benefit is about 74% of the federal poverty level (FPL, $794/month in 2021), and assets are limited to $2000. By contrast, the income limit for the expansion group is 138% FPL ($1,481/month for an individual), and there is no asset test. Other expansion group enrollees may qualify for Social Security Disability Insurance (SSDI) benefits but, without the ACA expansion pathway, could be uninsured during the required 24-month waiting period before they obtain Medicare eligibility. The benefit package for Medicaid expansion adults can include access to HCBS, such as home health or personal care state plan services. To the extent that these services meet the needs of expansion adults with disabilities or chronic conditions, these enrollees may choose not to pursue HCBS waiver coverage – and not join a waiver waiting list – because state plan coverage is available to them.
Key Areas of State Variation in Medicaid LTSS Policies
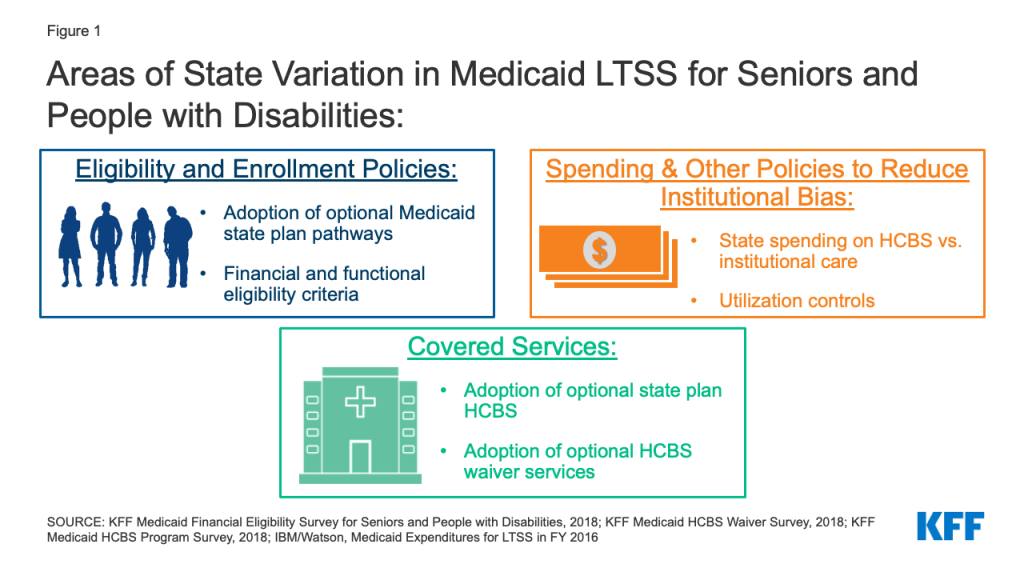
This brief takes a closer look at over 50 measures across three key areas (optional Medicaid eligibility pathways, spending, and services for seniors and people with disabilities) to assess state variation in LTSS policy choices beyond waiver waiting lists6 (Figure 1). The analysis identifies measures that demonstrate general state-level variation and measures that vary notably by states’ ACA expansion status. If a measure is presented by the binary “adopted” or “not adopted,” we consider this measure to vary notably by expansion status if it meets the following two criteria: 1) at least 15 states adopt that measure, and 2) there is at least a ten percentage point difference in the share of states that adopt that measure, by expansion status. Measures that are presented as medians or averages are considered to vary notably by expansion status if they meet the following two criteria: 1) there are at least 15 states included in calculation of the median or average, and 2) there is any degree of difference between the expansion and non-expansion averages/medians. Measures that do not vary by expansion status are considered to exhibit more general state variation.
Eligibility and Enrollment
We examined 14 key measures related to eligibility and enrollment policies for seniors and people with disabilities, including optional eligibility pathways, financial and functional eligibility criteria, post-eligibility treatment of income, and renewals. Specific measures are listed in Table 1. While nearly all states offer at least one optional state plan eligibility pathway based on old age or disability, state choices about which pathways adopted vary. Nearly all states choose to cover children with significant disabilities and working people with disabilities, and three-quarters cover medically needy seniors and/or people with disabilities. Less than half of states cover seniors and people with disabilities up to the federal poverty level, and very few states elect the Section 1915 (i) optional eligibility pathway (Appendix Table 1). Within these optional pathways, a minority of states opt to expand or eliminate asset limits (Appendix Tables 2-5). Nearly all states expand LTSS financial eligibility for both institutions and HCBS beyond state plan limits (Appendix Tables 6-9), and most states apply the same or less stringent financial and functional eligibility criteria to pathways for institutional LTSS and HCBS (Appendix Table 10). Post-eligibility treatment of income policies and spousal impoverishment standards vary across states (Appendix Table 11). Most states have adopted the ACA options to streamline renewals for pathways based on old age or disability (Appendix Table 12).
| Table 1: Eligibility and Enrollment Policy Options for Seniors and People with Disabilities | |
| Policy Area | Specific measures |
| Eligibility pathways |
|
| Financial eligibility criteria |
|
| Functional eligibility criteria | Functional eligibility criteria for HCBS are more or less stringent than institutions |
| Post-eligibility treatment of income |
|
| Eligibility renewal |
|
Some state policy choices related to Medicaid eligibility and enrollment for seniors and people with disabilities vary by states’ ACA expansion status, most notably with regard to optional coverage pathways. Expansion states are more likely than non-expansion states to offer coverage through certain state plan pathways, including the medically needy pathway and the buy-in for working people with disabilities (Appendix Tables 1-3, 5). Expansion states also are more likely than non-expansion states to not apply an asset limit to the buy-in for working people with disabilities (Appendix Tables 2, 5). While non-expansion states are more likely to expand financial eligibility for institutional LTSS beyond state plan pathway limits, expansion states are more likely to expand financial eligibility for several HCBS waiver populations (Appendix Tables 6-9). Expansion states typically adopt a higher median monthly personal needs allowance, expanding financial eligibility for HCBS waiver enrollees (Appendix Table 11). Additionally, non-expansion states are more likely than expansion states to adopt the ACA options to streamline Medicaid eligibility renewals for pathways based on old age or disability, including offering pre-populated forms and a reconsideration period (Appendix Table 12).7
Spending and Other Policies to Reduce Institutional Bias
We examined 17 key measures related to Medicaid LTSS spending and other policies to reduce institutional bias, including the share of LTSS spending devoted to HCBS, participation in federal HCBS grant programs, utilization controls, and waiting lists. Specific measures are listed in Table 2. Nationally, 56% of total Medicaid LTSS dollars are spent on HCBS as opposed to institutional care, with substantial variation among states, ranging from 30% to 83% (Appendix Table 13).8 Most states participate in the Money Follows the Person program, while over one-third were both eligible for and participated in the Balancing Incentive Program (Appendix Table 14).9 Two-thirds of states apply cost caps to HCBS waiver services, while very few do so for state plan home health or personal care services (Appendix Table 15). Half of states apply hour caps to home health state plan services, while less than half do so for personal care state plan services and HCBS waiver services (Appendix Table 15). Few states apply geographic limits to their HCBS waivers (Appendix Table 15). The majority of states screen people on a HCBS waiver waiting list for eligibility prior to waiting list enrollment and prioritize individuals with certain characteristics to receive waiver services when slots become available (Appendix Table 16-17). There is substantial variation among states in the average waiting period for waiver services by target population (Appendix Table 16-17).
| Table 2: LTSS Spending and Other Policies to Reduce Institutional Bias | |
| Policy Area | Specific measures |
| LTSS spending |
|
| Federal grant programs |
|
| Utilization controls |
|
| Wavier waiting lists |
|
Certain state policy choices to increase HCBS spending and reduce institutional bias vary by states’ ACA expansion status. Nearly half of all expansion states spend above the national average (56%) of their total LTSS dollars on HCBS (vs. institutional care) compared to under one-third of non-expansion states10 (Appendix Table 13). Additionally, among the states that were eligible for the ACA’s Balancing Incentive Program (BIP), expansion states were more than twice as likely to participate as non-expansion states11 (Appendix Table 14). The overall average waiting period for waiver services was longer among individuals living in expansion states compared to non-expansion states (Appendix Tables 16-17).
Covered Services
We examined 22 key measures related to Medicaid covered services for seniors and people with disabilities, including optional state plan benefits, HCBS waiver services, and self-direction policies. Specific measures are listed in Table 3. There is a great deal of variation in terms of state adoption of optional state plan HCBS, ranging from nearly all states adopting the rehabilitative services option to eight states adopting Community First Choice (CFC) attendant services (Appendix Table 18). In addition to the rehabilitative services option, half or more of states offer targeted case management, personal care, PACE, and private duty nursing state plan benefits (Appendix Table 18). Just under half of states offer ACA health homes, while fewer states offer case management or Section 1915 (i) state plan HCBS (Appendix Table 18). States’ HCBS waiver benefit packages vary widely by target population (Appendix Tables 19-24). Nearly all states offer options to self-direct state plan and/or HCBS waiver services12 (Appendix Table 25). When evaluating state variation in policies related to optional covered services, there is no clear relationship to states’ ACA expansion status.
| Table 3: State Policy Choices About Optional Covered Services | |
| Policy Area | Specific measures |
| Optional state plan HCBS |
|
| HCBS waiver services |
|
| Self-direction policies |
|
Looking Ahead
Our review of a range of measures, beyond waiver waiting lists, finds substantial state variation in adoption of policies to expand Medicaid for seniors and people with disabilities, with states’ ACA expansion status not a strong predictor of policy choices related to seniors and people with disabilities. In some cases, a state’s choice to adopt the ACA expansion is associated with state take-up of options to expand eligibility for seniors and people with disabilities, while in many cases, state variation in policies for seniors and people with disabilities appears to be unrelated to ACA expansion status.
Understanding current state-level variation in Medicaid eligibility, spending, and services for seniors and people with disabilities is important to inform upcoming policy debates. President Biden during the campaign supported expanding Medicaid HCBS through legislative changes to eliminate waiver waiting lists. COVID relief legislation being discussed in Congress would provide a time-limited 7.35 percentage point increase in federal Medicaid matching funds for state spending on HCBS, to fund a variety of activities to expand access to HCBS and support direct care providers during the COVID-19 public health emergency. Policymakers also may consider legislation to end Medicaid’s historical institutional bias by making HCBS a mandatory benefit, a policy that has garnered more interest in the recent months, given COVID-19’s disproportionate impact on people in institutional settings.
Though Medicaid is serving as a safety net during the public health emergency and economic downturn, state budget shortfalls could make it challenging for states to maintain optional LTSS without additional federal fiscal support. The Families First Coronavirus Response Act provided states with a temporary 6.2 percentage point increase in federal Medicaid matching funds to support their COVID-19 response, provided that states provide continuous coverage for current enrollees and meet other maintenance of effort (MOE) requirements. Notably, a few states – all of which have adopted the ACA Medicaid expansion — reported plans to expand optional eligibility pathways based on old age or disability in FY 2021.13 Still, as the pandemic and economic downturn continue, states may be forced to look to cutting provider payments or eliminating optional benefits, without further fiscal relief. The Biden Administration has indicated that the PHE is expected to extend through 2021, which would ensure that states can continue to receive the FMAP bump and prevent states from scaling back optional eligibility pathways. The MOE prevents states from adopting eligibility standards more restrictive than those in effect on January 1, 2020, while states are receiving enhanced federal matching funds, although changes to optional benefits, cost-sharing (including for LTSS), and provider payments are permitted.
The Biden Administration can take a variety of administrative actions to support state Medicaid programs and ensure continued coverage for enrollees during the public health emergency. States are using various Medicaid emergency authorities to expand eligibility for seniors and people with disabilities, including those who need LTSS, during the pandemic, and the Biden Administration’s indication that the PHE declaration is likely to continue through 2021, ensures that these authorities remain available to states. Over half of states have expanded eligibility criteria for seniors and people with disabilities, while a few states have increased the total number of HCBS waiver enrollees served. Nearly all states have streamlined enrollment processes, and over one-third of states have eased premium and/or cost-sharing requirements for seniors and people with disabilities. After the public health emergency ends, the Biden Administration could encourage and work with states to incorporate policy changes to support coverage adopted during the pandemic into their regular Medicaid programs. CMS guidance issued in December 2020 specifically encourages states to identify any temporary authorities that increased HCBS access and make those changes permanent.
MaryBeth Musumeci and Priya Chidambaram are with KFF.Molly O’Malley Watts is with Watts Health Policy Consulting.
Endnotes
- KFF, Key State Policy Choices About Medicaid Home and Community-Based Services (Feb. 2020), https://modern.kff.org/medicaid/issue-brief/key-state-policy-choices-about-medicaid-home-and-community-based-services/. ↩︎
- Id. ↩︎
- To align with available data sources, this report uses states’ ACA expansion status as of 2018 (33 expansion states and 18 non-expansion states). Medicaid expansion coverage became effective January 1, 2014 in all states that have adopted the expansion except for the following: Michigan (4/1/2014), New Hampshire (8/15/2014), Pennsylvania (1/1/2015), Indiana (2/1/2015), Alaska (9/1/2015), Montana (1/1/2016), Louisiana (7/1/2016), Virginia (1/1/2019), Maine (1/10/2019 with coverage retroactive to 7/2/2018), Idaho (1/1/2020), Utah (1/1/2020), Nebraska (10/1/2020), Oklahoma (planned for 7/1/2021), and Missouri (planned for 7/1/2021). For purposes of this analysis, Idaho, Utah, Nebraska, Oklahoma, and Missouri are considered non-expansion states because they implemented expansion after 2018. ↩︎
- Mathematica, Medicaid Long-Term Services and Supports Annual Expenditures Report: Federal Fiscal Years 2017 and 2018 (Jan. 2021), https://www.medicaid.gov/medicaid/long-term-services-supports/downloads/ltssexpenditures-2017-2018.pdf. ↩︎
- KFF, People with Disabilities Are At Risk of Losing Medicaid Coverage Without the ACA Expansion (Nov. 2020), https://modern.kff.org/medicaid/issue-brief/people-with-disabilities-are-at-risk-of-losing-medicaid-coverage-without-the-aca-expansion/. ↩︎
- To align with available data sources, this report uses states’ ACA expansion status as of 2018 (33 expansion states and 18 non-expansion states). Medicaid expansion coverage became effective January 1, 2014 in all states that have adopted the expansion except for the following: Michigan (4/1/2014), New Hampshire (8/15/2014), Pennsylvania (1/1/2015), Indiana (2/1/2015), Alaska (9/1/2015), Montana (1/1/2016), Louisiana (7/1/2016), Virginia (1/1/2019), Maine (1/10/2019 with coverage retroactive to 7/2/2018), Idaho (1/1/2020), Utah (1/1/2020), Nebraska (10/1/2020), Oklahoma (planned for 7/1/2021), and Missouri (planned for 7/1/2021). For purposes of this analysis, Idaho, Utah, Nebraska, Oklahoma, and Missouri are considered non-expansion states because they implemented expansion after 2018. ↩︎
- Aside from the Medicaid expansion, the ACA introduced other reforms that simplify and modernize Medicaid eligibility and enrollment processes. All states must adopt these reforms for poverty-related coverage pathways, and states can choose whether to apply them to age and disability-related pathways. 42 C.F.R. § 435.916; KFF, Medicaid Financial Eligibility for Seniors and People with Disabilities: Findings From a 50-State Survey (June 2019), https://modern.kff.org/report-section/medicaid-financial-eligibility-for-seniors-and-people-with-disabilities-findings-from-a-50-state-survey-issue-brief/. ↩︎
- The overall shift in spending from institutional services to HCBS reflects decades long rebalancing efforts by states and the federal government to meet beneficiary preferences for community living and community integration obligations under the Americans with Disabilities Act and the Supreme Court’s Olmstead decision and provide services in the most cost effective setting. ↩︎
- The MFP program operates in 29 Medicaid expansion states and 15 non-expansion states, and as of December 2019, 101,540 individuals have transitioned from an institution into the community since MFP began. Mathematica, Money Follows the Person: State Transitions as of December 31, 2019 (Sept. 2020), https://www.medicaid.gov/medicaid/long-term-services-supports/downloads/mfp-2019-transitions-brief.pdf. ↩︎
- Notably, spending data for five states (CA, IL, NC, NY and VA) are excluded, as a large share of services are provided by managed care organizations for which data are unavailable. Mathematica, Medicaid Long-Term Services and Supports Annual Expenditures Report: Federal Fiscal Years 2017 and 2018 (Jan. 2021), https://www.medicaid.gov/medicaid/long-term-services-supports/downloads/ltssexpenditures-2017-2018.pdf. ↩︎
- The BIP offered states temporary enhanced federal matching funds for Medicaid HCBS in exchange for making certain structural changes to their LTSS delivery systems. Participation in BIP was limited to states that, as of 2009, were devoting less than half of their total Medicaid LTSS spending to HCBS; 14 expansion states and four non-expansion participated. This total excludes three states (IN, LA, and NE) who initially participated in BIP but terminated their programs before completion. KFF, Medicaid Balancing Incentive Program: A Survey of Participating States (June 2015), https://modern.kff.org/medicaid/report/medicaid-balancing-incentive-program-a-survey-of-participating-states/. ↩︎
- Self-direction typically allows individuals to select and dismiss their direct care workers and determine workers schedules. Most states also allow individuals to set worker payment rates and/or allocate their service budgets. ↩︎
- California is expanding financial eligibility for the optional aged, blind, disabled population from 100% to 138% FPL and adding a new income disregard in the amount of the Medicare Part B premium. New Hampshire plans to expand its Medicaid buy-in program for working people with disabilities to include seniors up to 250% FPL. Louisiana is expanding HCBS waiver coverage for children with significant disabilities without regard to household income and assets. KFF, State Medicaid Programs Respond to Meet COVID-19 Challenges: Results from a 50-State Medicaid Budget Survey For State Fiscal Years 2000 and 2001 (Oct. 2020), https://modern.kff.org/medicaid/report/state-medicaid-programs-respond-to-meet-covid-19-challenges/. ↩︎