KFF designs, conducts and analyzes original public opinion and survey research on Americans’ attitudes, knowledge, and experiences with the health care system to help amplify the public’s voice in major national debates.
In the race to vaccinate as many people in the U.S. as possible, several benchmarks have been proposed, including President Biden’s goal of reaching 70% of adults in the U.S. with at least one dose by July 4. Whether or not this is attainable is unknown, as the pace of vaccination has slowed, and progress has varied substantially across states. Moreover, even where the 70% target is reached, whether nationally or in a particular state, achievement of the goal for the overall population may mask differences in vaccination rates across groups, particularly by race/ethnicity. To date, vaccination rates among Black and Hispanic people have lagged behind those of White people, largely due to access and logistical barriers as well as concerns about safety and potential side effects. As such, even if broad national vaccination goals are achieved, these groups may remain at higher risk, which could lead to widening health disparities and limit the nation’s recovery from the pandemic.
To further explore potential disparities in meeting vaccination benchmarks, researchers at Stanford University and KFF (Kaiser Family Foundation) used current state-reported vaccination data by race/ethnicity to project vaccine coverage going forward, by state and nationally. Specifically, using the current pace of vaccination, we projected the share of people ages 12 and older who would receive at least one dose of a COVID-19 vaccine as of July 4 for four racial/ethnic groups (White, Black, Hispanic, and Asian) and assessed when 70% of each group would have received at least one dose. We were not able to include other groups in the analysis due to data limitations.
Our focus on vaccinations among those ages 12 and older differs from President Biden’s goal, which is based on those 18 and older. We use a 70% vaccination rate as an illustrative measure for examining potential disparities across groups that may underlie an overall coverage rate. We focus on those ages 12 and older due to lack of systematic data on vaccinations by race/ethnicity and age. Our projected coverage levels will be lower than those among adults given that younger adolescents have only more recently become eligible for vaccination. Reporting on race and ethnicity is incomplete and inconsistent across states. Previous reporting on racial/ethnic disparities in vaccination through the Centers for Disease Control and Prevention (CDC) and other sources has not adjusted for these data discrepancies, resulting in reported coverage levels that likely underestimate actual population coverage. Although we have adopted a standard set of definitions and rules for reconciling unknown or discrepant data elements to enable transparent and comparable estimation of coverage over time and place, results must be interpreted as approximations in the context of missing and sometimes noisy data.
Findings
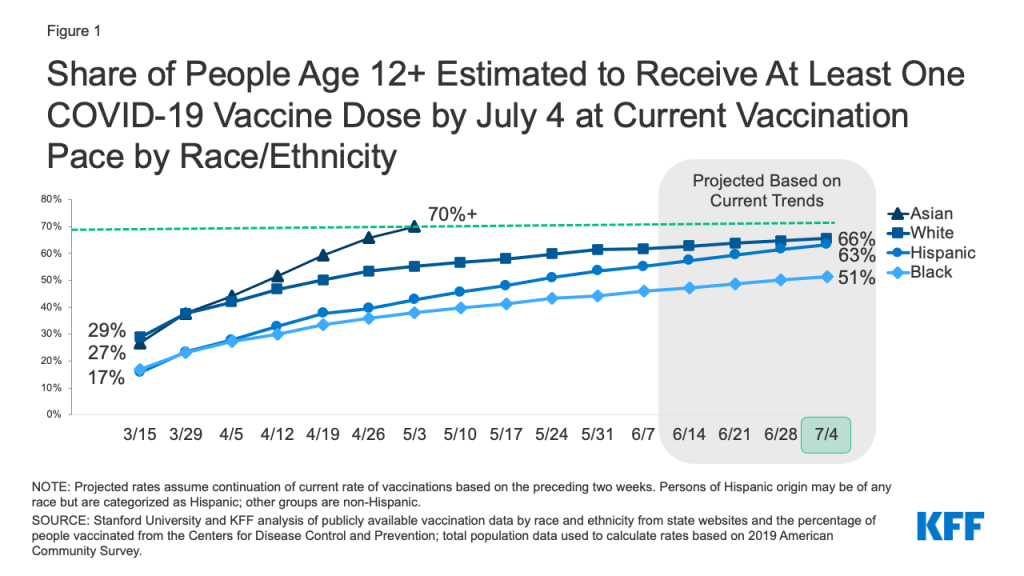
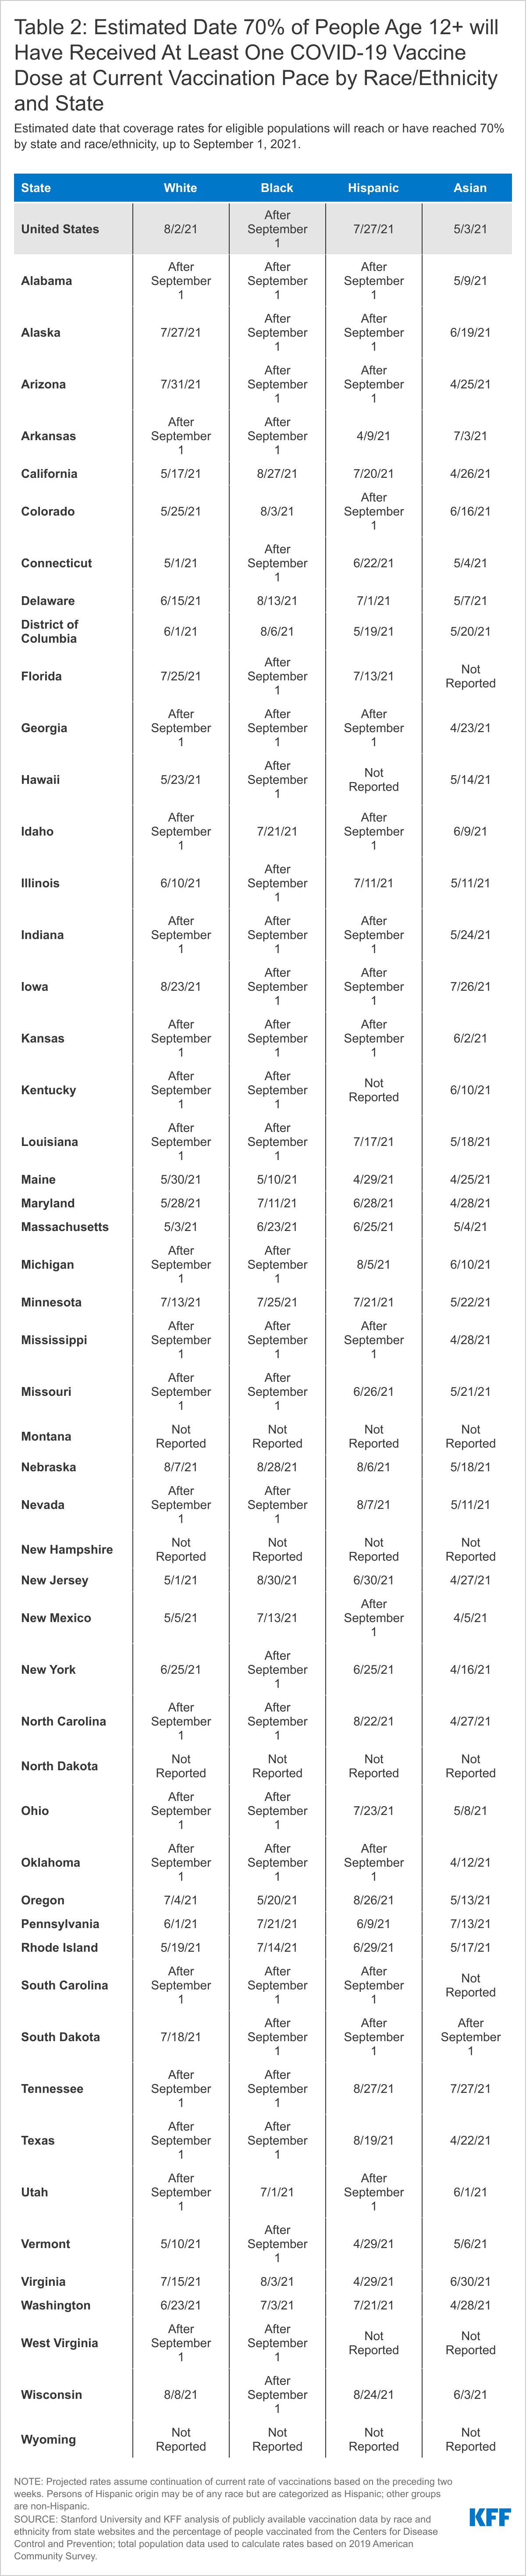
At the current pace of vaccination, 65% of those ages 12 and older would be at least partially vaccinated by July 4, but rates would be lower for Hispanic, and especially Black, people. Asian people are the only group estimated to exceed a 70% vaccination rate, while White people (66%) and Hispanic people (63%) will be shy of reaching this level, and only about half (51%) of Black people will have received at least one COVID-19 vaccine dose by July 4, based on current trends (Figure 1). If the current pace of vaccination continues, Hispanic people nationally would reach a 70% threshold by the end of July (July 27), White people would reach this threshold by early August (August 2), but Black people would still not have reached this coverage level by the beginning of September. Hispanic people are projected to reach 70% coverage faster than White people despite having a lower rate of vaccination as of July 4, because their recent pace of vaccination has been faster than White people.
Figure 1: Share of People Age 12+ Estimated to Receive at Least One COVID-19 Vaccine Dose by July 4 at Current Vaccination Pace by Race/Ethnicity
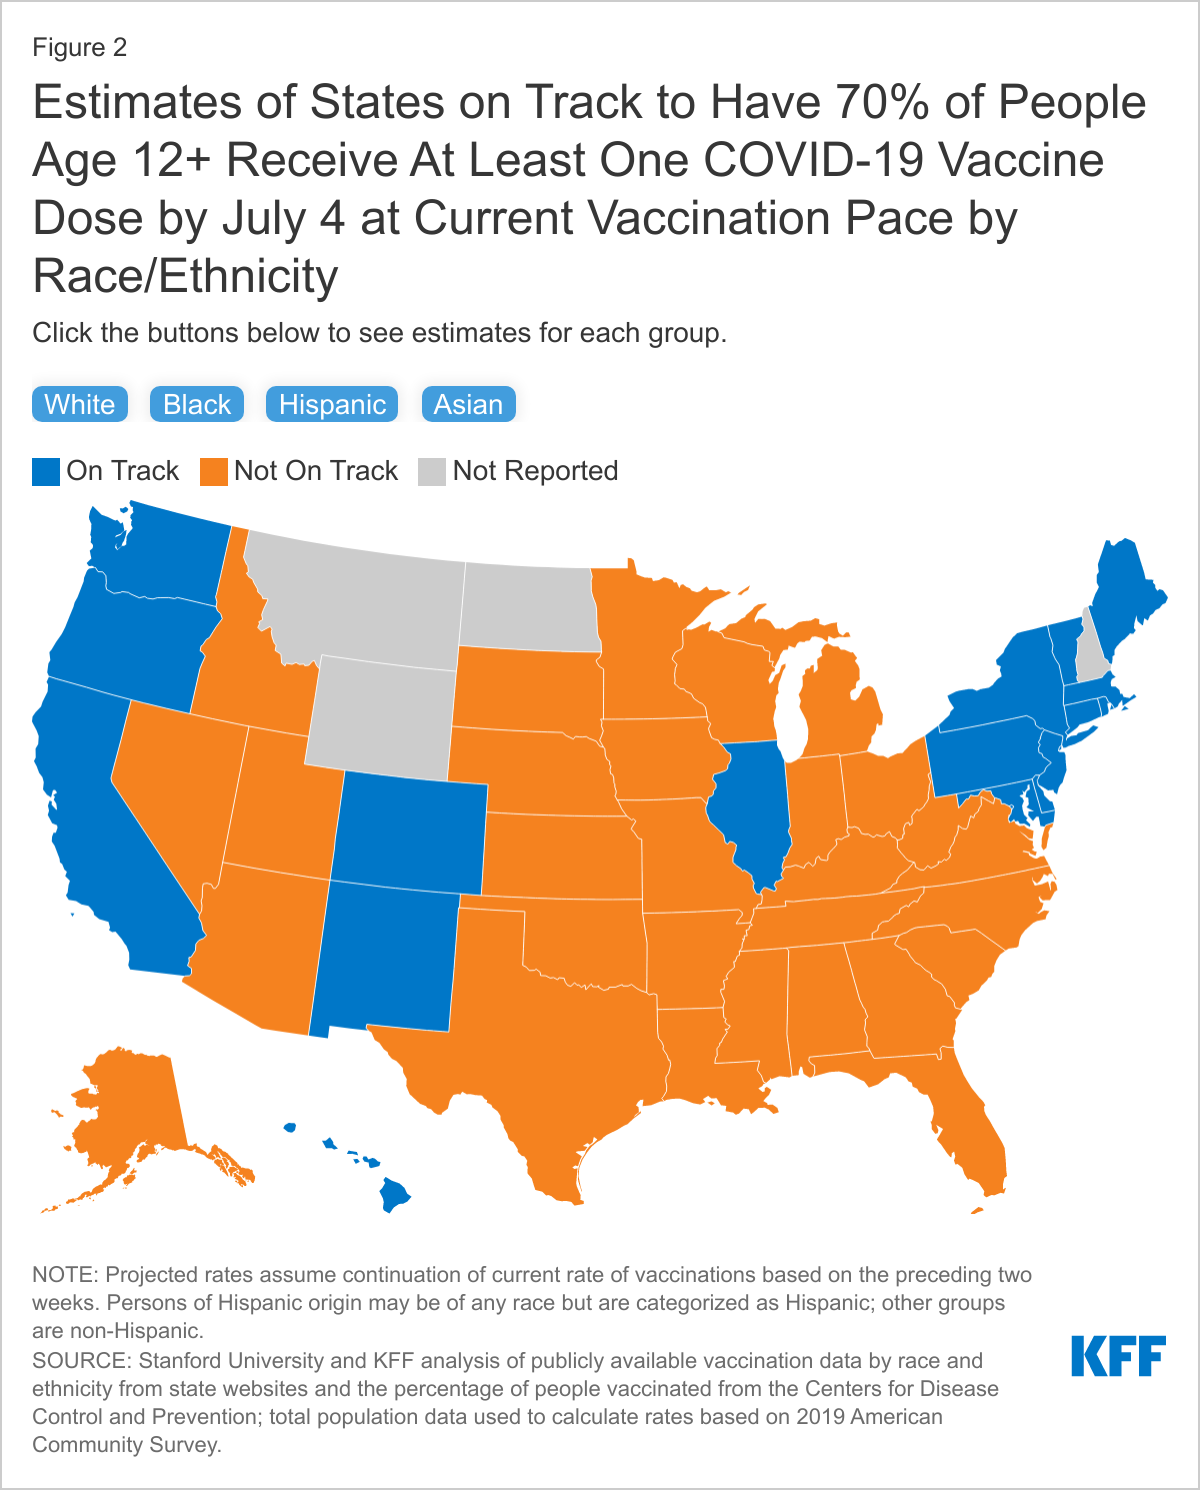
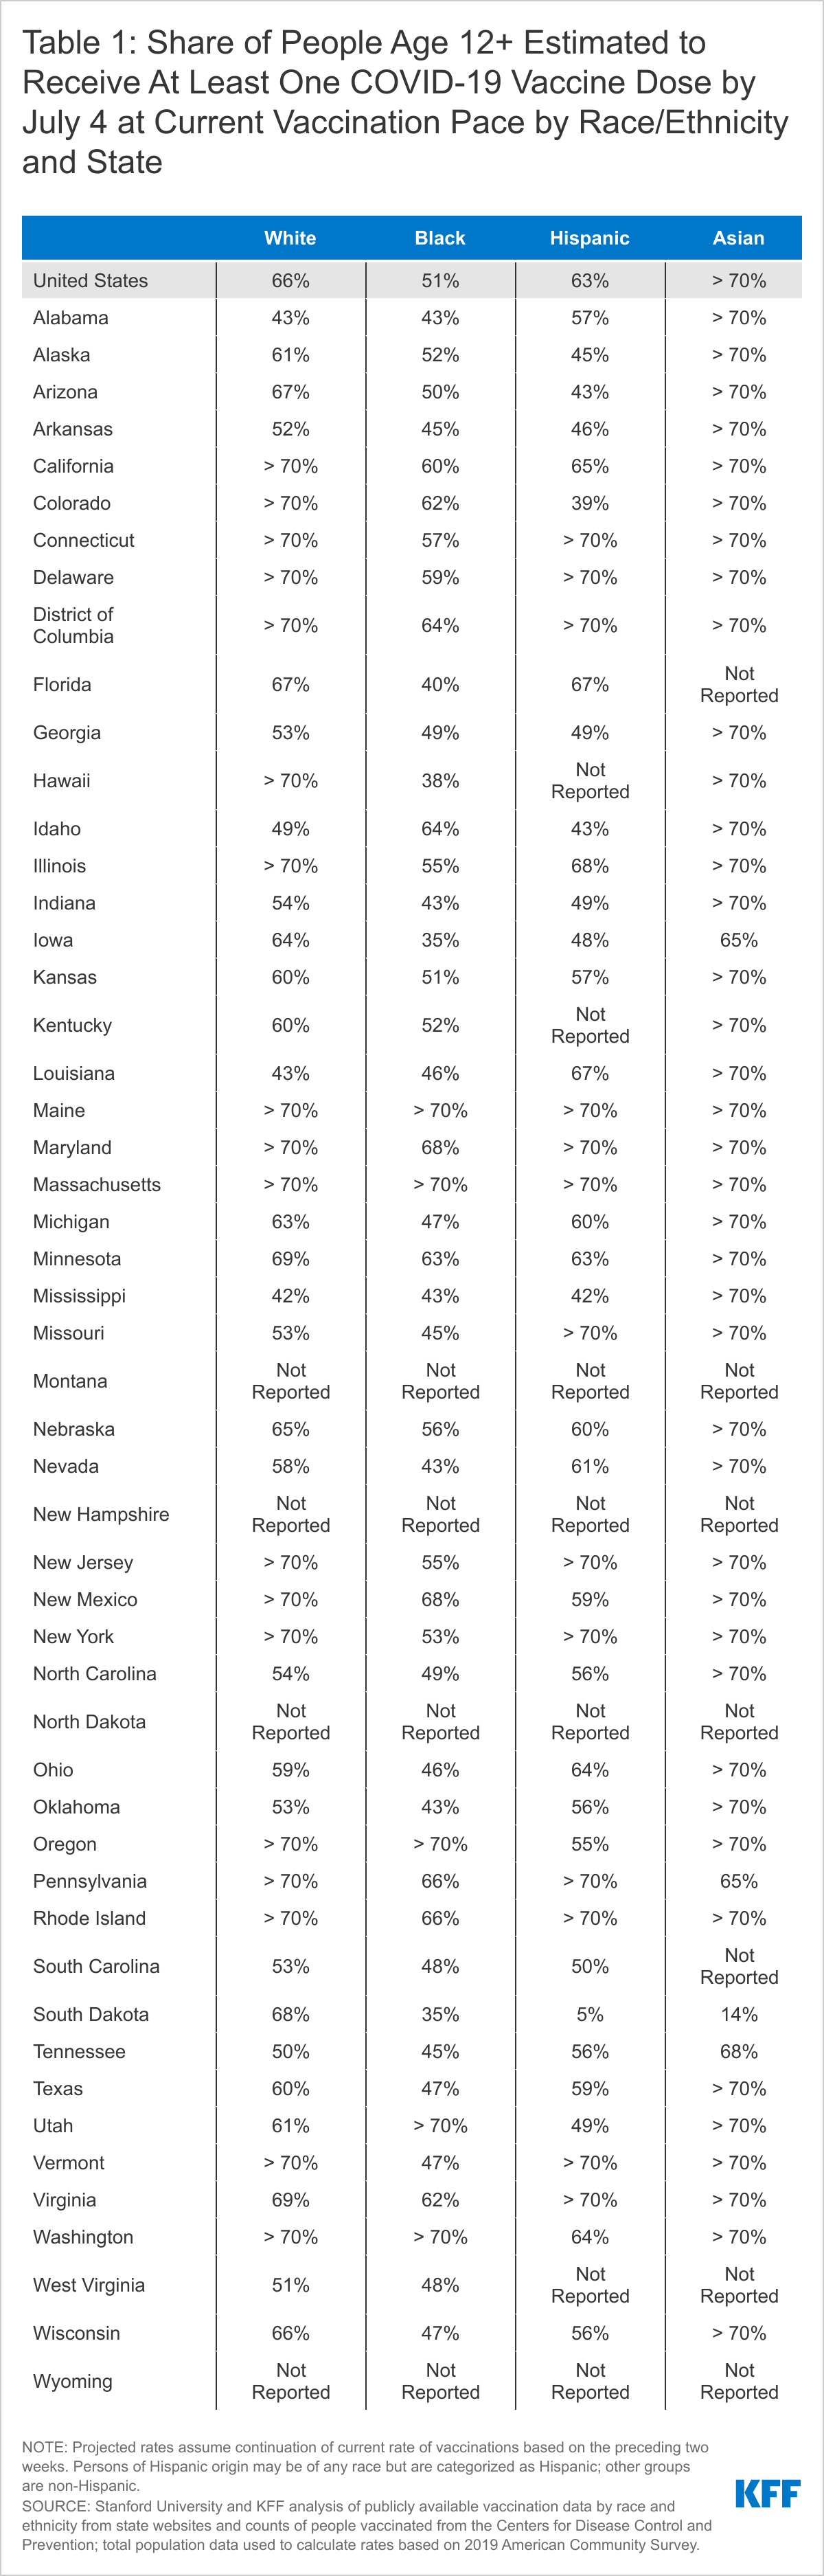
Progress toward achieving a 70% vaccination rate among those ages 12 and older by July 4, and disparities across race/ethnic groups, would also vary significantly across states. At the current vaccination pace, Asian people are on track to reach 70% of those ages 12 and older with at least one COVID-19 vaccine dose in nearly all reporting states (40 of 44), and White people are on track in just over a third of reporting states (18 of 47). Hispanic people are projected to reach this threshold in 13 of 44 reporting states, while Black people are estimated to reach this coverage level in only 5 of 47 reporting states (Figure 2, Tables 1 and 2).
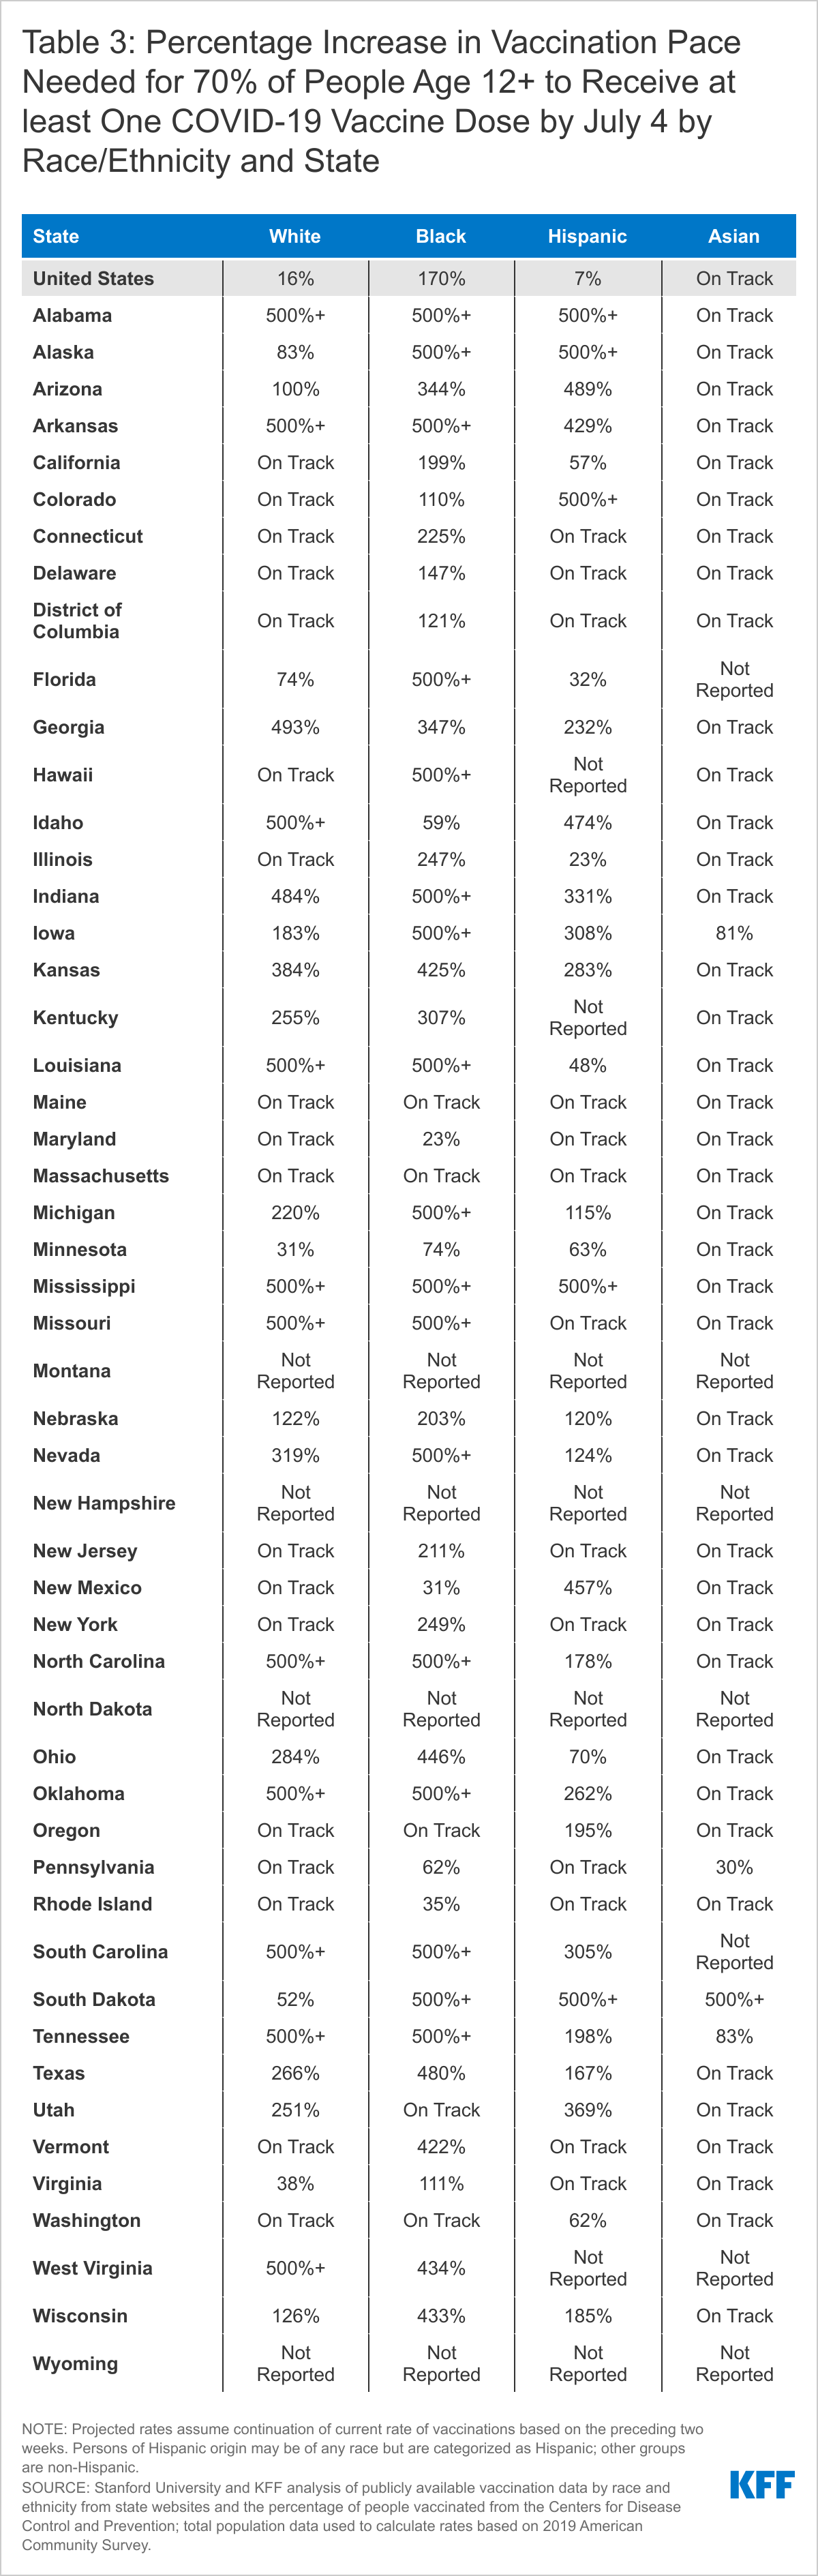
To reach a 70% vaccination rate by July 4, the pace of vaccination would need to increase substantially in many states, particularly for Black people. Nationally, the daily pace of new vaccinations would need to be 7% faster than the current pace to achieve 70% vaccination coverage among Hispanic people ages 12 and older by July 4, while the pace for Black people would need to be over two and a half times faster than the current pace. The increases in vaccination rates needed to reach this coverage level also vary across states. The pace would need to at least double in 24 of 44 states reporting data for Hispanic people, 24 of 47 states reporting data for White people, and 36 of 47 states reporting data for Black people (Table 3).
If the pace of new vaccinations continues to slow even further, disparities between groups in achieving progress toward coverage goals would persist. For example, a slowdown of 25% would mean that, overall, the share of those ages 12 and older estimated to have received at least one COVID-19 vaccine dose would drop from 65% to 64%. Asian people would still reach a 70% coverage rate, coverage among White people would remain below this threshold, with 65% receiving at least one dose, and there would be larger gaps for Hispanic and Black people, with 61% and 50% receiving at least one dose by July 4, respectively. These patterns play out at the state level as well.
Implications
It remains to be seen whether President Biden’s goal of at least 70% of adults receiving at least one COVID-19 vaccine dose by July 4 will be achieved, particularly given the slowdown in vaccinations. Regardless of when this goal is achieved, it is important to recognize that this national benchmark may mask underlying disparities. This illustrative analysis, which examines potential disparities toward achieving a 70% coverage rate among people ages 12 and older, shows that Black and Hispanic people will likely be left behind even if and when national goals are achieved, with substantial variation across the country. As such, even if the nation, overall, reaches a broad level of protection through vaccination, certain groups and communities will remain at increased risk for COVID-19. These disparities in vaccination may lead to further widening of the disproportionate impacts of COVID-19 on people of color and health disparities more broadly. These findings underscore the importance of continuing to prioritize vaccine equity and focused efforts to deliver vaccinations to underserved people and areas, as well as the importance of maintaining these efforts even after broader national goals are achieved.
Marissa Reitsma, Jeremy Goldhaber-Fiebert, Neesha Joseph, and Joshua Salomon are with Stanford University. Samantha Artiga, Jennifer Kates, Larry Levitt, and Anna Rouw are with KFF.
Methodology
Stanford University and KFF (Kaiser Family Foundation) researchers used current state-reported vaccination data by race/ethnicity to project vaccine coverage, by state and nationally, among people ages 12 and older for four racial/ethnic groups (White, Black, Hispanic, and Asian). Specifically, we used data on distribution of vaccines administered by race/ethnicity extracted from state reporting dashboards by KFF, total numbers of people who have received at least one dose from the Centers for Disease Control and Prevention, and total population data from the 2019 American Community Survey to estimate the share of people ages 12 years and older receiving one or more COVID-19 vaccination doses, by state and race/ethnicity, through June 7. We then estimated coverage rates through September 1 based on the average daily vaccination rate implied by the change in coverage between May 24 and June 7 for each racial/ethnic group, by state.
Data on vaccination coverage by race/ethnicity vary by state in terms of reporting groups and completeness. We applied the following data processing steps to produce comparable estimates. We assumed vaccinations reported as “unknown” race/ethnicity were distributed proportional to shares of vaccinations with known race/ethnicity in each state. Examining vaccinations reported as “other” race/ethnicity, we found that in most states, the shares attributed to “other” greatly exceeded population shares (implying coverage >100%). We therefore adjusted shares by assuming “other” were vaccinated proportional to eligible population, and proportionally redistributed remaining vaccinations among specified racial/ethnic groups. We adjusted shares to avoid double-counting in states that report shares by race separate from shares by ethnicity. For racial/ethnic groups not reported by specific states, we assumed these groups were vaccinated proportional to population size and scaled down shares of vaccines to reported groups accordingly. We capped coverage among any racial/ethnic group at 100% of the eligible population, and in cases where implied coverage exceeded 100%, we proportionally redistributed the excess across other groups.
A handful of states required exceptions to the standard approach. The share of vaccinations by race/ethnicity from Nebraska was unavailable on June 7. As a result, projections for Nebraska were based on race/ethnicity-specific vaccination rates spanning May 10 to May 24. The share of vaccinations by race/ethnicity from Idaho and Tennessee were unavailable from May 24. As a result, projections for these states were based on the three-week period spanning May 17 to June 7. CDC reported coverage in New Hampshire decreased slightly between May 24 and June 7, likely due to reconciling reporting issues. As a result, projections for New Hampshire were also based on the three-week period spanning May 17 to June 7. The share of vaccinations by race/ethnicity for Pennsylvania reported in the state dashboard do not include vaccinations for Philadelphia County. Since Philadelphia County includes a substantial fraction of the Black, Hispanic, and Asian population living in Pennsylvania, we separately extracted and included data from the Philadelphia County dashboard.
Limitations of this analysis include reliance on several assumptions to address incomplete and heterogeneous reporting of vaccination data by race/ethnicity across states. Previous reporting on racial/ethnic disparities in vaccination through the CDC and other sources has not adjusted for these data discrepancies, resulting in reported coverage levels that likely underestimate actual population coverage. Although we have adopted a standard set of definitions and rules for reconciling unknown or discrepant data elements to enable transparent and comparable estimation of coverage over time and place, results must be interpreted as approximations in the context of missing and sometimes noisy data. Future work should continue to update these estimates and further assess uncertainty due to model assumptions.
The KFF COVID-19 Vaccine Monitor is an ongoing research project tracking the public’s attitudes and experiences with COVID-19 vaccinations. Using a combination of surveys and qualitative research, this project tracks the dynamic nature of public opinion as vaccine development and distribution unfold, including vaccine confidence and acceptance, information needs, trusted messengers and messages, as well as the public’s experiences with vaccination.
Who are the Unvaccinated?
As of late May 2021, a majority of U.S. adults have received a COVID-19 vaccine, with 62% of adults reporting having gotten at least one dose according to the KFF COVID-19 Vaccine Monitor. There are still substantial shares of the adult population who have not received a vaccine and many do not plan on getting vaccinated. This analysis, drawing on data from the KFF COVID-19 Vaccine Monitor, provides some insights into the demographics of the currently unvaccinated population as well as their views of vaccines generally and the pandemic more broadly.
Unvaccinated adults are a shrinking population in the U.S. that, as of late May 2021, consists of about one-third of U.S. adults (37%). Adults in this group are those, who despite outreach efforts and being eligible for a vaccine for at least six weeks, have not received a COVID-19 vaccine. The unvaccinated group are younger, more likely to identify as Republicans or be Republican-leaning, and more likely to have lower levels of education and lower incomes than the vaccinated population.
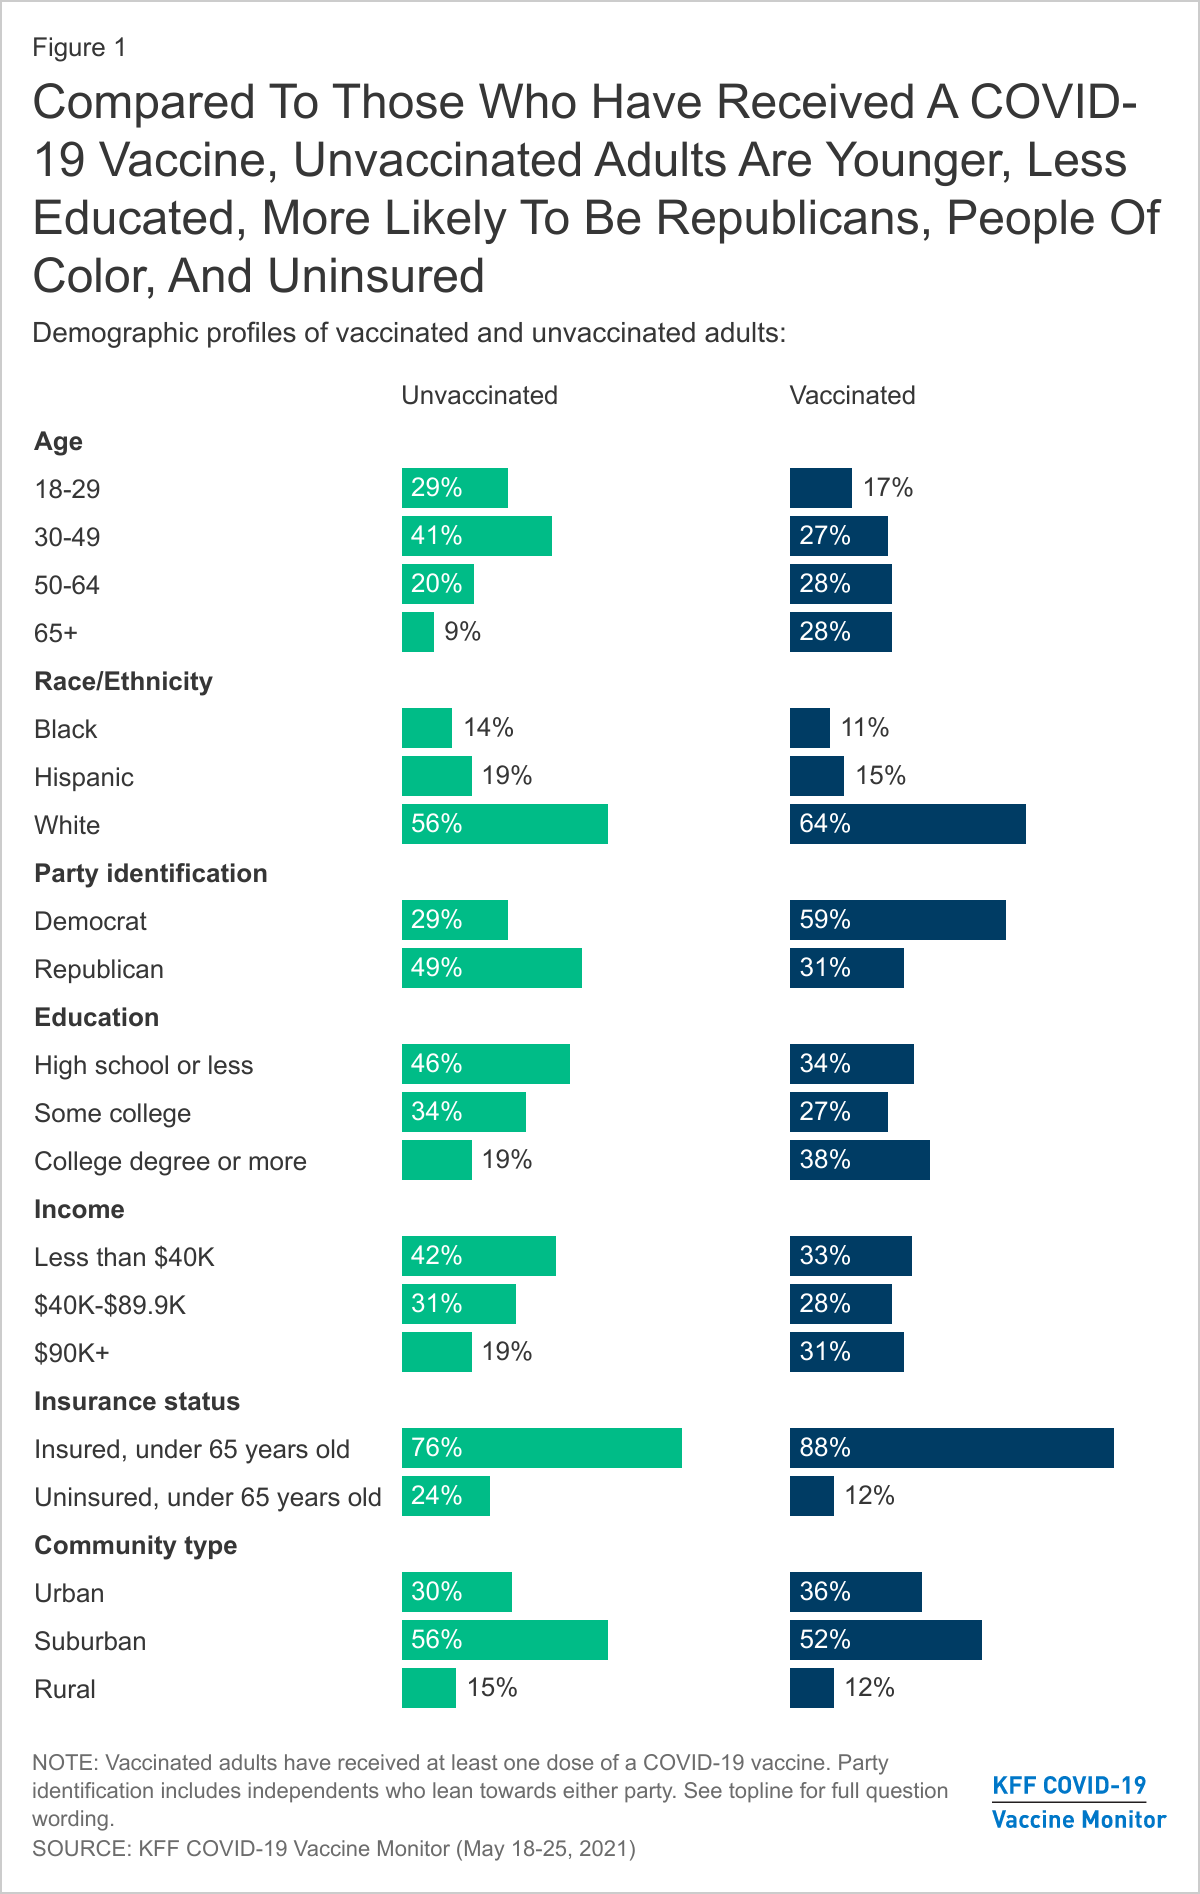
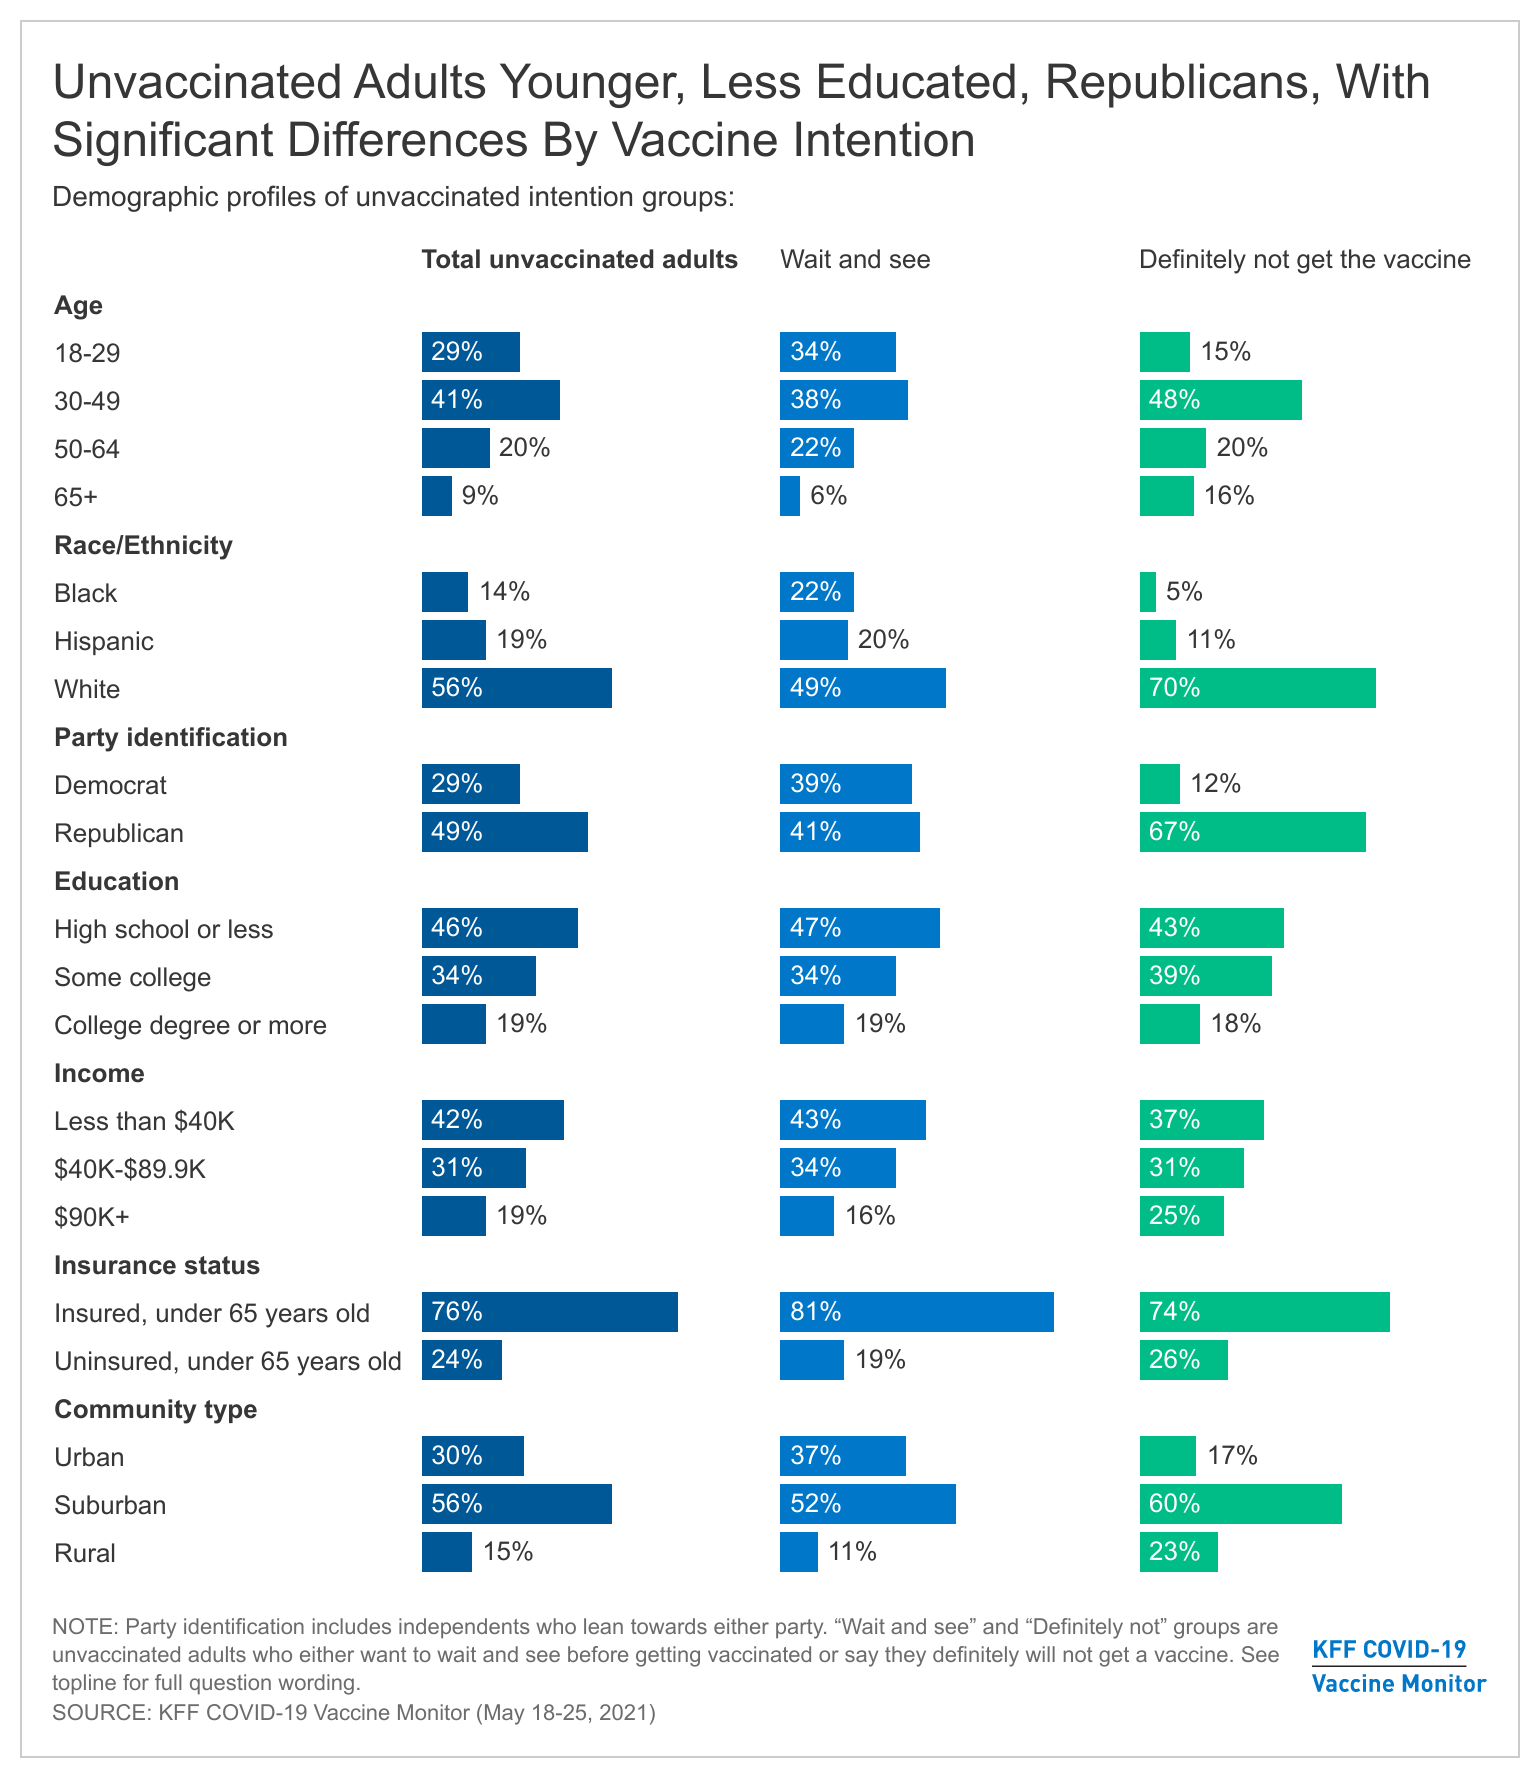
Unvaccinated adults are significantly younger, with 29% of those in the group falling in the 18-29 year old range compared to 17% of those in the vaccinated group. In addition, a smaller share of unvaccinated adults are 65 and older (9%) than the vaccinated group (28%). This may reflect recent changes in access to vaccines with older populations being among the first groups eligible to be vaccinated in states. President Biden announced that 90% of adults would be eligible to get the vaccine by April 19th but there were still significant waiting times for many adults who had just gotten eligible. Over the next few weeks we will better know whether these age differences are due to vaccine access or to actual different vaccine intentions among younger adults.
There are strong partisan differences in vaccine intentions with almost half (49%) of unvaccinated adults identifying as Republicans or Republican-leaning independents, compared to three in ten (31%) vaccinated adults. On the other hand, Democrats and Democratic-leaning independents make up a majority of the vaccinated population (about six in ten), while about three in ten in the unvaccinated population identify as Democrats or Democratic-leaning independents.
Compared to vaccinated adults, smaller shares of White adults are unvaccinated, with no significant differences for Black and Hispanic adults on whether they have received at least one-dose so far, despite Black and Hispanic adults lagging in vaccination rates compared to Whites. Around two-thirds (64%) of vaccinated adults are White, compared to 56% of unvaccinated adults. With difficulty accessing vaccine locations and services disproportionately impacting the non-White population, current outreach continues to strive to bridge the gap.
Americans with lower levels of education make up a larger share of the unvaccinated population than the vaccinated one, with 46% of unvaccinated adults holding a high school degree or less compared to 34% of vaccinated adults. Vaccinated Americans are twice as likely as unvaccinated to have a college degree or higher (38% vs. 19%).
The unvaccinated group also tends to include disproportionate shares of adults without health insurance coverage as well as those with lower levels of income. Those under the age of 65 without insurance make up about one quarter of the unvaccinated population, and 42% of all unvaccinated adults report earning less than $40K a year.
The “Definitely not” group compared to the “Wait and see” group
KFF has been tracking vaccine intentions over the past six months and while there are clear demographic differences between vaccinated adults and unvaccinated adults, there are also differences within the unvaccinated population depending on whether they are still open to getting a vaccine or not. Specifically, those who say they want to “wait until it has been available for a while to see how it is working for other people” before getting vaccinated, the wait and see group (12% of all adults) look distinctly different from the most vaccine resistant group, those who say they will “definitely not” get a COVID-19 vaccine (the definitely not group represents about 13% of U.S. adults). While the share of the U.S. adult population who self-identified as “wait and see” has decreased over the past several months as tens of millions of U.S. adults have received a vaccine and few people have experienced serious side effects from the vaccine, the share of the public who are in the “definitely not” group has not shifted dramatically over the past six months.
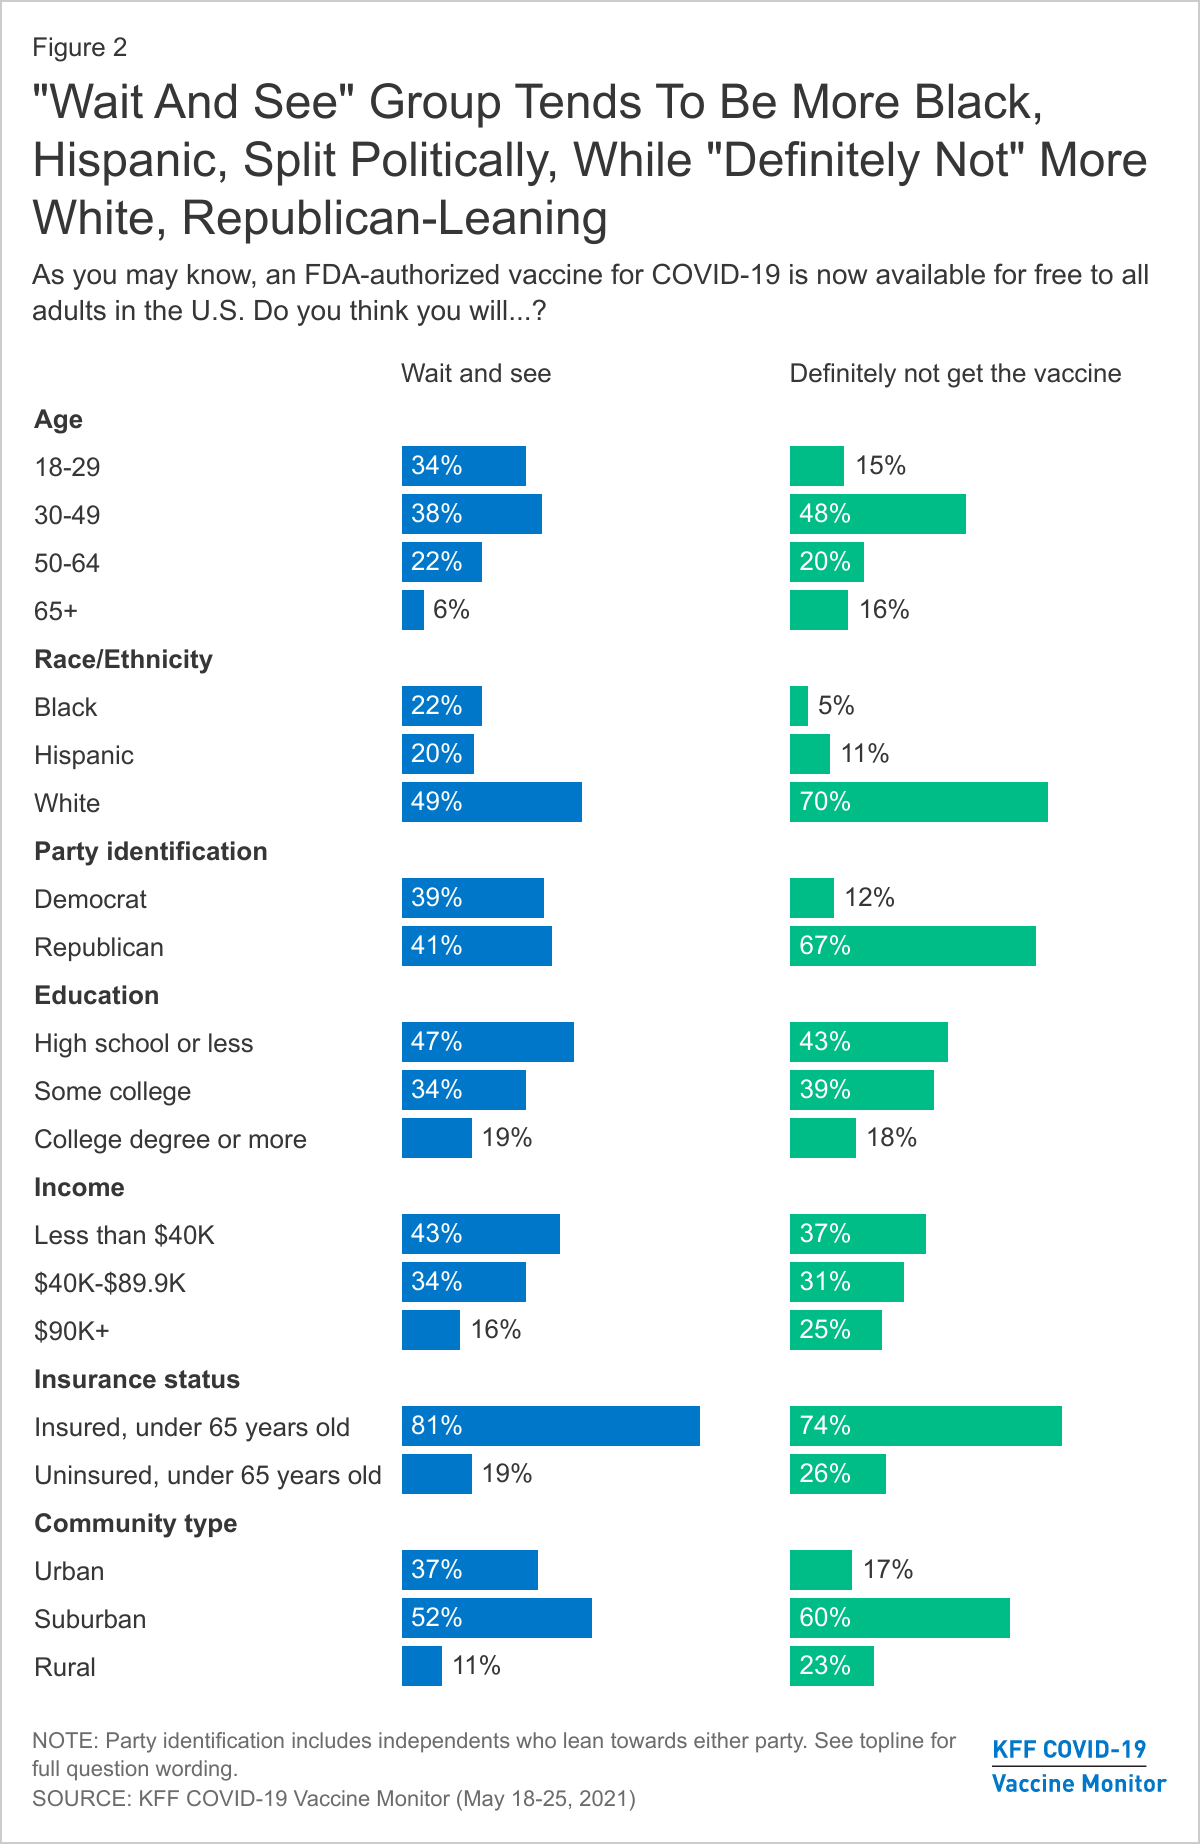
The key demographic differences between the “wait and see” and the “definitely not” groups center on racial and ethnic identity and political partisanship. Half of those in the “wait and see” group are people of color. Throughout the rollout of the vaccines, larger shares of Black and Hispanic adults have reported they would want to “wait until it has been available for a while to see how it is working for other people” before getting vaccinated. This still holds true in the latest KFF COVID-19 Vaccine Monitor with Black adults and Hispanic adults both representing about one-fifth of the “wait and see” group. On the other hand, the most vaccine resistant group, those who say they will “definitely not” get a COVID-19 vaccine is overwhelmingly made up of White adults (70% of the group compared to 49% of the “wait and see” group).
The “wait and see” group is also split politically, with about four in ten who identify as Republicans or Republican-leaning independents and another four in ten as Democrats or Democratic-leaning, while the more vaccine resistant “definitely not” group is overwhelmingly Republican-leaning, with two-thirds (67%) in the group identifying as either Republican or Republican-leaning independents.
There is a smaller share of rural residents in the “wait and see” group (11%) than in the “definitely not” group (23%) but the “definitely not” group is also characterized by other demographics that disproportionately live in rural areas, including more White adults and Republicans.
There are no significant differences when you look at age, education, and insurance status among those who are unvaccinated with about seven in ten in both unvaccinated groups under the age of 50, about one in five have college degrees, and similar shares reporting being uninsured.
Vaccine Intentions Among Unvaccinated Adults Strongly Connected To Views Of Pandemic, Past Flu Vaccine Behavior
People’s intentions to get a COVID-19 vaccine are also largely connected with their previous experience with vaccines and their overall views of the pandemic.
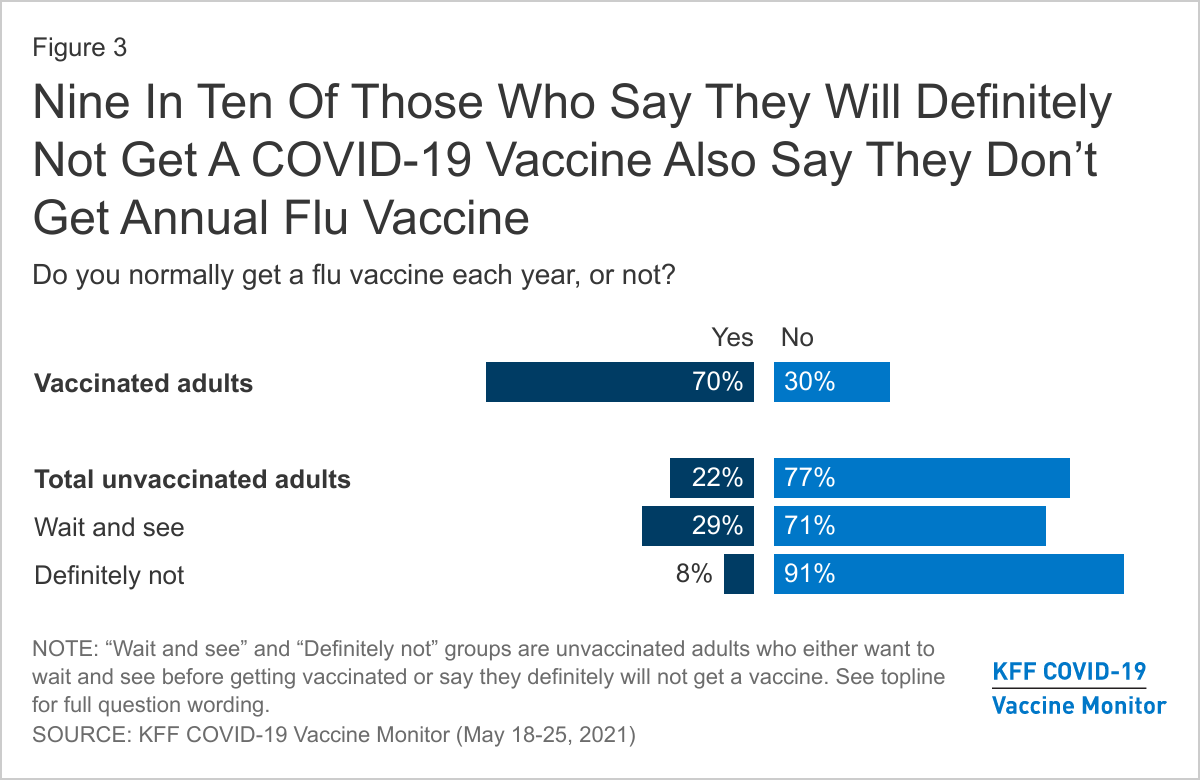
Unvaccinated adults are less likely to reporting getting of the flu vaccine, with over three-quarters (77%) saying they do not normally get a flu vaccine each year. The vast majority of unvaccinated adults who say they will “definitely not” get the COVID-19 vaccine say they don’t regularly get their flu vaccine (91%), compared to about seven in ten (71%) of those in the “wait and see” group.
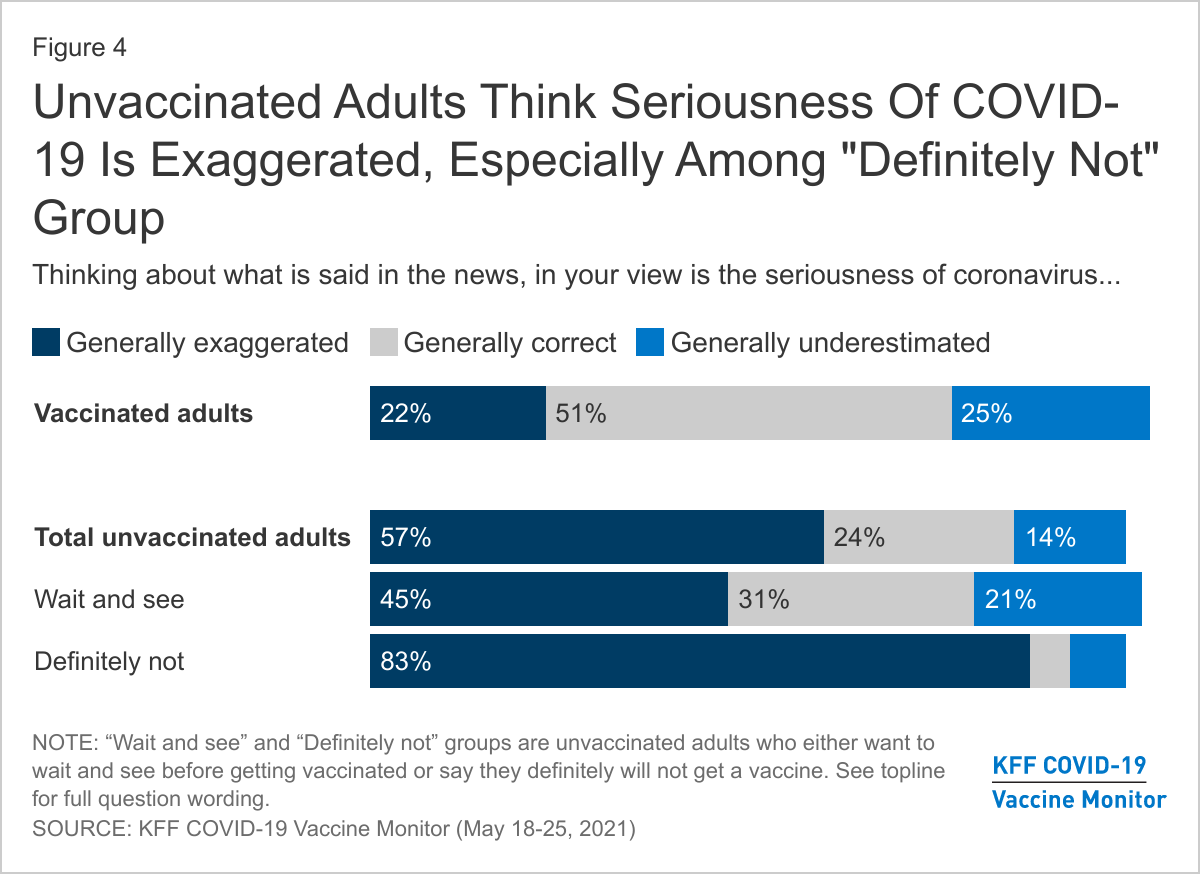
About six in ten unvaccinated adults (57%) think that what is said about COVID-19 in the news is generally exaggerated, significantly larger than the share of vaccinated adults who say the same (22%). Again, differences exist between the “wait and see” and the “definitely not” with close to twice as many of the latter group saying the news has exaggerated Covid-19. About three-fourths of vaccinated adults either say the news have either been “generally correct” or “generally underestimated” the severity of the pandemic.
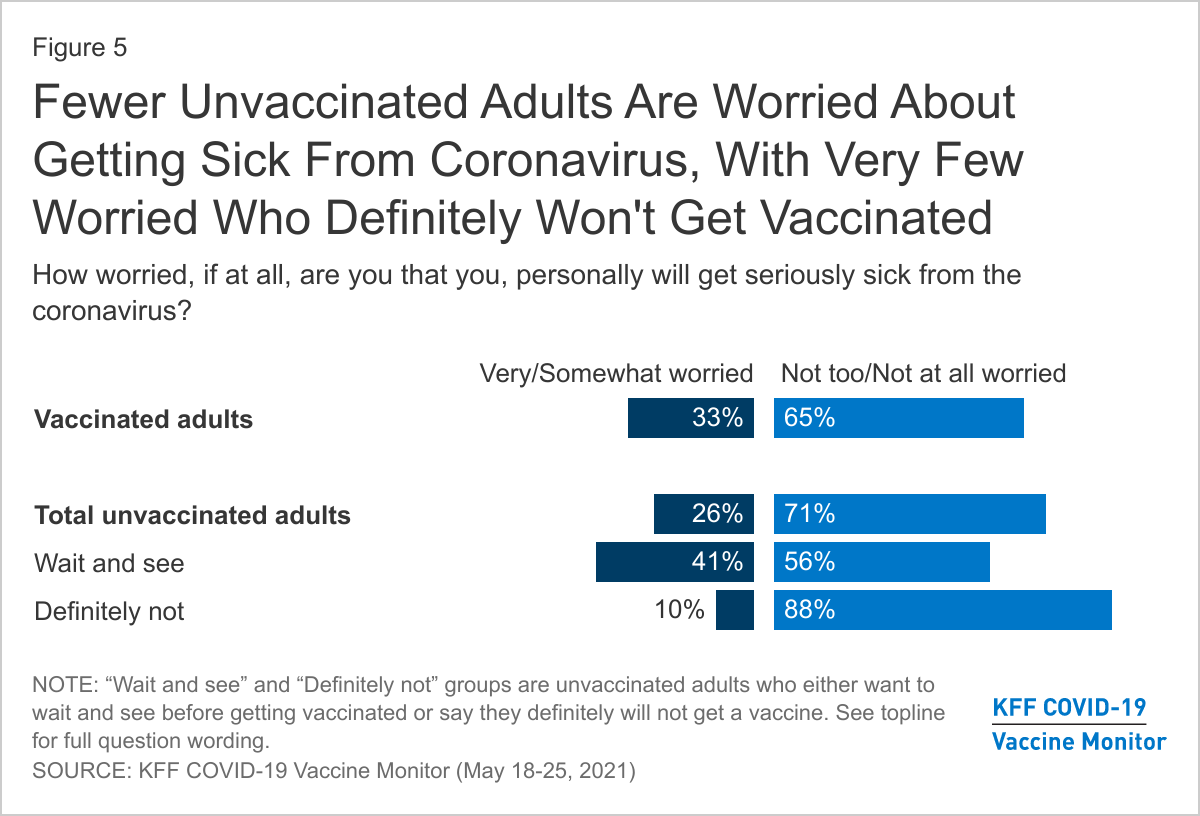
In addition to thinking the news has overstated the problem, most unvaccinated adults say they are not worried about getting sick from coronavirus. About seven in ten unvaccinated adults overall, including nearly nine in ten (88%) of those in the “definitely not” group say they are either “not too worried” or “not at all worried” about personally getting sick from COVID-19. Those in the “wait and see” group are more likely to say they are worried, but still a majority of them (56%) say they are not worried.
Despite being less likely to be worried about getting sick, one-third of unvaccinated adults say they know someone close who has died due to COVID-19, according to the April COVID-19 Vaccine Monitor – including 29% of those who say they definitely won’t get the vaccine.
Unvaccinated Adults Have Different Concerns and Some In The “Wait and See” Group Say Certain Incentives Could Persuade Them
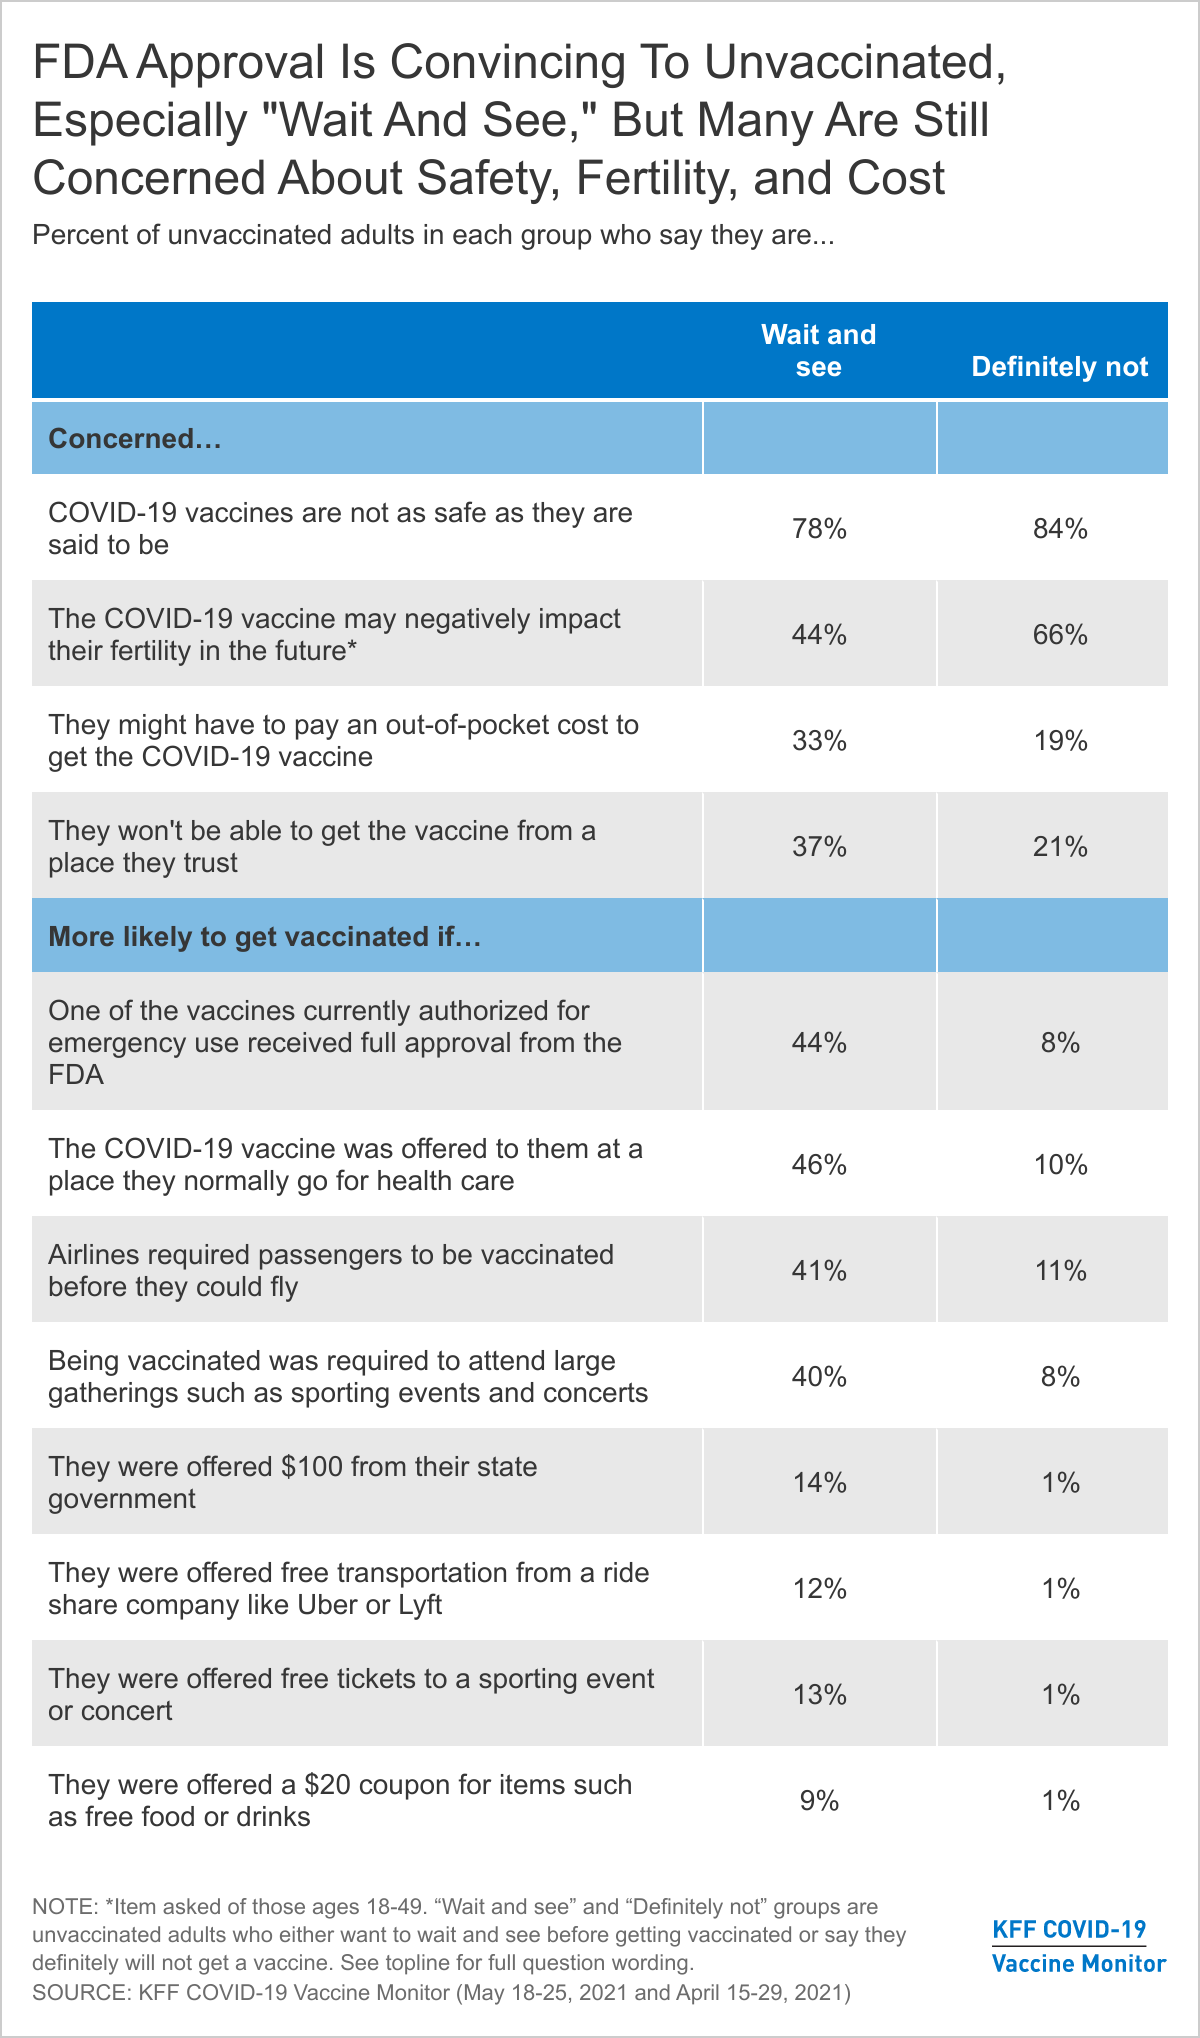
The KFF COVID-19 Vaccine Monitor has consistently found that many unvaccinated adults report being concerned about the safety of the vaccines. This is true among both the “wait and see” group and the “definitely not” group with large majorities of both saying they are concerned the vaccines are not as safe as they are said to be. The two groups differ on other concerns. For example, they differ in terms of concerns about the vaccine’s impact on fertility (two-thirds of the “definitely not” group say they are at least somewhat concerned about this compared to 44% of the “wait and see” group) and on concerns about having to pay for a vaccine (one-third of the “wait and see” group is concerned about this compared to 19% of the “definitely not” group). Nearly four in ten (37%) in the “wait and see” group also express concern about being able to get the vaccine from a place they trust, perhaps another indicator of health care access issues within this group.
Many states, public health departments, and employers are working on incentives aimed at increasing vaccine uptake among the currently unvaccinated populations. KFF has been tracking the reported effectiveness of various potential incentives for the past few months and finds substantial shares of those in the “wait and see” group say they would be more likely to get the vaccine if it was offered to them at a place they normally go for care (46%), they were required to get vaccinated in order to fly on an airplane (41%) or attend large gatherings (40%). In addition, nearly half of the “wait and see” group (44%) say they would be “more likely” to get a vaccine if one of the vaccines currently authorized for emergency use received full approval from the FDA. Yet, few of those in the “definitely not” group say any of these incentives, conveniences, or requirements would make them more likely to get vaccinated. This is also consistent with previous reports that finds these two groups differ in terms of reported access, information needs, and influence of both “carrot” and “stick” methods of incentives to get vaccinated.
It is clear there are distinct groups within the unvaccinated population and their views are not monolithic. While some within the “wait and see” population may be persuaded to get a vaccine in the coming weeks, few in the “definitely not” group show any indication of changing their minds as their views towards the COVID-19 vaccine are consistent with past vaccine behaviors as well as overall views of the threat of COVID-19.
As more people across the country get at least an initial dose of a COVID-19 vaccine, public health officials are increasingly trying to reach the shrinking pool of unvaccinated adults – now roughly a third of all adults.
The latest KFF COVID-19 Vaccine Monitor report explores this group’s demographic profile and finds that, compared to vaccinated adults, unvaccinated adults are younger and more likely to identify as Republican or Republican-leaning. They also have lower levels of education and income and are more likely to be uninsured.
Most (56%) are White adults, though large shares are Black (14%) and Hispanic (19%) adults, who are somewhat less likely to have received an initial dose than White adults are.
Among unvaccinated adults, there are significant differences between those who say they want to “wait and see” before getting a vaccine (12% of all adults) and those who say they will “definitely not” get one (13% of all adults).
While most in both groups live in suburban areas, the “wait and see” group includes a larger share of urban residents (37% v. 17%), while the “definitely not” group includes a larger share of rural residents (23% v. 11%).
The “wait and see” group is roughly evenly divided between White adults (49%) and people of color (51%), including many Black (22%) and Hispanic (20%) adults. They are also about as likely to say they are Democrats or Democrat-leaning (39%) as Republican or Republican-leaning (41%).
In contrast, those who say they will “definitely not” get a vaccine are largely White adults (70%) and Republican or Republican-leaning (67%).
The vast majority of the “definitely not” group (83%) and nearly half of the “wait and see” group (45%) also say that the seriousness of the COVID-19 pandemic has been “generally exaggerated” in the news. Among those who have been vaccinated, just 22% say so.
President Biden’s FY 2022 budget proposes lowering the Medicare enrollment age from 65 to 60, and a group of over 150 House Democrats recently called for a provision lowering the Medicare age to 60 or 55 to be included in the President’s American Families Plan. President Biden’s budget proposes “giving people age 60 and older the option to enroll in the Medicare program with the same premiums and benefits as current beneficiaries, but with financing separate from the Medicare Trust Fund.” The President’s budget proposal does not detail how lowering the Medicare age would work or be financed, or how it would affect current Medicaid spending and enrollees. While lowering the Medicare eligibility age based solely on work history to 60 could provide coverage to older adults who are currently uninsured or provide a more affordable option for people with private health insurance coverage, it also could affect Medicaid enrollees in this age range. Some Medicaid enrollees might lose Medicaid coverage when they gain Medicare, and others might become dually eligible for both programs, depending on the details of how it would work.
There are 3 million adults ages 60-64 enrolled in Medicaid as of 2019, just under 1 million of whom are already dually eligible for both Medicare and Medicaid (because they receive Social Security Disability Insurance (SSDI)). Medicare covers over 60 million seniors and nonelderly adults with significant long-term disabilities. Under current law, people with a sufficient work history are entitled to enroll in Medicare at age 65, and enrollment for non-elderly adults is limited to people who receive SSDI, generally after a 24 month waiting period. This issue brief highlights key differences between Medicare and Medicaid and raises questions about how a policy to lower the age of Medicare eligibility could affect individuals who are currently enrolled in Medicaid.
How could lowering the Medicare age affect people eligible for full Medicaid benefits?
What is current policy? Today, some people are eligible for both Medicare and full Medicaid benefits, while others may lose Medicaid eligibility once they become eligible for Medicare. A person’s status as a Medicare beneficiary does not qualify them for full Medicaid benefits. Instead, a person must independently qualify for Medicaid through an eligibility pathway based on low income or disability. Individuals in the 60-64 age range may qualify for Medicaid through various pathways that may have different eligibility criteria and benefit packages. For example:
Poverty-related Medicaid pathways, such as the ACA expansion (which 38 states plus DC have opted for), consider a person’s income but do not have an asset test. Notably, receiving Medicare and/or turning 65 makes someone ineligible for Medicaid as an ACA expansion adult.
Disability-related Medicaid pathways have relatively higher income limits compared to the poverty-related pathways described above and may have an asset limit, though some states have expanded or eliminated asset limits. State Medicaid programs must cover SSI enrollees, while other disability-related pathways are optional. States can choose to cover seniors and people with disabilities up the federal poverty level, people with high medical expenses considered medically needy, working people with disabilities, and those with incomes up to 300% of the federal SSI benefit amount ($2,382 per month for an individual in 2021) who need long-term home and community-based services, though eligibility pathways vary substantially by state. Unlike the ACA expansion pathway, individuals who qualify under these pathways may be dually eligible for Medicare. For those dually eligible for Medicare and Medicaid, Medicare is the primary payer, and Medicaid provides wrap-around benefits, filling in gaps in Medicare coverage, and also helps with Medicare’s out-of-pocket costs (discussed below).
What are the key policy choices and implications? Lowering the age for Medicare would require policy choices about whether to allow individuals in the new age range to continue to receive full Medicaid benefits, if eligible under the ACA expansion or other poverty- or disability-related pathways, or whether these individuals would move from Medicaid to Medicare as their sole or primary source of coverage. How these eligibility issues are resolved has important implications for enrollee benefits and cost-sharing as well as state and federal costs (discussed below). Additionally, Medicare enrollment is limited to specific periods, while Medicaid enrollment is open year-round. However, Medicaid eligibility must be periodically renewed, while Medicare eligibility currently continues without the need to renew eligibility once a person turns 65.
How could lowering the Medicare age affect benefits for current Medicaid enrollees?
What is current policy? Medicare and Medicaid’s benefit packages differ. Both cover inpatient and outpatient care and prescription drugs. Medicare generally includes wider participation of providers, though Medicaid drug coverage is broader. Medicaid also covers long-term care services in nursing homes and the community and specialty behavioral health services, which Medicare generally does not. Medicaid covers dental, vision, and hearing benefits for adults at state option. Traditional Medicare currently does not generally cover these benefits, although most Medicare Advantage plans do offer some dental, vision and hearing benefits. President Biden’s budget calls for adding these benefits to Medicare. Medicaid rules also require states to recover the cost of long-term care benefits provided to people age 55 and older from the estates of deceased enrollees, and other costs may be subject to estate recovery at state option. Medicare does not require estate recovery, though it also does not cover long-term care services. The appeals process also differs between the two programs, with Medicaid allowing services to continue while an appeal is pending.
What are the key policy choices and implications? Policy choices about whether individuals in the new age range could retain Medicaid if eligible or instead would move from Medicaid to Medicare are important because individuals currently eligible for Medicaid could lose access to benefits not covered by Medicare if they are required to move to Medicare as their sole source of coverage. Additionally, those appealing benefit reductions or terminations would not have continued access to services while appeals are resolved in Medicare as is the case in Medicaid.
How could lowering the Medicare age affect provider networks for current Medicaid enrollees?
What is current policy? People may have access to different provider networks in Medicare vs. Medicaid, due to different managed care and network adequacy rules. Once eligible for coverage, Medicare allows enrollees to choose whether to receive benefits under the traditional Medicare program, or enroll in a Medicare Advantage managed care plan. Traditional Medicare offers access to a broad provider network, while Medicare Advantage plans have restricted provider networks. States may require Medicaid enrollees to enroll in managed care, which can further restrict provider networks beyond those that participate in the state’s fee-for-service Medicaid program.
What are the key policy choices and implications? People could gain access to a broader provider network through traditional Medicare compared to their state’s Medicaid program. If moving from Medicaid to Medicare, individuals could experience changes in delivery systems and provider networks, depending on whether they opt for Medicare Advantage or traditional Medicare, which could mean disruptions in care.
How could lowering the Medicare age affect out-of-pocket costs for current Medicaid enrollees?
What is current policy? The Medicare Savings Program (MSP) is a Medicaid pathway that helps to cover Medicare’s premiums and/or cost-sharing requirements for current Medicare enrollees with low income and limited assets. This is an important consideration because Medicare’s premiums and cost-sharing are higher than those under Medicaid, which limits the populations who can be subject to premiums and has nominal cost-sharing. Box 1 summarizes current Medicare out-of-pocket costs and the assistance available through MSP.
Box 1: Medicare Out-of-Pocket Costs and the Medicare Savings Program
Medicare Part A, which covers inpatient hospital services, has an annual deductible of $1,484 in 2021. Medicare Part A also requires co-insurance for hospital stays over 60 days. Most Medicare beneficiaries qualify for Part A without a premium, based on their work history. Medicare Part B, which covers outpatient services, requires a monthly premium of $148.50 for most beneficiaries in 2021. Part B also requires an annual deductible of $203 in 2021 and co-insurance of 20% of the Medicare-approved cost of services after the deductible is met.
To help low-income enrollees afford Medicare’s out-of-pocket costs, state Medicaid programs must offer three MSP pathways:
Specified Low-Income Medicare Beneficiaries (SLMBs) have slightly higher incomes (100-120% FPL) and receive help with Medicare Part B premiums only. Most states set their SLMB income limits at 120% FPL ($1,288 per month for an individual and $1,742 for a couple in 2021). The asset limits described above also apply to the SLMB group.
Qualified Individuals (QIs) are eligible for Medicaid assistance with Medicare Part B premiums through an expansion of the SLMB program. The QI program covers Medicare beneficiaries with incomes up to 135% FPL ($1,449 per month for an individual and $1,960 for a couple in 2021). The asset limits described above also apply to the QI group. Unlike other Medicaid pathways, because Congress only appropriates a limited amount of funds to each state to pay for the QI program, once a state’s QI appropriation is spent, additional individuals who meet the eligibility criteria cannot receive help.
What are the key policy choices and implications? Proposals to lower the Medicare age likely will have to account for what type of assistance would be available to make the new coverage affordable for lower income enrollees, such as individuals who may lose Medicaid and transfer to Medicare. Without addressing this issue, some people could face higher out-of-pocket costs in Medicare compared to Medicaid. For example, people ages 60-64 who currently receive Medicaid in the ACA expansion group are eligible for that coverage based on their low incomes and without an asset test. When these individuals become eligible for Medicare under current law, they must meet both income and asset limits (Box 1) to qualify for MSP help with Medicare out-of-pocket costs. Though a few states have expanded or eliminated MSP asset limits, this generally means that individuals with savings above $7,970 would be ineligible for MSP, even though they might have been eligible for full Medicaid benefits in expansion states.
How might lowering the Medicare age affect state and federal costs and provider payments?
What is current policy? Medicare is a federal program primarily financed by a combination of payroll taxes, general revenue, and premiums. In traditional Medicare, the federal government establishes the methodology for making payments to hospitals, physicians and other health care providers under the traditional Medicare program and uses a formula to establish capitated payments to Medicare Advantage plans. In contrast, Medicaid is financed jointly by states and the federal government, and states determine provider payment rates within broad federal standards.
What are the key policy choices and implications? The precise impact of lowering the Medicare age on federal and state costs depends on how the policy is structured. Transitioning current Medicaid enrollees to Medicare would be likely to increase federal spending and reduce state costs as states would no longer share in the costs of covering these individuals. If individuals 60-64 are permitted to retain their current Medicaid eligibility, states would continue to fund a share of these individuals’ Medicaid costs, though Medicare would be the primary payer for the benefits it covers. If enrollees move to Medicare and do not retain full Medicaid eligibility, the federal government would no longer pay for a share of benefits that are only available through Medicaid (like long-term care).
Lowering the Medicare enrollment age could have considerable impacts on the scope of covered benefits, out-of-pocket costs, and provider access for low-income people as well as implications for state and federal health care costs. Depending on individual circumstances and key policy decisions, people who move from Medicaid to Medicare might experience higher out-of-pocket costs and/or fewer covered benefits. On the other hand, they might have access to a broader provider network in traditional Medicare, compared to their state’s Medicaid program. On the whole, current Medicaid enrollees are likely to face different issues than those who move from private insurance or uninsured status to Medicare.
The question of what would happen when a new, expensive prescription drug comes to market for a disease like Alzheimer’s that afflicts millions of people has loomed large in discussions over drug prices in the U.S.—and now we’re about to find out. After a nearly 20-year dry spell in new treatments for Alzheimer’s disease, the Food and Drug Administration (FDA) just approved a new Alzheimer’s medication, Aduhelm (aducanumab), developed by Biogen, with an expected annual price tag of $56,000. While the scientific community debates the evidence of the effectiveness of this new drug, the FDA’s decision raises hope for Alzheimer’s patients and their families, along with serious cost concerns for patients and payers, particularly Medicare.
Alzheimer’s disease is estimated to affect about 6 million Americans, the vast majority of whom are age 65 and older and therefore eligible for Medicare. As an intravenous infused medication administered by physicians, Aduhelm will be covered under Medicare Part B, which generally covers FDA-approved physician-administered medications that are reasonable and necessary for the individual patient. (In contrast, Medicare Part D covers retail prescription drugs.) With FDA approval in hand, attention now turns to decision-makers at the Centers for Medicare & Medicaid Services (CMS) who may opt to undertake a National Coverage Determination process that could set some limits on the conditions of Medicare coverage for Aduhelm based on the drug’s clinical effectiveness.
Medicare’s long-standing practice is to make coverage determinations without taking cost into consideration. While Medicare sets rates for hospitals and other providers, it does not set its own rates for drugs covered under Part B. Instead, Medicare reimburses providers 106% of the Average Sales Price (ASP), which is the average price to all non-federal purchasers in the U.S, inclusive of rebates. For drugs where no ASP is available, such as a new drug like Aduhelm, Medicare pays 103% of the wholesale acquisition cost (WAC) until ASP data are available. The WAC is equivalent to a list price and typically higher than ASP. Biogen has set the list price for Aduhelm at $56,000 for a year of treatment.
It is hard to know exactly how many Medicare beneficiaries will take Aduhelm, but even a conservative estimate would lead to a substantial increase in Medicare spending. In 2017, nearly 2 million Medicare beneficiaries used one or more of the currently-available Alzheimer’s treatments covered under Part D, based on our analysis of Medicare Part D claims data. If just one-quarter of these beneficiaries are prescribed Aduhelm, or 500,000 beneficiaries, and Medicare pays 103% of $56,000 in the near term, total spending for Aduhelm in one year alone would be nearly $29 billion, paid by Medicare and the patients who use this drug – an amount that far exceeds spending on any other drug covered under Medicare Part B or Part D, based on 2019 spending. To put this $29 billion amount in context, total Medicare spending for all Part B drugs was $37 billion in 2019.
Alzheimer’s patients covered under Medicare Part B could also face high out-of-pocket costs for treatment with Aduhelm, both for the drug itself and for the cost of related medical services. For most Part B covered drugs and services, Medicare pays 80% of the cost and beneficiaries are responsible for the remaining 20%. This means beneficiaries would face about $11,500 in coinsurance for one year of Aduhelm treatment, which represents nearly 40% of the $29,650 in median annual income per Medicare beneficiary in 2019. Because Aduhelm is not a cure for Alzheimer’s disease, patients could incur these annual out-of-pocket costs over multiple years.
The majority of beneficiaries in traditional Medicare have supplemental insurance, such as Medigap, employer-sponsored retiree coverage, or Medicaid, that would cover some or all of the coinsurance. However, beneficiaries with Medigap or retiree health could see their premiums rise to account for higher plan liability associated with costs for Aduhelm. And close to 6 million Medicare beneficiaries, or 10% of all beneficiaries, are in traditional Medicare with no supplemental coverage, which means they are fully exposed to Medicare’s cost-sharing requirements and lack the financial protection of an out-of-pocket cap, unlike enrollees in Medicare Advantage plans.
The 24 million beneficiaries enrolled in Medicare Advantage plans are also responsible for cost sharing for Part B drugs, like Abuhelm, though they typically do not have supplemental insurance to help with these expenses. According to our estimates, in 2021, nearly 90% of Medicare Advantage enrollees are in plans that charge 20% coinsurance for Part B drugs provided in-network, the same as under traditional Medicare, though some plans impose coinsurance as high as 45% or 50% for Part B drugs administered by out-of-network providers. Medicare Advantage enrollees who use Aduhelm would be responsible for their share of costs until they reach the annual out-of-pocket maximum ($7,550 for in-network care and $11,300 for combined in-network and out-of-network care in 2021).
The billions of dollars in new Medicare Part B spending will likely lead to higher Part B premiums for all 56 million Part B enrollees in traditional Medicare and Medicare Advantage. Since Part B premiums are set to equal 25% of projected annual Part B expenditures, an increase in spending would lead to an increase in premiums. State and federal Medicaid spending will also rise, since Medicaid pays the Part B premium for about 12 million low-income Medicare beneficiaries with Medicaid, and covers coinsurance for 9 million of these beneficiaries who have both Medicare and full Medicaid coverage.
The introduction of a new high-priced drug could energize efforts in Congress to enact drug price legislation. Under H.R. 3, which passed the House of Representatives in the last Congress and was recently reintroduced, the HHS Secretary would have authority to negotiate prices for up to 250 drugs, drawing from the 125 drugs with the highest net spending in Medicare Part D and the 125 drugs with the highest net spending in the U.S. overall, which could include drugs covered under Part B, such as Aduhelm. Negotiated prices would be made available to enrollees in Part D plans and private insurance coverage, and to providers that administer physician-administered drugs. Other proposals under active consideration would limit annual price increases for Part B and Part D drugs and limit the financial incentives under Medicare’s existing Part B reimbursement system for physicians to administer higher-priced drugs. The Center for Medicare and Medicaid Innovation could also test models to modify Medicare payments for high-priced drugs.
At a time when federal and state policymakers are weighing several policy options to lower prescription drug prices, the approval of Aduhelm provides the latest high-profile example of the potential budgetary consequences of Medicare’s role as a price-taker in the pharmaceutical marketplace. Concerns about the impact on Medicare spending associated with Aduhelm are reminiscent of discussions that took place after the introduction of high-cost treatments for hepatitis C, though in that case, the new drugs cured the disease and were approved for a much smaller patient population. Aduhelm may represent hope for Alzheimer’s patients and their families who have waited years for new treatments to come along, but that hope is likely to come at a high cost to Medicare, beneficiaries, and taxpayers.
This work was supported in part by Arnold Ventures. We value our funders. KFF maintains full editorial control over all of its policy analysis, polling, and journalism activities.
Prescription drug spending in Medicaid and other health programs has returned to the national policy debate. This analysis examines Medicaid outpatient prescription drug utilization and spending before rebates over the 2015 to 2019 period, which is helpful for understanding recent cost drivers and areas for targeted policy action. Key takeaways include:
Utilization, measured in terms of the number of prescriptions, increased by 5% from 2015 to 2019. Utilization increased from 2015 to 2017 and then declined in the years following.
The ten most frequently prescribed drug groups, which included Analgesics/Antipyretics, psychotherapeutic agents, cardiac drugs, antibiotics, and anticonvulsants, were relatively stable throughout the period, with the same groups making up the top five drug groups by utilization every year. These drug groups treat common illnesses and health conditions and reflect the health needs of Medicaid beneficiaries.
Notably, psychotherapeutic agents, including antidepressants, were the second most prescribed drug group throughout the period of study, highlighting the key role Medicaid plays in covering and financing behavioral health care.
Opioid prescriptions used to treat pain declined 41% over the period of study, while prescriptions to treat opioid addiction and overdose increased.
While Medicaid net spending on prescription drugs remained almost unchanged, spending before rebates increased by 23% from 2015 to 2019. Spending before rebates followed a similar pattern to utilization, increasing from 2015 to 2017 and decreasing in 2018; however, as utilization continued to decrease in 2019, spending increased again by 9%. Trends in gross spending and utilization provide important context for pharmacy benefit policy by highlighting underlying cost factors.
The ten most costly drug groups were relatively stable throughout the period, with the exception of molecular targeted therapy drugs, which grew from the 12th most costly drug group in 2015 to the 5th most costly drug group in 2019 before rebates.
Antivirals were the most costly drug group before rebates every year from 2015 to 2019. Spending on antivirals, and especially hepatitis C drugs, is disproportionate to their utilization.
Antidiabetics spending before rebates grew by 53% over the period of study, driven by spending on newer, non-insulin antidiabetic drugs.
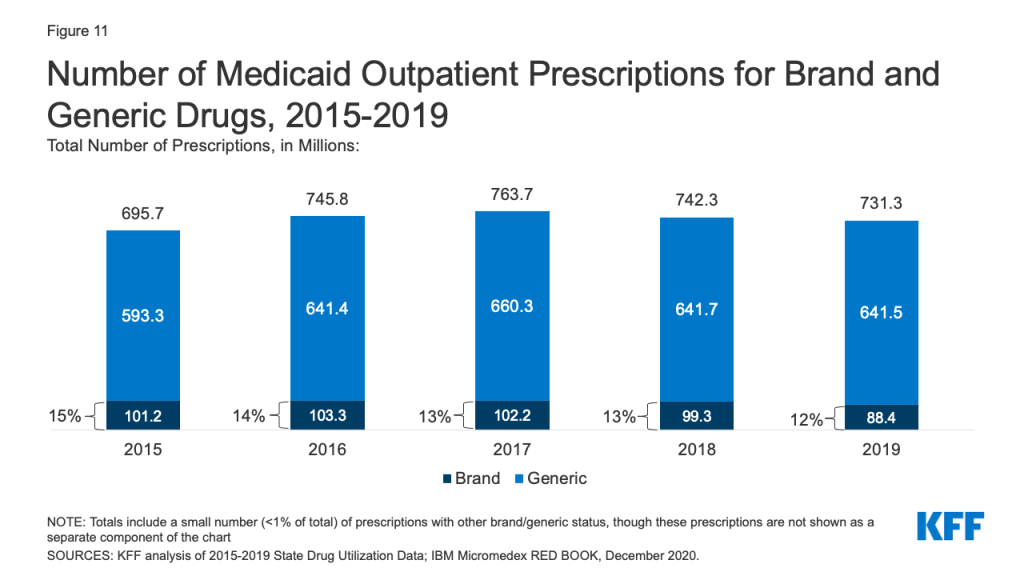
Generic drugs accounted for the vast majority of prescriptions over the 2015 to 2019 period, while brand drugs accounted for the vast majority of spending. Throughout the period, brand drugs accounted for a growing share of spending.
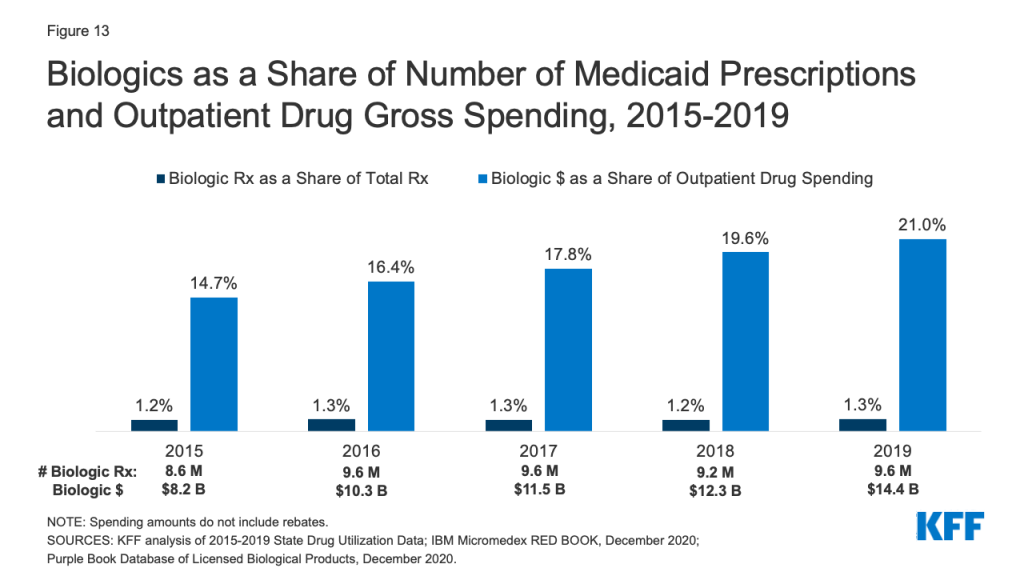
Spending on biological products is disproportionate to their utilization, accounting for little over 1% of prescriptions every year but between 15% and 21% of Medicaid spending before rebates over the period.
States remain concerned about the entry of new high-cost drugs to the market and report that developing strategies and policies to address these drugs is a top priority. There has also been recent policy discussion about federal action to address the cost of new therapies through the FDA accelerated approval pathway as well as gene and cell therapies. Data on utilization and spending can help highlight potential implications of policy proposals.
Introduction
Prescription drugs have returned to the national policy debate, with both Congress and the administration developing proposals to address drug prices. Though attention in current federal actions is largely focused on Medicare and private insurance drug prices, federal legislation also has been recently introduced or enacted that would affect Medicaid prescription drug policy. States also remain concerned about the budgetary impact of new, high cost drugs and Medicaid drug spending, given fiscal pressures. Understanding utilization and spending patterns in Medicaid can help illustrate the potential effects of proposed policy changes or targeted policy actions.
This brief analyzes data on Medicaid drug spending and utilization from 2015 to 2019, the period after the major expansion of Medicaid under the ACA and through most recent complete data available. It examines trends across drug groups, brand or generic status, and biologic status and takes a closer look at some of the drug groups that are experiencing changes in utilization and spending or have been the subject of recent policy debates. As described in more detail in Appendix B, it is based on Medicaid State Drug Utilization Data merged with IBM Micromedex RED BOOK data to analyze trends by drug group and brand or generic status. It also incorporates data from the Food and Drug Administration (FDA) to analyze trends among biological products. Because of data restrictions, spending does not reflect rebates. This analysis updates previous analysis of Medicaid outpatient prescription drug trends.
Background: Structure of the Medicaid Prescription Drug Benefit
The Medicaid prescription drug benefit is an optional benefit that all states provide. The state may provide the benefit in a fee-for-service environment or through managed care. Most states provide the benefit through managed care, although some states have moved to carve out specific classes or the pharmacy benefit altogether. State Medicaid programs reimburse pharmacies for prescription drugs based on the ingredient costs for the drug and a dispensing fee for filling the prescription; they do not buy drugs directly from manufacturers.
Under the Medicaid Drug Rebate Program (MDRP), manufacturers that want their drugs covered by Medicaid must sign an agreement with the Secretary of Health and Human Services stating that they will rebate a specified portion of the Medicaid payment for the drug to the states, who in turn share the rebates with the federal government. In return, Medicaid must cover almost all FDA-approved drugs that those manufacturers produce.1 However, state Medicaid programs can and do implement drug utilization management techniques, such as preferred drug lists and prior authorizations, to manage utilization and spending.
In addition to federal statutory rebates, most states negotiate supplemental rebates. Both statutory and supplemental rebates account for a sizeable share of prescription drug spending, lowering aggregate drug spending by about 55% in 2019. Rebates also increased during the period of this analysis, leaving Medicaid net spending in 2019 almost the same as net spending in 2015. Rebates vary across brand and generic drugs and specialty and non-specialty drugs due to the rebate formulas and rules that require Medicaid to receive the “best price” available to other purchasers (excluding certain government programs).2 A CBO analysis recently found that on average, Medicaid obtained rebates of approximately 77% of the Medicaid retail price for certain brand-name drugs.3 Medicaid rebates also include an inflation-based component to account for rising prices over time, which insulates the program from large price hikes. The specific rebate on a given drug is proprietary for both statutory and supplemental rebates. Because of this, it is not possible to include them in this analysis of trends by drug or drug group. While rebates have implications for net Medicaid spending, understanding trends in gross spending and utilization provides important context for pharmacy benefit policy by highlighting underlying cost factors.
Trends in Prescription Drug Utilization and Spending
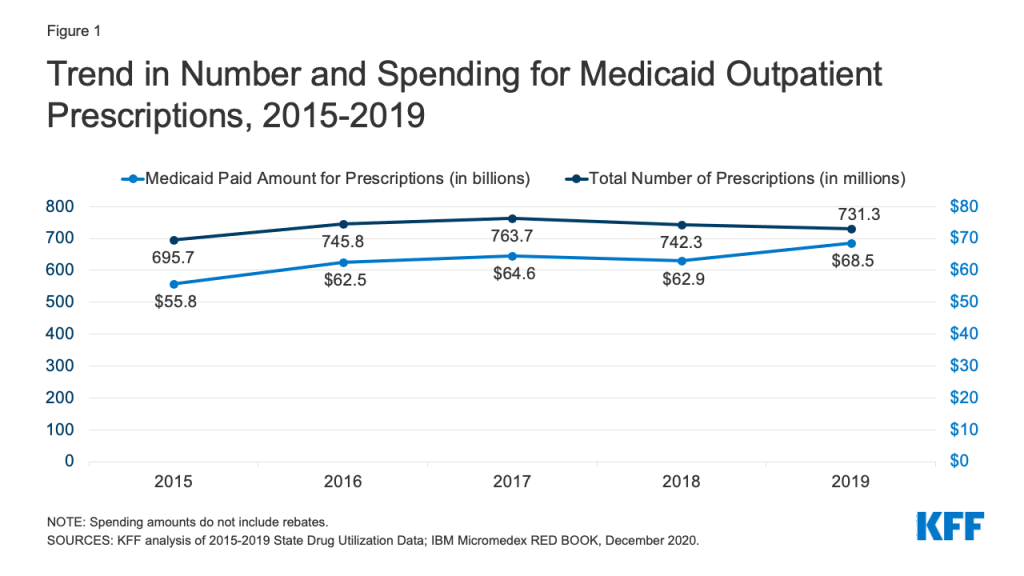
Medicaid drug utilization and spending before rebates followed similar trends from 2015-2018 but diverged in 2019. Medicaid outpatient drug utilization increased from 695.7 million prescriptions in 2015 to 763.7 million in 2017, an average annual growth of 5% (Figure 1). Following a similar pattern, Medicaid spending before rebates also increased from $55.8 billion in 2015 to $64.6 billion in 2017, representing average annual growth of 8%. From 2017 to 2018, utilization and spending both declined by 3%, decreasing from 763.7 million prescriptions and $64.6 billion down to 742.3 million prescriptions and $62.9 billion, respectively. This decline likely reflects declines in Medicaid enrollment, which declined by 1.6 million in 2018. From 2018 to 2019, utilization decreased by 1%, down to 731.3 million prescriptions, while spending diverged and grew by 9%, up to $68.5 billion. The increase in spending before rebates in 2019 may reflect the launch of expensive new brand drugs and increasing list prices.
Figure 1: Trend in Number and Spending for Medicaid Outpatient Prescriptions, 2015-2019
Trends by Drug Group
The top ten most frequent drug groups by number of prescriptions accounted for over half of all prescriptions each year from 2015 through 2019 and were relatively stable during the period. The exception is antihyperlipidemic drugs, which replaced anxiolytics (a type of psychotherapeutic) as the 10th most prescribed drug group starting in 2017 (Table 1 and Appendix Table A1). Further, the same groups made up the top five drug groups by utilization every year. Throughout all years, analgesics/antipyretics accounted for the largest number of prescriptions, and psychotherapeutic agents accounted for the second largest number of prescriptions. In 2019, both groups together accounted for 20% of all Medicaid prescriptions (Figure 2). Within the drug group psychotherapeutic agents, antidepressants made up more than 70% of all psychotherapeutic prescriptions each year.
Figure 2: Number of Medicaid Outpatient Prescriptions by Drug Group, 2019
Table 1: Rankings of Top Drug Groups by Number of Medicaid Prescriptions
Drug Group
Typical Use
Ranking by Year
2015
2016
2017
2018
2019
Analgesics/Antipyretics
Reduce pain, fever, inflammation
1
1
1
1
1
Psychotherapeutic Agents
Treat psychosis and depression
2
2
2
2
2
Cardiac Drugs
Treat medical conditions associated with the heart or circulatory system
4
3
3
3
3
Antibiotics
Treat bacterial infections
3
4
4
4
4
Anticonvulsants
Treat epileptic seizures
5
5
5
5
5
Antidiabetic Agents
Treat diabetes
8
7
6
6
6
Allergy Immunotherapy & Antihistamines
Allergy treatment
6
6
7
7
7
Sympathomimetic Agents
Stimulate adrenergic receptors
7
8
8
8
8
Adrenals & Combinations
Reduce inflammation
9
9
9
9
9
Antihyperlipidemic Drugs
Reduce lipid levels
12
12
10
10
10
SOURCES: KFF analysis of 2015-2019 State Drug Utilization Data; IBM Micromedex RED BOOK, December 2020.
Similarly, the ten most costly drug groups accounted for almost two thirds of Medicaid spending before rebates each year, and the composition of the top ten most costly drug groups before rebates remained relatively stable throughout the period (Table 2 and Appendix Table A2). Throughout all years, antivirals accounted for the largest share of gross drug spending. Although they switched places in 2017, antidiabetic agents and psychotherapeutic agents consistently ranked second and third in spending by year. In 2019, antivirals, antidiabetic agents, and psychotherapeutic agents together made up 30% of gross spending on Medicaid outpatient prescriptions (Figure 3). Additionally, five of the most prescribed drug groups were also five of the most costly drug groups each year: antidiabetic agents, psychotherapeutic agents, adrenals & combinations, analgesics/antipyretics, and anticonvulsants. Psychotherapeutic agents were consistently the second most prescribed drug group and second or third most costly drug group before rebates each year, highlighting the key role Medicaid plays in covering and financing behavioral health care. However, these trends in gross spending may not reflect net payment, given differences in rebates to Medicaid across brand and generic drugs, among other factors.4
Figure 3: Gross Spending on Medicaid Outpatient Prescriptions by Drug Group, 2019
Table 2: Rankings of Top Drug Groups by Medicaid Spending
Drug Group
Typical Use
Ranking by Year
2015
2016
2017
2018
2019
Antivirals
Treat viral infections
1
1
1
1
1
Antidiabetic Agents
Treat diabetes
3
3
2
2
2
Psychotherapeutic Agents
Treat psychosis and depression
2
2
3
3
3
Immunosuppressants
Treat autoimmune diseases and used for organ transplant
7
5
4
4
4
Molecular Targeted Therapy
Cancer treatment
12
9
7
6
5
Adrenals & Combinations
Reduce inflammation
5
6
6
7
6
Stimulant
Speed up the central nervous system
4
4
5
5
7
Coagulants & Anticoagulants
Promote blood clotting or thinning
9
10
10
9
8
Analgesics/Antipyretics
Reduce pain, fever, inflammation
6
7
8
10
9
Anticonvulsants
Treat epileptic seizures
8
8
9
8
10
NOTE: Spending amounts do not include rebates.SOURCES: KFF analysis of 2015-2019 State Drug Utilization Data; IBM Micromedex RED BOOK, December 2020.
Antivirals
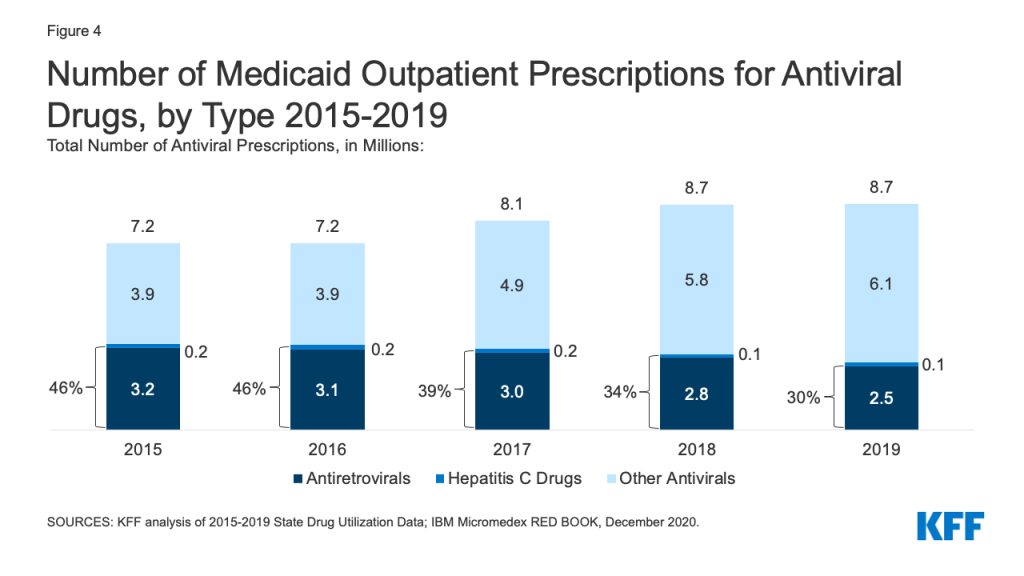
While utilization of antivirals overall increased over the period, the number of prescriptions for antiretrovirals (drugs largely used to treat or prevent HIV) and other drugs used for hepatitis C treatment have declined slightly in recent years. Medicaid plays a substantial role in covering people with HIV or Hepatitis C, providing insurance to 42% of the 1.2 million people with HIV and a disproportionate share of the 2.4 million people with hepatitis C in the US. Prescription drugs are a core component of treatment for these health conditions. Utilization of antiviral drugs increased over the period by 21% driven by increased use of other antiviral drugs, such as those that treat the flu. Utilization of antiretrovirals and other hepatitis C drugs decreased slightly over the period, making up 30% of antiviral prescriptions by 2019 (Figure 4). Declines in antiretrovirals may in part reflect substitution toward single-dose regimens, which increased by approximately 0.4 million prescriptions over this period. It could also represent greater stability in prescription regimens within a calendar year or be indicative of churn in the Medicaid program including with private insurance and the Ryan White HIV/AIDS Program. Declines in hepatitis C drugs could reflect utilization controls state Medicaid programs placed on hepatitis C drugs over the period or declining demand as a growing number of people receive the curative treatment. Over the period, antiretrovirals are more commonly prescribed than hepatitis C drugs due to the relatively larger number of people with HIV covered by Medicaid, expanded reach of these drugs through introduction of pre-exposure prophylaxis (PrEP) drugs to prevent HIV, and the fact that antiretrovirals are a maintenance drug taken over a lifetime (versus curative hepatitis C drugs taken over one course).
Figure 4: Number of Medicaid Outpatient Prescriptions for Antiviral Drugs, by Type 2015-2019
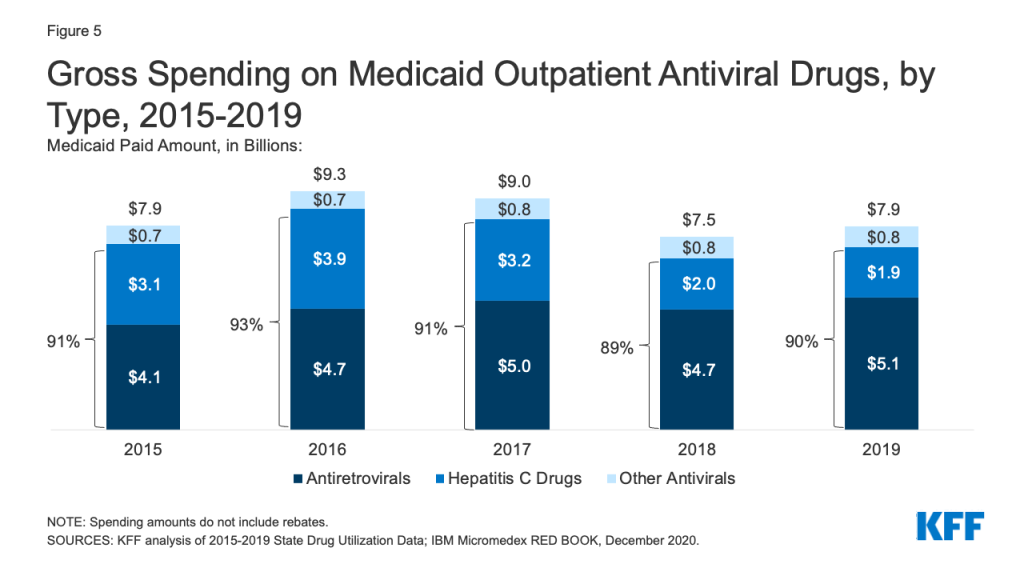
Over the entire period, antivirals were consistently the most costly drug group in Medicaid before rebates, driven by spending for drugs used to treat HIV and hepatitis C drugs. Antivirals accounted for 11% of gross Medicaid outpatient drug spending in 2019 (Figure 3). Antiretrovirals and hepatitis C drugs accounted for, on average, 91% of Medicaid antiviral spending each year before rebates (Figure 5). Gross spending on antivirals is disproportionate to their utilization (they were not among the top ten most frequently prescribed drug groups) and reflects the high cost of these drugs. While gross spending on hepatitis C drugs has decreased since 2016 due to competition, these drugs, like Harvoni and Sovaldi, account for a relatively large share of spending due to their high per-treatment cost.
Figure 5: Gross Spending on Medicaid Outpatient Antiviral Drugs, by Type, 2015-2019
Opioids
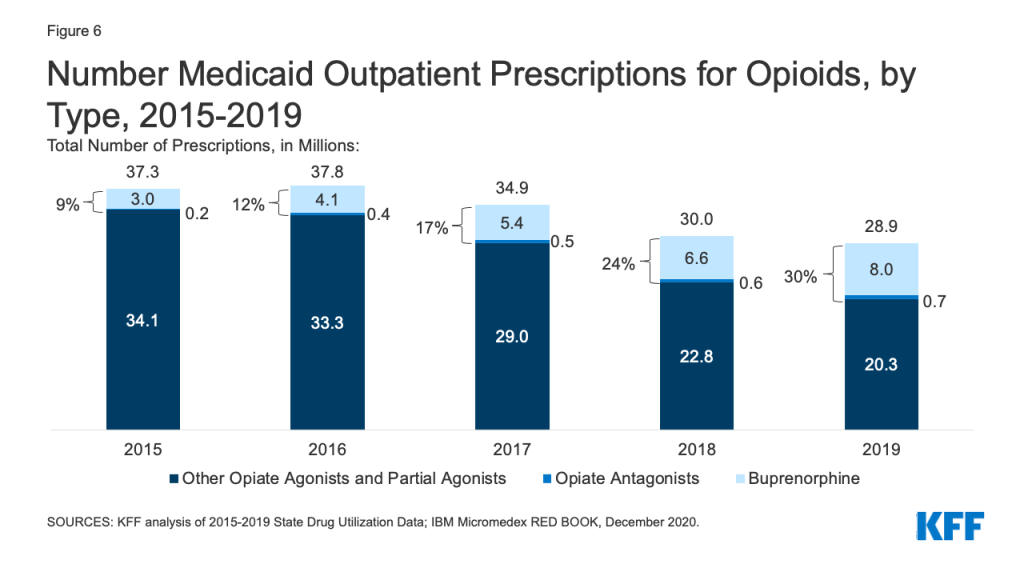
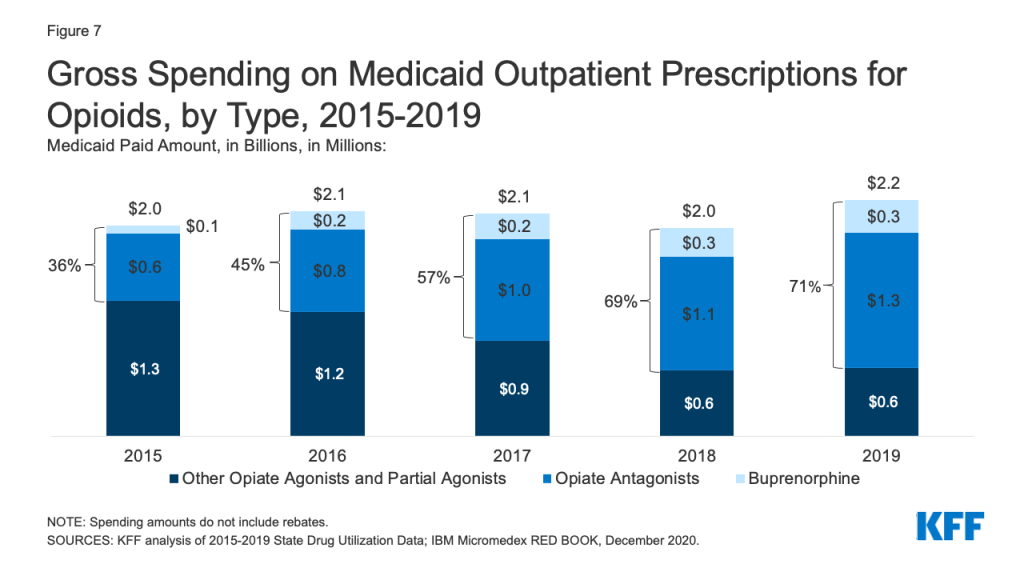
Patterns of prescriptions for opioids have shifted in recent years, with an increase in the number of prescriptions to treat opioid addiction and overdose and a decline in the number of prescriptions to treat pain. Opioids were widely prescribed during the period of study, with opiate agonists, partial agonists, and antagonists together accounting for 5.4% of all Medicaid outpatient prescriptions in 2015. However, opioid prescriptions declined over time, decreasing from 37.3 million prescriptions in 2015 to 28.9 million prescriptions in 2019 (Figure 6). While most opioids are used to treat pain, the opiate partial agonist, buprenorphine, and the opiate antagonists, naloxone and naltrexone, are used to treat addiction and overdose.5 Buprenorphine and opiate antagonists made up an increasing share of opioid prescriptions during the period, growing from 9% in 2015 to 30% in 2019. If opioids are examined aside from buprenorphine and opiate antagonists, the number of opioid prescriptions fell from 34.1 million in 2015 to 20.3 million in 2019, a 41% decline.
Figure 6: Number Medicaid Outpatient Prescriptions for Opioids, by Type, 2015-2019
While overall gross spending on opioids remained relatively stable during the period, buprenorphine and opiate antagonists made up an increasing share of opioid spending before rebates. The share of gross opioid spending on buprenorphine and opiate antagonists grew from 36% in 2015 to 71% in 2019 (Figure 7). At the same time, gross spending on other opiate agonist and partial agonist prescriptions, the vast majority of which are generic, decreased by 49% over the period, reflecting the decline in the number of prescriptions to treat pain.
Figure 7: Gross Spending on Medicaid Outpatient Prescriptions for Opioids, by Type, 2015-2019
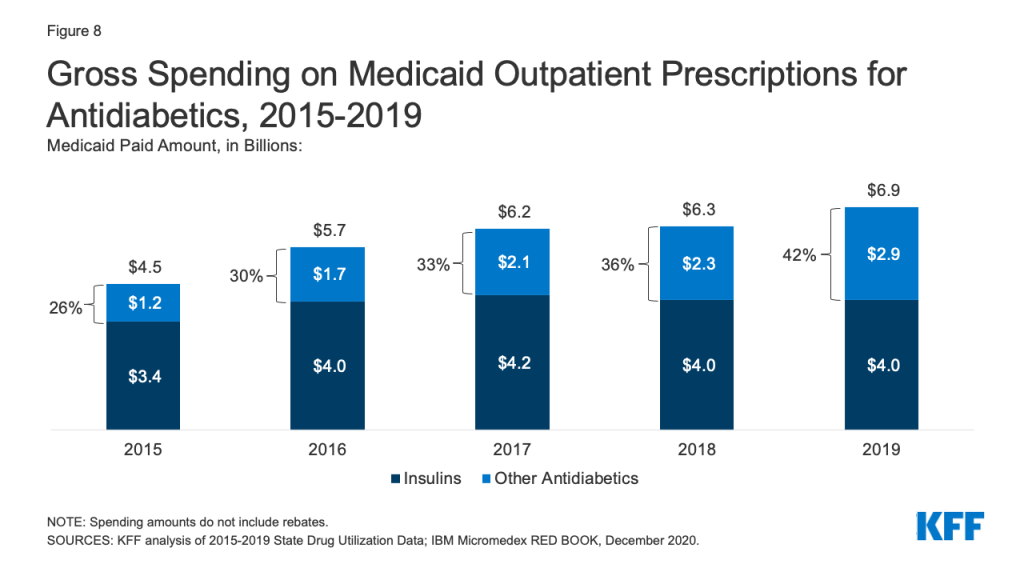
Antidiabetics
Antidiabetics were consistently in the top 10 most prescribed and most costly drug groups throughout the period of study. Their use grew 17% from 2015 to 2019, and Medicaid gross spending grew 53% from 2015 to 2019 (Appendix Table A1 and Figure 8). While insulins remained the largest source of gross spending on antidiabetics, non-insulin antidiabetic treatments, such as glucagon-like peptide-1 (GLP-1) receptor agonists and sodium glucose co-transporter (SGLT) inhibitors accounted for a growing share of spending (Figure 8).
Figure 8: Gross Spending on Medicaid Outpatient Prescriptions for Antidiabetics, 2015-2019
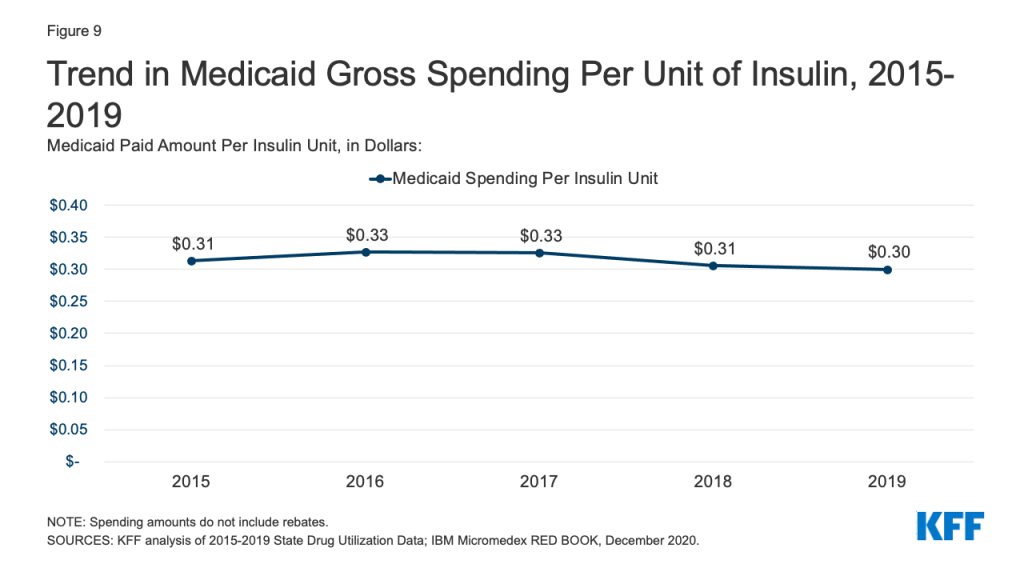
Medicaid spending on insulins before rebates remained relatively stable throughout the period. While the price of an insulin prescription nearly doubled between 2012 and 2016, Medicaid gross spending on insulin has remained around $4 billion since 2016, apart from 2017 when spending on insulins rose to $4.2 billion (Figure 8). Further, Medicaid gross spending per unit of insulin leveled off in 2016, then began to fall from a high of $0.33 in 2017 to $0.30 in 2019 (Figure 9). It is not clear from this data what has been driving this trend. Across payers, there has been a national pattern of declining insulin prices in recent years due to recent approvals of biosimilars and generics. However, because brand drugs are lower cost on net for the Medicaid program, likely due to high rebate amounts, Medicaid insulin utilization remains concentrated in brand drugs, and generic drugs are not similarly driving down insulin spending for Medicaid.
Figure 9: Trend in Medicaid Gross Spending Per Unit of Insulin, 2015-2019
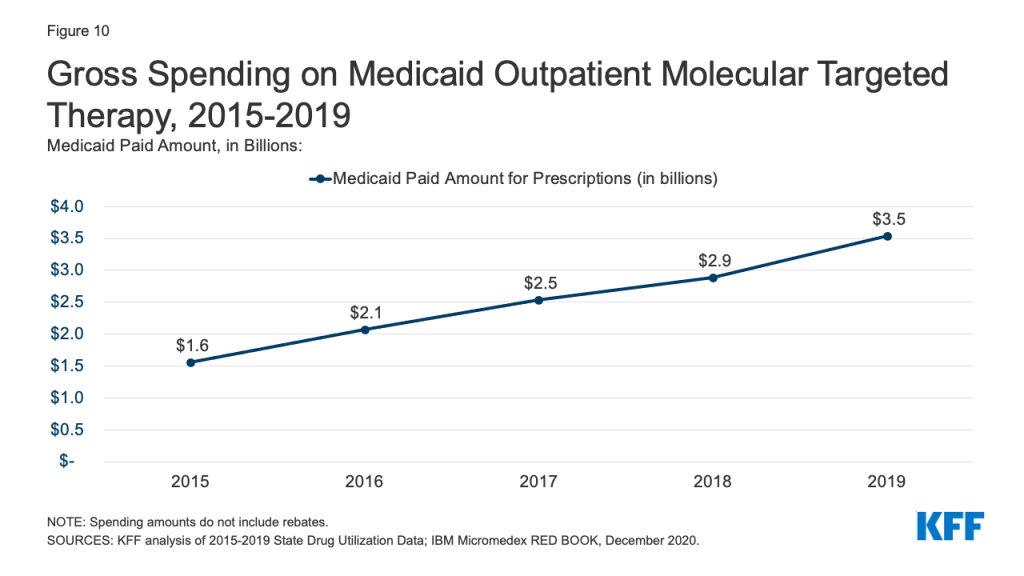
Molecular Targeted Therapy
Gross Medicaid spending on molecular targeted therapy (a type of targeted cancer treatment) more than doubled during the period of study. Spending on these drugs grew from the 12th most costly drug group in 2015 to the 5th most costly drug group in 2019 (Table 2 and Figure 10). Spending on these drugs is disproportionate to their utilization, with these drugs making up only 0.1% of prescriptions but 5% of overall Medicaid spending by 2019 (Figure 3). This growth reflects the rising cost of cancer treatment and signifies a shift toward more tailored cancer treatment, using therapies to target specific molecular features of tumors alongside other cancer treatments.
State preference for brand or generic drugs is complex due to the incentives created by the Medicaid Drug Rebate Program. Because generic drugs have lower list prices than brand-name drugs but are still therapeutically equivalent to their corresponding brand drugs, state Medicaid programs may implement required generic substitution policies to steer utilization to generic drugs where possible.6,7 However, because Medicaid rebates are higher on brand-name drugs than generics, net costs may actually be lower for brand-name drugs in Medicaid, leading some states to implement “brand over generic” programs. This is especially the case at the initial entrance of a generic equivalent into the market, when a state may still have supplemental rebate agreements and other large rebates that offset the price of the brand drug. Estimates suggest these programs can lead to substantial savings.
Figure 11: Number of Medicaid Outpatient Prescriptions for Brand and Generic Drugs, 2015-2019
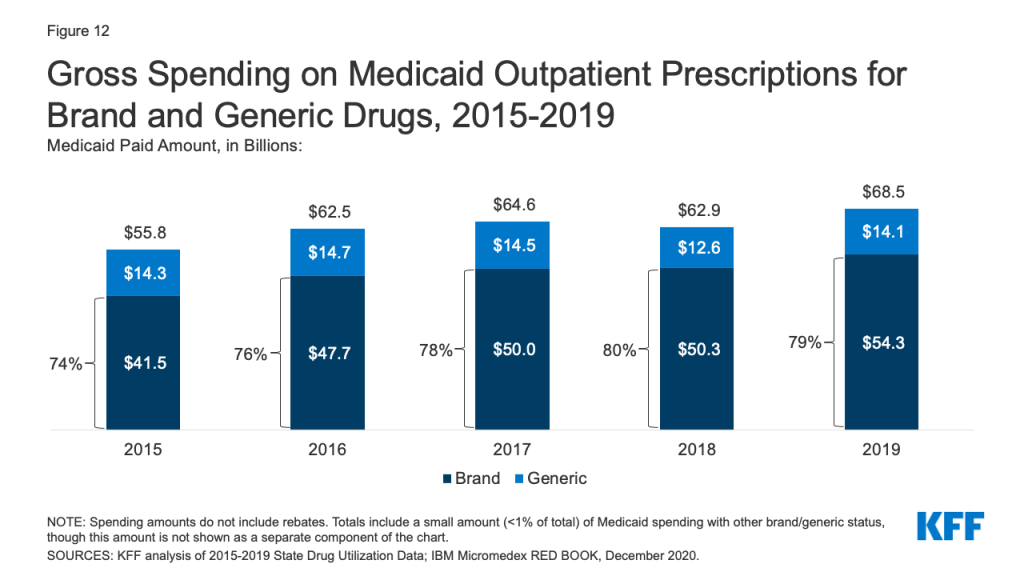
Generic drugs accounted for the vast majority of Medicaid outpatient prescriptions while brand drugs accounted for the vast majority of Medicaid spending before rebates during the period. The increase in number of Medicaid prescriptions from 2015 to 2017 was driven by the growing number of generic drugs, while the number of brand drug prescriptions over this period changed very little. The number of both brand and generic prescriptions fell from 2017 to 2019, but brand prescriptions decreased more quickly (14% drop) compared generic prescriptions (3% drop) (Figure 11). However, brand drugs consistently accounted for a relatively large share of Medicaid spending before rebates from 2015 through 2019, and this share increased slightly over time (from 74% to 79%) (Figure 12). The growth in brand spending despite decreases in both brand and generic prescriptions reflects national trends caused by increasing list prices for brand drugs and the launch of expensive new drugs during the period. Gross brand spending increased 8% from 2018 to 2019, likely driven by the launch of high cost, new specialty brand drugs like Biktarvy, Hemlibra, and Epidiolex. Other analysis shows that while other drugs have lost exclusivity over this period, the savings due to introduction of competition for those drugs are not keeping pace with the increased spending from the new drugs launching. There have also been price increases for existing brand drugs, like Humira, but Medicaid may be protected from some of these price hikes over time due to the inflationary component of the MDRP.
Figure 12: Gross Spending on Medicaid Outpatient Prescriptions for Brand and Generic Drugs, 2015-2019
Trends by Biologic Status
Biologics account for a very small share of prescriptions but a disproportionate share of gross Medicaid drug spending. Biologics are products, such as drugs or vaccines, derived from living organisms with chemical structures more complicated than traditional small molecule drugs. Biosimilars are products that are deemed “highly similar” or “interchangeable” with a referenced biologic. Biologics tend to be priced expensively and face less competition from biosimilars than small molecule brand drugs face from generics. Additionally, while there has been an increase in both biologics and biosimilars approved by the FDA from 2015 to 2019, some FDA approved biosimilars are not due to enter the US market for a few years or have delayed market entry to avoid patent litigation. Across the entire period from 2015-2019, relatively few prescriptions in Medicaid were biologics, but the amount Medicaid spends before rebates on biological products is outsized. While biological products consistently accounted for a little over 1% of Medicaid outpatient prescriptions every year, they accounted for between 15% and 21% of Medicaid spending on prescriptions before rebates over the period (Figure 13).
Figure 13: Biologics as a Share of Number of Medicaid Prescriptions and Outpatient Drug Gross Spending, 2015-2019
Looking Ahead
Medicaid prescription drug policy is likely to remain an issue at both the federal and state levels due to budgetary constraints and the entry of new, high-cost drugs. States remain concerned about the entry of new high-cost drugs to the market and report that developing strategies and policies to address these drugs is a top priority. There has also been recent policy discussion about strategies at the federal level to address the cost of new therapies through the FDA accelerated approval pathway as well as gene and cell therapies.
Congress may take action to address drug prices in both Medicaid and in the health system more broadly. Recent COVID-19 relief legislation includes a provision that lifts the Medicaid rebate cap (currently set at 100% AMP) beginning in 2024 and is estimated to reduce direct Medicaid spending by $14.5 billion. For drugs with large price increases over time, the Medicaid program may receive rebates from manufacturers that exceed the price of the drug. Reducing drug prices remains a focus of policymakers, particularly for individuals in Medicare and with private insurance, but any policies that change underlying drug prices will also have implications for Medicaid drug spending.
This work was supported in part by Arnold Ventures. We value our funders. KFF maintains full editorial control over all of its policy analysis, polling, and journalism activities.
SOURCES: KFF analysis of 2015-2019 State Drug Utilization Data; IBM Micromedex RED BOOK, December 2020.
Table A2: Top 10 Drug Groups by Medicaid Paid Amount
Rank
2015
2016
2017
2018
2019
1
Antivirals ($7,848,368,982)
Antivirals ($9,206,505,141)
Antivirals ($8,917,155,503)
Antivirals ($7,457,676,103)
Antivirals ($7,853,471,067)
2
Psychotherapeutic Agents ($6,912,012,885)
Psychotherapeutic Agents ($6,283,181,304)
Antidiabetic Agents ($6,239,455,084)
Antidiabetic Agents ($6,308,551,082)
Antidiabetic Agents ($6,908,757,194)
3
Antidiabetic Agents ($4,528,901,818)
Antidiabetic Agents ($5,668,623,740)
Psychotherapeutic Agents ($5,689,022,416)
Psychotherapeutic Agents ($5,625,902,994)
Psychotherapeutic Agents ($5,873,827,270)
4
Stimulant ($2,987,804,886)
Stimulant ($3,170,230,462)
Immunosuppressants ($3,918,023,261)
Immunosuppressants ($4,601,953,316)
Immunosuppressants ($5,866,587,687)
5
Adrenals & Comb. ($2,700,067,098)
Immunosuppressants ($3,157,553,958)
Stimulant ($3,189,477,837)
Stimulant ($3,049,867,394)
Molecular Targeted Therapy ($3,537,105,418)
6
Analgesics/ Antipyretics ($2,453,327,623)
Adrenals & Comb. ($2,979,009,890)
Adrenals & Comb. ($3,039,048,140)
Molecular Targeted Therapy ($2,892,308,999)
Adrenals & Comb. ($2,976,007,562)
7
Immunosuppressants ($2,166,612,165)
Analgesics/ Antipyretics ($2,502,808,801)
Molecular Targeted Therapy ($2,539,071,962)
Adrenals & Comb. ($2,890,468,521)
Stimulant ($2,934,419,541)
8
Anticonvulsants ($1,947,754,343)
Anticonvulsants ($2,175,883,747)
Analgesics/ Antipyretics ($2,404,774,675)
Anticonvulsants ($2,433,696,422)
Coagulants & Anticoagulants ($2,590,002,985)
9
Coagulants & Anticoagulants ($1,798,452,692)
Molecular Targeted Therapy($2,077,065,490)
Anticonvulsants ($2,330,799,364)
Coagulants & Anticoagulants ($2,241,068,696)
Analgesics/ Antipyretics ($2,444,551,383)
10
Sympathomimetic Agents ($1,635,996,791)
Coagulants & Anticoagulants ($2,013,718,601)
Coagulants & Anticoagulants ($2,124,605,146)
Analgesics/ Antipyretics ($2,193,543,762)
Anticonvulsants ($2,432,123,911)
NOTE: Spending amounts do not include rebates.SOURCES: KFF analysis of 2015-2019 State Drug Utilization Data; IBM Micromedex RED BOOK, December 2020.
Appendix B: Methodology
This analysis of Medicaid prescription drug utilization and spending trends used 2015 through 2019 State Drug Utilization Data (SDUD), downloaded in early January 2021, merged with data from IBM Micromedex RED BOOK. The SDUD is publicly available data provided as part of the Medicaid Drug Rebate Program. It provides data on the number of prescriptions, Medicaid spending before rebates, and cost-sharing for rebate-eligible Medicaid outpatient drugs. At the time of download, 2019 data were the most recent full year of data available. The RED BOOK data is from December 2020. The use of RED BOOK data does not represent and should not be characterized as a RED BOOK endorsement of any data, findings, or other content presented in this report.
The SDUD and the RED BOOK data were merged at the NDC-level to consistently identify the drug name, as well as to incorporate brand versus generic status and the therapeutic/pharmacologic category of the product. Branded-generic drugs were classified as generic drugs. Using the FDA’s Purple Book, a list of all FDA-licensed biological products regulated by the Center for Drug Evaluation and Research (CDER) and the Center for Biologics Evaluation and Research (CBER) as of December 2020, biological products in the SDUD were identified based on drug name.
Limitations
The SDUD provides spending and utilization data by NDC, quarter, managed care or fee-for-service, and state. It also provides this data summarized for the whole country. CMS has suppressed data cells with fewer than 11 prescriptions, citing the Federal Privacy Act and the HIPAA Privacy Rule. This analysis used the national data because less data is suppressed at the national versus state level.
This analysis does not include rebates because rebate data is unavailable to the public at the NDC level. Rebates have a considerable effect on Medicaid drug spending overall, lowering net spending, but this effect varies at the drug level as different drugs receive different rebates. Additionally, although Medicaid beneficiaries largely self-administer drugs that are prescribed in an outpatient setting, medical practitioners must administer some drugs. Although states are instructed to collect drug rebates on physician-administered outpatient drugs that are not billed as a bundled service, physician-administered drugs subject to a rebate can vary from state to state. Because biologics and other specialty drugs are often physician-administered, it is possible that the data reflects lower Medicaid spending and utilization of certain drugs of this kind.
For brand name drugs, the rebate is 23.1% of Average Manufacturer Price (AMP) or the difference between AMP and “best price,” whichever is greater. Best price is defined as the lowest available price to any wholesaler, retailer, or provider, excluding certain government programs, such as the health program for veterans. For generic drugs, the rebate amount is 13% of AMP, and there is no best price provision. Rachel Dolan, Understanding the Medicaid Prescription Drug Rebate Program (Washington, DC: KFF, November 2019) https://modern.kff.org/medicaid/issue-brief/understanding-the-medicaid-prescription-drug-rebate-program/↩︎
CBO analysis of 176 top-selling brand-name drugs in Medicare Part D. CBO computed the average price of those drugs per standardized prescription—a measure that roughly corresponds to a 30-day supply of medication. Congressional Budget Office, A Comparison of Brand-Name Drug Prices Among Selected Federal Programs (CBO, February 2021), https://www.cbo.gov/system/files/2021-02/56978-Drug-Prices.pdf↩︎
On average, Medicaid obtains rebates on brand drugs that are 77 percent of the average Medicaid retail price but only 60% for specialty drugs. The inflation-based component of the rebate averaged 31 percent of the retail price in Medicaid for specialty drugs and 43 percent for nonspecialty drugs. Congressional Budget Office, A Comparison of Brand-Name Drug Prices Among Selected Federal Programs (CBO, February 2021), https://www.cbo.gov/system/files/2021-02/56978-Drug-Prices.pdf↩︎
Buprenorphine, Naltrexone, and Methadone are FDA approved drugs used in Medication Assisted Treatment for opioid addiction. Buprenorphine and Methadone reduce withdrawal symptoms, and Naltrexone is an antagonist and blocks the effects of both opioids and alcohol. Naloxone is an antagonist that can reverse an opioid overdose. Methadone is administered when used to treat OUD, which is not reported in the Medicaid SDUD data. See Lisa Clemans-Cope, Emma Winiski, Victoria Lynch, and Marni Epstein, Rapid Growth in Medicaid Prescriptions and Spending to Treat Opioid Use Disorder and Opioid Overdose from 2010 to 2018 (Washington, DC, Urban Institute, July 2020), https://www.urban.org/research/publication/rapid-growth-medicaid-prescriptions-and-spending-treat-opioid-use-disorder-and-opioid-overdose-2010-2018/view/full_report. ↩︎
Of the states that required more the restrictive requirements, a majority required preauthorization to enable a pharmacist to provide a brand drug when a generic was available. States included other requirements, such as requiring the submission of a MedWatch Form and requiring a medical reason to override the use of a generic, and some implement more than one restrictive requirement. Ibid. ↩︎
The Biden Administration has started taking steps to reverse Trump Administration policy and regulations that significantly narrowed the implementation and administrative enforcement of Section 1557, the Affordable Care Act’s nondiscrimination provision, particularly as the regulations apply to gender identity and sexual orientation. In addition, several lawsuits challenging the regulations, which were initially issued by the Obama Administration and later substantially revised by the Trump Administration, are pending. Section 1557 prohibits discrimination based on race, color, national origin, sex, age, and disability in health programs and activities receiving federal financial assistance. The two versions of the regulations, those from the Obama Administration followed by those from the Trump Administration, adopted conflicting interpretations about the content and scope of prohibited discrimination. This issue brief provides an update on current developments and identifies issues to watch in the coming weeks and months.
Administrative Actions
On May 10, 2021, the Biden Administration announced that the HHS Office for Civil Rights (OCR) will include gender identity and sexual orientation as it interprets and enforces Section 1557’s prohibition against sex discrimination (Figure 1). This announcement followed a federal agency review of existing regulations and policy directed by President Biden’s executive order on preventing and combatting discrimination based on gender identity and sexual orientation, which he issued on his first day in office. The May 2021 announcement marks both a reversal of Trump Administration policy and an expansion of Obama Administration policy. While the Obama Administration regulations included gender identity and sex stereotyping in the definition of sex discrimination, they omitted sexual orientation, noting that federal law in this area was still evolving at that time. Subsequently, the Trump Administration eliminated gender identity and sex stereotyping from the regulations. However, just after the Trump Administration regulations were published, the Supreme Court, in Bostock v. Clayton County, Georgia, ruled that sex discrimination in the employment context does include discrimination based on gender identity or sexual orientation. Following the Bostock ruling, two federal district courts issued nationwide preliminary injunctions (Figure 1 and described further below), blocking implementation of several provisions of the Trump Administration’s regulations related to Section 1557.
Figure 1: Key Dates in Section 1557 Implementation
Three of the five cases challenging the Trump Administration regulations have been put on hold to provide the Biden Administration with additional time to complete its review of existing regulations and policy (Table 1). Courts in two of the cases on hold issued the nationwide preliminary injunction orders that continue to block implementation of some provisions of the Trump Administration regulations. These orders remain in place, although the federal government appealed both of them. A third case challenging the Trump Administration regulations also has been put on hold, though the parties disagree about how long the delay in that case should last. The cases currently on hold include:
A DC case, Whitman-Walker Clinic v. HHS, brought by health care and social service providers who serve LGBTQ people and people with limited English proficiency (LEP). The district court’s nationwide preliminary injunction prevents the federal government from implementing provisions of the Trump Administration regulations that (1) exclude sex stereotyping from definition of sex discrimination and (2) incorporate a blanket religious freedom exemption from claims of sex discrimination. The next status report is due to the court on August 12, 2021.
Another New York case, NY v. HHS, brought by a group of 23 states. Both sides have agreed to put the case on hold but disagree about when the next status report should be due to the court. The states propose June 13, 2021, while the federal government proposes August 12, 2021.
Two other cases challenging the Trump Administration regulations are currently active (Table 1). Decisions in these cases could influence the contents of the Biden Administration’s expected NPRM as well as the status of the Trump regulations that remain in effect. The active cases include:
Another DC case, Chinatown Service Center v. HHS, brought by community-based organizations serving older adults with LEP. The complaint in this case was filed recently, and HHS has not yet responded.
Another two cases, which were filed to challenge the Obama Administration regulations and are still pending, raise issues about the interaction between Section 1557’s nondiscrimination provisions and federal laws that protect religious beliefs. The Supreme Court did not reach this issue in Bostock, noting that this is a question for future cases to decide. These cases include:
Religious Sisters of Mercy v. Becerra, in which the Biden Administration is appealing a North Dakota federal court ruling that blocks it from requiring Catholic health care entities to perform or provide health insurance coverage for gender transition services under the Obama Administration’s Section 1557 regulations.
Franciscan Alliance v. Becerra, in which religiously affiliated health care providers claim that the Obama Administration regulations’ inclusion of gender identity and termination of pregnancy in the definition of sex discrimination would require them to serve people seeking transgender care and people who have terminated a pregnancy in violation of the providers’ religious rights. The 5th Circuit Court of Appeals sent the case back to the trial court to determine whether the providers’ claims are moot in light of the subsequent Trump Administration regulations as well as the recent Biden Administration actions. Briefing on these issues closes on June 18, 2021.
Looking Ahead
The interpretation and enforcement of Section 1557’s prohibition against discrimination in federally funded health programs and activities will continue to develop in the coming months. Outside of the Section 1557 regulations and surrounding litigation, federal courts in other cases have granted relief to individuals alleging discrimination under Section 1557, relying on the text of the statute itself. For example, a Wisconsin federal court permanently blocked the state Medicaid program’s categorical exclusion of gender affirming services from coverage as a violation of the statutory prohibition against sex discrimination. Future court rulings, the forthcoming NPRM, and administrative enforcement by OCR under the new Biden Administration policy together will influence Section 1557 law and policy and could affect the ability to access health coverage and care without discrimination.
Table 1: Lawsuits Challenging the Trump Administration’s Section 1557 Regulations, as of 5/24/21
(DC district court and DC Circuit Court of Appeals.)
Health care and social service providers who serve LGBTQ people and people with LEP
Case is on hold, with next status report due 8/12/21, to provide Biden Administration time to assess next steps. Nationwide preliminary injunction blocking parts of Trump Administration rule remains in place.
On 9/2/20, the district court issued a nationwide preliminary injunction preventing the federal government from implementing provisions of the Trump Administration regulations that (1) exclude sex stereotyping from the definition of sex discrimination and (2) incorporate a blanket religious freedom exemption from claims of sex discrimination.
The district court denied plaintiffs’ motion for a preliminary injunction to block the final rule’s (1) elimination of the provision prohibiting categorical coverage exclusions for gender-affirming care, (2) elimination of notice and tagline requirements, (3) restriction of the rule’s scope to apply only to HHS-administered programs and activities under ACA Title I, and not all HHS programs and activities, (4) exclusion from the rule of certain activities of health insurance issuers not principally engaged in the business of providing health care, and (5) provisions amending the appropriate legal standard to be applied to Section 1557 claims.
The Trump Administration appealed the district court’s preliminary injunction order, seeking to have it overturned. After the Biden Administration took office, the appeals court agreed to the parties’ joint request to put the appeal on hold, in light of the Biden Administration’s executive order directing federal agencies to review existing regulations and policy to prevent and combat discrimination based on gender identity and sexual orientation and to allow the Biden Administration time to review the issues in the lawsuit.
The Trump Administration also filed a motion to dismiss the district court case. Like the appeals court case, the district court case has been put on hold to give the Biden Administration time to complete its review of agency regulations and policy.
On 5/14/21, the parties filed a joint status report in which the Biden Administration said that its assessment pursuant to the executive order is ongoing. The Biden Administration also said that it intends to issue a new notice of proposed rule-making “as expeditiously as reasonably possible” to revise the regulations, which it says will provide the opportunity to reconsider many or all of the issues raised in this case. The Biden Administration also referred to its 5/10/21 notice that it will consider gender identity and sexual orientation within the definition of sex discrimination under Section 1557, consistent with the Supreme Court’s Bostock decision.
The next status report is due on 8/12/21, and every 90 days thereafter. The parties are to file motions to govern future court proceedings within 30 days after the Biden Administration completes its review of existing regulations and policy.
(NY district court (eastern district) and 2nd Circuit Court of Appeals)
2 transgender women of color
Case is on hold, with next status report duel 8/12/21, to provide Biden Administration time to assess next steps. Nationwide preliminary injunction blocking certain provisions of Trump Administration rule remains in place.
On 8/17/20, the district court issued a nationwide preliminary injunction preventing the federal government from implementing provisions of the Trump Administration regulations that exclude gender identity and sex stereotyping from definition of sex discrimination.
On 10/29/20, the district court entered an order expanding the preliminary injunction to also prevent the federal government from implementing provisions of the Trump Administration regulations that eliminated the requirement for healthcare providers to treat individuals consistent with their gender identity and eliminated the prohibition on providers from denying or limiting services based on gender identity. The court denied the plaintiffs’ other requests to expand the scope of the preliminary injunction but said that those requests can be renewed if plaintiffs can establish that they have standing to challenge other provisions.
The Trump Administration appealedboth of the district court’s preliminary injunction orders, seeking to have them overturned. The district court case is on hold while the appeals are pending.
After the Biden Administration took office, the appeals court agreed to the parties’ joint request to put the appeal on hold, in light of the Biden Administration’s executive order directing federal agencies to review existing regulations and policy to prevent and combat discrimination based on gender identity and sexual orientation and to allow the Biden Administration time to review the issues in the lawsuit.
On 5/14/21, the parties filed a joint status report in which the Biden Administration said that its assessment pursuant to the executive order is ongoing. The Biden Administration also said that it intends to issue a new notice of proposed rule-making “as expeditiously as reasonably possible” to revise the regulations, which it says will provide the opportunity to reconsider many or all of the issues raised in this case. The Biden Administration also referred to its 5/10/21 notice that it will consider gender identity and sexual orientation within the definition of sex discrimination under Section 1557, consistent with the Supreme Court’s Bostock decision.
The next joint status report is due on 8/12/21. The parties disagree about how to resolve the case. The plaintiffs argue that the federal government should withdraw its appeal of the preliminary injunction orders, while the federal government argues that the plaintiffs should dismiss their lawsuit.
23 states (NY, CA, MA, CO, CT, DE, DC, HI, IL, ME, MD, MI, MN, NV, NJ, NM, NC, OR, PA, RI, VT, VA, WI)
Case is on hold, although the parties disagree about when the next status report should be due. The states propose 6/13/21, while the federal government proposes 8/12/21.
However, the court granted the federal government’s motion to put the case on hold (which the states did not oppose) in light of the Biden Administration’s executive order directing federal agencies to review existing regulations and policy to prevent and combat discrimination based on gender identity and sexual orientation and to allow the Biden Administration time to review the issues in the lawsuit.
On 5/14/21, the parties filed a joint status report in which the Biden Administration said that its assessment pursuant to the executive order is ongoing. The Biden Administration also said that it intends to issue a new notice of proposed rule-making “as expeditiously as reasonably possible” to revise the regulations, which it says will provide the opportunity to reconsider many or all of the issues raised in this case. The Biden Administration also referred to its 5/10/21 notice that it will consider gender identity and sexual orientation within the definition of sex discrimination under Section 1557, consistent with the Supreme Court’s Bostock decision.
A transgender man and health care and social service providers who serve LGBTQ people and people with LEP
Case is active. Hearing scheduled for 6/3/21 on federal government’s motion to dismiss the lawsuit.
The court denied federal government’s motion to stay the case. The federal government had asked for the case to be put on hold to give HHS time to complete its review of regulations and policy in light of the Biden Administration’s executive order directing federal agencies to review existing regulations and policy to prevent and combat discrimination based on gender identity and sexual orientation and to allow the Biden Administration time to review the issues in the lawsuit. The plaintiffs opposed the request.
The Medicare Part D program provides an outpatient prescription drug benefit to older adults and people with long-term disabilities in Medicare who enroll in private plans, including stand-alone prescription drug plans (PDPs) to supplement traditional Medicare and Medicare Advantage prescription drug plans (MA-PDs) that include drug coverage and other Medicare-covered benefits. This analysis provides the latest data about Medicare Part D enrollment, premiums, and cost sharing in 2021 and trends over time, based on data from the Centers for Medicare & Medicaid services (CMS) Part D Enrollment, Benefit, Landscape, and Low Income Subsidy files.
Part D enrollment in Medicare Advantage drug plans has increased over time, while enrollment in stand-alone prescription drug plans has decreased in recent years
A total of 48 million people with Medicare are currently enrolled in plans that provide the Medicare Part D drug benefit, representing more than three-quarters (77%) of all Medicare beneficiaries. This total includes plans open to everyone with Medicare, including stand-alone PDPs and MA-PDs, and plans for specific populations, including retirees of a former employer or union and Medicare Advantage Special Needs Plans (SNPs). Over time, Part D enrollment in MA-PDs has increased, reflecting enrollment growth in Medicare Advantage plans overall, while enrollment in PDPs has decreased each year since 2019.
In 2021, half of all Part D enrollees are enrolled in stand-alone PDPs (50%), and the other half are in MA-PDs (50%), but a slightly larger number of enrollees are in MA-PDs (24.1 million) than in PDPs (23.9 million) (Figure 1, Table 1). (MA-PD enrollment includes Medicare Advantage HMOs, PPOs, private fee-for-service, and Medicare Savings Account plans, and other Medicare private plans, including Medicare-Medicaid plans, Cost plans, and PACE plans). Between 2020 and 2021, the number of MA-PD enrollees increased by 11%, while enrollment in PDPs decreased by 4%.
Part D enrollment is concentrated in 3 national firms – UnitedHealth, Humana, and CVS – which have a combined 56% of total enrollment
The top three firms – UnitedHealth, Humana, and CVS Health – cover close to 6 in 10 of all beneficiaries enrolled in Part D in 2021 (56%), while the top five firms – including Centene and Cigna – account for three-quarters (74%) of Part D enrollment (Figure 2). With the exception of Kaiser Permanente, which exclusively offers MA plans, the top Part D plan sponsors offer both stand-alone PDPs and MA-PDs. For most firms, Part D enrollment is more concentrated in one market than the other; for example, CVS Health, Centene, and Cigna have greater enrollment in PDPs than MA-PDs (Table 2).
An increasing share of beneficiaries receiving low-income subsidies are enrolled in Medicare Advantage drug plans, with just over half now enrolled in MA-PDs
In 2021, nearly 13 million Part D enrollees, or just over 1 in 4, receive premium and cost-sharing assistance through the Part D Low-Income Subsidy (LIS) program. These additional financial subsidies, also called “Extra Help,” pay Part D premiums for eligible beneficiaries, as long as they enroll in stand-alone PDPs designated as premium-free “benchmark” plans, and reduce cost sharing. For the first time since Part D started in 2006, more LIS enrollees are in MA-PDs (6.8 million) than in PDPs (6.0 million) (Figure 3). Reflecting overall trends in Part D enrollment, the share of LIS enrollees in stand-alone PDPs has declined over time, from 87% in 2006 to 47% in 2021, while the share in MA-PDs has increased, from 13% in 2006 to 53% in 2021 (Table 1).
As part of increased enrollment in MA-PDs, more than one quarter of all LIS enrollees (26%) are now enrolled in Medicare Advantage Special Needs Plans (SNPs), up from only 4% in 2006. SNPs limit enrollment to beneficiaries with certain characteristics, including those with certain chronic conditions (C-SNPs), those who require an institutional level of care (I-SNPs), and those who are dually enrolled in Medicare and Medicaid (D-SNPs), which account for the majority of SNP enrollees.
Monthly Part D premiums have decreased somewhat in recent years; the 2021 weighted average premium for drug coverage is 3 times larger for PDPs than for MA-PDs
In 2021, the weighted average monthly premium for PDPs is $38, a 7% reduction (-$3) from a high of $41 in 2018 (Figure 4). The average monthly PDP premium amount has decreased somewhat in recent years, and has remained within a few dollars of the 2021 average since 2010. For MA-PDs, the monthly premium for the Part D portion of covered benefits averages $12 in 2021 (and $21 for Part C and Part D benefits combined). The average premium for drug coverage in MA-PDs is lower than the average premium for PDPs due in part to the ability of MA-PD sponsors to use rebate dollars (which may include bonuses) from Medicare payments for benefits covered under Parts A and B to lower their Part D premiums. The combined weighted average Part D premium across both types of plans is $26 in 2021, a reduction of roughly 20% (-$6) from 2018, driven largely by a decrease in the Part D portion of the monthly MA-PD premium.
The moderation of growth in the average Part D premium in recent years is likely related to changes in the Part D benefit that have reduced plan liability, in particular, an increase in the manufacturer coverage gap price discount on brand-name drugs from 50% to 70% in 2019, which has led to a reduction in plan liability for brand-name drugs during the coverage gap phase. Lower plan liability helps constrain total costs, enabling plans to lower their bids and, therefore, premiums. The average premium reduction among MA-PDs specifically is related to both an increase in the availability of zero premium plans and the reduction in plan liability for brand-name drug costs during the coverage gap phase.
Most Part D enrollees in 2021 (51% of PDP enrollees and 87% of MA-PD enrollees) are in plans offering enhanced benefits, which can include a lower (or no) deductible, reduced cost sharing, or a higher initial coverage limit than under the standard benefit design. The weighted average premium in 2021 for enhanced benefit PDPs is $44, which is roughly 40% higher than the monthly premium for PDPs offering the basic benefit ($32).
The average Part D deductible has increased for PDPs, while decreasing for MA-PDs; the 2021 weighted average annual drug deductible is 3.5 times larger in PDPs than in MA-PDs
In 2021, a large majority of PDP enrollees (86%) are in plans that charge a deductible, with nearly two-thirds (64%) in PDPs that charge the standard amount of $445 in 2021. Conversely, less than 1 in 5 MA-PD enrollees (18%) are in plans that charge the standard Part D deductible, and nearly half (47%) are in plans that charge no drug deductible. These enrollment patterns explain the wide divergence between PDPs and MA-PDs in the enrollment-weighted average Part D deductible amount. For PDPs, the average Part D deductible in 2021 is $350, 3.5 times larger than the average drug deductible in MA-PDs ($102) (Figure 5).
The increase in the weighted average Part D deductible for PDPs was particularly steep between 2019 and 2020, when two national PDPs modified their plan design from charging no deductible to charging a partial or full deductible in all or nearly all regions. Charging a full or partial deductible provides plans with an additional lever to reduce their liability, particularly for those enrollees who have relatively low total drug costs, and keep premium growth in check. Conversely, MA-PDs have more leverage to reduce Part D premiums because of rebate dollars from Medicare, and with the majority of MA-PDs offering enhanced benefits, they are more likely to have lower or no deductibles than PDPs.
Most Part D enrollees pay less than $10 for generic drugs, but many pay $40-$100 (or coinsurance of 40%-50%) for brand-name drugs; a larger share of MA-PD enrollees than PDP enrollees pay the maximum 33% coinsurance for specialty tier drugs
Most Part D enrollees face relatively low cost sharing for preferred generic drugs, but higher amounts for generics not on the preferred tier. One-half of Part D enrollees (both PDP and MA-PD enrollees) pay $0 for preferred generics in 2021, but many pay $10 or more per prescription for generics that are not on the preferred tier (Figure 6). For preferred generics, 56% of PDP enrollees and 45% of MA-PD enrollees have a $0 copayment, while 44% of PDP enrollees and 51% of MA-PD enrollees face prescription copayments greater than $0 but less than $6. For generic drugs that are not on the preferred generic tier, most PDP enrollees (86%) pay less than $10, while more than half of MA-PD enrollees (60%) pay between $10 and $20. (We did not compare which specific drugs are covered on each tier in PDPs and MA-PDs, which would also influence enrollees’ out-of-pocket costs.)
For non-preferred drugs, most MA-PD enrollees face copayments while most PDP enrollees face coinsurance; for preferred brands, copayments are more common than coinsurance for enrollees in both types of plans. For preferred brands, 57% of PDP enrollees pay monthly copayments less than $45, while 69% of MA-PD enrollees pay $45 to $47. For drugs on the non-preferred tier (which can be all brands or a mix of brands and generics), virtually all PDP enrollees pay coinsurance between 25% and 50% in 2021, while most MA-PD enrollees (83%) pay copayments between $90 and $100. The maximum cost-sharing amount permitted by CMS is $47 or 25% for preferred brands and $100 or 50% for non-preferred drugs in 2021.
A larger share of MA-PD enrollees than PDP enrollees face the maximum 33% coinsurance rate for specialty tier drugs. For specialty tier drugs, defined by CMS as those that cost at least $670 per month, a much larger share of MA-PD enrollees than PDP enrollees are in a plan that charges the maximum 33% coinsurance (54% vs. 14%), while a much larger share of PDP enrollees than MA-PD enrollees are in a plan that charges the minimum 25% coinsurance (66% vs. 7%). Only those plans that waive some or all of the standard deductible are permitted to set the specialty tier coinsurance rate above 25%. Most PDP enrollees are in plans that charge the standard $445 deductible in 2021, while most MA-PD enrollees are in plans that charge either no or a lower deductible.
Juliette Cubanski is with KFF. Anthony Damico is an independent consultant.
With increased attention to the global need for COVID-19 vaccines and the Biden administration’s announcement today about how it plans to distribute the first portion of the 80 million doses it will share by the end of this month, the latest KFF Health Tracking Poll finds that two-thirds of the public (66%) say that the U.S. should play at least a “major role” in distributing COVID-19 vaccines to other countries, including about a quarter (27%) who say it should play a “leading role.”
Nearly 9 in 10 Democrats support the U.S. taking at least a “major role” (87%), while most Republicans (57%) say the U.S. should play a “minor role” or “no role at all,” a larger share than the 41% who want the U.S. to play a “leading” or “major role.”
The shares who say the U.S. should take at least a major role increase when people are told that the U.S. has enough COVID-19 vaccine to help other countries without hurting its own supply (78%), that the pandemic is much worse in other countries and they need access to the vaccines to stop its spread (77%), or that providing vaccines to other countries could help the U.S. achieve the immunity necessary to curb the pandemic (76%). After hearing each of these messages, at least half of Republicans say the U.S. should take a leading or major role in vaccine distribution overseas.
The poll also gauges the public’s health policy priorities, and finds large shares of the public consider each of nine proposals tested as “top” or “important” priorities for Congress.
This includes at least 8 in 10 who say so about allowing the federal government to negotiate lower prices directly with drug makers (92%), expanding Medicare coverage to include hearing aids, dental and vision coverage (90%), placing a limit on out-of-pocket costs that seniors have to pay each year for things like prescription drugs (88%), and continuing efforts to make sure U.S. residents are able to receive a COVID-19 vaccine (81%).
Other priorities for Congress include expanding public health coverage for low-income people in states that have not expanded their Medicaid program (78%), creating a public option to compete with private insurance (71%), or lowering the age of Medicare eligibility (66%).
Democrats are generally more likely than Republicans to prioritize each of these health issues as priorities for Congress. The policies aimed at addressing drug costs are the only ones that majorities of Democrats, independents, and Republicans identify as “top” priorities.
When asked directly whether they support or oppose allowing the federal government to negotiate with drug makers to reduce prices for both Medicare and private insurance, the vast majority of the public (88%) is in favor. The poll suggests those views could change in a national debate with arguments being made for and against the approach.
Support inches higher (to 90%) when the public hears that people could save money on their prescription drugs if this policy were implemented. On the flip side, nearly two thirds (65%) say they oppose such a policy after being told that “it could lead to less research and development of new drugs” or that “it could limit people’s access to newer prescription drugs.” These arguments are similarly effective with Democrats and Republicans.
Other findings include:
The COVID relief law enacted in March provides additional financial assistance to people who buy their own health insurance through the Affordable Care Act’s marketplace. Few (7%) of those who could be eligible for this assistance are aware of this fact.
Far more continue to view the Affordable Care Act favorably (53%) than unfavorably (35%). This reflects a huge partisan divide, with most Democrats (85%) and a narrow majority of independents (54%) viewing it favorably, and most Republicans (77%) viewing it unfavorably.
Larger majorities, including most Republicans, view both Medicare (78%) and Medicaid (74%) favorably.
Designed and analyzed by public opinion researchers at KFF, the KFF Health Tracking Poll was conducted from May 18-25 among a nationally representative random digit dial telephone sample of 1,526 adults. Interviews were conducted in English and Spanish by landline (248) and cell phone (1,278). The margin of sampling error is plus or minus 3 percentage points for the full sample. For results based on subgroups, the margin of sampling error may be higher.
The latest KFF Health Tracking Poll finds majorities of the public saying many current health care proposals being discussed by lawmakers are important priorities for Congress to focus on in the coming months, and few (less than one five) saying each of the health priorities “should not be done.” While majorities of the public say each of the health care priorities asked about is important for Congress to work on, proposals aimed at lowering prescription drug prices are a top priority for Democrats, independents, and Republicans.
Overall, nearly nine in ten (88%) favor allowing the federal government to negotiate for lower prices on medications, including three-fourths (77%) of Republicans, nine in ten independents (89%) and 96% of Democrats. And while majorities of the public continue favoring this proposal after hearing that people and the federal government could save money on their prescription drugs if this policy were implemented, majorities oppose this policy proposal when the public hears argument made by pharmaceutical companies that it could lead to less research and development for new drugs, or that access to newer prescriptions could be limited.
The COVID relief bill passed in early March 2021 provided additional financial assistance to people who buy their own health insurance. The vast majority of those who are eligible for this financial assistance are either unsure whether the COVID-19 relief package included this financial assistance (82%) or say it did not happen (9%), while about one in ten (9%) are aware of this increased financial assistance. Additionally, only a small minority of those potentially eligible for additional financial help or coverage report going online to see if they qualify for a different or cheaper health insurance plan.
With COVID-19 vaccine distribution still a domestic priority (especially among Democrats), majorities of the public also say the U.S. should take at least a “major role” when it comes to distributing COVID-19 vaccines internationally. Views of the U.S.’s role in distributing vaccines differs by party, with nearly nine in ten Democrats in support of the U.S. taking at least a major role while more than half of Republicans say the U.S. should take a “minor role” or “no role at all.” Attitudes shift in favor of U.S. involvement when the public is told that distributing COVID-19 vaccines can help other countries without hurting the U.S.’s own supply, that the coronavirus outbreak is worse in other countries and they need access to the vaccines in order to stop the spread of the virus, or that providing vaccines to other countries could help the U.S. achieve immunity necessary to curb the pandemic.
Health Care Priorities For Congress
On May 28th President Biden unveiled his $6 trillion budget for the following fiscal year, with broad calls on Congress to create a public option, lower the Medicare eligibility age to 60, lower prescription drug costs for people with Medicare and job-based coverage, and lower ACA deductibles. The plan also includes making permanent the 2-year financial assistance offered to people who buy their plans on the marketplace that was part of the COVID relief bill. The latest KFF Health Tracking Poll asks the public how much of a priority these, along with other health care priorities, are for Congress to focus on in the coming months and finds majorities saying each is at least an important priority and few (less than one five) saying each of the health priorities “should not be done.”
About nine in ten U.S. adults say allowing federal government negotiations with drug companies to get a lower price on prescription drugs (92%), allowing state governments to negotiate lower drug prices (89%), expanding Medicare coverage to include hearing aids, dental and vision coverage (90%), and placing a limit on out-of-pocket costs that seniors have to pay each year for things like prescription drugs (88%) are “top priorities” or an “important, but not top priorities.” At least seven in ten say continuing efforts to make sure U.S. residents are able to receive a COVID-19 vaccine (81%), expanding government health insurance coverage for lower-income people in non-expansion states (78%), and creating a government-administered public option that would be available to all Americans (71%) are at least important for Congress to work on. A slightly smaller share, but still a majority, say lowering the age of Medicare eligibility from 65 to 60 (66%) and making permanent the two-year expansion of additional financial help for people who buy their own insurance from the COVID relief bill (64%) are important priorities.
While majorities of the public say each of the health care priorities asked about are at least an important one for Congress to work on, proposals aimed at lowering prescription drug prices are a top priority for Democrats, independents, and Republicans. Majorities, across partisans, say both allowing the federal government and private insurance to negotiate for lower prices on prescription drugs and allowing states to negotiate with drug companies should be a “top priority for Congress.” Majorities of Democrats (66%), independents (56%), and Republicans (58%) also say placing a limiting on out-of-pocket costs like prescription drug costs for seniors is a “top priority.”
Other health proposals asked about in the survey, including continuing efforts to make sure U.S. residents are able to receive a COVID-19 vaccine, expanding government health insurance coverage for lower-income people in non-expansion states, and expanding Medicare coverage to include hearing aids, dental and vision coverage, are viewed as top priorities by majorities of Democrats, but by smaller shares of Republicans.
Expanding Government’s Role In Providing Health Insurance
While President Biden campaigned on creating a government public option that would compete with private insurance and be available to all Americans, more recently he has expressed support for expanding government insurance by lowering the age of eligibility for Medicare. Both of these proposals are more incremental efforts to expand the government’s role in health coverage than the hotly contested Medicare-for-all proposal that dominated much of the 2020 Democratic presidential primary. Previous KFF polling has found that while Medicare-for-all is favored by a majority of Democrats and independents, a public option garners support among four in ten Republicans (in addition to large majorities of Democrats and independents) and lowering the age of eligibility for Medicare garners bipartisan support (85% of Democrats, 75% of independents, and 69% of Republicans).
The latest KFF polling finds that while older adults, especially Republicans, are less likely to prioritize these policy proposals, both of these proposals aimed at expanding the government’s role in health insurance are important priorities among younger populations. About seven in ten Democrats 18-49 years old saying creating a public option is a top priority, compared to 58% of Democrats 50 and older. Lowering the age for Medicare eligibility is also an important priority for Democrats but with lower shares saying it is a top priority (eight in ten 18-49 year olds say it is at least an important priority as do about three-fourths of Democrats 50 and older). Both of these proposals also have support among younger Republicans (18-49 years old) with at least half saying each is at least an important priority.
Views of The Aca Remain Partisan
More than 11 years after the ACA was signed into effect, views of the 2010 health care law remain politically partisan. The latest KFF Health Tracking poll finds a larger share of the public hold favorable views of the law than unfavorable ones (53% vs. 35%), but still only a slight majority of the public view the law favorably.
Views of the ACA are still largely driven by party identification with vast majorities of Democrats (85%) expressing support for the legislation while 77% of Republicans view the law unfavorably. A larger share of independents view the law favorably (54%) than unfavorably (32%). This has remained largely unchanged over the past 5 years with more than seven in ten Republicans expressing unfavorable views of the ACA since the 2015 King v. Burwell challenge to the law. In comparison, majorities of Democrats, independents, and Republicans view both Medicare and Medicaid favorably.
Financial Assistance for People Who Purchase Their own health Insurance
The COVID relief bill passed in early March 2021 provided additional financial help for people who buy their own health insurance coverage. The vast majority of those likely eligible for this financial assistance are either unsure whether the COVID-19 relief package included this financial assistance (81%) or say that it did not happen (11%). Less than one in ten (7%) are aware of this increased financial assistance. Additionally, only a small minority of those potentially eligible for additional financial help or coverage have reported going online to see if they qualify for a different or cheaper health insurance plan. Among those under 65 years old, nine percent of those who are either uninsured or buy their own coverage report going online in the past two months to see if they qualify for a different or cheaper health insurance plan or Medicaid as part of the COVID relief package.
Prescription Drug Costs and Regulation
Throughout this spring, Democratic lawmakers have discussed allowing the Department of Health and Human Services to negotiate the prices of brand-name drugs. While this proposal is opposed by most Republican lawmakers, the latest KFF Health Tracking Poll finds it supported by a majority of the public, regardless of party identification.
Overall, nearly nine in ten (88%) favor allowing the federal government to negotiate for lower prices on medications, including three-fourths (77%) of Republicans, nine in ten Independents (89%) and 96% of Democrats. Nearly nine in ten across age groups favor the proposal. This pattern is consistent with previous KFF polling conducted prior to the pandemic in which 90% of Democrats, 87% of independents, and 80% of Republicans favored this proposal.
Despite widespread support for allowing the federal government to negotiate drug prices, public opinion can change in the course of a national debate and certain messages can dampen support for this proposal. Support starts high and remains high (90%) when people hear that people could save money on their prescription drugs if this policy were implemented. Eight in ten (81%) say that they favor this proposal after hearing that the federal government could save money if they were allowed to negotiate for lower drug prices for people on Medicare. However, opposition to this policy proposal rises to about two-thirds when the public hears assertions that this proposal could lead to less research and development for new drugs, or that access to newer prescriptions could be limited.
Both of the arguments against allowing the federal government to negotiate with drug companies are effective across partisanship, with support for the proposal dropping among Democrats to as low as 39% and among Republicans to 24% (both down more than fifty percentage points) after these arguments are read.
What Does The Public Think Drives Prescription Drug Costs?
The public sees profits made by pharmaceutical companies as the largest factor contributing to the price of prescription drugs. About eight in ten across partisans say profits made by pharmaceutical companies are a “major factor” in the price of prescription drugs. This is followed by about seven in ten (68%) who say the cost of research and development is a “major factor” contributing to the price, and about half (52%) saying that the cost of marketing and advertising is a major contributing factor to the cost of prescription drugs.
Despite the introduction of the three FDA authorized vaccinations for emergency use for COVID-19 and increased attention on the research and development component of pharmaceutical companies, the share of the public who say the cost of research and development is a “major factor” contributing to the price of prescription drugs has remained relatively unchanged since 2019, when eight in ten said “profits made by pharmaceutical companies”, seven in ten (69%) said “the cost of research and development” and half (52%) said the “cost of marketing and advertising” were major factor in the price of prescription drugs. The latest KFF Health Tracking Poll finds that patterns across partisans have remained stable from 2019.
The latest KFF Health Tracking Poll finds about two-thirds (63%) say there is “not as much regulation as there should be” for limiting the price of prescription drugs, while about half (48%) say there is “about the right amount” of regulation of pharmaceutical companies for making sure prescription drugs are safe for people to use. Few say there is “too much regulation” on either limiting the price (10%) or making sure they are safe for people to use (8%).
Majorities across partisans, including seven in ten Democrats, 65% of independents and nearly six in ten Republicans (57%), say there is “not as much regulation as there should be” when it comes to limiting the price of prescription drugs. Partisans are also similar in their views on regulation to make sure prescription drugs are safe for people to use. A slight majority Democrats (56%) say there is “about the right amount of regulation” on safety of prescription drugs as do nearly half (47%) of Republicans who say the same. Few across partisans say there is “too much” of either type of regulation.
This is only a slight shift from previous KFF polling before the coronavirus pandemic, when the share of the public who say there is “not as much regulation as there should be” on safety was 44% (down to 39% in the most recent poll). The main shift has occurred among Democrats with a majority now saying there is “about the right amount of regulation” while back in 2019, about half had said there is “not as much as there should be.”
U.S. Role In Distributing COVID-19 Vaccines To Foreign Countries
The Biden administration recently announced that by the end of June it would share 80 million COVID-19 vaccine doses with other countries, making it the largest single government donor of vaccines globally so far. The U.S. is also the largest donor to COVAX, the internationally coordinated effort to purchase and distribute vaccines worldwide. A majority of the public (66%) says that when it comes to distributing COVID-19 vaccines to other countries, the U.S. should take a “leading role” (27%) or a “major role” (39%). Views of the U.S.’s role in distributing vaccines differs by party, with nearly nine in ten Democrats in support of the U.S. taking a at least a major role (87%), while Republicans are more split, with more than half saying the U.S. should take a “minor role” (34%), or take “no role at all” (24%).
After hearing more information about the U.S. distribution of COVID-19 vaccines to other countries, larger shares of the public say that the U.S. should take at least a major role. At least three in four U.S. adults say they think the U.S. should play at least a major role after hearing that the U.S. has enough supply of the COVID-19 vaccines to help other countries without hurting its own supply (78%), the coronavirus outbreak is worse in other countries and they need access to the vaccines in order to stop the spread of the virus (77%), or that providing vaccines to other countries could help the U.S. achieve immunity necessary to curb the pandemic (76%).
Each of these messages shift attitudes across partisans, including among Republicans. After hearing each of these messages, at least half of Republicans say the U.S. should take a leading or major role in vaccine distribution. Most notably, six in ten Republicans say the U.S. should take a leading or major role after hearing that the U.S. has enough supply to help other countries without hurting itself.
Methodology
This KFF Health Tracking Poll was designed and analyzed by public opinion researchers at the Kaiser Family Foundation (KFF). The survey was conducted May 18-May 25, 2021, among a nationally representative random digit dial telephone sample of 1,526 adults ages 18 and older (including interviews from 327 Hispanic adults and 307 non-Hispanic Black adults), living in the United States, including Alaska and Hawaii (note: persons without a telephone could not be included in the random selection process). Phone numbers used for this study were randomly generated from cell phone and landline sampling frames, with an overlapping frame design, and disproportionate stratification aimed at reaching Hispanic and non-Hispanic Black respondents. Stratification was based on incidence of the race/ethnicity subgroups within each frame. Specifically, the cell phone frame was stratified as: (1) High Hispanic: Cell phone numbers associated with rate centers from counties where at least 35% of the population is Hispanic; (2) High Black: Cell phone numbers associated with remaining rate centers from counties where at least 35% of the population is non-Hispanic Black; (3) Else: numbers from all remaining rate centers. The landline frame was stratified as: (1) High Black: landline exchanges associated with Census block groups where at least 35% of the population is Black; (2) Else: all remaining landline exchanges. The sample also included 162 respondents reached by calling back respondents that had previously completed an interview on the KFF Tracking poll at least nine months ago. Another 134 interviews were completed with respondents who had previously completed an interview on the SSRS Omnibus poll (and other RDD polls) and identified as Hispanic (n = 46; including 19 in Spanish) or non-Hispanic Black (n=88). Computer-assisted telephone interviews conducted by landline (248) and cell phone (1,278, including 963 who had no landline telephone) were carried out in English and Spanish by SSRS of Glen Mills, PA. To efficiently obtain a sample of lower-income and non-White respondents, the sample also included an oversample of prepaid (pay-as-you-go) telephone numbers (25% of the cell phone sample consisted of prepaid numbers) Both the random digit dial landline and cell phone samples were provided by Marketing Systems Group (MSG). For the landline sample, respondents were selected by asking for the youngest adult male or female currently at home based on a random rotation. If no one of that gender was available, interviewers asked to speak with the youngest adult of the opposite gender. For the cell phone sample, interviews were conducted with the adult who answered the phone. KFF paid for all costs associated with the survey.
The combined landline and cell phone sample was weighted to balance the sample demographics to match estimates for the national population using data from the Census Bureau’s 2019 U.S. American Community Survey (ACS), on sex, age, education, race, Hispanic origin, and region, within race-groups, along with data from the 2010 Census on population density. The sample was also weighted to match current patterns of telephone use using data from the January- June 2020 National Health Interview Survey The weight takes into account the fact that respondents with both a landline and cell phone have a higher probability of selection in the combined sample and also adjusts for the household size for the landline sample, and design modifications, namely, the oversampling of potentially undocumented respondents and of prepaid cell phone numbers, as well as the likelihood of non-response for the re-contacted sample. All statistical tests of significance account for the effect of weighting.
The margin of sampling error including the design effect for the full sample is plus or minus 3 percentage points. Numbers of respondents and margins of sampling error for key subgroups are shown in the table below. For results based on other subgroups, the margin of sampling error may be higher. Sample sizes and margins of sampling error for other subgroups are available by request. Note that sampling error is only one of many potential sources of error in this or any other public opinion poll. Kaiser Family Foundation public opinion and survey research is a charter member of the Transparency Initiative of the American Association for Public Opinion Research.