- Health centers served about 32.7 million patients in 2025, a slight increase from 32.4 million patients in 2024. Nine in ten health center patients lived in low-income households, over six in ten were people of color, and three in ten lived in rural areas.
- About half of health center patients were covered by Medicaid while 23% had private insurance (including Affordable Care Act (ACA) Marketplace coverage) and 17% were uninsured. The number of health center patients covered by Medicaid decreased slightly in 2025, reflecting the decline in national Medicaid enrollment in 2025. At the same time, the number of privately insured and Medicare patients increased.
- Medicaid was the largest revenue source for health centers, accounting for 46% of the $55.4 billion in total health center revenue in 2025. Health center revenue increased in 2025 due to growing patient volume and revenue from payers.
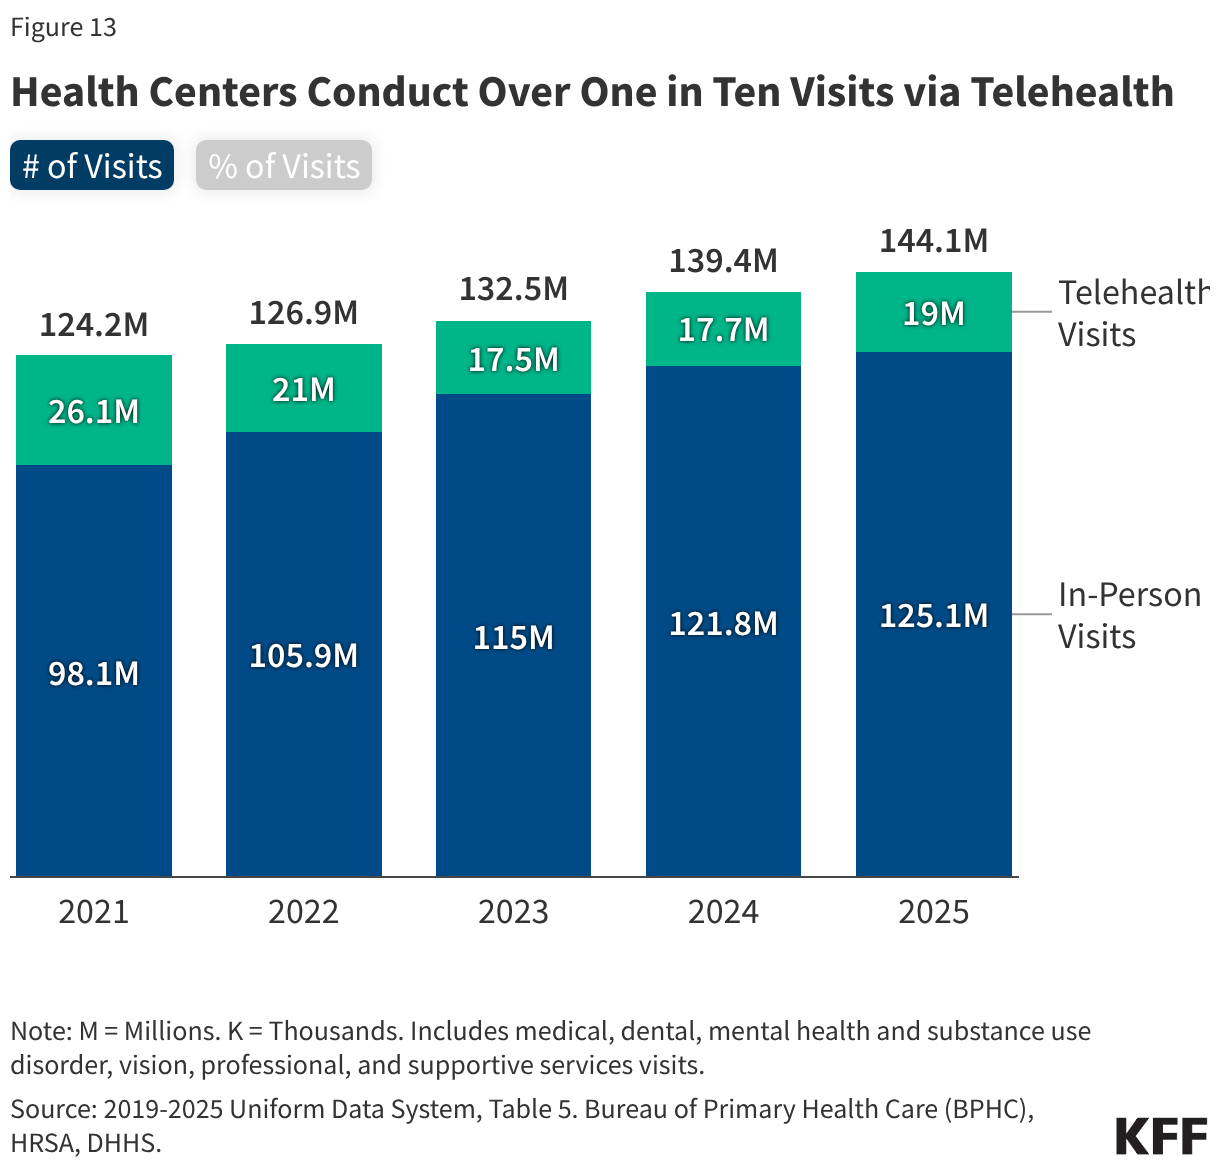
- Of the more than 144 million patient visits in 2025, 64% were for medical services, 15% were for mental health and substance use disorder (SUD) services, and 12% were for dental care. The share of health center visits (13%) conducted via telehealth remained steady from 2024, with nearly 19 million telehealth visits in 2025.
- Health centers face a number of challenges amid significant federal policy changes and funding uncertainty. Changes to Medicaid and the ACA Marketplace included in the 2025 reconciliation law and the expiration of ACA Marketplace enhanced premium tax credits at the end of 2025 are expected to increase the number of uninsured patients, placing new financial burdens on health centers. At the same time, health centers face ongoing financial uncertainty. Congress recently passed a continuing resolution funding the government through December 11, 2026, which will also delay passing annual discretionary health center funding until after the midterm elections.
Community Health Center Patients, Financing, and Services
Community health centers are a national network of nearly 1,400 safety-net primary care providers that served more than 32.7 million patients in 2025. They are located in medically underserved urban and rural communities and provide comprehensive primary care, mental health, and supportive services to patients regardless of their ability to pay. This brief reports on health center patients, services, and financing in 2025 and analyzes changes over time using national data from the Uniform Data System (UDS), to which all health centers are required to report annually, though indicators vary across states.
Introduction
Key Takeaways
Health Center Patients
Health Center Organizations
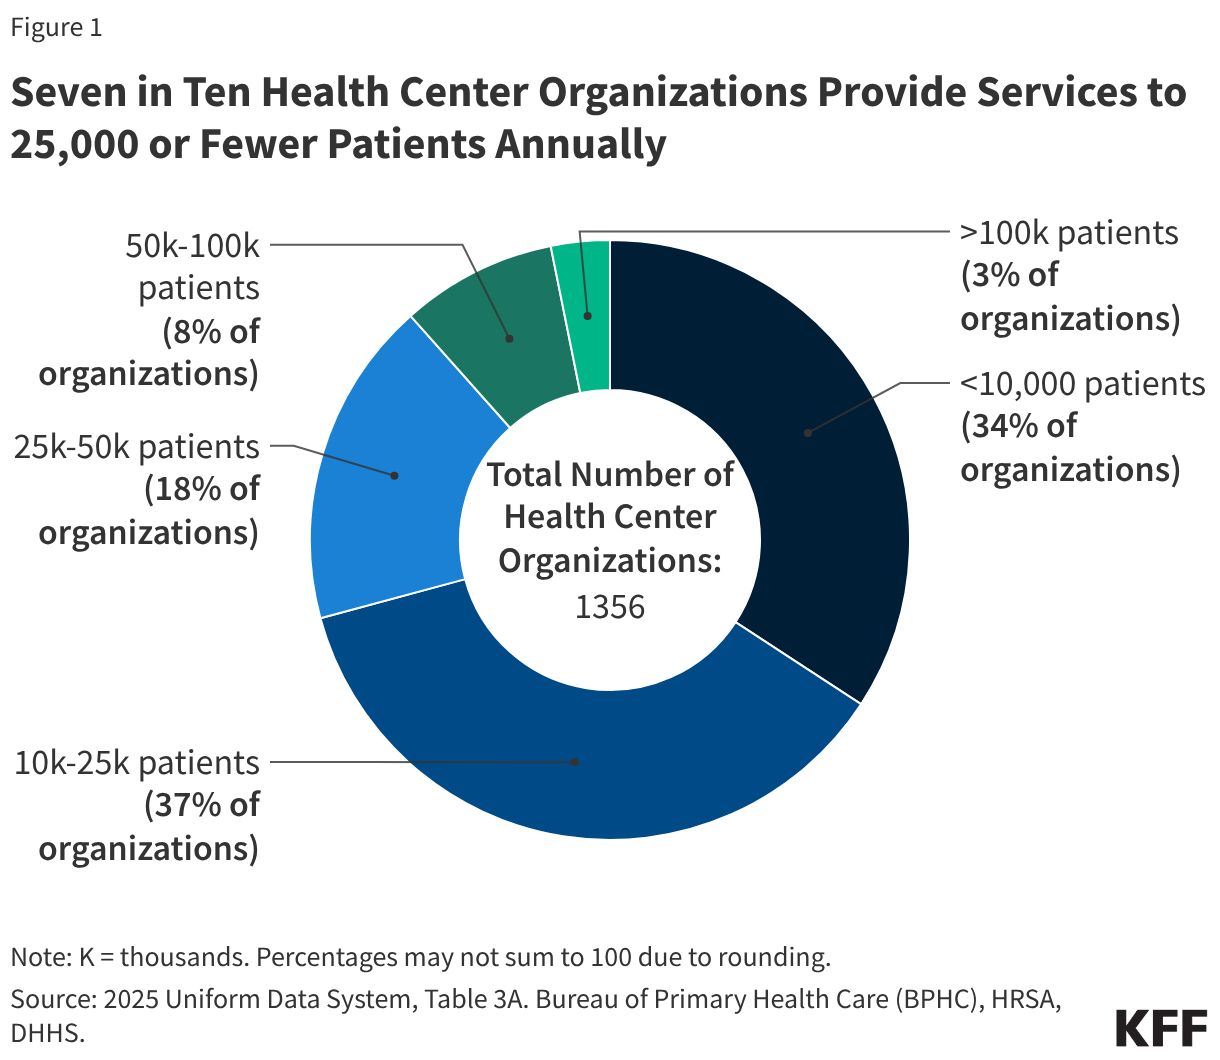
In 2025, 1,356 health center organizations provided care at over 16,600 service delivery sites (Figure 1). Roughly six in ten health centers served patients in medically underserved urban areas, while four in ten served rural communities. Seven in ten (71%) health centers provided services to 25,000 or fewer patients while 3% of health centers served 100,000 or more patients in 2025. Generally, smaller health centers are located in rural areas or focus services on certain neighborhoods or populations, while larger health centers tend to serve urban areas and operate multiple clinic locations. In addition to traditional clinic locations, health center sites included those in locations such as schools, homeless shelters, mobile sites, and other seasonal sites.
Patient Demographics
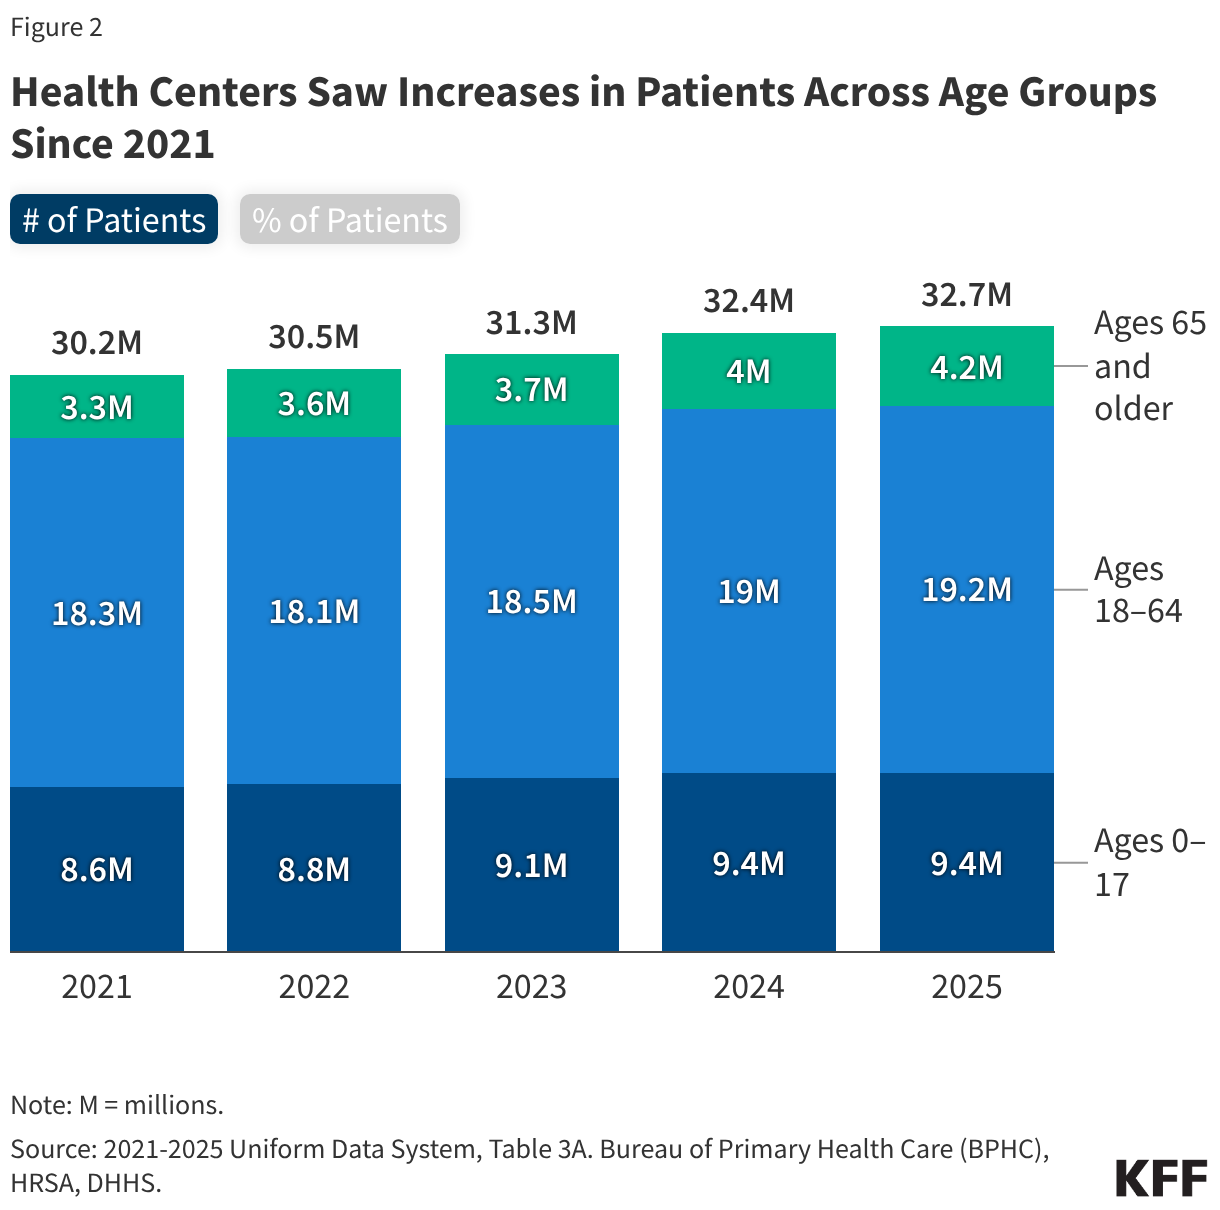
Over 32.7 million patients received services at health centers in 2025, an increase of about 1% from 2024 and 8% from 2021 (Figure 2). Health centers served 9.4 million children in 2025, about the same as in 2024, and children accounted for 29% of health center patients. Adults ages 18–64 accounted for 59% of health center patients, while adults ages 65 and older accounted for 13%. Although still a small share of the total health center patient population, the number of adult patients ages 65 and older served at health centers grew by 27%, or nearly 900,000, between 2021 and 2025, compared with growth of 8% among children and 5% among adults ages 18–64 during the same period.
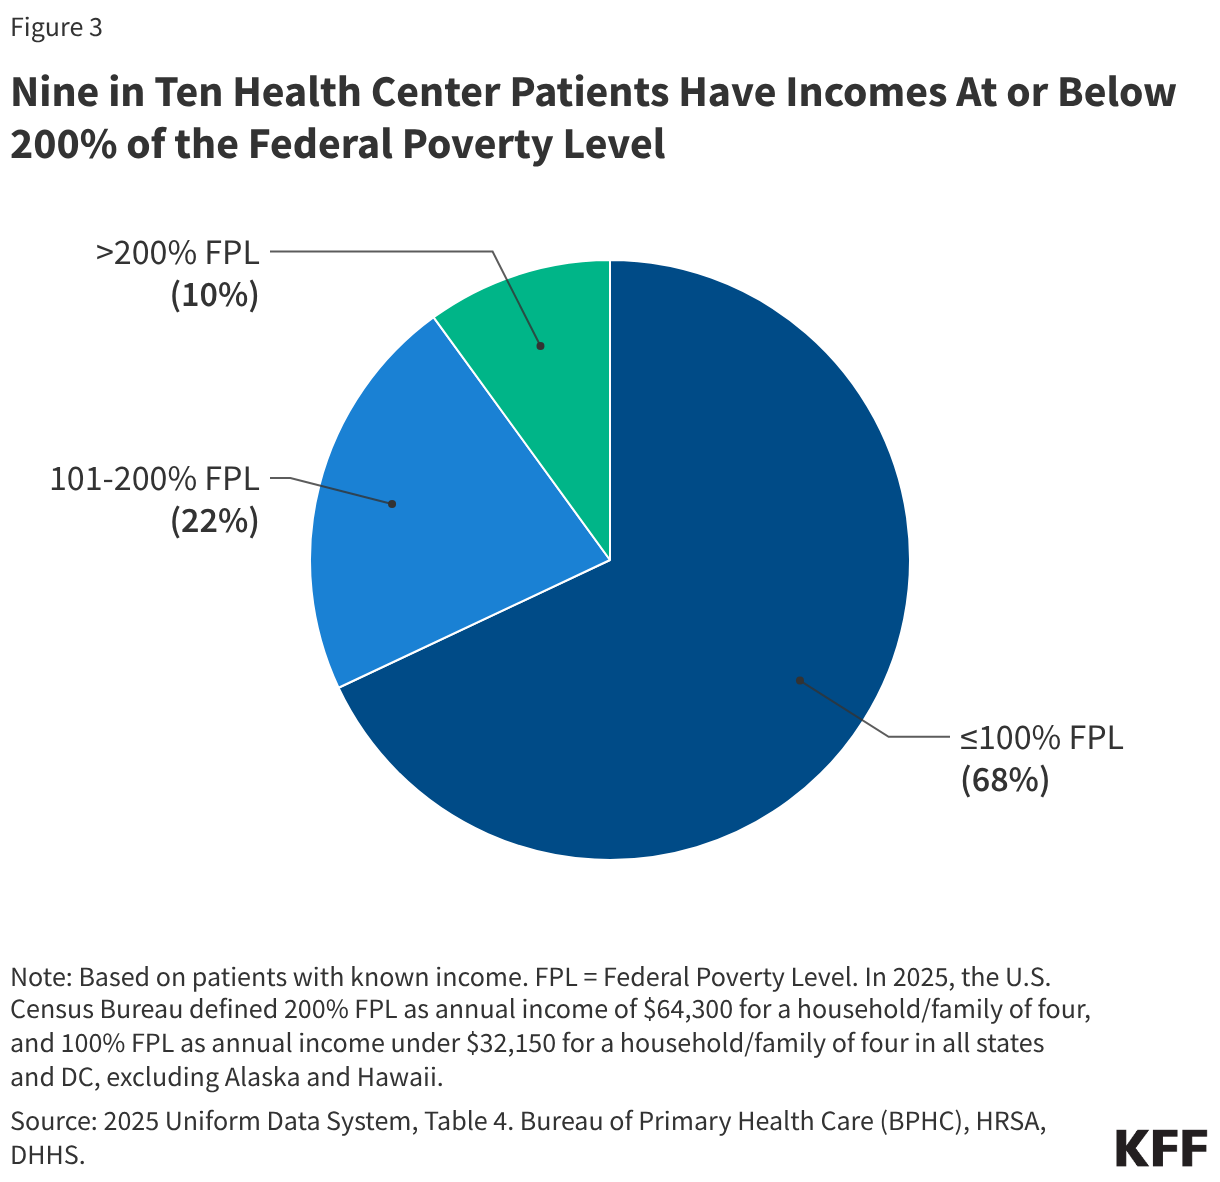
A majority of health center patients lived in low-income households in 2025 (Figure 3). Reflecting the mission of health centers to serve anyone regardless of ability to pay, nine in ten (90%) patients served at health centers had incomes that were at or below 200% of the federal poverty level (FPL) and two-thirds of patients (68%) had incomes at or below the poverty level (the poverty level was $32,150 for a family of four in 2025). The share of health center patients with incomes at or below 200% FPL was over three times the corresponding share of the U.S. population, 27% of whom had household incomes under 200% FPL in 2024.
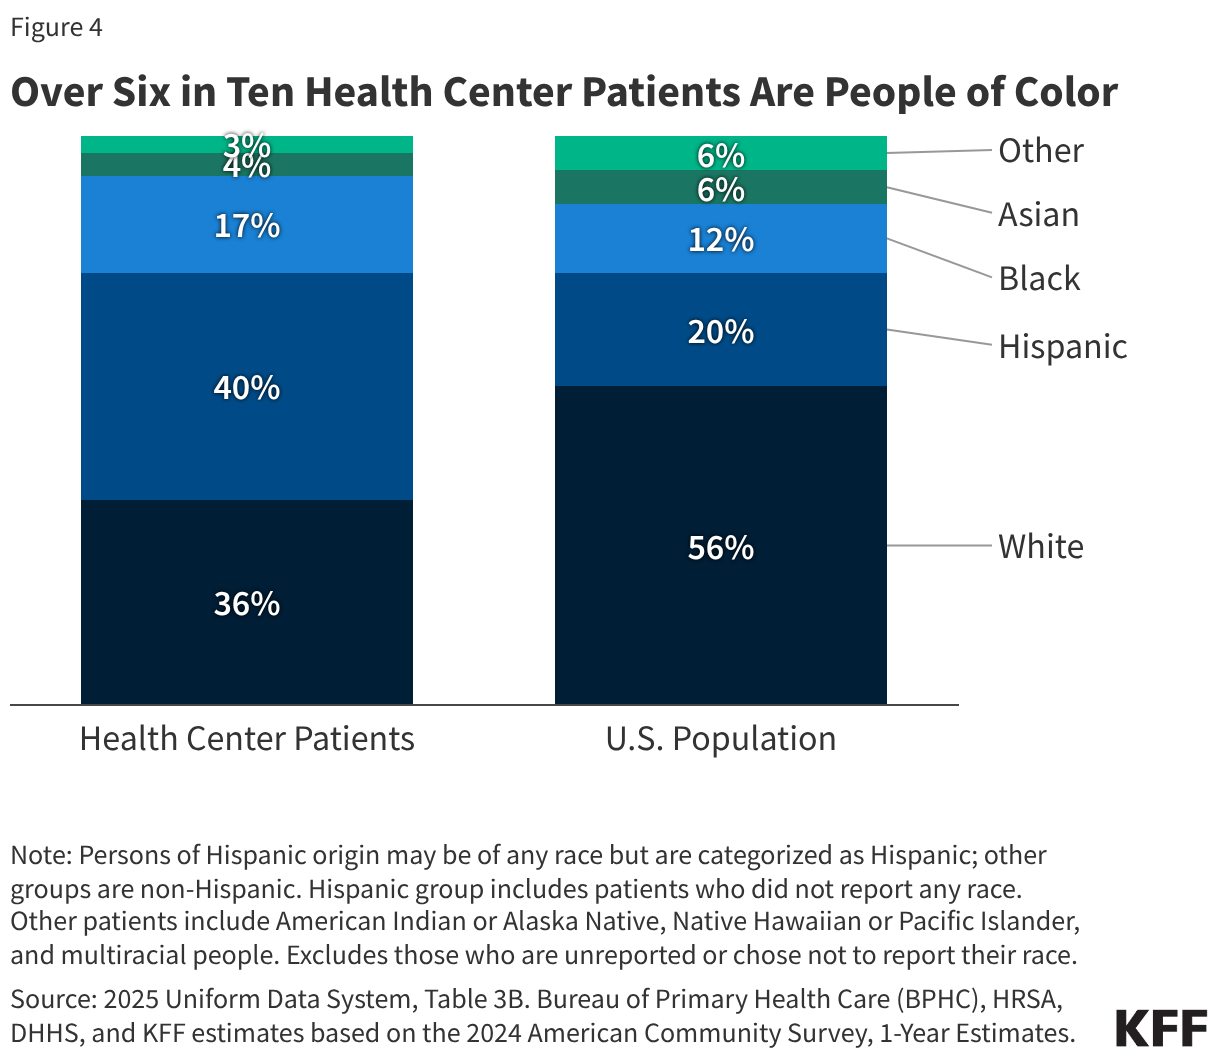
In 2025, most health center patients (64%) were people of color, greater than their share of the total U.S. population (Figure 4). Across all health centers, Hispanic patients made up the largest share of patients at 40%, followed by White patients (36%), Black patients (17%), Asian patients (4%), and all other patients (3%). Compared with their share of the total U.S. population, health centers served larger shares of Black and Hispanic patients, and smaller shares of White patients.
Special Patient Populations
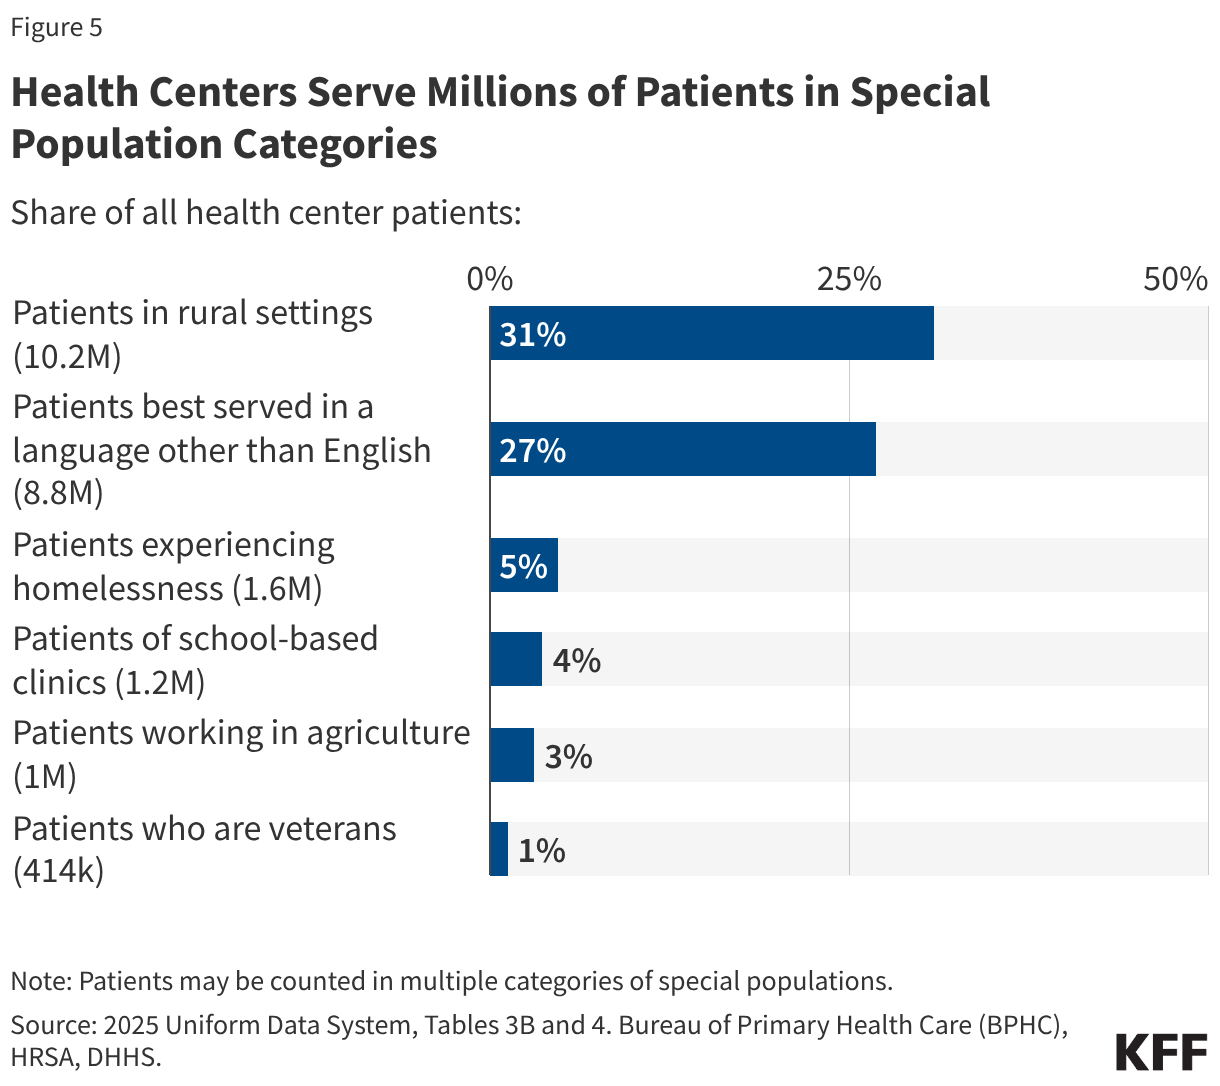
Health centers served millions of patients who were part of special populations with distinct health needs in 2025 (Figure 5). The Health Resources and Services Administration (HRSA), which administers the health center program, provides targeted funding for health centers that serve certain populations identified as underserved by the federal government, including people experiencing homelessness and migratory agricultural workers. In 2025, health centers served 1.6 million patients experiencing homelessness (5% of all patients), 1.2 million patients in school-based health centers (4% of all patients), 1 million agricultural workers (3% of all patients), and 414,000 veterans (1% of all patients). In addition, health centers are required to report data on other populations with known challenges accessing primary care. For example, three in ten patients (31% or 10.2 million) were rural residents, which is higher than the 20% of the U.S. population living in rural areas, and nearly three in ten patients (27% or 8.8 million) were best served in a language other than English.
Health Coverage of Health Center Patients
Trends in Health Coverage
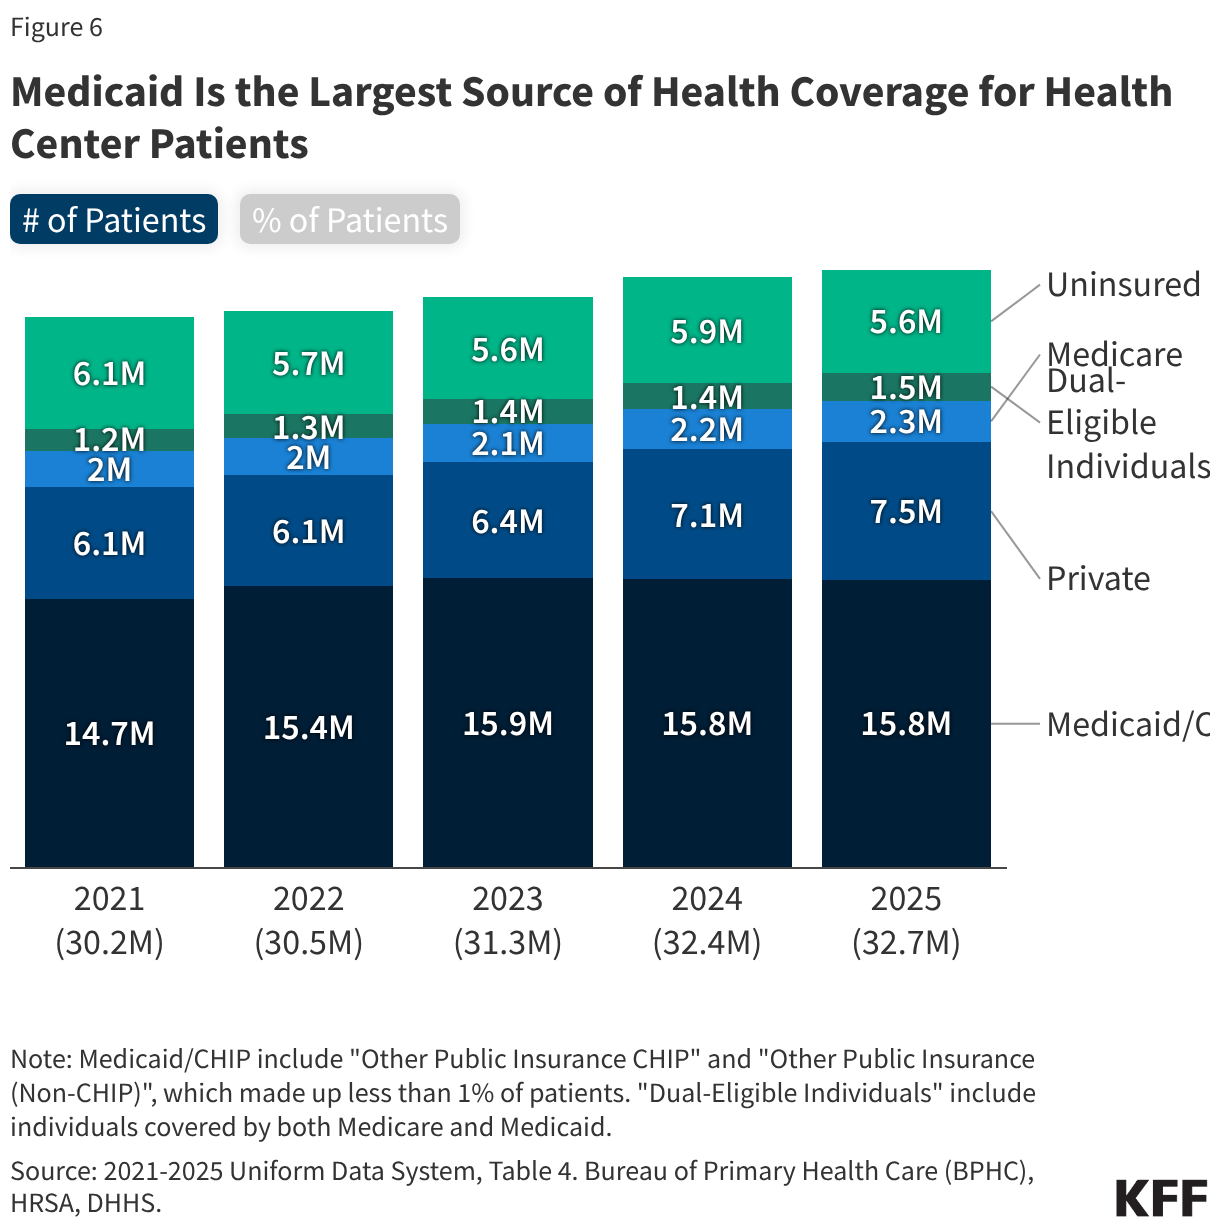
Medicaid remained the largest source of health coverage among health center patients in 2025 (Figure 6). Over eight in ten (83%) health center patients had health insurance coverage in 2025. Nearly half (48%) of health center patients were covered by Medicaid while 23% of patients had private insurance (including ACA Marketplace coverage), 7% had Medicare coverage, and 5% were dual-eligible patients who had both Medicare and Medicaid coverage. Medicare is likely the primary payer for health center services among dual-eligible patients, but Medicaid may cover the costs for dental services and some mental health or substance use disorder services. Nearly one in five (17%) health center patients were uninsured. From 2024 to 2025, the number of patients with private coverage increased by over 6% (437,000), driven by a record increase in Marketplace enrollment because of the continued availability of temporary enhanced premium tax credits that were extended through December 2025. At the same time, the number of Medicaid patients dropped by 49,000 or less than 1%, declining for the second straight year and reflecting continued declines in national Medicaid enrollment following the unwinding of the Medicaid continuous enrollment provision that was put in place during the COVID-19 pandemic.
Medicaid Coverage of Health Center Patients by State
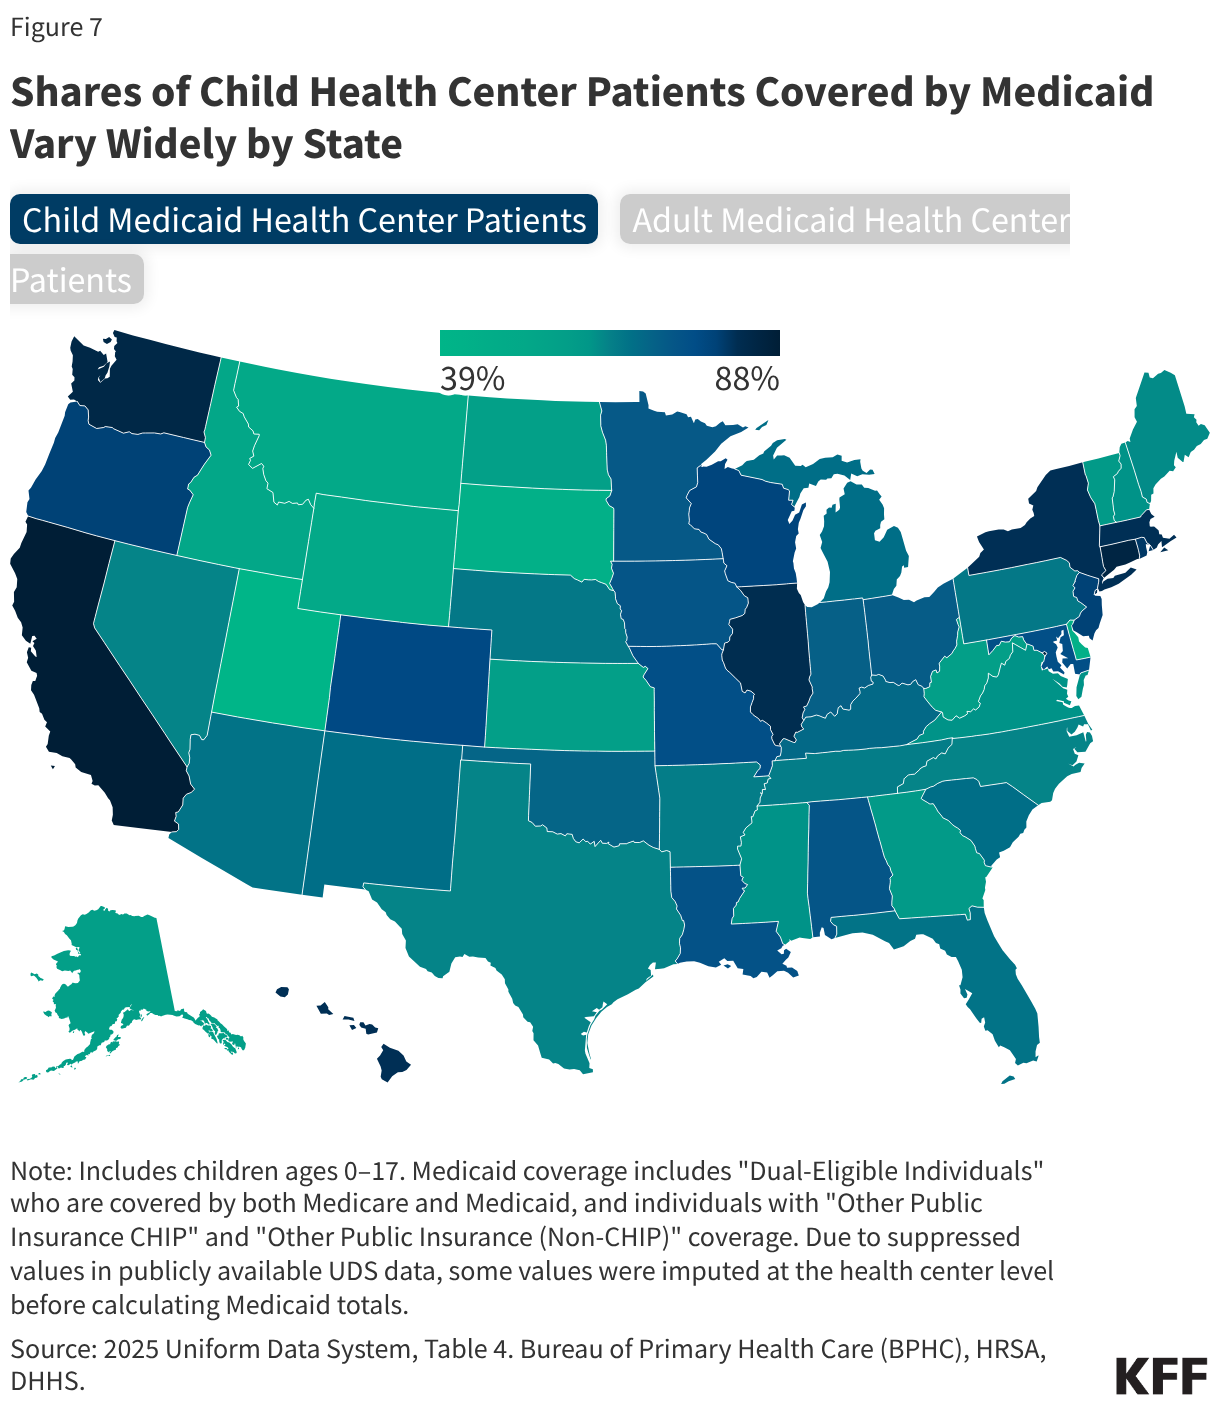
While Medicaid is an important source of coverage for health center patients, the share of child and adult health center patients covered by Medicaid varied widely by state in 2025 (Figure 7). Nationwide, about 6.9 million (74%) child health center patients ages 0–17 and 10.4 million (44%) adult health center patients ages 18 and older were covered by Medicaid and the Children’s Health Insurance Program (CHIP), including dual-eligible health center patients who had both Medicare and Medicaid coverage. The share of child health center patients covered by Medicaid ranged from less than 50% in three states to 80% or more in nine states, including DC, while the share of adult health center patients covered by Medicaid was less than 20% in six states and more than half in eight states, including DC. This variation likely reflects a mix of factors such as the types of health centers in the state, characteristics of the health center patient populations, and state Medicaid expansion status.
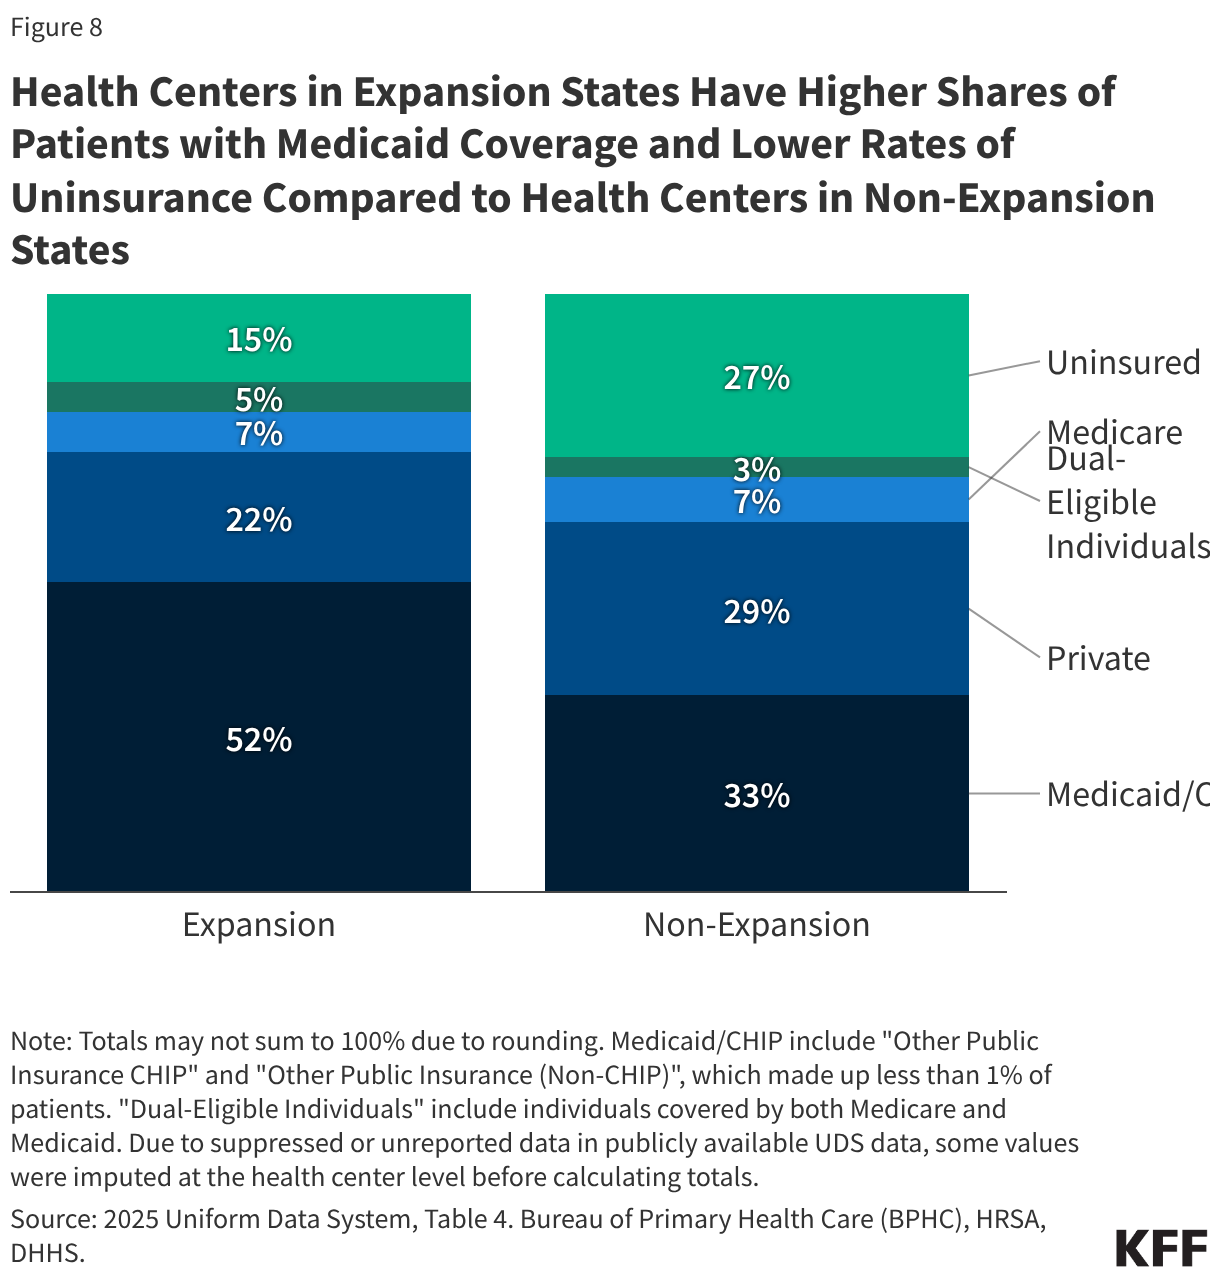
Health centers in Medicaid expansion states had higher shares of patients covered by Medicaid and lower shares of patients who were uninsured than those in non-expansion states in 2025. Health centers in expansion states had higher shares of patients covered by Medicaid (52% vs. 33%) and lower shares of patients who were uninsured (15% vs. 27%) compared with health centers in non-expansion states (Figure 8). Medicaid expansion is linked to reduced rates of uninsurance, increased health care affordability, improvements in access and health outcomes, and economic benefits for states and providers.
Health Center Financing and Costs
Health Center Revenue
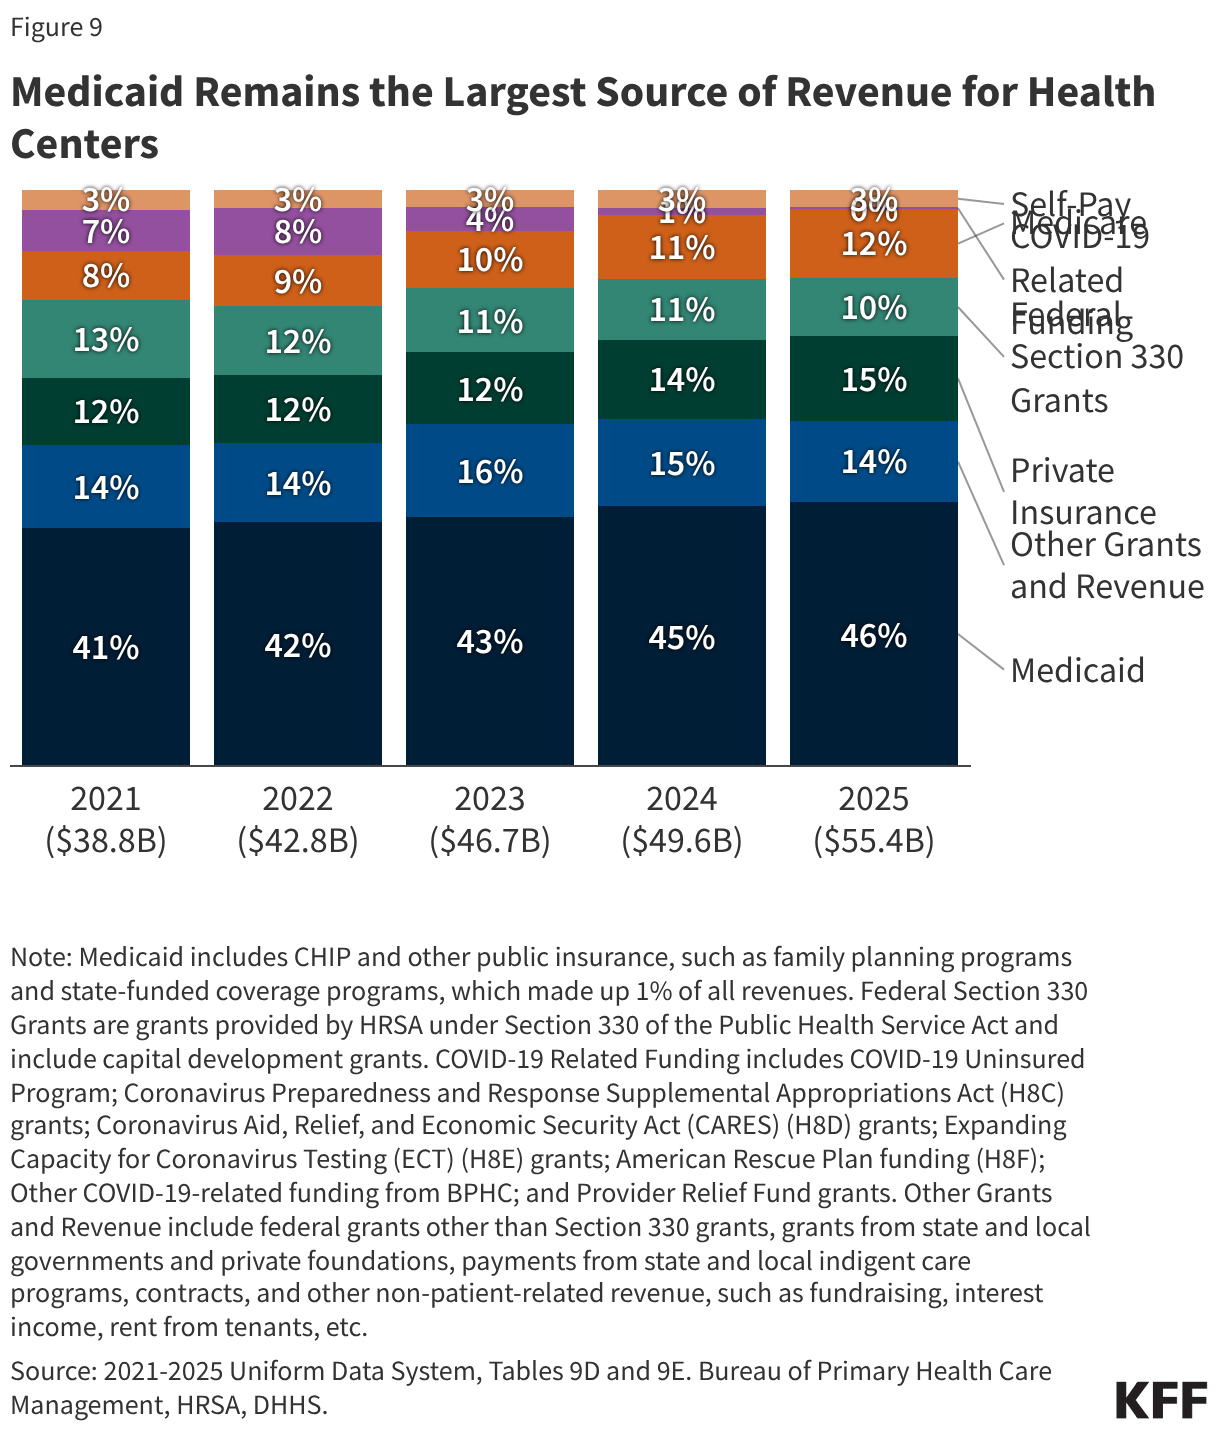
Health center revenue continued to increase in 2025 due to growing patient volume and revenue from payers. In 2025, total health center revenue was $55.4 billion, an increase of 12% from $49.6 billion in 2024 (Figure 9). Over three quarters (76%) of health center revenue came from payments from Medicaid, private insurance, Medicare, and self-pay patients, with Medicaid accounting for over 60% of patient care revenue and 46% of total revenue. Federal Section 330 grant funding, which supports health centers’ role as safety net providers, made up 10% of total revenue while other grants and contracts accounted for 14%. From 2021 to 2025, patient care revenue increased as a share of total revenue from 65% to 76%. At the same time, federal Section 330 grants decreased as a share of total revenue from 13% in 2021 to 10% in 2025.
Per-Patient Revenue
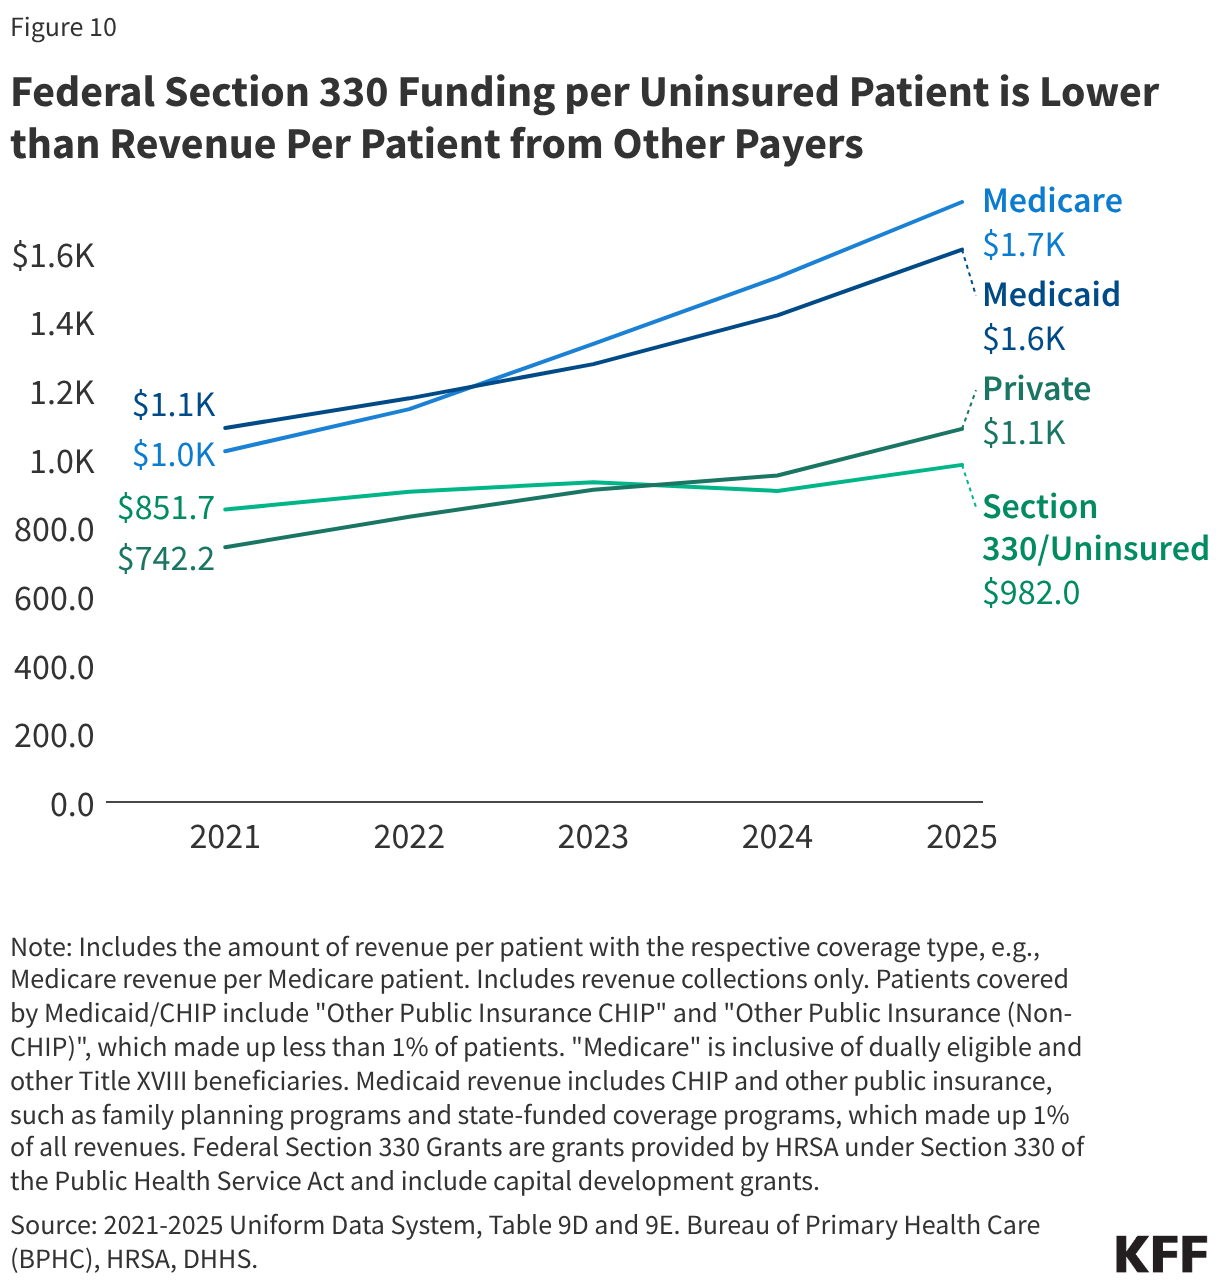
Federal Section 330 funding per uninsured patient remained lower than per-patient revenue from other payers in 2025 (Figure 10). Federal Section 330 grants support ongoing care to the uninsured, although Section 330 grants are not tied directly to the number of uninsured patients health centers serve and may vary widely between health centers. In 2025, Federal Section 330 funding per uninsured patient ($982) was lower than per-patient revenue from Medicare ($1,748), Medicaid ($1,609), and private insurance ($1,087). From 2021 to 2025, growth in Section 330 funding per uninsured patient (15%) was lower than the growth in per-patient revenue from Medicare (71%), Medicaid (48%), and private insurance (46%).
Health Center Costs
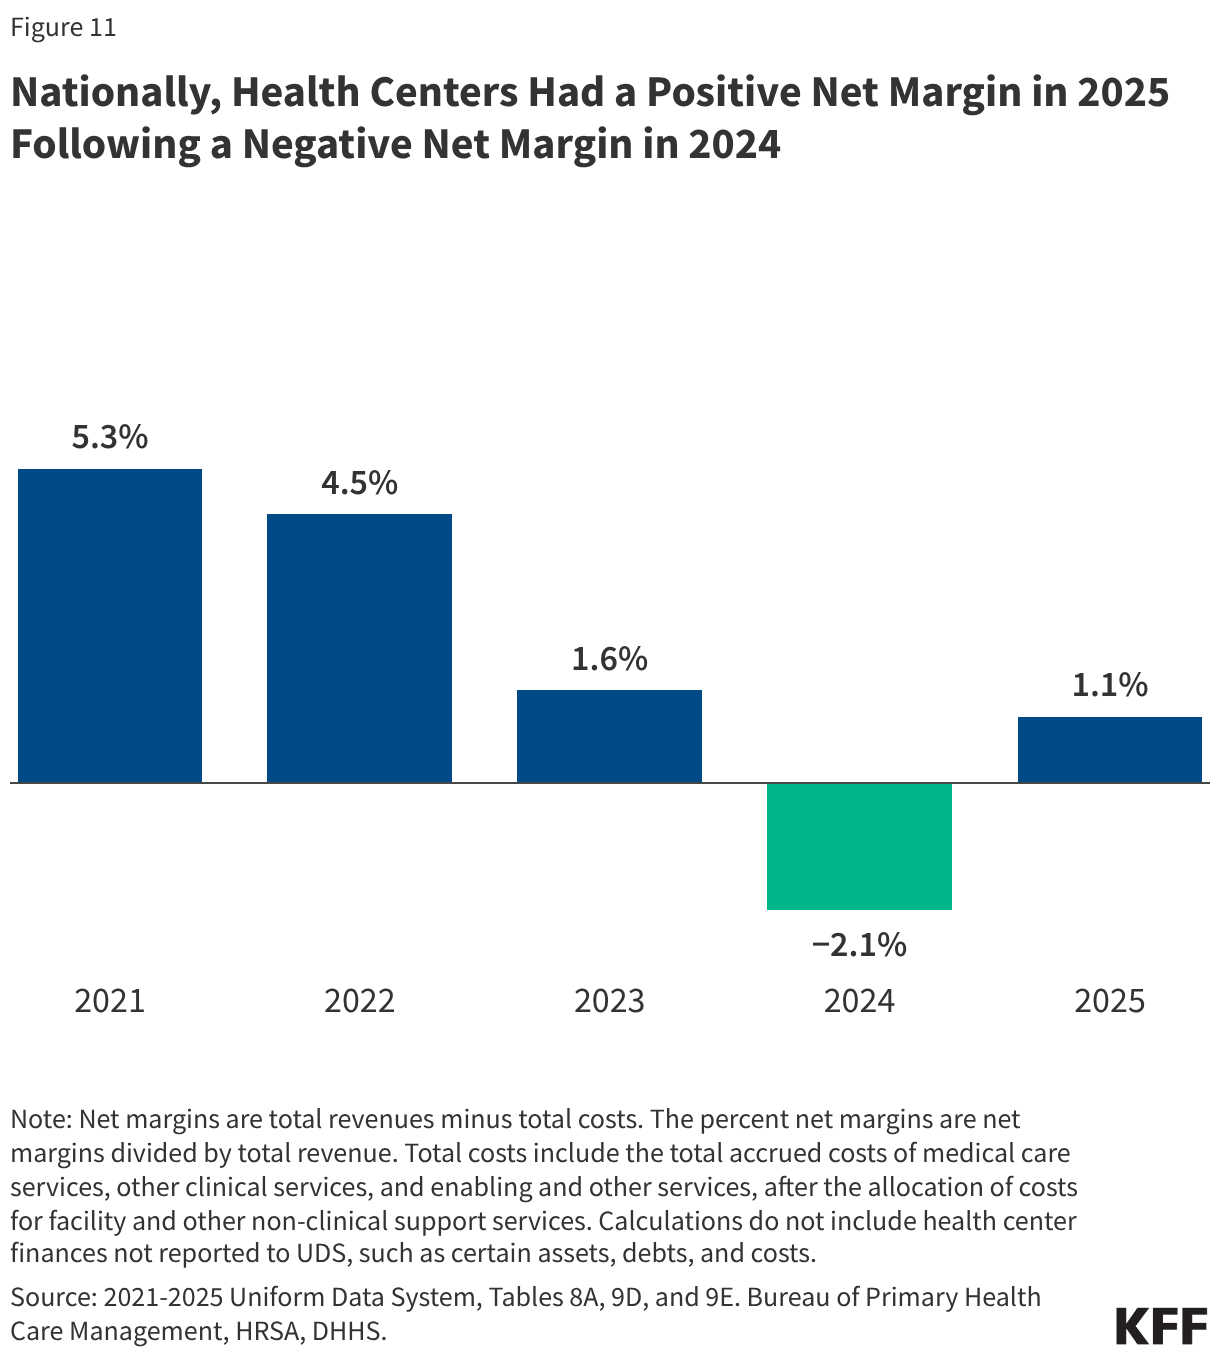
National health center net margins were 1.1% in 2025, following a negative net margin in 2024 (Figure 11). Net margins account for both costs and revenue and are reported as a percentage of revenue. Increased COVID-related and other supplemental funding during the pandemic drove the strong positive net margins seen among health centers from 2021 through 2022. The negative net margin in 2024 reflected higher costs, an increase in the number of uninsured patients, and the expiration of COVID-19 funding. Net margins will vary by health center depending on factors such as their share of uninsured patients, operating costs, the amount of competitive federal grant funding they are awarded, and other sources of revenue.
Health Center Services and Workforce
Health Center Visits
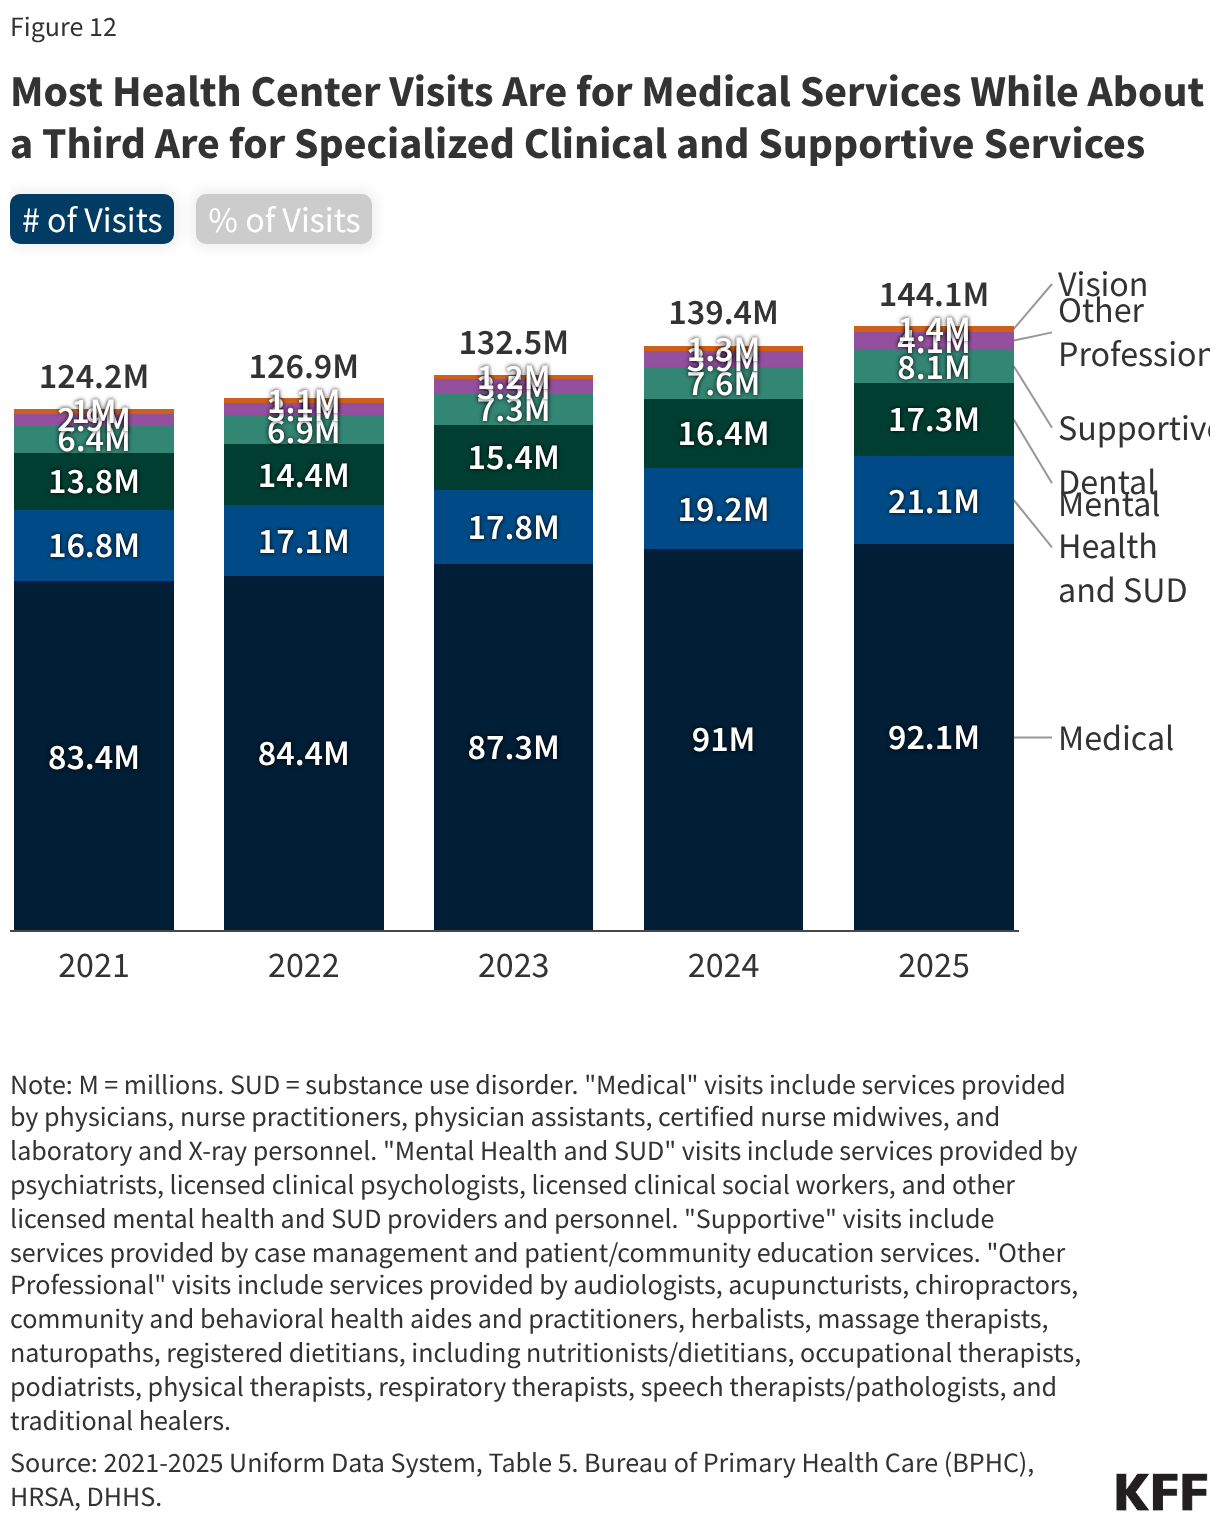
Health centers provided more than 144 million visits in 2025, an increase of 3% from 2024 and 16% from 2021, reflecting growth in visits across service areas (Figure 12). Most visits (64%) were for medical services, though health centers also provided a wide range of other clinical and supportive services, including mental health and SUD (15%), dental (12%), vision (1%), and other professional services (3%), which include services such as nutrition counseling, physical therapy, and traditional healing. Enabling or supportive services, which are non-clinical services like case management, transportation, and health education that facilitate access to care, represented 6% of all visits. Health centers are required by federal law to provide primary care and supportive services, and they may offer dental, vision, or other services depending on patient need and organizational capacity. Since 2021, the share of visits for medical services fell slightly from 67% to 64% as the number of visits for other types of services grew more rapidly. Visits for supportive, dental, and mental health and SUD services grew by 27%, 26%, and 25%, respectively, while visits for medical services grew 10%.
Telehealth
The share of health center visits conducted via telehealth (13%) has remained steady since 2023 after several years of decline (Figure 13). In 2025, health centers provided nearly 19 million telehealth visits, which represented 13% of all visits and an 8% increase from 2024. The number of telehealth visits peaked in 2020 at the start of the COVID-19 pandemic when 28.5 million visits (25%) were conducted via telehealth but declined from 2021 through 2023 before increasing slightly in 2024. Telehealth represents an important way for patients to access health center services, particularly since some patients face geographic and transportation barriers that can make it more difficult for them to attend in-person visits.
Health Center Workforce
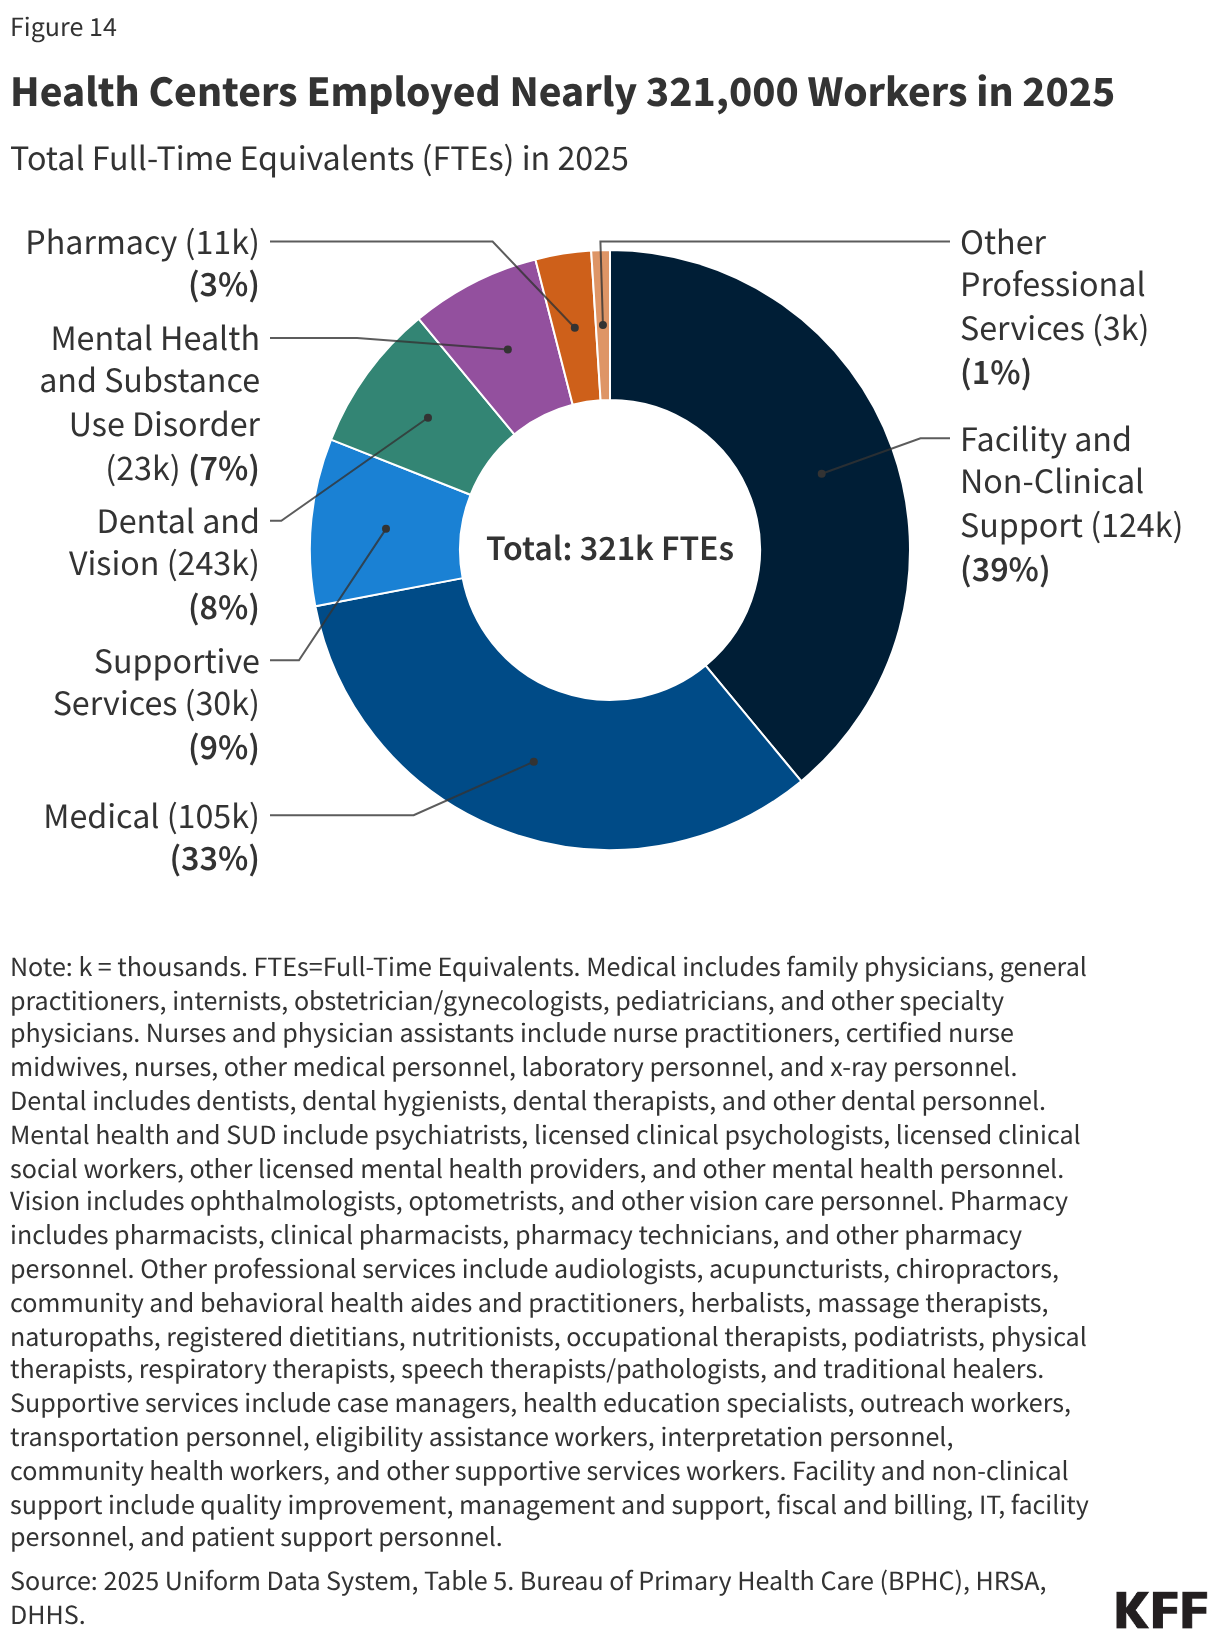
Health centers employed nearly 321,000 full-time equivalent (FTE) workers in 2025 (Figure 14). Most health center staff (61%) provided patient care or supportive services, including medical (33%), supportive (9%), dental and vision (8%), mental health and substance use disorder (7%), pharmacy (3%), and other professional services (1%). The remaining 39% of health center staff worked in facility and non-clinical support roles. Health centers are important employers in their communities; however, they consistently report workforce shortages as one of their main challenges. Research indicates that health center workforce shortages have worsened over time. Ongoing funding challenges and delays may further exacerbate these challenges.
Impact of Federal Policy Changes
2025 Reconciliation Law and Expiration of Enhanced Marketplace Tax Credits
Changes to Medicaid included in the 2025 reconciliation law, along with the expiration of ACA Marketplace enhanced premium tax credits, are expected to increase the number of uninsured health center patients. When the new law was enacted, the Congressional Budget Office (CBO) estimated that changes from health provisions would increase the number of people without health insurance in 2034 by 10 million, rising to more than 14 million when accounting for the expiration of the ACA enhanced premium tax credits. While many eligibility provisions in the new law, including Medicaid work requirements, do not take effect until 2027, immigrant eligibility restrictions for Medicaid and Marketplace coverage and expiration of ACA enhanced premium tax credits can impact health center finances earlier. Even before most of these changes take effect, enrollment has already begun to fall, with Medicaid enrollment declining 6% from May 2025 to May 2026 and Marketplace enrollment declining 12% year-over-year as of May 2026 following the expiration of the enhanced premium tax credits at the end of 2025. Increases in uninsured health center patients may contribute to financial uncertainty for health centers. A recent study estimates that health centers could experience over $3 billion in revenue reductions due to an increase in the number of uninsured patients from the 2025 reconciliation law’s health provisions.
Health Center Funding
Federal funding for health centers expires in December 2026. While Congress previously protected health centers from funding lapses by authorizing the Community Health Center Fund for five years, Congress only extended mandatory health center funding from February through December 2026 in the 2026 Consolidated Appropriations Act. Future annual discretionary health center funding will be delayed until after the midterm elections as Congress recently passed a continuing resolution funding the government through December 11, 2026. Future funding delays may create significant challenges for health centers and lead to health center closures as they rely on federal funding to maintain operations and provide care to uninsured patients.