Ground Ambulance Rides and Potential for Surprise Billing

Authors: Krutika Amin, Karen Pollitz, Gary Claxton, Matthew Rae, and Cynthia Cox
Published: Jun 24, 2021

Congress last year enacted the “No Surprises Act,” which prohibits most surprise out-of-network bills when a patient receives out-of-network services during an emergency visit or at an in-network hospital without advance notice starting in 2022. However, the protections do not apply to ground ambulance services, and the law instead requires a federal advisory committee to study the issue and recommend options to protect patients from surprise bills.

This analysis finds that half of emergency ground ambulance rides result in an out-of-network charge for people with private health insurance, potentially leaving patients at risk of getting a surprise bill. Overall ambulances transport about 3 million privately insured patients to emergency rooms each year. Local fire and rescue departments and other government agencies account for nearly two thirds of those rides.

The analysis also examines several existing state and local laws that seek to protect consumers from unexpected or excessive bills for ground ambulance services, generally by limiting when and how much ambulance providers can bill patients for their services.

The analysis is available on the Peterson-KFF Health System Tracker, an online information hub dedicated to monitoring and assessing the performance of the U.S. health system.

Supplemental Security Income for People with Disabilities: Implications for Medicaid

Authors: MaryBeth Musumeci and Kendal Orgera
Published: Jun 23, 2021

Issue Brief

Key Takeaways

The federal Supplemental Security Income (SSI) program provides a cash payment to serve as a minimum level of income for people who have low incomes and limited assets and are elderly or meet the Social Security Administration’s (SSA) strict rules that define disability. The maximum federal SSI benefit is less than the federal poverty level (FPL), $794 per month or about 74% FPL for an individual, in 2021. As a result of the SSA’s strict disability determination rules, not all people with disabilities qualify for SSI. States generally must provide Medicaid to people who receive SSI. This issue brief describes key characteristics of SSI enrollees, explains the SSI eligibility criteria and eligibility determination process, and considers the implications of changes in the SSI program for Medicaid, including the effects of the COVID-19 pandemic and resulting economic downturn and proposals supported by President Biden that Congress might consider. Key findings include the following:

  • Working people with disabilities experience disproportionate job loss during economic downturns compared to workers without disabilities, and SSI applications generally increase when the unemployment rate increases.
  • The COVID-19 pandemic has presented additional challenges not present during other economic downturns, such as the closure of SSA offices due to social distancing measures.
  • People in households where someone experienced a job or income loss were more than three times as likely to have applied or attempted to apply for SSI during the pandemic, or plan to apply in the next 12 months, compared to those in households without job or income loss.
  • Because SSI eligibility generally is a pathway for Medicaid eligibility, changes that affect the ability of people with disabilities to obtain or retain SSI also can affect the ability of people with disabilities to access Medicaid.

SSA expects disability claims (including SSI and SSDI) to increase by nearly 300,000 in the second half of FY 2021, and over 700,000 in FY 2022, compared to FY 2020. SSA received fewer applications than expected in FY 2020, due to office closures and other disruptions due to the pandemic. Additionally, the Affordable Care Act’s (ACA) Medicaid expansion was not available during prior economic downturns, so the extent to which people might forgo an SSI application (as a means to access Medicaid) because they are eligible for Medicaid through the ACA expansion (in states that have chosen to expand) remains to be seen. Finally, the extent of chronic disabling illness experienced by people with “long COVID” is not yet fully understood but could result in a new population seeking SSI due to their inability to work.

Introduction

Congress created the federal SSI program in 1972, as a safety net program of “last resort,” providing a cash payment to serve as a minimum level of income for poor people who are elderly or disabled and meet strict federal rules.1  To be eligible for SSI, beneficiaries must have low incomes, limited assets, and either be age 65 or older or have an impaired ability to work at a substantial gainful level as a result of significant disability.2  SSI is a separate program from Social Security Disability Insurance (SSDI), which provides cash payments to people who previously worked but are no longer able to work due to disability.3  Notably, states generally must provide Medicaid to people who receive SSI.4  By contrast, SSDI eligibility generally triggers Medicare eligibility after a 24-month waiting period; unlike SSDI and Medicare eligibility, there is no waiting period before an SSI enrollee is eligible for Medicaid.5  Box 1 explains other key differences between SSI and SSDI.

The maximum federal SSI benefit is less than the federal poverty level (FPL), $794 per month or about 74% FPL for an individual, in 2021.6  A couple in which both spouses are eligible for SSI receives a joint maximum federal payment of $1,191 per month, which is one and one-half times the individual benefit amount.7  Because SSI payments are reduced to account for any earned or unearned income as well as support that is deemed or received in-kind from other people, the average federal SSI payment is about $586 per month, as of April 2021.8  States have the option to make supplemental payments to SSI enrollees, which can vary based on income, living arrangement, and other factors.9  This issue brief describes key characteristics of SSI enrollees, explains the SSI eligibility criteria and eligibility determination process (with additional detail contained in the Appendix), and considers the implications of changes in the SSI program for Medicaid, including the effects of the COVID-19 pandemic and resulting economic downturn as well as proposals supported by President Biden that Congress might consider.

Box 1:  What is the Difference Between SSI and SSDI?

SSI is a federal program administered by the Social Security Administration (SSA) that ensures a minimum level of income for poor people who are elderly or disabled. To qualify, SSI enrollees must have low income, limited assets, and either be age 65 or older or have an impaired ability to work at a substantial gainful level according to strict federal rules.10  Unlike SSDI (described below), SSI is available to people regardless of their work history. The maximum SSI benefit is set by Congress.11 

SSA also administers Social Security Disability Insurance (SSDI), a separate program from SSI.12  Unlike SSI, there are no income or asset limits for SSDI eligibility. Instead, to qualify for SSDI, enrollees must have a sufficient work history (generally, 40 quarters) and meet the strict federal disability rules.13  SSA uses the same rules to determine disability for both the SSI and the SSDI programs.14  In addition, some people with a disability can qualify for SSDI based on a relative’s work history. For example, people whose disability began before age 22, known as “disabled adult children,” can qualify for SSDI based on the work history of their parent who is retired, deceased, or disabled.15 

The amount of SSDI benefits is based on the person’s earnings history.16  It is possible to receive both SSDI and SSI if a person’s SSDI benefit amount is less than the maximum SSI payment. In those cases, the person also can qualify for SSI to cover the difference between their SSDI benefit amount and the maximum SSI benefit.

Who receives SSI?

Nearly 8 million people receive SSI benefits as of April 2021 (Figure 1). The majority of SSI enrollees (57%) are nonelderly adults. Over one-quarter are seniors, and the remainder are children.

Figure 1: SSI Enrollees by Age, April 2021

The rate of SSI receipt varies by racial/ethnic group (Figure 2). People who are Black or American Indian/Alaska Native are more than twice as likely to receive SSI compared to White people.

Figure 2: Share of Population Who Are SSI Enrollees by Race/Ethnicity, 2019

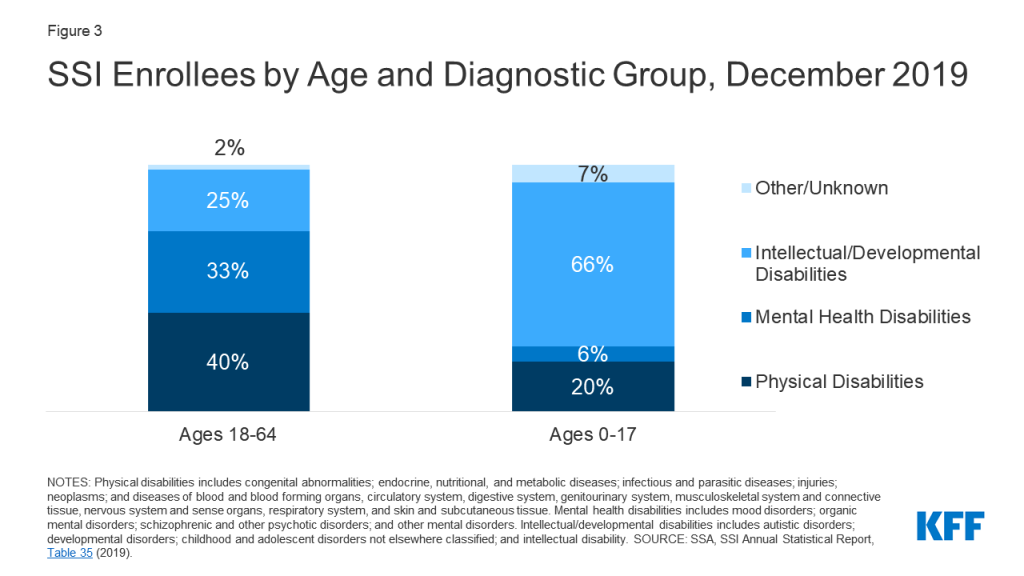
Grouped into broad categories, 40 percent of nonelderly adult SSI enrollees had a physical disability as of December 2019 (Figure 3). People age 65 and older are excluded as they can qualify for SSI based on their age rather than disability status. The most prevalent types of physical disabilities (using SSA’s terminology) were musculoskeletal disorders (generally involving impairment of one or both arms or legs, as well as soft tissue injuries), followed by neurological disorders (such as epilepsy, Parkinson’s disease, multiple sclerosis, amyotrophic lateral sclerosis (ALS), or muscular dystrophy) or loss of vision, speech or hearing; and circulatory disorders. One-third of nonelderly adult SSI enrollees qualified based on a mental health disability. The most prevalent types of mental health disabilities were schizophrenic and other psychotic disorders, followed by mood disorders (such as depression or bipolar disorder). One-quarter of nonelderly adult SSI enrollees have an intellectual or developmental disability (I/DD). Within this category, the most prevalent type was intellectual disability, followed by autism.

Figure 3: SSI Enrollees by Age and Diagnostic Group, December 2019

In contrast to adult SSI enrollees, two-thirds of child SSI enrollees have an I/DD as of December 2019 (Figure 3). The most prevalent type of disability within the broad I/DD category was developmental disability. One in five child SSI enrollees have a physical disability. The most prevalent types of physical disabilities among child SSI enrollees were neurological disorders or loss of vision, speech or hearing, followed by congenital disorders. Less than 10 percent of child SSI enrollees have a mental health disability. Within this category, the most prevalent disability types were mood disorders, followed by organic mental disorders.

How does a person qualify for SSI?

In addition to meeting the disability criteria (described below), an SSI enrollee must meet several non-medical criteria, including having a low income. SSA has complex rules for determining financial eligibility. In general, income is anything received in cash, earned or unearned, that can be used to meet a person’s need for food or shelter.17  Income is countable except for some limited amounts that are disregarded.18  Income also includes “in kind” support, such as any food or shelter provided or paid by another person. In kind support generally is valued at (and therefore reduces SSI payments by) one-third of the maximum federal benefit amount.19  SSA also deems a portion of income from a person’s spouse or parent/step-parent (for child applicants) as countable income.20  To financially qualify for SSI, a person’s countable income cannot exceed the maximum federal benefit rate ($794/month for an individual in 2021), and the amount of SSI that a person actually receives is the maximum federal rate reduced by the amount of their countable income.21  These rules apply to SSI enrollees of all ages.

Other non-medical criteria to qualify for SSI include having limited assets and a qualifying citizenship or immigration status. SSI eligibility requires that a person’s countable assets not exceed $2,000 for an individual and $3,000 for a couple in which both spouses are eligible for SSI.22  As with income, SSA deems a portion of assets from a person’s spouse or parent as countable.23  Examples of assets that are excluded from the limit include the individual’s home, household effects, and one automobile.24  SSI eligibility also generally is limited to U.S. citizens.25 

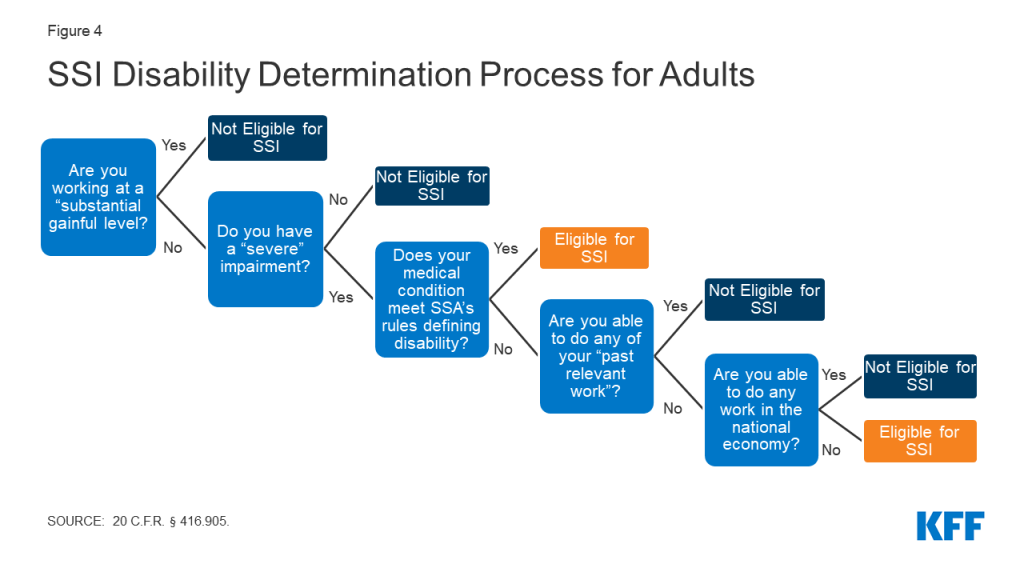
SSA uses a five-step process to determine whether a nonelderly adult qualifies as disabled for purposes of receiving SSI (Figure 4).26  By contrast, people age 65 and older can qualify for SSI based on their age. The first step in the disability determination process for nonelderly adults considers whether the person currently has earned income at or above the amount that SSA considers a “substantial gainful level.” The next question is whether the person has a “severe” impairment,” defined as a medically determinable impairment that lasts at least 12 months or results in death.27  The third step involves examining whether the person meets SSA’s strict rules that define whether the medical impairment meets the definition of disability. If a person does not meet SSA’s disability definition, the final two steps consider their ability to return to their past work or to do any work. SSA’s process to determine disability for purposes of SSI eligibility for children differs in some respects from the process used for adults to account for differences in functioning between the two populations.28  More detail is provided in the Appendix.

Figure 4: SSI Disability Determination Process for Adults

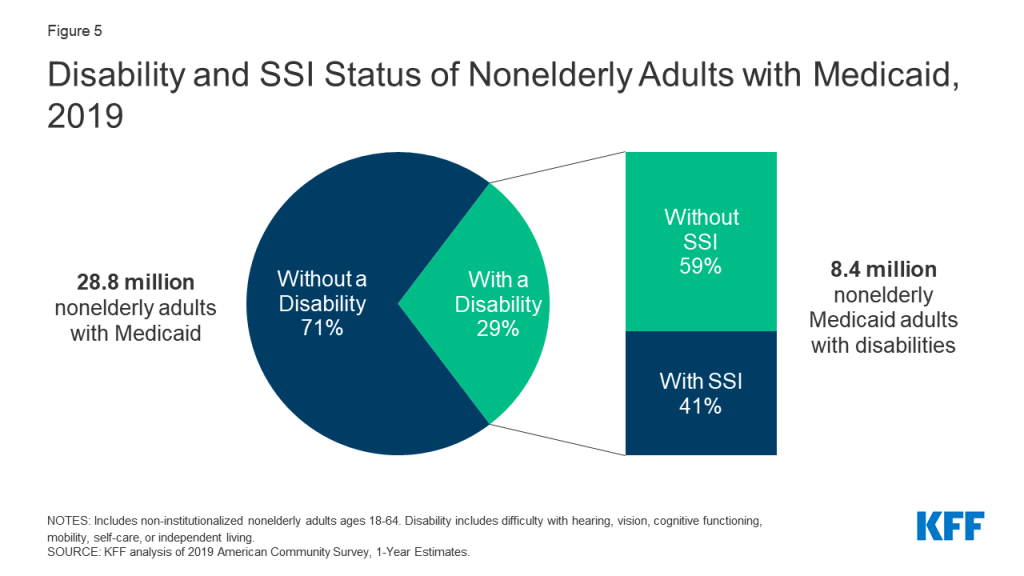
As a result of the strict SSA disability determination rules, not all people with disabilities qualify for SSI. For example, using one definition of functional disability, more than six in 10 nonelderly Medicaid adults who report a functional disability do not receive SSI (Figure 529 ). The definition of functional disability here includes people who report serious difficulty with hearing, vision, cognitive functioning (concentrating, remembering, or making decisions), mobility (walking or climbing stairs), self-care (dressing or bathing), or independent living (doing errands, such as visiting a doctor’s office or shopping, alone).30  Nonelderly adults with disabilities who do not receive SSI can qualify for Medicaid through other eligibility pathways including those based solely on their low income, such as the ACA’s Medicaid expansion or Section 1931 parents, or those based on disability, such as the state option to cover people with disabilities up to the federal poverty level or a home and community-based services waiver.31 

Figure 5: Disability and SSI Status of Nonelderly Adults with Medicaid, 2019

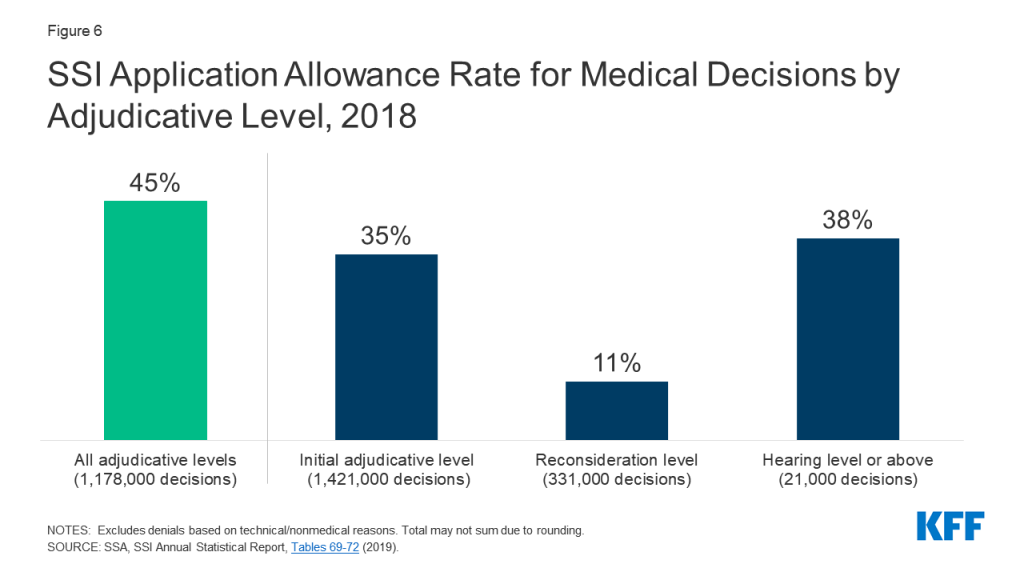
A notable share of initial decisions denying SSI eligibility are reversed on appeal (Figure 6). The overall “allowance rate,” awarding SSI benefits in cases involving medical determinations (excluding those denied for “technical” reasons such as such as income or assets) across all adjudicative levels in 2018, was 45 percent.32  However, the rate of SSI awards varies by adjudicative level. Thirty-five percent of applications involving medical determinations were approved at the initial application stage.33  Among cases involving medical determinations that were denied at the initial application and appealed, very few (11%) were awarded benefits at the first appeals level (reconsideration).34  However, nearly 40 percent of cases involving medical determinations that were denied at both the initial application and reconsideration levels and were appealed further ultimately had benefits awarded, at an administrative law judge (ALJ) hearing or higher appeals level.35  The appeals process can take a long time and can be difficult for individuals to navigate on their own without legal representation. For example, the average wait time between an ALJ hearing request (the second appeal level) and a hearing date ranged from five months to over 16 months, depending on the hearing office location, in March 2021.36 

Figure 6: SSI Application Allowance Rate for Medical Decisions by Adjudicative Level, 2018

After the initial eligibility determination, SSI enrollees are subject to “continuing disability reviews.” The timeframes for these reviews are established based on whether and when SSA expects the person’s medical condition to improve. SSI eligibility also is reviewed for other reasons, such as a return to work, increased wages, or completion of vocational rehabilitation training.37  Additionally, child enrollees who turn 18 have their eligibility reviewed using the adult disability determination rules.38 

How has the COVID-19 pandemic and associated economic downturn affected SSI and Medicaid?

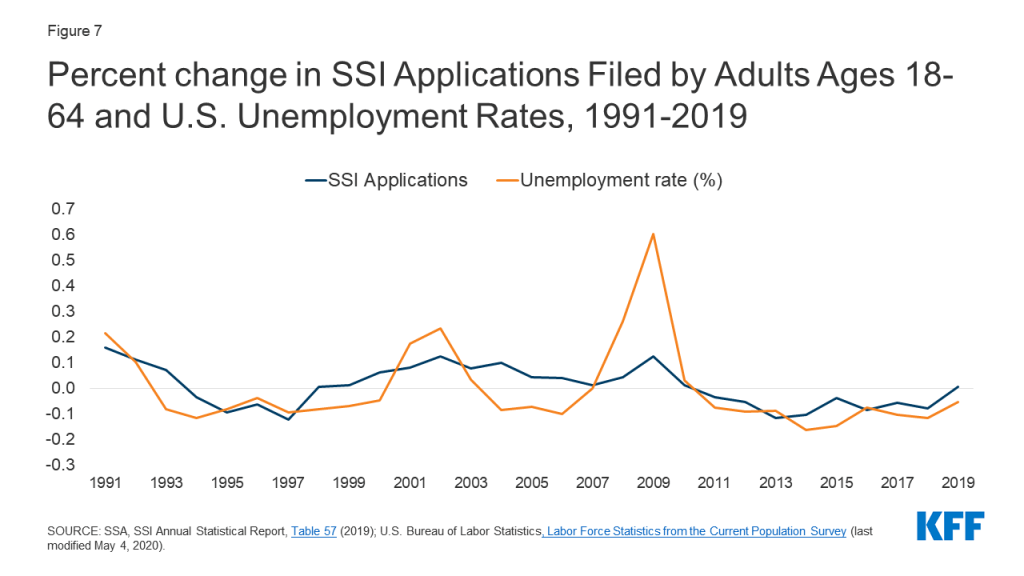
Working people with disabilities experience disproportionate job loss, compared to workers without disabilities, during economic downturns,39  and SSI applications generally increase when the unemployment rate increases (Figure 7). This trend held during the Great Recession and subsequent economic recovery.40  One exception to the general trend is the period from 2003 to 2007, when SSI applications continued to rise despite falling unemployment.41  Possible explanations for this anomaly include factors such as the lagged effect of federal welfare reform (passed in 1996) leading TANF enrollees to switch to SSI and “persistently high poverty rates.”42  The same study also found that the likelihood of applying for SSI significantly increases during extended periods of high unemployment.43 

Figure 7: Percent change in SSI Applications Filed by Adults Ages 18-64 and U.S. Unemployment Rates, 1991-2019

SSA projects an increase in disability applications in the second half of FY 2021 and in FY 2022.44  Specifically, SSA expects to complete nearly 300,000 more claims in FY 2021, and over 700,000 more claims in FY 2022, compared FY 2020.45  While SSA received nearly 190,000 fewer disability applications than anticipated in FY 2020, the agency expects “many of these individuals to apply for benefits as we emerge from the pandemic” and notes that some people may have been unable to obtain the help they needed to apply earlier in the pandemic.46  (SSA does not separately discuss SSI vs. SSDI applications in these projections.) Additionally, the extent of chronic disabling illness experienced by people with “long COVID” is not yet fully understood but could result in a new population seeking SSI due to their inability to work.

The pandemic has presented additional challenges that have not been present during other economic downturns. For example, the need for social distancing measures has closed SSA offices to the public since mid-March 2020. In April 2021 testimony before the Senate Finance Committee, the SSA Deputy Commissioner for Operations acknowledged the importance of in-person services for many populations served by SSA, such as seniors, people with low incomes, those with limited English proficiency, those who are homeless, and those with mental illness, and described SSA’s outreach efforts to these groups.47  SSA explained that before the pandemic, most or all tasks could be completed at the first point of contact in the office, while collecting evidence and documentation by mail or phone has slowed the process down, often requiring multiple contacts.48  Additionally, SSA cited mail delays, people who no longer receive mail at their address of record because they were forced to move during the pandemic, and hesitancy in accepting phone calls due to phone scams as factors that have exacerbated challenges resulting from office closures.49  SSA also noted that “at least 30 percent of all disability applications require a consultative examination to determine disability,” and the pandemic has made it more difficult for people to schedule and access these appointments with medical providers and to obtain evidence from schools and social service agencies.50  SSA reported that these tasks are “taking almost twice as long now, up from 21 days before the pandemic to 37 days during the pandemic.”51  Consequently, SSA is facing a backlog of initial disability applications that “grew by approximately 115,000 cases” between September 2019 and April 2021.52 

As of mid-March 2021, KFF analysis of Census survey data shows that 4.6 million people had applied or attempted to apply for SSI during the pandemic, or think they will apply in the next 12 months, with those in households that experienced job or income loss more likely to do so.53  People in households where someone experienced a job or income loss were more than three times as likely to have applied, attempted to apply, or plan to apply for SSI, compared to those in households without job or income loss.54  Among those who have applied, tried to apply, or plan to apply, one quarter said the pandemic led them to apply earlier than expected, while 15% said the pandemic led them not to apply or apply later than expected.55 

SSI enrollment remained relatively stable in the early months of the pandemic but began to decrease as the pandemic continued.56  When the pandemic began, SSA “temporarily deferred” some work, such as continuing disability reviews and SSI redeterminations, “to protect beneficiaries’ income and healthcare during a critical time.”57  SSA “resumed processing adverse actions in September and October of 2020.”58  This likely has contributed to the decrease in the number of SSI enrollees from nearly 8.1 million in April 2020 to just under 7.9 million in April 2021.59  Historically, SSI enrollment increased annually from 2000 through 2013. Then, beginning in 2014, annual SSI enrollment has declined slightly each year. 2014 is the first year that the ACA’s Medicaid expansion went into effect, and the extent to which the availability of this new Medicaid pathway may have influenced SSI enrollment declines is unclear. The overall decrease in enrollment from April 2020 to April 2021 is consistent with the general recent trend of annual SSI enrollment declines since 2014.

Medicaid enrollment increased in every state during the COVID-19 pandemic.60  Medicaid enrollment grew by 11.8% (7.6 million enrollees) nationally from actual adjusted February to preliminary November 2020 data.61  While enrollment increased for both children and adults during this period, adult enrollment grew at a greater pace.62  This reflects changes in the economy (as more people lost income and jobs and became eligible for and enrolled in Medicaid) as well as provisions in the Families First Coronavirus Response Act that require states to ensure continuous coverage for current Medicaid enrollees through the end of the month in which the COVID-19 public health emergency ends, as a condition of receiving a temporary increase in the Medicaid federal matching rate.63 

Implications for Medicaid

Because SSI eligibility generally is a pathway for Medicaid eligibility, changes that make it more difficult to obtain or retain SSI can affect the ability of people with disabilities to access Medicaid. For example, in January 2021, the Biden Administration withdrew a notice of proposed rule-making issued by the Trump Administration that would have increased the number and frequency of continuing disability reviews and was expected to result in some people losing SSI eligibility.64  Increasing the frequency of SSI continuing disability reviews could create administrative barriers that can result in eligible people losing not only SSI but also Medicaid.65  An increase in the number of people losing SSI also could increase state administrative costs because state Medicaid agencies must determine Medicaid eligibility on all other bases before terminating coverage if people lose eligibility through their current pathway.66 

On the other hand, changes that seek to increase and stabilize access to SSI could have similar effects on the ability of people with disabilities to obtain and retain Medicaid coverage. For example, President Biden and a group of Congressional Democrats have proposed increasing the maximum SSI benefit to 100% FPL; eliminating the SSI “marriage penalty” (referring to the fact that two SSI enrollees who marry receive the couple rate, described above, which is less than twice the individual rate); eliminating rules that reduce SSI benefits by one-third based on “in-kind support and maintenance;” and raising the asset limits, which last increased in 1989.67  President Biden backed these policy changes during his campaign, and a group of Congressional Democrats supports including them in the American Family Plan.68 

The availability of the Affordable Care Act’s (ACA) Medicaid expansion as an alternative pathway to affordable health insurance coverage can affect decisions about whether to apply for SSI during the current economic downturn. The ACA expansion was not available during prior economic downturns, so the extent to which people might forgo an SSI application (as a means to access Medicaid) because they are eligible for Medicaid through the ACA expansion is not yet fully understood. Limited research indicates possible federal and state savings due to decreased SSI participation associated with the ACA Medicaid expansion.69  Although it is not often thought of in these terms, the ACA expansion provides a pathway to Medicaid eligibility for many people with disabilities, though without the limited cash benefits SSI provides and without the need to navigate SSI’s disability determination process. While it is true that disability status is not one of the eligibility criteria to qualify for the ACA expansion group, nonelderly adults with disabilities who do not receive SSI can qualify for Medicaid based solely on their income through the expansion group.70  Many people in the ACA expansion group were previously ineligible for Medicaid, and eligibility remains limited in the 12 states that have not adopted the Medicaid expansion to date, where eligibility limits for parents remain very low, and there is no eligibility pathway for childless adults, regardless of income (except in Wisconsin).71  Medicaid eligibility pathways based on disability other than SSI receipt, such as the pathway to cover seniors and people with disabilities up to 100% FPL, are offered at state option and therefore not universally available.72 

Access to affordable health insurance, such as Medicaid, helps people with disabilities access services to meet daily self-care and independent living needs, such as bathing, dressing, and eating. Medicaid also supports working people with disabilities by covering the health and long-term care services they need to be able to work. For example, the optional Medicaid buy-in for working people with disabilities allows Medicaid eligibility to continue for people who lose SSI due to earned income, if losing Medicaid would “seriously inhibit [the person’s] ability to continue working” and earnings are insufficient to provide a “reasonable equivalent of benefits. . . which would be available” if not working.73  Together, SSI and Medicaid are key sources of support for low-income seniors, nonelderly adults, and children with disabilities.

Appendix

The SSI Disability Determination Process

SSA uses a five-step process to determine whether an adult qualifies as disabled for purposes of receiving SSI (Figure 4).74  The first question is whether the person has earnings at a level of “substantial gainful activity” (SGA).75  The SGA amount in 2021 is $1,310 per month.76  If a person has earnings at or above the SGA amount, they are not eligible for SSI, regardless of any disability or health condition.77  The next question is whether the person has a “severe” impairment.78  Despite the term “severe,” this step is not a high bar as generally any medically determinable impairment will qualify at step two. The impairment also must have lasted or be expected to last for a continuous period of at least 12 months or to result in death.79 

The third step in the SSI disability determination process for adults involves examining whether the person meets SSA’s strict rules that define disability (Figure 4). Specifically, the question at step three is whether the person’s impairment “meets or equals the listings,”80  and unlike the assessment of “severity” at step two, this is a much more rigorous inquiry. The listings are sets of criteria organized by body system that SSA has determined meet its definition of disability.81  Simply having a certain diagnosis is not enough to meet SSA’s definition of disability; instead evidence must establish that each of the specific criteria in the applicable listing is met.82  Alternatively, SSA can determine that a person’s impairment is “medically equivalent” to one of the listings.83  Additionally, in cases that involve medical evidence of drug addiction or alcoholism, SSA must determine that drug addiction or alcoholism is not a “contributing factor material to the determination of disability.”84  Essentially, this means that the person still would meet the criteria in the disability listings even if they stopped using drugs or alcohol.85  If a person is determined to satisfy a set of criteria in the listings, they qualify for SSI.86 

If a person does not meet any of the listings, the final two steps in the adult disability determination process consider their ability to work (Figure 4). Step four asks whether the person has the “residual functional capacity” (what the person remains able to do despite limitations from any physical or mental impairments) to do any of their “past relevant work.”87  Past relevant work includes any work within the past 15 years that meets the definition of SGA (above) and lasted long enough for the person to learn to do it.88  If SSA determines that a person can still do their past relevant work, they are not eligible for SSI.89  If SSA determines that a person cannot return to their past relevant work, step five asks whether the person can do any work that exists in significant numbers in the national economy, considering their residual functional capacity, age, education, and work experience.90  So long as such work exists, either in the region where the person lives or in several other regions of the country, “[i]t does not matter whether [w]ork exists in the immediate area in which you live; [a] specific job vacancy exists for you; or [y]ou would be hired if you applied for work,” according to SSA’s regulations.91  If SSA determines that the person cannot do any work in the national economy, they qualify for SSI.92 

SSA’s process to determine disability for purposes of SSI eligibility for children differs in some respects from the process used for adults. 93  The first two questions, whether the child has earnings at a substantial gainful level and whether the child has a “severe” impairment, are the same as those used in the adult process.94  Step three for children asks whether the child meets or equals a listing, again divided by body system but using different criteria for children than adults.95  If a child meets or medically equals one of SSA’s listings, they qualify for SSI.96  If a child does not meet a listing, the final consideration is whether the child “functionally equals” the listings.97  This requires a finding of “marked” limitation in two functional domains or “extreme” limitation in one domain, compared to other children of the same age without impairments.98  The functional domains are acquiring and using information, attending and completing tasks, interacting and relating with others, moving about and manipulating objects, caring for yourself, and health and physical well-being.99 

Appeals Process

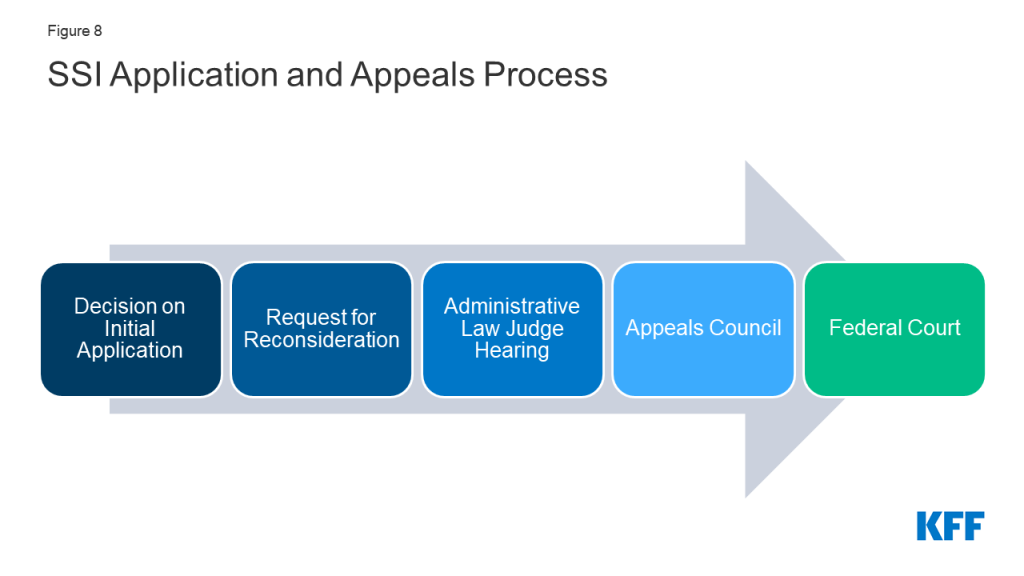
If an initial application for SSI is denied, there are several levels of appeal available (Figure 8). State disability determination agencies generally make the eligibility decision on initial applications, using SSA’s rules.100  The first appeal level is a request for reconsideration, which generally involves a paper review for initial applications denied for medical reasons.101  The second appeal level is an administrative law judge (ALJ) hearing, which provides an opportunity to present testimony and written evidence.102  The third appeals level is review by the Appeals Council, which typically is based on the submission of written arguments.103  Appeals Council decisions can then be appealed to federal court.104  The appeals process can take a long time and can be difficult for individuals to navigate on their own without legal representation. For example, the average wait time between an ALJ hearing request and a hearing date ranged from five months to over 16 months, depending on the hearing office location, in March 2021.105 

Figure 8: SSI Application and Appeals Process

Continuing Disability Reviews

After the initial eligibility determination, SSI enrollees are subject to “continuing disability reviews.” The timeframes for these reviews are established based on whether and when SSA expects the person’s medical condition to improve. For cases in which medical improvement is expected, eligibility is reviewed at intervals from six to 18 months.106  Cases involving disabilities that are not considered permanent but for which medical improvement cannot be accurately predicted are reviewed at least every three years.107  Cases involving disabilities that are considered permanent are reviewed every five to seven years.108  Decisions terminating SSI eligibility also are subject to the multi-level appeals process described above.

Endnotes

  1. Social Security Administration (SSA), Annual Report of the Supplemental Security Income Program at 6 (May 29, 2020), https://www.ssa.gov/oact/ssir/SSI20/ssi2020.pdf; 20 C.F.R. § 416.110. ↩︎
  2. See generally 42 U.S.C. § § 1381-1383f; 20 C.F.R. Part 416. ↩︎
  3. Cf. 42 U.S.C. § § 401-434; 20 C.F.R. Part 404. ↩︎
  4. 42 U.S.C. § 1396a (a)(10)(A)(i)(II); but see 42 U.S.C. § 1396a (f). For more information, see KFF, Medicaid Financial Eligibility for Seniors and People with Disabilities: Findings from a 50-State Survey (June 2019), https://modern.kff.org/medicaid/issue-brief/medicaid-financial-eligibility-for-seniors-and-people-with-disabilities-findings-from-a-50-state-survey/. ↩︎
  5. 42 U.S.C. § 426 (b). ↩︎
  6. SSA, SSI Federal Payment Amounts for 2021 (last accessed 4/22/21), https://www.ssa.gov/oact/cola/SSI.html. Prior to 1975, SSI benefit amounts were set by statute. Since 1975, the maximum SSI benefit has been subject to an annual cost-of-living adjustment (COLA) based on the increase in the Consumer Price Index for Urban Wage Earners and Clerical Workers (CPI-W) from the third quarter of the prior year to the third quarter of the current year. SSA, Cost-of-Living Adjustments (last accessed 4/20/21), https://www.ssa.gov/oact/cola/colaseries.html; see also 20 C.F.R. § 416.205. The most recent COLA, effective for benefits payable beginning in January 2021, was 1.3 percent. SSA, Latest Cost-of-Living Adjustment (last accessed 4/20/21), https://www.ssa.gov/oact/cola/latestCOLA.html. ↩︎
  7. SSA, SSI Federal Payment Amounts for 2021 (last accessed 4/22/21), https://www.ssa.gov/oact/cola/SSI.html. ↩︎
  8. SSA, Monthly Statistics, April 2021, Table 1 (released May 2021), https://www.ssa.gov/policy/docs/statcomps/ssi_monthly/2021-04/table01.html;  see generally 20 C.F.R. Part 416, Subpart K. ↩︎
  9. SSA, Understanding Supplemental Security Income SSI Benefits – 2021 Edition (last accessed 4/22/21), https://www.ssa.gov/ssi/text-benefits-ussi.htm. ↩︎
  10. 20 C.F.R. § 416.110. ↩︎
  11. 42 U.S.C. § § 1382 (b); 1382f. ↩︎
  12. The other two types of Social Security benefits are retirement insurance and survivors benefits. Eligibility for Social Security retirement benefits is triggered when a person with a qualifying work history reaches retirement age. Social Security survivors benefits are paid to a worker’s spouse, dependent child(ren), and/or dependent parent(s) after a person with a qualifying work history dies. 42 U.S.C. § 402. ↩︎
  13. 42 U.S.C. § 423. ↩︎
  14. 20 C.F.R. § 416.925; 20 C.F.R. Part 404, Subpart P, Appendix 1, Part A. ↩︎
  15. 42 U.S.C. § 402 (d)(1)(G). For other examples of people who may qualify based on a relative’s work history, see SSA, Types of Beneficiaries (last accessed June 23, 2021) https://www.ssa.gov/oact/progdata/types.html. ↩︎
  16. 42 U.S.C. § 423 (a)(2). ↩︎
  17. 20 C.F.R. § 416.1102. ↩︎
  18. 20 C.F.R. § § 416.1112, 416.1124. ↩︎
  19. 20 C.F.R. § § 416.1130-416.1145. ↩︎
  20. 20 C.F.R. § § 416.1160-416.1169. ↩︎
  21. 20 C.F.R. § 416.420. ↩︎
  22. 20 C.F.R. § 416.1205 (c). ↩︎
  23. 20 C.F.R. § 416.1202. ↩︎
  24. 20 C.F.R. § 416.1210. ↩︎
  25. Noncitizens may be eligible for SSI only in very limited circumstances. See, e.g., SSA, Supplemental Security Income for Non-Citizens (last accessed June 23, 2021), https://www.ssa.gov/pubs/EN-05-11051.pdf. ↩︎
  26. 20 C.F.R. § § 416.905, 416.920. ↩︎
  27. 20 C.F.R. § 416.920 (a)(4)(ii). ↩︎
  28. 20 C.F.R. § § 416.906; 416.924. ↩︎
  29. The number of nonelderly adult SSI enrollees in Figure 5 differs from Figure 1 due to differences in the two data sources. For example, Figure 5 subsets the number of nonelderly adults who report a disability and receive SSI, and the functional disability questions may not identify all SSI enrollees, such as people with mental health disabilities. ↩︎
  30. The ACS questions used to classify an individual as having a disability include: (1) Is this person deaf, or does he/she have serious difficulty hearing? (2) Is this person blind, or does he/she have serious difficulty seeing, even when wearing glasses? (3) Because of a physical, mental, or emotional condition, does this person have serious difficulty concentrating, remembering, or making decisions? (4) Does this person have serious difficulty walking or climbing stairs? (5) Does this person have difficulty dressing or bathing? (6) Because of a physical, mental, or emotional condition, does this person have difficulty doing errands alone, such as visiting a doctor’s office or shopping? The ACS definition of disability is intended to capture whether a person has a functional limitation that results in a participation limitation. U.S. Census Bureau, American Community Survey, Why We Ask Questions About… Disability, (last accessed April 21, 2021), https://www.census.gov/acs/www/about/why-we-ask-each-question/disability/. ↩︎
  31. KFF, People with Disabilities Are At Risk of Losing Medicaid Coverage Without the ACA Expansion (Nov. 2020), https://modern.kff.org/medicaid/issue-brief/people-with-disabilities-are-at-risk-of-losing-medicaid-coverage-without-the-aca-expansion/. ↩︎
  32. SSA, SSI Annual Statistical Report 2019, Outcomes of Applications for Disability Benefits at Table 69 (Aug. 2020), https://www.ssa.gov/policy/docs/statcomps/ssi_asr/2019/sect10.html. ↩︎
  33. Id. at Table 70. ↩︎
  34. Id. at Table 71. ↩︎
  35. Id. at Table 72. ↩︎
  36. SSA, Hearings and Appeals, Average Wait Time Until Hearing Held Report (For the Month of March 2021), (last accessed 4/22/21), https://www.ssa.gov/appeals/DataSets/01_NetStat_Report.html. ↩︎
  37. 20 C.F.R. § 416.990 (b). ↩︎
  38. 20 C.F.R. § 416.987. ↩︎
  39. See, e.g., H. Stephen Kaye, “The impact of the 2007-09 recession on workers with disabilities,” Monthly Labor Review, 19-30 (Oct. 2010), https://www.bls.gov/opub/mlr/2010/10/art2full.pdf (finding a nearly 10 percent decline in the presence of workers with disabilities in the employed labor force during the Great Recession, from October 2008 through June 2010, more than twice the proportional decline for workers without disabilities during this period); Onur Altindag, Lucie Schmidt, and Purvi Sevak, The Great Recession, Older Workers with Disabilities, and Implications for Retirement Security, Univ. of Mich. Retirement Research Center Working Paper No. 2012-277 (Nov. 2012), https://deepblue.lib.umich.edu/bitstream/handle/2027.42/95904/wp277.pdf?sequence=1&isAllowed=y (finding a 30 percent greater increase in involuntary job loss during the Great Recession for workers age 50 and older with an underlying risk of disability compared to the general population). ↩︎
  40. Austin Nichols, Lucie Schmidt, and Purvi Sevak, “Economic Conditions and Supplemental Security Income Application,” 77 Social Security Bulletin (2017), https://www.ssa.gov/policy/docs/ssb/v77n4/v77n4p27.html. Additionally, from 2007 to 2010, the 17 percent increase in SSI expenditures 2010 has been described as “modest,” with spending for other means-tested programs experiencing greater increases during that period. Robert A. Moffitt, The Social Safety Net and the Great Recession, The Russell Sage Foundation and The Stanford Center on Poverty and Inequality (Oct. 2012), https://web.stanford.edu/group/recessiontrends-dev/cgi-bin/web/sites/all/themes/barron/pdf/SocialSafety_fact_sheet.pdf. ↩︎
  41. Austin Nichols, Lucie Schmidt, and Purvi Sevak, “Economic Conditions and Supplemental Security Income Application,” 77 Social Security Bulletin (2017), https://www.ssa.gov/policy/docs/ssb/v77n4/v77n4p27.html ↩︎
  42. Id. ↩︎
  43. This finding is despite that people who lose their job during a period of high unemployment generally are less likely to apply for SSI compared to those who lose their job during a period of low unemployment. Id. Another study found that an increase in the state unemployment rate tends to be associated with a decrease in initial approvals of SSI applications for both adults and children, particularly for mental health disabilities. Kalman Rupp, “Factors Affecting Initial Disability Allowance Rates for the Disability Insurance and Supplemental Security Income Programs: The Role of the Demographic and Diagnostic Composition of Applicants and Local Labor Market Conditions,” 72 Social Security Bulletin (2012), https://www.ssa.gov/policy/docs/ssb/v72n4/v72n4p11.html. ↩︎
  44. SSA, FY 2022 Congressional Justification at p. 13-14 (May 28, 2021), https://www.ssa.gov/budget/FY22Files/2022BO.pdf. ↩︎
  45. Id. ↩︎
  46. Id. at 13. ↩︎
  47. SSA, Committee on Finance, United States Senate, Statement for the Record, Grace Kim, Deputy Commissioner for Operations at 6-7 (April 29, 2021), https://www.finance.senate.gov/imo/media/doc/SSA%20Testimony%20Service%20Delivery %20COVID%20FINAL%20to%20SFC.pdf. ↩︎
  48. Id. at 8. ↩︎
  49. Id. at 4, 8. ↩︎
  50. Id. at 8-9. ↩︎
  51. Id. at 9. ↩︎
  52. SSA, FY 2022 Congressional Justification at p. 13 (May 28, 2021), https://www.ssa.gov/budget/FY22Files/2022BO.pdf. ↩︎
  53. KFF analysis of Census Bureau Household Pulse Survey, March 17 to March 29, 2021. ↩︎
  54. Id. ↩︎
  55. Id. ↩︎
  56. SSA, Monthly Statistics, April 2021 at Table 2 (released May 2021), https://www.ssa.gov/policy/docs/statcomps/ssi_monthly/index.html. ↩︎
  57. SSA, Committee on Finance, United States Senate, Statement for the Record, Grace Kim, Deputy Commissioner for Operations at 4-5 (April 29, 2021), https://www.finance.senate.gov/imo/media/doc/SSA%20Testimony%20Service%20Delivery %20COVID%20FINAL%20to%20SFC.pdf. ↩︎
  58. Id. at 5. ↩︎
  59. SSA, Monthly Statistics, April 2021 at Table 2 (released May 2021), https://www.ssa.gov/policy/docs/statcomps/ssi_monthly/index.html. ↩︎
  60. KFF, Analysis of Recent National Trends in Medicaid and CHIP Enrollment (April 2021), https://modern.kff.org/coronavirus-covid-19/issue-brief/analysis-of-recent-national-trends-in-medicaid-and-chip-enrollment/. ↩︎
  61. Id. ↩︎
  62. Id. ↩︎
  63. Id.; see also KFF, Medicaid Maintenance of Eligibility Requirements:  Issues to Watch (Dec. 2020), https://modern.kff.org/medicaid/issue-brief/medicaid-maintenance-of-eligibility-moe-requirements-issues-to-watch/. ↩︎
  64. Executive Office, of the President, Office of Management and Budget, Office of Information and Regulatory Affairs, OIRA Conclusion of EO 12866 Regulatory Review, Rules Regarding the Frequency and Notice of Continuing Disability Reviews, Withdrawn (Jan. 22, 2021), https://www.reginfo.gov/public/do/eoDetails?rrid=131391; 84 Fed. Reg. 63588-63601 (Nov. 19, 2019), https://www.federalregister.gov/documents/2019/11/18/2019-24700/rules-regarding-the-frequency-and-notice-of-continuing-disability-reviews. ↩︎
  65. See, e.g., KFF, Medicaid and CHIP Eligibility, Enrollment and Cost sharing Policies as of January 2019:  Findings from a 50-State Survey (March 2019), https://modern.kff.org/medicaid/report/medicaid-and-chip-eligibility-enrollment-and-cost-sharing-policies-as-of-january-2019-findings-from-a-50-state-survey// ↩︎
  66. 42 C.F.R. § 435.916 (f). ↩︎
  67. The Biden Plan for Full Participation and Equality for People with Disabilities, (last accessed 4/22/21), https://joebiden.com/disabilities/. This document refers to 1984 as the last time that SSI asset limits were increased. The increase adopted in 1984 raised asset limits incrementally over several years, with the last increment taking effect in 1989. 20 C.F.R. § 416.1205 (c). ↩︎
  68. Letter to Hon. Joseph R. Biden and Hon. Kamala Harris (April 16, 2021), https://www.brown.senate.gov/imo/media/doc/ssi_letter_41921.pdf. ↩︎
  69. KFF, The Effects of Medicaid Expansion under the ACA: Updated Findings from a Literature Review (March 2020) (see studies cited at endnotes 862-876), https://modern.kff.org/report-section/the-effects-of-medicaid-expansion-under-the-aca-updated-findings-from-a-literature-review-report/. ↩︎
  70. KFF, People with Disabilities Are At Risk of Losing Medicaid Coverage Without the ACA Expansion (Nov. 2020), https://modern.kff.org/medicaid/issue-brief/people-with-disabilities-are-at-risk-of-losing-medicaid-coverage-without-the-aca-expansion/. ↩︎
  71. KFF, Medicaid and CHIP Eligibility and Enrollment Policies as of January 2021:  Findings from a 50-State Survey (March 2021), https://modern.kff.org/medicaid/report/medicaid-and-chip-eligibility-and-enrollment-policies-as-of-january-2021-findings-from-a-50-state-survey/. ↩︎
  72. KFF, Medicaid Financial Eligibility for Seniors and People with Disabilities: Findings from a 50-State Survey (June 2019), https://modern.kff.org/medicaid/issue-brief/medicaid-financial-eligibility-for-seniors-and-people-with-disabilities-findings-from-a-50-state-survey/. ↩︎
  73. 20 C.F.R. § § 416.260, 416.264, 416.265, 416.268, 416.269. ↩︎
  74. 20 C.F.R. § § 416.905, 416.920. ↩︎
  75. 20 C.F.R. § § 416.920 (a)(4)(i); 416.972. ↩︎
  76. SSA, Substantial Gainful Activity (last accessed 4/22/21), https://www.ssa.gov/oact/cola/sga.html. ↩︎
  77. 20 C.F.R. § 416.920 (b). ↩︎
  78. 20 C.F.R. § 416.920 (a)(4)(ii). ↩︎
  79. 20 C.F.R. § 416.909. ↩︎
  80. 20 C.F.R. § 416.920 (a)(4)(iii). ↩︎
  81. 20 C.F.R. § 416.925; 20 C.F.R. Part 404, Subpart P, Appendix 1, Part A. ↩︎
  82. 20 C.F.R. § 416.925 (d). ↩︎
  83. 20 C.F.R. § 416.926. ↩︎
  84. 20 C.F.R. § § 416.214; 416.935. ↩︎
  85. 20 C.F.R. § 416.935 (b)(1). ↩︎
  86. 20 C.F.R. § 416.920 (a)(4)(iii), (d). ↩︎
  87. 20 C.F.R. § § 416.920 (a)(4)(iv); 416.945. ↩︎
  88. 20 C.F.R. § 416.960 (b). ↩︎
  89. 20 C.F.R. § 416.920 (a)(4)(iv). ↩︎
  90. 20 C.F.R. § § 416.920 (a)(4)(v), (g); 416.960 (c). ↩︎
  91. 20 C.F.R. § 416.966 (a). ↩︎
  92. 20 C.F.R. § 416.920 (a)(4)(v). ↩︎
  93. 20 C.F.R. § § 416.906; 416.924. ↩︎
  94. 20 C.F.R. § 416.924 (b), (c). ↩︎
  95. 20 C.F.R. § § 416.924 (d); 416.925 (b)(2)(i); 20 C.F.R. Part 404, Subpart P, Appendix 1, Part B. ↩︎
  96. 20 C.F.R. § 416.924 (d). ↩︎
  97. 20 C.F.R. § 416.926a. ↩︎
  98. 20 C.F.R. § 416.926a (b), (d), (e). ↩︎
  99. 20 C.F.R. § 416.926a (b), (g)-(l). ↩︎
  100. 20 C.F.R. § § 416.1003; 416.1010-416.1013; 416.1015. ↩︎
  101. 20 C.F.R. § § 416.1407; 416.1413; 416.1413a. ↩︎
  102. 20 C.F.R. § 416.1429. ↩︎
  103. 20 C.F.R. § § 416.1467; 416.1476. ↩︎
  104. 20 C.F.R. § 416.1481. ↩︎
  105. SSA, Hearings and Appeals, Average Wait Time Until Hearing Held Report (For the Month of March 2021), (last accessed 4/22/21), https://www.ssa.gov/appeals/DataSets/01_NetStat_Report.html. ↩︎
  106. 20 C.F.R. § 416.990 (d). ↩︎
  107. Id. ↩︎
  108. Id. ↩︎

Costs and Savings under Federal Policy Approaches to Address Medicaid Prescription Drug Spending

Authors: Rachel Garfield, Rachel Dolan, and Elizabeth Williams
Published: Jun 22, 2021

Issue Brief

Introduction

Several recent policy proposals address the cost of prescription drugs to both consumers and payers. Though attention in current federal actions is largely focused on Medicare and private insurance drug prices, federal legislation also has been recently introduced or enacted that would affect Medicaid prescription drug policy. Most recently, the American Rescue Plan included a provision that would eliminate the Medicaid rebate cap and save $14.5 billion between 2021-2030.

Congress has already started hearings on other legislation to target drug prices and could include such proposals in forthcoming budget reconciliation bills.  This brief analyzes leading federal approaches to address Medicaid prescription drug spending, discusses (where available) a range of cost estimates for each policy, and assesses what drives those estimates or where there is uncertainty in them. Key findings include (Table 1):

  • The recently enacted policy to eliminate the Medicaid rebate cap is estimated to save $14.5 billion in federal Medicaid spending between 2021-2030 and $17.3 billion between 2021-2031, though savings are to some extent dependent on manufacturer response to the policy. Other policies to increase Medicaid rebates, for example by increasing the minimum rebate amount for certain drugs, would likely generate similar scale potential savings for the Medicaid program.
  • Prohibiting spread pricing by pharmacy benefit managers (PBMs) would generate relatively small federal savings of nearly $1 billion over ten years, but the level of savings depends on state actions to address spread pricing and the extent of spread pricing across states. State estimates suggest larger savings than estimates of federal proposals.
  • Allowing importation of drugs would likely result in significant federal savings, but these would be to programs other than Medicaid. Importation is unlikely to have a large effect on Medicaid spending.
  • The “best price” requirement provides significant discounts for federal and state Medicaid drug spending and policies that modify or eliminate Medicaid best price rules are likely to increase federal spending on Medicaid but may result in savings for other payers.
Table 1: Federal Approaches to Address Medicaid Prescription Drug Spending
Cost EstimatesStatus of ProposalKey Factors Impacting Estimates
Eliminate Medicaid Drug Rebate Cap$17.3 billion in federal Medicaid savings over 2021-2031 (policy effective as of 2024)Enacted in the American Rescue Plan (P.L. 117-2)
  • Number and composition of drugs reaching the rebate cap
  • Manufacturer response
Limit or Prohibit PBM Spread Pricing$929 million in federal Medicaid savings over 10 yearsIncluded in H.R. 19; introduced in House and referred to Subcommittee on Health
  • State actions to limit spread pricing
  • Prevalence of spread pricing across states
Eliminate or Modify Medicaid Best PriceNot likely to produce savings and may increase costsFinal rule issued December 2020; Biden Administration issued proposed rule delaying provisions on 5/28/2021
  • Which drugs are subject to best price changes
  • Manufacturer behavior
Increase Minimum Rebate Amount for Certain Drugs$10 billion in federal Medicaid savings over 10 yearsMACPAC adopted recommendations to increase rebate amounts on certain accelerated approval drugs
  • Which drugs are subject to new minimum rebate
  • Manufacturer response
Allow Importation of Prescription Drugs$7 billion in federal savings over 10 years (across all federal programs)Biden administration has supported the importation rule in court but gave no timeline for approval of state proposals
  • Which drugs are subject to importation
  • If Medicaid is able to receive rebates in addition to importation discounts
SOURCE: CBO, Estimated Budgetary Effects of H.R. 1319, American Rescue Plan Act of 2021,March 2021; CBO, Prescription Drug Pricing Reduction Act of 2019, March 2020; CBO, A Comparison of Brand-Name Drug Prices Among Selected Federal Programs, February 2021; KFF, Pricing and Payment for Medicaid Prescription Drugs, January 2020; MACPAC High-Cost Specialty Drugs: Review of Draft Chapter and Recommendations, April 2021; CBO, S. 469, The Affordable and Safe Prescription Drug Importation Act, July 2017.

1.  Eliminate the Medicaid Drug Rebate Cap

Recent federal legislation has changed the structure of the Medicaid Drug Rebate Program (MDRP), which provides a significant offset to Medicaid drug spending, to lift current caps on rebate amounts. Under current law, manufacturers who want their drugs covered by Medicaid must enter a federal rebate agreement under which they rebate a specified portion of the Medicaid payment for the drug to the states, who in turn share the rebates with the federal government. The rebate amount is set by statute and includes two main components: a rebate based on a percentage of average manufacturer price (AMP) and an inflationary component to account for price increases. Because of the inflationary component, the calculated rebate on a drug whose price increases quickly over time could be greater than the AMP for that drug. However, the total rebate amount has been capped at 100% of AMP since 2010. As a result, manufacturers who hit the rebate cap do not face additional Medicaid rebates if they continue to increase list price. Proposals to modify the rebate cap have included raising it to a higher amount (e.g., 125% AMP) or eliminating it entirely and have had bipartisan support. As part of the American Rescue Plan Act enacted in March 2021, the 100% of AMP limit on Medicaid drug rebates will be eliminated starting January 1, 2024.

Estimating Federal Cost Savings

Eliminating the rebate cap is expected to reduce federal spending by more than $17 billion over ten years, an estimate that has been largely consistent over various versions of proposals related to the rebate cap. The CBO score of the provision to eliminate the rebate cap estimates a reduction in federal Medicaid spending of $14.5 billion over the 2021-2030 period and $17.3 billion over the 2021-2031 period. This estimate is based in CBO’s analysis that the rebate cap led to $3 billion in lost federal and state rebates in 2019 and translates to an approximately 5-8% drop1  in federal Medicaid prescription drug spending over 2021-2031 (states would also save, as statutory rebates are split between states and the federal government). This estimate is largely in line with other cost estimates related to the rebate cap. MACPAC’s review of estimated cost savings from changes to the rebate cap indicates that cost estimates for eliminating the rebate cap save between $15-20 billion in federal spending over 10 years and indicates that raising, versus eliminating, the cap would produce “about half as much savings.”

Estimates of savings under changes to the rebate cap are, to a large extent, based on analysis of how many and which drugs currently hit the rebate cap, information that is currently proprietary. The CBO generates its cost estimate based in part on data on actual AMPs and rebates collected through Medicaid. Such data is currently not publicly available, making it difficult to replicate or extend this analysis. Thus, it is difficult to predict which drugs or manufacturers will be most affected by the policy change. In an analysis of drug rebate data from 2015, MACPAC analysis (which found annual foregone rebates on par with the CBO estimate)2  found that about 18.5% of brand drugs (at the national drug code level) reached the rebate cap in that quarter. An analysis of 2017 data found a similar share of drugs potentially affected by the rebate cap (16%) and showed that, among the drugs analyzed, the distribution of potential effects was skewed: in that analysis, 85% of reduced rebates due to the cap were attributable to 25 drugs, most of which were for diabetes treatment. That analysis also showed that one insulin drug alone accounted for 38% of lost rebates and that foregone rebates were concentrated among a few manufacturers. Recent KFF analysis finds that insulin utilization in Medicaid is still largely concentrated among brand-name drugs. It also finds that gross (pre-rebate) Medicaid spending per insulin unit on diabetes drugs declined slightly from 2017-2019, though it is unclear whether this trend means diabetes drugs still account for most foregone rebates due to the cap (as it could mean that fewer drugs are increasing prices and hitting the cap or that prices have stabilized).3 

Other analysis concludes that drugs with steep price increases are most likely to be subject to the cap, since once those drugs hit the cap, they face no additional inflationary rebates under Medicaid but could gain revenue from other payers. KFF analysis of gross prescription drug spending in Medicaid finds that more than a third (34%) of drugs had price increases above inflation between 2015 and 2019,4  though not all these drugs hit the rebate cap. Drugs with fewer drugs in their drug class were more likely to have increases above inflation.5  While some analyses show Medicaid spending on specialty and biologic drugs has increased faster than non-specialty or “traditional” drugs, due at least in part to increases in the cost per claim, some of this may reflect changes in the composition of “specialty drugs” over time. Other analysis found that rebates were, on average, lower for specialty drugs compared to non-specialty drugs in Medicaid (60% versus 86%), due to both lower base rebates and lower inflationary rebates, indicating that specialty drugs may be less likely to hit the cap. Thus, it may be traditional drugs with large price increases and large rebates that are most likely to be hitting the cap. In analysis of gross spending per prescription, for example, we find that some of the largest price increases were in common classes such as antibiotics, antiemetics, sympathomimetic agents, and analgesics.

Cost savings under changes to the rebate cap also will be dependent on manufacturer responses to the change in policy. CBO indicates that actual federal savings under the current proposal to eliminate the rebate cap are subject to error due to difficulty in “forecasting future growth in drug prices and how drug manufacturers would change their pricing strategies if the cap on rebates were eliminated.” Manufacturers maintain that policies to increase Medicaid rebates create incentives to raise prices and may shift costs to other payers.6  In discussing potential outcomes under changes to the rebate cap, MACPAC explains that manufacturers could respond to the policy change by increasing launch prices for drugs or, far less likely, exiting the Medicaid program altogether. Other possible manufacturer responses could include shifting prices from brand-name to generic drugs, as there is more “room” below the current cap for generic drugs due to a lower minimum rebate (13% of AMP). Another possible challenge is potential increased gaming to inappropriately reduce reported AMP (or also best price) to reduce rebate liability once the AMP cap is eliminated. The rebate calculations rely on the pricing information reported by manufacturers; misclassified drugs or inaccurate price information in these files affects the rebate calculation. Further changes to Medicaid best price reporting in a final rule released in December 2020 may also create opportunities for gaming, but those provisions have now been delayed for six months by the Biden administration. On the other hand, it is possible that manufacturers may make no changes to their drug pricing if the additional Medicaid rebate paid is offset by increased revenue from other payers.

2.  Limit or Prohibit PBM Spread Pricing in Medicaid

Federal legislation could limit or prohibit “spread pricing” in Medicaid by pharmacy benefit managers (PBMs) by requiring “pass through” pricing that limits PBM fees. States and MCOs are increasingly utilizing pharmacy benefit managers (PBMs) in their Medicaid prescription drug programs. The financial responsibilities PBMs take on, including negotiating prescription drug rebates with manufacturers and dispensing fees with pharmacies, have generated considerable policy debate about price transparency and spread pricing. Spread pricing refers to the difference between the payment the PBM receives from the state or MCO and the reimbursement amount it pays to the pharmacy. Proposals to limit spread pricing may require “pass through pricing,” under which PBMs can retain only a “reasonable” administrative fee. Some states have limited spread pricing by eliminating the use of PBMs or requiring pass through pricing, but federal action could make this policy uniform nationally. A bill introduced in the 117th Congress would effectively prohibit spread pricing in both Medicaid managed care and Medicaid fee-for-service. Under the proposal, PBMs would be required to pass through actual pharmacy costs (net of rebates) to managed care plans or the state, charge only the actual cost of the drug plus a dispensing fee, and be provided only a reasonable administrative fee. Other potential federal policies in this area, including transparency or contractual requirements that could reduce spread pricing, are more limited than proposals to ban spread pricing outright.

Estimating Federal Cost Savings

Estimates of a federal proposal to eliminate spread pricing predict that it would lead to approximately $900 million in federal savings over 10 years, while some state analyses indicate higher degrees of spread pricing. A March 2020 CBO estimate of the federal proposal to require pass through pricing finds the spread pricing provision would produce federal savings of $929 million over 10 years, which translates to a less than 1% drop in federal Medicaid prescription drug spending. It is unclear what analysis or assumptions went into these estimates, but they are highly dependent on assumptions or understanding of the extent to which spread pricing currently exists in Medicaid. Several state reports have found relatively higher Medicaid costs due to spread pricing. For example, a 2018 report by Ohio’s state auditor found that PBMs cost the Medicaid program nearly $225 million through spread pricing in managed care. Similar analysis by the Massachusetts Health Policy Commission found that PBMs charged MassHealth MCOs more than the acquisition price for generic drugs in 95% of the analyzed pharmaceuticals in the last quarter of 2018. Michigan found that PBMs had collected spread of more than 30% on generic drugs and a report found that Medicaid had been overcharged $64 million. These state estimates clearly range widely, but existing state estimates are generally higher than the average $1.9 million a year per state that the CBO estimate impliesIt is possible that state analyses occurred in states in which this issue is more problematic or that CBO’s estimates assume state activity to curb spread pricing has already addressed some of these costs.

The inclusion or exclusion of fee-for-service prescription drug spending may affect the scale of potential savings from spread pricing limits. The large majority of states that use comprehensive managed care to deliver services to Medicaid enrollees generally include prescription drugs in those contracts, though many MCO states carve out certain drugs or entire drug classes and, in recent years, a growing number of states are making or considering pharmacy carve outs (likely in an effort to negotiate higher supplemental rebates). In 2019, nearly two-thirds (64%) of gross Medicaid prescription drug spending was through MCOs.7 

MCOs have been the primary target of efforts to curb spread pricing, as MCOs are not bound by the same rules regarding ingredient cost reimbursement that prescription drug payments through Medicaid fee-for-service (FFS) are subject to. However, current spread pricing proposals would apply to fee-for-service in addition to managed care, to the extent that states are using PBMs or PBM-like entities to administer their FFS pharmacy benefit. It is unclear to what extent including FFS in spread pricing bans increases savings. One analysis that examined “markup” in Medicaid generic drug prescriptions—defined in that analysis as the difference between gross reimbursement and acquisition cost, the benchmark used to determine Medicaid reimbursement for ingredient costs— found that in Q2 2020 approximately 7.5% of prescriptions in FFS had “high markup,” or gross reimbursement at least $15 above NADAC. However, it is not necessarily the case that those price differences reflect PBM spread (versus, for example, dispensing fees which are often $10-$15).

To the extent that spread pricing policies lead states to make different decisions about delivering pharmacy benefits through managed care, the policy could have downstream spending effects. For example, additional carve-ins could lead to different utilization control policies and thus different spending, though many states currently align those policies across FFS and MCOs.

Federal savings tied to a specific proposal are, in part, dependent on whether additional states take action to curb spread pricing. Increased state action to limit or prohibit spread pricing would likely decrease the level of federal savings estimated under a national ban on spread pricing, though—because Medicaid prescription drug costs are shared by states and the federal government— ultimately the federal government does share in cost savings due to state action in this area. State actions that focus on increasing transparency around PBM pricing could enable more precise estimates of federal savings. As of July 2019, at least 15 states had prohibited spread pricing or planned to prohibit spread pricing in 2020 and other states have placed additional transparency requirements on PBMs.

3.  Eliminate or Modify Medicaid Best Price

Federal action could ease rules on Medicaid “best price,” either as part of other changes to the rebate formula or to facilitate value-based payment arrangements. The statutory formula for Medicaid rebates includes a “best price” component that ensures that Medicaid receives the lowest price offered by a manufacturer. 8  Best price is defined as the lowest available price to any wholesaler, retailer, or provider, excluding certain government programs, such as the health program for veterans. The best price benchmark is especially important for Medicaid, as brand drugs comprise a large share of spending and their rebates are often larger than the minimum rebate amount. However, the Medicaid best price provision is often cited by manufacturers and other stakeholders as a barrier to discounts and value-based contracts for other payers, since those same discounts would apply to Medicaid as well. Recent policy proposals to modify best price are largely aimed to provide exceptions for other payers. These include allowing exceptions for value-based arrangements, entirely eliminating the best price provision (which may be offset by an increase in the minimum rebate amount), and setting uniform reporting rules for prices under value-based arrangements. In late December 2020, the Trump Administration issued a final rule that allows manufacturers to report multiple “best prices” if they participate in certain types of value-based payment arrangements and allows flexibility in how manufacturers calculate which drugs apply to the VBP and the length of time to revise initial best price reports. The Biden Administration recently released a proposed rule to delay implementation of the best price changes for six months, to July 2022.

Estimating Federal Costs

Rough estimates indicate that best price leads to substantial discounts in federal and state Medicaid prescription drug spending. In the final rule, CMS assumes close to no spending impact from changes to best price and small savings due to uptake of VBP arrangements. Specifically, the agency estimated an upper and lower range of combined federal and state savings between $0 and $228 million over 5 years for provisions that make best price reporting changes to facilitate more widespread adoption of subscription or VBP arrangements in the commercial sector. CMS notes that the savings will likely be on the lower end of estimates (that is, close to zero) unless there is a significant increase in the number of states participating in the agreements. However, policies to eliminate or alter best price have the potential to generate large costs to Medicaid. Recent analysis from the CBO indicates that the average Medicaid rebate for select9  brand-name drugs was 77% of retail price in 2017, with about half of that due to the base rebate and half due to inflationary rebates. This finding means the average base rebate was approximately 38.5%, more than 15 percentage points higher than the minimum rebate amount of 23.1%. In that year, Medicaid gross spending on brand-name prescription drugs was $50 billion. Applying an approach used in earlier analysis10 , we calculate that best price led to approximately $7.7 billion in discounts (shared by the federal government and states) above the minimum rebate amount in 2017.

Using another approach, CBO also shows that best price was 59% of AMP, on average for select brand-name drugs. Using the average AMP ($509) and best price ($298) amounts included in the CBO analysis, best price leads, on average, to an addition $94 rebate per brand name prescription, about an 80% increase over the base rebate amount.11 

The ultimate cost impact of changes to Medicaid best price depends on how the policy is enacted and to what drugs it applies. The range of policy options regarding best prices makes it difficult to assess a cost effect, as proposals could include an offset to easing best price such as increasing rebates. Under the specific policy issued in December 2020, of which portions are currently under review, the actual cost to Medicaid will depend on which drugs are included in VBP arrangements. The limited number of VBP arrangements under way to date have largely targeted costly “specialty drugs” with exceptionally high costs or with high costs plus relatively high demand. Using the approach above to calculate discounts due to best price for all prescription drugs, CBO indicates that base rebates for “high-priced drugs” in Medicaid were 29%, lower than those overall for brand-name drugs. KFF analysis12  finds that gross Medicaid spending for the 50 most expensive drugs (ranked by spending per prescription) was $1.4B in 2019, leading to an estimate that best price leads to $85 million per year in discounts for these drugs. Limiting the analysis to the top 10 most costly drugs, the estimate drops to $25 million. These calculations provide illustrative ranges of the scale of costs if best price is no longer available for these very high cost drugs.

The cost of changing rules for best price also depends in part on the extent to which reporting may introduce errors or allow for gaming by manufacturers. Because Medicaid rebate calculations rely on pricing information reported by manufacturers, inaccurate price information affects the rebate calculation and may reduce rebates and increase net spending. Particularly for policies that allow manufacturers to report more than one best price or choose which best price to report, it is possible that the policy will create substantial opportunities for manufacturer gaming and weaken compliance overall with the best price requirement; this gaming could further raise federal and state Medicaid costs. While manufacturers will still be required to report best prices outside of VBP arrangements under the December 2020 regulations, nothing prohibits them from shifting certain drugs entirely to VBP arrangements, which would only offer discounts to states that participate in those arrangements. It is unclear to what extent manufacturer behavior may affect ultimate costs or savings under the rule.

Federal savings are also dependent on which rebates and discounts are included in the best price calculation. There is uncertainty over the extent to which manufacturers already include PBM rebates in best price, the relative importance of those manufacturers to Medicaid drug spending and rebates, and how much their PBM rebates would affect how best price is calculated, relative to discounts that currently are incorporated into best price.  There are no cost estimates on an explicit requirement that commercial PBM rebates be included in best price calculations by manufacturers.  According to the HHS Office of Inspector General, there is a wide range of assumptions taken by manufacturers: most include some PBM rebates, some include all and some do not include any PBM rebates.  Those that do not include PBM rebates claim that the PBM rebates are not reflected in retail prices faced by consumers.  An explicit requirement likely may not produce “scoreable” savings on the assumption that many of the PBM rebates are already included in best price under current law.

4.  Increase Minimum Rebate Amount for Certain Drugs

Federal action could aim to increase the minimum Medicaid rebate amount based on launch price or other factors that define a high-cost drug. The Medicaid rebate amount is set is statute based on a formula that sets the rebate at a minimum amount (for brand name drugs, the greater of 23.1% of AMP or the difference between AMP and best price; for generic drugs, 13% of AMP). As discussed above, the MDRP also includes a penalty for price increases above inflation, capped at 100% AMP until 2024, to address the issue of increasing drug prices over time. However, manufacturers producing new drugs may set their launch prices high in an effort to capture greater net reimbursement. For example, in its estimate of the effect of minimum rebate increases passed under the ACA, CBO predicted that manufacturers would increase launch prices by about 4% and that supplemental rebates would decrease. Subsequent research has had mixed findings on how the increase in base rebate led to other pricing responses, and specific Medicaid rebate proposals could target other aspects of pricing such as launch price. One potential federal legislative action to combat this response is an increase in the statutory (federal) minimum rebate, with a sliding scale based on launch price or another factor that defines a high-cost drug, to deter high launch prices for new drugs or simply increase minimum rebates on high-cost drugs. For example, MACPAC recently considered changes to the rebate formula for specific categories of high-cost drugs, including drugs approved through the FDA’s accelerated approval process, and the Commission adopted a recommendation that Congress increase the base minimum rebate on drugs approved through the accelerated-approval pathway with an additional inflationary rebate for drugs that have not completed confirmatory trials in a specified number of years.

Estimating Federal Cost Savings

Federal savings due to proposals to link rebates to launch prices or increase minimum rebate amounts for specific drugs are highly dependent on the specific proposal or drugs targeted, but estimates of current proposals indicate federal savings may be relatively small. CBO scored the MACPAC proposal to increase the base rebate for accelerated approval drugs by 10 percentage points, with a 20 percentage point increase in the inflationary rebate if the manufacturer has not completed confirmatory trials within five years, at federal savings up to $50 million in the first year and up to $1 billion over the first five years. That estimate is largely in line with other calculations that, while the policy could lead to substantial savings on a given specific, high-cost drug accelerated approval drugs account for a very small share of overall Medicaid spending.

Broadening rebate increases to target other groups of specialty drugs could substantially increase federal savings. For example, increasing the minimum rebate amount for specialty drugs by 10 percentage points (to 33.1% AMP) could increase rebates paid for specialty brand-name drugs from the current average base rebate for these drugs (29%) by 4 percentage points. Previous analysis indicates that specialty drugs account for 35% of total net Medicaid expenditures. If all these drugs were affected by the increase, it could lead to approximately $900 million more in statutory rebates (shared by states and the federal government).13  It is unclear how such a policy would be applied, as there is no uniform definition or classification of “specialty” drug. If the policy targeted only very high-cost drugs, such as the top 50 most costly drugs, savings would be lower: an additional 4 percentage point rebate on gross spending of $1.4 billion for these drugs translates to approximately $57 million. The increased rebates would be shared by the federal and state governments, so federal savings would be lower. In addition, some of the upfront savings from the increase in the minimum rebate would be offset by lower reductions in net spending due to best price discounts, supplemental rebates and inflation-related rebates that would otherwise ramp up over time for such drugs.

Further expanding policies to increase minimum rebates to target drugs with high launch prices could lead to substantial short-term savings, though long-term effects are uncertain. Analysis of drug prices has indicated that, while year-to-year prices increases have slowed in recent years, launch prices have increased substantially: between 2006 and 2018, it found that median launch cost per month of treatment for brand-name drugs increased 934%; while launch prices dropped in 2019, the analysis still found a 381% increase in median launch prices between 2006 and 2019. The analysis showed increases on a similar scale for launch prices for generic drugs. KFF analysis of Medicaid rebate data shows that the average gross spending per prescription for drugs new to the MDRP from 2011 to 2018 was more than 2700% higher for brands and 468% higher for generics than that for other drugs in the class.14  Median price differences were smaller (less than 300% for brands and 24% for generics), indicating that some very high-priced new drugs drive these differences. Some of these “new” drugs may have been new packaging or reformulations of existing drugs, which would lead to an underestimate of launch prices of new drugs. Altogether, gross Medicaid spending for the most costly (top 10%) of new drugs in Medicaid averaged more than $4 billion per year from 2015-2018. Medicaid is most likely obtaining rebates for these drugs similar to those for “high priced drugs,” which CBO reports are 29% or just above the base rebate, compared to an average rebate for high-priced drugs of 53%. Thus, increasing the base rebate for costly new drugs in their first year could lead to federal and state savings.

There are major unknown factors in predicting costs or savings of policies targeted at launch prices or targeted to specific high-cost drugs, including when specific products will come to market and the extent to which Medicaid rebate policy drives overall market prices. Recent analysis of the implications of the drug pipeline for Medicaid indicates that there are multiple, very high-cost drugs coming to market that could lead to substantial drug spending within Medicaid, though it is unclear exactly when these drugs will be on the market and prescribed. State Medicaid programs could impost utilization control measures on these drugs, which would further limit costs. In addition, Medicaid’s ability to drive market prices such as launch price through changes to MDRP may be limited. Other analyses have noted that, while there is some evidence that Medicaid policy influences prices to other payers, manufacturers pricing decisions also are driven by a range of factors besides Medicaid reimbursement, including competition, coverage decisions by other payers, and long-term profit calculations. Research from other countries has also shown that negotiating launch prices does not necessarily lead to lower launch prices.

5.  Allow Importation of Prescription Drugs

Some federal proposals allow buyers, including state Medicaid programs, to import drugs from foreign markets to access lower prices generally available in other countries. Federal law already allows pharmacists and wholesalers to import prescription drugs directly from Canada, subject to specified limitations and safeguards. Some importation proposals focus on allowing additional actors, such as states and other entities (including consumers) to import drugs, while others would allow importation from additional countries. In fall 2020, the Trump Administration issued a final rule and FDA guidance for industry creating new pathways for the importation of drugs from Canada and other countries by pharmacists, wholesales, states, and certain entities, subject to specified limitations and safeguards. The law requires importation to result in a significant reduction in drug costs and requires states to submit a plan for approval to the FDA. While some states have developed importation proposals, few have moved forward with implementation due to barriers related to regulation, safety and overall financial impact. While Biden supported importation during the Presidential campaign, it is unclear if the Biden Administration will approve any state plans to move forward with implementation of an importation proposal. In a recent court filing, the Biden Administration indicated that implementation and approval of state plans for importation would be difficult and that Canada would oppose such efforts.

Estimating Federal Cost Savings

While importation proposals are estimated to generate federal savings, the savings generated on behalf of Medicaid are likely small. Federal programs, which use mechanisms such as the best price provision in Medicaid and the federal supply schedule, already pay among the lowest prices in the market. CBO scored the impact of broad importation policies in a 2003 importation bill, which would have allowed pharmacists, wholesalers and individuals to import drugs from 25 countries, and estimated estimated small reductions in spending by federal programs—just $2.9 billion across Medicaid, FEHB, TriCare, and Medicare over the 2004-2013 period. Though current proposals are more limited in scope, the landscape has changed substantially since the 2003 bill, which came before the creation of Medicare Part D (which increased federal subsidy of prescription drugs) as well as changes to Medicaid drug rebates that have increased the amount of rebates paid to states and the federal government. A more recent CBO score estimates federal savings of importation legislation at $6.8 billion over ten years, but does not specify savings by program. In its final rule, the FDA did not provide estimates of importation savings due to significant uncertainty around the number of participants in the importation program as well as eligible drugs and their relative prices, but noted savings would likely be less than other, more broad proposals.

States that have developed importation plans have also developed cost savings estimates for their proposals and show limited Medicaid savings. Vermont’s report concluded that importation would not generate significant savings for the Medicaid program, largely due to the state’s rebate agreements. Florida’s report on drug importation found notable savings under importation, but the analysis removed drugs that were already deeply discounted in Medicaid and would not yield any greater savings or were ineligible for inclusion due to other restrictions. Thus, it is not clear to what extent savings would accrue to Medicaid. Medicaid wholesalers and pharmacists are included as eligible importers in Florida’s importation law but would likely only import drugs that did not receive significant Medicaid rebates.

Key factors affecting estimates related to importation include whether Medicaid rebate rules apply to imported drugs as well as how imported drugs feed into Medicaid price benchmarks.   Due to the high rebate amounts Medicaid receives, unless states could claim rebates on top of lower imported prices, imported prices would likely not be lower than net Medicaid prices. However, CMS guidance on the recent FDA final rule states that drugs imported from Canada under this rule are not eligible for rebates and would not be reported for best price. Importation also has implications for pharmacy reimbursement. Medicaid does not pay manufacturers directly for drugs but rather reimburses pharmacies for their acquisition costs. If importation lowers acquisition costs (which is the goal of such policies), pharmacy rates would need to be adjusted to account for those lower acquisition costs for Medicaid to realize lower prices  but the mechanism for tracking and reporting dispensing of imported drugs is unclear. The number of states that take up the option to import drugs as well as the specific drugs imported also would have significant implications for any cost savings.

Looking Ahead

Recently introduced legislation targets prescription drug prices for both Medicaid and other payers and includes several of the policy proposals analyzed here, and it is possible that additional policy proposals or legislation will be introduced. In addition, states are taking a range of actions in Medicaid prescription drug policy, some of which directly interact with federal proposals and their likely costs. Prescription drug spending growth remains an area of concern for states, particularly payment for new, high cost therapies, and states may continue to adopt new policies in the absence of federal action. Understanding the cost and savings implications of policies currently under discussion, as well as the factors driving those estimates or uncertainty in them, can help policymakers and others assess the relative impact of policy options.

This work was supported in part by Arnold Ventures. We value our funders. KFF maintains full editorial control over all of its policy analysis, polling, and journalism activities.

We are grateful to Edwin Park and Rena Conti for their input into the policy options included and considerations for estimating or understanding their potential costs.
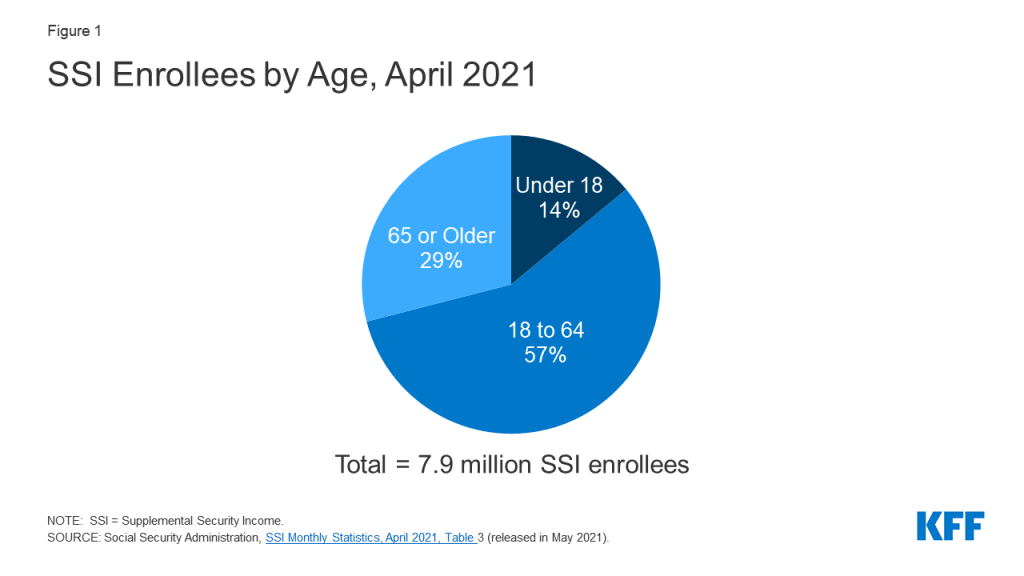
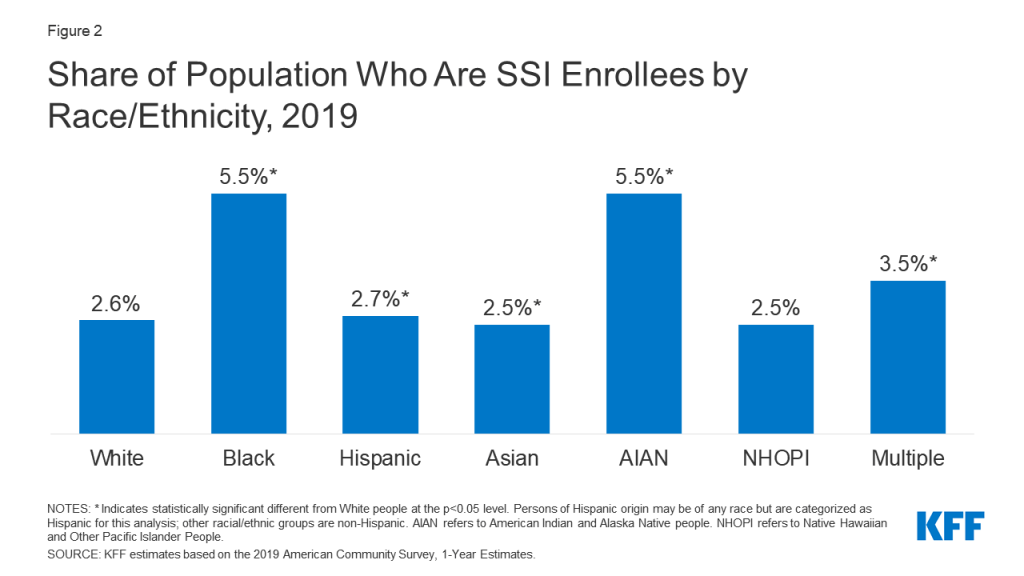
Endnotes

  1. The National Health Expenditure Accounts report $20.9 billion in federal Medicaid prescription drug expenditures in 2019. Assuming spending is flat, the cost estimate translates to an 8% drop in federal Medicaid spending over the period. Assuming spending grows at the same average annual rate as the previous 10-year period, it translates to a 5% drop in federal Medicaid spending. Note that the policy would not be in effect for the entire budget period, since it does not go into effect until 2024. ↩︎
  2. MACPAC’s analysis finds $690 million per quarter in lost rebates; extrapolating this quarterly estimate leads to an annual estimate of $2.8 billion, on par with the CBO estimate of $3 billion in 2019. ↩︎
  3. Industry analysis of fee-for-service claims shows increases in net costs per claim for insulin from 2018-2019, indicating smaller rebates relative to gross spending at least on certain drugs in this class that could reflect these drugs continuing to hit the rebate cap. ↩︎
  4. This analysis, based on the State Drug Utilization Data, is based on spending per unit and only includes drugs that appeared in the data in both 2015 and 2019. ↩︎
  5. Among drug classes in which more than half of drugs increased faster than inflation, the median number of drugs was 7.5, compared to a median of 56.5 among classes in which less than half of drugs increased faster than inflation. ↩︎
  6. PhRMA, Comments Of The Pharmaceutical Research And Manufacturers Of America, (PhRMA 2018), https://www.phrma.org/-/media/Project/PhRMA/PhRMA-Org/PhRMA-Org/PDF/P-R/PhRMA-RFI-Comments-on-HHS-Blueprint-to-Lower-Drug-Prices-and-Reduce-Out-of-Pocket-Costs5.pdf ↩︎
  7. KFF analysis of 2019 State Drugs Utilization Data (SDUD) data, https://www.medicaid.gov/medicaid/prescription-drugs/state-drug-utilization-data/index.html. ↩︎
  8. The rebate amount for brand-name drugs is a defined percent of Average Manufacturer Price (AMP) or the difference between AMP and “best price,” whichever is greater. Best price only applies to brand drugs; generic drug rebates are calculated based on 13% of AMP. ↩︎
  9. The drugs included in the CBO analysis accounted for 62% of total spending on brand-name drugs in Medicaid in 2017. Congressional Budget Office, A Comparison of Brand-Name Drug Prices Among Selected Federal Programs (CBO, February 2021), https://www.cbo.gov/system/files/2021-02/56978-Drug-Prices.pdf Our analysis assumes that the average rebate amount also applies to the 38% of brand-name drugs not included in the CBO analysis. ↩︎
  10. That analysis, conducted by Edwin Park and Andrea Noda, calculated $5 billion in discounts due to best price. The difference in these estimates is related to the higher rebate percentage in the 2021 CBO report compared to the 2019 CBO report upon which the earlier estimates were based as well as growth in Medicaid spending on brand-name drugs between 2015 and 2017. ↩︎
  11. This estimate is based on calculating an average minimum rebate of $118 (23.1% of the average $509 AMP) compared to an average rebate of $211 due to best price (AMP minus best price), a difference of $93. Over the total number of brand-name prescriptions covered by Medicaid in 2017 (102 million), this average savings translates to more than $9.5 billion in additional discounts due to best price. However, the CBO analysis is based on standardized prescriptions, while the 102 million prescriptions are not standardized and are simple counts at the NDC level. ↩︎
  12. Based on analysis of 2019 State Drug Utilization Data (SDUD). We ranked drugs according to the cost per prescription; this analysis therefore does not reflect cost per course of treatment and is only illustrative of the scale of best price savings for very high cost drugs. ↩︎
  13. This rough calculation assumes an additional 4 percentage point rebate on approximately 35% of gross Medicaid drug spending. ↩︎
  14. This calculation is based on gross spending per prescription for drugs for which an NDC code newly-appears in the State Drug Utilization Data (SDUD) between 2011 and 2018. Because SDUD suppresses data for drugs with a small number of claims, and because many new NDCs have spending suppressed in the first year they appear, we calculated gross spending per prescription for the second year for which an NDC newly-appears in the data. Still, about a third of drugs for which an NDC newly-appears in the SDUD data have data suppressed even in subsequent years. We compared the gross spending per prescription for new NDCs to median gross spending per prescription for other drugs in the same therapeutic class that year. A small number of drugs (0.4%) did not have a comparison therapeutic class due to being the only drug in their class that year and were excluded. ↩︎
News Release

Although Their Share of the Market Varies By State, Enrollment in Medicare Advantage Plans Has More Than Doubled Over the Past Decade, with More than 4 in 10 Medicare Beneficiaries Now Enrolled in the Private Plans

Three KFF Analyses Examine the Latest Data and Trends in Medicare Advantage Enrollment, Premiums, Plan Benefits, Out-of-Pocket Limits, Cost Sharing, Star Ratings and Bonuses, and More

Published: Jun 21, 2021

The private plans known as Medicare Advantage now cover more than 4 in 10 Medicare beneficiaries, reflecting a more than doubling of enrollment over the past decade even as the plans remain a far larger presence in some states than others, according to a new KFF analysis.

More than 26 million of the nation’s nearly 63 million Medicare beneficiaries are enrolled in Medicare Advantage plans in 2021. The share varies considerably by state, ranging from less than 20 percent in Vermont, Maryland, Alaska, and Wyoming, to more than 50 percent in Minnesota, Florida, and Puerto Rico, the analysis finds.

Enrollment rates also vary widely across counties, within states. In Florida, for example, it ranges from 16 percent in Monroe County (Key West) to 73 percent in Miami-Dade County. Nationally, 29 percent of Medicare beneficiaries live in a county where more than half of all Medicare beneficiaries are enrolled in Medicare Advantage plans.

The new analysis is one of three released by KFF today that examine various aspects of Medicare Advantage, a type of Medicare coverage that the Congressional Budget Office has projected will cover 51 percent of all Medicare beneficiaries by 2030.

One brief provides current information about Medicare Advantage enrollment, including the types of plans in which Medicare beneficiaries are enrolled, and how enrollment varies across geographic areas. A second analysis describes Medicare Advantage premiums, out-of-pocket limits, cost sharing, extra benefits offered, and prior authorization requirements. A third compares Medicare Advantage plans’ star ratings and federal spending under the quality bonus program.

Among other key findings:

• Nine in ten Medicare Advantage enrollees are in plans that include prescription drug coverage and nearly two-thirds of these enrollees (65%) pay no premium other than the monthly Medicare Part B premium ($148.50 in 2021).

• Virtually all Medicare Advantage enrollees (99%) would pay less than the traditional Medicare Part A hospital deductible of $1,484 for an inpatient stay of three or fewer days. But for a six-day stay or longer, about half (53%) would incur higher costs than beneficiaries in traditional Medicare with no supplemental coverage.

• In 2021, the weighted average out-of-pocket limit for Medicare Advantage enrollees is $5,091 for in-network services and $9,208 for in-network and out-of-network services combined. For enrollees in HMOs, the average out-of-pocket (in-network) limit is $4,566.

• Most enrollees in individual Medicare Advantage plans have access to some benefits not covered by traditional Medicare, including eye exams and/or glasses (99%), telehealth services (94%), dental care (94%), a fitness benefit (93%) and hearing aids (93%). Other benefits are offered far less frequently, such as a meal benefit (55%), transportation (37%), and in-home support services (7%), and when they are offered, tend to be offered more frequently in special needs plans.

• More than 80 percent of Medicare Advantage enrollees in 2021 are in plans that receive bonus payments from Medicare based on quality star ratings, substantially higher than the share in 2015 (55%). Spending on bonus payments to Medicare Advantage plans totals $11.6 billion in 2021, almost four times the amount in 2015.

The full analyses are available online and include:

Medicare Advantage in 2021: Enrollment Update and Key Trends

• Medicare Advantage in 2021: Premiums, Cost Sharing, Out-of-Pocket Limits and Supplemental Benefits

Medicare Advantage in 2021: Star Ratings and Bonuses

For more data and analyses about Medicare Advantage, visit kff.org

Asian Immigrant Experiences with Racism, Immigration-Related Fears, and the COVID-19 Pandemic

Authors: Samantha Artiga, Latoya Hill, Bradley Corallo, and Jennifer Tolbert
Published: Jun 18, 2021

Summary

Asian immigrants have faced multiple challenges in the past year. There has been a rise in anti-Asian hate crimes, driven, in part, by inflammatory rhetoric related to the coronavirus pandemic, which has spurred the federal government to make a recent statement condemning and denouncing acts of racism, xenophobia, and intolerance against Asian American communities and to enact the COVID-19 Hate Crimes Act. At the same time, immigrants living in the U.S. have experienced a range of increased health and financial risks associated with COVID-19. These risks and barriers may have been compounded by immigration policy changes made by the Trump administration that increased fears among immigrant families and made some more reluctant to access programs and services, including health coverage and health care. Although the Biden administration has since reversed many of these policies, they may continue to have lingering effects among families.

Limited data are available to understand how immigrants have been affected by the pandemic, and there are particularly little data available to understand the experiences of Asian immigrants even though they are one of the fastest growing immigrant groups in the U.S. and are projected to become the nation’s largest immigrant group over the next 35 years. To help fill these gaps in information, this analysis provides insight into recent experiences with racism and discrimination, immigration-related fears, and impacts of the COVID-19 pandemic among Asian immigrant patients at four community health centers.

The findings are based on a KFF survey with a convenience sample of 1,086 Asian American patients at four community health centers. Respondents were largely low-income and 80% were born outside the United States. The survey was conducted between February 15 and April 12, 2021. Key findings include:

  • One in three (33%) respondents report that they have personally felt more discrimination based on their racial/ethnic background since the COVID-19 pandemic began in the U.S. Asian health center respondents report facing a range of negative experiences due to their racial or ethnic background over the past 12 months, including 14% who say they experienced a personal verbal or physical attack due to their race/ethnicity.
  • Many respondents have immigration-related fears, and most say they don’t have enough information about how recent immigration policy changes affect their family. Over four in ten (44%) Asian health center respondents say they worry a lot or some that they or a family member could be detained or deported. One quarter (25%) say they or a member of their household did not apply for or stopped participating in a government program to help pay for health care, food, or housing in the past year due to immigration-related fears. Over half (54%) say they do not have enough information about how recent changes to U.S. immigration policy might impact them or their family.
  • Asian health center respondents report negative health and financial impacts from the COVID-19 pandemic. Nearly half (48%) of respondents say the COVID-19 pandemic negatively affected their ability to pay for basic needs like housing, utilities, and food, and over half (54%) say someone in their household experienced job or income loss due to the pandemic. Over four in ten (43%) report negative effects on their mental health.
  • Nearly six in ten (58%) respondents say they have worried at some point that they have been exposed to coronavirus. Most (60%) of those who worried about being exposed say they have been tested for the virus. Among those who worried about exposure but say they have not been tested, the most frequently cited reasons for not getting tested were thinking they could isolate at home (31%) or not knowing where to get tested (26%). Some also say concerns about costs (13%), effects on ability to work (12%), and fears of negative impacts on their or a family member’s immigration status (10%) are reasons for not getting tested. The large majority of Asian health center patients who responded say they are willing to get a COVID-19 vaccine, with nearly two in three (64%) wanting to get it as soon as possible at the time the survey was fielded.

Approach

The findings in this report are based on responses from a convenience sample of Asian patients at four community health centers. KFF worked with the Association of Asian Pacific Community Health Organizations (AAPCHO) and community health center staff to develop and field the survey. Because the survey is based on a convenience sample, the findings are not generalizable to a broader population and cannot be benchmarked against other population-based surveys. Respondents are limited to four locations and may be lower income than Asian immigrants overall as they are patients of federally qualified health centers serving a predominantly low-income population. Further, as patients of a community health center, respondents are connected to a source of health care. Despite these limitations, the findings increase the knowledge base for understanding Asian immigrant experiences, which remains very limited. (See Methods for more details.)

The health centers that fielded the survey serve a predominantly Asian, low-income population that likely includes many immigrants. Four health centers fielded the survey: Asian Health Services in Alameda County, CA; North East Medical Services, in San Francisco, CA; HOPE Clinic in Houston, TX; and International Community Health Services (ICHS) in King County, WA. Overall, 79% of patients at these health centers identify as Asian; over 87% have income below 200% of the federal poverty level, including 54% who have income below poverty; and 12% are uninsured.1  Health centers do not collect information on patient immigration status, but nearly seven in ten patients at these health centers are best served in a language other than English.2 

Mirroring the patient populations served by the health centers, respondents include Asian American patients who are largely low-income and born outside the United States. Overall, a total of 1,086 survey respondents self-identify as Asian patients of one of the health centers. Among Asian patient respondents, over six in ten (62%) identify as Chinese and roughly one in five (18%) identify as Vietnamese, with the remaining respondents representing a broad range of ethnic backgrounds. Eight in ten (80%) report that they were born outside the U.S. The remaining share report they were U.S.-born; however, these respondents may have an immigrant family member living in their household as many express immigration-related concerns in their survey responses. Over seven in ten (72%) respondents report total annual family income below $40,000, and 15% report they were uninsured.

Respondents include a larger share of patients age 65 or older compared to the total patient population served by the health centers. Nearly four in ten respondents (39%) are age 65 or older compared to 20% among the total patient population of the health centers. The higher share of respondents age 65 or older reflects that the health centers fielded the survey during the time they began COVID-19 vaccination efforts, which were initially focused on people in this age group.

Over half of respondents (57%) are patients at either of the two California-based health centers, while about a third (32%) are patients with ICHS in Washington state, and 11% are patients at HOPE clinic in Texas. California health center respondents are more likely than other health center respondents to be under age 65 (69% vs. 51%) and less likely to have lower household income (<$40,000 per year) (65% vs. 80%). They also are more likely to be Chinese (71% vs. 49%) and less likely to be Vietnamese (13% vs. 24%).

Given that the respondents are older than the overall patient population for these health centers, we examine findings by age to identify key differences in experiences of adults ages 18-64 and those ages 65 and older. In addition to comparing findings by age group, we also examine differences between California health center respondents vs. other health center respondents. The data allowed for comparisons between California health center respondents and other health center respondents, but the ability to make comparisons for Washington and Texas, specifically, was limited due to sample size restrictions. In addition, we highlight differences by gender and parental status (i.e., whether respondents are parents or guardians of children under age 18 living in their household). We also identify differences between Chinese and Vietnamese respondents; comparisons for other ethnicities were not possible due to sample size restrictions. All differences mentioned in the brief are significant at the .05 level.

Findings

Experiences with Racism and Discrimination

One in three (33%) Asian health center respondents say they have personally felt more discrimination based on their racial/ethnic background since the COVID-19 pandemic began in the U.S (Figure 1). Roughly three in ten indicate that they have not felt any discrimination (28%) or that they have felt about the same level of discrimination (28%), while less than one in ten (9%) report less discrimination.

Figure 1: 1 in 3 Asian Health Center Respondents Have Felt More Discrimination Since the Coronavirus Pandemic Began

The share reporting more discrimination since the pandemic began is somewhat higher among parents (37%) than those without children in the home (30%) and among adults under age 65 (35%) compared to adults over age 65 (28%). Chinese respondents are more likely than Vietnamese respondents to say that they have felt about the same level of discrimination since the start of the pandemic (30% vs. 19%) but less likely to say they have felt no discrimination (28% vs. 36%). Those who are 65 or older are more likely than those under age 65 to say that the amount of discrimination they feel has not changed, while those under age 65 are more likely to say they have not felt any discrimination since the pandemic began. California health center respondents are more likely to report both more and less discrimination since the start of the pandemic compared to those in other locations (Texas and Washington), while those in other locations are more likely to say they have felt the same level of discrimination.

Asian health center respondents say they have faced a range of negative experiences due to their racial or ethnic background over the past 12 months, including verbal and physical attacks. Over one in three (35%) report receiving poorer service than other people due to their racial or ethnic background at a store or other public place, one in five (20%) say they have been being denied a job for which they were qualified, and 18% report being denied housing they could afford. Others report more personal attacks based on their race/ethnicity, including 16% who say they were criticized for speaking a language other than English in public, 15% who say they have been accused of “spreading or causing COVID-19” or were told that they should go back to their home country, and 14% who say they were verbally or physically attacked (Figure 2).

Figure 2: Asian Health Center Respondents Report A Range of Recent Negative Experiences Due to Their Race or Ethnicity

Those who are age 65 or older are more likely to say they have received poorer service (44% vs. 30%) or been denied housing (30% vs. 11%) or a job (27% vs. 16%) based on their race/ethnicity compared to younger respondents, and men are more likely than women to report receiving poorer service (41% vs. 32%) and being denied housing (22% vs. 15%) (Figure 3). Similarly, respondents without children in the home were more likely than parents to report housing discrimination (21% vs. 13%). California health center respondents were less likely to say they experienced discrimination in housing (11% vs. 27%) or jobs (18% vs. 23%) compared to those of other health center locations (Washington and Texas).

CHART-TITLE

Over four in ten (42%) Asian health center respondents say they have been criticized for wearing a mask since the pandemic began in the U.S., while 13% say they have been criticized for not wearing a mask. There are some variations in experiences among respondents. For example, higher shares of those age 65 and older say they have been criticized for wearing a mask compared to those who are younger (57% vs. 32%) and men are more likely to say they have been criticized for mask wearing than women (47% vs. 38%). Respondents without children in the home also are more likely than parents to report being criticized for wearing a mask (48% vs. 29%). There are also variations in experiences by location, with California health center respondents less likely than those in other locations to report being criticized for wearing a mask (30% vs. 57%) and more likely to say they have been criticized for not wearing one (16% vs. 7%).

Over four in ten (44%) Asian health center respondents say they worry a lot or some that they or a family member could be detained or deported (Figure 4). Worries are higher among those age 65 or older, men, and those without children in the home, compared to those who are under age 65, women, and parents. Among parents, three in ten (30%) say their children have worries or fears that they or a family member might be detained or deported. Although there is no significant difference in their own levels of worry about detention or deportation by location, parents who are California health center respondents are more likely to say their children are concerned about a family member being detained or deported than parents in other locations (39% vs. 12%).

Figure 4: Over 4 in 10 Asian Health Center Respondents Say They Worry a Lot or Some About Detention or Deportation

One quarter (25%) of respondents say they or a member of their household decided not to apply for or stopped participating in a government program to help pay for health care, food, or housing in the past year due to immigration-related fears (Figure 5). Overall, nearly one in five (17%) say they did not apply for or stopped participating in a program that helps with housing, 12% for a program that helps with food, and 10% for a program that helps pay for health care. The shares who say they did not apply for or stopped participating in a program are higher among parents (32%) and respondents at California health centers (35%). However, parents also are more likely than those without children in the home to say they have received any type of government assistance to pay for things like housing, food, or health insurance in the past year (53% vs. 34%), as are California health center respondents compared to those in other locations (48% vs. 29%).

Figure 5: 1 in 4 Asian Health Center Respondents Say They Avoided a Program in the Past Year Due to Immigration Fears

Over half of (54%) respondents say they do not have enough information about how recent changes to U.S. immigration policy might impact them or their family (Figure 6). Chinese respondents are more likely than Vietnamese respondents to say they do not have enough information (59% vs. 41%).

Figure 6: Over Half of Asian Health Center Respondents Lack Enough Information on Recent Immigration Policy Changes

Asian health center respondents report relying on a variety of sources for information on immigration policy. The most frequently cited sources that they relied on very or somewhat often were television and radio in their native language (59%) followed closely by friends and families (56%) and social media (56%). Over half (51%) report relying on newspapers in their native language, and nearly half said they rely on English television and radio (44%) or English newspapers (40%) very or somewhat often. About four in ten report turning to nonprofit organizations (36%) or the government (34%) for this information, while over one in three said they rely on religious organizations (34%) or an attorney (32%).

In general, respondents age 65 or older are more likely to report using all sources of information very or somewhat often compared to their younger counterparts, except for social media or close family or friends. In addition, those without children in the home and men are more likely to report frequent use of certain information sources than parents and women, particularly English language television, radio, and newspapers. California health center respondents are less likely than those of other health centers to report frequent use of certain sources of information, including English language television and radio (16% vs. 35%), English language newspapers (10% vs. 27%), native language television or radio (21% vs. 30%), a nonprofit organization (6% vs. 13%), a religious organization or church (7% vs. 13%), government sources (5% vs. 20%), or an immigration attorney (5% vs. 25%).

Impacts of the COVID-19 Pandemic

Over half (54%) of Asian health center respondents say they or another adult in their household lost their job or had their income or hours reduced due to the pandemic (Figure 7). This share rises to 75% for those who are parents and nearly seven in ten among those under age 65 (69%) and who are California health center respondents (67%).

Figure 7: Over Half of Asian Health Center Respondents Say Someone in Their Household Lost a Job or Income

Respondents also report negative impacts on their ability to pay for basic needs, their mental health, and their children’s education and care (Figure 8). Nearly half (48%) say that the COVID-19 pandemic negatively affected their ability to pay for basic needs like housing, utilities, and food, four in ten (40%) report that it negatively affected their ability to do their job, and 43% say it has negatively impacted their mental health. The share reporting negative impacts on ability to pay for basic needs rises to over half among parents (53%) and men (53%). Vietnamese respondents are more likely than Chinese respondents to report negative impacts on their ability to pay for basic needs (61% vs. 44%) and their ability to do their job (51% vs. 37%), while Chinese respondents are more likely to report positive effects in these areas as well as on their mental health (30% vs. 20%).

Figure 8: The Pandemic Has Negatively Affected Asian Health Center Respondents’ Finances, Mental Health, and Children’s Education and Care

Over half of parents (52%) say the pandemic has negatively affected their children’s education and 41% say it has had negative impacts on their ability to care for their children. In contrast, three in ten say the pandemic has positively impacted their children’s education (30%) and their ability to care for their children (30%). California health center respondents are more likely than those of other health centers to report positive impacts on their children’s education (35% vs. 17%) and care (35% vs. 19%), while other health center respondents are more likely than California health center respondents to report no impact on education (26% vs. 11%) or care (39% vs. 20%).

Many respondents say worry and stress related to the pandemic has affected their behavior and health in certain ways. Nearly half (48%) say it has affected their sleep and 39% report changes in their appetite and eating (Figure 9). Others say it has led to frequent headaches or stomachaches (24%), increased difficulty controlling temper (15%), increased alcohol or drug use (10%), and worsened chronic conditions, like diabetes or high blood pressure (9%). Adults under age 65 are more likely than those age 65 and older to report some of these effects, including frequent headaches or stomachaches, difficulty controlling temper, and increased alcohol and drug use. There were also some differences by location, with California health center respondents more likely to report these same effects, which may also reflect that they are more likely to be under age 65.

Figure 9: Worry or Stress Due to the Pandemic has Affected Asian Health Center Respondents’ Behavior and Health

Three in ten (30%) Asian health center respondents say they put off or went without health care in the past 12 months and 37% of parents report doing so for their children. Among those who put off or went without health care for themselves, 42% say they did not seek health care because of concerns about exposure to coronavirus. Other factors include not being able to take time off work (45%) and not being able to afford the cost (31%), despite being patients of a community health center that provides free or low-cost care. Less than one in ten (6%) say they went without care because they were concerned it would negatively affect their or a family member’s immigration status. Adults under age 65 are more likely to say they put off or went without care than those age 65 and older (35% vs. 23%), and a higher share of parents say they went without care than those without children in the home (39% vs. 26%). Parents are more likely than those without children in the home to say they went without care because they couldn’t take time off work or due to difficulty getting to an office or clinic and less likely to cite concerns about exposure to coronavirus as a reason. California health center respondents are more likely than those at other centers to report putting off or going without health care for themselves (42% vs. 15%) and their children (44% vs. 20%). These differences may reflect demographic differences—California health center respondents are more likely to be under age 65 and parents—as well as differences in social distancing policies across locations.

COVID-19 Exposure, Testing, and Vaccines

Nearly six in ten (58%) Asian health center respondents say they have worried at some point about being exposed to coronavirus (Figure 10). Overall, less than half (46%) say they have ever been tested for coronavirus, but the share rises to 60% among those who say they have ever worried about exposure. Among those who worried they might have been exposed but were not tested, the main reasons they give for not getting tested are thinking they could isolate at home (31%) or not knowing where to go to get tested (26%). Some also report concerns about costs (13%) and being told by a health professional they did not need to get tested (13%). About one in ten say they had concerns about effects on their ability to work (12%) or fears of negative effects on their or a family member’s immigration status (10%), even though the federal government has clarified that getting tested will not negatively affect immigration status.  

Figure 10: Most Asian Health Center Respondents Say They Have Worried About Ever Being Exposed to Coronavirus

Concerns about ever being exposed to coronavirus are higher among adults under age 65, parents, and California health center respondents (Figure 11). Reflecting these increased worries, these groups are also more likely to report having received a COVID-19 test, overall. There are no notable differences by age or parental status in the share who say they have received a test among those who ever worried about exposure. However, among those who say they have ever worried about exposure, California health center respondents are more likely to report being tested than those of other health centers (66% vs. 49%).

Figure 11: Concerns About Coronavirus Exposure are Higher Among Asian Health Center Respondents Who are Nonelderly Adults, Parents, and in California

At the time of the survey, nearly two-thirds (64%) of respondents said they wanted to get the COVID-19 vaccine as soon as they can. About a quarter (23%) indicated they want to wait to see how it works for other people. Only 11% said they will only get the vaccine if required or definitely will not get it. Concerns about side effects, believing that the vaccine development process was rushed, and not believing they are at risk for getting seriously ill from the virus are the main reasons why people say they are not ready to be vaccinated. Broader data show that vaccine attitudes have shifted over the course of the vaccine rollout, with willingness to get a vaccine increasing across a number of groups.

Conclusion

While these findings are not representative of Asian immigrants or Asian health center patients overall, they provide new insight into and understanding of the experiences of Asian health center patients who are largely immigrants, a group for whom there remain very little data. The findings illustrate the ways Asian immigrants experience racism and discrimination in their daily lives and indicate that these experiences have increased amid the COVID-19 pandemic. They also suggest that immigration-related fears are ongoing among the community and contributing to reluctance accessing government assistance programs for food, housing, and health care. The findings further show the that the pandemic has taken a toll on mental health and well-being, finances, and access to health care for Asian immigrant families. This increased understanding can help inform COVID-19 response efforts as well as efforts to address health disparities more broadly. Going forward, continued efforts to assess and understand the experiences of smaller population groups, including Asian immigrants, remain important as they are often invisible in public data sources.

Methods

This analysis is based on a KFF survey of Asian patients at four community health centers: Asian Health Services in Alameda County, CA; North East Medical Services, in San Francisco, CA; HOPE Clinic in Houston, TX; and International Community Health Services (ICHS) in King County, WA. In 2019, these four health centers served a total of 154,604 patients, 117,617 of whom identified as non-Hispanic Asian, or 79% of patients with known race/ethnicity. Health centers do not collect information on patient immigration status, but nearly seven in ten patients at these health centers are best served in a language other than English.3  The survey instrument was designed by researchers at KFF in collaboration with staff at the Association of Asian Pacific Community Health Organizations and the community health centers who participated in the survey. Community health center staff translated the survey into Chinese (traditional), Vietnamese, Korean, and Burmese. Reflecting their patient demographics, Asian Health Services, North East Medical Services, and ICHS fielded the survey in English, Chinese, Vietnamese, and Korean, while HOPE Clinic fielded the survey in English, Chinese, Vietnamese, and Burmese.

The survey was conducted between February 15 and April 12, 2021 by health center staff. Over a third (34%) of respondents completed the survey in-person with clinic staff, 32% completed a paper version of the survey, 25% completed the survey online, and 7% completed the survey via phone. There were a total of 1,467 survey respondents. The analysis presented above was limited to 1,086 respondents who self-identified as Asian and indicated that they were a patient of one of the four health centers in their survey responses. Of those included in the analysis, 874 indicated that they were born outside the United States or Puerto Rico and 176 were born in the U.S. or Puerto Rico; 36 respondents did not answer the survey question on nativity.

This work was supported, in part, by the Blue Shield of California Foundation. We value our funders. KFF maintains full editorial control over all of its policy analysis, polling, and journalism activities. The authors thank the Association of Asian Pacific Community Health Organizations (AAPCHO) and community health center staff for their assistance developing and fielding the survey.

Endnotes

  1. KFF analysis of the 2019 Uniform Data System, Health Resources and Services Administration. ↩︎
  2. Ibid. ↩︎
  3. Ibid. ↩︎
News Release

Survey and Event Examine Experiences and Concerns of Asian Immigrants During COVID-19 Pandemic and Amid Rising Incidents of Anti-Asian Hate Crimes

Published: Jun 18, 2021

A KFF survey of Asian patients at four community health centers serving a predominantly Asian, low-income population finds a third (33%) of them have felt more discrimination based on their race/ethnicity since the COVID-19 pandemic began. Respondents, 80% of whom were born outside the U.S., reported a range of negative experiences including receiving poorer service in public settings, being denied employment and/or housing, and being verbally or physically attacked.

Asian Immigrant Experiences with Racism, Immigration-related Fears, and the COVID-19 Pandemic was released today at a briefing discussing the diversity of the Asian American population and how the pandemic and rising anti-Asian hate crimes have exacerbated existing challenges in health care access, especially mental health. Innovative care models and the impact of immigration policy were also topics. Congresswoman Judy Chu provided opening remarks which was followed by highlights from the survey and a panel discussion with the representatives from the Association of Asian Pacific Community Health Organizations and community health centers serving the Asian American community.

Over half (54%) of the 1,086 Asian health center respondents, a convenience sample drawn from locations in California, Texas, and Washington, say they don’t have enough information about recent immigration policy changes to understand how they impact their family. Four in ten report worrying some or a lot about they or a family member being detained or deported and a quarter say they or a member of their household stopped participating in or didn’t apply for government assistance with health care, housing or food in the past year due to immigration-related fears, despite many facing increased needs due to the pandemic.

Almost six in ten (58%) Asian health center respondents say they have worried at some point about being exposed to coronavirus, and over half say someone in their household lost a job or income since the pandemic began. The fear of exposure to coronavirus was one of several factors cited for the 30% of respondents who said they put off or went without health care in the past year.

The complete findings and methodology of the survey fielded from February to April of 2021 are available on kff.org.

State actions in response to the COVID-19 crisis have highlighted their divergent approaches to abortion access. Some states classified abortion as a non-essential service, effectively banning services, while others have clarified that abortion is an essential service. In a handful of states, some clinics have begun to offer medication abortions using telemedicine. This approach maintains access to abortion while social distancing, preserving personal protective equipment (PPE), and limiting in-person health care visits and risk of exposure. (more…)

Medication Abortion and Telemedicine: Innovations and Barriers During the COVID-19 Emergency

Authors: Amrutha Ramaswamy, Gabriela Weigel, Laurie Sobel, and Alina Salganicoff
Published: Jun 16, 2021

UPDATE

On April 12th, 2021, the FDA’s Center for Drug Evaluation and Research (CDER) notified ACOG that they will exercise enforcement discretion during the ongoing public health emergency with respect to in-person dispensing requirements of mifepristone based on a safety reviewEffectively, this will allow providers in states that do not have laws that would otherwise ban this practice to dispense mifepristone using the telehealth protocol for medication abortion. On May 7th, 2021, in response to the ACLU lawsuit, the FDA announced in a court filing that a review of the REMS is currently underway. 

State actions in response to the COVID-19 crisis have highlighted their divergent approaches to abortion access. Some states classified abortion as a non-essential service, effectively banning services, while others have clarified that abortion is an essential service. In a handful of states, some clinics have begun to offer medication abortions using telemedicine. This approach maintains access to abortion while social distancing, preserving personal protective equipment (PPE), and limiting in-person health care visits and risk of exposure. (more…)

How Do CMS’s New COVID-19 Vaccine Reporting and Education Rules Apply To Different Long-Term Care Settings?

Authors: Priya Chidambaram and MaryBeth Musumeci
Published: Jun 16, 2021

The COVID-19 pandemic has resulted in substantial cases and deaths among long-term care facility (LTCF) residents and staff, though these numbers dropped precipitously after vaccine rollout began. As of May 17th, 2021, the US has reported over 184,000 COVID-19 deaths among LTCF residents and staff, accounting for nearly one-third of all COVID-19 deaths in the US. These data do not reflect the full extent of COVID-19’s impact on LTCFs beyond nursing homes, however, as data gaps for settings serving nonelderly people with disabilities are an ongoing challenge. Settings for which data are incomplete include certain institutions, such as intermediate care facilities for people with intellectual or developmental disabilities (ICF/IIDs) and inpatient behavioral health settings, and congregate community-based settings, such as group homes, personal care homes, assisted living facilities (ALFs), and adult day programs.  

In addition to incomplete data, COVID-19 vaccine access and distribution efforts have varied across LTCF setting types. While the CDC’s Pharmacy Partnership for Long-Term Care facilitated the initial vaccination of residents and staff at most nursing homes and ALFs, other LTCF types were ineligible for the Partnership. Moreover, now that the Partnership has ended, CMS estimates that the number of new residents and staff entering nursing homes and ALFs over the next year is expected to exceed the number of those that were offered a vaccine through the Partnership.

Recognizing that ongoing vaccination efforts are crucial to ending the pandemic, CMS issued an Interim Final Rule with Comment Period (IFC) that establishes new vaccine reporting and/or education requirements for nursing homes and ICF/IIDs as of May 21st, 2021. Public comments are due July 12, 2021, after which CMS may revise the rule. CMS also seeks public comment about whether similar requirements should apply to inpatient behavioral health settings and community-based congregate settings. This issue brief explains the new requirements and identifies where gaps remain across different LTCF settings (Figure 1). The Appendix provides detail about the various types of LTCFs.

Figure 1: Which Long-Term Care Settings are Subject to New COVID Vaccine Reporting and Education Rules?

What are the new reporting requirements for LTCFs?

Under the new interim final rule, nursing homes must report weekly on the COVID-19 vaccination status of all residents and staff as well as COVID-19 therapeutic treatment administered to residents. These requirements apply to both Medicare skilled nursing facilities (SNFs) and Medicaid nursing facilities (NFs). The new vaccine data elements must be reported to the CDC’s National Healthcare Safety Network (NHSN) and include the total numbers of residents and staff, numbers of residents and staff vaccinated, numbers of each dose of COVID-19 vaccine received, and COVID-19 vaccination adverse events. As with other Medicare and Medicaid conditions of participation, nursing homes that fail to follow the new reporting requirements may have to pay a civil monetary penalty.

The new interim final rule does not mandate COVID-19 vaccination or treatment reporting for other LTCF types. CMS concluded that requiring ICF/IIDs to participate in mandatory vaccine reporting would create an administrative burden, as very few (only about 80 out of over 5,700) currently participate in the NHSN or another formal reporting program, and requiring participation could involve new equipment, staff, and training. CMS also notes that ICF/IIDs do not appear to be administering COVID-19 therapeutics at this time. The new reporting requirements also do not apply to other LTCFs, such as inpatient behavioral health settings or congregate community-based settings. For all of these settings, CMS encourages voluntary reporting as facilities are able to do so and seeks comment on reporting barriers and ways to encourage voluntary reporting. Another rule that requires CDC reporting on COVID-19 cases and deaths applies only to nursing homes and not to other LTCF types.

What are the new vaccine education and offering requirements for LTCFs?

The new interim final rule’s requirements to educate residents/clients and staff about the COVID-19 vaccine and offer the vaccine when available apply more broadly, to both nursing homes and ICF/IIDs. CMS notes that these new requirements build on existing regulations that govern influenza and pneumonia immunizations for nursing homes and preventive care including immunizations for ICF/IIDs. In the preamble, CMS clarifies that staff who must be educated about and offered the vaccine include those who work in the facility at least once a week. Facilities must maintain documentation on their vaccine education efforts, administration of multi-dose vaccines, and efforts to appropriately acquire subsequent doses as necessary for all residents/clients and staff. As with other Medicare/Medicaid conditions of participation, facilities may be subject to civil money penalties if they fail to comply with the new requirements.

Under the new rule, nursing home and ICF/IID vaccine education efforts must include the benefits, risks, and potential side effects of the vaccine and the most current information regarding additional doses. In the preamble, CMS notes that facilities may choose to include other staff education topics, such as further information on the development of the vaccine, how the vaccine works, particulars of the multiple doses, and the low likelihood of potential side effects. The preamble also states that residents/clients and their representatives should be told that they are able to receive the vaccine without copays or out-of-pocket costs. Finally, CMS reminds facilities that educational materials should be made available in accessible formats, such as large print, Braille, American Sign Language, closed captioning, audio descriptions, and plain language.

The new rule requires nursing homes and ICF/IIDs to offer the COVID-19 vaccine to all residents/clients and staff unless immunization is medically contraindicated or they have already been immunized. The rule specifies that residents/clients and staff may refuse the vaccine and may change their decision at any time. Recognizing that decisions about whether to receive the vaccine may change over time, the preamble notes that if an individual requests a vaccine but missed earlier opportunities for any reason, facilities should try to acquire a vaccination opportunity for that individual “as quickly as practicable.” In the preamble, CMS clarifies that facilities may provide the vaccine directly or arrange for vaccination through another provider, such as a pharmacy or health department.  

How are other congregate care settings addressed?

CMS is not requiring other LTCFs, such as inpatient behavioral health settings and congregate community-based settings, to report on COVID-19 vaccination, provide education, or offer the vaccine to residents and staff at this time. CMS notes that individuals in psychiatric facilities may only be inpatients for short periods, making a two-dose vaccine series challenging to administer, and CMS currently is unable to guarantee availability of the single-dose vaccine for these facilities. To facilitate vaccination for residents/clients and staff of congregate community-based settings, such as ALFs, group homes, and adult day centers, CMS encourages collaboration between these settings and state Medicaid agencies and state and local health departments to learn about vaccine distribution options.

CMS seeks public comment on the feasibility of extending COVID–19 vaccine reporting, education, and offering requirements to other congregate LTCFs. Specifically, CMS seeks public comment on:

  • Potential barriers that other LTCFs may face in meeting new requirements, such as staffing, resident/client population characteristics, and potential unintended consequences;
  • Any existing state or local licensing or certification requirements or facility policies related to vaccines for congregate community-based settings and any benefits or challenges from policy implementation;
  • Who should be responsible for vaccine access for residents and staff who participate in multiple settings (such as both residential and day programs);
  • How to ensure equitable vaccine access in congregate community-based settings and identify access barriers for staff;
  • Available data on admission rates, average length of stay, comorbidities that may increase residents/clients’ risk of severe illness from COVID-19, and rates of employee turnover and employee sharing across congregate living settings.

Looking Forward

The new COVID-19 vaccine reporting, education, and offering requirements establish some standards and oversight for ongoing vaccination efforts in nursing homes, as the CDC Partnership has ended but the pandemic continues. Still, as CMS recognizes, data gaps remain, and the new standards currently do not apply across all LTCF types. The new rule does not require nursing homes to report COVID-19 vaccination or treatment data by resident/staff demographics such as race/ethnicity, continuing a data gap that pre-dates the pandemic. While ICF/IIDs are subject to the new education and offering requirements, there are not similar requirements for other long-term care settings that present similar COVID-19 risk factors for residents and staff, including inpatient behavioral health facilities and congregate community-based settings, and none of these settings are required to report data. Until data, resource, and oversight gaps across the long-term care continuum are filled, nonelderly people with disabilities may continue to experience disproportionate barriers to vaccine access compared to people in nursing homes, and the full impact of COVID-19 on this population will not be completely understood.

Because Medicaid is the primary payer for long-term care services and supports provided in congregate community-settings, states may consider leveraging the new enhanced federal Medicaid HCBS funding included in the American Rescue Plan to support vaccination efforts in settings across the long-term care continuum. Recent CMS guidance confirms that states may use these additional federal funds to facilitate COVID-19 vaccine access for Medicaid HCBS enrollees, many of whom reside into the categories of HCBS congregate care settings discussed above. For example, states can use the new funds to assist Medicaid HCBS enrollees with scheduling vaccination appointments, provide direct support services during appointments, provide transportation to appointments, develop in-home vaccination options, and conduct vaccine outreach and education. While the availability of effective vaccines has helped alleviate the toll the pandemic has taken on LTCFs, continued education and data on vaccine access can help inform ongoing COVID-19 response efforts.

Appendix

Facilities Mentioned in Interim Final Rule

Nursing homes: Licensed nursing facilities that are certified for participation in the Medicare and/or Medicaid programs are colloquially referred to as “nursing homes”. Nursing homes primarily provide 3 types of services: skilled nursing, rehabilitation, and long-term care. Payment for these services in facilities largely depends on licensure by either Medicare and/or Medicaid. In 2020, there were 15,327 nursing homes licensed to participate in Medicare and/or Medicaid serving about 1.3 million residents. Four percent of these facilities were certified as Medicare skilled nursing facilities (SNFs), two percent were certified as Medicaid nursing facilities (NFs), and the remaining 94% of facilities were certified to participate in both Medicare and Medicaid. Medicare typically pays for short-term skilled nursing care and rehabilitation while Medicaid covers short-term skilled care, rehabilitation, and long-term care in nursing homes.

ICF/IIDs: Intermediate care facilities for individuals with intellectual or developmental disabilities are residential facilities that provide active treatment services for people with these conditions. Active treatment refers to aggressive, consistent implementation of a 24-hour program of specialized and generic training, treatment, health services and related services. ICF/IIDs are an optional Medicaid benefit, though all states have adopted the benefit. The latest data indicate that there are 5,768 certified ICF/IIDs across all 50 states serving over 64,800 individuals. These facilities are 100% Medicaid funded, so all residents in these facilities must financially qualify for Medicaid.

Inpatient Behavioral Health Settings: Inpatient behavioral health settings include inpatient psychiatric hospitals (IPFs) and psychiatric residential treatment facilities (PRTFs). IPFs are facilities that provide short-term treatment (typically under 30 days) for individuals with mental illness. PRTFs are non-hospital facilities with a provider agreement with a state Medicaid agency. The age limit imposed by regulation for the PRTF benefit is 21 years of age.

HCBS Congregate Settings: HCBS is an umbrella term for long-term supports and services that are provided to people in their own homes or other community settings rather than institutions. These programs serve a diverse population, including many nonelderly adults with disabilities. The individuals in these settings often have multiple chronic conditions that can increase the risk from COVID–19. HCBS congregate settings include group homes, day habilitation sites, assisted living facilities, shared living/host home settings, adult foster care homes, and more.

News Release

New Analysis: In Pursuit of a National Vaccination Benchmark, Hispanic and Black People’s Rates Projected to Lag Behind

Published: Jun 14, 2021

Much attention has focused on President Biden’s stated goal of vaccinating 70% of U.S. adults by July 4th. While achieving a high overall vaccination rate is important for recovery from the COVID-19 pandemic, a new analysis of people ages 12 and older—a different population than President Biden’s goal, but one that is currently eligible for vaccination—projects that 65% will have received at least one dose by July 4th, but 63% of Hispanic people and only about half (51%) of Black people will have received one dose at the current pace of vaccination. The lagging vaccinations among Black and Hispanic people stand in contrast to projections that Asian people will exceed a 70% level, while 66% of White people will reach it by Independence Day.

Researchers from Stanford University and KFF, using state-reported vaccination data by race/ethnicity, highlight how gaps in vaccines for Black and Hispanic people could persist even if an overall vaccination benchmark is achieved indicating the importance of addressing these gaps with focused efforts to reach specific populations. The analysis further estimates that at the current pace of vaccination, Hispanic people would reach a 70% coverage level at the end of July and White people would reach this level by early August, reflecting a faster recent pace of vaccination among Hispanic people. However, Black people would still not have reached this level by the beginning of September.

Due to data limitations, the projections focus on the vaccinations among people ages 12 and older rather than adults, using 70% receiving at least one dose by July 4th as an illustrative measure to examine potential disparities across groups. Vaccination rates among adults are higher than those among adolescents, who became eligible for the vaccine more recently.

The data note also looks at state-level projections. Asian people are on track to reach a 70% coverage rate in nearly all reporting states (40 of 44), and White people are on track in just over a third of reporting states (18 of 47). Hispanic people are projected to reach 70% by July 4 in 13 of 44 reporting states, while Black people are estimated to reach the level in only 5 of 47 reporting states.

You can read the full findings, Disparities in Reaching COVID-19 Vaccination Benchmarks: Projected Vaccination Rates by Race/Ethnicity as of July 4.