Implications of the Medicaid Fiscal Cliff for the U.S. Territories

Authors: Lina Stolyar and Robin Rudowitz
Published: Sep 14, 2021

The U.S territories – American Samoa, the Commonwealth of the Northern Mariana Islands (CNMI), Guam, Puerto Rico, and the U.S. Virgin Islands (USVI) – have faced an array of longstanding fiscal and health challenges that were exacerbated by recent natural disasters and most recently by the COVID-19 pandemic. Differences in Medicaid financing, including a statutory cap and match rate, have contributed to broader fiscal and health systems challenges for the territories. While additional federal funds have been provided over the statutory caps, these funds are set to expire at the end of September 2021. Congress is currently debating legislation to address the looming Medicaid funding cliff. This brief builds on data in an earlier brief released in May 2021 examining the effects of the pandemic and the implications of the fiscal cliff and incorporates findings from a questionnaire sent to Medicaid Directors in territories in the summer of 2021. The questionnaire was created in collaboration with Health Management Associates (HMA). Three territories (CNMI, Puerto Rico, and USVI) responded to the questionnaire.

How is Medicaid funding in the Territories different from the states?

Unlike in the 50 states and D.C., annual federal funding for Medicaid in the U.S. territories is subject to a statutory cap and fixed matching rate. Both the capped federal allotment (known as the Section 1108 allotment) and the territories’ federal matching rate (known as the federal medical assistance percentage, or FMAP) are fixed in statute.1  This funding arrangement is unlike federal Medicaid funding for states where federal dollars are uncapped and the FMAP is adjusted annually based on a state’s relative per capita income. Once a territory exhausts its capped federal funds, it no longer receives federal financial support for its Medicaid program during that fiscal year. This limit on federal Medicaid funding ultimately risks coverage for patients and places financial strain on the territories’ health care systems and providers, including health centers, that continue serving Medicaid patients, even if the federal funding to support the costs of those services is no longer available.

Over time, Congress has provided increases in federal funds for the territories broadly and in response to specific emergency events. Temporary funding can provide short-term relief, but also create fiscal funding cliffs that require ongoing Congressional action. The allotments for each of the territories for FY 2020 and FY 2021 are around seven to nine times the statutory levels as a result of additional funding added in the FY 2020 appropriation package and the Families First Coronavirus Response Act (FFCRA). In addition to adding funding above the statutory caps, legislation also increased the federal match rate, which reduces the amount that the territories needed to contribute to access the federal funds.2  If Congress does not act, Medicaid funding will revert back to the statutory allotments resulting in sharp declines in federal funds and significant funding shortfalls unless spending is dramatically reduced (Figure 1).

Figure 1: Federal Funding for the U.S. Territories, FY 2021 and Estimated FY 2022 Without Congressional Action

What are implications of the Medicaid fiscal cliff?

In the fielded questionnaire, territories reported using the increases in Medicaid funds to support enrollment, provide benefits, and increase provider rates. For example, increases in federal Medicaid funds allowed Puerto Rico to temporarily increase eligibility thresholds from about 40% of the Federal Poverty Level (FPL) to around 85% in 20203  (resulting in about 200,000 additional Medicaid enrollees).4  Increased federal funding was also used to increase payments rates to physicians and hospitals and to cover Hepatitis C treatments in Puerto Rico. USVI used increased funds to implement a personal care attendant (PCA) program and a hospice benefit, to expand their Part B dual eligible coverage program, and to extend post-partum coverage to 12 months. Even with increased funding, Puerto Rico noted that there were not enough funds to provide services that are mandatory in the states like non-emergency medical transportation (NEMT), long-term services and supports (LTSS), and diabetes supplies.

Every territory responding to the questionnaire reported that they would need to make significant program changes to eligibility and benefits with the loss of federal funds. One Medicaid Director reported that the Medicaid fiscal cliff would have a “devastating negative impact” on the health care system. All Medicaid Directors reported that the territories would not be able to fill the funding gaps from the loss of federal Medicaid funds with local funds. For example, Puerto Rico would need to roll back recent eligibility and provider rate increases. USVI noted that they would be required to reduce income eligibility across all categorical enrollee groups, cut optional benefits such as dental services, cut provider payment rates, and roll back recent increases in coverage and benefits. CNMI stated that payments to their safety net hospitals would be affected by the decreased funding. The territories noted that reduced federal Medicaid funding would exacerbate long standing problems in attracting and maintaining providers and would also hamper efforts to continue to respond to the COVID-19 pandemic. While the territories have had varied experiences with the COVID-19 pandemic to date, the future is uncertain with the spread of the Delta variant. Recent data shows that some territories have seen a spike in cases, with Guam and Puerto Rico both seeing significant increases in cases over the past two weeks (around 30% in Puerto Rico and over 250% in Guam) as of August 23, 2021.

What federal policy options are under consideration?

Congress is considering proposals to avoid the upcoming Medicaid funding cliff. The Supporting Medicaid in the U.S. Territories Act of 2021 (H.R. 4406) was approved by the House Energy and Commerce Committee in late July 2021. This bill would extend funding for the territories (for five years for Puerto Rico with a 76% FMAP rate and for eight years for the other territories with an 83% FMAP rate).

However, temporary funding measures would not address the long-term Medicaid financing issues. The territories have long advocated for a permanent change in Medicaid financing that would treat the territories more like states by eliminating the funding cap and by calculating the match rate based on relative per capita income. Such changes would increase the stability and predictability of Medicaid funding year to year. While temporary measures would avert the upcoming fiscal cliff, it would create another fiscal cliff in the future and make it difficult to address long-standing issues in the overall health care system.

  1. The Section 1108 allotments are updated annually based on the Consumer Price Index for All Urban Consumers (CPI-U). See: Medicaid and the CHIP Payment Access Commission (MACPAC) Report, “Medicaid in the U.S. Territories,” 2021: https://www.macpac.gov/wp-content/uploads/2019/07/Medicaid-and-CHIP-in-the-Territories.pdf ↩︎
  2. Like other states, the territories are also eligible for a 6.2 percentage point increase in the match rate that is tied certain eligibility requirements in place throughout the public health emergency period. ↩︎
  3. Averting A Crisis: Protecting Access To Health Care In The U.S. Territories, 117th Cong. (2021) (testimony of Congresswoman Jennifer A. Gonzalez Colon). ↩︎
  4. Ibid. ↩︎
News Release

Preventable Costs of Unvaccinated COVID-19 Patients Rise Sharply in August as Hospitalizations Surge

Estimated Costs for Treating Unvaccinated Patients in Hospitals Tops $5 Billion Through August

Published: Sep 14, 2021

A surge in COVID-19 hospitalizations among people who have not been vaccinated in August is adding billions of dollars in preventable costs to the nation’s health-care system, an updated KFF analysis finds.

In August, the new analysis estimates that the preventable costs of treating unvaccinated patients in  hospitals total $3.7 billion, almost twice the estimates for June and July combined. The total preventable costs for those three months now stand at an estimated $5.7 billion.

The estimates draw on KFF’s analysis of U.S. Department of Health and Human Services data about COVID-19 hospital admissions, adjusted for admissions primarily for COVID-19, the share among unvaccinated patients and the share that likely could have been prevented if the patients were vaccinated, as well as other data estimating that each COVID hospitalization on average results in roughly $20,000 in hospital costs.

Only a small share of the cost of a COVID-19 hospitalization is typically paid directly by patients themselves. The rest is typically paid through insurers, including public programs like Medicare and Medicaid, and private insurance purchased by workers, businesses and individuals.

The full analysis, including its methodology, is available through the Peterson-KFF Health System Tracker, an online information hub that monitors and assesses the performance of the U.S. health system.

Potential Savings for Medicare Part D Enrollees Under Proposals to Add a Hard Cap on Out-of-Pocket Spending

Authors: Juliette Cubanski, Tricia Neuman, and Anthony Damico
Published: Sep 10, 2021

Medicare Part D, the outpatient prescription drug benefit for Medicare beneficiaries, provides coverage above a catastrophic threshold for high out-of-pocket drug costs, but there is no cap on total out-of-pocket drug costs that beneficiaries pay each year. Part D enrollees are required to pay 5% of their total drug costs in the catastrophic phase unless they qualify for Part D Low-Income Subsidies (LIS). In 2021, the catastrophic threshold is set at $6,550 in out-of-pocket drug costs, which includes what beneficiaries themselves pay and the value of the manufacturer discount on the price of brand-name drugs in the coverage gap (sometimes called the “donut hole”), which counts towards this amount. This lack of a hard out-of-pocket spending cap can expose Part D enrollees to thousands of dollars in out-of-pocket costs if they take several costly medications or even just one expensive drug.

President Biden has endorsed adding a hard cap on out-of-pocket Medicare Part D prescription drug spending, and this proposed change has also been included in legislation sponsored by policymakers on both sides of the aisle, including H.R. 3, which passed the U.S. House of Representatives in December 2019 and was recently reintroduced in the 117th CongressH.R. 19, the House GOP prescription bill (a similar version was introduced in the Senate); bipartisan legislation that passed out of the Senate Finance Committee in the 116th Congress (S. 2543); and other legislation. Under H.R. 3, out-of-pocket drug spending under Part D would be capped at $2,000 (beginning in 2024), while under the GOP drug price legislation and the 2019 Senate Finance bill, the cap would be set at $3,100 (beginning in 2022); under each of these proposals, the out-of-pocket cap excludes the value of the manufacturer price discount. A lower cap would help more beneficiaries and provide more out-of-pocket savings than a higher cap, but could mean higher costs for the federal government, plans, and drug manufacturers, depending on the specific features included in these Part D benefit redesign proposals.

To inform discussions about the potential impact of this proposal, in a previous KFF analysis, we analyzed how many Part D enrollees without low-income subsidies exceeded the catastrophic coverage threshold annually and over multiple years, taking into account both beneficiary out-of-pocket spending and the value of the manufacturer discount, and we found that 1.5 million enrollees did so in 2019, and close to 3 million did so between 2015 and 2019. In this analysis, we focus on the potential impact of different out-of-pocket spending caps in terms of how many beneficiaries would be affected and how much they could save. We analyze how many beneficiaries paid more than $2,000 or $3,100 out of their own pockets for their medications in 2019 (excluding the value of manufacturer discounts they may have received), and the magnitude of potential savings for beneficiaries had these caps been in place in 2019. We also analyze the individual drugs for which Part D enrollees incurred average annual out-of-pocket costs in 2019 above the amount of proposed caps. The analysis is based on 2019 Part D claims data (the most current year available) for Part D enrollees without low-income subsidies (LIS) from the Centers for Medicare & Medicaid Services Chronic Conditions Data Warehouse (see Methods for details).

How many Medicare Part D enrollees incurred out-of-pocket drug costs above $2,000 and $3,100 in 2019?

  • In 2019, nearly 1 million more Part D enrollees incurred out-of-pocket costs for their medications above $2,000, the proposed out-of-pocket spending limit in H.R. 3, than above $3,100, the proposed out-of-pocket spending limit in the GOP drug legislation and the 2019 Senate Finance Committee bill (Figure 1). Overall, 1.2 million Part D enrollees in 2019 incurred annual out-of-pocket costs for their medications above $2,000, while 0.3 million spent more than $3,100 out of pocket.
  • The number of Medicare Part D enrollees who have annual out-of-pocket costs greater than $2,000 or $3,100 in a future year, when a proposed cap could be implemented, is likely to exceed our estimates that are based on 2019 claims data, considering enrollment growth, rising drug prices for existing drugs, and the availability of new, higher-priced medications covered by Part D. Moreover, while adding an out-of-pocket cap to Part D may affect a relatively small number of enrollees in any given year, it would help a larger share and number over time, as our previous analysis showed.
In 2019, Nearly 1 Million More Medicare Part D Enrollees Had Spending Above $2,000 Than Above $3,100, the Proposed Spending Caps in Recent Legislation

What is the magnitude of potential savings for Part D enrollees with out-of-pocket costs above $2,000 or $3,100 based on proposed spending caps?

  • As expected, a $2,000 cap on out-of-pocket spending would generate larger savings than a $3,100 cap. Average out-of-pocket spending was $3,216 among the 1.2 million Part D enrollees with out-of-pocket spending above $2,000 in 2019. These enrollees would have saved $1,216, or 38% of their annual costs, on average, if a $2,000 cap had been in place in 2019, but only $116, or 4%, under a $3,100 cap (Figure 2). (See Table 1 for estimates of the number of Medicare Part D enrollees with out-of-pocket spending above $2,000 and $3,100 in 2019 by state, and estimated savings under proposed Part D spending caps.)
  • Medicare Part D enrollees with higher-than-average out-of-pocket costs could save substantial amounts with an out-of-pocket spending cap. For example, the top 10% of beneficiaries (122,000 enrollees) with average out-of-pocket costs for their medications above $2,000 in 2019 – who spent at least $5,348 – would have saved $3,348 (63%) in out-of-pocket costs with a $2,000 cap and $2,248 (42%) with a $3,100 cap. The top 1% of beneficiaries with average out-of-pocket costs above $2,000 (12,000 enrollees) – who spent nearly $12,000 or more – would have saved $9,880 (83%) with a $2,000 cap and $8,780 (74%) with a cap of $3,100.
Figure 2: Estimated Cost Savings Under Proposed Medicare Part D Out-of-Pocket Spending Caps Could Be Substantial for Some Part D Enrollees with High Out-of-Pocket Costs

How many and which drugs had average out-of-pocket costs in 2019 above proposed spending caps?

  • In 2019, there were 154 drugs where Medicare Part D enrollees incurred average annual out-of-pocket costs for that one drug alone greater than $2,000, including 108 drugs where average annual out-of-pocket costs exceeded $3,100.
    • While some of these high-priced drugs are treatments for rare diseases that are taken by a relatively small number of Part D enrollees, the out-of-pocket cost for individual patients taking these drugs can be substantial. For example, average out-of-pocket spending was $42,440 for Strensiq, which treats a rare metabolic disease called hypophosphatasia; $15,108 for Takhzyro, a treatment for hereditary angioedema; and $13,090 for Firdapse, a treatment for Lambert-Eaton myasthenic syndrome (LEMS), a rare muscle disease. It is important to note that these spending estimates do not include additional out-of-pocket costs that users of these 154 drugs incurred for other medications, so the total out-of-pocket cost burden in 2019 for users of these drugs was likely higher, suggesting that the savings associated with proposed caps on out-of-pocket spending would be even greater than the amount associated with a given relatively high-priced drug.
  • Most of these relatively high-priced drugs were used by fewer than 1,000 non-LIS Part D enrollees in 2019, but 15 drugs were used by at least 5,000 enrollees, and these include drugs to treat cancer, multiple sclerosis (MS), and hepatitis C. For most of these drugs, average out-of-pocket costs in 2019 were well over $2,000, and in many cases well over $3,100 (Figure 3).
    • Average out-of-pocket spending for these 15 drugs in 2019 ranged from $2,300 for abiraterone acetate, a prostate cancer drug used by 14,000 non-LIS enrollees, to $5,700 for Jakafi, a treatment for blood cancer used by 8,000 enrollees.
  • Part D enrollees who used one of these 15 drugs for an entire year spent substantially more than the average user. Average spending tends to understate spending incurred by people who take high-priced drugs for an entire year, since the average includes beneficiaries who begin taking medication after the first of the year (for example, those with a new diagnosis mid-year) as well as those who stop taking a drug at some point during the year for various reasons (such as switching medications, or upon their death). For example:
    • Medicare Part D enrollees who used the cancer drug Revlimid for the entire year in 2019 spent nearly $9,000 out of pocket for this drug alone, two-thirds more than the average user, who only filled 7 prescriptions.
    • Beneficiaries who used the MS drug Tecfidera for the full year in 2019 spent around $4,500 out of pocket for this drug, 31% more than the average user, who filled 9 prescriptions.
The 15 Drugs with Average Out-of-Pocket Costs by Medicare Part D Enrollees Greater than $2,000 and More than 5,000 Users in 2019 Include Treatments for Cancer, Multiple Sclerosis, and Hepatitis C
  • Beneficiaries with higher-than-average out-of-pocket costs, including those who take expensive medications for an entire year, could achieve substantial savings under proposed spending caps. For example, Part D enrollees who took Revlimid for the entire year in 2019 would have seen savings of close to $7,000 under a $2,000 spending cap, and more than $5,700 with a $3,100 cap in 2019 (Figure 4) – not including potential savings from other drugs they may also have been taking.
Medicare Part D Enrollees Who Take Expensive Medications for an Entire Year Could Achieve Substantial Savings Under Proposed Out-of-Pocket Spending Caps

Discussion

Our analysis shows that close to 1 million more Medicare Part D enrollees would have had their out-of-pocket costs capped in 2019 under a $2,000 out-of-pocket drug spending limit (as under H.R. 3) than a $3,100 limit (as under the GOP bill and the 2019 Senate Finance Committee bill). Under either cap, however, savings could be considerable for Part D enrollees who take high-cost medications for conditions such as cancer and MS. Deciding on the level of the cap involves tradeoffs, with more enrollees benefitting and higher out-of-pocket cost savings from a lower cap, but with the potential for higher spending by the federal government, plans, and drug manufacturers, depending on the specific features included in the Part D benefit redesign proposal.

While proposed legislation to cap out-of-pocket costs under Medicare Part D would help beneficiaries who take several costly medications or even just one high-priced drug, these proposals would not cap drug spending for expensive physician-administered injectable and infused medications that are covered under Medicare Part B. These drugs are subject to a 20% coinsurance, with no cap on out-of-pocket costs. While many Medicare beneficiaries have supplemental coverage, such as employer-sponsored retiree benefits or Medigap, to help pay their share of costs, nearly 6 million beneficiaries lack supplemental coverage and another 26 million are enrolled in Medicare Advantage plans and typically face 20% coinsurance for Part B drugs up to their plan’s out-of-pocket maximum.

For example, a Medicare beneficiary who takes aducanumab, the new Alzheimer’s drug priced at $56,000 annually, would face cost-sharing liability of more than $11,000 in a year, according to KFF analysis, unless they have supplemental insurance. Medicare Advantage enrollees would have a portion of their out-of-pocket costs for this drug covered but would need to pay out of pocket up to their plan’s limit for Medicare Part A and B benefits ($7,550 in 2021 for in-network and $11,300 for in-network and out-of-network combined).

The number of Medicare Part D enrollees who have annual out-of-pocket costs greater than $2,000 or $3,100 in a future year, when a proposed cap could be implemented, is likely to exceed our estimates that are based on actual claims data for 2019, considering enrollment growth, rising drug prices for existing drugs, and the availability of new, higher-priced medications covered by Part D. These estimates also do not reflect the interactive effects of other provisions being considered in current prescription drug legislation, such as allowing the federal government to negotiate drug prices or Part B and Part D drug price inflation caps, which would also affect out-of-pocket drug spending.

Adding an out-of-pocket cap to Part D would protect Part D enrollees with high drug costs, which may affect only a small share of enrollees in any given year but a larger share over time, including those who have persistently high drug costs over multiple years and others who have high costs in one year but not over time. The outcome of current discussions in Congress about prescription drug legislation has implications for the affordability of prescription drugs among Medicare beneficiaries.

Juliette Cubanski and Tricia Neuman are with KFF. Anthony Damico is an independent consultant.

This work was supported in part by Arnold Ventures. We value our funders. KFF maintains full editorial control over all of its policy analysis, polling, and journalism activities.

Table 1: Medicare Part D Enrollees With Out-of-Pocket Spending Above $2,000 and $3,100 by State in 2019, and Estimated Savings Under Proposed Part D Spending Caps

Methods

This analysis is based on 2019 Medicare Part D claims data from the Centers for Medicare & Medicaid Services Chronic Conditions Data Warehouse for Part D enrollees who are not receiving low-income subsidies (LIS). We exclude Part D enrollees receiving full low-income subsidies because they face only modest cost-sharing amounts before the catastrophic coverage phase and no cost sharing for catastrophic coverage, as well as those receiving partial low-income subsidies, who pay 15% coinsurance before the catastrophic coverage phase and modest copayments of no more than $3.70 for generics and $9.20 for brands in the catastrophic phase.

For this analysis, we estimated the number of Part D enrollees without low-income subsidies who had average annual out-of-pocket spending for all the medications they took in 2019 above $2,000 and $3,100, as well as the specific drugs where non-LIS Part D enrollees incurred average annual out-of-pocket costs above $2,000 and $3,100 in 2019. Except where noted, we define a Medicare beneficiary as a full-year user when they either have 12 or more drug fills (generally 30-day supplies) or when their annualized prescription medication quantity received exceeds 360 days.

Understanding the Impact of Medicaid Premiums & Cost-Sharing: Updated Evidence from the Literature and Section 1115 Waivers

Authors: Madeline Guth, Meghana Ammula, and Elizabeth Hinton
Published: Sep 9, 2021

Issue Brief

Federal law limits the extent to which states can charge premiums and cost sharing in Medicaid because the Medicaid population is low-income. States may not charge premiums to Medicaid enrollees with incomes below 150% of the federal poverty level (FPL). Maximum allowable cost-sharing in Medicaid varies by type of service and income, with total family out-of-pocket costs (premiums and cost-sharing) limited to no more than 5% of family income. A large body of research shows premiums serve as a barrier to obtaining and maintaining Medicaid coverage; even relatively small levels of cost-sharing are associated with reduced care, including necessary services, as well as increased financial burden for families; and state savings from premiums and cost-sharing in Medicaid are limited. This brief reviews and summarizes the most recent literature on the impact of premiums and cost-sharing on low-income populations. We also summarize approved Section 1115 demonstration waivers allowing eight states to charge premiums to enrollees below 150% FPL (AZ, AR, GA, IN, IA, MI, MT, and WI) and analyze available data on the impact of these premiums from five states (AR, IN, IA, MI, and MT). States generally may not use Section 1115 authority to waive other cost-sharing protections such as statutory limits on co-payment amounts.

Our review of recent literature on premiums and cost-sharing is based on studies and reports published between 2017 and 2021. Our analysis of premiums in post-Affordable Care Act (ACA) Section 1115 waivers (approved under the Obama and Trump administrations) is based on available interim and final waiver evaluations as well as annual and quarterly state data reports posted on Medicaid.gov. Key findings include:

  • Recent studies bolster earlier research on premiums and cost-sharing for low-income populations, indicating that these policies lead to reduced coverage, worse access to care, and increased financial burden.
  • Eight states have CMS approval to implement Section 1115 waivers with premium requirements, with stated goals of these requirements including increasing personal responsibility and ensuring program sustainability.
  • While specific premium policies vary across states that have Section 1115 approval for premium requirements, available data and evaluations from five states that have implemented these requirements show that high numbers of enrollees fail to pay premiums, face consequences for nonpayment, and experience confusion over premium policies.

During the COVID-19 public health emergency (PHE), states may not disenroll those who fail to pay premiums. Of the six states that had been implementing Section 1115 premiums prior to the PHE, three have continued to charge these premiums while the other three have temporarily waived or suspended these premiums. After the PHE ends, states must determine whether and how to resume premium policies. Looking ahead, changing waiver policy under the Biden Administration could also impact the future of Medicaid premiums under Section 1115 waivers. In addition, as Congress considers options to provide coverage for people in the coverage gap, understanding the implications of premium requirements may help inform those options.

What does the literature tell us about the effects of premiums and cost-sharing on low-income populations?

An earlier literature review found that premiums serve as a barrier to obtaining and maintaining Medicaid coverage for low-income individuals, with those who lose coverage facing increased barriers to accessing care. Research indicated that these effects are largest among those with the lowest incomes. Studies also found that even relatively small levels of cost-sharing are associated with reduced use of care and increased financial burden. Research suggested that state savings from premiums and cost-sharing in Medicaid and CHIP are limited, and that increases in premiums and cost-sharing can increase pressures on safety net providers.

A review of recent studies continues to support earlier research on the impacts of premiums and cost-sharing among low-income populations. We reviewed research from 24 papers published between April 2017 and May 2021 on the effects of premiums and cost-sharing on low-income populations (usually defined as at or below 250% of the federal poverty level (FPL)). Additional research on the impact of premiums from Section 1115 waiver reports are described in a later section of this brief. Literature in this section includes peer-reviewed studies and freestanding reports, government reports, and white papers by research and policy organizations. Key findings include the following:

Premiums lead to decreased coverage for low-income individuals, with negative impacts on health access and outcomes for those who lose coverage. Studies find that premiums reduce insurance coverage and increase disenrollment among low-income individuals, though in some instances these effects were limited to healthier individuals only.1 ,2 ,3 ,4  Those who disenroll, are disenrolled, or otherwise lose coverage due to premiums are at increased likelihood of remaining uninsured and may experience worse health outcomes, decreased health care utilization, worse quality of health care, and increased financial burden.5 ,6 ,7  Other research shows that administrative burdens on eligibility and enrollment processes, such as having to re-apply to regain coverage, result in some eligible people remaining unenrolled.

Cost-sharing is associated with reduced use of care, worse health outcomes, and increased financial burden. Studies find that higher out-of-pocket costs are associated with decreased access to and utilization of care, including for individuals with significant health needs.8 ,9 ,10 ,11 ,12 ,13 ,14 ,15 ,16   In particular, studies indicate that higher cost-sharing contributes to decreased prescription refills.17 ,18 ,19 ,20 ,21 ,22 ,23  Several studies find that higher out-of-pocket costs are associated with worse health outcomes including increased mortality and unintended pregnancies.24 ,25 ,26 ,27 ,28   Finally, cost-sharing results in higher costs, decreased affordability, and greater financial burden for low-income adults.29 ,30 ,31 ,32 ,33 ,34 ,35 

One more recent study supported earlier findings of limited state savings from premiums and cost-sharing. The study finds that increasing premiums leads to lower-cost enrollees disproportionately dropping out, raising the average cost of the remaining insured population and contributing to increased average medical claims.36 

What states have approved Section 1115 waivers with premiums and how do they vary?

Following the ACA, eight states have received CMS approval to implement Section 1115 waivers with premium requirements.37  Prior to the ACA, a number of states sought approval for and implemented coverage expansion waivers (under Section 1115 authority) to optionally extend Medicaid eligibility to adults who did not meet categorical Medicaid eligibility requirements (i.e., to childless adults). Many of these waivers provided these adults more limited benefits and charged them higher premiums and cost-sharing than otherwise allowed in Medicaid. Medicaid expansion under the ACA expanded eligibility to nearly all adults with income at or below 138% FPL, including adults without dependents. While most states that have taken up the ACA option to expand Medicaid have implemented the expansion through State Plan authority, some states have sought and received approval to implement the ACA expansion through Section 1115 waivers. The Obama Administration approved certain premium requirement provisions as part of broader ACA Medicaid expansion Section 1115 waivers. Under the Trump Administration, CMS allowed states to apply these premium requirements to broader populations (i.e., non-expansion/traditional) and to charge higher premium amounts than previously approved. States generally may not use Section 1115 authority to waive other cost-sharing protections such as statutory limits on co-payment amounts.38 

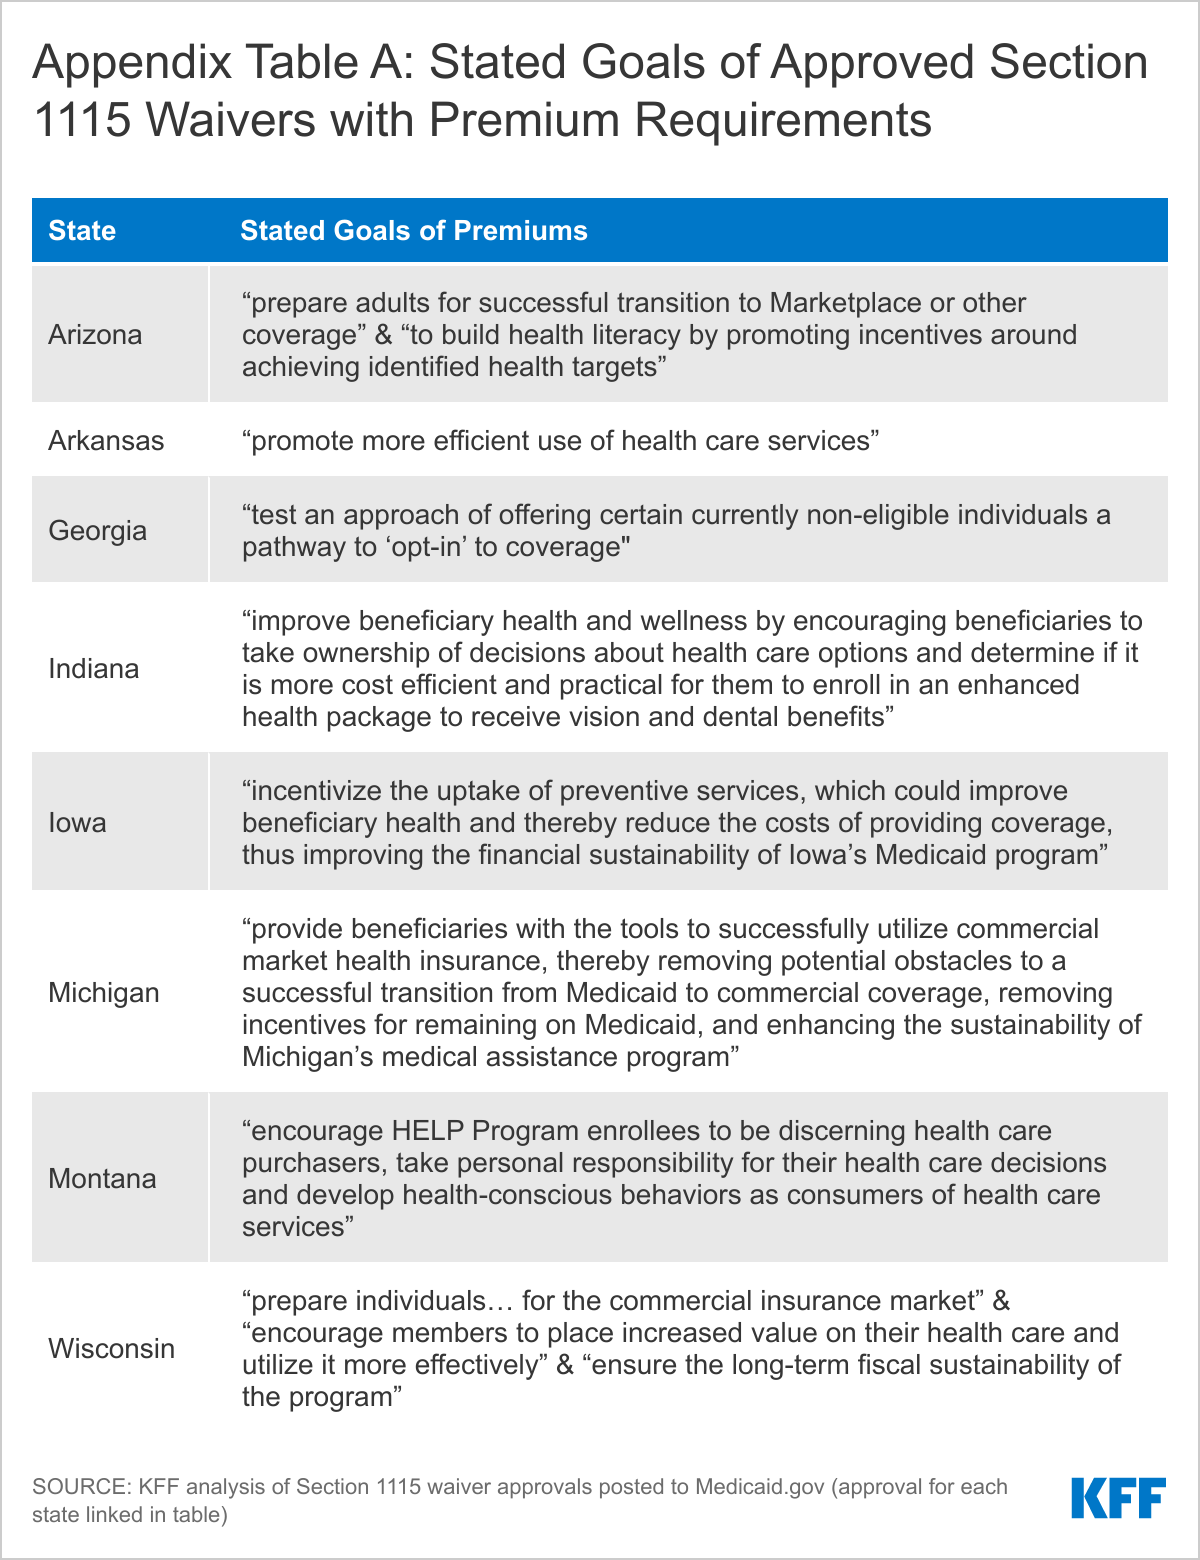
Stated goals of Section 1115 premium requirements include increasing personal responsibility and ensuring program sustainability (Appendix Table A). Appendix Table A summarizes goals of these post-ACA 1115 premium requirements across states with approved waivers. Across these goals, states hypothesize benefits of premiums for beneficiaries, including improving health outcomes and health literacy, increasing personal responsibility, and preparing enrollees to transition off Medicaid by aligning the program more closely with commercial coverage. States also hypothesize economic benefits of Section 1115 premiums for themselves, with another common goal being to ensure the fiscal sustainability of the Medicaid program.

Table 1: Approved Section 1115 Waivers with Premium Requirements

>

Key differences in approved Section 1115 premium policies across states include the populations subject to premiums, amounts charged, consequences for nonpayment, and other provisions (Table 1):

Populations. Six states (AR, AZ, IA, IN, MI, and MT) have approval to require expansion adults to pay premiums, though the income groups subject to premiums vary across these states. Under the Trump Administration, CMS approved waivers for three states (GA, IN, and WI) to charge premiums to non-expansion adults, including two states (GA and WI) which have not expanded Medicaid under the ACA. In addition to variation by eligibility group and income level, all states exempt some populations from being charged premiums and/or from facing consequences for non-payment, with common exemptions including medically frail populations and American Indian and Alaskan Native (AI/AN) individuals.

Amounts. Most states adjust premium amounts by beneficiary income, with approved possible charges ranging from approximately $5 to $74 per month. Four states (AR, AZ, MI, and MT) have approved waivers to require monthly premium payments as a percentage of income. Except for Michigan, these states all have approval to charge premiums equal to 2% of household income; Michigan currently charges 2% of income as well but has received CMS approval to raise this amount to 5% of income (which, once implemented, would make it the state with the highest premiums). The other four states (GA, IA, IN, and WI) have approval to charge fixed dollar premiums, three of which vary these amounts by income level (GA, IA, and IN). One of these states, Indiana, had previously charged premiums as a percentage of income but subsequently replaced this requirement with fixed dollar premiums to ease administrative burden.

How premiums are paid. In most states which have implemented premiums, enrollees pay premiums directly to the state, though in two states (AR and IN), enrollees pay premiums to health plans. States and/or health plans generally allow enrollees to pay premiums online (using credit/debit cards or bank account information) or by mail (using checks, cash, and/or money orders). States and/or plans may also allow enrollees to pay in person or by payroll deductions through eligible employers. In states where health plans charge premiums, payment options may vary by plan. Three states (AZ, IN, and MT) allow third party payers (such as employers or nonprofits) to make premium payments on behalf of enrollees.

Consequences for nonpayment. Six of eight states (AZ, GA, IA, IN, MT, and WI) have approval to impose some form of coverage loss for missed premiums (following a grace period) for at least some beneficiaries. In three of these states (AZ, GA, and IA), individuals who fail to pay premiums will lose coverage but may reapply at any time. In the other three states (IN, MT, and WI), individuals who fail to pay are disenrolled from coverage and locked out for a period of six months (IN and WI) or an indefinite period until all missed premiums are paid or until the state sends the individual a notice of collectible debt (MT). In Indiana, although only individuals above 100% FPL face coverage loss for nonpayment, enrollees below 100% FPL who fail to pay premiums receive a more limited benefit package (without coverage of vision, dental, and other services) and owe point-of-service co-payments. In most states, all individuals (including those not subject to coverage loss consequences) may face debt collection of unpaid premiums. Once unpaid premiums are considered collectible debt, states and/or health plans typically recover this debt from state tax refunds, but face some restrictions (e.g., may not place a lien on the individual’s home and may not sell the debt to a third party).

Additional provisions. In addition to monthly premiums, two states (GA and IN) have approval to charge a tobacco premium surcharge which increases the monthly amount owed for enrollees who use tobacco (by $3-$5 in GA and $1.50-$30 in IN, with both states varying the surcharge amount by income level).39  Six states (AZ, GA, IA, IN, MI, and WI) with approved premiums also have approved healthy behavior incentives that may reduce premium amounts if completed. Four states (AZ, GA, IN, and MI) have approval to deposit paid premiums into a member savings account that may be used to deduct copays. Arkansas has approval for a Qualified Health Plan (QHP) premium assistance program, through which expansion adults are required to enroll in and pay premiums for Marketplace QHP coverage, with premium assistance from the state to reduce these premiums to no more than 2% of income.

What does the data show on the impact of premiums under Section 1115 waivers?

In this section, we analyze data from five states that have implemented Section 1115 premium requirements (AR, IN, IA, MI, and MT) on rates of premium nonpayment and consequences, reasons for nonpayment including confusion and affordability, and administrative burden. Our analysis is based on interim and final waiver evaluations as well as annual and quarterly state data reports posted on Medicaid.gov. Although we highlight key themes across states, comparison between states is limited by state-by-state variation in premium policies and available data metrics.

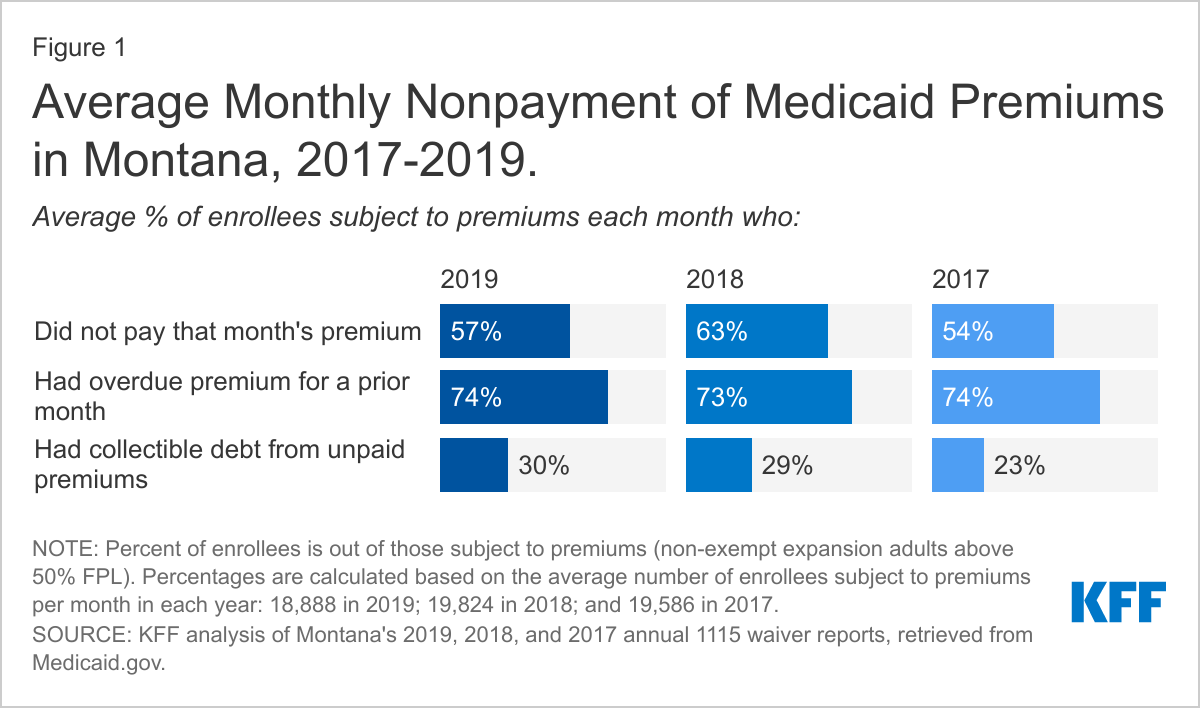
Available data from quarterly and annual state waiver reports suggests that high numbers of enrollees fail to pay premiums. Common reasons for nonpayment include confusion and affordability (see details below). For example, in Montana (a state with particularly robust data), for each month in 2019 an average of 57% of enrollees failed to pay that month’s premium, while 74% had an overdue premium for a prior month (Figure 1); these percentages were similar in 2017 and 2018.40  Lower-income enrollees in Montana were more likely to fail to pay: an average of 61% of those between 50% and 100% FPL failed to pay that month’s premium versus 52% of those above 100% FPL (data not shown).

Average Monthly Nonpayment of Medicaid Premiums in Montana, 2017-2019.

Available data from other states also suggests high rates of nonpayment: in Arkansas, from January 2015 through April 2016, just 14% of enrollees made at least one eligible premium payment. In Michigan, between October 2014 and January 2021, fewer than half (47%) of those who owed premiums made at least one payment. During this time period, the state only collected 26%, or approximately $23.8 million, of the $92.3 million in premium payments owed. In Indiana, from February 2015 through November 2016, 55% of all individuals subject to premiums had at least one missed premium payment and faced consequences.

Data indicates that many enrollees have faced an array of consequences for failure to pay premiums, including loss of coverage.

  • Loss of coverage or benefits. Data shows that individuals with incomes above 100% FPL subject lost coverage in Montana, Indiana, and Iowa due to failure to pay premiums. In Montana, a total of 1,800 individuals lost coverage due to nonpayment of premiums in 2019 (nearly one in four of those subject to coverage loss).41  In Iowa, a total of 2,200 individuals were disenrolled due to failure to pay premiums in 2019 (16% of those subject to coverage loss).42  In Indiana, from February 2015 through November 2016, of those eligible to pay premiums with incomes above 100% FPL, just over half (51%) were never enrolled in coverage (46,200 individuals) or lost coverage (13,600 individuals) due to failure to pay. Nearly half (47%) of those eligible to pay premiums with incomes below 100% FPL were moved from the comprehensive to the more limited benefit package due to failure to pay (286,900 individuals in total).
  • Debt collection. In addition, data show that individuals in Iowa, Montana, and Michigan were subject to debt collection due to premium non-payment. For example, in Iowa, a total of 5,300 enrollees faced debt collection due to failure to pay premiums in 2019 (more than one in 10 of those subject to premiums).43  In Montana, for each month in 2019 about 30% of all non-exempt enrollees were subject to debt collection as a consequence for premium nonpayment (Figure 1). As of August 2017, about 186,000 Michigan beneficiaries owed past due premiums or co-payments, and over 40% of these were in “consistent failure to pay” status, subjecting them to garnishment.44 

Available data from evaluation reports indicates that many enrollees experience confusion over premium policies. Unlike employer-sponsored insurance plans which typically require workers to contribute some share of premium costs by automatically deducting these from employee paychecks, premium policies implemented as part of Section 1115 Medicaid waivers generally require enrollees to actively remit payment each month, typically online or by mail. For example, reports from Iowa and Indiana show that the most common reasons for nonpayment of premiums included not knowing payment was required and forgetting to pay or confusion about payment process (in addition to affordability, discussed below). State reports also indicate that policies related to premiums such as member savings accounts and healthy behavior incentives similarly may result in confusion for enrollees. Other examples include the following:

  • An Iowa survey of individuals disenrolled for failure to pay premiums found that fewer than 40% were aware that they owed a premium while receiving coverage. Just 34% of those disenrolled for premium nonpayment knew that they were being disenrolled before it happened (despite the state’s 90-day grace period for premium nonpayment).
  • In Montana, the majority of enrollees (current and those disenrolled for premium nonpayment) knew that monthly premiums were dependent on income; however, focus groups reported multi-hour wait times when trying to obtain help understanding premium policies. Fewer Montanans were aware of the consequences for nonpayment and options for retaining or reenrolling in coverage following nonpayment.45 
  • Indiana reports that while most members understood payment obligations generally (i.e., the fact that they owed premiums), fewer understood the consequences for nonpayment. Although only enrollees above 100% FPL are subject to coverage loss and lock-out in Indiana, evidence from focus groups suggests that individuals at all income levels thought that this consequence for premium nonpayment applied to them. Officials in Indiana indicated that member understanding of premium obligations may have improved following the transition from a 2% of income premium structure to a fixed dollar amount structure.
  • An analysis from Michigan reveals that although the state currently does not impose coverage loss as a consequence for nonpayment of premiums, enrollees subject to premiums were more likely to disenroll from the program.

Many enrollees reported that their premiums were not affordable. In Iowa and Indiana, the most common reason for failure to pay premiums was inability to afford payment. In Montana, 15% of “current enrollees” (subject to premiums) and 80% of those disenrolled for failure to pay premiums reported that premiums were more than they could afford. In Indiana, 15% of current enrollees and 41% of those disenrolled for failure to pay premiums reported that they always or usually worried about having enough money to pay premiums. Among individuals in Michigan who disenrolled from Medicaid, those who remained uninsured were less likely to agree that Medicaid premiums were fair and affordable. Of individuals disenrolled for failure to pay premiums in Iowa, 44% lacked coverage and 31% stated that their health had declined following disenrollment. In Montana, the large majority of those disenrolled for failure to pay premiums were found to be eligible through an alternative Medicaid pathway, suggesting that they had lower incomes and qualified for “standard Medicaid” coverage without premium requirements.

Limited available data suggests that premiums may cause high administrative burden and in some cases have resulted in the discontinuation of program elements. States are not required to report administrative data—including state costs to build and operate the infrastructure required to implement premium requirements—associated with Section 1115 waiver implementation.

  • In Arkansas, in 2016 administrative costs for the state’s Section 1115 waiver were nearly 30% higher as compared to standard Medicaid (though the state does not identify specifically the reasons for these higher costs).
  • In 2018, Indiana replaced its 2% of income premium requirement with a fixed dollar premium requirement that varies across five income tiers, explaining that this simpler structure would ease administrative burden from both a systems and member communication perspective.
  • Two years after implementing its premium requirements, Montana discontinued two provisions related to premiums due to administrative and budgetary concerns. The state initially provided coverage to non-exempt enrollees through public-private third-party administrator (TPA) plans but eliminated this program element due to state budgetary concerns, citing the belief that shifting to state collection of premiums instead of TPA would yield savings in administrative costs. At the same time, Montana also discontinued a provision that provided all enrollees subject to premiums with a credit toward co-payments of up to 2% of income, citing that this credit was too difficult to track and administer.

Without administrative data from most states, it is unclear whether costs to implement premium requirements are typically offset by premium collections, given high rates of nonpayment: for example, while Michigan charged over $92.3 million in premiums from October 2014 to January 2021, enrollees paid less than $23.8 million in premiums over the same time period.

Looking Ahead

Recent literature as well as data from Section 1115 waiver reports and evaluations bolster earlier research finding that premiums may serve as a barrier to obtaining and maintaining Medicaid coverage, are confusing and unaffordable to enrollees, and that states’ premium collections may not offset administrative costs. Looking ahead, both the continued COVID-19 emergency and actions at the federal level could impact premiums in Medicaid, though the Biden Administration’s stance on premiums requirements approved through Section 1115 waivers is not yet clear. Three states (AR, MI, and MT) are still charging premiums during the PHE (though maintenance of eligibility requirements prohibit them from disenrolling those who fail to pay and also prohibit states from increasing premium amounts), while the remaining states have temporarily waived or suspended premiums. When the PHE ends, states must determine whether and how to resume policies including charging premiums, increasing premiums, and/or disenrolling individuals who fail to pay.

At the federal level, Section 1115 waiver policy generally reflects changing priorities from one presidential administration to another. Section 1115 waiver policy could shift under the Biden Administration: in a January 28, 2021 executive order, President Biden directed relevant agencies to review waivers and waiver policies that may reduce coverage under or otherwise undermine Medicaid. CMS subsequently began the process to withdraw waivers with work requirement provisions and indicated that other previously-approved authorities in these waivers—including, in some cases, premium requirements—remained under review. CMS generally reserves the right to withdraw approved waiver authorities at any time, and can also decline to renew or to renegotiate waivers as demonstrations expire. This large body of research and state experience with premium waivers could contribute to decisions about continuing or granting additional waivers to study the effects of such policies. In addition, as Congress considers options to provide coverage for people in the coverage gap, understanding the implications of premium requirements may help inform those options.

The authors thank former KFF Policy Analyst Olivia Pham for her assistance reviewing studies on the effects of premiums and cost-sharing.

Appendix

Appendix Table A: Stated Goals of Approved Section 1115 Waivers with Premium Requirements

Endnotes

  1. Amy Finkelstein, Nathaniel Hendren, and Mark Shepard, "Subsidizing Health Insurance for Low-Income Adults: Evidence from Massachusetts," American Economic Review 109 no. 4 (April 2019): 1530-67, https://doi.org/10.1257/aer.20171455 ↩︎
  2. Coleman Drake and David M. Anderson, "Terminating Cost-Sharing Reduction Subsidy Payments: The Impact Of Marketplace Zero-Dollar Premium Plans On Enrollment," Health Affairs 39 no. 1 (January 2020): 41-49, https://doi.org/10.1377/hlthaff.2019.00345 ↩︎
  3. Seth Freedman, Lilliard Richardson, and Kosali I. Simon, "Learning From Waiver States: Coverage Effects Under Indiana’s HIP Medicaid Expansion," Health Affairs 37 no. 6 (June 2018): 936-943, https://www.healthaffairs.org/doi/10.1377/hlthaff.2017.1596 ↩︎
  4. Betsy Q. Cliff, Sarah Miller, Jeffrey T. Kullgren, John Z. Ayanian, and Richard Hirth, Adverse Selection in Medicaid: Evidence from Discontinuous Program Rules (National Bureau of Economic Research, Working Paper No. 28762, May 2021), https://www.nber.org/papers/w28762 ↩︎
  5. Natoshia M. Askelson et al., "Purged from the Rolls: A Study of Medicaid Disenrollment in Iowa," Health Equity 3 no. 1 (December 2019): 637-643, https://doi.org/10.1089/heq.2019.0093 ↩︎
  6. Brendan Saloner et al., "Access to Care Among Individuals Who Experienced Medicaid Lockouts After Premium Nonpayment," Jama Network Open 2 no. 11 (November 2019), https://doi.org/10.1001/jamanetworkopen.2019.14561 ↩︎
  7. Rohan Khera et al., "Association of Out-of-Pocket Annual Health Expenditures With Financial Hardship in Low-Income Adults With Atherosclerotic Cardiovascular Disease in the United States," JAMA Cardiology 3 no. 8 (August 2018): 729-738, https://doi.org/10.1001/jamacardio.2018.1813 ↩︎
  8. Uriel Kim, Johnie Rose, and Siran Koroukian, "Access and Affordability in Low- to Middle-Income Individuals Insured Through Health Insurance Exchange Plans: Analysis of Statewide Data," Journal of General Internal Medicine 34 (January 2019): 792-795, https://link.springer.com/article/10.1007/s11606-019-04826-w ↩︎
  9. Charles Stoecker, Alexandra M. Stewart, and Megan C. Lindley, "The Cost of Cost-Sharing: The Impact of Medicaid Benefit Design on Influenza Vaccination Uptake," Vaccines 5 no. 1 (March 2017): 8, https://doi.org/10.3390/vaccines5010008 ↩︎
  10. Amitabh Chandra, Evan Flack, and Ziad Obermeyer, The Health Costs of Cost-Sharing (National Bureau of Economic Research, Working Paper No. 28439, February 2021), https://www.nber.org/papers/w28439 ↩︎
  11. Kurt J. Lavetti, Thomas DeLeire, and Nicolas R. Ziebarth, How Do Low-Income Enrollees in the Affordable Care Act Marketplaces Respond to Cost-Sharing? (National Bureau of Economic Research, Working Paper No. 26430, November 2019), https://www.nber.org/papers/w26430 ↩︎
  12. Kelly C. Young-Wolff et al., "Evaluating the Impact of Eliminating Copayments for Tobacco Cessation Pharmacotherapy," Medical Care 56 no. 11 (November 2018): 912-918, https://doi.org/10.1097/MLR.0000000000000987 ↩︎
  13. David L. Rabin, Anuradha Jetty, Stephen Petterson, Ziad Saqr, and Allison Froehlich, "Among Low-Income Respondents With Diabetes, High-Deductible Versus No-Deductible Insurance Sharply Reduces Medical Service Use," Diabetes Care 40 no. 2 (February 2017): 239-245, https://doi.org/10.2337/dc16-1579 ↩︎
  14. J. Frank Wharam et al., "Diabetes Outpatient Care and Acute Complications Before and After High-Deductible Insurance Enrollment: A Natural Experiment for Translation in Diabetes (NEXT-D) Study," Jama Internal Medicine 177 no. 3 (March 2017): 358-368, https://doi.org/10.1001/jamainternmed.2016.8411 ↩︎
  15. J. Frank Wharam et al., "Vulnerable And Less Vulnerable Women In High-Deductible Health Plans Experienced Delayed Breast Cancer Care," Health Affairs 38 no. 3 (March 2019): 408-415, https://doi.org/10.1377/hlthaff.2018.05026 ↩︎
  16. J. Frank Wharam et al., "Effect of High-Deductible Insurance on High-Acuity Outcomes in Diabetes: A Natural Experiment for Translation in Diabetes (NEXT-D) Study," Diabetes Care 41 no. 5 (May 2018): 940-948, https://doi.org/10.2337/dc17-1183 ↩︎
  17. Vanessa K. Dalton et al., "Trends in Birth Rates After Elimination of Cost Sharing for Contraception by the Patient Protection and Affordable Care Act," JAMA Network Open 3 no. 11 (November 2020): https://doi.org/10.1001/jamanetworkopen.2020.24398 ↩︎
  18. Jalpa A. Doshi, Pengxiang Li, Sunita Desai, and Steven C. Marcus, "Impact of Medicaid Prescription Copayments on Use of Antipsychotics and Other Medications in Patients with Schizophrenia," Journal of Medical Economics 12 (August 2017): 1252-1260, https://doi.org/10.1080/13696998.2017.1365720 ↩︎
  19. Deliana Kostova and Jared Fox, "Chronic Health Outcomes and Prescription Drug Copayments in Medicaid," Medical Care 55 no. 5 (May 2017): 520-527, https://doi.org/10.1097/MLR.0000000000000700 ↩︎
  20. Amitabh Chandra, Evan Flack, and Ziad Obermeyer, The Health Costs of Cost-Sharing (National Bureau of Economic Research, Working Paper No. 28439, February 2021), https://www.nber.org/papers/w28439 ↩︎
  21. Rachel E. Barenie, Aaron S. Kesselheim, Theodore Tsacogianis, and Michael Fischer, "Associations Between Copays, Coverage Limits for Opioid Use Disorder Medications, and Prescribing in Medicaid, 2018," Medical Care 59 no. 3 (March 2021): 266-272, https://doi.org/10.1097/MLR.0000000000001494 ↩︎
  22. Kelly C. Young-Wolff et al., "Evaluating the Impact of Eliminating Copayments for Tobacco Cessation Pharmacotherapy," Medical Care 56 no. 11 (November 2018): 912-918, https://doi.org/10.1097/MLR.0000000000000987 ↩︎
  23. David L. Rabin, Anuradha Jetty, Stephen Petterson, Ziad Saqr, and Allison Froehlich, "Among Low-Income Respondents With Diabetes, High-Deductible Versus No-Deductible Insurance Sharply Reduces Medical Service Use," Diabetes Care 40 no. 2 (February 2017): 239-245, https://doi.org/10.2337/dc16-1579 ↩︎
  24. Vanessa K. Dalton et al., "Trends in Birth Rates After Elimination of Cost Sharing for Contraception by the Patient Protection and Affordable Care Act," JAMA Network Open 3 no. 11 (November 2020): https://doi.org/10.1001/jamanetworkopen.2020.24398 ↩︎
  25. Deliana Kostova and Jared Fox, "Chronic Health Outcomes and Prescription Drug Copayments in Medicaid," Medical Care 55 no. 5 (May 2017): 520-527, https://doi.org/10.1097/MLR.0000000000000700 ↩︎
  26. Amitabh Chandra, Evan Flack, and Ziad Obermeyer, The Health Costs of Cost-Sharing (National Bureau of Economic Research, Working Paper No. 28439, February 2021), https://www.nber.org/papers/w28439 ↩︎
  27. J. Frank Wharam et al., "Diabetes Outpatient Care and Acute Complications Before and After High-Deductible Insurance Enrollment: A Natural Experiment for Translation in Diabetes (NEXT-D) Study," Jama Internal Medicine 177 no. 3 (March 2017): 358-368, https://doi.org/10.1001/jamainternmed.2016.8411 ↩︎
  28. J. Frank Wharam et al., "Effect of High-Deductible Insurance on High-Acuity Outcomes in Diabetes: A Natural Experiment for Translation in Diabetes (NEXT-D) Study," Diabetes Care 41 no. 5 (May 2018): 940-948, https://doi.org/10.2337/dc17-1183 ↩︎
  29. Salam Abdus and Patricia S. Keenan, "Financial Burden of Employer-Sponsored High-Deductible Health Plans for Low-Income Adults With Chronic Health Conditions," Jama Internal Medicine 178 no. 12 (December 2018): 1706-1708, https://doi.org/10.1001/jamainternmed.2018.4706 ↩︎
  30. Kurt J. Lavetti, Thomas DeLeire, and Nicolas R. Ziebarth, How Do Low-Income Enrollees in the Affordable Care Act Marketplaces Respond to Cost-Sharing? (National Bureau of Economic Research, Working Paper No. 26430, November 2019), https://www.nber.org/papers/w26430 ↩︎
  31. Amy Finkelstein, Nathaniel Hendren, and Erzo F. P. Luttmer, "The Value of Medicaid: Interpreting Results from the Oregon Health Insurance Experiment," Journal of Political Economy 127 no. 6 (December 2019), https://doi.org/10.1086/702238 ↩︎
  32. Alon Peltz, Amy J. Davidoff, Cary P. Gross, and Marjorie S. Rosenthal, "Low-Income Children With Chronic Conditions Face Increased Costs If Shifted From CHIP To Marketplace Plans," Health Affairs 36 no. 4 (April 2017): 616–625, https://doi.org/10.1377/hlthaff.2016.1280 ↩︎
  33. Uriel Kim, Johnie Rose, and Siran Koroukian, "Access and Affordability in Low- to Middle-Income Individuals Insured Through Health Insurance Exchange Plans: Analysis of Statewide Data," Journal of General Internal Medicine 34 (January 2019): 792-795, https://link.springer.com/article/10.1007/s11606-019-04826-w ↩︎
  34. Rohan Khera et al., "Association of Out-of-Pocket Annual Health Expenditures With Financial Hardship in Low-Income Adults With Atherosclerotic Cardiovascular Disease in the United States," JAMA Cardiology 3 no. 8 (August 2018): 729-738, https://doi.org/10.1001/jamacardio.2018.1813 ↩︎
  35. J. Frank Wharam et al., "Vulnerable And Less Vulnerable Women In High-Deductible Health Plans Experienced Delayed Breast Cancer Care," Health Affairs 38 no. 3 (March 2019): 408-415, https://doi.org/10.1377/hlthaff.2018.05026 ↩︎
  36. Amy Finkelstein, Nathaniel Hendren, and Mark Shepard, "Subsidizing Health Insurance for Low-Income Adults: Evidence from Massachusetts," American Economic Review 109 no. 4 (April 2019): 1530-67, https://doi.org/10.1257/aer.20171455 ↩︎
  37. Additionally, CMS also issued approval for a premiums provision in Kentucky's KY HEALTH waiver on January 12, 2018. However, this waiver approval was set aside by a federal district court prior to implementation and Democratic Governor Andy Beshear subsequently notified CMS that the state had terminated this waiver on December 16, 2019. ↩︎
  38. An exception is for non-emergent use of the emergency room (ER). A small number of states have requested or received CMS approval to charge co-payments exceeding statutory limits assessed for non-emergent use of the ER. See KFF Section 1115 waiver tracker for more details. ↩︎
  39. A study on tobacco premium surcharges in the ACA Marketplaces found that among adults 138% to 400% FPL, these surcharges reduced coverage but did not increase smoking cessation. ↩︎
  40. In Montana, for each month on average in 2019, only about one in five waiver enrollees were subject to premiums (about 18,900 out of 96,200 total enrollees), as most enrollees were below 50% FPL (71,400 enrollees) and a small number met other exemptions to premium requirements (5,900 enrollees). Of those enrollees who were subject to premiums, 59% were between 50% and 100% FPL (11,100 enrollees) and 41% were above 100% FPL (7,800 enrollees). ↩︎
  41. Montana’s waiver report does not provide the number of annual unduplicated enrollees. Thus, for this estimate we use as a denominator the monthly average number of enrollees subject to coverage loss (non-exempt enrollees above 100% FPL), which is about 7,800 enrollees. ↩︎
  42. Iowa’s waiver reports do not provide the number of annual unduplicated enrollees. Thus, for this estimate we use as a denominator the monthly average number of enrollees subject to coverage loss (non-exempt enrollees above 100% FPL), which is about 14,200 enrollees. ↩︎
  43. Iowa’s waiver reports do not provide the number of annual unduplicated enrollees. Thus, for this estimate we use as a denominator the monthly average number of enrollees subject to debt collection for premium nonpayment (all enrollees subject to premiums), which is about 48,800 enrollees. ↩︎
  44. More recent data from Michigan indicates that as of March 2021, about 281,800 beneficiaries owed past due premiums or co-payments, and about 27% of these were in “consistent failure to pay” status, subjecting them to garnishment. However, although Michigan is still charging and collecting premiums during the COVID-19 PHE, during this time the state is not referring beneficiaries to the Department of Treasury for debt collection for any unpaid premiums. ↩︎
  45. In Montana, 75% of current enrollees and 66% of “disenrollees” (individuals disenrolled for failure to pay premiums) knew that monthly premiums were dependent on income. 43% of enrollees and 34% of disenrollees knew they could pay missed premiums within a 90-day grace period to retain coverage, 26% of enrollees and 19% of disenrollees knew they could pay after 90 days and reenroll, and 28% of enrollees and 40% of disenrollees knew that unpaid premiums could be collected against future tax refunds. ↩︎
Poll Finding

Views Of COVID-19 Vaccines Among LGBT Adults

Published: Aug 27, 2021

Findings

There has been limited data on how the coronavirus pandemic has impacted the lives of lesbian, gay, bisexual, and transgender individuals (LGBT) in the U.S. Drawing on our previous analyses indicating that LGBT individuals are at greater risk of both COVID-19 health and economic outcomes, this analysis examines their views of the vaccine and their role in uptake.  

Key Findings

  • This new analysis examines the experiences of LGBT adults from the July COVID-19 Vaccine Monitor and finds that as a group they are more likely to be vaccinated for COVID-19 and less likely to view getting the vaccine as a health risk compared to non-LGBT adults. Previous analyses have found that the LGBT population bears a disproportionate burden from the pandemic, including economic hardships and mental health problems. In addition, research has found that LGBT individuals have higher rates of comorbidities and experience stigma and discrimination in the health system.
  • A larger share of LGBT adults than non-LGBT adults say they have received at least one dose of a COVID-19 vaccine (82% vs 66%) and 8 in 10 report being fully vaccinated (80% with one of their one-dose vaccine or two of their two-dose). This may reflect the fact that larger shares of LGBT adults identify as Democrats, a group that has been disproportionately likely to get the vaccine. However, the high level of vaccination among LGBT adults is notable given that they are a younger population. Nearly half (45%) of LGBT adults are under age 30, an age group that has lagged in vaccination rates compared to older populations.
  • LGBT adults are more supportive of vaccine mandates than non-LGBT adults. Almost two-thirds of LGBT people (65%) support the federal government recommending that employers require their employees to get the COVID-19 vaccine unless they have a medical exception. Fewer non-LGBT adults agree with government recommended mandates, with the group split between supporting them (50%) and not (47%). Again, this likely reflects the differences in partisan identification between the two populations.
  • A larger share of LGBT people than non-LGBT people believe the seriousness of the pandemic has been generally underestimated by the media, which may be a reflection of the disproportionate mental health and economic struggles they have faced. This may also be a factor in their relative enthusiasm and high uptake of the COVID-19 vaccine. Compared to other historically marginalized groups that have tended to have lower vaccine uptake, this high level of vaccination could be an important factor to mitigate further disparities in the pandemic’s impact on the LGBT population.

COVID-19 Vaccination Intentions And Uptake

As of July 2021, eight in ten LGBT adults report being vaccinated for COVID-19, according to the latest KFF COVID Vaccine Monitor. A larger share of LGBT adults report receiving at least one dose of a COVID-19 vaccine than non-LGBT adults (82% vs. 66%). Eight in ten report being fully vaccinated (80% with one of their one-dose vaccine or two of their two-dose). Eighteen percent (18%) of LGBT adults remain unvaccinated, a smaller share than for non-LGBT adults, 32% of whom remain unvaccinated.

Among LGBT adults, a small share (2%) say they want to get vaccinated “as soon as possible,” while 4% want to “wait and see” before getting vaccinated, and 12% say they will “definitely not” get the vaccine (similar to the 14% of non-LGBT adults who express this view).

Eight In Ten LGBT Adults Already Vaccinated, Significantly More Than Non-LGBT

In KFF’s analysis of April and May polling data, 56% of LGBT adults reported being vaccinated, 5% wanted to get one “as soon as possible,” and another 20% wanted to “wait and see,” mostly matching the reported intentions among the general public, 59% of whom were already vaccinated, 6% wanted it right away, and 14% were “wait and see.” Around 1 in 10 LGBT people reported they definitely would not get vaccinated (11%) or would only get it if required (7%), also similar to intentions among the general population.

Now however, a larger share of LGBT adults report being vaccinated, surpassing rates among the non-LGBT population.

A previous KFF analysis examined the demographic groups among the unvaccinated population finding adults who are still unvaccinated tend to be older, more Republican-leaning, less educated, and lower income, with each of those groups making up a larger part of unvaccinated than the vaccinated group. Party identification, in particular, tends to be a strong predictor of vaccination intentions.

Higher rates of vaccination among LGBT adults compared to their non-LGBT peers may be associated with strong Democratic party identification, rather than or in addition to, sexual orientation or gender identity. Two-thirds of LGBT adults identify as Democrats or lean that way compared to 43% of non-LGBT adults. By contrast, more than a third (36%) of non-LGBT adults identify or lean Republican compared to 14% of LGBT adults. Additionally, LGBT adults tend to be younger and lower income, two groups that tend to have low vaccination rates. Almost half (45%) of adults who identify as LGBT are under age 30 compared to 19% of non-LGBT adults, and half (51%) of LGBT adults compared to a third (34%) of non-LGBT people report having household incomes under $40,000. High self-reported vaccination rates among LGBT people could be driven by their Democratic partisanship, but also is in spite of their relatively young age and lower incomes.

Views of covid-19 and the vaccine

In addition to higher vaccination uptake, LGBT individuals have different views of how the media has portrayed the severity of the pandemic, as well as the relative risk of the vaccines versus the virus.

Three in 10 (31%) LGBT adults say what is said in the news “generally underestimates” the seriousness of the pandemic compared to one in five (18%) non-LGBT adults. Another four in ten LGBT adults (40%) say the news is “generally correct” in its portrayal of the seriousness of the pandemic, which is similar to the share of non-LGBT adults who report the same (44%).

LGBT Adults Are More Likely To Think The News Underestimates The Seriousness Of The Pandemic

Consistent with views of the pandemic generally, a large majority of LGBT adults say becoming infected with coronavirus is a bigger risk to their health than getting vaccinated (82%), while 14% think getting vaccinated is a bigger risk. About 7 in 10 (69%) non-LGBT people agree that becoming infected is a bigger risk, though this share is somewhat less than among the LGBT group.

Larger Shares Of LGBT Adults Think Becoming Infected With COVID-19 Is A Bigger Risk Than Getting The Vaccine

Similar to other adults, LGBT people generally have high levels of confidence in the effectiveness of the COVID-19 vaccines. Two-thirds of LGBT people think the available COVID-19 vaccines are “extremely” or “very” effective at preventing vaccinated individuals from getting seriously sick or hospitalized if infected (67%) and dying from COVID (66%). Another 56% say the vaccines are effective at preventing infection if exposed to someone who is sick and 45% say the same of passing coronavirus on to others.

Majorities Of LGBT And Non-LGBT Adults View The Available COVID-19 Vaccines As Effective, Especially With Preventing Death And Hospitalization

Mandates

LGBT adults are more supportive of vaccine mandates than non-LGBT adults. Almost two-thirds (65%) of LGBT people support the federal government recommending that employers require their employees to get the COVID-19 vaccine, unless they have a medical exemption. Fewer non-LGBT adults agree with the government recommended mandates, with the group split between supporting them (50%) and not (47%). Given that views on government mandates divide sharply along partisan lines, this division of opinion between LGBT adults and non-LGBT adults likely reflects the fact that LGBT adults lean more Democratic, as noted above.

Two-Thirds LGBT Adults Support Government Recommending Employer Mandates For Vaccines, Non-LGBT Adults Split

Methodology

This KFF COVID-19 Vaccine Monitor was designed and analyzed by public opinion researchers at the Kaiser Family Foundation (KFF). The survey was conducted July 15-July 27, 2021, among a nationally representative random digit dial telephone sample of 1,517 adults ages 18 and older (including interviews from 322 Hispanic adults and 300 non-Hispanic Black adults), living in the United States, including Alaska and Hawaii (note: persons without a telephone could not be included in the random selection process). This includes 95 adults who identify as LGBT, 1,403 who are not LGBT, and 19 respondents who said they didn’t know or refused to answer. Phone numbers used for this study were randomly generated from cell phone and landline sampling frames, with an overlapping frame design, and disproportionate stratification aimed at reaching Hispanic and non-Hispanic Black respondents as well as those living in areas with high rates of COVID-19 vaccine hesitancy. Stratification was based on incidence of the race/ethnicity subgroups and vaccine hesitancy within each frame. High hesitancy was defined as living in the top 25% of counties as far as the share of the population not intending to get vaccinated based on the U.S. Census Bureau’s Household Pulse Survey.  The sample also included 28 respondents reached by calling back respondents that had previously completed an interview on the KFF Tracking poll at least nine months ago. Another 118 interviews were completed with respondents who had previously completed an interview on the SSRS Omnibus poll (and other RDD polls) and identified as Hispanic (n =50 ; including 21 in Spanish) or non-Hispanic Black (n=68). Computer-assisted telephone interviews conducted by landline (176) and cell phone (1,341, including 1,015 who had no landline telephone) were carried out in English and Spanish by SSRS of Glen Mills, PA. To efficiently obtain a sample of lower-income and non-White respondents, the sample also included an oversample of prepaid (pay-as-you-go) telephone numbers (25% of the cell phone sample consisted of prepaid numbers) Both the random digit dial landline and cell phone samples were provided by Marketing Systems Group (MSG). For the landline sample, respondents were selected by asking for the youngest adult male or female currently at home based on a random rotation. If no one of that gender was available, interviewers asked to speak with the youngest adult of the opposite gender. For the cell phone sample, interviews were conducted with the adult who answered the phone. KFF paid for all costs associated with the survey.

The combined landline and cell phone sample was weighted to balance the sample demographics to match estimates for the national population using data from the Census Bureau’s 2019 U.S. American Community Survey (ACS), on sex, age, education, race, Hispanic origin, and region, within race-groups, along with data from the 2010 Census on population density. The sample was also weighted to match current patterns of telephone use using data from the January- June 2020 National Health Interview Survey. The weight takes into account the fact that respondents with both a landline and cell phone have a higher probability of selection in the combined sample and also adjusts for the household size for the landline sample, and design modifications, namely, the oversampling of potentially undocumented respondents and of prepaid cell phone numbers, as well as the likelihood of non-response for the re-contacted sample. All statistical tests of significance account for the effect of weighting.

The margin of sampling error including the design effect for the full sample is plus or minus 3 percentage points. Numbers of respondents and margins of sampling error for key subgroups are shown in the table below. For results based on other subgroups, the margin of sampling error may be higher. Sample sizes and margins of sampling error for other subgroups are available by request. Sampling error is only one of many potential sources of error and there may be other unmeasured error in this or any other public opinion poll. Kaiser Family Foundation public opinion and survey research is a charter member of the Transparency Initiative of the American Association for Public Opinion Research.

This work was supported in part by grants from the Chan Zuckerberg Initiative DAF (an advised fund of Silicon Valley Community Foundation), the Ford Foundation, and the Molina Family Foundation. We value our funders. KFF maintains full editorial control over all of its policy analysis, polling, and journalism activities.

GroupN (unweighted)M.O.S.E.
Total1,517± 3 percentage points
LGBT Status
LGBT adults95± 13 percentage points
Non-LGBT adults1,403± 3 percentage points
News Release

Two New KFF Reports Take a Closer Look at the COVID-19 Pandemic and the LGBT Community, From the Impact on Mental Health to Vaccination Status

Published: Aug 27, 2021

Two new KFF reports provide new and updated data on the experiences of lesbian, gay, bisexual and transgender (LGBT) people during the COVID-19 pandemic, featuring data showing the impact on mental health and COVID-19 Vaccine Monitor data on vaccine uptake within the community. The two reports add important context to the limited but growing body of evidence on the community’s pandemic experiences.

As a result of the COVID-19 pandemic, LGBT people reported stress and worry negatively impacted their mental health, more often and more severely than non-LGBT people. As of July, six in ten LGBT people reported that the pandemic negatively impacted their mental health, with 31% saying it had a major impact, compared to 17% of non-LGBT people. One in four (25%) LGBT people report seeking mental health care during the pandemic compared to one in ten non-LGBT people. While LGBT people were more likely to seek out mental health services during the pandemic, almost two in ten faced affordability barriers. For more information, see the full report The Impact of the COVID-19 Pandemic on LGBT People’s Mental Health.

Eight in ten LGBT adults say they have received at least one dose of the COVID-19 vaccine, compared to two-thirds of non-LGBT adults (82% vs 66%), according to the latest Vaccine Monitor. LGBT adults are also more likely to support vaccine mandates compared to non-LGBT adults (65% vs 50%) and believe the seriousness of the virus is underestimated (31% vs 18%) by the media. This may reflect the fact that larger shares of LGBT adults identify as Democrats, a group that has shown to be more receptive to the COVID-19 vaccine and mandates. For more information, see the full report Views of COVID-19 Vaccine Among LGBT Adults.

Designed and analyzed by public opinion researchers at KFF, the KFF Vaccine Monitor survey was conducted from July 15-27 among a nationally representative random digit dial telephone sample of 1,517 adults, including oversamples of adults who are Black (300) or Hispanic (322). This includes 95 adults who identify as LGBT, 1,403 who are not LGBT, and 19 respondents who said they didn’t know or refused to answer.  Interviews were conducted in English and Spanish by landline (176) and cell phone (1,341). The margin of sampling error is plus or minus 3 percentage points for the full sample, plus or minus 13 percentage points for LGBT adults and plus or minus 3 percentage points for the non-LGBT adults. For results based on subgroups, the margin of sampling error may be higher.

The KFF COVID-19 Vaccine Monitor is an ongoing research project tracking the public’s attitudes and experiences with COVID-19 vaccinations. Using a combination of surveys and qualitative research, this project tracks the dynamic nature of public opinion as vaccine development and distribution unfold, including vaccine confidence and acceptance, information needs, trusted messengers and messages, as well as the public’s experiences with vaccination.

The Impact of the COVID-19 Pandemic on LGBT+ People’s Mental Health

Authors: Lindsey Dawson, Matthew McGough, Ashley Kirzinger, Grace Sparks, Matthew Rae, Greg Young, and Jennifer Kates
Published: Aug 27, 2021

Findings

Key Findings

Historically, the LGBT+1  community has faced mental health and substance use problems at higher rates than their non-LGBT+ peers. The COVID-19 pandemic, which has disrupted the lives of people across the globe, has negatively impacted LGBT+ people’s mental health in disproportionate ways. In this data note, we pull together data from nationally representative surveys, adding to a small but growing evidence base on the impact of the pandemic on LGBT+ people.

  • LGBT people reported the COVID-19 pandemic negatively impacted their mental health both more widely and more severely than their non-LGBT peers. They report that their sleep, appetite, and temper were negatively impacted at higher rates than non-LGBT people. They also report that they were more likely to seek out mental health care during the pandemic than non-LGBT people, including via telemedicine.
  • A range of factors may contribute to these mental health disparities among LGBT+ people during the COVID pandemic, including different work, life, and health care experiences. LGBT+ people more commonly report quitting a job because of COVID-19, taking time off work because of becoming ill with COVID-19 or quarantining, or taking time off work to care for a family member who was sick with COVID-19 or quarantining than non-LGBT+ people. Given that LGBT+ have lower-incomes than their non-LGBT+ peers, disruptions in employment could be especially challenging for families and harmful to mental health.
  • Another factor that may drive these disparities is LGBT+ people’s higher rates of mental health and substance use problems pre-pandemic, including those related to more common experiences of stigma and discrimination compared to their non-LGBT+ peers. These underlying experiences could have made LGBT+ people more vulnerable to stress during the pandemic.
  • Despite LGBT+ people reporting accessing mental health care at higher rates than non-LGBT+ people, many still face barriers, particularly financial ones, to getting the care that they need. LGBT+ people are more likely to report they could not afford mental health care and say they face challenges with medical bills than their non-LGBT peers. Other reported roadblocks include problems getting appointments and negative provider experiences.

Taken together, these findings may help to identify and inform opportunities to address and mitigate mental health disparities among LGBT+ people. These could include adopting culturally appropriate policy solutions and approaches to engaging the community, as well as efforts to address wider, systemic factors that drive stigma and discrimination.

Introduction

Historically, the LGBT+ community has faced mental health and substance use problems at higher rates than their non-LGBT+ peers and experiences during the COVID-19 pandemic have been no exception. The pandemic has negatively impacted LGBT+ people’s mental health in disproportionate ways. Pulling together data from three nationally representative surveys in this area, we explore a range of factors related to LGBT+ people’s mental health during the pandemic including assessment of mental health, access to and affordability of mental health services, and underlying experiences of stigma, discrimination, and negative encounters with health care providers.

Data in this analysis comes from: KFF’s monthly COVID Vaccine Monitor, KFF’s Women’s Health Survey, and new KFF analysis of publicly available Survey of Household and Economics and Decisionmaking (SHED) data from the Federal Reserve.

The Impact of COVID-19 on LGBT People’s Mental Health and Care Seeking

LGBT individuals report that worry and stress related to the COVID-19 pandemic negatively impacted their mental health more often and more severely than non-LGBT people. These negative mental health impacts were especially pronounced for all people before vaccines were widely available. The KFF COVID-19 Vaccine Monitor found that in the December 2020/January 2021 period, three-quarters of LGBT people (74%) reported that worry and stress from the pandemic negatively impacted their mental health compared to half (49%) of non-LGBT people. This includes about half of LGBT people (49%) who said the coronavirus was having a “major impact” on their mental health, twice the share of non-LGBT individuals who reported the same (23%) (Figure 1).

While the share reporting negative mental health impact of the pandemic fell for both groups in July 2021, a time of widely available vaccination and partial reopening, LGBT people continue to report the pandemic has negatively impacted their mental health both more widely and more severely than non-LGBT people. In July, six in ten LGBT people reported that the pandemic negatively impacted their mental health, about half (31%) of whom say that the impact has been major. By comparison, 37% of non-LGBT people reported a negative mental health impact in this period, 17% of whom say that the impact was major (Figure 1).

LGBT People Report Worry and Stress Related to the Pandemic Has Negatively Impacted Their Mental Health at Higher Rates Than Non-LGBT People, a Disparity That Has Persisted for Months

Specifically, compared to non-LGBT people, larger shares of LGBT people say worry or stress related to the coronavirus caused them to experience difficulty with sleep (39% v. 21%), problems with their appetite (41% v. 18%), and difficulty controlling their temper (23% v. 10%) in the past two months. They report similar rates of headaches or stomachaches, worsening chronic conditions (e.g. blood pressure or diabetes), and increased alcohol or drug use. LGBT people are more likely to report that they have experienced at least one of these impacts than non-LGBT people (55% v 34%) (Figure 2).

LGBT People More Commonly Report Recent Pandemic Related Worry or Stress Has Negatively Impacted Their Sleep, Appetite, and Temper Than Non-LGBT People

A range of factors may contribute to these mental health disparities among LGBT+ people, including their different circumstances during the pandemic. For example, the 2020 KFF Women’s Health Survey found larger shares of LGBT+ people reported having to quit a job for a reason related to COVID-19 compared to non-LGBT+ individuals (15% v. 7%). Additionally, 19% of LGBT+ people report taking time off work because of personally becoming ill with COVID-19 or quarantining, compared to 11% of non-LGBT+ individuals. One in ten (10%) LGBT+ people report taking time off work to care for a family member who was sick with COVID-19 or is quarantining (v. 5% of non-LGBT people) (Figure 3). While these factors could be stressful for any individual, given that LGBT+ people tend to be lower income than their non-LGBT+ peers, disruptions in employment could be especially challenging for families and harmful to mental health.

Quitting a Job or Taking Time Off Work in Response to COVID-19 Was a More Common Experience for LGBT+ People Than Non-LGBT+ People

In addition, LGBT+ people faced higher rates of mental health and substance use problems pre-pandemic, which may be related to common experiences with stigma and discrimination. KFF analysis of 2020 Survey of Household and Economics and Decisionmaking (SHED) data reveal that 19% of LGBT+ people report experiencing discrimination or unfair treatment in the past 12 months versus 9% of non-LGBT+ people (Figure 4). These experiences with unfair treatment and discrimination were similar prior to and during the pandemic but the underlying stress associated with them could have made LGBT+ people more vulnerable to pressures related to the pandemic.

LGBT+ People Report Higher Rates of Recent Discrimination and Violence Than Their Non-LGBT+ Peers

LGBT+ people also report seeking mental health care during the pandemic more than non-LGBT+ people. One in four (25%) LGBT+ people report seeking mental health care because of the pandemic, compared to 1 in 10 (12%) non-LGBT+ people, potentially reflecting their higher reported needs in these domains (Figure 5).

1 in 4 LGBT+ People Sought Mental Health Care During the Pandemic

Additionally, LGBT+ people reported using telehealth more widely since the pandemic began than non-LGBT+ people (49% v. 34%) and among LGBT+ people who reported COVID era telehealth use, 25% say it was for mental health services, a higher share than non-LGBT+ telehealth users (14%) (Figure 6).

Of Those Who Used Telehealth During the Pandemic, LGBT+ People Were More Likely to Do So For Mental Health Services Than Non-LGBT+ People

Barriers to Mental Health Care

Even as LGBT people have a greater need for mental health care during the pandemic, and report seeking such care at higher rates, all those who require mental health services may not be receiving them. SHED data reveal that in 2020, one-in-five (19%) LGBT+ people say they could not afford mental health care or counseling during the past 12 months compared to a smaller share of non-LGBT people (5%) (Figure 7). LGBT+ people’s lower income levels and higher rates of pandemic related employment disruptions compared to non-LGBT+ peers could make accessing and affording mental health care especially difficult for this group.

LGBT+ People Face Affordability Barriers to Mental Health Care or Counseling at Higher Rates Than Non-LGBT+ people

Indeed, 30% of LGBT individuals report trouble paying medical bills in the past year, compared to 19% of non-LGBT individuals (Figure 8). Of LGBT people who had trouble paying medical bills over half (58%) attributed that trouble, at least in part, to the COVID-19 pandemic.

LGBT+ People Were More Likely to Have Difficulty Paying Medical Bills During the Pandemic Than Non-LGBT+ People

In addition to financial challenges, difficulty in obtaining appointments during the pandemic may also present a barrier. Nearly one-third (29%) of LGBT+ people said they were unable to get a health care appointment during the pandemic (not limited to mental health services), similar to the share among non-LGBT+ people (25%).

Negative provider experiences may also deter LGBT+ people from getting the care they need. Compared to non-LGBT people, LGBT+ people are more likely to report a provider has not believed they were telling the truth (16% v. 8%), suggested they were to blame for a health problem (13% v. 8%), assumed something without asking (21% v. 11%), and dismissing their concerns (29% v. 16%). Altogether, over one-third (36%) of LGBT+ people reported at least one of these negative experiences with a provider, compared to fewer than one in five (22%) non-LGBT+ people. (Figure 9)

Larger Shares of LGBT+ People Report Negative Provider Experiences Than Non-LGBT+ People

Implications

Larger shares of LGBT+ people experienced negative mental health effects from the COVID-19 pandemic than non-LGBT people. While LGBT+ people were more likely to report seeking mental health care during the pandemic, not all those who need services are obtaining them. Many report barriers to receiving care, particularly related to affordability. However, difficulty getting appointments during the pandemic may also play a role, as might negative past provider experiences. Experiences of stigma and discrimination were widespread among LGBT+ people prior to the pandemic and these underlying disparities could make weathering pandemic related stress more challenging. These findings are important both given the mental health disparities LGBT+ populations have traditionally faced and as the pandemic created new stressors disproportionately impacting the community. As such, targeted and culturally appropriate policy solutions and approaches to engaging the LGBT+ community would be beneficial. Additionally, addressing the wider, systemic factors that drive stigma and discrimination may help to mitigate these disparities.

This work was supported in part by the Elton John AIDS Foundation. We value our funders. KFF maintains full editorial control over all of its policy analysis, polling, and journalism activities.

Methodology

COVID-19 Vaccine Monitor DataMethodology and toplines can be found here for Dec. 2020/Jan. 2021 data and here for July. In addition to the detail provided in the link, the July COVID-19 Vaccine Monitor is a nationally representative random digit dial telephone sample of 1,557 adults, including 95 adults who identified as lesbian, gay, bisexual, or transgender. The margin of sampling error is plus or minus 13 percentage points for the full LGBT sample and 3 percentage points for the non-LGBT sample.

Women’s Health Survey DataMethodology and topline can be found here.

Survey of Household Economics and Decisionmaking (SHED)The Survey of Household Economics and Decisionmaking (SHED) is an annual survey of adults conducted by the Federal Reserve Board. The survey is based on the Ipsos KnowledgePanel, a nationally representative probability-based online panel. Ipsos selected respondents for KnowledgePanel based on address-based sampling (ABS). The questions asked of the panel are intended to gather information from the individual about how they make household economic decisions. All data is the most current available.  The data presented here are from the 2020 survey with the exception of the estimates of being a victim of violence which is from the 2019 survey. SHED survey finishes data collection in October and then releases the report and public use file in May of the following year. LGBT+ adults include those who self-identify as lesbian, gay, bisexual, transgender, or something else (other than straight or cisgender).

Endnotes

  1. Where possible in this analysis we use the inclusive term LGBT+. LGBT+ includes people who identify as lesbian, gay, bisexual, transgender, or another sexual orientation or gender identity aside from heterosexual or cisgender. When LGBT is used, the more limited term describes the population a particular survey reflects. ↩︎

How Have States Used Medicaid Emergency Authorities During COVID-19 and What Can We Learn?

Authors: Rachel Dolan and Madeline Guth
Published: Aug 26, 2021

In response to the COVID-19 public health emergency, states and the federal government took a range of actions in Medicaid to enhance capacity to respond to the public health and economic crises. The COVID-19 pandemic had wide ranging effects across Medicaid, impacting providers, beneficiaries, and long-term services and supports (LTSS). States were able to use Medicaid emergency authorities to address specific challenges and make necessary changes as circumstances evolved and new challenges emerged.

Although the federal public health emergency (PHE) remains in place, as vaccine rates increased and COVID-19 cases declined earlier this year, many state-level emergency declarations expired and states started to terminate some Medicaid flexibilities beginning in late Spring and early Summer of 2021. However, the Delta variant and low vaccination rates in some areas may present additional challenges. The Biden Administration has indicated it intends to extend the public health emergency until at least the end of calendar year 2021, but a continued wave of infections, hospitalizations, and deaths could lead to further extensions and continued emergency authorities in Medicaid.

This brief summarizes how states have used Medicaid emergency authorities related to the COVID-19 PHE, providing potential lessons for future public health and economic crises.

The declarations of a national disaster and a public health emergency allow for the use of a range of Medicaid emergency authorities. These authorities include Disaster-Relief state plan amendments (SPAs), Section 1135 waivers, Section 1915(c) Appendix K waivers, and Section 1115 waivers. States can also make Medicaid program changes during a PHE using existing administrative authorities and traditional SPAs. In addition, Congress enacted major federal legislation to respond to the COVID-19 emergency, including funding to support Medicaid and increase access to Medicaid coverage. The PHE began on January 27, 2020, and the most recent declaration extended the PHE through October 18, 2021, however; the Biden administration has indicated it will continue to renew the PHE through the end of 2021 and that states will receive 60 days’ notice prior to its expiration or termination.

The unprecedented nature of the COVID-19 pandemic resulted in wide adoption by states of available Medicaid emergency authorities to expand Medicaid capacity and target services, providers, and enrollees that were impacted by the coronavirus emergency. Based on our tracking between March 2020 and July 2021, all 50 states and DC received approval to make changes through Disaster-Relief state plan amendments (SPAs), Section 1135 waivers and Section 1915(c) Appendix K waivers. Additionally, twelve states received approval for changes through a Section 1115 waiver and six states made changes through regular SPAs. States adopted many policies through these existing authorities similar to previous disasters, including to connect individuals to coverage more quickly and to address needs of affected populations.

States used Medicaid emergency authorities to make changes across a number of policy areas during the COVID-19 PHE to address the effects of the emergency. We analyzed specific state actions in more detail in a series of briefs, linked below. State actions included:

  • Facilitating access to Medicaid and/or CHIP coverage. As people lost jobs and income due to the COVID-19 emergency and associated economic downturn, a growing number became eligible for Medicaid. To make it easier for individuals to enroll, states made changes to expand eligibility and/or modify eligibility rules, eliminate or waive premiums, and streamline application and enrollment processes. Federal legislation also created a new optional Medicaid eligibility pathway available to all states, with 100% federal matching funds, for states to cover coronavirus testing and testing-related services for uninsured individuals. However, only about a third of states adopted this eligibility group and some states rescinded the policy later after adoption.
  • Expanding LTSS eligibility and benefits. The COVID-19 pandemic had a disproportionate impact on nursing homes, congregate settings, and other LTSS providers and services. In response, states expanded eligibility criteria for seniors and people with disabilities, reduced premium and/or cost-sharing requirements for these populations, and provided new LTSS benefits to meet enrollee needs during the emergency.
  • Supporting providers across service type and authority, most commonly by increasing payment rates and making retainer payments.The coronavirus pandemic resulted in financial strain for Medicaid providers. Forty-one states increased provider payment rates for state plan services through Disaster-Relief SPA or other administrative authority, 40 states did so for home and community-based services (HCBS) waiver services specifically using Appendix K, and two states received approval for Section 1115 waivers that increased payment rates for HCBS.
  • Increasing beneficiary access to medications. Medicaid beneficiaries with chronic conditions faced barriers to obtaining needed medications during social distancing and stay-at-home orders. To allow beneficiaries to have more of their medication on hand and reduce the barriers to receiving medication, states relaxed restrictions on quantity limits, allowed early refills, suspended prior authorization requirements and increased the availability of mail delivery.
  • Increasing access to telehealth. To increase health care accessibility and limit risk of viral exposure, states took steps to expand coverage and access to services delivered via telehealth. For example, states newly allowed certain services to be delivered via telehealth and established payment parity for these services as compared to face-to-face services. States also broadened the provider types that may provide services via telehealth, including by adding new providers and waiving licensing requirements.

Use of Medicaid emergency Section 1115 authority differed from previous emergencies. Historically, states have used Section 1115 authority to expand coverage and/or provide uncompensated care to address the direct impact of natural disasters and public health emergencies (like New York City after 9/11Hurricane Katrina, and Flint Michigan) on state Medicaid and Children’s Health Insurance Program (CHIP) programs. In response to the COVID-19 PHE, however, CMS targeted the emergency Section 1115 waiver demonstration opportunity to HCBS flexibilities. While states initially submitted Section 1115 waivers with a broader approach, CMS approved few waivers and mostly limited the scope to authorities in the application template.

Medicaid emergency authorities related to the PHE expire at different times, but states can choose to continue some of these changes even after the PHE ends (Table 1). The PHE ends when the Secretary declares that the emergency no longer exists, or after 90 days from the last PHE extension, whichever happens first. As noted above, the Biden Administration has indicated the PHE will last at least through 2021.  Policy changes such as streamlining eligibility and enrollment, adding benefits and increasing provider rates that were made through Disaster-Relief SPAs can be continued after the emergency through regular SPA authority. Similarly, states may submit 1915(c) waiver amendment requests to continue some Appendix K options (such as expanded telehealth, new services, and increased ability to pay family caregivers) after the PHE. States may also submit Section 1115 requests to continue some emergency flexibilities.

Table 1: Medicaid Emergency Authorities

Lessons learned from Medicaid’s response to the COVID-19 PHE can inform continued pandemic response and recovery as well as future emergencies.  To facilitate states’ adoption of emergency authorities during the COVID-19 PHE, the federal government issued templates, guidance documents and held state calls to communicate with states. These weekly state calls helped to provide timely guidance and to answer emerging questions as the federal government and states were moving quickly to implement new legislative provisions as well as emergency authorities designed to facilitate enrollment, access to care and reimbursement for providers.  Preprint templates allowed states to quickly apply for and adopt flexibilities specifically addressed to COVID-19 challenges, especially given that states faced staffing shortages due to social distancing and illness. Once adopted, states and the federal government communicated with providers and enrollees to inform those impacted by the policy changes and to ensure that additional resources were utilized. Policy flexibilities during the COVID-19 PHE strengthened Medicaid’s ability to serve as a safety net during the pandemic and economic downturn by providing coverage to individuals who lost their jobs and supporting providers who experienced reduced income. The Biden Administration has indicated a continued focus on Medicaid as a key part of the social safety net during the COVID-19 recovery and beyond, including increasing support for HCBS services and increasing adoption of the Medicaid expansion. Going forward, understanding how the process of adopting and implementing changes during the pandemic worked and what could be improved will be important in continuing to respond to the current emergency and the Delta variant as well as future emergencies.

Looking ahead, some states had begun to unwind emergency authorities and were planning for a return to normal operations; however, they may face challenges due to rising cases as a result of the Delta variant and low vaccination rates in some areas. The Biden Administration recently updated previous guidance to states on the end of the PHE on transitioning to normal operations, allowing additional time for states to complete renewals and redeterminations once the PHE ends. States began to roll back emergency authorities and plan for normal operations beginning in late Spring and early Summer of 2021 as vaccination levels increased and cases declined. More recently, however, states are again seeing increased cases due to the Delta variant. States with areas of low vaccination rates in particular may face challenges and disruptions similar to those experienced earlier in the pandemic. If states have terminated emergency Medicaid flexibilities that increased access to coverage and care, they may have reduced ability to address the effects of the Delta variant on providers and individuals. Increased case levels due to coronavirus variants may result in the Biden Administration continuing to extend the PHE into 2022, which would also have implications for maintenance of effort requirements for states, further extending the time which they must provide continuous Medicaid coverage and keeping many emergency authorities in place longer.

News Release

New Campaign from THE CONVERSATION / LA CONVERSACIÓN about Kids and the COVID Vaccines

Pediatricians Featured in Latest Installment of KFF’s Public Information Response to COVID-19, Presented with the American Academy of Pediatrics

Published: Aug 25, 2021

August 25, 2021 – THE CONVERSATION / LA CONVERSACIÓN expands to address questions about the COVID-19 vaccines and children with new FAQ videos featuring pediatricians. This installment of the campaign is produced by KFF (Kaiser Family Foundation) under its Greater Than COVID public information response and is presented with the American Academy of Pediatrics (AAP).

Vaccine safety, efficacy and potential side effects, as well as the need for vaccinations among children, are among issues highlighted in the new FAQ video series, which addresses both the currently available COVID vaccine for 12 and older as well as status of vaccines for younger children. Comedian and parent, W. Kamau Bell appears in an anchor video in conversation with pediatricians about some of the most common questions asked by parents and caregivers in KFF research.

Children 12 and older are currently eligible to get the COVID vaccine. Clinical trials with children under 12 are underway with authorization expected to come later this fall. With the Delta variant resulting in increasing COVID cases among children, along with adults, and rising hospitalizations among those unvaccinated, there is growing urgency to get children vaccinated when eligible.

“As a pediatrician, I am very concerned about the rapid increase in children who are being infected and hospitalized with COVID due to the Delta variant,” said AAP President, Lee Savio Beers, MD, FAAP. “Vaccination is the best way to protect children 12 and older. And for those children who are not yet eligible to be vaccinated, families can protect them by getting vaccinated themselves. This is part of a layered approach that includes hand washing, physical distancing and wearing masks as kids return to school.”

According to a data analysis by the AAP, as of August 19, nearly 4.6 million children have tested positive for COVID-19 since the onset of the pandemic. Over 180,000 cases were added from the week prior, a continuing substantial increase. After declining in early summer, child cases have steadily increased since the beginning of July.

“The surge in COVID cases as children return to school has many parents anxious about how best to protect their families. Parents trust pediatricians more than everyone else when it comes to information on vaccinating their kids. This campaign provides resources that build on that trust,” said KFF President and CEO Drew Altman.

According to recent findings from the KFF COVID Vaccine Monitor, pediatricians are the top trusted source of information on COVID-19 for parents. Among parents of teens who discussed the vaccine with their pediatrician, most say the doctor recommended their child get vaccinated, and three-quarters of those whose pediatrician recommended vaccination say their child has received at least one shot.

“Children across the country are returning to in-person learning at a time when the dominant strain of COVID is more contagious than ever. So many parents and caregivers are rightfully concerned about how to protect their kids,” said Rhea Boyd, MD, MPH, pediatrician and public health advocate, who co-developed THE CONVERSATION / LA CONVERSACIÓN with KFF and appears in the current messaging about kids and the COVID vaccines. “In this video series, parents and caregivers can hear directly from us, pediatricians who know the science and can share the information they need to feel comfortable getting their kids vaccinated when eligible.”

“I’ve been working with pediatric vaccines my whole career, including in pediatric COVID-19 vaccine trials here at Stanford Medicine. There is no doubt in my mind that we absolutely need vaccines for children. We know that vaccines are the most effective public health intervention to keep all populations safe and healthy,” says Yvonne “Bonnie” Maldonado, MD, Stanford Medicine Epidemiologist and Pediatric Infectious Disease Specialist, who appears in the campaign.

THE CONVERSATION / LA CONVERSACIÓN offers an expansive, living video library featuring doctors, nurses, researchers and community health workers dispelling myths and providing credible facts about the COVID-19 vaccines. The campaign debuted in March with an initial series focused on Black communities presented with the Black Coalition Against COVID. Additional content was added in May for Latinx and Spanish-speaking communities with UnidosUS. To date, the videos have been viewed more than 82.7 million times on digital and social media.

All content is available rights-free and designed to be shared on social media and can be easily embedded on websites. A community toolkit provides additional graphics and promotions to extend reach of the messaging.

The California Health Care Foundation, California Community Foundation, California Endowment, Commonwealth Fund, Sierra Health Foundation and Walgreens have provided funding in support of THE CONVERSATION / LA CONVERSACIÓN campaign. YouTube, Google, Facebook, Twitter and Pinterest are promoting the messaging on their platforms as part of efforts to amplify trusted voices on COVID-19.

For more information about THE CONVERSATION / LA CONVERSACIÓN go to:

www.BetweenUsAboutUs.org l www.EntreNosotrosSobreNosotros.org

www.youtube.com/GreaterThanCOVID

The American Academy of Pediatrics is an organization of 67,000 primary care pediatricians, pediatric medical subspecialists and pediatric surgical specialists dedicated to the optimal health and well-being for all infants, children, adolescents and young adults. For more information, visit www.aap.org.

KFF (Kaiser Family Foundation) is a national nonprofit leader in health policy analysis and polling, journalism and social impact media. No affiliation with Kaiser Permanente. Visit the COVID-19 Vaccine Monitor Dashboard, Racial Equity and Health topic page and KHN.

Greater Than COVID is a public information initiative from KFF to help individuals take charge of their health during the evolving COVID-19 public health crisis. Tailored media messages and community tools address information needs about the vaccines.

News Release

KFF’s Kaiser Health News and Science Friday Examine Rising Suicide Rates among People of Color in Initial Collaboration

Published: Aug 20, 2021

Continuing its expansion into audio storytelling, KFF’s Kaiser Health News examines the rising suicide rates among Black, Hispanic and other communities of color in its first collaboration with Science Friday, the award-winning producer of high-quality, trustworthy science news and educational programming.

The storytelling highlights tragic cases like that of 19-year-old Jamal Clay, who killed himself in his family’s garage in May 2020. Rafiah Maxie, Clay’s mom and herself a social worker, recounts her difficulties in getting her son the mental-health care he needed and her efforts since his death to help others affected by violence, suicide and trauma in her community outside Chicago.

Reported by KHN correspondent Aneri Pattani, the package includes Pattani’s digital story, and a radio segment airing today with longtime SciFri guest host John Dankosky and voices of families and experts. In their conversation, Dankosky and Pattani discuss socioeconomic factors linked to suicide risk and the community-level fixes that might reverse its rise among people of color in the U.S.

KHN’s initial collaboration with Science Friday builds on a strong tradition of audio journalism — including KHN’s longtime partnership with NPR and dozens of its member stations to report on health and health policy issues from across the country, and the crowdsourced investigative series with NPR and CBS, “Bill of the Month.”

KHN’s family of podcasts includes What the Health?, An Arm and a Leg and Where It Hurts, a co-production with St. Louis Public Radio. In other recent audio collaborations, KHN has partnered with This American Life and Reveal from the Center for Investigative Reporting.

Read the story and listen to radio segment.

About KFF and KHN

KHN (Kaiser Health News) is a national newsroom that produces in-depth journalism about health issues. Together with Policy Analysis and Polling, KHN is one of the three major operating programs at KFF (Kaiser Family Foundation). KFF is an endowed nonprofit organization providing information on health issues to the nation.

About Science Friday

The Science Friday Initiative, a nonprofit, is dedicated to increasing the public’s access to science and scientific information. WNYC Studios distributes the radio show, which airs on over 400 public radio stations across the U.S. The initiative produces a sweeping array of educational and entertaining science experiences including videos, podcasts and live events that serve hundreds of thousands of lifelong learners every year.