Housing Affordability, Adequacy, and Access to the Internet in Homes of Medicaid Enrollees

Author: Bradley Corallo
Published: Sep 22, 2021

Issue Brief

Executive Summary

The COVID-19 pandemic and the ensuing economic disruption have drawn more attention to longstanding issues related to housing and internet access and how these issues can impact health. As the primary source of health insurance for low-income populations, Medicaid covers a considerable share of people living in homes that are unaffordable, inadequate, or have limited access to the internet. This brief examines housing adequacy, affordability, and internet access within the homes of Medicaid enrollees using data from the 2019 American Community Survey (prior to the COVID-19 pandemic) and assesses the limited role that Medicaid can play in helping to address these challenges. Key findings include the following:

  • Prior to the pandemic, in 2019, the majority (57%) of Medicaid enrollees lived in a home that was inadequate (defined as lacking complete plumbing or kitchen facilities or being overcrowded) or unaffordable (defined as costing more than 30% of household income), representing more than one-third (36%) of all individuals in such homes nationally.
  • We estimate that 13% of Medicaid enrollees did not have internet access in their home prior to the pandemic, either through a computer or cell phone, and an additional 13% have internet but with limited computer access in their homes (i.e., a smartphone was the only computer device in the home or no computer device).
  • The likelihood of Medicaid enrollees living in inadequate or unaffordable homes were especially high for Native Hawaiian/Other Pacific Islander enrollees (70%) and Hispanic enrollees (67%), as well as enrollees ages 18 and under (63%) and enrollees in metro areas (59%). Limited internet and computer access was highest among American Indian/Alaska Native enrollees (43%), enrollees ages 65 and older (41%), and enrollees in non-metro areas (31%).
  • Housing problems can negatively impact health, but Medicaid plays a narrow role in addressing these impacts. Medicaid has traditionally been able to cover certain non-clinical services (including housing-supports) through home and community-based services (HCBS) programs that support seniors and people with disabilities. Beyond HCBS programs, states have limited ways to leverage Medicaid for supporting access to some housing supports, though Medicaid generally cannot pay the direct costs of non-medical services like rent and food.

While housing insecurity and other “social determinants” can affect health, policies and programs outside of Medicaid – and the health care sector generally – have the greatest impact on housing issues among the broader Medicaid population. Recent legislation has created or extended funding for several federal housing programs, which likely helped to stabilize housing for many people during the pandemic. Additionally. one of the key priorities in the proposed infrastructure bill, the Infrastructure Investment and Jobs Act, would address some issues related to broadband access in rural and low-income communities if signed into law. The Centers for Disease Control and Prevention also implemented a temporary eviction moratorium that likely contributed to greater housing stability for people behind on rent; however, the Supreme Court ended the moratorium in August 2021, requiring that Congress authorize the moratorium to continue.

Why is housing important for health and the COVID-19 pandemic?

Housing can impact health in several ways. For example, housing adequacy may have a direct link to health through its effect on access to clean water, ability to store food or medications, prepare healthy meals, or maintain personal hygiene. Problems with housing affordability (typically defined as spending more than 30% of household income on housing) can lead to housing instability, overcrowding, and potentially homelessness, all of which have been associated with a range of physical and mental conditions. The causes of housing adequacy and affordability issues are extremely complex vary greatly by locality, with differences often reflecting state and local policy decisions, local economic conditions, availability of federal housing assistance, and historical and ongoing practices of housing discrimination.

Households with lower incomes generally have higher rates of living in unaffordable housing and having serious housing deficiencies or limited internet access. As the primary source of health insurance coverage for low-income populations, Medicaid covers many enrollees who are likely experiencing housing issues such as these. While Medicaid has traditionally been able to cover certain non-clinical services (including housing-supports) through home and community-based services (HCBS) programs that support seniors and people with disabilities, Medicaid generally cannot pay the direct costs of non-medical services like housing and food. However, there are more narrow ways in which Medicaid can be leveraged to help support access to some housing supports. Other programs outside of Medicaid – and the health care sector – are designed to address housing issues for low-income populations. At the federal level, for example, programs such as the Low-Income Housing Tax Credit Program, Housing Choice (Section 8) Voucher Program, and public housing are designed to improve access to affordable housing, although these programs have historically faced a range of unique challenges, including underfunding, long wait lists to receive benefits, and challenges locating housing units in desirable neighborhoods.

The COVID-19 pandemic has drawn more attention to housing issues related to affordability, quality, and internet access at home. For example, data from the Census Bureau’s Household Pulse Survey estimate that, between September 1 and September 13, 2021 (the latest data available), 14.6 million adults lived in households that were behind on rent or mortgage payments, and 4.5 million of these adults reported that they were “very likely” or “somewhat likely” to be evicted or experience foreclosure in the next two months. Moreover, as people spend more time in and around their homes during the pandemic, living in safe, adequate housing with complete amenities has also become increasingly important for personal health and social distancing. For example, living in a crowded household can potentially increase transmission of the coronavirus to other member of the household and limit their ability to effectively quarantine. Similarly, having internet access in the home has become a common way to receive health care and attend school, as well as to work from home where possible, while following social distancing guidelines during much of the pandemic.

What do the data say about housing affordability, adequacy, and access to internet for Medicaid enrollees prior to the pandemic?

In this brief, we follow the definitions for incomplete plumbing facilities, incomplete kitchen facilities, overcrowding, and unaffordable housing as defined by the U.S. Census Bureau’s ACS 2019 Subject Definitions. Notably, this brief’s definition of “inadequate housing” (defined below) differs from the U.S. Department of Housing and Urban Development’s (HUD’s) definition captured through the American Housing Survey (AHS). We did not use AHS data because the survey does not capture health insurance information for respondents.

Inadequate housing is either (1) a housing unit lacking complete plumbing and/or kitchen facilities as reported in the ACS or (2) “overcrowded” housing units. In the ACS, complete plumbing and kitchen facilities include hot and cold running water, a shower or bathtub, a sink with a faucet, a stovetop or range, and a refrigerator. Overcrowded housing units are those with more than 1 occupant per room (not counting bathrooms, porches, balconies, hallways, or unfinished basements, etc.).

Unaffordable housing is defined as paying more than 30% of household income on either (1) gross rent (contract rent plus most utilities) or (2) owner costs (mortgage payments, most utilities, real estate taxes, some insurance coverage, condominium fees, deeds of trust, and contracts to purchase). Housing units with zero or negative income are considered to live in unaffordable housing, while housing units who do not pay cash rent are assumed to live in affordable housing.

Internet access includes individuals living in homes that receive internet services through internet service providers or through a cell phone company, whether or not the household pays for internet services.

Limited computer access includes individuals living in homes that either (1) do not have a computer or (2) the only means to access the internet is with a smartphone (versus having a desktop, laptop, tablet, or another computer device available in the home, sometimes called “smartphone dependent”). We only report limited computer access for housing units with internet.

Even before the pandemic, the majority of Medicaid enrollees (57%) lived in inadequate or unaffordable housing, greatly exceeding the rate of the U.S. population overall (31%). In 2019, prior to the pandemic, nearly half (47%) of Medicaid enrollees lived in housing that was unaffordable, and 17% lived in crowded housing, both of which exceeded the national average (26% and 7%, respectively). Few Medicaid enrollees (1%) live in homes with incomplete plumbing or kitchen facilities, similar to the national average. Roughly one in 13 (8%) Medicaid enrollees live in a home that has two or all three of these conditions, exceeding the national rate of 3%. Overall, there are roughly 99 million people that live in inadequate or unaffordable housing across the U.S., and more than one-third (36% or 36 million) are enrolled in Medicaid. Although these data show national rates, other research shows that the share of people living in unaffordable housing varies greatly across localities.

The Majority of Medicaid Enrollees Live in Inadequate or Unaffordable Housing

The share of Medicaid enrollees living in homes that are inadequate or unaffordable varied across race/ethnicity in 2019. For example, seven in ten (70%) Native Hawaiian/Other Pacific Islander (NHOPI) enrollees live in a home with at least one of the selected housing conditions for inadequate or unaffordable housing, and two in ten (20%) live in homes with two or all three of the selected housing conditions. Additionally, American Indian and Alaska Native (AIAN) enrollees have the highest rates of incomplete plumbing or kitchen facilities, and AIAN enrollees were among the only demographic group we examined to exceed 2% on this measure. Generally, the shares of people of color enrolled in Medicaid exceeded the rates among White enrollees living in overcrowded and unaffordable housing.

Among different age groups, children enrolled in Medicaid (or CHIP) were the most likely to live in inadequate or unaffordable housing (63%). This pattern may reflect having multiple children (relative to the number of adults) within an inadequate or unaffordable housing unit. Enrollees in metro areas also experienced higher rates of inadequate or unaffordable housing compared to enrollees in non-metro areas, and the difference was especially large for unaffordable housing (49% vs. 38%). When looking at sex, although the differences were statistically significant at the p < .05 level (Appendix Table 1), rates of unaffordable housing were generally similar for males and females across all measures. For example, 56% of male enrollees and 58% of female enrollees lived in a home with any condition related to inadequate or affordable housing.

Percent of the U.S. Population and Medicaid Enrollees Living in Homes with Selected Housing Conditions by Race/Ethnicity, 2019

In 2019, roughly one in four Medicaid enrollees lived in a home without internet or with limited computer access. An estimated 13% of Medicaid enrollees have no internet access in their home, either through a computer or a cell phone. A similar share (13%) of Medicaid enrollees have internet access, but they either lack any type of computer device (1%) or the only computer in the home is a smartphone (12%), limiting the amount of tasks and activities that can be completed online. Previous KFF research showed Medicaid enrollees made up 32% of people across the U.S. without internet access in their home. When considering internet access in conjunction with limited computer access, Medicaid enrollees make up a slightly larger share. Of the 47 million individuals living in homes without internet or with limited computer access, 16 million (34%) are enrolled in Medicaid.

One in four Medicaid Enrollees Lives in a Home with Limited Internet or Computer Access.

Leading up to the pandemic, internet access and the availability of computers in the homes of Medicaid enrollees varies by race/ethnicity, age, sex, and metro/non-metro areas in 2019. More than four in ten (43%) AIAN enrollees had limited internet or computer access, including 27% who had no internet access in their homes. Black people also had among the highest rates of limited internet or computer access (34%), including 16% with no internet access in their homes. Enrollees who are ages 65 and older also had high rates, with 41% facing internet or computer limitations, with nearly one-third (30%) lacking internet in their homes. Non-metro areas also had high rates of internet or computer limitations (31%), with 17% of enrollees lacking access to the internet in their homes. Conversely, there was little difference between male and female enrollees, with 25% and 26% of enrollees reporting limited internet or computer access, respectively, although differences were statistically significant at the p < .05 level (Appendix Table 2).

The Share of Medicaid Enrollees Living in a Home with Internet and Computer Access by Selected Demographic Characteristics, 2019

What are the policy levers for Medicaid to address housing challenges?

State Medicaid programs can add certain non-clinical services, including housing supports, into home and community-based services (HCBS) programs to support seniors and people with disabilities. CMS released guidance in January 2021 to highlight opportunities to address SDOH in Medicaid and CHIP. That guidance specified that federal Medicaid matching funds are available for certain housing-related services and supports that promote health and community integration. These services are generally available for children with special health care needs, adults with disabilities, or seniors. Housing-related services in HCBS programs might include: home accessibility modifications (such as wheelchair ramps or grab bars in the shower); one-time community transition costs (such as payment of a security deposit, utility activation fees, and essential household furnishings); and housing and tenancy supports (such as help with a housing search, identifying adequacy of public transit, and assisting in arranging for and supporting move-in); and tenancy sustaining services (education or training on the role, rights, and responsibilities of the tenant and landlord).

Beyond HCBS authorities, Medicaid has limited ability to address housing related challenges for most enrollees. Primarily, Medicaid can help to finance many health and behavioral health services that can be critical in helping people obtain and maintain housing. Medicaid can play an important role in coordinating medical and non-medical services and act as a bridge to social services (e.g., case management). States can also require managed care organizations to screen for and provide referrals for social services. States and plans can also build partnerships across sectors to meet basic needs for enrollees – including building linkages with supportive housing programs. Plans may also have additional flexibilities to provide certain non-medical services outside of contractually-covered services (through what are known as “in-lieu-of” and “value-added” services), although state Medicaid agencies must approve which services can be counted toward the capitation rate paid to the plans. While there are examples of health plans and provider systems investing in affordable housing programs (e.g., community investment or reinvestment requirements), these programs are often hard to scale or replicate broadly given issues with housing costs and supply. Further, screening and referral may not help to address housing challenges for Medicaid enrollees. While Medicaid is an entitlement, affordable housing/rental assistance programs are generally capped and not available to all who qualify and need assistance.

Some states have used or are seeking approval to use Medicaid waivers to address housing issues for high need populations. For example, in October 2018, CMS approved North Carolina’s Section 1115 waiver which provides financing for a new pilot program, called “Healthy Opportunities Pilots,” to cover non-medical services that may include housing modifications (such as carpet replacement and air conditioner repair to improve a child’s uncontrolled asthma control). To be eligible, enrollees must have at least one physical or behavioral health risk factor and at least one social risk factor (including homelessness or housing insecurity). Pilot services in North Carolina are expected to begin in the Spring of 2022.

Arizona is currently requesting Section 1115 waiver approval to enhance and expand housing services and supports for enrollees who are homeless or at risk of becoming homeless and also have another high-risk condition. Services could include short-term, transitional housing (up to 18 months) for individuals leaving homelessness or institutional settings; community transitional services to provide financial assistance for non-recurring move-in expenses to assist members in obtaining housing; eviction prevention services, which may include payment of back rent, utility bills; home modification services or pre-tenancy and tenancy support services. The waiver application is still pending but, if approved, will be authorized in the fall of 2021.

In 2016, California began its “Whole Person Care” (WPC) pilot program authorized under Section 1115 waiver authority. This program operates in certain counties and targets high-risk, high-utilizing populations including individuals experiencing or at risk of homelessness. Common services offered by WPC pilots include housing-related services such as housing navigation, tenancy support, and landlord incentives. In June 2021, California requested CMS approval to sunset Section 1115 authority for the WPC pilot program, indicating plans to instead expand the WPC approach statewide via the state’s managed care delivery system (with the introduction of enhanced care management statewide and a new menu of state-approved in-lieu-of services). This Section 1115 request also included federal funding to support capacity building for this expanded initiative, called “California Advancing and Innovating Medi-Cal” (CalAIM). California intends to implement CalAIM in January 2022.

In addition to stable and adequate housing, lack of internet and computers have implications to receive Medicaid services via telehealth. Prior to the pandemic, state coverage of telehealth in Medicaid varied widely. States took many factors into consideration when establishing temporary policies during the pandemic to increase telehealth coverage and access, including budget limitations, patient and provider acceptance, scope of practice laws, operational/technology challenges and costs for providers and patients, evidence of quality and effectiveness for services delivered via telehealth, and concerns involving potential for fraud and abuse, among others. Although state coverage of telehealth in Medicaid still varies widely, many states vastly expanded the use of telehealth in response to the COVID-19 crisis. However, telehealth requires technology and internet access that is a challenge for many Medicaid enrollees. While state Medicaid programs can expand the use of telehealth, Medicaid funds cannot address broader issues of internet and computer access.

Looking Ahead

A growing body of literature shows that improving housing quality, affordability, and internet access is fundamental step to improving individual and population health. As the primary source of health insurance for low-income Americans, Medicaid covers a considerable share of people living in homes that are inadequate, unaffordable, or have limited access to the internet. Although Medicaid has a limited role in helping to address these issues for the broader Medicaid population, states have some existing policy levers and can use partnerships to provide some access to housing services and supports for narrow subsets of enrollees.

In response to the pandemic, the federal government has taken several steps to stabilize housing for low-income households during the pandemic. For example, The American Rescue Plan Act created or increased funding for several federal housing programs, including an increase in funding for the Emergency Rental Assistance (ERA) program to over $45 billion, which is a program administered through the states to help renters pay late rent and utilities. It is unclear whether ERA funds will be enough to cover low-income renters’ late rent and utilities, as estimates of need vary widely. Additionally, data from the Census Bureau’s Household Pulse Survey estimate that only 2.8 million of the 8.2 million adults behind on rent had applied for rental assistance through the state or local government, and the majority were still awaiting a response (1.4 million) or were denied (900,000) as of late August. The  current infrastructure proposal being debated in Congress also contains provisions to expand broadband internet access for rural and low-income communities, as well as funds for digital literacy training so that individuals can use the internet effectively for daily tasks. Moreover, the proposed infrastructure bill includes increased funding for replacing lead service lines, in additional to other steps, to improve access to safe drinking water. Earlier in the pandemic, the Centers for Disease Control and Prevention (CDC) issued a temporary eviction moratorium that prevented landlords from evicting tenants due to unpaid rent (although it did not stop rent, fees, penalties, or interest from accruing). However, the Supreme Court ended the eviction moratorium in August 2021, before it was set to expire, requiring that Congress authorize the moratorium to continue. Housing and internet issues pose major challenges to Medicaid enrollees and low-income populations generally – and these issues generally worsened during the pandemic. The breadth and scope of federal housing programs and supports will ultimately have implications for Medicaid enrollees’ home lives and associated health risks during the pandemic.

Methods

This brief analyzes data from the 2019 American Community Survey (ACS) 1-year file. The unit of analysis in this brief is the individual, rather than households or the housing unit, and we use the person weights in the ACS data file. Household characteristics, such as household income, housing costs, and internet access, are the same for all members of the household. However, individual characteristics, such race, age, and sex, are reported differently for each member of the household. For example, children and adults in the household may be reported separately in our findings, as well as individuals in a household comprised of people identifying with different race/ethnicities or sexes. Our findings will differ from other studies where the unit of analysis is the housing unit, which often report demographics based on the householder (rather than individuals in the house) and use housing unit weights in the ACS data file. All differences between Medicaid enrollees that are mentioned in the brief are significant at the p < .05 level, which are also shown in appendix tables.

Our analysis excluded people living in noninstitutional group quarters such as college dormitories and residential treatment centers because the ACS does not collect data on plumbing, kitchen facilities, or internet access for in these housing units. Notably, however, our analysis included both renters and owners.

As noted in the definitions box in the brief, the definitions for incomplete plumbing facilities, incomplete kitchen facilities, overcrowding, and unaffordable housing are defined by the U.S. Census Bureau’s ACS 2019 Subject Definitions. For unaffordable housing, we assumed that people with zero or negative income lived in unaffordable housing, and those who do not pay cash rent (but have positive household income) are assumed to live in affordable housing.

Metro and non-metro classifications are not part of the ACS microdata files. Metro and non-metro areas are defined by the USDA Economic Research Service. For this analysis, metro areas were defined as public use microdata areas (PUMAs) where more than 50% of the 2010 population lived in metro areas, and the remaining PUMAs were defined as non-metro areas. We received a crosswalk of metro/non-metro populations for each PUMA from a personal communication with USDA staff (June 17, 2021), which we joined with the ACS data. Our analysis used the same methods described further in a another Peterson-KFF Health System Tracker brief.

Appendix

Appendix Table 1: Percent of Medicaid Enrollees Living in Homes with Selected Housing Conditions by Race/Ethnicity, Age, Sex, and Metro/Non-Metro Status, 2019
Appendix Table 2: Percent of Medicaid Enrollees with No Internet or Limited Computer Access in their Home by Race/Ethnicity, Age, Sex, and Metro/Non-Metro Status, 2019

Tracking U.S. COVID-19 Vaccine Donations

Published: Sep 22, 2021

For the latest data on U.S. COVID-19 vaccine donations visit our tracker.

There remains a significant gap in vaccine access across the world, with only 2% of the population in low-income countries (LICs) receiving at least one vaccine dose, compared to 30% in lower-middle-income countries (LMICs), 54% in upper-middle-income countries (UMICs), and nearly two-thirds in high-income countries (HICs). One way to address this gap is for countries that have vaccines to donate them to countries in need, either via the multilateral COVAX mechanism or directly to countries and/or regions via bilateral donations. For its part, the U.S. government has pledged to donate at least 1.1 billion doses of COVID-19 vaccine for global use by 2022 and has been delivering doses to countries around the world since June.1  To understand more about these donated doses and where they have been directed, we analyzed data from the U.S. State Department, COVAX, and other sources. We find that, as of September 20, 2021:

  • The U.S. has donated approximately 140 million doses2  to at least 93 countries (see Table 1 and Figure 1). The ten countries receiving the most doses include: Pakistan (15.8 million), Bangladesh (6.5 million), Philippines (6.4 million), Colombia (6.0 million), South Africa (5.7 million), Vietnam (5.0 million), Indonesia (4.5 million), Guatemala (4.5 million), Uzbekistan (4.2 million), and Nigeria (4.0 million).
Recipients of U.S. COVID-19 Vaccine Donation Deliveries by Total Doses Received
  • Looking by country income, more than half of U.S. doses have been donated to LMICs (see Figure 2). Of the 140 million doses delivered to date, approximately 77 million (55%) have been provided to LMICs, followed by UMICs (36 million, 26%), LICs (10 million, 7%), and HICs (5 million, 4%). When standardized by population, LMICs still account for the largest amount received (24.9 thousand doses per million population), while UMICs and LICs have received smaller amounts (13.5 thousand and 13.3 thousand doses per million population), and HICs receiving the smallest amount with 4.4 thousand doses per million population.
Total Doses Received of U.S. COVID-19 Vaccine Donation Deliveries by Income
  • Countries in the Western Hemisphere have received the most U.S. doses (both in total and when standardized by population size; see Figure 3). Forty million doses (28%) have been provided to countries in the Western Hemisphere, followed by South and Central Asia (35 million, 25%), Sub-Saharan Africa (29 million, 21%), East Asia and the Pacific (29 million, 20%), Middle East and North Africa (4 million, 3%), and Europe and Eurasia (4 million, 3%). When standardized based on population size, the number of doses received by countries in the Western Hemisphere (50.1 thousand per million) is more than double the next largest region (Sub-Saharan Africa; 22.7 thousand doses per million population).
Total Doses Received of U.S. COVID-19 Vaccine Donation Deliveries by Region
  • The Moderna vaccine accounts for the largest share of U.S. donated doses (see Figure 4). Of the 140 million doses provided to date, 42% are Moderna, followed by Pfizer (25%), and Johnson & Johnson (19%).
U.S. COVID-19 Vaccine Donation Doses Delivered by Vaccine Product
  • The majority of U.S. donated doses have been provided through COVAX (see Figure 5). Approximately 53% of doses (74.7 million) have been provided through COVAX with 38% (54.0 million doses) provided directly to the recipient country.
U.S. COVID-19 Vaccine Donation Doses Delivered by Delivery Mechanism
  • The bulk of U.S. COVID-19 vaccine donations occurred in July 2021. By number of deliveries, most occurred in July (64 deliveries or 50%), followed by August (36 deliveries, 28%), June (7 deliveries, 6%), and through September 20 (17 deliveries, 13%). By number of doses delivered, most doses were still delivered in July (82.4 million doses, or 59%), followed by August (17.6 million doses, 13%), through September 20 (14.4 million doses, 10%), and June (12.3 million doses, 9%).

President Biden has said the U.S. will be the “arsenal of vaccines” for the globe, and the 140 million doses donated by the U.S. to date represent one component of the U.S. effort to expand access to Covid-19 vaccines. While the doses provided so far make the U.S. the single largest donor of vaccines worldwide, these donations remain a fraction of what the U.S. has promised to provide by the end of this year and into next and are far from sufficient to meet global needs. Continued monitoring of U.S. donations will help gauge progress toward meeting its global vaccination goals.

Table 1: U.S. COVID-19 Vaccine Donation Deliveries by Recipient Country
  1. The U.S. announced in June that it would donate 500 million doses of the Pfizer vaccine, and announced an additional 500 million dose donation of Pfizer vaccine in September; the U.S. plans to supply these Pfizer doses via COVAX. An additional number of Moderna and Johnson & Johnson vaccine doses are part of the 1.1. billion total pledge. The U.S. has stated that all of these doses are to be donated in 2021 and 2022. ↩︎
  2. While the U.S. reports that it had shipped over 160 million doses as of September 21, it also reports that it has delivered approximately 140 million doses to country recipients. ↩︎

Tracking Global COVID-19 Vaccine Equity: An Update

Published: Sep 22, 2021

Prompted by the global COVID-19 Summit, called on by President Biden on September 22 held in conjunction with the United Nations General Assembly (UNGA), we provide updated estimates of global COVID-19 vaccine access and equity (our prior analysis from July is here). We examine access by country income level and region, and also estimate progress toward global vaccination goals. These goals include reaching 40% vaccination coverage in all countries by the end of 2021 and 70% by mid-2022, called for by the World Health Organization and others.1  In addition, President Biden has called for reaching 70% fully vaccinated in all countries by fall 2022, ahead of next year’s UNGA meeting. For this analysis, we estimate the share of population within each grouping (income and region) expected to receive at least one dose against these targets in order to provide a best-case scenario (since reaching full vaccination would actually require more than one dose for many COVID-19 vaccines).

In our updated analysis we find that, as of September 9, there continue to be wide disparities in access and at current rates, most low-income countries (LICs) and most countries in Africa will not reach global vaccination targets. We also find that, compared to July, the rate at which vaccination would have to increase for LICs to meet global targets is even greater now, due to more ambitious goals and continued low rates of dose administration in these countries.

COVID-19 Vaccinations by Country Income

There are large differences in the share of the population that has received at least one vaccine dose by country income, with low-income countries lagging significantly behind. As of September 9, only 2% of the population in LICs had received at least one vaccine dose, compared to 30% in lower-middle-income countries (LMICs), 54% in upper-middle-income countries (UMICs), and nearly two-thirds (65%) in high-income countries (HICs). In 6 LICs (25%), fewer than 1% had received at least one vaccine dose. By contrast, in 6 HICs (8%), more than 80% of the population had (see Figure 1 and Figure 2).

Share of Population That Has Received At Least One Dose by Income
Share of Population That Has Received At Least One Dose by Country and Income

See Table 1 for the full list of countries in each income group by share of population that has received at least one dose.

Similarly, there is also a large gulf in the rate at which vaccines are being administered by country income. While the daily rate of first doses administered varies by country (see Figure 3), in late August, LMICs surpassed HICs and UMICs, due to both an increase in first doses being administered in LMICs and a decrease in rates among HICs and UMICs. However, all three income groups are vaccinating at a rate ranging from 19-29 times higher than LICs. See Table 2 for a breakdown of countries in each income group by coverage and daily administration rates.

Daily Rate of First Doses Administered per One Million People by Country and Income

If current trends continue, these disparities are likely to grow, and LICs are unlikely to meet vaccination targets. Based on current vaccination rates (using rates of first doses administered), HICs, UMICs, and LMICs are on track to have 40% or more of their populations having received at least one dose by the end of the year, whereas LICs would need to increase their daily rate by nearly 35 times in order to meet the same goal. HICs, UMICs, and LMICs are also on track to have 70% or more of their populations having received at least one dose by mid-2022, while LICs would need to increase their daily rate by 24 times (see Figure 4). As of September 9, almost all HICs (68 countries or 96%) had already met one or both of the WHO targets, as had just over a third of UMICs (18 or 35%). Less than a fifth of LMICs (9 or 17%) and no LICs had met these targets. In order to reach 70% of the population with at least one dose by next year’s UNGA meeting, LICs would need to increase their daily rate by 19 times.

Projected Share of Population That Has Received At Least One Dose by Income Using Global Targets

COVID-19 Vaccinations by Region

As with country income, there are large differences in the share of the population that has received at least one vaccine dose by region, with the highest coverage in the Western Pacific and smallest in Africa. As of September 9, the region with the highest coverage is the Western Pacific (67%) followed by the Americas (56%) and Europe (52%); Africa has the lowest coverage (4%) (see Figure 5 and Figure 6).

Share of Population That Has Received At Least One Dose by Region
Share of Population That Has Received At Least One Dose by Country and Region

See Table 3 for a breakdown of top countries in each region by coverage and daily administration rates.

The rate of vaccine administration is highest in South-East Asia and lowest in Africa. While rates of first doses administered vary by country (see Figure 7), South-East Asia currently has the highest rate of daily doses administered. This region is vaccinating at a rate 1.2 times that of the Western Pacific, 1.4 times that of Eastern Mediterranean nearly 2 times the rate of the Americas, 2.7 times that of Europe, and   6 times higher that of Africa. See Table 4 for a breakdown of countries in each region by coverage and daily administration rates.

Daily Rate of First Doses Administered per One Million People by Country and Region

These disparities are likely to grow based on current vaccination trends. Western Pacific, Europe, the Americas, and South-East Asia, and Eastern Mediterranean are all ahead of schedule toward reaching 40% by the end of 2021 while Africa would need to increase its rate of daily first doses administered by more than 6 times the current rate. They are also ahead of schedule to reach 70% by mid-2022, while Africa would need to increase its rate of daily first doses administered by approximately 5 times the current rate (see Figure 8). Certain countries, primarily those in Europe, have already met some of these vaccination targets. As of September 9, 35 European countries (66%) have met one or both of these targets, and more than half of countries in the Americas (54%) and the Western Pacific (52%) have met one or both of these targets. On the other hand, only 7% of countries in Africa (3 countries) have met either of these targets. In order to reach 70% of the population with at least one dose by next year’s UNGA meeting, the African region would need to increase its daily rate by nearly 4 times.

Projected Share of Population That Has Received At Least One Dose by Region Using Global Targets

Implications

These findings underscore an ongoing equity gap in access to COVID-19 vaccinations around the world, particularly for those living in the poorest countries and in countries in Africa. Furthermore, they suggest that if current rates continue, some of these disparities may grow and many low-income countries will not meet global targets. Increasing vaccine supply and stepping up the pace of vaccinations in those countries lagging furthest behind can narrow the equity gap and help all countries achieve COVID-19 vaccination coverage goals.

Tables

Table 1: Countries by Share of Population that Has Received at Least One Dose

Table 2: Countries by Daily Rate of First COVID-19 Vaccine Doses Administered per 1,000,000 People

Table 3: Countries by Share of Population that Has Received at Least One Dose

Table 4: Countries by Daily Rate of First Doses Administered by Region

Methodology

Vaccination Data: We used country-level vaccination data on doses administered, provided by Our World in Data (OWID), to assess global vaccination trends at the income and regional level. Totals for some entities were combined (Taiwan, Hong Kong, and Macao included as part of China, and Jersey and Guernsey were combined and reported as the Channel Islands). Where missing data in the daily doses provided existed between two dates for a country, we estimated the number of doses administered each day between the two reported dates assuming a linear distribution. For countries that have stopped reporting data, we assumed no change in new doses administered. For countries that report total doses administered but not share of population that has received at least one dose, we use OWID’s suggested methodology and calculated a lower-bound estimate. As a result, our estimates are conservative and the actual share of the population receiving one dose is likely higher. For data on daily administration of first doses, we calculated the rolling 7-day average in daily change of the number of people who have received at least one dose. For projecting increased rate needed for groupings to reach certain benchmarks (40% by end of 2021, 70% by July 1, 2022, and 70% by September 13, 2022), we calculated the rate needed to reach these benchmarks for each grouping, based on number of first doses already administered and population, and calculated the percentage change from the current daily rate in first doses being administered to the increased rate needed to reach these targets. Lastly, for all data, to account for any lag in country reporting, we use data up to one week prior (September 9, 2021).

Population Data: Population data were obtained from the United Nations World Population Prospects using 2020 estimates for total population (and the CIA World Factbook for Serbia and Kosovo). Totals for some entities were combined (Taiwan, Hong Kong, and Macao included as part of China), while others were separated (separating Kosovo from Serbia).

Income Data: Income classifications were obtained using World Bank data. Entities lacking an income classification were excluded from the income-level analysis.

Regional Data: Region classifications were obtained using World Health Organization data. Entities lacking a region classification were excluded from the region-level analysis.

  1. While the coverage goals seek to reach 40% and 60% coverage, it is not clear whether this refers to partial coverage (share of population that has received at least one dose) or full coverage (share of population that is fully vaccinated). For our analysis, we focus on share of population that has received at least one dose. Additionally, while these goals aim to vaccinate the global population, we look at populations by income-level and region. ↩︎
News Release

Many Medicare Beneficiaries Face High Out-of-Pocket Costs for Dental and Hearing Care, Whether in Traditional Medicare or Medicare Advantage

Analysis Provides Context About Existing Coverage and Costs as Congress Considers Adding Dental, Hearing and Vision Coverage to Medicare

Published: Sep 21, 2021

Many Medicare beneficiaries face high annual out-of-pocket costs for dental and hearing care — services that generally aren’t covered in traditional Medicare, but typically are covered by Medicare Advantage plans though the scope and value of these benefits vary, finds a new KFF analysis.

The analysis shows that, among beneficiaries who used each type of service, average annual out-of-pocket spending was $914 for hearing care and $874 for dental care in 2018, but considerably less ($230) for vision care. Among those who were in the top 10 percent in terms of their out-of-pocket costs for such services, 2.7 million beneficiaries spent $2,136 or more on their dental care, while 360,000 beneficiaries spent $3,600 or more on hearing services.

Beneficiaries can face high out-of-pocket costs whether they are in traditional Medicare or privately-run Medicare Advantage plans, the analysis finds. Among users of dental services, for instance, average out-of-pocket spending was $766 among beneficiaries in Medicare Advantage and $992 among those in traditional Medicare in 2018.

The analysis also finds that people on Medicare in communities of color, with disabilities, or with low incomes are disproportionately likely to have difficulty getting these services. About 16 percent of all Medicare beneficiaries reported in 2019 that there was a time in the last year that they could not get dental, hearing, or vision care, but this was reported by a greater percentage of beneficiaries under age 65 with long-term disabilities (35%); those enrolled in both Medicare and Medicaid (35%); with low incomes (e.g., 31% for those with income under $10,000); and Black and Hispanic beneficiaries (25% and 22%, respectively).

The new analysis also provides an overview of coverage of dental, hearing, and vision services in Medicare Advantage plans. While most plans offer coverage for these services, the extent of coverage varies and has limits.

  • Nearly all Medicare Advantage enrollees with access to dental coverage have preventive care benefits, and most have access to more extensive dental benefits. Cost sharing for more extensive dental services is typically 50 percent for in-network care, and typically is subject to an annual dollar cap on plan payments.
  • Similarly, almost all Medicare Advantage enrollees have access to hearing exams and hearing aid coverage. The coverage generally is subject to either a maximum annual dollar cap and/or frequency limits on how often plans cover the service.
  • Virtually all Medicare Advantage enrollees have access to vision exams and eyewear coverage, typically subject to maximum annual limits averaging about $160 per year.

The findings come as policymakers in Congress are considering adding dental, hearing, and vision benefits to Medicare as part of the budget reconciliation bill, one of several competing spending priorities in the debate. It would be the largest expansion of Medicare benefits since the Part D drug benefit was launched in 2006. (A similar 2019 proposal would have increased Medicare spending by more than $300 billion over 10 years according to the Congressional Budget Office.)

For the full analysis and other KFF data and analyses about Medicare, including the recent Medicare and Dental Coverage: A Closer Look, visit kff.org

Dental, Hearing, and Vision Costs and Coverage Among Medicare Beneficiaries in Traditional Medicare and Medicare Advantage

Published: Sep 21, 2021

Notably missing among covered benefits for older adults and people with long-term disabilities who have Medicare coverage are dental, hearing, and vision services, except under limited circumstances. Results from a recent KFF poll indicate that 90% of the public says expanding Medicare to include dental, hearing, vision is a “top” or “important” priority for Congress. Policymakers are proposing to add coverage for these services as part of budget reconciliation legislation, and a provision to add these benefits to traditional Medicare was included in the version of H.R. 3 that passed the House of Representatives in the 116th Congress.

The Biden Administration endorsed improving access to these benefits for Medicare beneficiaries in the FY2022 budget. Addressing these gaps in Medicare benefits is grounded in a substantial body of research showing that untreated dental, vision, and hearing problems can have negative physical and mental health consequences. Adding these benefits to Medicare would increase federal spending, and they will be competing against other priorities in the budget reconciliation debate.

Dental, hearing, and vision services are typically offered by Medicare Advantage plans, but the extent of that coverage and the value of these benefits varies. Some beneficiaries in traditional Medicare may have private coverage or coverage through Medicaid for these services, but many do not. As a result, beneficiaries who need dental, vision, or hearing care may forego getting the care or treatment they need or face out-of-pocket costs that can run into the hundreds and even thousands of dollars for expensive dental treatment, hearing aids, or corrective eyewear.

In a separate KFF analysis, we analyzed dental coverage, use, and out-of-pocket spending among Medicare beneficiaries and provided an in-depth look at coverage of dental services in Medicare Advantage plans. In this brief, we build on our prior work by analyzing hearing and vision use, out-of-pocket spending and cost-related barriers to care among beneficiaries in traditional Medicare and Medicare Advantage, incorporating top-level findings from our analysis of dental services to provide a comprehensive profile of dental, hearing, and vision benefits in Medicare Advantage plans. The analysis of spending, use, and cost-related barriers to care is based on self-reported data by beneficiaries in both traditional Medicare and Medicare Advantage from the 2018 and 2019 Medicare Current Beneficiary Survey, and analysis of Medicare Advantage plan benefits is based on the 2021 Medicare Advantage Enrollment and Benefit files for data on individual Medicare Advantage plans (see Methods for details).

Findings

Dental, Hearing, and Vision Use and Spending

  • Difficulty with hearing and vision is relatively common among Medicare beneficiaries, with close to half (44%, or 25.9 million) of beneficiaries reporting difficulty hearing and more than one third (35% or 20.2 million beneficiaries) reporting difficulty seeing in 2019. These percentages may understate the share of beneficiaries who have problems with hearing or vision in that some beneficiaries who wear corrective eyewear or hearing aids do not report having difficulties. For example, among the 83% of Medicare beneficiaries who report wearing eyeglasses or contact lenses, only 32% say they have vision difficulties, while of the 14% of beneficiaries who report using a hearing aid, 65% say they have hearing difficulties. The lower overall rate of hearing aid use, relative to the rate of reported hearing difficulties, may be a function of affordability, considering the relatively high cost of hearing aids and limited availability of lower-cost options for hearing technology.
  • A larger share of Medicare beneficiaries used dental services than either hearing or vision services in 2018. In 2018, 53% (31.3 million) of beneficiaries reported having a dental visit within the past year, 35% (20.3 million) used vision services, and 8% (4.6 million) used hearing services (Figure 1).
  • On average, out-of-pocket spending on hearing and dental care by Medicare beneficiaries who used these services in 2018 was higher than spending on vision care by beneficiaries who used vision services that year. Among beneficiaries who used each type of service, average spending was $914 for hearing care, $874 for dental care, and $230 for vision care (Figure 1).
On Average, Medicare Beneficiaries' Out-of-Pocket Costs Were Higher for Hearing and Dental Care than Vision Care in 2018
  • The distribution of out-of-pocket spending on dental and hearing services is highly skewed, with a small share of users incurring significant out-of-pocket costs (likely associated with the purchase of costly equipment such as hearing aids, or expensive dental procedures, such as implants). For example, in 2018, among beneficiaries who used dental services, beneficiaries in the top 10% in terms of their out-of-pocket costs (2.7 million beneficiaries) spent $2,136 or more on their dental care, while among beneficiaries who used hearing services, beneficiaries in the top 10% in terms of out-of-pocket costs (0.4 million beneficiaries) spent $3,600 or more on these services (Figure 2). Conversely, half of beneficiaries who used dental services had out-of-pocket spending below $244 for their dental care; half of those who used vision services had out-of-pocket spending below $130 for their vision care; and half of those who used hearing services had out-of-pocket spending below $60 for their hearing care.
 Small Share of Medicare Beneficiaries Incurred High Out-of-Pocket Costs for Hearing and Dental Care in 2018
  • Among users of these services, beneficiaries enrolled in Medicare Advantage plans spent less out of pocket for dental and vision care than beneficiaries in traditional Medicare in 2018, but there was no difference between the two groups in spending on hearing care. Both groups spent substantially more for dental and hearing services than vision services. For dental services, average out-of-pocket spending was $766 among beneficiaries in Medicare Advantage and $992 among beneficiaries in traditional Medicare (Figure 3). For vision services, average out-of-pocket spending was $194 among beneficiaries in Medicare Advantage and $242 among beneficiaries in traditional Medicare. Most Medicare Advantage enrollees had coverage for some dental, vision and hearing benefits, as described below, but still incurred out-of-pocket costs for these services.
    • Lower average out-of-pocket spending among Medicare Advantage enrollees for dental and vision care is likely due to several factors. Most Medicare Advantage enrollees have coverage for dental, hearing, and vision services through their plan (as described below), which helps to improve the affordability of these services. Lower out-of-pocket spending among Medicare Advantage enrollees may also be related to lower overall income levels among these beneficiaries. Previous KFF analysis showed that average out-of-pocket spending on dental care rises with income because higher income beneficiaries are more able to afford such expenses, not because they have greater dental needs. It is possible that some traditional Medicare beneficiaries used more, or more expensive, types of dental and vision care than those in Medicare Advantage, contributing to their higher average out-of-pocket costs for these services. Due to data limitations, it is not possible to assess how utilization of dental, vision, or hearing care differed between Medicare Advantage and traditional Medicare enrollees.
Among Beneficiaries Who Used Services, Medicare Advantage Enrollees Spent Less Out of Pocket on Average for Dental and Vision Care than Beneficiaries in Traditional Medicare in 2018
  • About one in six Medicare beneficiaries reported in 2019 that there was a time in the last year that they could not get dental, hearing, or vision care, and among those who reported access problems, cost was a major barrier.
    • Overall, in 2019, 16% of Medicare beneficiaries, or 9.5 million, reported that there was a time in the last year that they could not get dental, hearing, or vision care. This includes 12% of Medicare beneficiaries who said they could not get dental care, 6% who couldn’t get vision care, and 3% who couldn’t get hearing care (Figure 4).
    • Similar shares of beneficiaries in both traditional Medicare and Medicare Advantage reported access problems in the last year for dental, hearing, or vision services (16% and 17%, respectively).
    • Among the 20.2 million beneficiaries who reported difficulty seeing, 11% (2.1 million beneficiaries) said there was a time in the last year they could not get vision care, and among the 25.9 million beneficiaries who reported difficulty hearing, 7% (1.8 million beneficiaries) said there was a time in the last year they could not get hearing care.
    • Medicare beneficiaries more likely to report difficulty getting dental, hearing, or vision care include beneficiaries under age 65 with long-term disabilities (35%); with low incomes (e.g., 31% for those with income under $10,000); in fair or poor health (30%); enrolled in both Medicare and Medicaid (35%); Black and Hispanic beneficiaries (25% and 22%, respectively); and residing in rural areas (20%) (Figure 5).
Cost was a Barrier to Care for Medicare Beneficiaries who Reported in 2019 They Couldn't Get Dental, Vision, or Hearing Care in the Last Year
The Share of Medicare Beneficiaries Saying They Couldn't Get Dental, Hearing, or Vision Care in the Last Year Was Highest Among Those under Age 65, with Low Incomes, in Poor Health, and in Communities of Color
  • Among the 16% of beneficiaries who said that there was a time in the last year that they could not get dental, hearing, or vision care, a majority (70%) said that it was due to cost (Figure 4). This includes 75% of those who couldn’t get hearing care, 71% of those who couldn’t get dental care, and 66% of those who couldn’t get vision care.
    • Among beneficiaries in traditional Medicare and Medicare Advantage who reported access problems in the last year for dental, hearing, or vision care, roughly 7 in 10 beneficiaries in both groups said that cost was a barrier to getting these services (72% and 70%, respectively).
    • Beneficiaries more likely to report cost as a barrier to dental, hearing, or vision care include those under age 65 with long-term disabilities (76%); with low incomes (e.g., 72% for those with incomes under $10,000); and in fair/poor health (75%).

What Dental, Hearing, and Vision Benefits Are Offered by Medicare Advantage Plans?

Most Medicare Advantage plans provide some coverage of routine dental, vision, and hearing benefits, unlike traditional Medicare. Plans can use rebate dollars – a portion of the difference between their bid to cover Medicare Parts A and B services and the benchmark – to provide supplemental benefits, such as dental, hearing, and vision benefits. Plans also use rebate dollars to lower enrollee cost sharing and reduce premiums, and for administrative expenses and profit. According to MedPAC, about 21% of rebate dollars in 2021, or $29 per enrollee per month, were used to cover supplemental benefits not covered by traditional Medicare.

Dental Benefits

In 2021, 94% of Medicare Advantage enrollees or 16.6 million people, are in a plan that offers access to some dental coverage. Virtually all Medicare Advantage enrollees have access to preventive dental benefits and most have access to more extensive dental benefits, according to a prior KFF analysis. Most enrollees with access to more extensive benefits are typically subject to annual dollar limits on coverage, which averages $1,300.

Among Medicare Advantage enrollees with access to dental coverage:

  • Most (86%) of these enrollees are offered both preventive and more extensive dental benefits.
  • More than three in four (78%) Medicare Advantage enrollees who are offered more extensive coverage are in plans with annual dollar limits on dental coverage, with an average limit of $1,300 in 2021. More than half (59%) of these enrollees are in a plan with a maximum dental benefit of $1,000 or less.
  • Nearly two-thirds of Medicare Advantage enrollees (64%) with access to preventive benefits, such as oral exams, cleanings, and/or x-rays, pay no cost sharing for these services, though their coverage is typically subject to an annual dollar cap. The most common coinsurance for more extensive dental services, such as fillings, extractions, and root canals, is 50%.
  • About 10% of Medicare Advantage beneficiaries are required to pay a separate premium to access any dental benefits. For additional and more detailed information about dental benefits offered by Medicare Advantage plans, see “Medicare and Dental Coverage: A Closer Look.”

Hearing Benefits

In 2021, 97% of Medicare Advantage enrollees or 17.1 million people, have access to a hearing benefit. Among these enrollees, virtually all (95%) are in plans that provide access to both hearing exams and hearing aids (either outer ear, inner ear, or over the ear). Hearing aid coverage is typically subject to annual dollar limits on coverage or frequency limits, with an average dollar limit of $960 and the most common frequency limit of one set of aids per year.

Among Medicare Advantage enrollees who have access to hearing coverage:

  • Virtually everyone with hearing aid coverage is subject to either annual dollar limits on coverage, frequency limits on covered services, or both (Figure 6).
    • Nearly a third (32%) of Medicare Advantage enrollees are in plans with a maximum dollar limit the plan will pay annually toward hearing aid coverage as well as frequency limits on hearing aid coverage; about 8% are in plans with maximum dollar limits, but do not have frequency limits. For those in plans with maximum annual dollar limits, the average limit is $960 in 2021, ranging from $66 up to $4,000.
    • Nearly 6 in 10 enrollees (59%) are in plans that do not have maximum dollar limits on hearing aid coverage but do have a frequency limit on how often hearing aids are covered; 1% of enrollees have neither a maximum annual dollar limit nor a frequency limit on hearing aids.
About 40% of Medicare Advantage enrollees are in plans with annual dollar limits on hearing aids; nearly all remaining enrollees have a frequency limit on hearing aids that are covered during a given period
  • Medicare Advantage enrollees are often subject to limits in the frequency of obtaining certain covered hearing-related services.
    • Among enrollees with access to hearing exams, virtually all enrollees (98%) are in plans that limit the number of hearing exams, with the most common limit being no more than once per year.
    • Of the 69% of enrollees with access to fitting and evaluation for hearing aids, about 88% are in plans that have frequency limits on those services, with the most common limit being no more than once per year.
    • Most enrollees (91%) are in plans with frequency limits on the number of hearing aids they can receive in a given period. The most common limit is one set (one for each ear) per year (58%), followed by one set every two years (28%), and one set every three years (14%).
  • Hearing exams are often covered without cost sharing, but hearing aids are typically subject to cost-sharing requirements, and enrollees who do not face cost sharing for hearing aids are usually subject to annual dollar limits.
    • Nearly three quarters of all enrollees (74%) are in plans that do not require cost sharing for hearing exams, while 11% of enrollees are in plans that report cost sharing for hearing exams, with the majority being copays, which range from $15 to $50. Data on cost sharing is missing for plans that cover the remaining 15% of enrollees (see Methods for more information).
    • Of those enrollees with access to fitting and evaluations of hearing aids as part of their plan, more than half (61%) of enrollees are in plans that do not require cost sharing for these services. About 5% of enrollees are in plans that require cost sharing for fittings and evaluations, nearly all copays, which range from $15 to $50.
    • About 60% of enrollees are in plans that require cost sharing for hearing aids, which can range from $5 up to $3,355. Nearly one quarter of enrollees (22%) pay no cost sharing for any type of hearing aid, but virtually all these enrollees are in plans with a maximum annual limit.

Vision Benefits

In 2021, 99% of Medicare Advantage enrollees or 17.5 million people, have access to some vision coverage. Among these enrollees, virtually all (93%) are in plans that provide access to both eye exams and eyewear (contacts and/or eyeglasses). Most enrollees do not pay cost sharing for eyewear, but nearly all vision coverage is subject to annual dollar limits on coverage, averaging $160.

Among Medicare Advantage enrollees who have access to vision coverage:

  • Virtually all (99%) Medicare Advantage enrollees offered both eye exams and eyewear coverage are in plans with annual dollar limits on vision coverage, with an average limit of $160 in 2021. Nearly half (45%) of these enrollees are in a plan with a maximum vision care benefit of $100 or less (Figure 7).
Virtually all Medicare Advantage plans that offer vision have an annual dollar limit on the benefit; nearly half of enrollees in these plans have a limit of $100 or less in 2021
  • For vision benefits, Medicare Advantage enrollees are often limited in terms of the frequency of obtaining certain covered services.
    • Among enrollees with access to eye exams, nearly all enrollees (94%) are in plans that limit the number of covered eye exams, with the most common limit being no more than once per year.
    • More than half of enrollees (58%) in plans that cover eyeglasses are limited in how often they can get a new pair. Among those with a limit on eyeglasses, the most common limit is one pair per year (52%), followed by one pair every two years (47%).
    • Among plans that cover contact lenses, one third of enrollees (33%) are in plans that have frequency limits on contact lenses, typically once per year.
    • Virtually all enrollees in plans without quantity limits on eyeglasses or contact lenses are limited by an annual dollar cap, as noted above.
  • Vision exams are often covered without cost sharing, and eyewear is also often covered without cost sharing but is always subject to annual dollar limits.
    • Most enrollees (71%) pay no cost sharing for eye exams, while about 14% of enrollees are in plans that report cost sharing for eye exams, with virtually all requiring copays, ranging from $5 to $20. Data on cost sharing is missing for plans that cover the remaining 15% of enrollees.
    • Around two-thirds of Medicare Advantage enrollees pay no cost sharing for eyeglasses or contact lenses (66% and 64% respectively), but all these enrollees are in plans that have an annual maximum dollar limit on coverage. About 2% of enrollees are in plans that require cost sharing for either eyeglasses or contacts, with nearly all requiring copays; these enrollees are also subject to an annual dollar cap.

In conducting this analysis of Medicare Advantage benefits, we found that plans do not use standard language when defining their benefits and include varying levels of detail, making it challenging for consumers or researchers to compare the scope of covered benefits across plans. Our analyses take into account benefits, as described in the Medicare Advantage Plan Benefit files, which includes annual limits on plan benefits, frequency limits on obtaining covered services, and cost-sharing requirements, but does not take into account plan restrictions that may affect access, such as type or model of hearing aids covered, type of eyeglasses or lenses covered (e.g. bifocals, graduated lenses), the extent to which prior authorization rules are imposed, or network restrictions on suppliers.

Discussion

While some Medicare beneficiaries have insurance that helps cover some dental, hearing, and vision expenses (such as Medicare Advantage plans), the scope of that coverage is often limited, leading many on Medicare to pay out-of-pocket or forego the help they need due to costs. Traditional Medicare generally does not cover routine dental, hearing, or vision services, and coverage for these services under Medicare Advantage varies.

Based on self-reported data, use of dental, hearing, and vision services ranges widely among Medicare beneficiaries overall, with just over half of all beneficiaries reporting that they used dental services in 2018, roughly one-third using vision services, and fewer than one in 10 using hearing services. While it is not the case that use of these services is indicated or required annually for everyone on Medicare, our analysis shows that vision and hearing difficulty is not uncommon among Medicare beneficiaries and cost prevented many beneficiaries in both traditional Medicare and Medicare Advantage plans who sought dental, hearing, or vision care from getting it in 2019.

Medicare Advantage plans are the leading source of dental coverage for people with Medicare, and a main source of coverage for hearing and vision. According to our analysis of plan benefit data, most Medicare Advantage plans provide access to these benefits; only 6% of enrollees are in plans that do not cover dental benefits, 3% are in plans that do not cover hearing exams and/or aids, and 1% are in plans that do not cover eye exams/glasses. While the scope of coverage varies across Medicare Advantage plans, there are some common features within each category. Nearly all Medicare Advantage enrollees with access to dental coverage have preventive benefits, and most have access to more extensive dental benefits, though cost sharing for more extensive services is typically 50% for in-network care, and subject to an annual cap on plan payments. Almost all Medicare Advantage enrollees have access to both hearing exams and hearing aid coverage; hearing aid coverage is subject to either a maximum annual dollar cap and/or frequency limits on how often plans cover the service. Virtually all Medicare Advantage enrollees have access to both vision exams and eyewear coverage, and this coverage is typically subject to maximum annual limits, averaging about $160 per year.

Policymakers are considering adding dental, hearing, and vision benefits to Medicare as part of the budget reconciliation bill – a change that would be the largest expansion of Medicare benefits since the Part D drug benefit was launched in 2006. These program improvements would lead to higher federal spending of $358 billion over 10 years (2020-2029), including $238 billion for dental and oral health care, $89 billion for hearing care, and $30.1 billion for vision care, according to a Congressional Budget Office estimate of the version of H.R.3 passed by the House in 2019. Additionally, in a July 2021 executive order, President Biden called for the Secretary of Health and Human Services to issue a proposed rule that would allow hearing aids to be sold over-the-counter, as allowed under the FDA Reauthorization Act of 2017 – a move that could help make hearing aids more affordable for people with hearing difficulties who may be foregoing purchasing them due to cost. Expanding Medicare coverage for dental, hearing, and vision services and making lower-cost hearing aids available would address significant gaps in coverage and could alleviate cost concerns related to these services for people on Medicare.

This work was supported in part by the AARP Public Policy Institute. We value our funders. KFF maintains full editorial control over all of its policy analysis, polling, and journalism activities.

Methods

Our analysis of dental, hearing, and vision out-of-pocket spending and cost-related barriers to care is based on data from the 2018 and 2019 Medicare Current Beneficiary Survey (MCBS). For the analysis of problems getting care due to cost, we relied on the 2019 MCBS Survey File topical segment “Access to Care, Medical Appointments” (ACCSSMED) to identify community-dwelling beneficiaries who reported that they couldn’t get dental, hearing, or vision care in the last year because of cost. This analysis was weighted to represent the ever-enrolled population, using the ACCSSMED topical segment weight ‘ACSEWT’.

Respondents were coded as having hearing difficulty if they reported having “a little trouble hearing”, “a lot of trouble hearing”, or deafness/serious difficulty hearing.

Respondents were coded as having vision difficulty if they reported having “a little trouble seeing”, “a lot of trouble seeing”, blindness, or blindness/difficulty seeing even with glasses. This analysis was weighted to represent the ever-enrolled population, using the weight ‘EEYRSWGT’.

For the analysis of out-of-pocket spending on dental, hearing, and vision services, we relied on the 2018 MCBS Cost Supplement data, which includes survey-reported events for these services since they are generally not Medicare-covered services and therefore there are no Medicare claims. We identified dental events based on the Dental segment, and vision and hearing events using the Medical Provider Events (MPE) segment. We subset the file to beneficiaries with hearing events, which were identified as medical provider specialty events for an audiologist or hearing therapist or where the type of event was for a hearing or speech device or a hearing aid, and beneficiaries with vision events, which were identified as medical provider specialty events for an optometrist or where the type of event was for eyeglasses. We analyzed out-of-pocket spending on dental, hearing, and vision services (separately) among community-dwelling beneficiaries overall, and among the subset of community-dwelling beneficiaries who were coded as having a dental, vision, or hearing event. This analysis was weighted to represent the ever-enrolled population, using the Cost Supplement weight ‘CSEVRWGT’. We also analyzed out-of-pocket spending among community-dwelling beneficiaries who reported having difficulty hearing or difficulty seeing.

The Medicare Advantage Enrollment and Benefit files for 2021 were used to look at dental, hearing, and vision coverage for beneficiaries enrolled in individual Medicare Advantage plans (e.g., excludes Special Needs Plans, employer-group health plans, and Medicare-Medicaid Plans (MMPs)). This analysis includes enrollees in the 50 states, Washington D.C., and Puerto Rico. Plans with enrollment of 10 or fewer people were also excluded because we are unable to obtain accurate enrollment numbers. For cost-sharing amounts for dental, vision, and hearing coverage, many plans do not report these figures, and in cases where enrollee cost sharing does not add up to 100%, it is due to plans not reporting this data. Due to data limitations, we examine benefits offered, but are unable to analyze the extent to which enrollees in Medicare Advantage plans use supplemental benefits specifically offered by their plan, such as dental, hearing and vision, because encounter data for these benefits are not available. It is also unclear from the plan Benefit files the extent to which plans limit the type of eyeglasses or hearing aids, impose network restrictions or prior authorization.

Medicaid and State Financing: Key Indicators to Watch Through Pandemic and Recovery

Authors: Elizabeth Williams, Robin Rudowitz, Rachel Garfield, and Elizabeth Hinton
Published: Sep 20, 2021

The health and economic effects of the pandemic have significant implications for Medicaid.  Medicaid, which provides coverage of health and long-term care for low-income residents, is administered by states within broad federal rules and jointly funded by states and the federal government. Medicaid is a counter-cyclical program, meaning that more people become eligible and enroll during economic downturns; at the same time, states may face declines in revenues that make it difficult to fund the state share of funding for the program. As in past economic downturns, the federal government has provided additional financial assistance to states during the current pandemic to help them maintain their Medicaid programs at a time of growing need.  This brief presents the most current data for key indicators to help understand how various economic factors that could affect Medicaid enrollment and spending are changing in light of the pandemic as well as efforts to address the pandemic and the start of economic recovery.  An overview of the methods is in the Methods Box at the end of the brief, and a companion brief provides an overview of Medicaid Financing Basics.

What factors could affect Medicaid enrollment?

Medicaid enrollment is typically the primary driver of spending.  Administrative data for Medicaid show that after declines in enrollment from 2017 through 2019, total enrollment nationwide began to grow after February 2020, right before the pandemic began. Between February 2020 and April 2021, enrollment steadily increased to 82.3 million, an increase of 11.1 million, or 15.5%, from actual enrollment in February 2020. These trends in enrollment likely reflect changes in the economy as more people experience income and job loss and become eligible and enroll in Medicaid coverage as well as “maintenance of eligibility” (MOE) provisions in the Families First Coronavirus Response Act (FFCRA) that require states to ensure continuous coverage to current Medicaid enrollees to access a temporary increase in the federal Medicaid match rate.

Key economic indicators that could signal changes to Medicaid enrollment include those showing job and income loss such as the unemployment rate, unemployment insurance claims, and the employment-to-population ratio.  Unemployment rates and unemployment insurance filings capture people who are actively looking for or have recently lost employment, respectively, and may be affected by people who opt to leave the workforce altogether.  Employment-to-population ratios capture what share of the population is working overall.  All measures capture some aspect of income loss, which could make more people eligible for Medicaid. However, Medicaid enrollment changes may lag behind changes in broader economic metrics.  For example, when unemployment rises, increases in Medicaid enrollment may follow, but improvements in unemployment may not immediately translate to slower Medicaid growth. This effect was observed following the end of the Great Recession in 2009 when Medicaid spending and enrollment continued to grow in 2010 and 2011 and is due in part by MOE provisions that prevent states that accept additional federal funding from disenrolling Medicaid beneficiaries.

National data show sharp increases in the average unemployment rate and unemployment claims following the onset of the pandemic in March 2020, but they have moderated in more recent months.  Indicators of employment-to-population ratios also show precipitous declines at the start of the pandemic, unmatched by trends since 2008. While changes in indicators related to employment and jobs have moderated in more recent months, they are still not at pre-pandemic levels. For example, July 2021 saw a national unemployment rate of 5.4% across all states including DC, below the peak of 14.8% in April 2020 but still above 3.5% in February 2020, right before the pandemic.  Similarly, total unemployment claims peaked in May 2020 and have been steadily declining, but total claims in July 2021 were greater than February 2020.  Finally, the employment-to-population ratio dropped to a low of 51.3% in April 2020; the 58.4% ratio in July 2021 is below the February 2020 level of 61.1%.  Unemployment rates and unemployment claims were higher, and the employment-to-population ratios were lower relative to the Great Recession that started in December 2007.

Monthly Unemployment Rate

For each employment indicator there was wide variation across states in the average over the most recent 12-month period compared to a year earlier.  Looking at the average for the most recent 12-month period (August 2020 to July 2021) compared to the same period in the prior year, the national unemployment rate decreased by 1%; however, growth across states varied significantly, from more than a 30% increase in Hawaii and Connecticut to a 33% decrease in New Hampshire. Measures continue to improve, with over half of states seeing declines in their average unemployment rate and number of unemployment claims and a quarter of states seeing growth in their average employment-to-population ratio when comparing the most recent 12-month average to the year prior. South Dakota was in the top 5 states with the most improvement in its 12-month average for at least two of the three indicators, and Connecticut, D.C., Hawaii, and Maryland were hardest hit, being in the top 5 with the largest changes in their 12-month averages for at least two of the three indicators.

Employment-related economic consequences are directly related to the proportion of jobs a state has in more impacted sectors. States, like Hawaii and Nevada, which rely heavily on more exposed sectors (restaurants and bars, travel and transportation, entertainment, etc.), saw larger changes in job-related indicators throughout the pandemic. On the other hand, states more reliant on less exposed sectors, like agriculture in the Midwestern states, fared better. The leisure and hospitality industries experienced the highest unemployment rates at the start of the pandemic, but other industries also reliant on in-person work, like mining, are now seeing higher rates of unemployment. Many individuals enrolled in Medicaid even before the pandemic are employed in exposed sectors (such as food and other service industries) and are particularly at risk for income or job loss. Additionally, state issued stay-at-home orders and personal social-distancing behaviors varied across states and also contributed decreased economic activity.

Percent Change in Unemployment Rate by State

What factors could affect states’ ability to finance Medicaid?

States generally fund their share of Medicaid costs through general revenue collected from residents, businesses, and sales taxes. States must adopt balanced budgets, so during economic downturns when demand for services and programs like Medicaid increases, state revenues typically decline, putting pressure on state budgets.  To provide broad fiscal relief to states and to help support increases in Medicaid enrollment, the Families First Coronavirus Response Act (FFCRA) authorized a 6.2 percentage point increase in the federal match rate (“FMAP”) for states that meet certain “maintenance of eligibility” (MOE) requirements. The additional funds were retroactively available to states beginning January 1, 2020 and continue through the quarter in which the PHE period ends. While the current PHE declaration expires 90 days from July 20, 2021, the Biden Administration has notified states that the PHE will likely remain in place throughout CY 2021 and that states will receive 60 days-notice before the end of the PHE.

Measures of changes in state revenue can provide insight into states’ ability to finance the state share of Medicaid. State revenues are largely dependent on revenue from personal income taxes, corporate income taxes and sales taxes. The share of revenue coming from each of these sources varies, and 9 states have no personal income tax at all. In addition, each type of tax may be affected differently by changes in economic conditions.

State revenues overall have increased sharply in recent months, with unadjusted 12-month rolling averages for revenue now surpassing pre-pandemic averages. For the most recent 12-month rolling average (ending June 2021) compared to the 12-month average from February 2020, before the pandemic, average monthly total revenues are 13.4% higher. This is much improved from the 12-month period ending June 2020, the lowest point during the pandemic, which saw a 8.0% drop from the 12-month average from February 2020. Overall, states have not experienced revenue declines as large as original projections. While the data show steep revenue declines early in the pandemic, overall unadjusted revenues have rebounded in recent months, though some of the sharp increases in the recent 12-month rolling averages can be attributed to delayed income tax filing deadlines. Revenues appear to have surpassed pre-pandemic levels; however, there is variation across states, and the data pre-dates the Delta variant and is volatile due to changing income tax deadlines. States adapted to the changing outlook, adopting conservative FY 2021 budgets and then adopting FY 2022 budgets with increases in state spending and revenue after ending FY 2021 with surpluses.

State revenue changes vary across revenue sources, with personal income taxes faring better than sales taxes during the pandemic. Corporate income tax revenues are volatile and can fluctuate considerably from month to month. For the most recent 12-month rolling average (ending June 2021) compared to February 2020, before the pandemic, average monthly personal income taxes increased by 19.5%, corporate income taxes grew by 40.4%, and sales taxes grew by 6.3%. Most states pushed back their 2020 income tax filing deadline from April 15th to July 15th and their 2021 deadline to May 17th, delaying income tax revenue and causing the 12-month averages for May and June 2021 to contain two income tax collection months for many states. US total data is preliminary for April, May, and June 2021, due to delays by some states to report revenues as they close out the 2021 fiscal year.

12-Month Rolling Average Tax Revenue

There is considerable variation across states with regard to changes in revenues. Almost all states are now seeing an increase in average monthly total tax revenue for the most recent 12-month period (ending June 2021) compared to the prior year, with only 2 states experiencing declines. Changes in overall average monthly tax collections ranged from a decline of 18% in Alaska to growth of 53% in California for the most recent 12-month period compared to the prior year, and there was also variation by revenue source. Since the pandemic has disproportionately affected low income workers in the service industry, most states experienced smaller declines in personal income tax revenue than expected, especially for states with progressive income tax structures, where people with higher incomes pay a higher share of income tax.  In addition, income tax withholdings on the supplemental federal unemployment benefits may have also sustained state income tax revenues.

States that issued stay-at-home orders saw reduced sales tax revenues, and states that rely heavily on tourism, like Hawaii, Florida, and Nevada, or oil and gas, like Alaska and North Dakota, experienced larger revenue declinesSales tax revenues were bolstered by $600 weekly federal unemployment benefits under the CARES Act that allowed consumers to continue spending, the 2018 Supreme Court decision that authorized states to collect sales tax on online purchases, and increased spending on goods instead of services, which most states do not tax. While sales taxes on groceries have been shown to worsen income and racial inequalities, states that tax groceries saw smaller declines in sales tax revenue during the pandemic. Sales tax revenues are recovering more slowly than personal income and corporate income tax revenues, and states that rely more heavily on sales tax revenues and do not have an income tax experienced steeper declines in total tax revenues.

Percent Change in Total Tax Revenue by State

Looking Ahead

The ongoing health and economic effects of the pandemic will continue to have implications for Medicaid enrollment and financing. While revenues and employment indicators have improved, employment indicators have not yet returned to pre-pandemic levels and there remains a lot of variation across states. In addition, while indicators are improving on average across states, it is unclear how quickly and how much jobs and revenue in certain sectors of the economy will improve.  As the economy improves, what happens in certain sectors could greatly affect Medicaid as there have been disproportionate effects on low-wage workers who could be eligible for Medicaid.

Almost all states have adopted budgets for state fiscal year 2022 (which started July 1 for most states), and revenue and spending projections incorporated improvements in revenue tied to COVID-19 vaccination efforts and eased restrictions, assumptions about the duration of the PHE (which has implications for the temporary fiscal relief and continuous coverage requirements for Medicaid), and federal stimulus funds that were part of the American Rescue Plan. However, the spread of the Delta variant and the recent surge in COVID-19 cases and deaths casts more uncertainty about state economic conditions and the duration of the PHE.

Methods Overview

The data in this analysis draws on a range of sources, including the Bureau of Labor Statistics, Department of Labor, and State and Local Finance Initiative at Urban Institute.  We draw on the most current data available for each specific indicator. For most indicators, we examined both national and state-by-state changes over time. To avoid major fluctuations using monthly data, we calculate 12-month rolling averages and percent changes in 12-month rolling averages compared to the prior year period.

  • At the state level, we calculate the percent change in the most recent 12-month average compared to the prior year by taking the average of the measure (revenue, unemployment rate, etc.) for the most recent 12-month period and comparing to the same 12-month period the prior year. For example, the percent change calculation for June 2021 compares the average tax revenue from July 2020-June 2021 to the average tax revenue from July 2019-June 2020. When the most recent month’s revenue is not available for a state, we shift the 12-month comparison back to the most recent 12-months available and add a note to the figure. For example, total tax revenue for Nevada is not available for June 2021 so the most recent 12-month average is calculated using June 2020-May 2021 and compared to June 2019-May 2020.
  • Monthly unemployment claims are calculated by combining reported initial and continued unemployment claims for each week, and then aggregating into months using the date in which the filing week ended.
  • For the state level revenue data, state data is removed if there is one revenue outlier that heavily skews the average calculations for that state. When this occurs, a note is added to the figure.
  • All other data is pulled directly from sources and no additional adjustments are made. Revenue data is not adjusted for inflation.

Racial Disparities in COVID-19 Impacts and Vaccinations for Children

Published: Sep 16, 2021

Introduction

Although children have not borne the most severe brunt of COVID-19 relative to adults, some do become hospitalized, suffer long-term consequences, and even death from the disease. There is growing attention to how children are being affected by the pandemic, particularly as in-person school returns, and those younger than age 12 are not yet eligible for vaccination. While data remain limited, available research and data to date suggest that children of color have been disproportionately affected by COVID-19 and may be less likely to have been vaccinated, mirroring racial disparities observed among the broader population. These disparities may leave children of color at increased risk, particularly as they return to in-person school. Together the findings point to the importance of increasing data available to understand racial disparities in COVID-19 impacts and vaccinations among children and efforts to mitigate disproportionate impacts of COVID-19 for children of color going forward.

Findings

Disparities in COVID-19 Impacts among Children

Research suggests COVID-19 has disproportionately affected the health of children of color in ways that mirror patterns observed among adults. Studies find that, compared to their White counterparts, Black, Hispanic, and Asian children had lower rates of testing but were significantly more likely to be infected; Black and Hispanic children were more likely to be hospitalized and more likely to have multisystem inflammatory syndrome (MIS-C (a serious and sometimes deadly condition where different body parts become inflamed, including the heart, lungs, kidneys, and brain); Black children were more likely to be admitted to intensive care units due to MIS-C; and Hispanic, Black, and American Indian and Alaska Native (AIAN) children had higher rates of death. Recent data from CDC also show racial disparities in COVID-19 health impacts. As of August 31, 2021, there were almost 4.9 million infections, over 39,000 hospitalizations, and 725 deaths due to COVID-19 among children 19 and younger, which showed:

  • Infection rates were highest among AIAN, Native Hawaiian and Other Pacific Islander (NHOPI), and Hispanic children at over 500 cases per 10,000 people (Figure 1). White and Black children had over 300 cases per 10,000 people, while Asian children had the lowest infection rate at just over 200 cases per 10,000 people.
  • AIAN and Hispanic children had the highest rates of hospitalization, followed by NHOPI and Black children, who are two to three times as likely to be hospitalized than White children. Asian children had the lowest hospitalization rate.
  • There were large disparities in deaths for AIAN and Black children, whose death rates were over 3.5 and 2.7 times higher than the rate for White children, respectively. Hispanic children also were more likely to die than their White counterparts, while Asian children had a lower death rate. Deaths among NHOPI children were not reported due to insufficient data.
COVID-19 Cases Among Children by Race/Ethnicity, August 31, 202

The pandemic has also adversely impacted children’s mental, social and academic growth, with Hispanic and Black children bearing the brunt of these impacts. A recent KFF Vaccine Monitor report shows that half of Hispanic parents say one of their children fell behind academically as a result of the pandemic compared to about a third (35%) of White parents who say the same. Additionally, half of Hispanic parents (52%) say one of their children experienced difficulty concentrating on school work, issues with sleeping and eating, or frequent headaches or stomachaches since the pandemic began, compared to less than four in ten (40%) White parents. Black and Hispanic parents also are more likely to say their household suffered a job disruption due to childcare needs in the past year and to say that the disruption has had a major impact on their family’s finances and stress level. These findings are consistent with a 2020 McKinsey analysis finding that Black and Latino students would disproportionately experience learning loss during the pandemic due to a variety of reasons, including a lack of access to high-quality remote learning, and high-speed internet. These disproportionate impacts of the pandemic may further widen existing gaps in academic performance for children of color.

Disparities COVID-19 Vaccinations among Children

Children ages 12 and older became eligible for COVID-19 vaccination on May 10, 2021, while children under age 12 are not yet eligible for vaccination at this time. Ensuring equity in COVID-19 vaccinations among children is important for mitigating the disproportionate impacts of COVID-19 and preventing widening disparities going forward. Moreover, because children make up a significant share of the population and are more racially diverse than the rest of the population, equitable vaccination among this group is key for achieving an overall high rate of vaccine coverage among the population and may help to reduce disparities in vaccination rates more broadly.

There is a dearth of data to examine vaccination rates by race/ethnicity among children, but the available data point to potential racial disparities in vaccinations among children. As of September 7, 2021, federal data were not available on vaccinations among children by race/ethnicity and just seven states were reporting these data. White children had higher vaccination rates than Black children in all seven reporting states, although the size of these differences varied widely across states (Figure 2). The vaccination rate for White children was higher than the rate for Hispanic children in two states (Connecticut, and Wisconsin), although the differences between rates were generally smaller than the differences in rates between White and Black children. Hispanic children had a similar or higher vaccination rate than White children in the remaining five states. In the five states for which we were able to calculate vaccination rates for Asian children, the rate for Asian children was higher compared to that of White children.

Figure 2: Percent of Children Who Have Received a COVID-19 Vaccine Dose by Race/Ethnicity, September 7, 2021

KFF COVID Vaccine Monitor data show that Hispanic and Black parents are more likely than White parents to report potential access barriers to vaccination. Across racial/ethnic groups, the top concerns about the COVID-19 vaccine for parents of unvaccinated teens center around the potential for long-term or serious side effects in children. However, consistent with surveys of adults, Hispanic and Black parents are more likely than White parents to cite concerns that reflect access barriers to vaccination, including not being able to get the vaccine from a trusted place, believing they may have to pay an out-of-pocket cost, or having difficulty traveling to a vaccination site. A larger share of Hispanic parents than White parents also reports being concerned about needing to take time off work to get their child vaccinated.

Ensuring equity in vaccinations when children under the age of 12 become eligible for vaccination will be particularly important given the size and racial diversity of this group. There are 48 million children under the age of 12 in the United States, almost three times the number of adolescents, aged 12-15, who became eligible in May 2021. About half (50.5%) of children under the age of 12 are children of color, including more than a quarter (25.8%) who are Hispanic. An additional 13.3% are Black, 4.7% are Asian, and the remaining 6.7% are American Indian or Alaska Native, Native Hawaiian or Other Pacific Islander, or multiracial Some states have even larger shares of children of color.

Looking Ahead

Together these data suggest that COVID-19 has disproportionately negatively affected the physical and mental health, academic growth, and economic security of children of color. At the same time, the limited data available to date suggest some children of color may be less likely to receive a COVID-19 vaccine, leaving them at elevated risk as the virus continues to spread and as many return to in-person school.

Exposure risk associated with returning to in-person school may be mitigated by policies such as requiring face masks or vaccination among staff and eligible students in schools or by providing options for virtual learning. Because many of these decisions are being made at the local level, there will be wide variation in implementation of these protections across the country. However, some decisions are being made at the state level. For example, as of September 13, 2021, 18 states were requiring face masks in schools, 28 states did not have a face mask requirement in schools, and 5 states prohibited a face mask requirement in schools. Nine states had a vaccine mandate for school employees. While most states (29) are leaving decisions about school instruction mode to the local level, 19 states have a requirement for in-person learning and 3 have a requirement for hybrid learning. This varied implementation of mitigation policies also will have important implication for disparities in COVID-19 impacts among children going forward.

Vaccines Are Free. Covid Care Is Not. Who Should Pay?

Published: Sep 16, 2021

In this commentary for Barron’s, Cynthia Cox explores the impact to the American public as the U.S. health insurance system adjusts to the COVID-19 pandemic. She uses the experience of the past year and a half to raise questions about broader issues of fairness in the distribution of health care costs in the country.

Key Issues and Questions for PEPFAR’s Future

Authors: Jennifer Kates, Alicia Carbaugh, and Mike Isbell
Published: Sep 15, 2021

Key Findings

The Biden administration has inherited PEPFAR at a critical time for the program and the fight against HIV, and PEPFAR is at a turning point. Much has changed since the program was created in 2003, including important shifts in global HIV burden, a substantial expansion of the array of validated HIV prevention and treatment tools, and notable changes in the global health and development landscape. In addition, the program awaits the nomination by the President of a new Coordinator, is preparing a new five-year, Congressionally-mandated strategy, and, in two years, is due to be reauthorized by Congress. At the same time, the fight against HIV/AIDS is far from over and the COVID-19 pandemic has presented new health and economic challenges for PEPFAR countries.

This policy brief explores key issues and poses questions regarding PEPFAR’s future, providing a roadmap for the major decisions ahead for the program. It identifies eight key, interrelated issues facing the administration, Congress, and other PEPFAR stakeholders, as follows:

  1. Addressing the short- and long-term impacts of COVID-19 on PEPFAR and the HIV response. COVID-19 continues to have profound health and economic effects in the countries that receive PEPFAR support and there is uncertainty about the future. While early actions by PEPFAR appear to have helped minimize treatment disruptions, COVID-19 has also presented the program with new challenges and questions, including the extent to which COVID-19 might set back PEPFAR’s progress, administrative and legislative actions that can be taken to mitigate impact and make-up lost ground, and whether the PEPFAR platform can be used more directly to address COVID-19 through vaccine delivery and other interventions.
  2. PEPFAR funding and bipartisan support. PEPFAR funding has been mostly stagnant for more than a decade, even as the number of people needing HIV treatment has increased and new infections remain high. In addition, other donors have reduced their HIV funding in recent years and countries that receive PEPFAR support have faced challenges in mobilizing domestic HIV resources. Whether funding for PEPFAR will be increased, or even sustained, will in part depend on its ability to maintain bipartisan support, which has been one of its hallmarks to date. Ultimately, many of the decisions facing the program will hinge on future funding levels, as well as the broader HIV financing landscape.
  3. PEPFAR’s geographic footprint, service portfolio, and population focus. Among the main programmatic levers available to PEPFAR to address the HIV epidemic are its geographic focus, the set of interventions it supports, and the population groups it prioritizes. Decisions in these areas have reflected a variety of factors over time, including HIV epidemiology, scientific advances, political and diplomatic considerations, and funding. Going forward, many of these same factors will likely affect PEPFAR’s strategic choices in these three interrelated areas. Other considerations may also come into play, including, for example, the extent to which a focus on promoting equity in access to HIV services might be incorporated into such decisions.
  4. The role of community and civil society in PEPFAR and the HIV response. Since the onset of the HIV epidemic, communities, including people living with HIV, have played a key role in the HIV response – as advocates, providers of services, and accountability watchdogs. The participation of civil society in PEPFAR’s policy development and programming has a long history, one which has increased and become more formalized over time and is unique among other areas of global health and development. In addition to strengthening PEPFAR’s immediate efforts, the inclusion of community and civil society could affect the longer-term sustainability of programs in countries. As such, how PEPFAR seeks to further build upon and sustain its support for community-led HIV responses will have important implications for the program’s future.
  5. PEPFAR, epidemic control, and the long-term sustainability of the HIV response. Although PEPFAR was designed from the outset as an emergency response, the importance of building sustainable capacity in countries was recognized as a priority at its early stages and has been underscored over time. Still, how best to define and sustain long-term success remains a challenge for PEPFAR, as well as for other HIV donors. It is not yet clear what the scope and nature of U.S. assistance might be after a country achieves epidemic control or other program targets or how to sustain progress and guard against shocks. Ultimately, how best to promote sustainability and country ownership, including whether PEPFAR should consider instituting formal transition plans or criteria for determining when and at what pace to draw down support, are key questions for the future.
  6. PEPFAR’s role in global health security and broader health systems strengthening. The COVID-19 pandemic has intensified attention to shoring up U.S. global health security efforts and creating more resilient health systems. It is unclear what this will mean for PEPFAR, and any major actions could pose both opportunities and risks for the program. As the first and largest U.S. global health program specifically designed to address a pandemic, PEPFAR could offer key lessons for broader U.S. pandemic preparedness efforts and potentially be integral to such efforts. However, an increased focus on health security more generally could conceivably crowd out other global health investments and reduce the emphasis on HIV, even when tremendous need still exists.
  7. PEPFAR and the Global Fund to Fight AIDS, Tuberculosis and Malaria. The U.S. has played an integral role in the Global Fund since its inception, including providing the Global Fund with its founding contribution, serving as its single largest donor, and being active in the organization’s governance and oversight. The Global Fund, in turn, extends the reach of PEPFAR into more countries and populations. PEPFAR and the Global Fund work quite differently, however. Given how critical both PEPFAR and the Global Fund are to the HIV response, there may be opportunities for the U.S. government to rethink and strengthen their relationship going forward, including through more proactive and strategic coordination, particularly given concerns about future financing for HIV.
  8. PEPFAR’s structure and location within the U.S. government’s global health architecture. When PEPFAR was first created, locating it at the State Department and providing its Coordinator with the power to oversee all U.S. global HIV investments, as specified in its authorizing legislation, marked a departure from the way in which U.S. global health programs had been previously structured. Some have argued that PEPFAR’s location and structure should be reconsidered to further its transition from an “emergency” program to one more focused on long-term development and to better integrate activities across the U.S. global health portfolio.1  Others, citing the program’s broadly recognized positive impact on the HIV response, have argued that it is important to keep the current structure, and that moving PEPFAR would present significant risks, including threatening the HIV response and diluting PEPFAR’s diplomatic role.2  Whether or not PEPFAR’s structure is reconsidered by policymakers, particularly in the context of an increasing focus on global health security, is likely to remain a key question facing the program’s future.

Issue Brief

Browse by Issue:

  1. Addressing the short- and long-term impacts of COVID-19 on PEPFAR and the HIV response.
  2. PEPFAR funding and bipartisan support.
  3. PEPFAR’s geographic footprint, service portfolio, and population focus.
  4. The role of community and civil society in PEPFAR and the HIV response.
  5. PEPFAR, epidemic control, and the long-term sustainability of the HIV response.
  6. PEPFAR’s role in global health security and broader health systems strengthening.
  7. PEPFAR and the Global Fund.
  8. PEPFAR’s structure and location within the U.S. government’s global health architecture.

Introduction

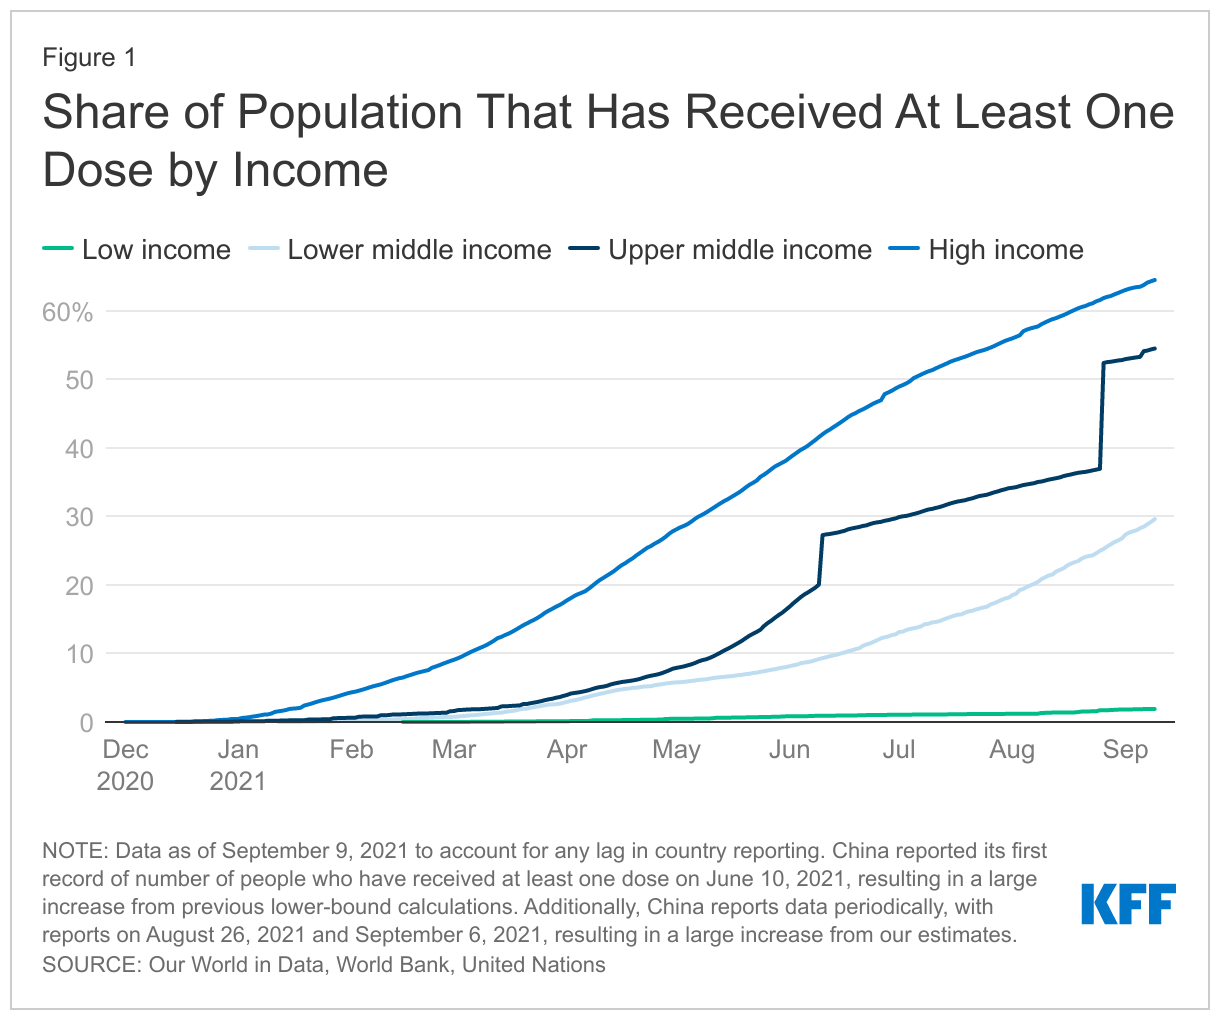
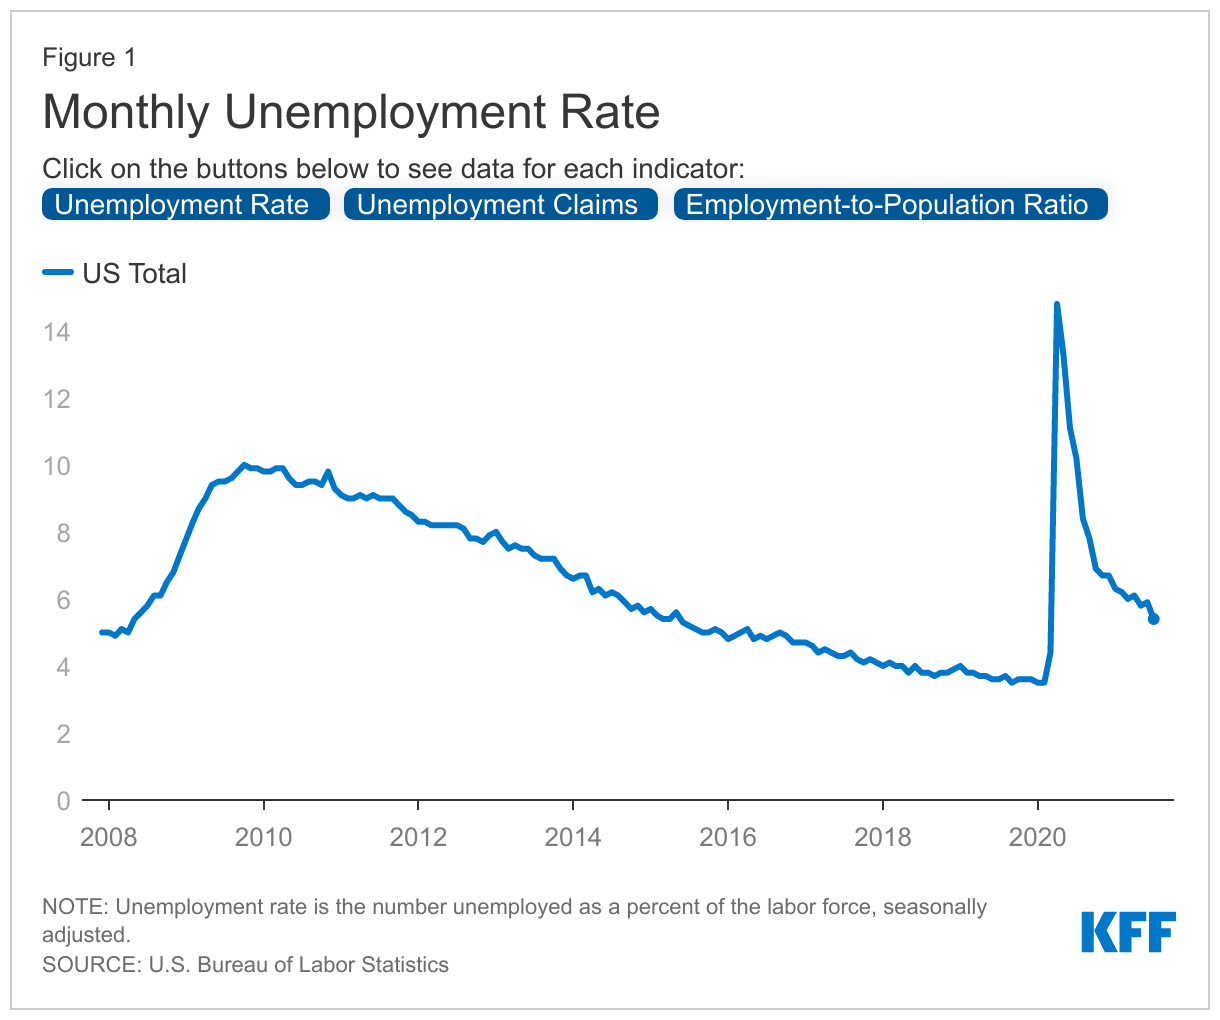
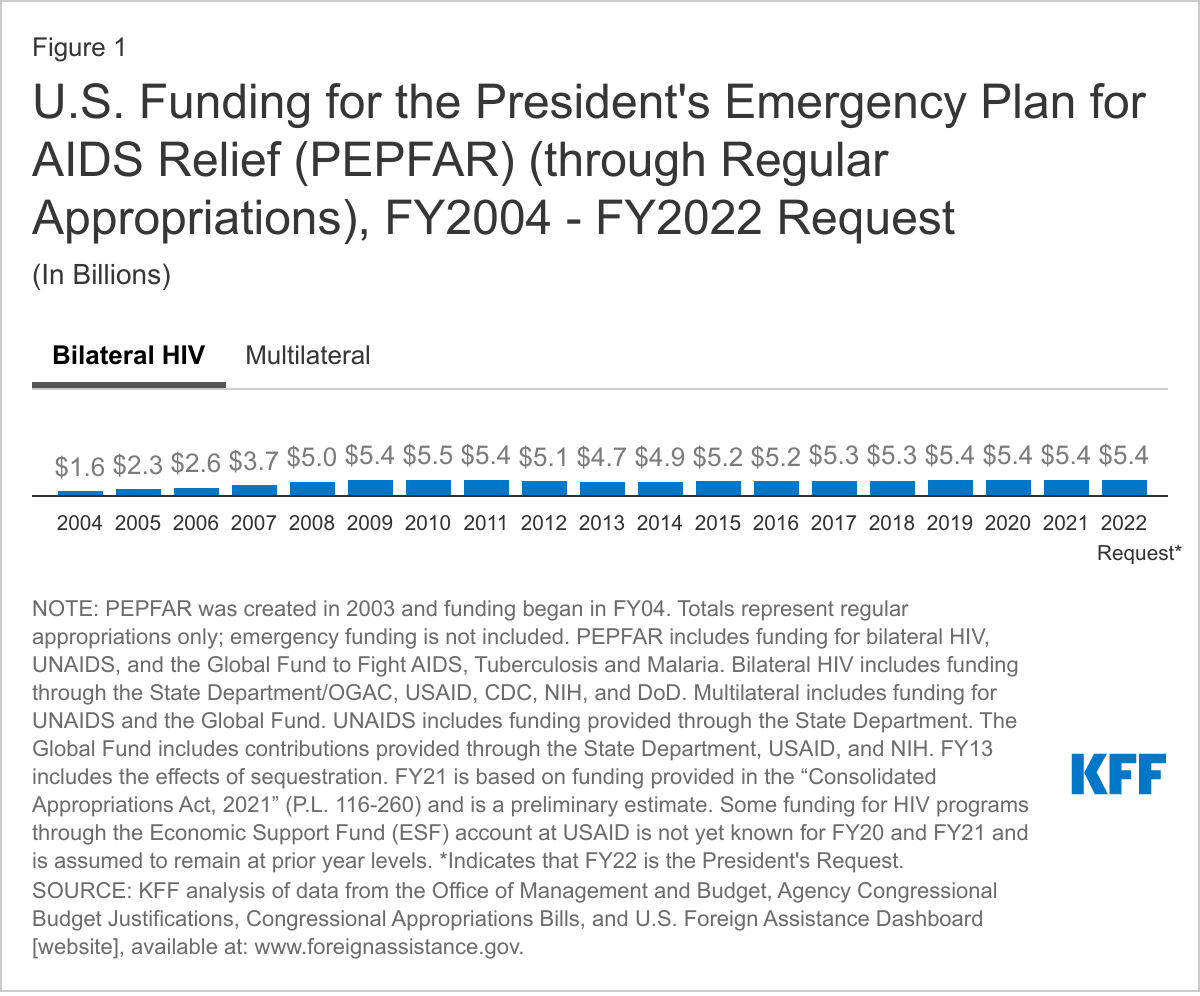
The Biden administration has inherited the President’s Emergency Plan for AIDS Relief (PEPFAR) at a critical time for the program and the fight against HIV, as it faces important strategic decisions and new challenges, not the least of which being the continuing impact of COVID-19. PEPFAR, the U.S. government’s signature global health effort, is broadly regarded as one of the most successful programs in global health history. Conceived of as an emergency initiative and launched by President George W. Bush in 2003, when HIV was ravaging much of sub-Saharan Africa, PEPFAR, along with the creation of the Global Fund to Fight AIDS, Tuberculosis and Malaria (Global Fund), ushered in a significant increase in funding and attention to the global HIV response, with bilateral HIV funding more than tripling in the program’s initial five-year period, rising from $1.6 billion in 2004 to $5 billion in 2008 (see Figure 1).

U.S. Funding for the President's Emergency Plan for AIDS Relief (PEPFAR) (through Regular Appropriations), FY2004 - FY2022 Request

Due in no small part to sustained U.S. support, many of the countries that were being devastated by HIV at the turn of the millennium have recorded major progress in preventing new HIV infections and deaths, including a number that appear to be on the cusp of achieving PEPFAR’s epidemic control target.3  PEPFAR reports that it has saved 20 million lives, prevented millions of new HIV infections, and contributed to progress towards elimination of mother-to-child HIV transmission, and a number of external analyses and evaluations have documented its impact (see Box 1 for additional PEPFAR results).4 ,5 ,6 

Box 1: PEPFAR Reported Results
  • Countries Reached: 50+
  • People Receiving Antiretroviral Treatment (as of September 2020): 18.2 million
  • Babies Born Free of HIV (as of September 2020): 2.8 million
  • New Health Care Workers Trained (as of September 2020): 290,000
  • People Receiving HIV Testing Services (in FY2020): 50 million
SOURCE: U.S. Department of State, PEPFAR Latest Global Results; June 2021.

However, PEPFAR is at a turning point. Much has changed since the program was created, including important shifts in the global HIV burden, a substantial expansion of the array of validated HIV prevention and treatment tools, and notable changes in the global health and development landscape. The lens through which the HIV response is viewed has also shifted, with a growing focus on addressing inequalities and promoting equity, principles endorsed, for example, in a new UNAIDS global AIDS strategy.7  In addition, over the last year, COVID-19 has upended the world in fundamental ways that have affected the HIV response and have important implications for future directions of global health more broadly. Institutionally, PEPFAR awaits the nomination by the President of a new Coordinator, is preparing a new five-year, Congressionally-mandated strategy and has released principles and a vision for this strategy (see Table 1)8 ,9  and, in two years, will be considered by Congress for reauthorization (initially authorized in 2003, the program has been reauthorized three times, the most recent of which extends through 2023) (see Table 2).10 

Table 1: Key Elements of Current & Forthcoming PEPFAR Strategies
PEPFAR Strategy for Accelerating HIV/AIDS Epidemic Control (2017-2020)Guiding Principles for the Next Phase of PEPFAR (Released December 2020)PEPFAR Strategy: Vision 2025(September 2021 “2.0” Draft)
  • Focused on achieving epidemic control in 13 high-burdened countries, with ultimate goal of ending the HIV epidemic
  • Aligned with UNAIDS 90-90-90 framework
  • Action steps:
    • Accelerate optimized HIV testing and treatment strategies
    • Expand HIV prevention
    • Use epidemiologic and cost data to improve partner performance and increase program impact
    • Renew engagement with faith-based organizations and private sector
    • Strengthen policy and financial contributions by partner governments
  • Focused on ending AIDS as a public health threat by 2030 (Sustainable Development Goal 3)
  • Key principles:
    • Deliver inclusive, people-centered HIV prevention and treatment services
    • Support resilient and capacitated partner country health and community systems, communities, and local partners
    • Partner for greater impact, burden sharing, and sustainability
  • Vision to “achieve sustained epidemic control of HIV by supporting equitable health services and solutions, enduring national health systems and capabilities, and lasting collaborations”
  • Aligned with UNAIDS Global AIDS Strategy 2021-2026 and 95-95-95 framework, as well as post-2022 Global Fund Strategy
  • Under strategy, PEPFAR aims to ensure that supported countries have, by 2025:
    • Reached UNAIDS 95-95-95 treatment targets for all populations; sustain progress in countries that have already achieved targets
    • Reduced new HIV infections, particularly in key populations, adolescent girls and young women, key populations, children
    • Institutionalized data use, systems, and community-led approaches in place to monitor and address new infections in key populations and younger populations
    • Made significant gains toward addressing societal challenges that impede HIV progress, including stigma and discrimination and gender-based inequalities
    • Developed benchmarks that support enabling policies and systems in countries to increase domestic capacity to deliver services
SOURCES: U.S. Department of State, “Strategy for Accelerating HIV/AIDS Epidemic Control (2017-2020),” 2017; U.S. Department of State, “Guiding Principles for the Next Phase of PEPFAR,” 2020; U.S. Department of State, “Draft Overview – PEPFAR Strategy: Vision 2025,” September 2021.
Table 2: PEPFAR Legislation
Full TitleCommon TitlePublic Law #Years
United States Leadership Against HIV/AIDS, Tuberculosis, and Malaria Act of 2003“The Leadership Act”P.L. 108-25FY 2004 - FY 2008
Tom Lantos and Henry J. Hyde United States Global Leadership Against HIV/AIDS, Tuberculosis, and Malaria Reauthorization Act of 2008“The Lantos-Hyde Act”P.L. 110-293FY 2009 - FY 2013
PEPFAR Stewardship and Oversight Act of 2013“The PEPFAR Stewardship Act”P.L. 113-56FY 2014 - FY 2018
PEPFAR Extension Act of 2018“The PEPFARExtension Act”P.L. 115-305FY 2019 - FY 2023

At the same time, the fight against HIV/AIDS is far from over. In 2020, 1.5 million people were newly infected with HIV, and the pace of decline in new HIV infections has slowed.11  HIV remains the number one cause of death among those ages 15 to 49 in sub-Saharan Africa, is the number one cause of death among women of reproductive age worldwide, and, more broadly, is a leading cause of death globally.12  There are still many countries, including PEPFAR countries, which have fallen short of key global HIV targets.13 ,14  Moreover, funding to address HIV in low- and middle-income countries (LMICs) has stagnated at levels that are below estimated need,15  threatening further progress.16 

At this inflection point for PEPFAR and the broader fight against HIV, this policy brief explores key issues and questions regarding PEPFAR’s future that, depending on how they are addressed, could shape the program’s long-term vision, goals, strategies, measures of success, and implementation moving forward, as well as the future of the broader global HIV response. Eight key interrelated issues facing policymakers, PEPFAR leadership, and others were identified. These are explored in greater detail below, providing background and context and elaborating on key strategic choices confronting PEPFAR in the coming years:

  1. Addressing the short- and long-term impacts of COVID-19 on PEPFAR and the HIV response.
  2. PEPFAR funding and bipartisan support.
  3. PEPFAR’s geographic footprint, service portfolio, and population focus.
  4. The role of community and civil society in PEPFAR and the HIV response.
  5. PEPFAR, epidemic control, and the long-term sustainability of the HIV response.
  6. PEPFAR’s role in global health security and broader health systems strengthening.
  7. PEPFAR and the Global Fund.
  8. PEPFAR’s structure and location within the U.S. government’s global health architecture.

(Back to top)

Issues & Questions

1. Addressing the short- and long-term impacts of COVID-19 on PEPFAR and the HIV response

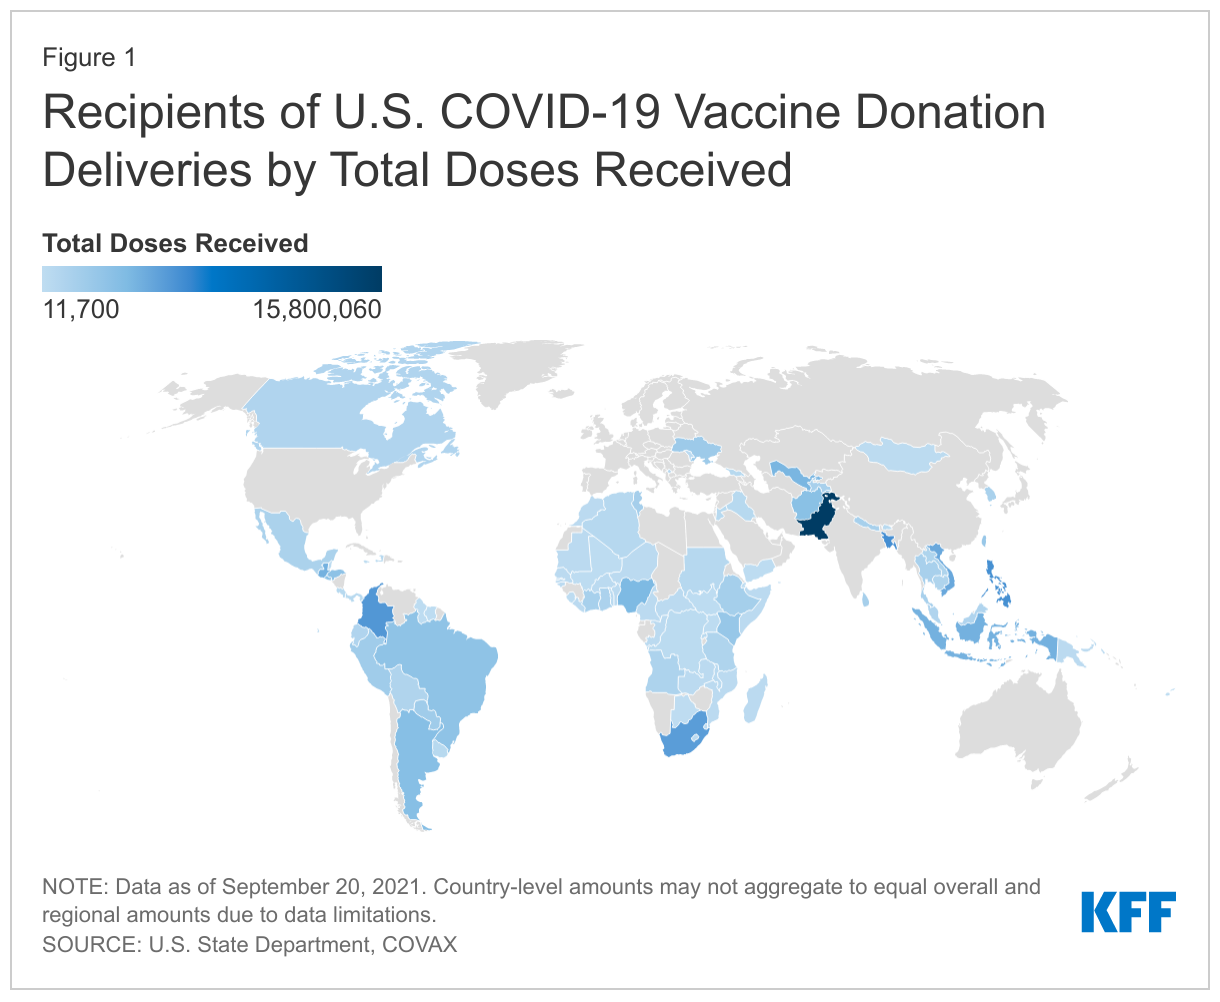
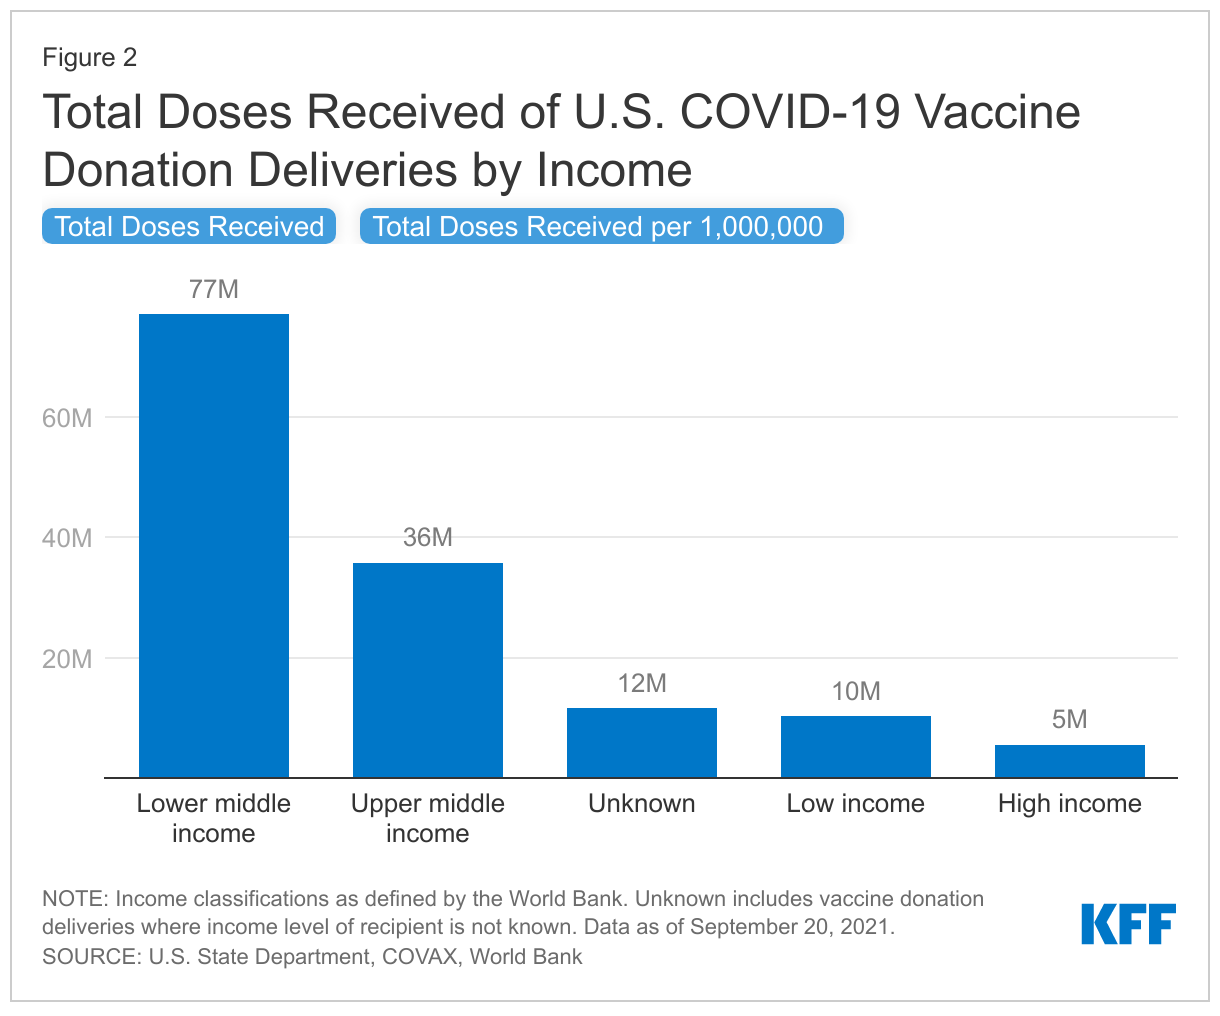
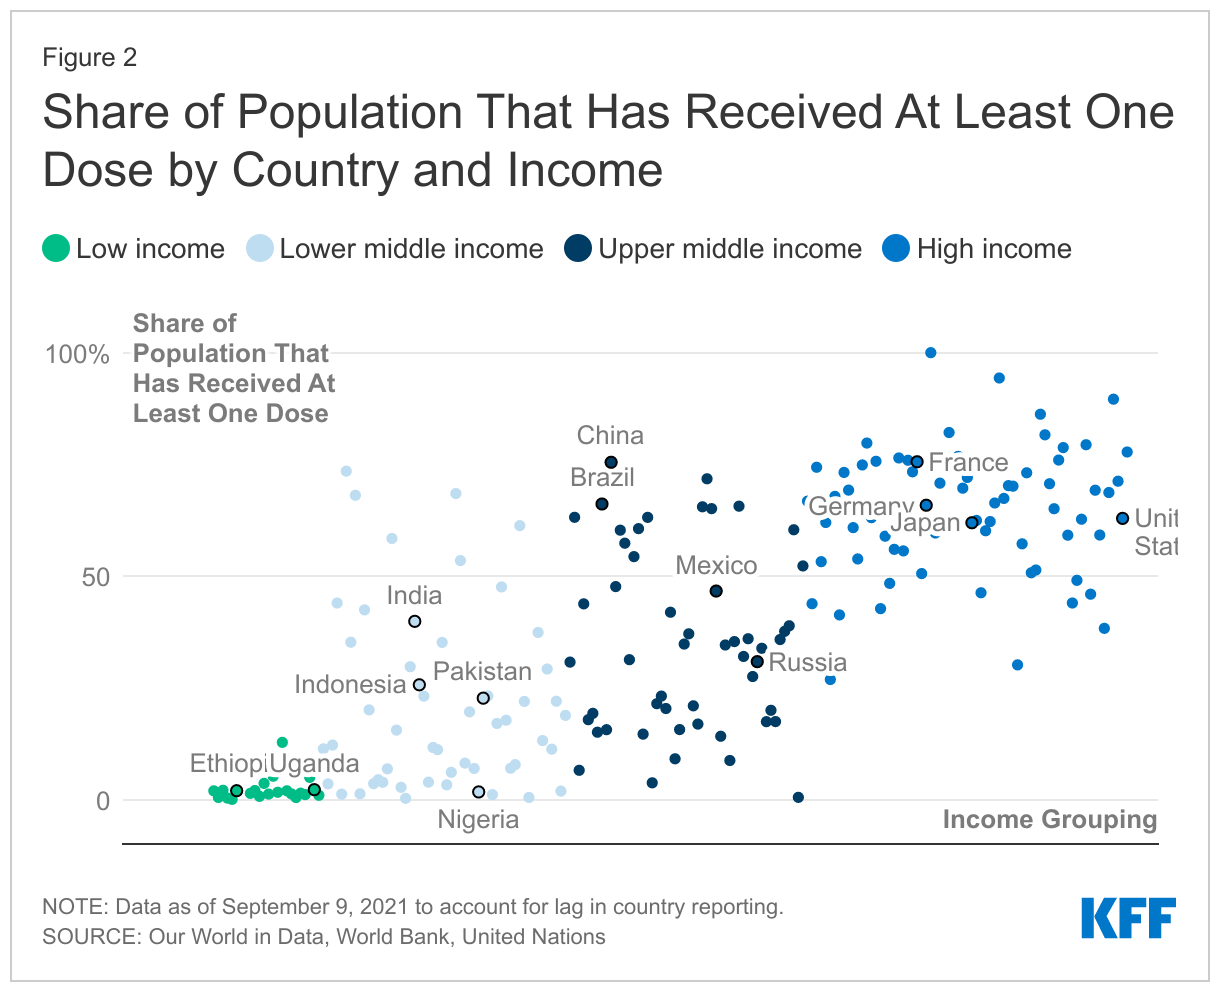
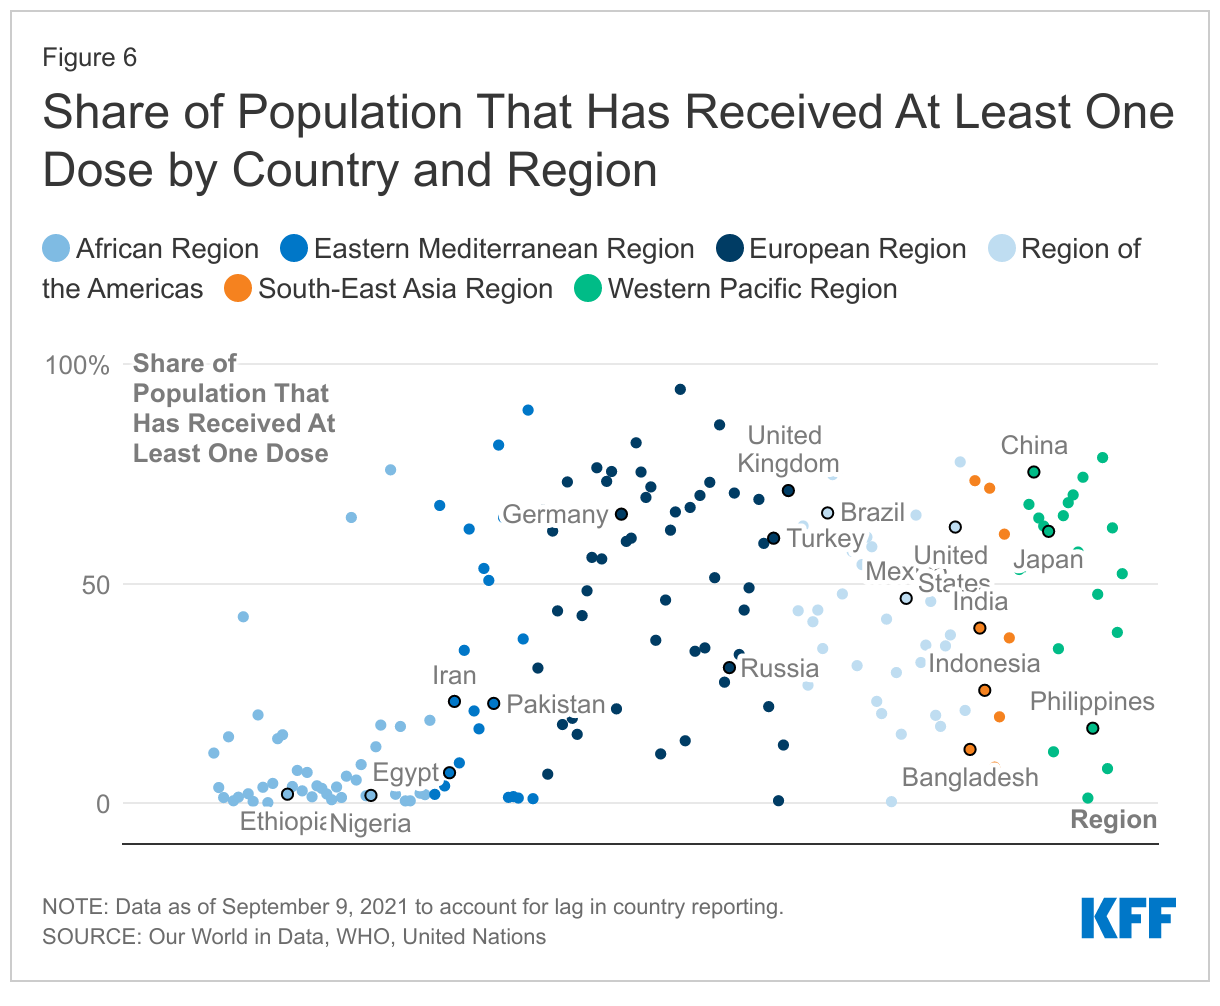
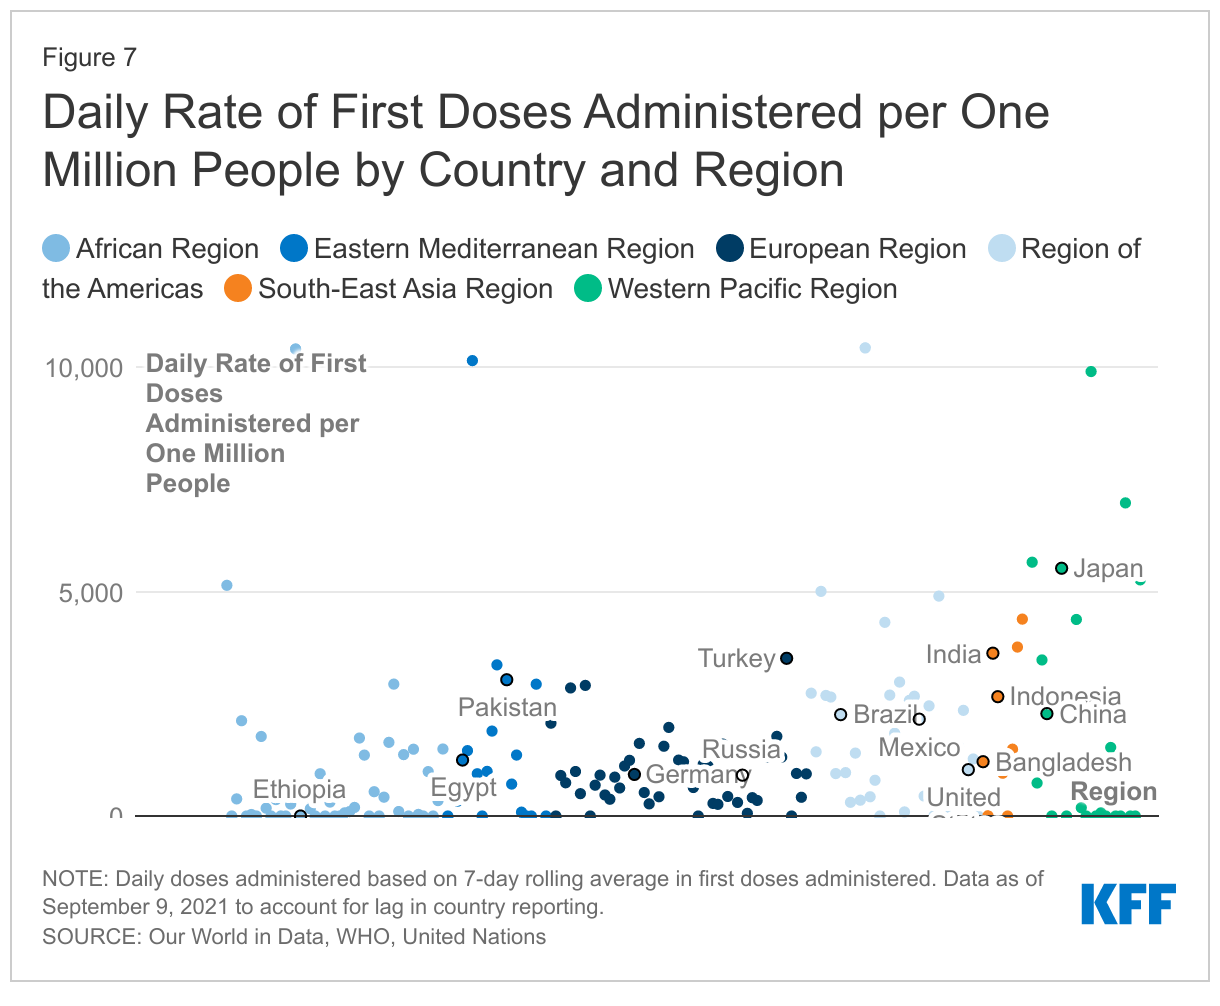
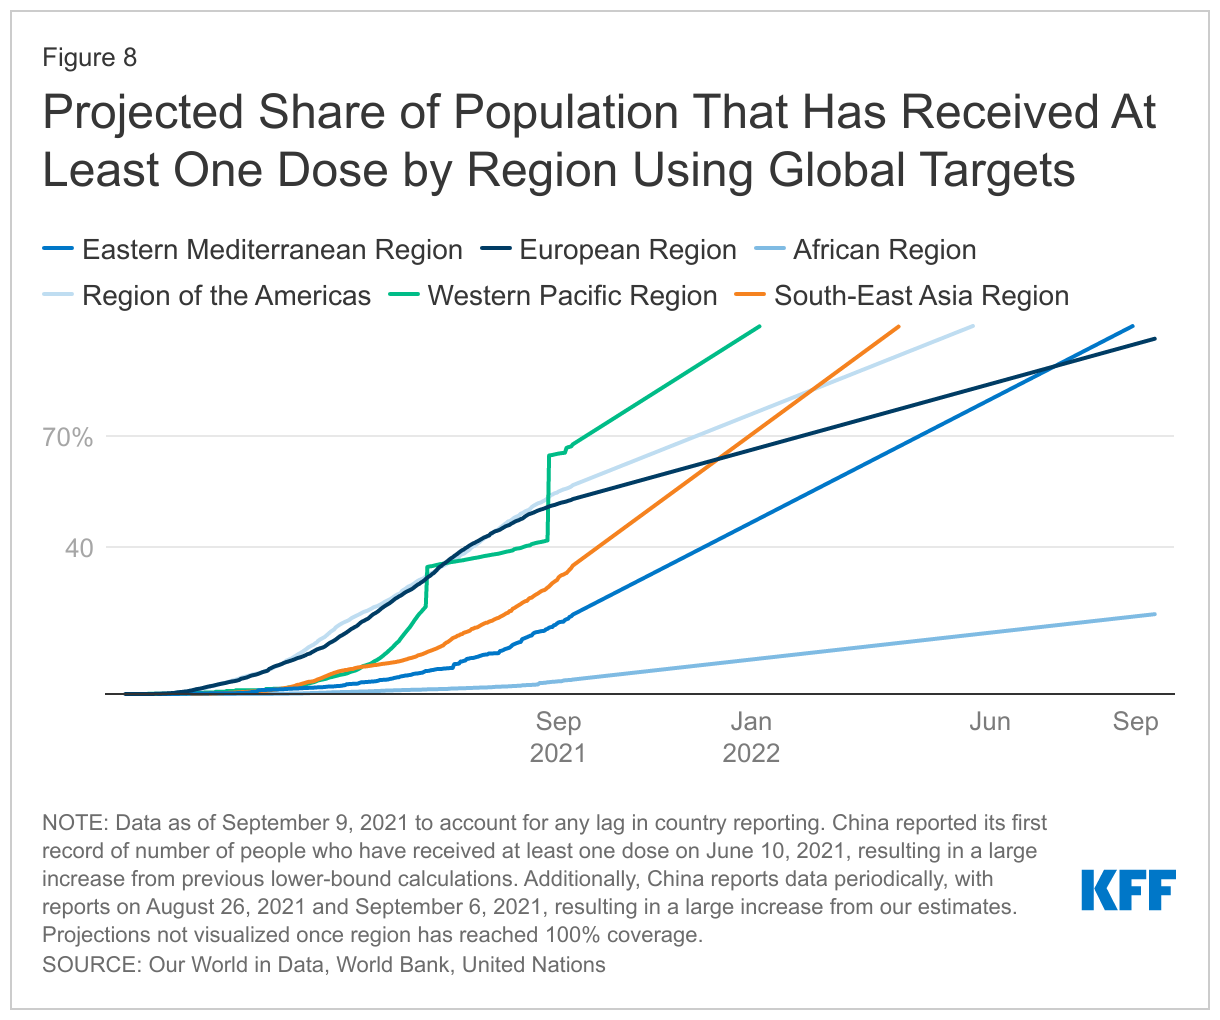
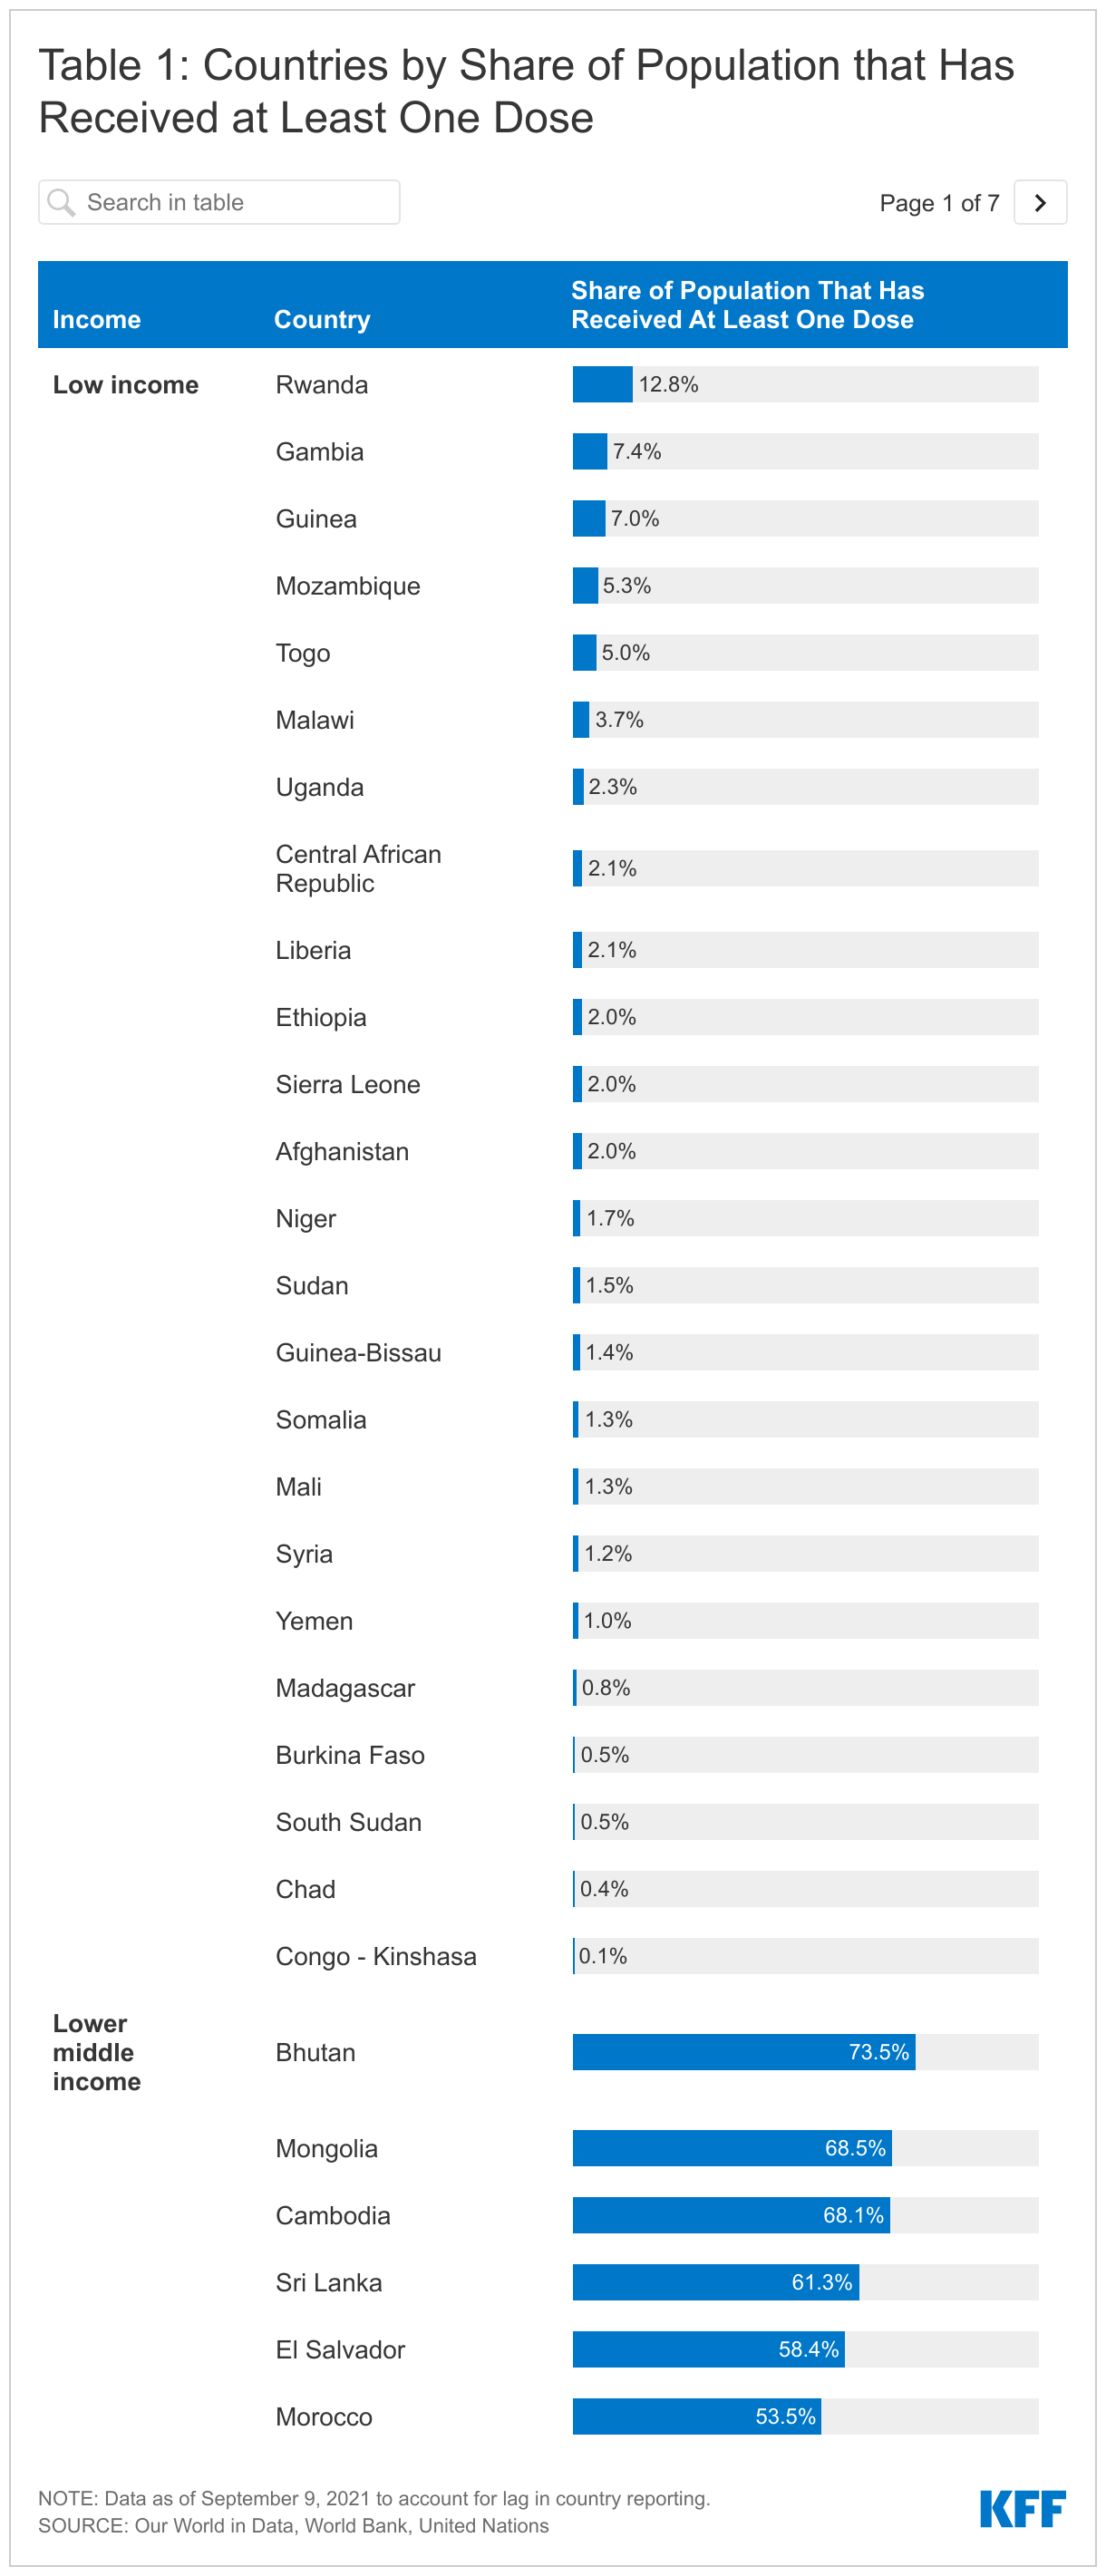
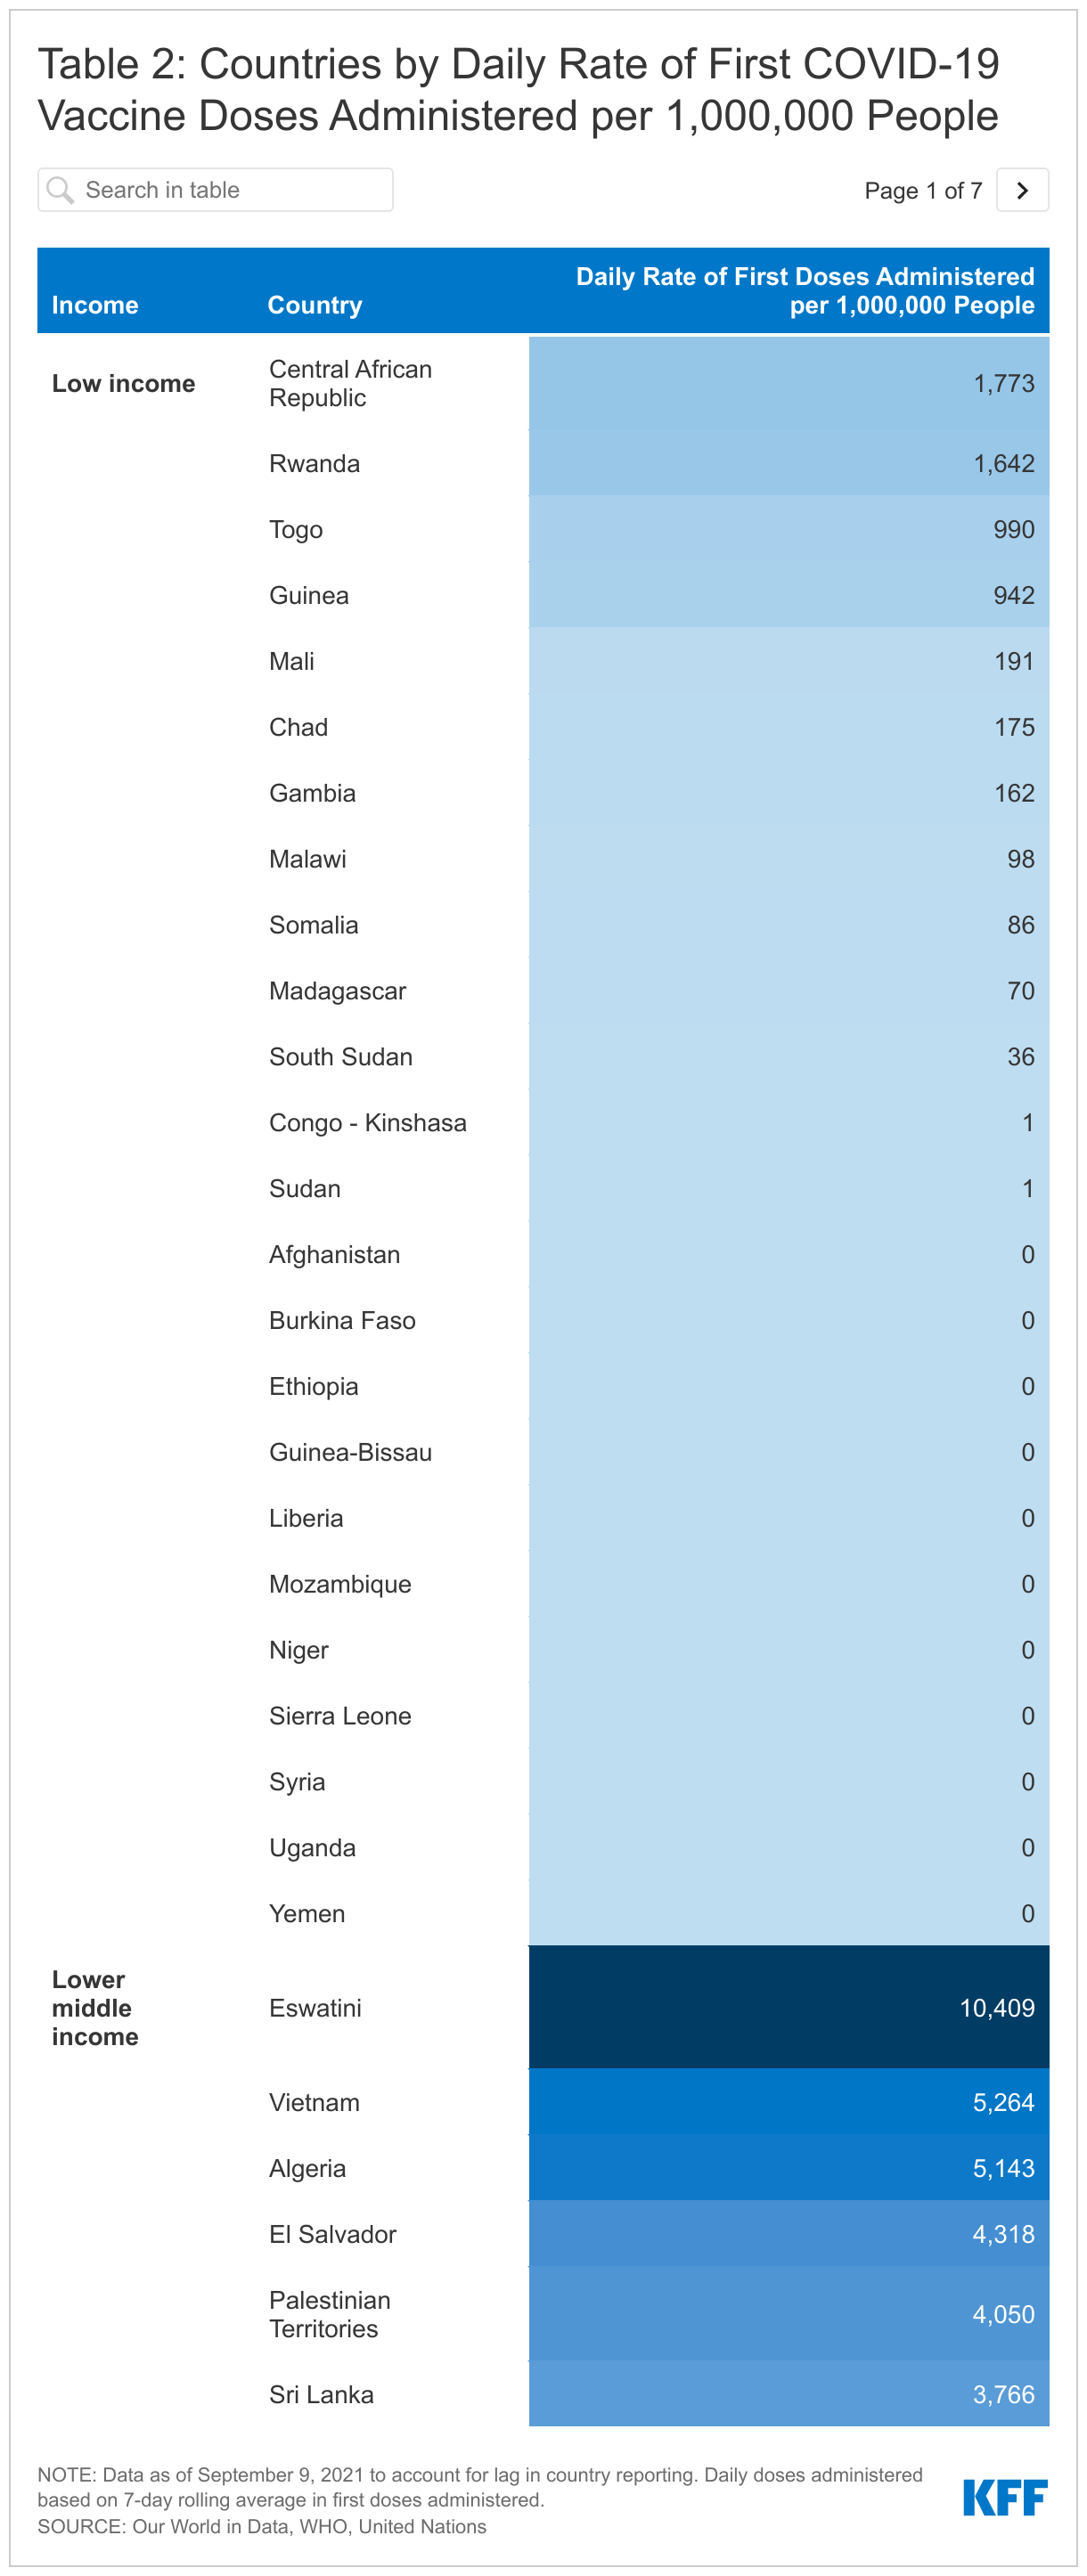
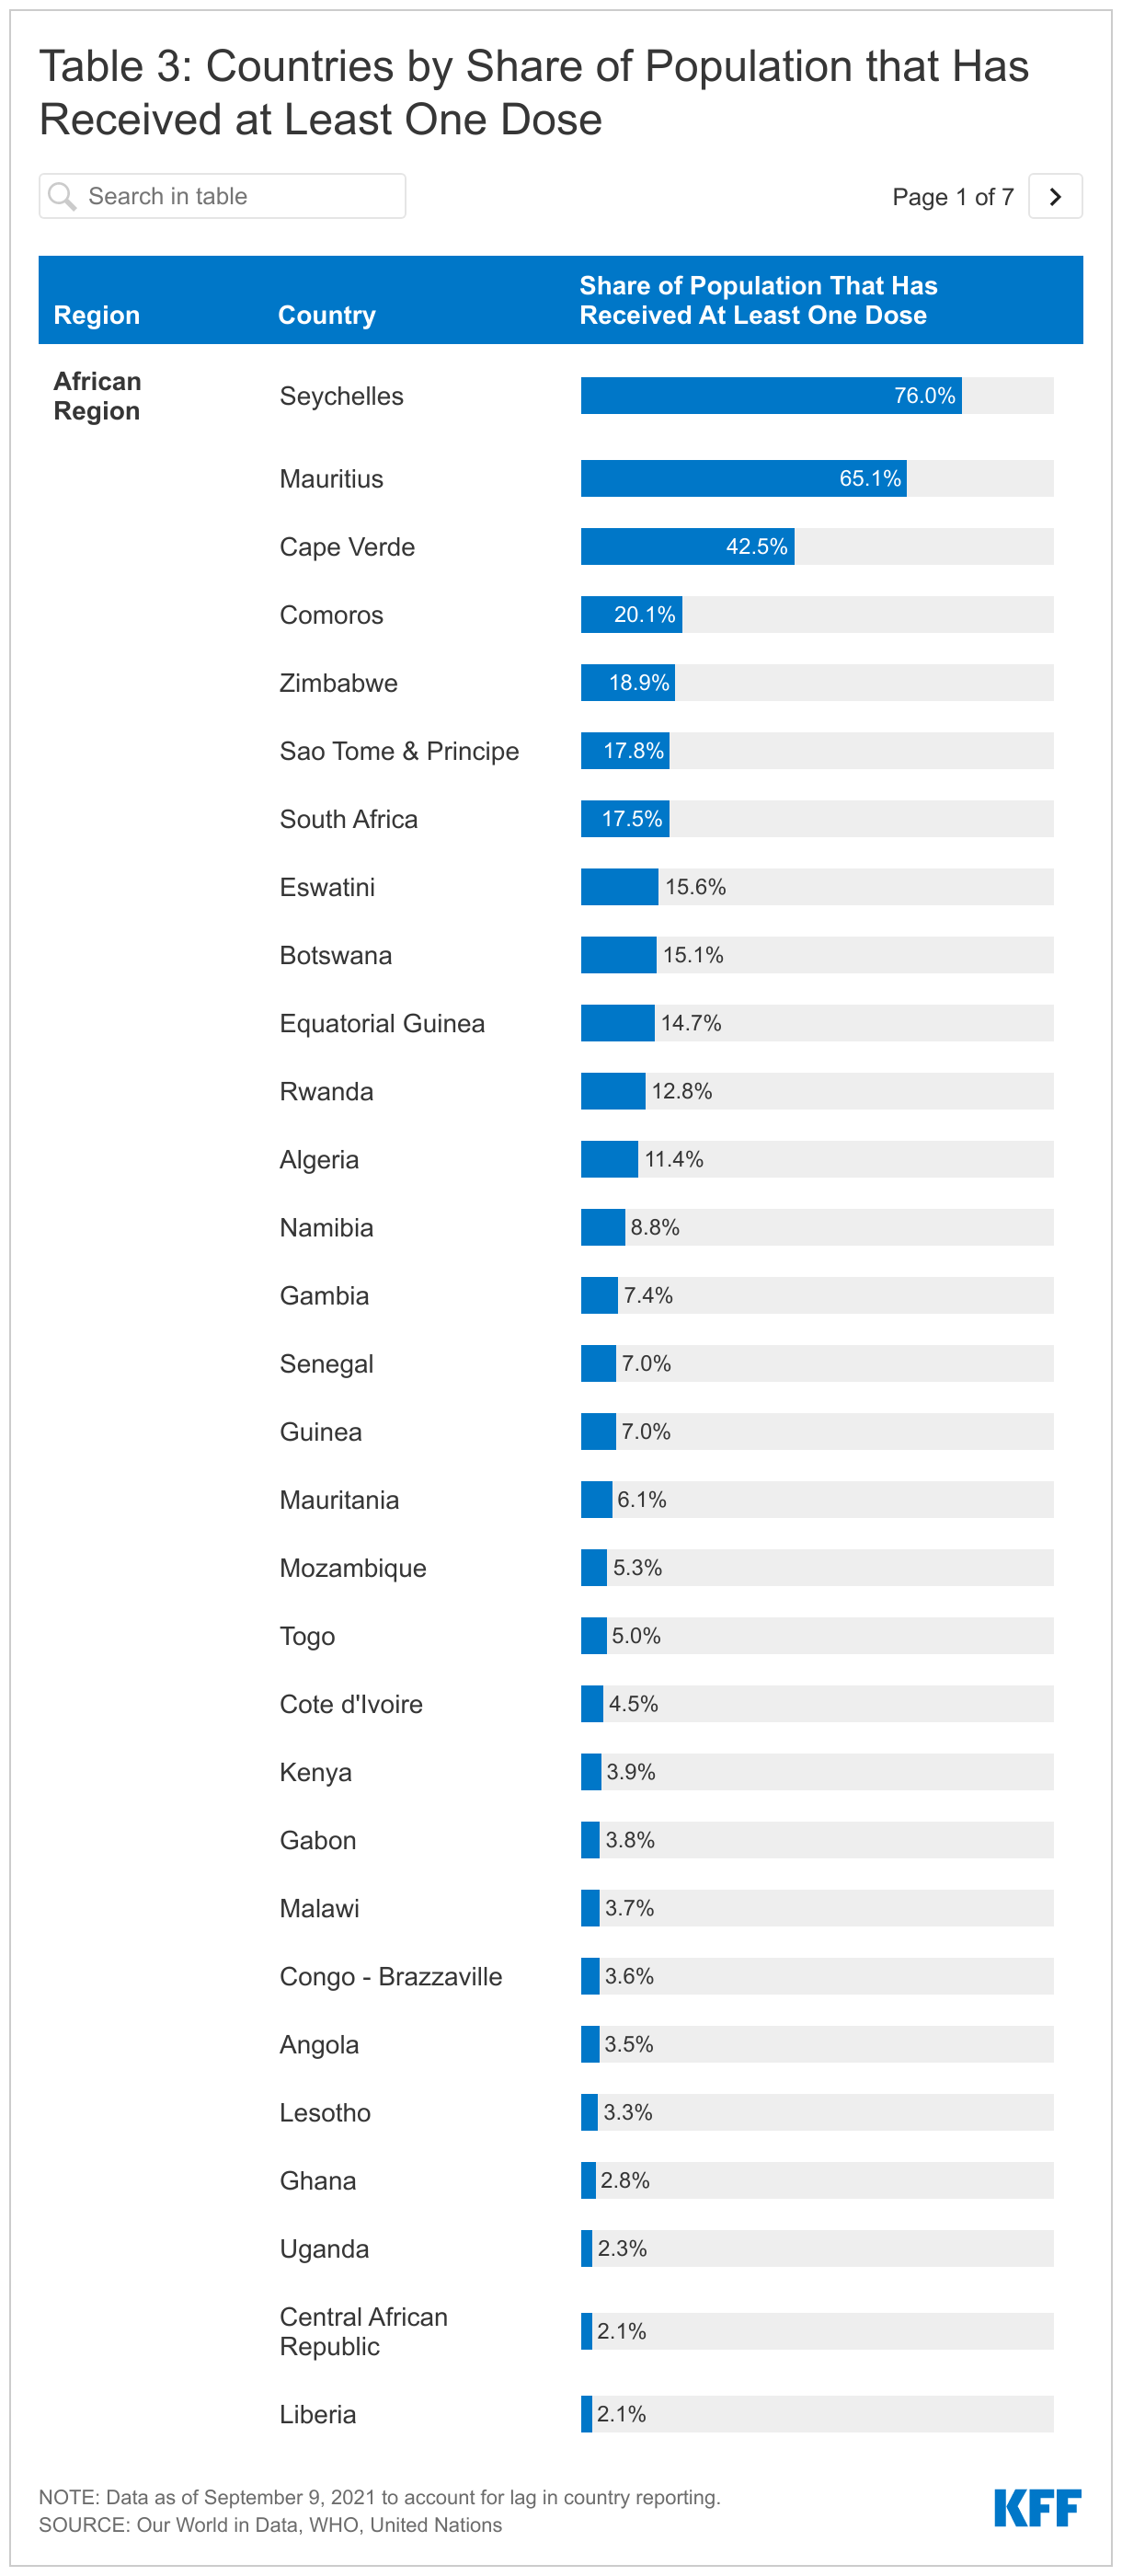
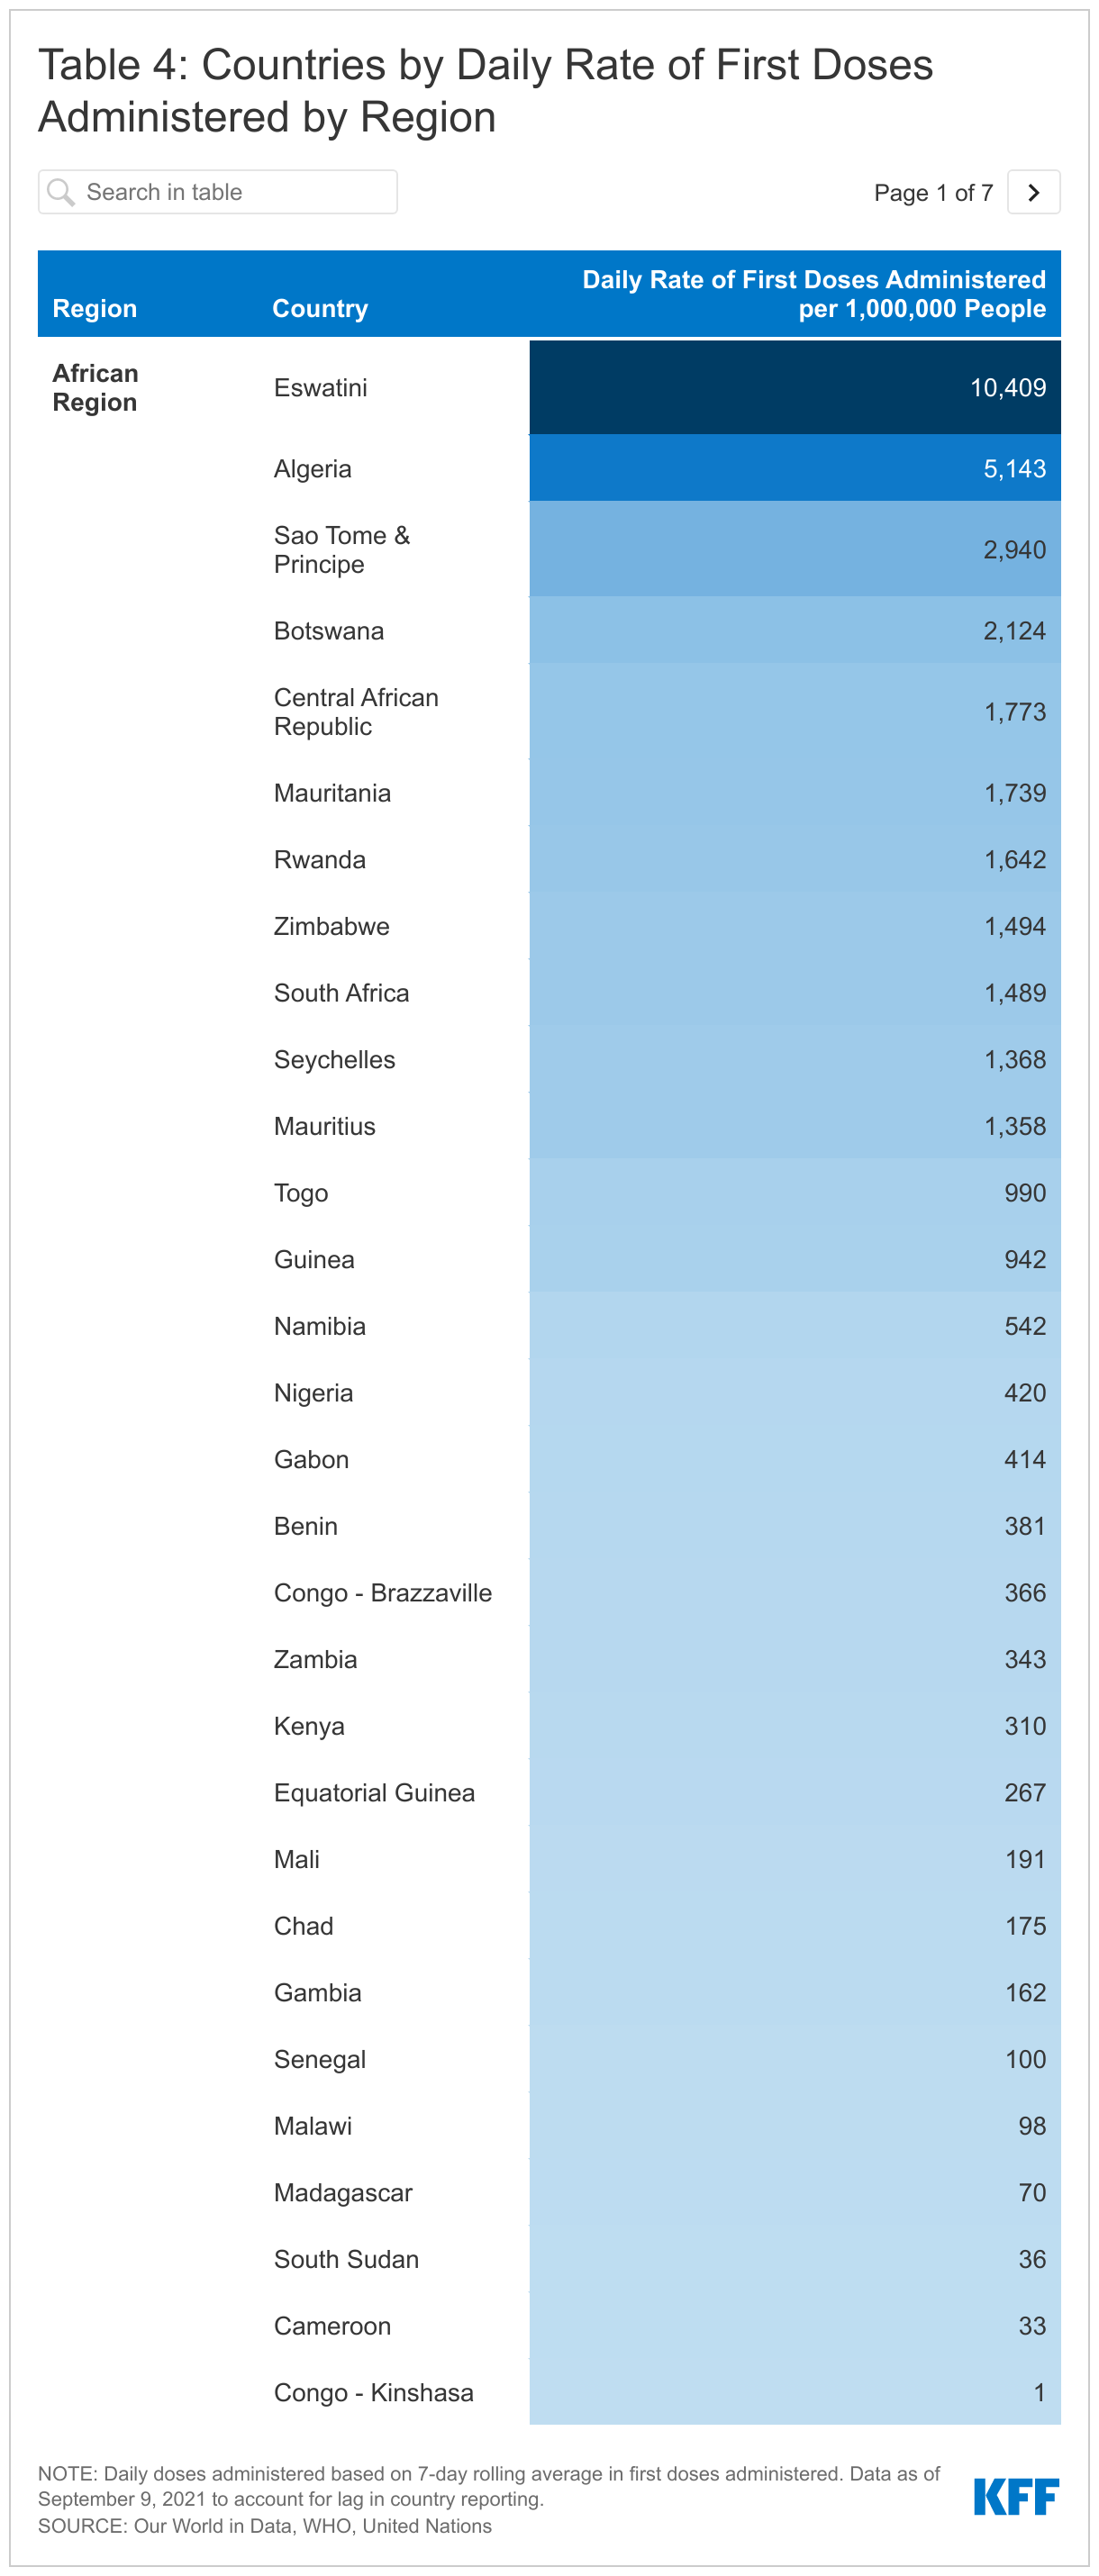
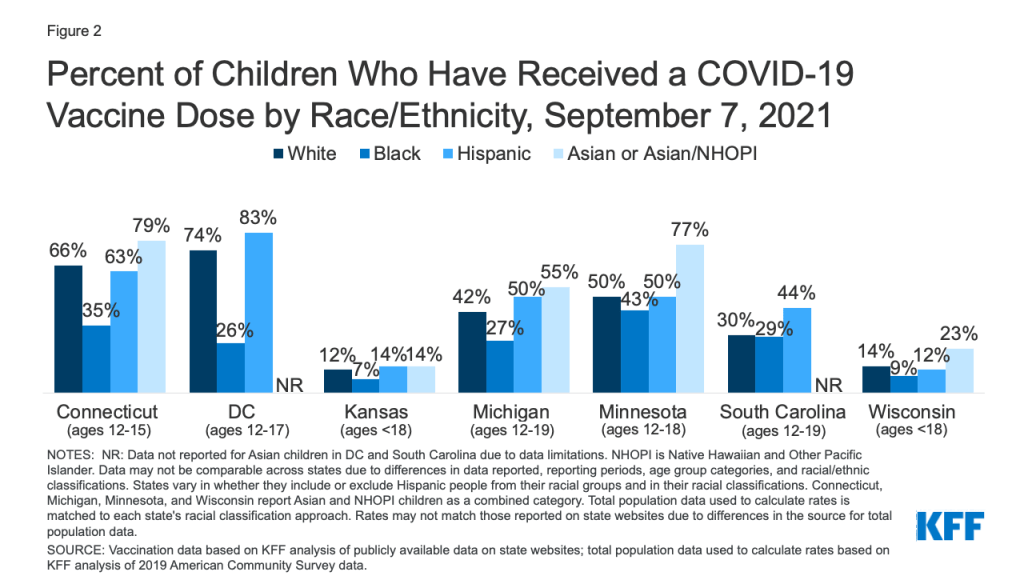
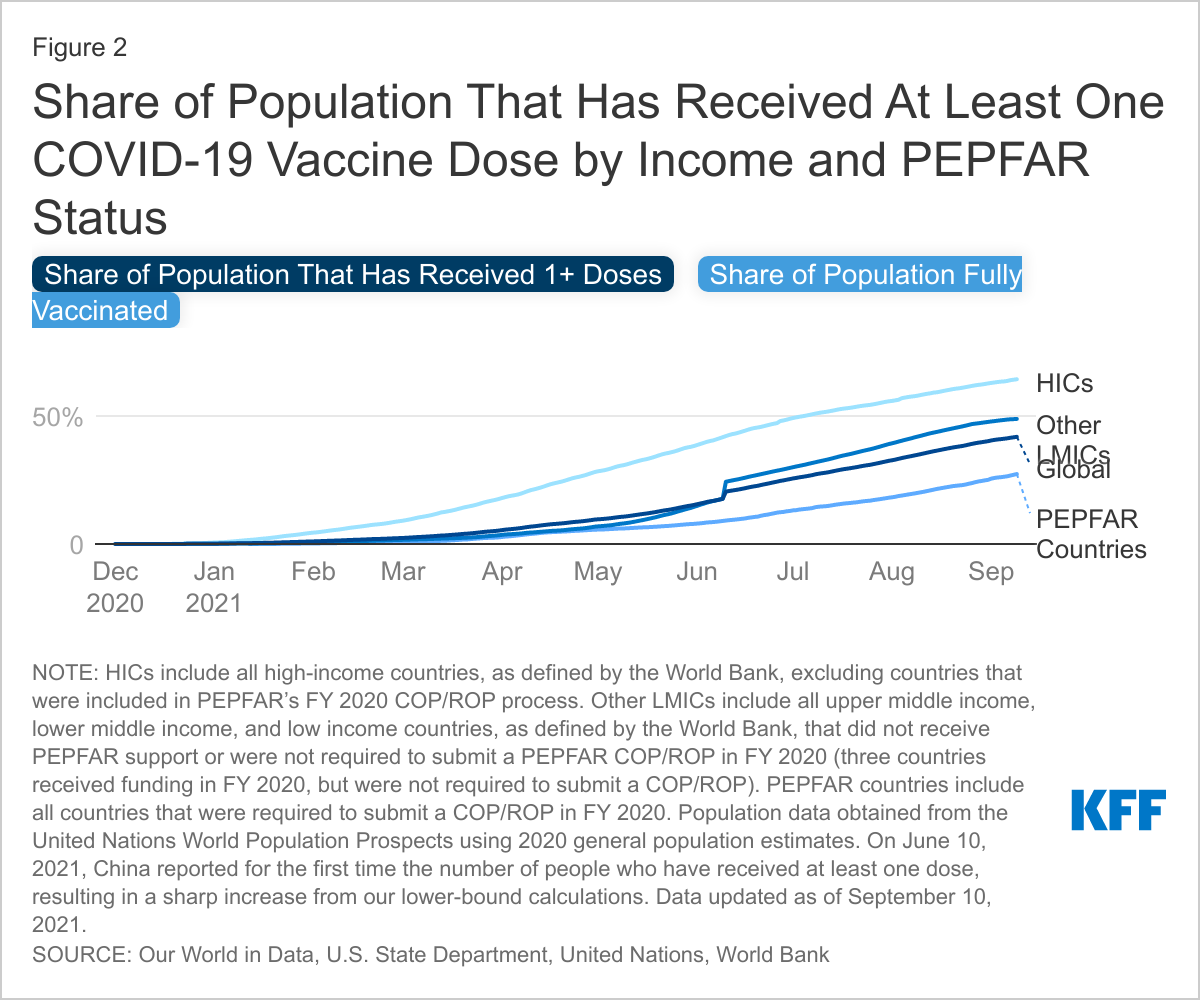
COVID-19 continues to have profound effects in the LMICs that receive PEPFAR support, where vaccination rates are markedly lower than in the U.S. (Figure 2).17  Although rates of reported COVID-19 cases and deaths are lower in sub-Saharan Africa than in many other parts of the world, some countries in the region have been harder hit.”18  Additionally, COVID-19 control measures have pushed the region into its first recession in 25 years, deepening poverty, increasing vulnerability, and challenging national budgets.19  While COVID-19 accelerated uptake of key innovations that PEPFAR has long championed, it has also presented the program with new challenges and strategic choices.

Share of Population That Has Received At Least One COVID-19 Dose by Income and PEPFAR Status

As COVID-19 emerged as a worldwide emergency, national and localized lockdowns and social distancing mandates swiftly made impossible the face-to-face encounters on which HIV services have long relied, such as clinic visits, prevention counseling, and community outreach. During the early phases of the pandemic, PEPFAR documented disruptions in HIV services, particularly for prevention, including HIV testing, voluntary male medical circumcision (VMMC), and its DREAMS initiative serving adolescent girls and young women.20 ,21  The World Health Organization,22  UNAIDS,23  and the Global Fund24 ,25  also reported service disruptions as a result of COVID-19. Beyond these direct impacts on HIV programs, indirect effects of COVID-19 could also affect the fight against HIV, including a rising incidence of gender-based violence;26  broader impacts on health systems,27  many of which were already under-resourced before COVID-19; and significant and ongoing economic hardship and financial risk28  in many of the countries in which PEPFAR works, particularly those in sub-Saharan Africa.29 

In one aspect of the HIV response – preserving access to HIV treatment services – action by PEPFAR leadership, as well as the Global Fund,30  appears to have minimized service disruptions or limited their duration.31  Shortly after the emergence of COVID-19, PEPFAR leadership issued guidance to the field that has been regularly updated, with a particular focus on ensuring continuity of care, providing program flexibility, and leveraging PEPFAR’s infrastructure to respond to COVID-19.32  PEPFAR has accelerated the use of strategies to minimize disruption and promote continuity of HIV services, such as multi-month dispensing of antiretrovirals and decentralized distribution of HIV self-testing kits; implemented new strategies, such as telemedicine; and allowed for some program flexibility in reporting requirements, staffing, and funding re-allocation.33 ,34 ,35 

PEPFAR data for many countries indicate that, thus far, there has been no decline in the number of people accessing HIV treatment services, although disruptions in HIV testing services caused declines in the number of people newly initiating HIV treatment in many settings in the first year of the pandemic.36  A recent analysis of results in six PEPFAR countries found that the level of HIV treatment interruption was actually lower during lockdowns in five of the six countries (all but Botswana), compared to pre-lockdown levels, and that the lower rate of treatment interruption persisted after lockdowns were removed.37  Disruptions to HIV prevention services, however, were more severe and longer-lasting in many countries.38 

PEPFAR’s capacity to recover ground lost as a result of COVID-19 received an important boost in March of this year, when the latest COVID-19 emergency relief bill passed by Congress39  provided the program with $250 million (Congress also provided $3.5 billion in emergency funding to the Global Fund), and PEPFAR has begun to identify how it will use these funds.40  In its National Strategy for the COVID-19 Response and Pandemic Preparedness, the White House has also said that it will seek to mitigate the secondary impacts of COVID-19 on global health programs.41  Whether these efforts will be sufficient to address the short and long-term effects of COVID-19 on the HIV response in PEPFAR countries remains to be seen, and it will likely take time to fully assess and understand the implications.

Key questions:
  • Will COVID-19 set back PEPFAR’s progress and if so, to what extent? Are there specific PEPFAR countries, or populations within countries, that are particularly vulnerable to COVID-19’s impact?
  • Should PEPFAR adjust its program targets to account for existing and potential effects of COVID-19 given challenges in vaccine access and concerns about a third wave? What actions can PEPFAR take to support countries in making up any ground lost during COVID-19, particularly on the HIV prevention front?
  • Will PEPFAR’s emergency funds from Congress be sufficient to address the primary and secondary impacts of COVID-19 on the HIV response? How flexible will these funds be?
  • Should PEPFAR be more directly involved in providing COVID-19 vaccines in the countries in which it works?
  • To what extent should Congress and the administration explore broader economic relief to aid these countries in their HIV response?
  • How did PEPFAR’s existing authorities affect its early response to COVID-19? Are adjustments needed to enhance its ability to respond to the lasting effects of COVID-19, future pandemics, or other shocks?
  • Are there ways for PEPFAR and the Global Fund to more effectively leverage each other’s strengths, resources, and reach to respond to COVID-19 and minimize the impact on HIV, as well as TB and malaria?

(Back to top)

2. PEPFAR funding and bipartisan support

Future funding levels for PEPFAR will, in many ways, structure and affect its broad direction, including many of the looming programmatic and policy decisions highlighted in this brief. As a discretionary federal program, PEPFAR depends on annual appropriations from Congress, which are not guaranteed nor tied to the number of people in need of services or the cost of those services. While the creation of PEPFAR in 2003 heralded significant increases in U.S. HIV funding to LMICs, PEPFAR funding has been mostly stagnant for more than a decade, remaining at approximately the same level in FY 2021 as in FY 2011.42 ,43  President Biden’s first budget request to Congress, released on May 28, 2021, would keep the program at this same level in FY 2022 (see Figure 1).44 

The flattening of PEPFAR funding over the past decade has occurred even as the number of people needing HIV treatment has increased and as new infections remain high. Although PEPFAR has managed to expand the number of people receiving HIV treatment services, largely through programmatic efficiencies and a pipeline of funding, the potential for further coverage gains without increased funding is uncertain. PEPFAR’s once robust funding pipeline – funding available, but not yet spent – has diminished over time, and its ability to achieve greater program efficiencies is unclear. Given that millions of people in LMICs had yet to obtain antiretroviral therapy in 2020,45  potential programmatic efficiencies on their own, by PEPFAR or others, will be insufficient to close the still-substantial HIV treatment gap (though it should be noted that the U.S. government has, in the past, stated that it will maintain antiretroviral treatment for all of those currently on treatment through PEPFAR support).46 ,47 

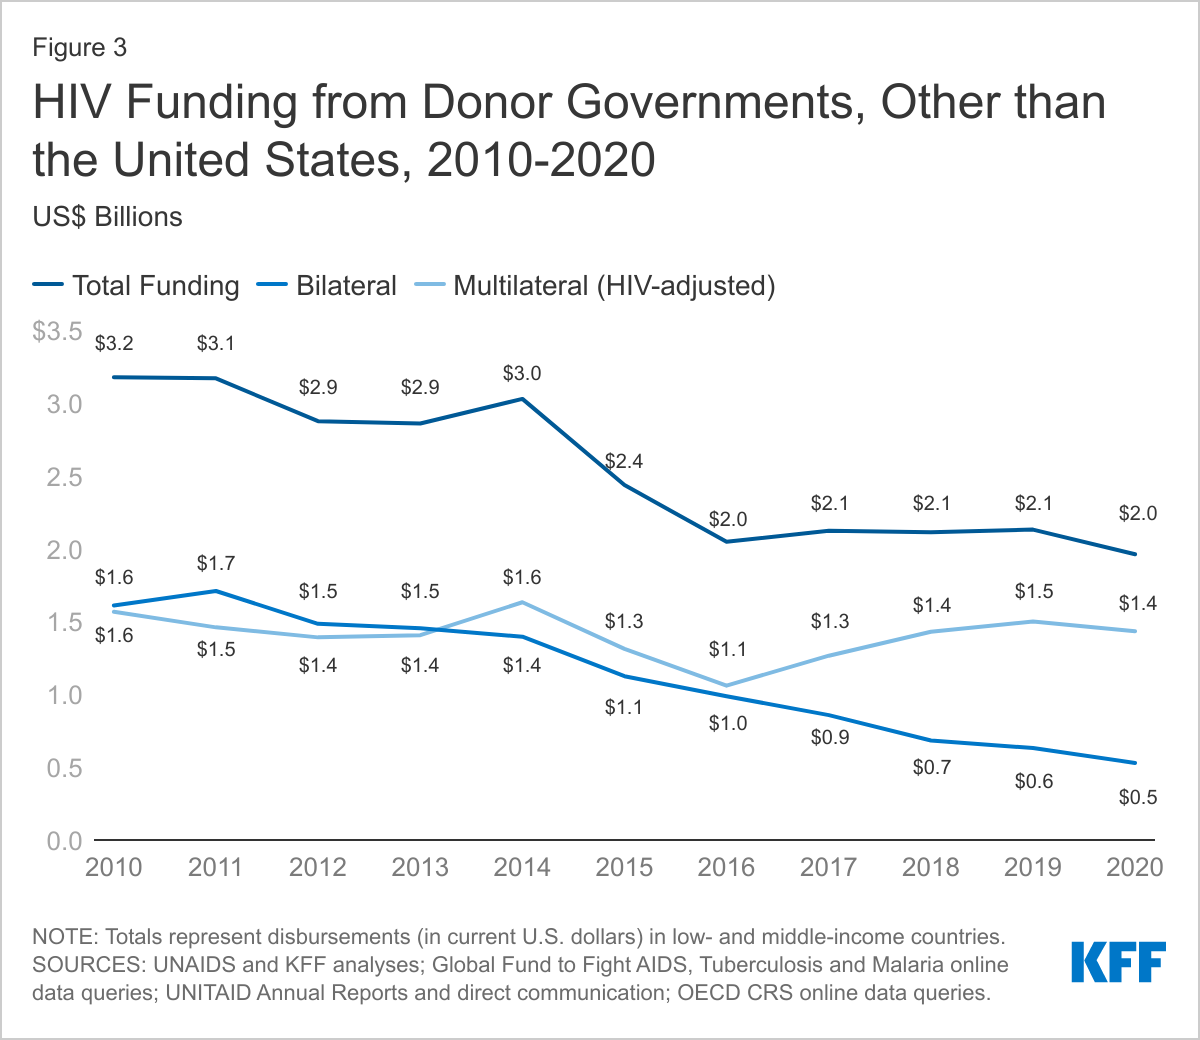
In addition, our analyses have shown that other donors have reduced their funding for HIV in recent years, forcing an increased reliance on the U.S. government and calling into question the ability of the global community to sufficiently scale up the HIV response (Figure 3).48  While some countries that receive PEPFAR support have made strides toward mobilizing domestic resources to complement U.S. support – for example, South Africa, home to the largest number of people living with HIV, covers roughly 80% of HIV-related costs through domestic outlays49  – domestic expenditures on HIV globally have also begun to plateau.50  Moreover, even small reductions in donor assistance for HIV would be hard for many LMICs to absorb.51  This is now all the more challenging given the impacts of COVID-19 on the economies of many countries that receive PEPFAR support, at least in the near term.52 

HIV Funding from Donor Governments, Other than the United States, 2010-2020

Whether funding for PEPFAR will be increased, or even sustained, will in part depend on its ability to maintain bipartisan support,53  which has been one of its hallmarks to date.  An unprecedented initiative launched by a Republican president, PEPFAR has been supported by both parties and multiple congresses and administrations over time, as well as a broad and diverse base of non-governmental organizations and advocates. As a result, PEPFAR has remained largely unaffected by the increasingly polarized and partisan environment. This support has been aided by the program’s clear, singular focus on HIV, its reliance on specific goals and metrics, and its evidence of impact.54  How strongly PEPFAR’s bipartisan support persists, as well as the feasibility of more or even stable funding, in the future is unclear, however. Many original PEPFAR champions are no longer in Congress, and only 20% of current members were serving when the program was first authorized.55  In addition, decisions made about PEPFAR’s future directions – including whether or not its mandate is broadened to more directly address global health security or health systems strengthening, whether it is further integrated with other U.S. global health programs, or whether its structure is altered (see discussions below) – could affect support for the program. More generally, the sense of urgency around HIV seems to have diminished, with attention turning to other challenges, including but not limited to COVID-19.56 

Key questions: 

  • Can PEPFAR stretch its current budget further to reach more people? Or would flat funding require a reduction in its scope?
  • Without additional funding, what strategic choices should PEPFAR make and how should these be weighed?
  • How does the larger global political and economic climate affect PEPFAR’s prospects for new funding? Will COVID-19’s impact on the economies of LMICs mean that even more HIV funding will be needed?
  • If HIV funding from other sources is reduced, or increased, will it change the calculus of U.S. support?
  • Will there be appetite in Congress to provide additional funding to PEPFAR? What if such funding were to come at the expense of other components of the U.S. global health portfolio?
  • Were Congress to appropriate additional resources for PEPFAR, how best should they be used?
  • How would a broadening of PEPFAR’s mandate, further integration of PEPFAR’s efforts with other global health programs, or a change in PEPFAR’s structure affect Congressional support?

(Back to top)

3. PEPFAR’s geographic footprint, service portfolio, and population focus

Among the main programmatic levers available to PEPFAR to address the HIV epidemic are its geographic focus, the set of interventions its supports, and the population groups it prioritizes. Decisions in these areas have reflected a variety of factors over time, including the epidemiology of HIV, new scientific advances, political and diplomatic considerations, historical HIV investments, and current funding levels.57  Going forward, many of these same factors will likely affect PEPFAR’s strategic choices in these three interrelated areas, as will new ones, including, for example, an increasing focus on addressing inequalities and promoting equity in the context of HIV and beyond.58 ,59 ,60 

PEPFAR’s geographic footprint

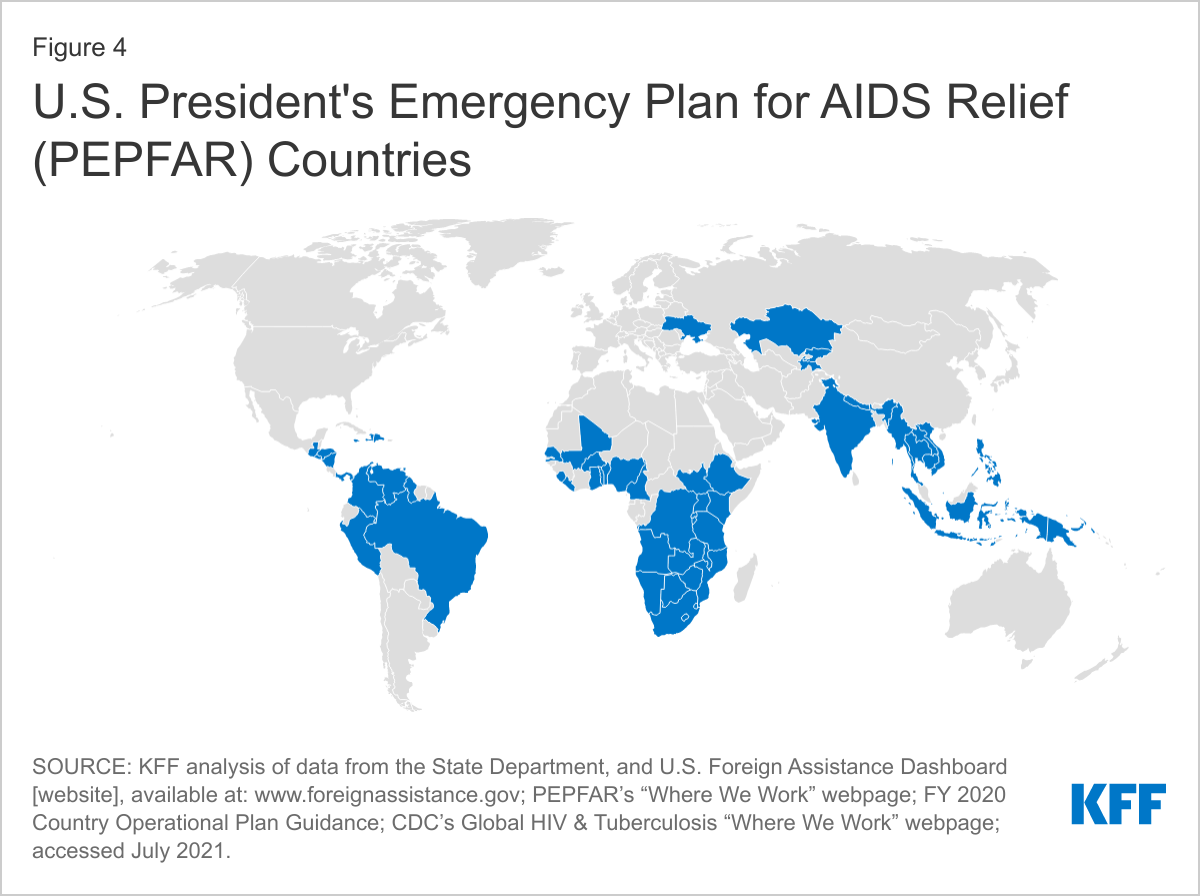
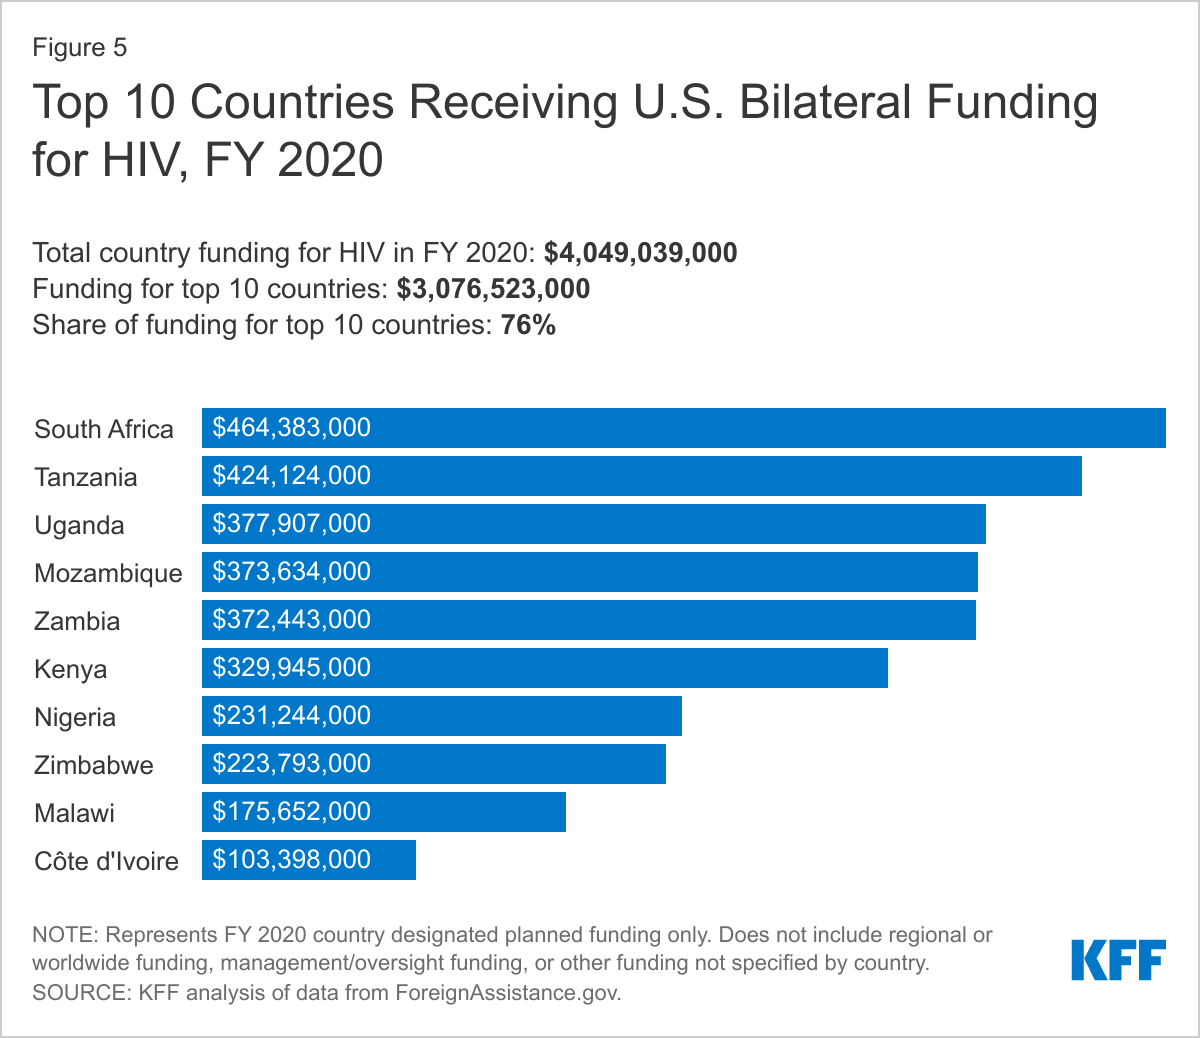
While PEPFAR’s bilateral funding has reached more than 100 countries since it launched, and today is provided to more than 50 countries (Figure 4),61  it has always concentrated its efforts in a smaller subset. This includes its original 15 “focus countries”,62  located primarily in sub-Saharan Africa, as well as its more recent emphasis on 13 “priority high-burden countries” for epidemic control, nine of which are original focus countries and all but one of which is in sub-Saharan Africa.63 ,64  Most of PEPFAR’s current country funding is concentrated in 10 countries,65  which together represent more than half (54%) of people living with HIV globally (Figure 5).66 

U.S. President's Emergency Plan for AIDS Relief (PEPFAR) Countries
Top 10 Countries Receiving U.S. Bilateral Funding for HIV, FY 2020

At the same time, while PEPFAR’s most prominent funding footprint remains in eastern and southern Africa, the sub-region most heavily affected by HIV and where PEPFAR is widely acknowledged to have played a pivotal role in the area’s comparatively greater progress in treatment coverage and HIV incidence reduction,67  incidence has been on the rise in Eastern Europe/Central Asia (where deaths have also risen recently), Latin America, and the Middle East and North Africa.68 

Going forward, PEPFAR faces a range of possible options with respect to its future geographic footprint. PEPFAR could continue to concentrate most funding and activities in the same set of countries currently prioritized as these countries work toward epidemic control. This would promote continuity and predictability but might not neatly map to where the need is greatest or where other donor actions may leave gaps. Alternatively, PEPFAR could further narrow its scope to a smaller set of countries, which could help to drive impact or allow greater focus within particularly hard hit or challenging areas. However, this approach might require a scale down in other countries and, again, may not be responsive to changing epidemiological trends. Finally, PEPFAR could seek to increase investments elsewhere to maximize responsiveness to an ever-evolving epidemic, such as directing resources to countries facing the loss of other donor support (e.g., middle-income countries that are no longer eligible for Global Fund support), experiencing increasing HIV rates among key populations, and/or other acute challenges such as conflict or famine. How these decisions are made will depend on multiple factors, including future funding, without which any decision to change geographic focus could become a zero-sum game, with real risks to HIV outcomes (though as noted above, the U.S. government has stated that it will maintain antiretroviral treatment for all those it supports).

PEPFAR’s service mix

PEPFAR currently channels just over half (52% in 2020) of its planned funding to HIV treatment, 16% to care, 15% to prevention, 6% to testing, and the remainder (11%) to governance, management, and operations.69  PEPFAR’s current service mix is the result of years of shifting funding mandates by Congress as well as the evolution in standards of care and introduction of new interventions. PEPFAR’s original legislation required that at least 55% of bilateral funds be spent on treatment70  and that at least 33% of prevention funds be spent on abstinence-until-marriage (ABC) programs, among other requirements. After criticism of these earmarks,71 ,72  Congress somewhat relaxed these requirements in 2008.73 

While HIV treatment remains the single greatest area of expenditure for PEPFAR, the program has supported an increasing range of prevention interventions over time. Especially noteworthy is the creation by PEPFAR in 2015 of the DREAMS initiative, which links biomedical, behavioral, and structural approaches to prevent new HIV infections among adolescent girls and young women in 15 countries.74  PEPFAR reports that it has invested nearly $1 billion in DREAMS.75  A recent review found that DREAMS programs have reached millions of adolescent girls and young women, elevated global attention to the HIV agenda for these populations, and contributed to a decline in new HIV infections among adolescent girls and young women in districts where DREAMS programs are operating.76 

However, the stubbornly high global rate of new HIV infections has led UNAIDS to call for a substantial strengthening of investments in HIV prevention efforts and structural interventions to address the factors that contribute to HIV vulnerability and impede service utilization.77  The case for bolstering HIV prevention has been underscored by the disruptions in HIV prevention services caused by COVID-19, as well as by the pipeline of new prevention technologies that are likely to come on line soon, such as long-acting injectable pre-exposure prophylaxis (PrEP) and vaginal dapivirine rings. Yet, at the same time, the HIV treatment agenda remains unfinished, as more than one in four of all people living with HIV worldwide were not receiving antiretroviral therapy in 2020 and one-third were not virally suppressed.78 

Lastly, although PEPFAR retains a singular focus on HIV, the program has also provided services to address co-morbidities frequently experienced by people living with HIV, including tuberculosis, cervical cancer, viral hepatitis, and cryptococcal meningitis. In addition, it has started to address some chronic conditions faced by people with HIV as they age, but there is an open question about how much it should emphasize these other areas in the future.

As with possible changes in PEPFAR’s geographic footprint, PEPFAR could choose to rebalance its portfolio mix, as long as it complies with Congressional mandates (though Congress could also choose to relax or change some of these mandates in the future). This could include a greater emphasis on prevention programming, such as increasing support for PrEP; scaling-up support for structural interventions; devoting more resources to health systems strengthening, including for health care workers, in support of HIV interventions; and/or more proactively planning for the incorporation and rapid diffusion of new technologies on the horizon (e.g. vaginal microbicides, long-acting PrEP), which is one objective in PEPFAR’s draft vision for 2025.79  Changes in the broader environment, such as further reductions in the unit costs of antiretroviral therapy, could conceivably aid PEPFAR in freeing up resources for the scale-up of prevention and other non-treatment programming, or for treating additional people.

PEPFAR’s population focus

As with PEPFAR’s geographic and service mix, PEPFAR’s population focus, particularly for prevention efforts, has evolved over time, largely reflecting the relaxation of legislative mandates and changing political views. With much of its early prevention programming focused on promoting an ABC (“abstinence, be faithful, use condoms”) approach and reducing heterosexual transmission, there was limited attention to high-risk key populations such as men who have sex with men, sex workers, and injection drug users. In fact, PEPFAR’s original authorizing legislation was almost completely silent on these populations. Over time, PEPFAR has increased its focus on key populations, releasing specific guidance on injection drug users (in 2006) and men who have sex with men (in 2011),80  supporting the development of evidence-based estimates of the size of key populations in countries, and launching a Key Population Implementation Fund.81 

Notwithstanding this evolution, programming for key populations has never been a central pillar of PEPFAR’s work in most countries. In FY 2021, planned PEPFAR funding specifically identified to address key populations totaled $269.8 million, or just 6% of the total.82  There have been calls for PEPFAR to further increase its focus on key populations, including by creating a DREAMS-type program for key populations.83  This stems from both the unique challenges and barriers they face, including discrimination, stigma, and criminalization in their own countries, as well as evidence that high-risk key populations and their partners are now driving the global HIV epidemic, accounting for 62% of new HIV infections in 2019.84  A new series of papers highlights the importance of enhancing efforts to address HIV among key populations in Africa, who will “increasingly become the face of AIDS” on the continent.85 

In addition, although PEPFAR’s authorizing legislation prioritized programming for women and girls, the challenge of meeting their needs and importance of increasing PEPFAR’s focus on women and girls has been identified throughout PEPFAR’s history.86 ,87 ,88  Women, particularly young women and girls, continue to be at high risk for HIV and face unique challenges. In 2020, women accounted for 51% of new HIV infections globally, including 63% in sub-Saharan Africa.89  Adolescent girls and young women are particularly vulnerable, with those in sub-Saharan Africa estimated to have an HIV risk that is 4.5 times higher than men their own age.90  These challenges helped to drive the creation of the DREAMS initiative in 2014. As with calls to increase the focus on key populations, some have also called for more funding and attention to the needs of adolescent girls and young women by PEPFAR as well as through broader U.S. programming.91 

Finally, there have been similar calls for PEPFAR to increase attention to and funding for children,92  as well as for men and boys. PEPFAR has been a key provider of HIV services for children, supporting treatment services to nearly 700,000 children living with HIV and providing care and support to 6.7 million orphaned or made vulnerable by HIV as well as their caregivers.93  However, there are significant gaps in access,94  particularly for antiretroviral treatment, with only 54% of the 1.4 million children living with HIV diagnosed and on treatment in 2020, compared to 74% of adults.95  Data also show that men and boys lag in their uptake of HIV testing and treatment, posing risks for themselves and their partners. While PEPFAR has developed specific programs targeting men and boys, including through the MenStar Coalition96  with private sector partners, and is the largest funder of VMMC in the world, it has also been criticized97  for not including men and boys more directly in DREAMS programming.

Going forward, as with its geographic footprint and service mix, PEPFAR faces key strategic questions about whether it should expand or shift its population focus in any way. These decisions depend in part on funding, but also the extent to which PEPFAR has comparative advantages relative to other donors or country governments in addressing the needs of certain population groups, such as those who face discrimination or even criminalization by their own governments.

Key questions:

  • Should PEPFAR expand, narrow, or otherwise change the countries and regions where it works? If so, what should be the factors or criteria that determine PEPFAR’s future geographic footprint? How important will future funding levels be to PEPFAR’s ability to alter its geographic footprint?
  • How, if at all, should PEPFAR’s HIV service mix change? How might PEPFAR expand its prevention services while preserving and continuing to maintain or even scale up treatment access and improving rates of viral suppression? To the extent PEPFAR opts to expand its prevention services, which prevention interventions should be prioritized and which target populations?
  • Should PEPFAR increase its focus on addressing co-morbidities and chronic conditions among people with HIV? Does it have a mandate to do so?
  • How can PEPFAR best be prepared to rapidly diffuse new technologies once they are available?
  • Are there priority populations that warrant intensified assistance from PEPFAR? If so, which ones?
  • Should PEPFAR create a DREAMS-like initiative for key populations or otherwise intensify its assistance for programming to address the HIV prevention and treatment needs of key populations? What is PEPFAR’s comparative advantages with respect to key population programming?
  • To what degree would an increased focus on key populations, or other population groups, be tied to decisions regarding PEPFAR’s geographic footprint? What trade-offs need to be considered?
  • To what extent should PEPFAR incorporate equity goals into its HIV response and decisions about who to serve?
  • How should actions or policies of other donors and country governments be taken into account in PEPFAR’s decision-making regarding its geographic, service, and population emphases in the future?

(Back to top)

4. The role of community and civil society in PEPFAR and the HIV response

Since the onset of the HIV epidemic, communities, including people living with HIV, have played a key role in the HIV response – as advocates, providers of services, and accountability watchdogs.98  Communities bring to the table unique perspectives on their needs and on the most effective public policies and service delivery strategies, underscoring the importance of community engagement in the planning and implementation of HIV programs.99  The integral involvement of civil society in the HIV response has distinguished it from other areas of global health and development, and this has been the case for PEPFAR as well.

The participation of civil society in PEPFAR’s policy development and programming has a long history, one which has increased and become more formalized over time. While PEPFAR’s early annual reports to Congress identified the importance of civil society, the program’s 2008 reauthorization specifically required PEPFAR to include civil society in the development of new “compacts” at the country level, and PEPFAR’s subsequent Partnership Framework Guidance reflected this.100 ,101  In 2013, for the first time, PEPFAR formally included civil society in the annual process for developing the Country Operational Plans (COPs) that guide PEPFAR support at the country level, with the FY 2014 COP guidance specifying that PEPFAR country teams must include a separate supplemental narrative documenting how civil society has been involved in COP development, comments made by civil society, and the ways in which the country teams have considered these comments as part of COP planning.102 

This inclusion of civil society has resulted in adjustments in PEPFAR’s guidance and influenced country plans. At the level of the Office of the Global AIDS Coordinator (OGAC), for example, civil society input led PEPFAR to change its COP guidance to address concerns about the delivery of index testing (the offer of testing to partners or family members of people living with HIV)103  and to develop further guidance on safe and ethical ways to deliver this service.104  At the country planning level, a recent analysis found that nearly 500 civil society recommendations were either fully or partially incorporated into PEPFAR annual country workplans during the COP 2020-2021 planning process.105  In addition, community involvement in COP development has been cited as an important factor in the implementation of innovations in HIV treatment programming in Malawi, Uganda, and Zimbabwe.106  Finally, civil society groups successfully advocated to have PEPFAR, and the Global Fund, adopt and support “community-led monitoring” (CLM), a process by which civil society groups are directly involved in data collection on HIV service quality and access primarily from actual beneficiaries of those services, and PEPFAR COP guidance now requires countries to establish CLM.107  Despite these efforts, community groups continue to document challenges in access and quality at the country level, suggesting that this work is ongoing.

In addition to strengthening PEPFAR’s immediate efforts, the inclusion of community and civil society could be important for the longer-term sustainability of programs in countries. Civil society engagement and strengthening have been found to be key ingredients in successful country transitions from donor assistance.108 ,109 ,110  As experience during COVID-19 has underscored, community organizations and networks are able to reach populations not always well served by health facilities and play a critical role in preserving service access during crises.111  Sustaining community-led responses over time will likely depend on transitioning the funding of community infrastructure from donors to domestic governments through mechanisms such as social contracting, whereby governments provide support to community groups for performing essential health functions.112 

There may also be lessons to be learned from PEPFAR’s experience for other U.S. global health and development programs on how to include civil society more formally in planning and programming efforts, as well as efforts to promote sustainability.

Key questions:

  • How can PEPFAR build upon and sustain its support for community-led HIV responses? Are there other ways to augment community involvement, particularly at the country level?
  • Should PEPFAR, and the U.S. government, engage HIV civil society more directly in monitoring human rights and governance challenges in the countries in which it works?
  • How can communities be engaged over the long term to inform, assess, and monitor PEPFAR when and if it seeks to reduce or discontinue assistance in particular countries or settings?
  • How might lessons learned from PEPFAR’s inclusion of civil society and support for community-led responses inform and strengthen other U.S. government health and development programs?

(Back to top)

5. PEPFAR, epidemic control, and the long-term sustainability of the HIV response

Although PEPFAR was designed from the outset as an emergency response, the importance of building sustainable capacity in countries was recognized as a priority at the early stages of the program. Capacity building for sustainability was included in PEPFAR’s original authorizing legislation,113  its first five-year strategy,114  and the Institute of Medicine’s early assessment of the program.115  As the Institute of Medicine (IOM) found, “For continued progress toward its 5-year targets and longer-term goals, PEPFAR should transition from a focus on emergency relief to an emphasis on the long-term strategic planning and capacity building necessary for sustainability.”116  By the time PEPFAR was reauthorized in 2008, there was a specific emphasis on country ownership and health system strengthening.

PEPFAR has used different models to enhance country ownership and sustainability over time, including “Partnership Frameworks,” required by the 2008 reauthorization and developed with 19 countries and two regions between 2009 and 2012,117  and “Country Health Partnerships”,118  created in 2013 and used with several countries.119 ,120  In addition, PEPFAR developed a “Sustainability Index and Dashboard (SID)” in 2015 that all country teams complete.121  In 2018, PEPFAR announced that it would direct at least 70% of its funding to host country governments or local organizations by the end of 2020, although that benchmark has not yet been met.122 ,123  PEPFAR’s draft strategic vision for 2025 includes a goal to “Build Enduring Capabilities” which includes developing benchmarks to, among other things, ensure “that countries and communities can lead with the capacity to deliver prevention and treatment services through domestic systems.”124 

Still, how best to define and sustain long-term success in any recipient country remains an important challenge for PEPFAR, as well as for other HIV donors. While epidemic control has been identified as a critical program target, along with reaching the UNAIDS 95-95-95 goals,125  PEPFAR acknowledges that “[t]his definition of epidemic control does not suggest near-term elimination or eradication of HIV, as may be possible with other infectious diseases, but rather suggests a decline of HIV-infected persons in a population, achieved through the reduction of new HIV infections when mortality among [people living with HIV] is steady or declining, consistent with natural aging” (see Table 3 for key global HIV targets and status in PEPFAR countries).126 

Table 3: Progress Toward Global HIV Targets in PEPFAR Countries
TargetDefinitionPEPFAR Countries Meeting Target in 2020 (out of 53)
Know HIV StatusFirst of UNAIDS “90-90-90” targets established in 2014 and expired in 2020 – 90% of people with HIV know their status.13 (25%)
Receiving ARTSecond “90” – 90% of people who know their status are on treatment.14 (26%)
Suppressed Viral LoadsThird “90” – 90% of people on treatment have suppressed viral loads.13 (25%)
PEPFAR’s Epidemic Control Target (Incidence-to-Mortality)Ratio of number of new HIV infections to number of people infected with HIV who die (from any cause). When ratio is greater than one, or when there are more new infections than deaths, size of the population of people living with HIV grows; when less than one, size of population shrinks.18 (34%)
HIV Incidence per 1,000Number of new HIV infections per 1,000 population. Global HIV incidence target is <1%.41 (77%)
Incidence-to-PrevalenceRatio of number of new HIV infections and number of people living with HIV within a population to measure average duration of time a person lives with the disease. Benchmark for epidemic control is a ratio of 3%. When the number of new infections is less than 3%, total population of people who live with HIV will eventually decline.20 (38%)
NOTE: HIV epidemiological data is for all ages unless otherwise specified.SOURCES: KFF analysis of data from: U.S. Department of State, “Where We Work — PEPFAR” webpage, https://www.state.gov/where-we-work-pepfar/; UNAIDS, AIDSInfo database, accessed August 2021; UNAIDS, Global AIDS Update 2021, July 2021; UNAIDS, “Ratio of new HIV infections to number of people living with HIV improving,” April 2020; UNAIDS, “Making the End of AIDS Real: Consensus building around what we mean by epidemic control,” October 2017.

With respect to PEPFAR assistance, it is not yet clear what the scope and nature of U.S. support might be after a country achieves epidemic control or other program targets, and how best to sustain HIV treatment and prevention programs and leverage surveillance systems going forward and guard against shocks or respond to setbacks that might occur, as in the case of COVID-19. Additionally, some of the elements needed to achieve and sustain gains are beyond the control of the U.S. government, such as adequate national investments in health, the capacity for which is heavily affected by macroeconomic conditions and the effectiveness of national governance.

Ultimately, promoting sustainability and country ownership is a major challenge, given the complexity of the HIV epidemic and the larger political and economic climate in recipient countries. Despite its efforts to promote sustainability and country ownership, PEPFAR does not have formal transition or graduation plans, unlike the Global Fund127  and Gavi, the Vaccine Alliance,128  for example, each of which have specific graduation criteria and requirements for domestic co-financing. Whether PEPFAR should consider instituting a formal transition or graduation plan, specific criteria for determining when and at what pace to draw down financial or other support, or requirements for co-financing are key strategic questions for the future. If it were to pursue such a strategy, there are important lessons to be learned from the U.S. family planning program and other health areas, as well as the experiences of the Global Fund and Gavi, including the length of time needed and the challenges faced by more marginalized populations.129 ,130 ,131 

Moreover, the continued heavy reliance of many countries on PEPFAR support (in many cases, more so than in other health areas) poses another challenge to long-term sustainability. According to the latest data on HIV expenditures (2017-2019), PEPFAR accounted for 86% of all HIV-related spending in Tanzania, 73% in Angola, 66% in Mozambique, 57% in Zambia, 56% in Lesotho, and 50% in Malawi.132  With some notable exceptions, governments in countries receiving PEPFAR aid have had difficulty allocating substantially greater domestic resources for HIV services to complement and leverage PEPFAR assistance, even before COVID-19. Factors that have contributed to limited domestic contributions include challenges mobilizing sufficient domestic resources to address HIV; multiple, simultaneous pressures to take on more of their HIV responses, as well as more of their responses to other health issues, from other donors; weak health systems; and difficulty in instituting social insurance schemes which could help to promote access.133  The effects of COVID-19 in LMICs – increasing hunger, poverty, unemployment, and the need for government assistance at the same time that the pandemic’s economic shocks have reduced government revenues – may delay even further the domestic investments in health and HIV that will be needed for long-term sustainability.134 

Key questions:

  • How else can PEPFAR promote long-term sustainability in the countries in which it works? How should such considerations be adjusted or tempered as the result of the COVID-19 pandemic?
  • For countries that achieve epidemic control, how might PEPFAR assistance evolve? Should the upcoming reauthorization of PEPFAR specify criteria or mechanisms for transitioning PEPFAR assistance in countries that achieve or approach epidemic control? What steps are needed to ensure that gains in the response can be sustained in high-performing countries? What is the risk that some might see “epidemic control” as an endpoint?
  • Should PEPFAR develop clear metrics or “graduation” criteria to guide country-specific transitions from PEPFAR support? If so, what should these metrics consist of and how might PEPFAR avoid creating unintended incentives that penalize countries that are doing well?
  • Should PEPFAR implement clear co-financing requirements for recipients of PEFPAR support?
  • As PEPFAR explores ways in which to increase recipient country ownership of the HIV response, what safeguards should be included to ensure that HIV outcomes do not suffer and that certain groups, particularly key populations, are not left behind?
  • How should PEPFAR’s efforts to promote long-term sustainability of the HIV response be coordinated with other U.S. government efforts and those of other donors, the private sector, and communities?

(Back to top)

6. PEPFAR’s role in global health security and broader health systems strengthening

In large part because of the COVID-19 pandemic, there is growing attention to scaling up U.S. global health security efforts and creating more resilient health systems.135  This is shaping up to be a major global health focus of the Biden administration.136  On his first day in office, President Biden issued an Executive Order on “Organizing and Mobilizing the United States Government to Provide a Unified and Effective Response to Combat COVID-19 and to Provide United States Leadership on Global Health and Security.”137  This was followed shortly thereafter by a National Security Memorandum on “United States Global Leadership to Strengthen the International COVID-19 Response and to Advance Global Health Security and Biological Preparedness.”138  In addition, several bipartisan global health security bills have been introduced in Congress calling for more funding and U.S. action.139 

It is still unclear, however, what an increased emphasis on global health security will mean for PEPFAR, as well as for the other core, longer-standing components of the U.S. global health portfolio, and this growing focus poses both opportunities and risks. On the one hand, PEPFAR already contributes significantly to health systems strengthening efforts, including support for many of the key elements of pandemic preparedness which, combined with its large geographic footprint and diplomatic engagement, may make it uniquely situated among U.S. global health programs to play a broader role in this area. For example, PEPFAR reports that it has supported 3,000 laboratories, including 28 national reference laboratories, 70,000 health care facilities, and 290,000 health care workers, and invests almost one billion dollars each year in health systems.140  In addition, as the first and largest U.S. global health program specifically designed to address a pandemic, PEPFAR could offer key lessons for broader U.S. pandemic preparedness efforts and potentially be integral to such efforts. On the other hand, an increased focus on broader health security could conceivably crowd out other global health investments and reduce the stature of the PEPFAR program and emphasis on HIV when tremendous need still exists.

As mentioned above, infrastructure components built by or strengthened through PEPFAR investments – specifically those focused on preservation of HIV treatment services – rapidly pivoted in 2020 to address COVID-19 and continue to play important roles in national COVID-19 responses.141  PEPFAR-supported laboratories provide diagnostic testing for COVID-19; health care workers hired through HIV investments shifted to manage COVID-19 as well; HIV clinical sites, many of them closed during lockdowns, were repurposed to care for COVID-19 patients; and strategic information systems strengthened through PEPFAR investments proved critical for tracking COVID-19.142 

This is not the first time that PEPFAR and other HIV investments have contributed to managing a serious health emergency, as was seen in the Ebola outbreak in West Africa in 2014-2015.143 ,144  Still, whether and how PEPFAR’s expertise and reach will be leveraged to address a more robust U.S. global health security engagement, and health systems more generally, remains unclear and depending on the approach could either strengthen or dilute HIV efforts.

Key questions:

  • Will an increasing emphasis on global health security and pandemic preparedness pull attention away from PEPFAR and the fight against HIV or can PEPFAR become an integral contributor to these efforts? Does a program largely focused on a single disease support or complicate global health security efforts?
  • What are PEPFAR’s comparative advantages for responding to COVID-19 and other pandemics?
  • Should PEPFAR be more intentional about identifying opportunities to build out from the program’s platform to strengthen pandemic preparedness and response? Are changes needed in PEPFAR’s authorization to better leverage PEPFAR’s comparative advantages with respect to pandemic preparedness and response? Should global health security and pandemic preparedness become a greater part of PEPFAR’s future mandate?
  • How can PEPFAR’s contributions to health systems strengthening and pandemic preparedness be better quantified and accounted for?
  • How can the U.S. government build on the PEPFAR platform for other global health and development efforts, including global health security, without diminishing the HIV response? Are there marginal investments that could be made to do so?

(Back to top)

7. PEPFAR and the Global Fund

The Global Fund, founded in 2002, is an independent multilateral financing entity designed to raise significant resources and intensify efforts to end the AIDS, tuberculosis, and malaria epidemics. The U.S. has played an integral role in the Global Fund since its inception by providing the Global Fund with its founding contribution, serving as its single largest donor, and being active in the organization’s governance and oversight.145  The Global Fund has been called the “multilateral component” of PEPFAR146  and together, the two account for most (82% in 2019) international funding provided to address HIV in LMICs.147 

PEPFAR and the Global Fund work quite differently, however.148  PEPFAR, for example, uses a donor-driven model, driving decisions from Washington, D.C. to the country-level, and the U.S. government has a significant presence on the ground in many of the countries in which it works. By contrast, the Global Fund relies on country-driven proposals, and, as a financing mechanism, does not have any programming presence in countries. PEPFAR uses an annual COP planning process while the Global Fund’s Country Coordinating Mechanism development process is on a three-year cycle. In some cases, the differences between PEPFAR and the Global Fund have been complementary. The Global Fund has helped to expand PEPFAR’s reach to many more countries and to leverage additional donor resources. PEPFAR has provided on-the-ground technical and other support for Global Fund programs. Additionally, in many of the countries that receive funding from both, PEPFAR and the Global Fund finance different components of the HIV response – the Global Fund is generally the largest funder of HIV commodities in PEPFAR countries while PEPFAR funds many of the associated services needed to support the delivery and use of commodities, for example.149 

Given how important both PEPFAR and the Global Fund are to the HIV response, there may be opportunities for the U.S. government to rethink and strengthen their relationship going forward, including through more proactive and strategic coordination, particularly given concerns about future financing for HIV. For example, both the Global Fund and PEPFAR are in the process of developing new strategic frameworks, which may provide a natural opportunity to enhance strategic alignment between the two programs. PEPFAR’s draft vision for 2025 indicates that it will seek to closely coordinate with the Global Fund Strategy to “optimize complementarity, value for money, and impact.”150  Specific areas that might be more closely coordinated include planning cycles, monitoring systems, and guidance documents, in part to reduce reporting burdens on countries and partners. Other areas that could be explored for further coordination and alignment include a more explicit division of labor and/or financing for specific HIV services (e.g., commodities, labs, workforce, etc.) in countries where both are present; leveraging PEPFAR’s expertise to assist the Global Fund in strengthening the quality, timeliness, and strategic use of program data; and more closely planning regarding support for countries transitioning off of Global Fund financing, particularly since the list of these countries is known several years in advance.

Key questions:

  • What factors should the U.S. government use to determine the optimal balance of U.S. funding between PEPFAR and the Global Fund, particularly in the long term?
  • Could PEPFAR and the Global Fund coordinate more closely to support countries that are transitioning off of Global Fund financing?
  • Could planning cycles and strategy development be more closely aligned?
  • Could there be more direct and proactive coordination regarding the division of financing for specific HIV services (e.g., commodities, labs, workforce, etc.) in countries in which both PEPFAR and the Global Fund operate?
  • Can PEPFAR leverage its expertise to assist the Global Fund in strengthening the quality, timeliness, and strategic use of program data and data monitoring capabilities? Can the two work more closely together on monitoring to reduce the reporting burden on implementers?
  • Can PEPFAR and the Global Fund work more directly together on mitigating the impact of the COVID-19 pandemic on the HIV response?

(Back to top)

8. PEPFAR’s structure and location within the U.S. government’s global health architecture

When PEPFAR was first created, locating it in the State Department and providing its Coordinator with the power to oversee all U.S. global HIV investments, as specified in its authorizing legislation, marked a departure from the way in which U.S. global health programs had been structured. Prior to that point, with limited exception, global health programs, including bilateral HIV assistance, typically resided at the U.S. Agency for International Development (USAID) [USAID and the Centers for Disease Control and Prevention are PEPFAR’s main implementing agencies, although several other arms of the U.S. government carry out HIV activities under PEPFAR’s coordination]. There were several reasons this unorthodox approach was taken with PEPFAR: an emergency program that linked multiple arms of the U.S. government appeared to justify an unusual organizational approach; PEPFAR’s placement at State was believed to better harness U.S. diplomacy capabilities in addition to development and public health expertise in other agencies; and situating PEPFAR at State recognized that the global HIV epidemic presented not only public health but also major human rights and national security challenges.

PEPFAR’s first five-year strategy, presented to Congress in 2004, discussed its intentional role in supporting the implementation of good policies and effective legislation, including addressing stigma and discrimination and promoting human rights.151  PEPFAR’s diplomatic role has been cited as one of its most important successes.152 ,153 ,154 ,155  PEPFAR has worked with host country governments to remove user fees for accessing health services; adopt international HIV treatment guidelines and standards of care; and address stigma and discrimination against key populations.156 ,157 ,158 ,159  Analyses have found that higher levels of PEPFAR investment are associated with greater improvements in key governance measures and that PEPFAR countries have better policy alignment with internationally recommended standards compared to other LMICs that do not receive PEPFAR support.160 ,161 ,162 

Still, some have argued that at this point in PEPFAR’s evolution, the program should be moved to USAID,163  co-located with other global health efforts, to further its transition from an “emergency” program to one more focused on long-term development. Others, citing the program’s broadly recognized positive impact on the HIV response, have argued that it is important to keep the current structure, and that moving PEPFAR would present significant risks, including threatening the HIV response and diluting PEPFAR’s diplomatic role, which could have implications for country-level coordination with local governments.164  In addition, they posit that PEPFAR, by virtue of its structure, should be seen a model for other U.S. global health programs in leveraging public health, development, and diplomatic expertise for achieving desired outcomes. In addition, given the size of PEPFAR investments in numerous countries, the program has unique leverage and diplomatic impact, which could translate beyond HIV. This issue has gained new attention in the context of President Biden’s moves to shore up the U.S. global health security response, including by placing a Coordinator for the Global COVID Response and Health Security at the State Department,165  and a bipartisan global health security bill introduced in the Senate which seeks to establish a special representative for global health security and diplomacy at the State Department, to be appointed by the President and confirmed by the Senate.166 

There are also broader conversations regarding the importance of integrating across global health programs, particularly to better reach and more effectively serve women and girls, which may have bearing on PEPFAR’s structure.167 ,168  PEPFAR’s DREAMS initiative for adolescent girls and young women is one effort to offer a more integrated approach, with HIV prevention, testing, and treatment services linked to educational assistance, economic support and community strengthening. However, the DREAMS program still faces challenges in integrating fully with other U.S. government global health and development assets. For example, as a matter of policy, PEPFAR funds cannot be used to procure contraceptive commodities, other than for prevention purposes, which must instead be funded by other U.S. programs or other donors.169  More generally, Congress funds U.S. global health programs through specific appropriations and requires reporting according to these siloes, making it difficult to integrate across programs.

Ultimately, whether or not discussions about PEPFAR’s structure or location will continue, Congressional legislation would be needed to make some of these changes, including the location of PEPFAR at State and reporting line of the Coordinator.

Key questions:

  • Should PEPFAR’s statutory structure and location at the State Department be reconsidered? What are the risks of doing so? What are the opportunities? How does the administration’s increased focus on global health security and diplomacy affect these considerations?
  • Are there ways to better leverage PEPFAR’s role in global health diplomacy beyond HIV? What are the opportunities to support a more “whole-of-government” approach in the U.S. government’s relations with countries that receive PEPFAR support?
  • What steps are needed to improve the integration of PEPFAR with other U.S. global health and development programs? Should Congress and the administration consider elimination of some of the existing budgeting line silos or otherwise encourage reporting on integrated programming?

Conclusion

PEPFAR has made historic contributions to the health and well-being of people living in the world’s most resource-constrained countries, first starting as an emergency program with little precedent and growing to become the mainstay of the global HIV response and largest component of the U.S. global health portfolio. As PEPFAR approaches its two-decade mark, however, it is at an important inflection point and there are several key strategic questions regarding its programmatic focus and role within the U.S. government’s global health and development portfolio going forward. Key factors that have the potential to influence PEPFAR’s future include the growing emphasis on global health security (and the continuing need to mitigate the spread and impact of COVID-19 and to hasten recovery from the pandemic), the durability of bipartisan political support and its implications for program funding, how PEPFAR defines success in individual countries and promotes the long-term sustainability of national HIV responses, and the optimal relationship of PEPFAR to other global health programs. Given that the fight against HIV is far from over, decisions about PEPFAR’s future will have an outsized impact on the course of the HIV epidemic. The key strategic issues and questions posed here aim to inform these decisions.

This work was supported in part by the Bill & Melinda Gates Foundation. We value our funders. KFF maintains full editorial control over all of its policy analysis, polling, and journalism activities.

Jennifer Kates and Alicia Carbaugh are with KFF. Mike Isbell is an independent consultant. KFF’s Stephanie Oum and Anna Rouw also contributed to the brief.

Endnotes

  1. Ingram G, Making USAID a premier development agency, February 2021, Brookings, accessed: https://www.brookings.edu/research/making-usaid-a-premier-development-agency/.   ↩︎
  2. O’Neill Institute for National and Global Health Law at Georgetown University Law Center, Reorganization and the Future of PEPFAR; Implications of State and USAID Reform, 2018.   ↩︎
  3. PEPFAR’s definition of epidemic control is when “the total number of new HIV infections fall below the total number of deaths from all causes among HIV-infected individuals.” For more information, see U.S. Department of State, PEPFAR Strategy for Accelerating HIV/AIDS Epidemic Control (2017-2020), September 2017, accessed: https://www.state.gov/wp-content/uploads/2019/08/PEPFAR-Strategy-for-Accelerating-HIVAIDS-Epidemic-Control-2017-2020.pdf and KFF, KFF Dashboard: Progress Toward Global HIV Targets in PEPFAR Countries, August 2021. ↩︎
  4. U.S. Department of State, PEPFAR Latest Global Results, July 2021, accessed: https://www.state.gov/wp-content/uploads/2021/06/PEPFAR-Latest-Global-Results_JUNE-2021-1.pdf. ↩︎
  5. Institute of Medicine, Evaluation of PEPFAR, 2013, accessed: https://www.nap.edu/catalog/18256/evaluation-of-pepfar. ↩︎
  6. Institute of Medicine, PEPFAR Implementation: Progress and Promise, 2007, accessed: https://www.nap.edu/catalog/11905/pepfar-implementation-progress-and-promise. ↩︎
  7. UNAIDS, Global AIDS Strategy 2021-2026, End Inequalities. End AIDS, July 2021, accessed: https://www.unaids.org/sites/default/files/media_asset/global-AIDS-strategy-2021-2026_en.pdf (May 16, 2021). ↩︎
  8. U.S. Department of State, Guiding Principles for the Next Phase of PEPFAR, December 2020, accessed: https://www.state.gov/wp-content/uploads/2020/12/Guiding-Principles-for-the-Next-Phase-of-PEPFAR.pdf. ↩︎
  9. U.S. Department of State, Draft Overview – PEPFAR Strategy: Vision 2025, accessed: https://www.state.gov/development-of-the-next-pepfar-strategy-vision-2025/ (September 10, 2021). ↩︎
  10. KFF, PEPFAR Reauthorization: Side-by-Side of Legislation Over Time, January 2019. ↩︎
  11. UNAIDS AIDSInfo database, accessed: https://aidsinfo.unaids.org (August 12, 2021). ↩︎
  12. UNAIDS further analysis of Global Health Estimates 2019: Deaths by Cause, Age, Sex, by Region, 2000-2019, 2020. ↩︎
  13. UNAIDS AIDSInfo database, accessed: https://aidsinfo.unaids.org (August 12, 2021). ↩︎
  14. KFF, KFF Dashboard: Progress Toward Global HIV Targets in PEPFAR Countries, August 2021. ↩︎
  15. UNAIDS, Evidence Review: Implementation of the 2016-2021 UNAIDS Strategy On the Fast Track to End AIDS, 47th meeting of the UNAIDS Program Coordinating Board, UNAIDS/PCB(47)/CRP3, accessed: https://www.unaids.org/sites/default/files/media_asset/PCB47_CRP3_Evidence_Review_EN.pdf (May 16, 2021). ↩︎
  16. UNAIDS, Seizing the Moment: Tackling Entrenched Inequalities to End Epidemics, 2020, accessed: https://www.unaids.org/sites/default/files/media_asset/2020_global-aids-report_en.pdf (accessed on May 16, 2021). ↩︎
  17. Data for figure sourced from One World in Data, U.S. Department of State, United Nations, World Bank. ↩︎
  18. WHO, “WHO Coronavirus (COVID-19) Dashboard,” accessed: https://covid19.who.int/ (September 10, 2021). ↩︎
  19. The World Bank, The World Bank in Africa, 2020, accessed: https://www.worldbank.org/en/region/afr/overview (May 9, 2021). ↩︎
  20. U.S. Department of State, PEPFAR Technical Guidance in Context of COVID-19 Pandemic (version dated February 24, 2021, accessed: https://www.state.gov/wp-content/uploads/2021/02/02.24.21-PEPFAR-Technical-Guidance-During-COVID.pdf (August 12, 2021). ↩︎
  21. U.S. Department of State, PEPFAR 2021 Country & Regional Operational Plan (COP/ROP) Guidance for All PEPFAR Countries, pages 11-13, accessed: https://www.state.gov/wp-content/uploads/2021/02/PEPFAR-COP21-Guidance-Final.pdf. ↩︎
  22. WHO, Pulse survey on continuity of essential health services during the COVID-19 pandemic, August 2020, accessed: https://apps.who.int/iris/rest/bitstreams/1297631/retrieve. ↩︎
  23. UNAIDS, Prevailing Against Pandemics by Putting People at the Center, December 2020, accessed: https://www.unaids.org/sites/default/files/media_asset/prevailing-against-pandemics_en.pdf. ↩︎
  24. The Global Fund, The Impact of COVID-19 on HIV, TB and Malaria Services and Systems for Health: A Snapshot from 502 Health Facilities Across Africa and Asia, April 2021, accessed: https://www.theglobalfund.org/media/10776/covid-19_2020-disruption-impact_report_en.pdf. ↩︎
  25. The Global Fund, Results Report 2021, September 2021, accessed: https://www.theglobalfund.org/en/news/2021-09-08-global-fund-results-report-reveals-covid-19-devastating-impact-on-hiv-tb-and-malaria-programs/ (September 8, 2021). ↩︎
  26. United Nations, “Addressing the Impact of the COVID-19 Pandemic on Violence Against Women and Girls,” November 20202, accessed: https://www.un.org/en/addressing-impact-covid-19-pandemic-violence-against-women-and-girls. ↩︎
  27. The Global Fund, The Impact of COVID-19 on HIV, TB and Malaria Services and Systems for Health: A Snapshot from 502 Health Facilities Across Africa and Asia, April 2021, accessed: https://www.theglobalfund.org/media/10776/covid-19_2020-disruption-impact_report_en.pdf. ↩︎
  28. The World Bank, “Global Economy to Expand by 4% in 2021; Vaccine Deployment and Investment Key to Sustaining the Recovery,” January 2021, accessed: https://www.worldbank.org/en/news/press-release/2021/01/05/global-economy-to-expand-by-4-percent-in-2021-vaccine-deployment-and-investment-key-to-sustaining-the-recovery. ↩︎
  29. International Monetary Fund, “Sub-Saharan Africa: Navigating a Long Pandemic,” April 2021, accessed: https://www.imf.org/en/News/Articles/2021/04/14/pr21108-sub-saharan-africa-navigating-a-long-pandemic. ↩︎
  30. The Global Fund launched an immediate response to COVID-19 to help mitigate the impact of COVID-19 on HIV, TB, and malaria programs and support national COVID-19 responses. This includes new funding and grant flexibilities, among other measures. For more information, see: “The Global Fund, Our COVID-19 Response,” accessed: https://www.theglobalfund.org/en/our-covid-19-response/ (August 12, 2021). ↩︎
  31. Golin R, et al, “PEPFAR’s response to the convergence of the HIV and COVID‐19 pandemics in Sub‐Saharan Africa,” Journal of the International AIDS Society, accessed: https://www.ncbi.nlm.nih.gov/pmc/articles/PMC7405155/. ↩︎
  32. U.S. Department of State, PEPFAR Technical Guidance in the Context-19 Pandemic, accessed: https://www.state.gov/pepfar/coronavirus/ (August 12, 2021). ↩︎
  33. U.S. Department of State, PEPFAR Technical Guidance in the Context-19 Pandemic, accessed: https://www.state.gov/pepfar/coronavirus/ (August 12, 2021). ↩︎
  34. U.S. Department of State, PEPFAR 2021 Country & Regional Operational Plan (COP/ROP) Guidance for All PEPFAR Countries, accessed: https://www.state.gov/wp-content/uploads/2021/02/PEPFAR-COP21-Guidance-Final.pdf. ↩︎
  35. U.S. Department of State, PEPFAR Update – Stakeholder Townhall (presentation on August 2, 2021), provided to KFF by the Office of the Global AIDS Coordinator. ↩︎
  36. U.S. Department of State, PEPFAR Update – Stakeholder Townhall (presentation on August 2, 2021), provided to KFF by the Office of the Global AIDS Coordinator. ↩︎
  37. Mehta N et al., “Impact of COVID-19 on HIV treatment interruption in seven PEPFAR countries, April-June 2020,” 11th IAS Conference on HIV Science, 2021, Abstract ALX01LB04. ↩︎
  38. U.S. Department of State, PEPFAR Update – Stakeholder Townhall (presentation on August 2, 2021), provided to KFF by the Office of the Global AIDS Coordinator. ↩︎
  39. U.S. Congress, H.R. 1319, “American Rescue Plan Act of 2021,” January 3, 2021, accessed: https://www.congress.gov/117/bills/hr1319/BILLS-117hr1319enr.pdf. ↩︎
  40. U.S. Department of State, PEPFAR Update – Stakeholder Townhall (presentation on August 2, 2021), provided to KFF by the Office of the Global AIDS Coordinator. ↩︎
  41. White House. National Strategy for the COVID-19 Response and Pandemic Preparedness, January 21, 2020, accessed: https://www.whitehouse.gov/wp-content/uploads/2021/01/National-Strategy-for-the-COVID-19-Response-and-Pandemic-Preparedness.pdf. ↩︎
  42. KFF, Breaking Down the U.S. Global Health Budget by Program Area, May 2021. ↩︎
  43. Not including emergency funding appropriated in FY 2021 for COVID-19. ↩︎
  44. KFF, “White House Releases Full FY 2022 Budget Request,” June 2, 2021. ↩︎
  45. UNAIDS, Fact Sheet 2021, accessed: https://www.unaids.org/sites/default/files/media_asset/UNAIDS_FactSheet_en.pdf (July 27, 2021). ↩︎
  46. U.S. Office of Management and Budget, Major Savings and Reforms: Budget of the U.S. Government Fiscal Year 2018, accessed: https://www.govinfo.gov/content/pkg/BUDGET-2018-MSV/pdf/BUDGET-2018-MSV.pdf (page 70). ↩︎
  47. Igoe M, “PEPFAR to 'accelerate' implementation in 13 countries under new strategy,” September 19, 2017, Devex, accessed: https://www.devex.com/news/pepfar-to-accelerate-implementation-in-13-countries-under-new-strategy-91064#:~:text=The%20initiative%20will%20maintain%20lifesaving,treating%20HIV%2C%20the%20official%20said (August 12, 2021). ↩︎
  48. KFF/UNAIDS, Donor Government Funding for HIV in Low- and Middle-Income Countries in 2020, July 2021. ↩︎
  49. UNAIDS, UNAIDS Data 2020, 2020, accessed: https://www.unaids.org/sites/default/files/media_asset/2020_aids-data-book_en.pdf (May 15, 2021). ↩︎
  50. UNAIDS, Prevailing Against Pandemics by Putting People at the Centre, December 2020, accessed: https://www.unaids.org/sites/default/files/media_asset/prevailing-against-pandemics_en.pdf (May 10, 2021). ↩︎
  51. Kates J et al., “Domestic government spending on HIV: Three scenarios assessing decreased donor support,” International AIDS Conference 2018, Abstract 7731, accessed: https://programme.aids2018.org/Abstract/Abstract/7731. ↩︎
  52. KFF, Forthcoming analysis, 2021. ↩︎
  53. See, for example, the discussion by Members of Congress during consideration of PEPFAR’s 2018 reauthorization, accessed: https://www.govinfo.gov/content/pkg/CREC-2018-11-13/pdf/CREC-2018-11-13-pt1-PgH9488.pdf; a letter from Representative Kay Granger, accessed: https://kaygranger.house.gov/2018/12/bipartisan-achievement-s-saving-lives-0; and this Devex article, accessed: https://www.devex.com/news/opinion-we-started-pepfar-politicizing-aids-would-be-a-disaster-91659. ↩︎
  54. See, for example, the House of Representatives’ Committee Report accompanying the 2018 reauthorization of PEPFAR, that states, “While goals such as strengthening health systems, combatting non-communicable diseases, and establishing social safety nets for children in adversity are worthy objectives—and PEPFAR and the Global Fund clearly have had corollary, net-positive effects on these and other global health and development priorities—these objectives can and should be addressed through different initiatives. PEPFAR’s past and future success is contingent on remaining focused upon the three core diseases.” See: https://www.congress.gov/115/crpt/hrpt1014/CRPT-115hrpt1014.pdf. ↩︎
  55. KFF calculations on member composition of the U.S. Congress. ↩︎
  56. UNAIDS, Seizing the Moment: Global AIDS Update 2020, accessed: https://www.unaids.org/sites/default/files/media_asset/2020_global-aids-report_executive-summary_en.pdf. ↩︎
  57. PEPFAR’s initial focus countries were primarily those that were targeted by President Clinton’s 1999 “LIFE” Initiative, see: https://clintonwhitehouse4.archives.gov/media/pdf/2pager.pdf), and President George W. Bush’s 2002 “International Mother and Child HIV Prevention Initiative,” see: https://georgewbush-whitehouse.archives.gov/news/releases/2002/06/20020619-3.html. ↩︎
  58. UNAIDS, Global AIDS Strategy 2021-2026, End Inequalities. End AIDS, July 2021, accessed: https://www.unaids.org/sites/default/files/media_asset/global-AIDS-strategy-2021-2026_en.pdf (May 16, 2021). ↩︎
  59. White House, U.S. COVID-19 Global Response and Recovery Framework, July 1, 2021, accessed: https://www.whitehouse.gov/wp-content/uploads/2021/07/U.S.-COVID-19-Global-Response-and-Recovery-Framework.pdf. ↩︎
  60. USAID, “Equity in Health,” accessed: https://www.usaid.gov/global-health/global-health-newsletter/equity-in-health (accessed August 12, 2021). ↩︎
  61. KFF analysis of data from the U.S. Department of State’s U.S. Foreign Assistance Dashboard, accessed: www.foreignassistance.gov; U.S. Department of State, “Where We Work – PEPFAR” webpage, accessed: https://www.state.gov/where-we-work-pepfar (July 2021); U.S. Department of State, PEPFAR 2021 Country & Regional Operational Plan (COP/ROP) Guidance for All PEPFAR Countries, accessed: https://www.state.gov/wp-content/uploads/2021/02/PEPFAR-COP21-Guidance-Final.pdf; CDC’s Global HIV & Tuberculosis “Where We Work” webpage, accessed: https://www.cdc.gov/globalhivtb/index.html (July 2021). ↩︎
  62. 14 countries were specified in PEPFAR’s 2003 authorizing legislation: Botswana, Côte d’Ivoire, Ethiopia, Guyana, Haiti, Kenya, Mozambique, Namibia, Nigeria, Rwanda, South Africa, Tanzania, Uganda, and Zambia. Viet Nam was added in 2004. ↩︎
  63. These 13 countries are: Botswana, Côte d’Ivoire, Haiti, Kenya, Lesotho, Malawi, Namibia, Rwanda, Swaziland, Tanzania, Uganda, Zambia, and Zimbabwe. Nine are original focus countries. ↩︎
  64. U.S. Department of State, Strategy for Accelerating HIV/AIDS Epidemic Control (2017-2020), September 2017, accessed: https://www.state.gov/wp-content/uploads/2019/08/PEPFAR-Strategy-for-Accelerating-HIVAIDS-Epidemic-Control-2017-2020.pdf. ↩︎
  65. KFF analysis data from the U.S. Department of State’s U.S. Foreign Assistance Dashboard, accessed: www.foreignassistance.gov (July 2021). ↩︎
  66. KFF analysis of UNAIDS 2020 epidemiological data, accessed:  https://www.unaids.org/en/resources/documents/2021/HIV_estimates_with_uncertainty_bounds_1990-present (August 12, 2021). ↩︎
  67. UNAIDS, Global AIDS Strategy 2021-2026, End Inequalities. End AIDS, July 2021, accessed: https://www.unaids.org/sites/default/files/media_asset/global-AIDS-strategy-2021-2026_en.pdf (May 16, 2021). ↩︎
  68. UNAIDS, 2021 HLM report slides, June 2021, accessed: https://www.unaids.org/en/resources/documents/2021/2021-HLM-report-slides. ↩︎
  69. amfAR, PEPFAR Country/Regional Operational Plans (COPs/ROPs) Database, accessed: https://copsdata.amfar.org/s/2020# (August 12, 2021). ↩︎
  70. This was a sense of Congress for FY 2004-2005 and a requirement as of FY 2006. ↩︎
  71. GAO, Spending Requirement Presents Challenges for Allocating Prevention Funding under the President’s Emergency Plan for AIDS Relief, 2006, GAO-06-395, accessed: https://www.gao.gov/assets/gao-06-395.pdf (March 16, 2021). ↩︎
  72. Institute of Medicine, PEPFAR Implementation: Progress and Promise, 2007, accessed: https://www.nap.edu/catalog/11905/pepfar-implementation-progress-and-promise. ↩︎
  73. The program is now required to spend at least half of bilateral funding on treatment and care and the 33% abstinence earmark was replaced with a requirement for “balanced funding” for prevention, although PEPFAR is still required to report to Congress if it spends less than 50% of its prevention funding on abstinence and related activities. ↩︎
  74. U.S. Department of State, DREAMS Partnership Fact Sheet 2019, accessed: https://www.state.gov/wp-content/uploads/2020/01/DREAMS-Partnership-Fact-Sheet_WAD_2019.pdf (May 16, 2021). ↩︎
  75. U.S. Department of State, DREAMS Partnership (webpage), accessed: https://www.state.gov/pepfar-dreams-partnership/ (August 13, 2021). ↩︎
  76. Fleischman J., Five Years of DREAMS and What Lies Ahead: How to Address the Intersecting Crises of HIV, Gender Inequality, and Health Security, May 2021, Center for Strategic & International Studies, accessed: https://www.csis.org/analysis/five-years-dreams-and-what-lies-ahead. ↩︎
  77. UNAIDS, Global AIDS Strategy 2021-2026, End Inequalities. End AIDS, July 2021, accessed: https://www.unaids.org/sites/default/files/media_asset/global-AIDS-strategy-2021-2026_en.pdf (May 16, 2021). ↩︎
  78. UNAIDS, Global Commitments, Local Action: After 40 years of AIDS, charting a course to end the pandemic, 2021, accessed: https://www.unaids.org/sites/default/files/media_asset/global-commitments-local-action_en.pdf (June 4, 2021). ↩︎
  79. U.S. Department of State, Draft Overview – PEPFAR Strategy: Vision 2025, accessed: https://www.state.gov/development-of-the-next-pepfar-strategy-vision-2025/ (September 10, 2021). ↩︎
  80. Institute of Medicine, Evaluation of PEPFAR, 5. Prevention, 2013, accessed: https://www.ncbi.nlm.nih.gov/books/NBK207004/. ↩︎
  81. U.S. Department of State, Key Populations (webpage), accessed: https://www.state.gov/key-populations/ (August 13, 2021). ↩︎
  82. Based on analysis of data from the PEPFAR Panorama Spotlight Dashboards, accessed: https://data.pepfar.gov/ (September 9, 2021). ↩︎
  83. MPact Global Action, “Key Populations Push Secretary of State for Funding,” March 21, 2021, accessed: https://mpactglobal.org/key-populations-push-secretary-of-state-for-funding/. ↩︎
  84. UNAIDS, Seizing the Moment: Global AIDS Update 2020, accessed: https://www.unaids.org/sites/default/files/media_asset/2020_global-aids-report_executive-summary_en.pdf. ↩︎
  85. Barr D, et al, “Key populations are the future of the African HIV/AIDS pandemic,” Journal of the International AIDS Society, June 30, 2021, accessed: https://onlinelibrary.wiley.com/doi/10.1002/jia2.25750. ↩︎
  86. Institute of Medicine, PEPFAR Implementation: Progress and Promise, 2007, accessed: https://www.nap.edu/catalog/11905/pepfar-implementation-progress-and-promise. ↩︎
  87. Fleischman J., Time to Address the Intersecting Crises of Covid-19, HIV, and Gender Inequality, November 2020, Center for Strategic & International Studies, accessed: https://www.csis.org/analysis/time-address-intersecting-crises-covid-19-hiv-and-gender-inequality. ↩︎
  88. Fleischman J., Five Years of DREAMS and What Lies Ahead: How to Address the Intersecting Crises of HIV, Gender Inequality, and Health Security, May 2021, Center for Strategic & International Studies, accessed: https://www.csis.org/analysis/five-years-dreams-and-what-lies-ahead. ↩︎
  89. UNAIDS, Confronting Inequalities: Lessons for pandemic responses from 40 years of AIDS: Global AIDS Update 2021, accessed: https://www.unaids.org/sites/default/files/media_asset/2021-global-aids-update_en.pdf (August 4, 2021). ↩︎
  90. UNAIDS, Evidence Review: Implementation of the 2016-2021 UNAIDS Strategy On the Fast Track to End AIDS, 47th meeting of the UNAIDS Program Coordinating Board, UNAIDS/PCB(47)/CRP3, accessed: https://www.unaids.org/sites/default/files/media_asset/PCB47_CRP3_Evidence_Review_EN.pdf (May 16, 2021). ↩︎
  91. Fleischman J., Five Years of DREAMS and What Lies Ahead: How to Address the Intersecting Crises of HIV, Gender Inequality, and Health Security, May 2021, Center for Strategic & International Studies, accessed: https://www.csis.org/analysis/five-years-dreams-and-what-lies-ahead. ↩︎
  92. Milanga M and Volgina A, “Opinion: PEPFAR and the Global Fund must improve care for HIV-positive children,” January 27, 2021, Devex, accessed: https://www.devex.com/news/opinion-pepfar-and-the-global-fund-must-improve-care-for-hiv-positive-children-98860. ↩︎
  93. U.S. Department of State, PEPFAR 2021 Annual Report to Congress, accessed: https://www.state.gov/wp-content/uploads/2021/02/PEPFAR2021AnnualReporttoCongress.pdf. ↩︎
  94. UNAIDS, “Joint statement calling for urgent country scale-up of access to optimal HIV treatment for infants and children living with HIV,” December 22, 2020, accessed: https://www.unaids.org/en/resources/presscentre/featurestories/2020/december/treatment-for-children-living-with-hiv. ↩︎
  95. UNAIDS, Start Free, Stay Free, AIDS Free: Final report on 2020 targets, 2021, accessed: https://www.unaids.org/sites/default/files/media_asset/2021_start-free-stay-free-aids-free-final-report-on-2020-targets_en.pdf (August 4, 2021). ↩︎
  96. U.S. Department of State, Men (webpage), accessed: https://www.state.gov/populations/men/ (August 14, 2021). ↩︎
  97. Fleischman J., Five Years of DREAMS and What Lies Ahead: How to Address the Intersecting Crises of HIV, Gender Inequality, and Health Security, May 2021, Center for Strategic & International Studies, accessed: https://www.csis.org/analysis/five-years-dreams-and-what-lies-ahead. ↩︎
  98. Caswell G et al., “The continuing role of communities affected by HIV in sustained engagement in health and rights,” June 30, 2021, Journal of the International AIDS Society, accessed: https://onlinelibrary.wiley.com/doi/10.1002/jia2.25724. ↩︎
  99. UNAIDS, Global AIDS Strategy 2021-2026, End Inequalities. End AIDS, July 2021, accessed: https://www.unaids.org/sites/default/files/media_asset/global-AIDS-strategy-2021-2026_en.pdf (June 5, 2021). ↩︎
  100. U.S. Congress, Public Law No: 110-293, “Tom Lantos and Henry J. Hyde United States Global Leadership Against HIV/AIDS, Tuberculosis, and Malaria Reauthorization Act of 2008”, July 30, 2008, accessed: https://www.congress.gov/bill/110th-congress/house-bill/5501. ↩︎
  101. USAID’s Health Finance and Governance Project, An Assessment of PEPFAR partnership frameworks and Partnership framework implementation plans, June 2017, accessed: https://www.hfgproject.org/an-assessment-of-pepfar-partnership-frameworks-and-partnership-framework-implementation-plans/. ↩︎
  102. U.S. Department of State, FY 2014 Country Operational Plan (COP) Guidance. ↩︎
  103. “Index testing” is a testing strategy that works to notify partners of people who test HIV-positive and offer them HIV testing services. ↩︎
  104. U.S. Department of State, PEPFAR Guidance on Implementing Safe and Equitable Index Testing Services, July 2020, accessed: https://www.pepfarsolutions.org/tools-2/2020/7/10/pepfar-guidance-on-implementing-safe-and-ethical-index-testing-services (June 7, 2021). ↩︎
  105. Health Gap, PEPFAR Watch, Measuring Up: Tracking PEPFAR’s Accountability to People Living with HIV 2020-21, 2021, accessed: https://healthgap.org/wp-content/uploads/2021/02/2020-21-Measuring-Up-FINAL.pdf (June 7, 2021). ↩︎
  106. Health Gap, How can you influence PEPFAR plans in your country? April 2016, accessed: https://healthgap.org/wp-content/uploads/2018/11/Fact_Sheet_-_PEPFAR_COP_Engagement.pdf (May 23, 2021). ↩︎
  107. U.S. Department of State, PEPFAR 2021 Country & Regional Operational Plan (COP/ROP) Guidance for All PEPFAR Countries, accessed: https://www.state.gov/wp-content/uploads/2021/02/PEPFAR-COP21-Guidance-Final.pdf. ↩︎
  108. Cromer C et al., The Family Planning Graduation Experience: Lessons for the Future, October 2014, Poptech, accessed: https://www.rhsupplies.org/uploads/tx_rhscpublications/The_FP_Graduation_Experience-Lessons_for_Future.pdf. ↩︎
  109. McDonough A. and Rodríguez DC, “How donors support civil society as government accountability advocates: a review of strategies and implications for transition of donor funding in global health,” November 2020, Globalization and Health, accessed: https://globalizationandhealth.biomedcentral.com/articles/10.1186/s12992-020-00628-6. ↩︎
  110. George G et al., “The Challenges of Transition From Donor-Funded Programs: Results From a Theory-Driven Multi-Country Comparative Case Study of Programs in Eastern Europe and Central Asia Supported by the Global Fund,” June 2019, Global Health: Science and Practice, accessed: https://www.ghspjournal.org/content/7/2/258. ↩︎
  111. UNAIDS, Seizing the Moment: Tackling Entrenched Inequalities to End Epidemics, 2020, accessed: https://www.unaids.org/sites/default/files/media_asset/2020_global-aids-report_en.pdf (accessed on May 16, 2021). ↩︎
  112. U.S. Department of State, PEPFAR 2021 Country & Regional Operational Plan (COP/ROP) Guidance for All PEPFAR Countries, accessed: https://www.state.gov/wp-content/uploads/2021/02/PEPFAR-COP21-Guidance-Final.pdf. ↩︎
  113. U.S. Congress, Public Law No: 108-25, “United States Leadership Against HIV/AIDS, Tuberculosis, and Malaria Act of 2003”, May 27, 2003, accessed: https://www.congress.gov/bill/108th-congress/house-bill/1298. ↩︎
  114. U.S. Department of State, The President’s Emergency Plan for AIDS Relief: U.S. Five-Year Global HIV/AIDS Strategy, accessed: https://web.archive.org/web/20070214212818/http:/www.state.gov/documents/organization/29831.pdf (June 4, 2021). ↩︎
  115. Institute of Medicine, PEPFAR Implementation: Progress and Promise, 2007, accessed: https://www.nap.edu/catalog/11905/pepfar-implementation-progress-and-promise. ↩︎
  116. Institute of Medicine, PEPFAR Implementation: Progress and Promise, 2007, accessed: https://www.nap.edu/catalog/11905/pepfar-implementation-progress-and-promise. ↩︎
  117. USAID’s Health Finance and Governance Project, An Assessment of PEPFAR partnership frameworks and Partnership framework implementation plans, June 2017, accessed: https://www.hfgproject.org/an-assessment-of-pepfar-partnership-frameworks-and-partnership-framework-implementation-plans/. ↩︎
  118. U.S. Department of State, PEPFAR Supporting Country Ownership: Advancing a Sustainable Response, 2013, accessed: https://reliefweb.int/sites/reliefweb.int/files/resources/PEPFAR%20Supporting%20Country%20Ownership.pdf (August 24, 2021). ↩︎
  119. UNAIDS, “U.S. Secretary of State John Kerry unveils new model for PEPFAR engagement,” September 2013, accessed: https://www.unaids.org/en/resources/presscentre/featurestories/2013/september/20130926soskerry (August 24, 2021). ↩︎
  120. U.S. Department of State, PEPFAR 2014 Annual Report to Congress, accessed: https://www.state.gov/wp-content/uploads/2019/08/PEPFAR-2014-Annual-Report-to-Congress.pdf. ↩︎
  121. USAID, Fostering PEPFAR Sustainability through Leadership, Management, and Governance: A Literature Review, September 2017, accessed: https://www.usaid.gov/sites/default/files/documents/1864/PY6_O3.9_Fostering_PEPFAR_Sustainability_through_LMG_FINAL_09.22.17-508.pdf. ↩︎
  122. U.S. CDC, Supporting the Transition of HIV Services To Local Partners, October 2020, accessed: https://www.cdc.gov/globalhivtb/images/Supporting-the-Transition-of-HIV-Services-to-Local-Partners-Policy-Brief.pdf. ↩︎
  123. U.S. Department of State, PEPFAR 2021 Country & Regional Operational Plan (COP/ROP) Guidance for All PEPFAR Countries, page 75, accessed: https://www.state.gov/wp-content/uploads/2021/02/PEPFAR-COP21-Guidance-Final.pdf. ↩︎
  124. U.S. Department of State, Draft Overview – PEPFAR Strategy: Vision 2025, accessed: https://www.state.gov/development-of-the-next-pepfar-strategy-vision-2025/ (September 10, 2021). ↩︎
  125. The 95-95-95 targets were adopted by U.N. member states at the U.N. General Assembly High-Level Meeting on HIV/AIDS in 2021, are successors to the earlier 90-90-90 targets for 2020. The new targets provide that: by 2025, 95% of all people living with HIV will know their HIV status, 95% of people with an HIV diagnosis will receive antiretroviral therapy, and 95% of people receiving HIV treatment will achieve viral suppression. ↩︎
  126. U.S. Department of State, PEPFAR 2021 Country & Regional Operational Plan (COP/ROP) Guidance for All PEPFAR Countries, page 28, accessed: https://www.state.gov/wp-content/uploads/2021/02/PEPFAR-COP21-Guidance-Final.pdf. ↩︎
  127. The Global Fund, Guidance Note: Sustainability, Transition and Co-financing, May 2020, accessed: https://www.theglobalfund.org/media/5648/core_sustainabilityandtransition_guidancenote_en.pdf. ↩︎
  128. Gavi, the Vaccine Alliance, Gavi Alliance Eligibility and Transition Policy Version 3.0, accessed: https://www.gavi.org/sites/default/files/document/gavi-eligibility-and-transition-policypdf.pdf. ↩︎
  129. Chaudhry RG et al., “Graduation and Phase-Out in the Health Sector: What Have We Learned?” USAID, Spring 2012, accessed: https://pdf.usaid.gov/pdf_docs/pbaaa917.pdf. ↩︎
  130. Hecht R et al., “Donor Transitions From HIV Programs: What Is The Impact On Vulnerable Populations?” Health Affairs, December 2018, accessed: https://www.healthaffairs.org/do/10.1377/hblog20181213.623294/full/. ↩︎
  131. Kallenberg J et al., “Gavi’s Transition Policy: Moving From Development Assistance To Domestic Financing Of Immunization Programs,” Health Affairs, February 2016, accessed: https://www.healthaffairs.org/doi/full/10.1377/hlthaff.2015.1079. ↩︎
  132. UNAIDS, UNAIDS Data 2020, 2020, accessed: https://www.unaids.org/sites/default/files/media_asset/2020_aids-data-book_en.pdf (May 15, 2021). ↩︎
  133. Friebel R et al., “Challenges of Social Health Insurance in Low- and Lower-Middle Income Countries: Balancing Limited Budgets and Pressure to Provide Universal Health Coverage,” Center for Global Development, October 2020, accessed: https://www.cgdev.org/blog/challenges-social-health-insurance-low-and-lower-middle-income-countries-balancing-limited. ↩︎
  134. U.S. Global Leadership Coalition, COVID-19 Brief: Impact on the Economies of Developing Countries, 2021, accessed: https://www.usglc.org/coronavirus/economies-of-developing-countries/ (May 23, 2021). ↩︎
  135. KFF, The U.S. Government and Global Health Security, May 2021. ↩︎
  136. KFF, What Will Be the Contours of the Biden Administration’s Global Health Agenda? February 2021. ↩︎
  137. White House, “Executive Order on Organizing and Mobilizing the United States Government to Provide a Unified and Effective Response to Combat COVID-⁠19 and to Provide United States Leadership on Global Health and Security,” January 2021, accessed: https://www.whitehouse.gov/briefing-room/presidential-actions/2021/01/20/executive-order-organizing-and-mobilizing-united-states-government-to-provide-unified-and-effective-response-to-combat-covid-19-and-to-provide-united-states-leadership-on-global-health-and-security/. ↩︎
  138. White House, “National Security Memorandum on United States Global Leadership to Strengthen the International COVID-⁠19 Response and to Advance Global Health Security and Biological Preparedness,” January 2021, accessed: https://www.whitehouse.gov/briefing-room/statements-releases/2021/01/21/national-security-directive-united-states-global-leadership-to-strengthen-the-international-covid-19-response-and-to-advance-global-health-security-and-biological-preparedness/. ↩︎
  139. KFF, Global Health Legislation Tracker, updated August 2021. ↩︎
  140. U.S. Department of State, PEPFAR Fact Sheet, February 2021, accessed: https://www.state.gov/wp-content/uploads/2021/02/PEPFAR-Overall-Fact-Sheet_2021.pdf. ↩︎
  141. Golin R, et al, “PEPFAR’s response to the convergence of the HIV and COVID‐19 pandemics in Sub‐Saharan Africa,” Journal of the International AIDS Society, accessed: https://www.ncbi.nlm.nih.gov/pmc/articles/PMC7405155/. ↩︎
  142. UNAIDS, COVID-19 and HIV: 1 moment, 2 epidemics, 3 opportunities – how to seize the moment to learn, leverage and build a new way forward for everyone’s health and rights, 2020, accessed: https://www.unaids.org/sites/default/files/media_asset/20200909_Lessons-HIV-COVID19.pdf (May 12, 2021). ↩︎
  143. Daschle T, Frist B, Building Prosperity, Stability, and Security Through Strategic Health Diplomacy: A Study of 15 Years of PEPFAR, 2018, Bipartisan Policy Center, accessed: https://bipartisanpolicy.org/wp-content/uploads/2019/03/Building-Prosperity-Stability-and-Security-Through-Strategic-Health-Diplomacy-A-Study-of-15-Years-of-PEPFAR.pdf (May 16, 2021). ↩︎
  144. Testimony of USAID Administrator Rajiv Shah, “Hearing on Combating Ebola in West Africa: The International Response, Committee on Foreign Affairs, House of Representatives,” November 13, 2014, accessed: https://www.govinfo.gov/content/pkg/CHRG-113hhrg91450/html/CHRG-113hhrg91450.htm (June 5, 2021). ↩︎
  145. KFF, The U.S. & The Global Fund to Fight AIDS, Tuberculosis and Malaria, November 2019. ↩︎
  146. U.S. Congress, Public Law No: 110-293, “Tom Lantos and Henry J. Hyde United States Global Leadership Against HIV/AIDS, Tuberculosis, and Malaria Reauthorization Act of 2008”, July 30, 2008, accessed: https://www.congress.gov/bill/110th-congress/house-bill/5501. ↩︎
  147. KFF analysis of data from the UNAIDS HIV Financial Dashboard, accessed: https://hivfinancial.unaids.org/hivfinancialdashboards.html#. ↩︎
  148. Summers T, “The Global Fund and PEPFAR: Complementary, Successful, and Under Threat,” Center for Strategic and International Studies, August 2017, accessed: https://csis-website-prod.s3.amazonaws.com/s3fs-public/publication/170901_Summers_GlobalFundPEPFAR_Web.pdf. ↩︎
  149. KFF, Funding for Key HIV Commodities in PEPFAR Countries, July 2021. ↩︎
  150. U.S. Department of State, Draft Overview – PEPFAR Strategy: Vision 2025, accessed: https://www.state.gov/development-of-the-next-pepfar-strategy-vision-2025/ (September 10, 2021). ↩︎
  151. U.S. Department of State, The President’s Emergency Plan for AIDS Relief: U.S. Five-Year Global HIV/AIDS Strategy, accessed: https://web.archive.org/web/20070214212818/http:/www.state.gov/documents/organization/29831.pdf (June 4, 2021). ↩︎
  152. National Academies, “New IOM Report Highlights PEPFAR's Successes, Calls on Initiative to Intensify Efforts to Enhance Partner Countries' Management of Programs and to Improve Prevention,” Press Release, accessed: https://www8.nationalacademies.org/onpinews/newsitem.aspx?RecordID=18256. ↩︎
  153. Daschle T, Frist B, Building Prosperity, Stability, and Security Through Strategic Health Diplomacy: A Study of 15 Years of PEPFAR, 2018, Bipartisan Policy Center, accessed: https://bipartisanpolicy.org/wp-content/uploads/2019/03/Building-Prosperity-Stability-and-Security-Through-Strategic-Health-Diplomacy-A-Study-of-15-Years-of-PEPFAR.pdf (May 16, 2021). ↩︎
  154. Collins C et al., “Four Principles for Expanding PEPFAR’s Role as a Vital Force in U.S. Health Diplomacy Abroad,” Health Affairs, July 2012, accessed: https://www.healthaffairs.org/doi/10.1377/hlthaff.2012.0204. ↩︎
  155. Kolker J. “A Diplomat’s Perspective on Use of Science and Evidence in Implementing PEPFAR,” April 2018, Science and Diplomacy, accessed: https://www.sciencediplomacy.org/article/2018/kolker-pepfar. ↩︎
  156. U.S. Department of State, “Statement from Ambassador Deborah Birx, M.D., U.S. Global AIDS Coordinator, on the Principles of PEPFAR's Public Health Approach,” April 2014, accessed: https://web.archive.org/web/20150905071637/http:/www.pepfar.gov/press/releases/2014/224738.htm. ↩︎
  157. U.S. Department of State, PEPFAR 2021 Country & Regional Operational Plan (COP/ROP) Guidance for All PEPFAR Countries, page 340, accessed: https://www.state.gov/wp-content/uploads/2021/02/PEPFAR-COP21-Guidance-Final.pdf. ↩︎
  158. Ahonkhai AA et al. “The impact of user fees on uptake of HIV services and adherence to HIV treatment: Findings from a large HIV program in Nigeria,” September 2020, PLOS ONE, accessed: https://journals.plos.org/plosone/article?id=10.1371/journal.pone.0238720. ↩︎
  159. U.S. Department of State. U.S. Embassy and Consulate in Nigeria. “U.S. Urges Removal of User-fees for People Living with HIV,” October 2019, accessed: https://ng.usembassy.gov/u-s-urges-removal-of-user-fees-for-people-living-with-hiv/. ↩︎
  160. Daschle T, Frist B, Building Prosperity, Stability, and Security Through Strategic Health Diplomacy: A Study of 15 Years of PEPFAR, 2018, Bipartisan Policy Center, accessed: https://bipartisanpolicy.org/wp-content/uploads/2019/03/Building-Prosperity-Stability-and-Security-Through-Strategic-Health-Diplomacy-A-Study-of-15-Years-of-PEPFAR.pdf (May 16, 2021). ↩︎
  161. Daschle T, Frist B, The Case for Strategic Health Diplomacy: A Study of PEPFAR, 2015, Bipartisan Policy Center, accessed: https://bipartisanpolicy.org/wp-content/uploads/2019/03/BPC_Strategic-Health-November-2015.pdf (May 16, 2021). ↩︎
  162. KFF, An Assessment of Policy Alignment with International Standards in PEPFAR Countries, Forthcoming September 2021. ↩︎
  163. Ingram G, Making USAID a premier development agency, February 2021, Brookings, accessed: https://www.brookings.edu/research/making-usaid-a-premier-development-agency/. ↩︎
  164. O’Neill Institute for National and Global Health Law at Georgetown University Law Center, Reorganization and the Future of PEPFAR; Implications of State and USAID Reform, 2018. ↩︎
  165. U.S. Department of State, Gayle E. Smith: Coordinator for Global COVID Response and Health Security, accessed: www.state.gov/biographies/gayle-e-smith/ (August 25, 2021). ↩︎
  166. U.S. Senate Committee on Foreign Relations, “Risch, Menendez Introduce Comprehensive Global Health Legislation to Respond to COVID-19 and Better Prepare for Future Pandemics,” June 28, 2021, accessed: https://www.foreign.senate.gov/press/ranking/release/risch-menendez-introduce-comprehensive-global-health-legislation-to-respond-to-covid-19-and-better-prepare-for-future-pandemics-. ↩︎
  167. Institute of Medicine, PEPFAR Implementation: Progress and Promise, 2007, accessed: https://www.nap.edu/catalog/11905/pepfar-implementation-progress-and-promise. ↩︎
  168. Center for Strategic and International Studies, Improving the Health of Women, Girls, and Families around the World, 2017, accessed: http://vision2017.csis.org/wp-content/uploads/2017/02/cross_sectional_studies_multisectoral_integration.pdf. ↩︎
  169. U.S. Department of State, PEPFAR 2021 Country & Regional Operational Plan (COP/ROP) Guidance for All PEPFAR Countries, page 400, accessed: https://www.state.gov/wp-content/uploads/2021/02/PEPFAR-COP21-Guidance-Final.pdf. ↩︎

The Red/Blue Divide in COVID-19 Vaccination Rates

Authors: Jennifer Kates, Jennifer Tolbert, and Kendal Orgera
Published: Sep 14, 2021

There continue to be differences in COVID-19 vaccination rates along partisan lines, a gap that has grown over time. We’ve documented this in our COVID-19 Vaccine Monitor surveys of the public, and we’ve been tracking county-level data to assess vaccination rates in counties that voted for Trump in the 2020 Presidential election compared to those that voted for Biden.

As of September 13, 2021, 52.8% of people in counties that voted for Biden were fully vaccinated compared to 39.9% of Trump counties, a 12.9 percentage point difference (Figure 1). While the rate of vaccination coverage has slowed in both county groups, the gap has widened over time (Figure 2).

Vaccination Rates in Counties that Voted for Biden and Counties that Voted for Trump, April - September 2021
The Gap in Vaccination Rates Between Counties that Voted for Biden and Counties that Voted for Trump, April – September 2021

Whether President Biden’s recent actions to address the ongoing impact of COVID-19 in the U.S., including a federal employee vaccine mandate and a requirement that all employers with more than 100 employees institute a vaccine mandate or regular testing, will be enough to increase vaccination rates and narrow this gap remains to be seen.

This data snapshot is based on an analysis of data on the share of the population fully vaccinated by county from the Centers for Disease Control and Prevention’s (CDC) COVID-19 Integrated County View and data on the 2020 Presidential election results by county from here (for more detailed methods, see: https://www.kff.org/coronavirus-covid-19/issue-brief/vaccination-is-local-covid-19-vaccination-rates-vary-by-county-and-key-characteristics/).