Donor Government Funding for HIV in Low- and Middle-Income Countries in 2024

Authors: Adam Wexler, Jennifer Kates, and Eric Lief
Published: Jul 10, 2025

Overview

This report, Donor Government Funding for HIV in Low- and Middle-Income Countries in 2024, tracks funding levels of the donor governments that collectively provide the bulk of international assistance for AIDS through bilateral programs and contributions to multilateral organizations. The new report, produced as a partnership between KFF and UNAIDS, provides the latest data available on donor funding disbursements based on data provided by governments. It includes their bilateral assistance to low- and middle-income countries and contributions to the Global Fund to Fight AIDS, Tuberculosis and Malaria as well as UNITAID.

Previous versions by publish date:

July 2023 (.pdf)

July 2022 (.pdf)

July 2021 (.pdf)

July 2020 (.pdf)

July 2019 (.pdf)

July 2018 (.pdf)

July 2017 (.pdf)

July 2016 (.pdf)

July 2015 (.pdf)

July 2014 (.pdf)

September 2013 (.pdf)

July 2012 (.pdf)

July 2011 (.pdf)

July 2010 (.pdf)

July 2009 (.pdf)

July 2008 (.pdf)

June 2007 (.pdf)

July 2006 (.pdf)

July 2005 (.pdf)

Key Findings

In 2025, the donor government funding landscape fundamentally changed. Under the new administration, the United States, the largest donor to HIV in the world, has instituted significant changes to global health programs including freezing, and then cancelling, most global HIV projects, restricting allowable activities, and seeking to cut HIV funding by at least 40%, actions which have collectively driven down disbursements. In addition, several other large donors to HIV – the United Kingdom, Germany and France – have also signaled reductions in their development assistance budgets. As such, this report, which focuses on both bilateral and multilateral funding for HIV provided by donor governments in 2024 and shows an increase over 2023, is likely the high watermark as funding will likely decline moving forward. While the U.S. has shouldered much of the burden of funding the HIV response, its abrupt reductions leave large gaps and could set back the HIV response, as some studies have already found. Key findings are as follows:

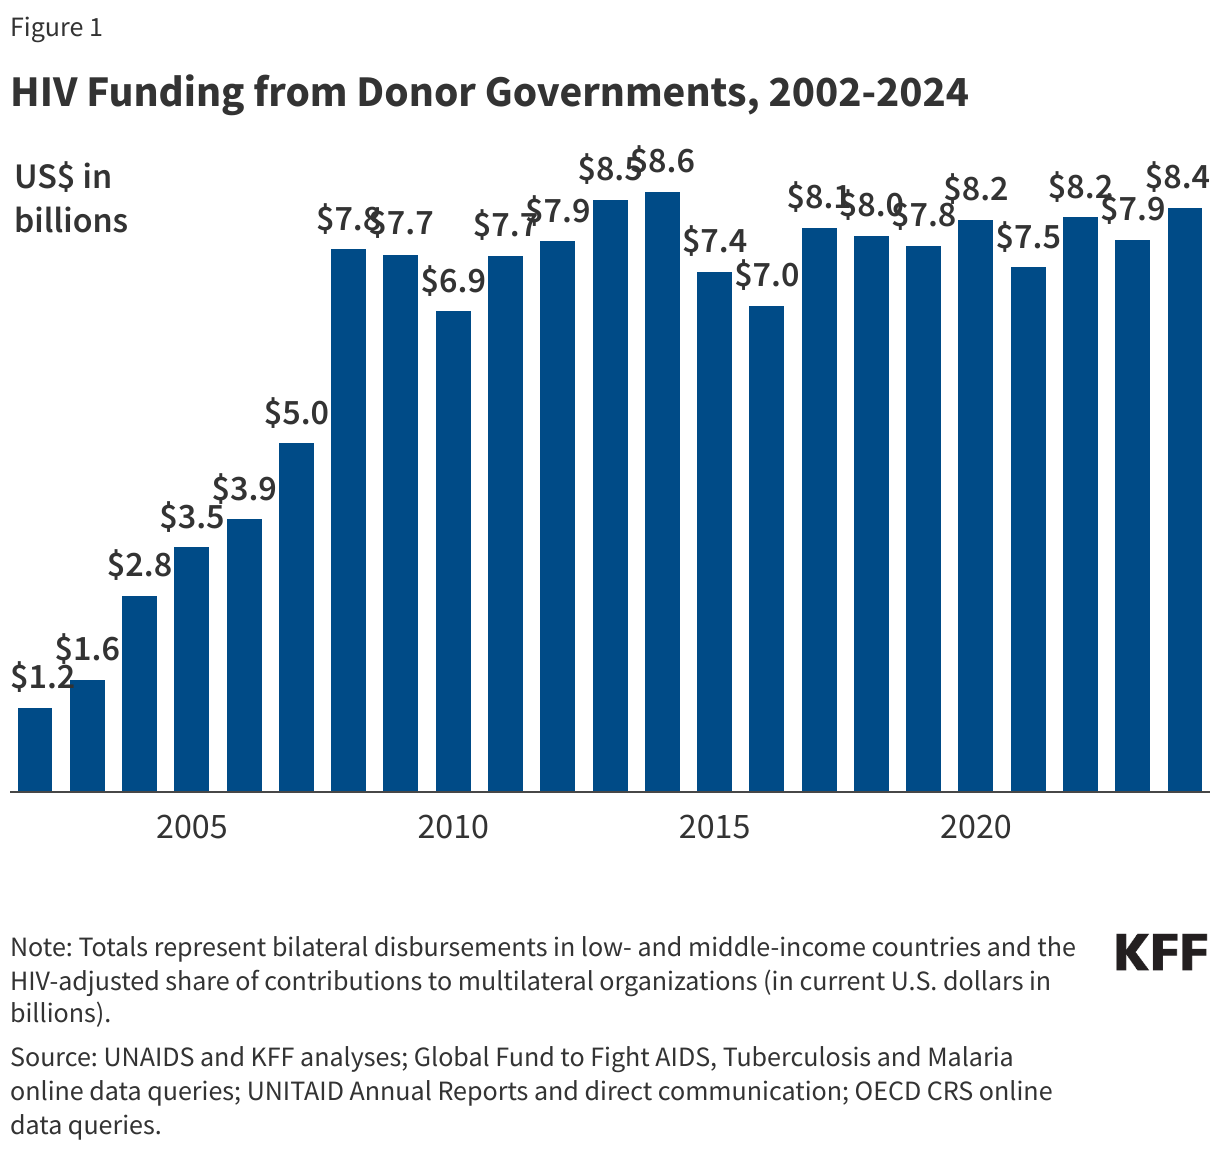
  • Donor government funding for HIV increased in 2024 compared to the prior year. Disbursements for combined bilateral and multilateral support were US$8.37 billion in 2024, an increase of US$460 million compared to 2023 (US$7.91 billion), in current U.S. dollars (not adjusted for inflation).1  Funding increased even after accounting for exchange rate fluctuations. Looking more broadly, donor government funding for HIV in 2024 was at its highest level since 2014 (US$8.60 billion), but still below that peak.
  • The increase in 2024 was almost entirely due to the timing of disbursements by the U.S., not actual changes in funding commitments. The timing of disbursements, or payouts, by donor governments fluctuates each year and those fluctuations can affect overall levels of funding availability, independent of donor funding commitments. In 2024, the U.S. government’s disbursements for HIV increased significantly, while the U.K.’s payout declined, but both were due to the timing of payouts. Other donors had similar fluctuations. Because the U.S. is the largest donor, its fluctuations drove up overall funding levels in 2024.
  • Bilateral funding increased in 2024, driven by payout timing. Bilateral funding totaled US$5.87 billion in 2024, an increase of US$241 million compared to 2023 (US$5.63 billion), with five donors providing increased disbursements. The increase was primarily the result of higher funding from the U.S., due to the timing of payouts, and the U.K., as well as slight increases from Australia, Japan, and Norway. Funding from eight donor governments decreased and two remained flat.
  • Multilateral funding, which is the main channel of support for HIV used by most donor governments, also increased in 2024, similarly due to the timing of contributions. Multilateral funding totaled US$2.50 billion in 2024, an increase of US$218 million compared to 2023 (US$2.28 billion). Six donor governments increased multilateral support, while four remained flat, and five declined. Most multilateral funding for HIV was provided to the Global Fund (US$2.27 billion or 91%) with smaller amounts provided to UNAIDS (US$169 million or 7%) and UNITAID (US$59 million or 2%). The timing of payments to the Global Fund drove the multilateral increase in 2024.
  • The U.S. has consistently been the largest donor to HIV. In 2024, the U.S. provided US$6.69 billion for HIV (bilateral and multilateral combined), accounting for 80% of total donor government support.2  France was the second largest donor (US$314 million, 4%), followed by Germany (US$226 million, 3%), the U.K. (US$218 million, 3%), and the Netherlands (US$192 million, 2%).3 ,4  Even when standardized by the size of its economy (per million GDP), the U.S. ranked first. The next largest donor, per million GDP, was the Netherlands, followed by Denmark, France, and Norway.

Looking ahead, donor government funding for HIV is expected to decline in 2025 and beyond. Due to the new administration’s actions targeting U.S. foreign assistance programs, including for global health and HIV, U.S. disbursements for HIV this year are well below prior year levels.5  In addition, the administration has asked Congress to rescind (formerly cancel) approximately US$400 million in bilateral HIV funding for 2025 and has proposed reducing the HIV budget by at least 40% in 2026. If these cuts were to materialize, other donor governments would have to more than double their HIV funding to maintain current levels. Given that the U.S. has already reduced HIV spending in 2025 and several other large donors have announced plans to reduce foreign assistance, funding for HIV in low- and middle-income countries is highly likely to decline.

Report

Introduction

This report provides the latest available data on donor government resources provided to address HIV in low- and middle-income countries, reporting on disbursements made in 2024. It is part of a collaborative tracking effort between UNAIDS and KFF that began almost 20 years ago, just as new global initiatives were being launched to address the epidemic. The analysis includes data from all 33 members of the Organisation for Economic Co-operation and Development (OECD)’s Development Assistance Committee (DAC), as well as non-DAC members who report data to the DAC. Data are collected directly from donor governments, UNAIDS, the Global Fund, and UNITAID, and supplemented with data from the DAC. Of the 33 DAC members, fifteen provide 98% of total disbursements for HIV; data for these donors are presented individually. For the remaining 18 DAC members, data are provided in aggregate. All totals are presented in current U.S. dollars (amounts are not adjusted for inflation). While totals include both bilateral and multilateral assistance for the entire period (2002-2024), detailed disaggregated bilateral and multilateral amounts for all donors are only available starting in 2011 (see Methodology for more detail).

Importantly, given that the donor government funding landscape fundamentally changed in 2025, the data provided here likely represent a high watermark for HIV funding. Under the new administration, the United States, the largest donor to HIV in the world, began instituting significant changes to global health programs in January 2025, including freezing, and then cancelling, most global HIV projects, restricting allowable activities, and seeking to cut HIV funding by at least 40%, actions which have collectively driven down disbursements. If U.S. reductions continue and future cuts were to be enacted, other donor governments would have to more than double their funding to maintain current levels. Yet several other large donors to HIV – the United Kingdom, Germany and France – have also signaled reductions in their development assistance budgets, making it highly likely that future funding will be reduced.

Findings

Total Funding

In 2024, donor government funding for HIV through bilateral and multilateral channels totaled US$8.37 billion in current USD (not adjusted for inflation) and accounted for approximately 44% of the US$18.7 billion estimated by UNAIDS to be available to address HIV.6 ,7 ,8 ,9  As per UNAIDS estimates, domestic resources accounted for 52%, and the remainder (4%) was from foundations, other multilateral organizations, and UN agencies.

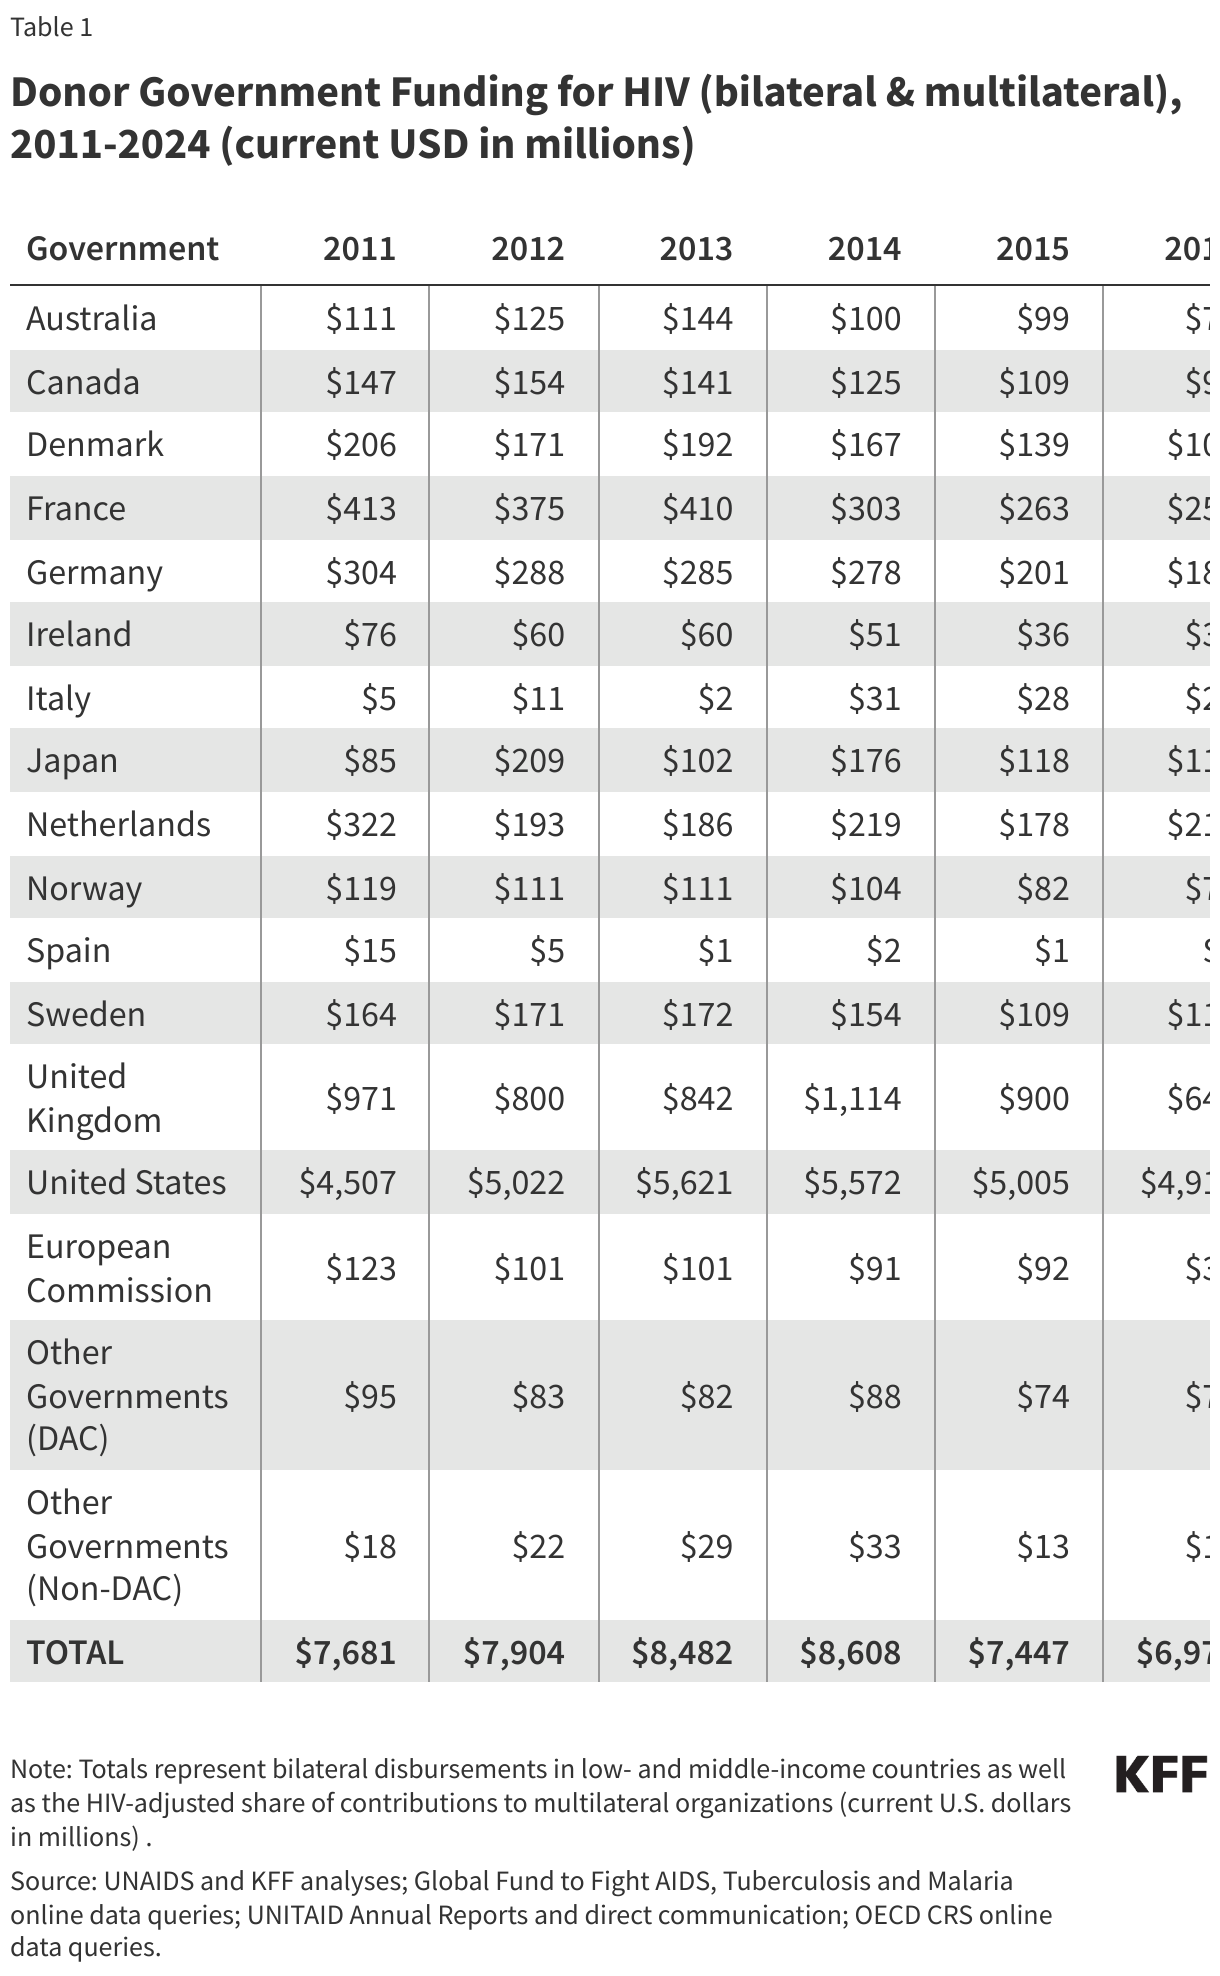
Donor government funding for HIV in 2024 increased by US$460 million compared to 2023 (US$8.37 in 2024 compared to US$7.91 billion in 2023) and reached the highest level since 2014 (US$8.60 billion), though it is still below that highpoint (See Figure 1 and Table 1).10 

HIV Funding from Donor Governments, 2002-2024

Donor Government Funding for HIV (bilateral & multilateral), 2011-2024 (current USD in millions)

The increase in 2024 was almost entirely due to the timing of disbursements, or payouts, by donor governments, which can fluctuate from year-to-year, not actual changes in funding commitments. For instance, U.S. disbursements increased significantly in 2024 while funding from the U.K. declined, but both were due to the timing of payouts. As two of the world’s largest donors, these fluctuations can have an outsized impact on the overall amount of available funding in a given year.

The U.S. continued to be the largest donor to HIV efforts, providing US$6.69 billion and accounting for 80% of total donor government funding in 2024.11  The second largest donor was France (US$314 million, 4%), followed by Germany (US$226 million, 3%), the U.K. (US$218 million, 3%), and the Netherlands (US$192 million, 2%).12 ,13  In 2024, 91% of total donor government funding for HIV was provided by these five donors.

Bilateral Disbursements

Bilateral disbursements for HIV from donor governments – that is, funding disbursed by a donor on behalf of a recipient country or region – totaled US$5.87 billion in 2024, an increase of US$241 million compared to 2023 (US$5.63 billion). Despite the increase, bilateral funding from most donor governments decreased or remained flat and most of the overall increase was attributable to the U.S. and the U.K. When the increases from the U.S. and U.K. are removed, bilateral funding from all other donor governments declined by US$49 million in 2024 (US$237 million) compared to 2023 (US$286 million). These trends were the same after accounting for exchange rate fluctuations.

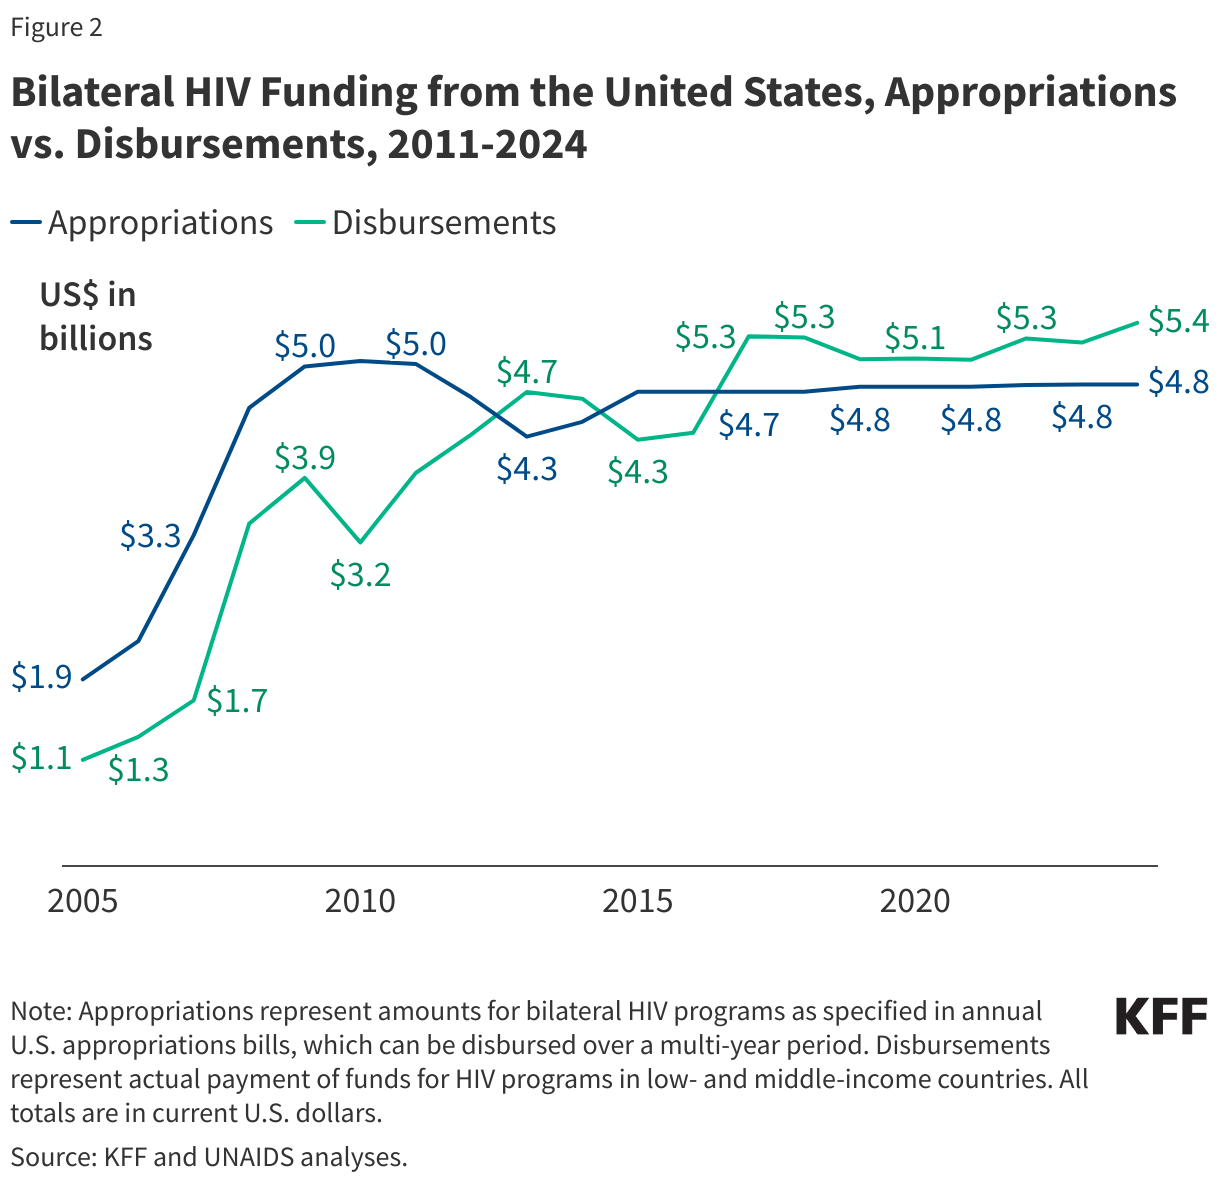
Bilateral disbursements from the U.S. increased by almost US$200 million in 2024 (US$5.43 billion) compared to 2023 (US$5.23 billion), due to the timing of payouts, but not actual increases in funding commitments. In fact, bilateral HIV funding as specified by the U.S. Congress in annual appropriations bills has been flat for several years (see Figure 2).14 ,15 

Bilateral HIV Funding from the United States, Appropriations vs. Disbursements, 2011-2024

Multilateral Contributions

Multilateral contributions from donor governments to the Global Fund, UNITAID, and UNAIDS for HIV – funding disbursed by donor governments to these organizations which in turn use some (Global Fund and UNITAID) or all (UNAIDS) of that funding for HIV – totaled US$2.50 billion in 2024 (after adjusting for an HIV share to account for the fact that the Global Fund and UNITAID address other diseases). This represents an increase of US$218 million compared to 2023 (US$2.28 billion).16 ,17  The Global Fund accounted for most of the multilateral funding for HIV in 2024 (US$2.27 billion or 91%), followed by UNAIDS (US$169 million or 7%) and UNITAID (US$59 million or 2%).

The increase in 2024 disbursements was due to the timing of payments to the Global Fund, particularly from the U.S., which is required by law not to exceed 33% of total contributions to the Global Fund from all donors and results in significant year-to-year differences depending on the amounts other donors have provided.18  In addition, funding from donor governments to the Global Fund often fluctuates reflecting different Global Fund pledge periods. For instance, some donors choose to “front-load” contributions (e.g., the U.K. fulfilled almost its entire pledge for 2023-2025 in 2023 resulting in a significant decrease in 2024), while others choose to fulfill pledges towards the end of the pledge period (e.g., Australia and Denmark did not provide any contribution in 2023, but both fulfilled more than half their pledges in 2024).

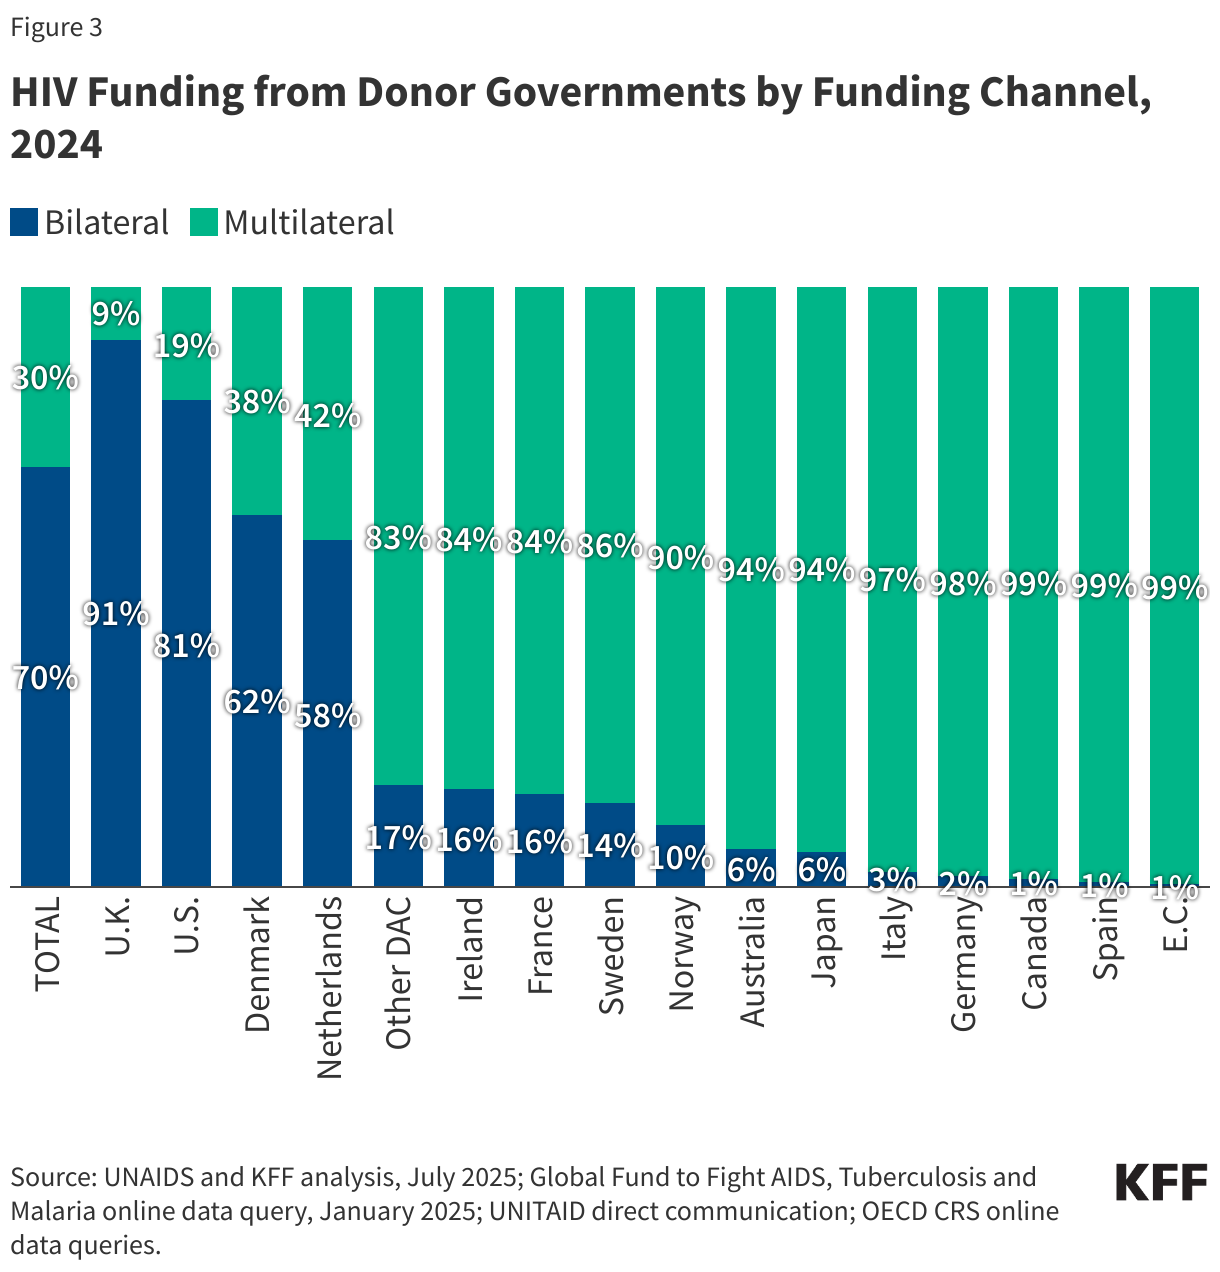
Most donor governments provide the majority of their HIV funding through multilateral organizations. In 2024, eleven provided more than 80% of their HIV funding multilaterally; only Denmark, the Netherlands, the U.K., and the U.S. provided a larger share bilaterally (Figure 3). While the U.K. provided most of its HIV funding bilaterally in 2024, this was entirely due to the timing of payments to the Global Fund. The U.K. fulfilled almost its entire pledge to the Global Fund for 2023-205 in 2023 resulting in significantly lower levels of multilateral funding in 2024. In fact, between 2019-2023, most HIV funding from the U.K. was provided through multilateral channels.

HIV Funding from Donor Governments by Funding Channel, 2024

Fair Share

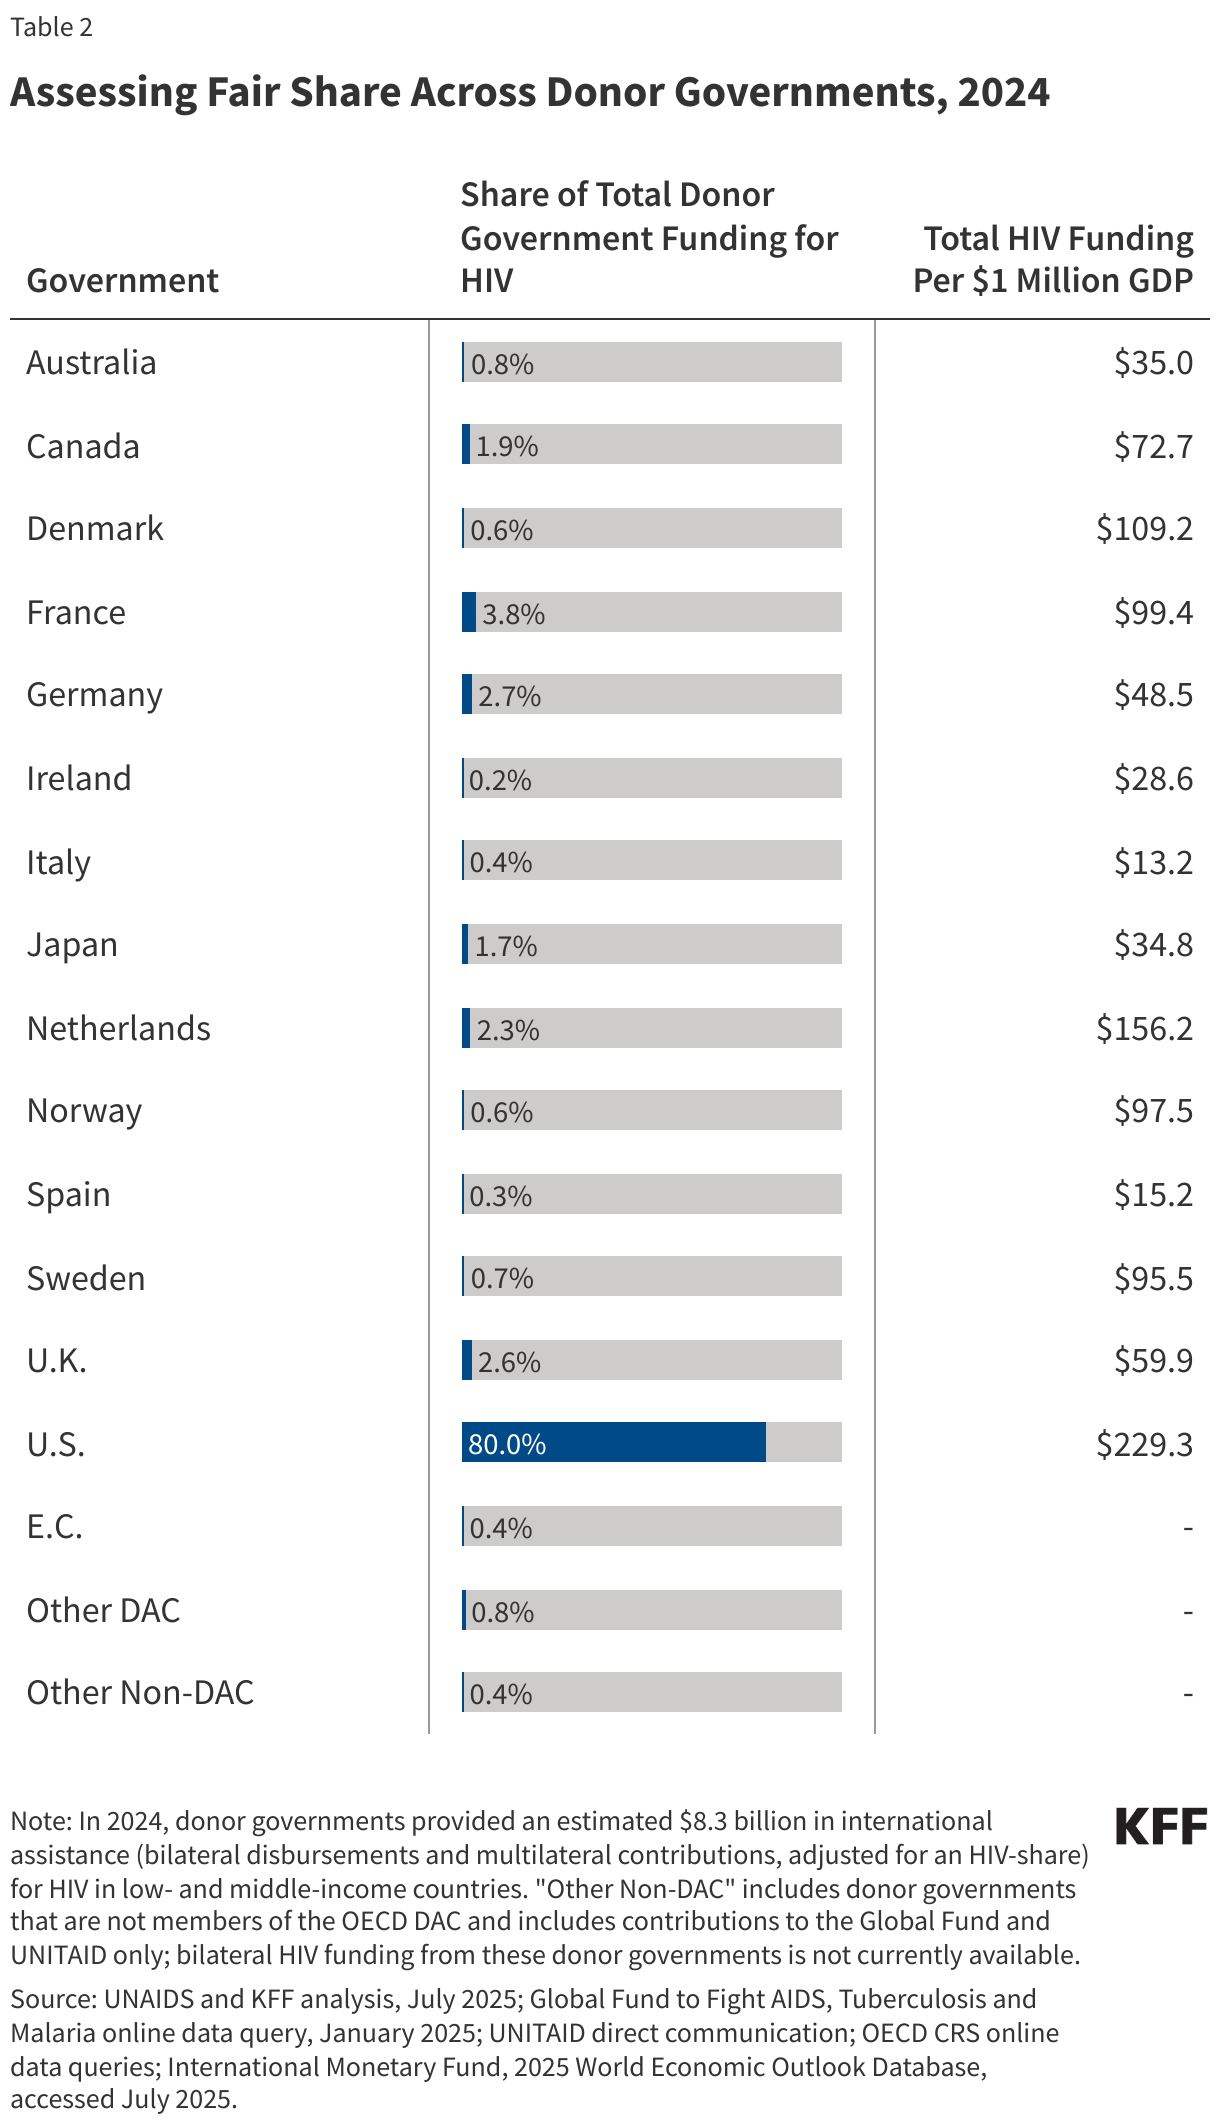
There are different ways to measure donor government contributions to HIV, relative to one another. While the U.S. government provides the largest amount of funding for HIV, for example, it also has the largest economy in the world. To assess relative contributions, or “fair share”, two measures were used: ranking by overall funding amount and ranking by funding for HIV per US$1 million GDP, to adjust for the size of donor economies (See Table 2):

  • Rank by share of total donor government funding for HIV: By this measure, the U.S. ranked first in 2024, followed France, Germany, the U.K., and the Netherlands. The U.S. has ranked #1 in absolute funding amounts since tracking efforts began.
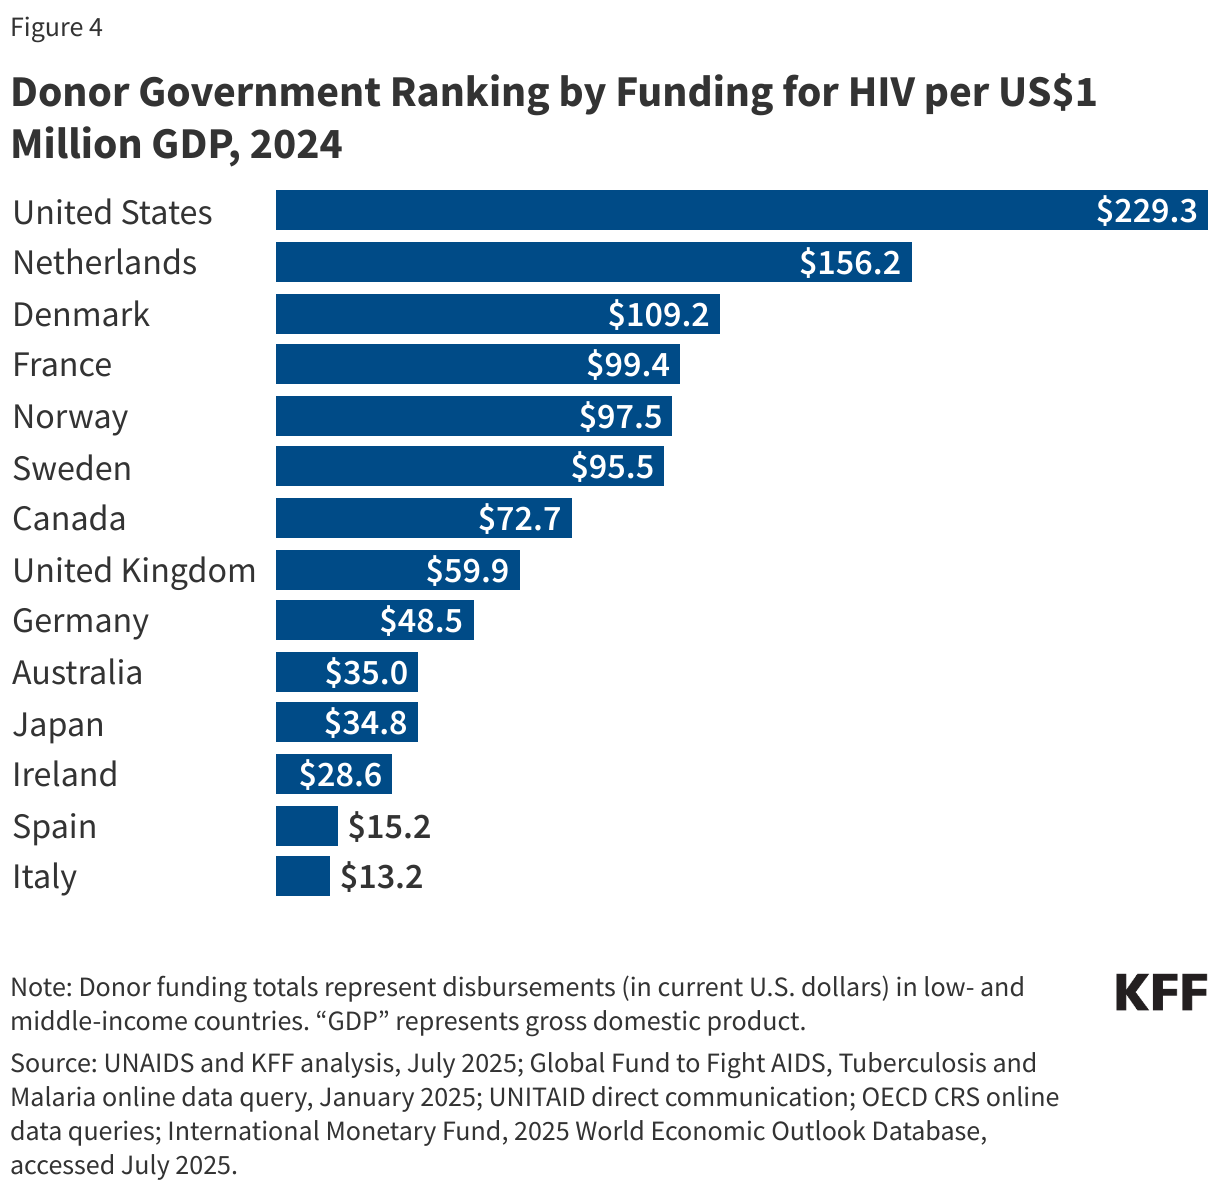
  • Rank by funding for HIV per US$1 million GDP: By this measure, the U.S. ranks first, followed by the Netherlands, Denmark, France, and Norway (See Figure 4).19 

Assessing Fair Share Across Donor Governments, 2024

Donor Government Ranking by Funding for HIV per US$1 Million GDP, 2024

Looking Forward

Donor government funding for HIV in low and middle-income countries is likely to decline in 2025. While the anticipated decline is largely due to actions by the new administration, which have already resulted in lower disbursements in 2025, other donor governments have also indicated plans to reduce foreign assistance. Looking beyond 2025, the new administration has proposed to reduce HIV funding by at least 40% in 2026. Since the U.S. is the world’s largest donor to the global HIV response, a cut in funding of this size would require other donor governments to more than double their funding to fill the gap, an increase that seems unlikely. While final funding amounts are determined by the U.S. Congress, the administration’s actions may continue to have the effect of reducing HIV funding from the U.S.

This work was supported in part by the Joint United Nations Programme on HIV and AIDS (UNAIDS) and the Bill & Melinda Gates Foundation. KFF maintains full editorial control over all of its policy analysis, polling, and journalism activities.

Adam Wexler and Jen Kates are with KFF. Eric Lief is an independent consultant. Joint United Nations Programme on HIV and AIDS (UNAIDS).

Methodology

This project represents a collaboration between the Joint United Nations Programme on HIV/AIDS (UNAIDS) and KFF. Data provided in this report were collected and analyzed by UNAIDS and KFF.

Totals presented in this analysis include both bilateral funding for HIV in low- and middle-income countries, core contributions to UNAIDS, and the estimated share of donor government contributions to the Global Fund and UNITAID that are used for HIV. Amounts are based on analysis of data from the 32 donor government members of the Organisation for Economic Co-operation and Development (OECD) Development Assistance Committee (DAC) in 2024 who had reported Official Development Assistance (ODA). Bilateral and multilateral data were collected from multiple sources. Disaggregated bilateral and multilateral data are only available starting from 2011.

Data on gross domestic product (GDP) were obtained from the International Monetary Fund’s World Economic Outlook Database and represent current price data for 2024 (see: https://www.imf.org/en/Publications/WEO/weo-database/2025/April).

Bilateral Funding:Bilateral funding is defined as any earmarked (HIV-designated) amount, including earmarked non-core (“multi-bi”) contributions to multilateral organizations, such as UNAIDS. Data included in this report represent funding assistance for HIV prevention, care, treatment and support activities, but do not include funding for international HIV research conducted in donor countries (which is not considered in estimates of resource needs for service delivery of HIV-related activities).

The research team collected the latest bilateral funding data directly from twelve governments: Australia, Canada, Denmark, France, Germany, Ireland, Japan, the Netherlands, Norway, Sweden, the United Kingdom, and the United States during the first half of 2025, representing the fiscal year 2024 period. Direct data collection from these donors was desirable because they represent the preponderance of donor government assistance for HIV and the latest official statistics – from the Organisation for Economic Co-operation and Development (OECD) Creditor Reporting System (CRS) (see: http://www.oecd.org/dac/stats/data) – are from 2023 and do not include all forms of international assistance (e.g., certain funding streams provided by donors, such as HIV components of mixed-purpose grants to non-governmental organizations). Data for all other member governments of the OECD DAC – Austria, Belgium, the Czech Republic, the European Commission, Estonia, Finland, Greece, Hungary, Iceland, Italy, Korea, Lithuania, Luxembourg, New Zealand, Poland, Portugal, the Slovak Republic, Slovenia, Spain, and Switzerland – which collectively accounted for less than 5 percent of bilateral disbursements in each of the past several years, were obtained from the OECD CRS database and are from calendar year 2023.

In 2025, France provided data revising prior year amounts to account for “set-aside” funding (adjusted for an HIV-share) that supports Global Fund related activities. While this funding is considered part of France’s pledge to the Global Fund, it is not counted by the Global Fund as a direct contribution and is instead included under bilateral totals in this analysis. Due to this update, amounts presented in this report will differ from prior reports.

Where donor governments were members of the European Union (EU), the research team ensured that no double-counting of funds occurred between EU Member State reported amounts and European Commission (EC) reported amounts for international HIV assistance. Figures obtained directly using this approach should be considered as the upper bound estimation of financial flows in support of HIV-related activities.

Reflecting deliberate strategies of integrating HIV activities into other activity sectors, some donors use policy markers to attribute portions of mixed-purpose projects to HIV. This is done, for example, by the Netherlands and the U.K. The bilateral figures submitted by the UK Foreign, Commonwealth & Development Office (FCDO) for the financial year 2024/25 are based on an existing FCDO ‘HIV policy marker’. Ireland and Denmark also attribute percentages of multipurpose projects to HIV. Canada breaks its mixed-purpose projects into components by percentage. Germany, Norway, and Sweden provided data much more conservatively, consistent with DAC constructs and purpose codes. Apart from targeted HIV/AIDS programs, bilateral health programs mainly focusing on health systems strengthening are also designed to contribute to the HIV response in partner countries.

Bilateral assistance data represent disbursements. A disbursement is the actual release of funds to, or the purchase of goods or services for, a recipient. Disbursements in any given year may include disbursements of funds committed in prior years and in some cases, not all funds committed during a government fiscal year are disbursed in that year. In addition, a disbursement by a government does not necessarily mean that the funds were provided to a country or other intended end-user.

Amounts presented are for the fiscal year period, which varies by country. The U.S. fiscal year runs from October 1-September 30. The fiscal years for Canada, Japan, and the U.K. are April 1-March 31. The Australian fiscal year runs from July 1-June 30. The European Commission, Denmark, France, Germany, Italy, Ireland, the Netherlands, Norway, and Sweden use the calendar year. The OECD uses the calendar year, so data collected from the CRS for other donor governments reflect January 1-December 31. Most UN agencies use the calendar year, and their budgets are biennial.

All data are expressed in current US dollars (USD), unless otherwise noted. Where data were provided by governments in their currencies, they were adjusted by average daily exchange rates to obtain a USD equivalent, based on foreign exchange rate historical data available from the U.S. Federal Reserve (see: http://www.federalreserve.gov/) or the OECD.

Funding totals presented in this analysis should be considered preliminary estimates based on data provided and validated by representatives of the donor governments who were contacted directly.

Multilateral Funding:Multilateral funding includes core contributions to UNAIDS, as well as contributions to the Global Fund (see: http://www.theglobalfund.org/en/) and UNITAID (see: http://www.unitaid.org/#end). All Global Fund contributions were adjusted to represent 52% of the donor’s core contribution, reflecting the Fund’s reported grant approvals for HIV-related projects to date and includes funding for HIV/TB activities. UNITAID contributions were adjusted to represent 46% of the donor’s core contribution, reflecting UNITAID’s reported attribution for HIV-related projects.

Data obtained from UNAIDS, the Global Fund, and UNITAID were already adjusted to represent a USD equivalent based on date of receipts.

UNAIDS core contributions reflect amounts received in 2024. In 2024, the Netherlands provided two core contributions to UNAIDS; the first payment was provided for the 2024 contribution, while the second was a prepayment of the 2025 contribution. Global Fund and UNITAID contributions from all governments correspond to amounts received during the 2024 calendar year, regardless of which contributor’s fiscal year such disbursements pertain to.

In addition to contributions supporting the Global Fund’s and UNITAID’s core activities, some donor governments provided significant funding to these multilateral organizations for COVID-related efforts between 2020-2023. These COVID-specific contributions were not included in totals in this analysis. The U.S., for example, provided almost US$1.9 billion in such funding to the Global Fund during 2022.

Other than contributions provided by governments to the Global Fund and UNITAID, un-earmarked general contributions to United Nations entities, most of which are membership contributions set by treaty or other formal agreement (e.g., the World Bank’s International Development Association or United Nations country membership assessments), are not identified as part of a donor government’s HIV assistance even if the multilateral organization in turn directs some of these funds to HIV. Rather, these would be considered as HIV funding provided by the multilateral organization, as in the case of the World Bank’s efforts, and are not considered for purposes of this report.

Appendix

Donor Government Funding for HIV (current USD in millions), 2023 & 2024

Endnotes

  1. Between 2020-2023, some donor governments provided COVID-specific emergency contributions to the Global Fund and UNITAID in addition to their contributions for core activities. For the purposes of this report, these COVID-specific amounts have been excluded as they cannot be attributed to a specific area, such as HIV. ↩︎
  2. U.S. totals represent funding amounts provided through regular appropriations only. In 2021, the U.S. Congress appropriated additional emergency supplemental funding for bilateral HIV activities and for the Global Fund to address the impacts of the COVID-19 pandemic. These emergency supplemental funding amounts are not included in overall U.S. totals. ↩︎
  3. In 2025, France provided data revising prior year amounts to account for “set-aside” funding (adjusted for an HIV-share) that supports Global Fund related activities. While this funding is considered part of France’s pledge to the Global Fund, it is not counted by the Global Fund as a direct contribution and is instead included under bilateral totals in this analysis. Due to this update, amounts presented in this report will differ from prior reports. ↩︎
  4. Total HIV funding from the Netherlands in 2024 includes two core contributions to UNAIDS; the first payment was provided for the 2024 contribution, while the second was a prepayment of the 2025 contribution. ↩︎
  5. KFF analysis of data from USAspending.gov and Treasury.gov. ↩︎
  6. Donor government disbursements are a subset of overall international assistance for HIV in low-and-middle-income countries, which also includes funding provided by other multilateral institutions, UN agencies, and foundations. ↩︎
  7. UNAIDS, “UNAIDS Global AIDS Update 2025: AIDS, Crisis and the Power to Transform”, July 2025. ↩︎
  8. UNAIDS estimates that US$18.7 billion was available for HIV from all sources (domestic resources, donor governments, multilaterals, and philanthropic organizations) in 2024. In addition, while the amounts presented in this analysis include donor contributions to multilateral organizations, the UNAIDS estimate of total available resources for HIV includes the actual disbursements made by multilateral organizations in 2024 rather than the donor government contributions to these entities. ↩︎
  9. The donor share of total available resources includes bilateral disbursements as well as an adjusted share of Global Fund and UNITAID disbursements (the donor government share of contributions to each of the multilaterals in 2024 is applied to the disbursements from these multilaterals for the same year). ↩︎
  10. KFF & UNAIDS, “Donor Government Funding for HIV in Low- and Middle-Income Countries in 2023”, July 2024. ↩︎
  11. U.S. totals represent funding amounts provided through regular appropriations only. In 2021, the U.S. Congress appropriated additional emergency supplemental funding for bilateral HIV activities and for the Global Fund to address the impacts of the COVID-19 pandemic. These emergency supplemental funding amounts are not included in overall U.S. totals. ↩︎
  12. In 2025, France provided data revising prior year amounts to account for “set-aside” funding (adjusted for an HIV-share) that supports Global Fund related activities. While this funding is considered part of France’s pledge to the Global Fund, it is not counted by the Global Fund as a direct contribution and is instead included under bilateral totals in this analysis. Due to this update, amounts presented in this report will differ from prior reports. ↩︎
  13. Total HIV funding from the Netherlands in 2024 includes two core contributions to UNAIDS; the first payment was provided for the 2024 contribution, while the second was a prepayment of the 2025 contribution. ↩︎
  14. KFF, “The U.S. President’s Emergency Plan for AIDS Relief (PEPFAR)”, May 2025. ↩︎
  15. U.S. totals represent funding amounts provided through regular appropriations only. In 2021, the U.S. Congress appropriated additional emergency supplemental funding for bilateral HIV activities and for the Global Fund to address the impacts of the COVID-19 pandemic. These emergency supplemental funding amounts are not included in overall U.S. totals. ↩︎
  16. Between 2020-2023, some donor governments provided COVID-specific emergency contributions to the Global Fund and UNITAID in addition to their contributions for core activities. For the purposes of this report, these COVID-specific amounts have been excluded as they cannot be attributed to a specific area, such as HIV. ↩︎
  17. In 2024, 52% of the Global Fund’s disbursements and 48% of UNITAID’s disbursements were directed to HIV activities. These percentages were applied to the full donor government contributions to these multilateral organizations to calculate the “HIV-share” (see Methodology for additional details). ↩︎
  18. The U.S. has had a long-standing legislative requirement that total U.S. contributions to the Global Fund could not exceed 33% of all contributions (see “KFF – The U.S. & The Global Fund to Fight AIDS, Tuberculosis and Malaria”), which results in year-to-year fluctuations in U.S. payouts to the Global Fund depending on when other donors provide funds. However, this requirement technically expired in March when the authorization legislation ended (see “KFF – PEPFAR Reauthorization: Side-by-Side of Legislation Over Time”). ↩︎
  19. GDP estimates are from the International Monetary Fund’s (IMF) World Economic Outlook (WEO) Database (accessed July 2025). ↩︎

Health Provisions in the 2025 Federal Budget Reconciliation Bill

Updated: July 8, 2025


Note: KFF now has a clean summary of the health care provisions in the 2025 federal budget reconciliation law as well as a separate implementation timeline highlighting key dates in the law.

This side-by-side comparison tool compares the health care provisions in the House-passed and Senate-passed 2025 budget reconciliation law to each other and prior law. The Senate-passed bill ultimately passed the House on July 3 and was signed into law by President Trump on July 4. The comparison is divided into four categories: Medicaid, the Affordable Care Act, Medicare and Health Savings Accounts (HSAs). It also compares the provisions to a earlier draft of the bill passed by the House on May 22.

Summary of House Reconciliation Bill

Topics:

Health Provisions in the 2025 Federal Budget Reconciliation Bill

Updated: July 8, 2025


Note: KFF now has a clean summary of the health care provisions in the 2025 federal budget reconciliation law as well as a separate implementation timeline highlighting key dates in the law.

This side-by-side comparison tool compares the health care provisions in the House-passed and Senate-passed 2025 budget reconciliation law to each other and prior law. The Senate-passed bill ultimately passed the House on July 3 and was signed into law by President Trump on July 4. The comparison is divided into four categories: Medicaid, the Affordable Care Act, Medicare and Health Savings Accounts (HSAs). It also compares the provisions to a earlier draft of the bill passed by the House on May 22.

Summary of HSA-Related Provisions in 2025 Reconciliation Bill

Health Provisions in the 2025 Federal Budget Reconciliation Bill

Updated: July 8, 2025


Note: KFF now has a clean summary of the health care provisions in the 2025 federal budget reconciliation law as well as a separate implementation timeline highlighting key dates in the law.

This side-by-side comparison tool compares the health care provisions in the House-passed and Senate-passed 2025 budget reconciliation law to each other and prior law. The Senate-passed bill ultimately passed the House on July 3 and was signed into law by President Trump on July 4. The comparison is divided into four categories: Medicaid, the Affordable Care Act, Medicare and Health Savings Accounts (HSAs). It also compares the provisions to a earlier draft of the bill passed by the House on May 22.

In addition to the changes included in the law, if Congress takes no further action, the increase in the deficit would trigger mandatory spending cuts, also known as sequestration, under the Statutory Pay-As-You-Go Act of 2010. These cuts would total approximately $500 billion to Medicare over 2026–2034, according to the Congressional Budget Office, based on an increase in the deficit of $2.3 trillion over 10 years. The required spending cuts to Medicare could be larger based on the Senate-passed bill that was enacted into law, which is estimated to increase the deficit by $3.4 trillion over 10 years

Summary of Medicare Provisions in 2025 Reconciliation Bill

Health Provisions in the 2025 Federal Budget Reconciliation Bill

Updated: July 8, 2025


Note: KFF now has a clean summary of the health care provisions in the 2025 federal budget reconciliation law as well as a separate implementation timeline highlighting key dates in the law.

This side-by-side comparison tool compares the health care provisions in the House-passed and Senate-passed 2025 budget reconciliation law to each other and prior law. The Senate-passed bill ultimately passed the House on July 3 and was signed into law by President Trump on July 4. The comparison is divided into four categories: Medicaid, the Affordable Care Act, Medicare and Health Savings Accounts (HSAs). It also compares the provisions to a earlier draft of the bill passed by the House on May 22.

Summary of ACA-Related Provisions in the 2025 Reconciliation Bill

We’ve Never Seen Health Care Cuts This Big

Author: Larry Levitt
Published: Jul 1, 2025

In this July 1 column for The New York Times Opinion section, KFF Executive Vice President for Health Policy Larry Levitt explains how the budget reconciliation bill passed by the Senate on July 1 is effectively a partial repeal of the Affordable Care Act (ACA) and, if signed into law, the resulting reductions in Medicaid and ACA Marketplace coverage would make it “the biggest rollback in federal support for health coverage ever.”

10 Key Data Points About the Experiences of LGBT+ Women and Their Access to Care

Published: Jun 30, 2025

Health disparities and health access-related challenges persist among the LGBTQ+ community.  While there have been various state and federal efforts over the last several years to address equity in the LGBT+ community, including with respect to health care access, nondiscrimination, and data collection, recent Trump Administration policy actions could reverse these developments. Additionally, potential changes in the health policy landscape could lead to insurance coverage losses, which could stand to exacerbate existing access challenges. In particular, efforts to restrict access to gender affirming care, including for adults, could lead to more medical mistrust, and reduce willingness to engage in the health system.

This brief presents key data points on the health care experiences of LGBT+ women from the KFF Women’s Health Survey, a nationally representative survey of women in the United States conducted from May 13 – June 18, 2024. This online and by telephone survey includes a sample of 3,901 women of reproductive age (18-49). Respondents were asked about their gender and sexual orientation. The LGBT+ sample (n = 676) in this brief includes respondents who identified as women and also identified as non-binary or transgender and/or said their sexual orientation was lesbian or gay, bisexual, or something else. The non-LGBT+ sample are respondents who identified as other women, those who are cisgender and heterosexual.

1. One in six (17%) women of reproductive age identify as LGBT+, with the largest share of LGBT+ women identifying as bisexual.

One in six (17%) women of reproductive age identify as lesbian, gay, bisexual, transgender, non-binary or something else (LGBT+) (Figure 1). Women ages 18 to 35 are twice as likely to identify as LGBT+ compared to women ages 36 to 49 (23% vs. 9%).

Younger Reproductive Age Women Are Twice as Likely to Identify as Bisexual Compared to Older Reproductive Age Women

2. LGBT+ women are more likely to be younger than non-LGBT+ women but are similar in other demographic indicators.

Three in four reproductive age LGBT+ women are age 35 and younger (77%) compared to 53% of non-LGBT+ women (Figure 2). Nearly six in ten reproductive age LGBT+ women are White and nearly one in five are Hispanic, which is not significantly different than non-LGBT+ women. LGBT+ women are less likely to be Asian and more likely to identify as another race/ethnicity compared to non-LGBT+ women. Four in ten reproductive age LGBT+ women have household incomes below 200% of the federal poverty level (FPL), similar to non-LGBT+ women. Nine in ten live in an urban/suburban area, which is higher than non-LGBT+ women. A quarter of LGBT+ women are the parent or guardian of children under the age of 18, which is half the share of non-LGBT+ women (27% vs. 52%).

Three in Four Reproductive Age LGBT+ Women Are Age 35 and Younger and Fewer are Parents Compared to Non-LGBT+ Women

3. While the majority of reproductive age LGBT+ women have a regular health care provider, three in ten do not (31%). LGBT+ women are less likely to go to a private doctor’s office for care than non-LGBT+ women, but a higher share rely on clinics or do not have a place to go.

Despite being a younger population overall, LGBT+ women are more likely to report fair or poor health (Figure 3) than non-LGBT+ women. One in four reproductive age LGBT+ women (26%) describe their health as fair or poor compared to one in six non-LGBT+ women (16%). Most LGBT+ women have a usual site of care to go to when they are sick or need advice about health (92%), while only 8% say they do not have a place to go. LGBT+ women are less likely than non-LGBT+ women to go to a private doctor’s office for care, and a higher share do not have a place to go compared to non-LGBT+ women. While the majority of LGBT+ women have a regular doctor or health care provider (69%), three in ten do not (31%).

While the Majority of Reproductive Age LGBT+ Women Have a Regular Health Care Provider, Three in Ten Do Not

4. Similar shares of LGBT+ and non-LGBT+ women say they have received HIV and STI tests, but fewer report receiving a Pap test than non-LGBT+ women. One in seven (15%) LGBT+ women say they have never seen a doctor or nurse for an OBGYN exam.

Similar shares of LGBT+ women say they have received an HIV test (37% vs. 36%) and STI test (44% vs. 39%) compared to non-LGBT+ women in the past two years (Figure 4). However, a smaller share of LGBT+ women compared to non-LGBT+ women report receiving a Pap smear or Pap test to test for cervical cancer in the past two years. One in seven (15%) reproductive age LGBT+ women say they have never seen a doctor or nurse for an OBGYN exam, which was higher than non-LGBT+ women (10%).

Similar Shares of Reproductive Age LGBT+ Women Have Received HIV and STI Tests, But Fewer Have Received a Pap Test Compared to Non-LGBT+ Women

5. One in five reproductive age LGBT+ women report having a disability, twice the rate of non-LGBT+ women.

While a younger population, among reproductive age LGBT+ women report who report a disability, one in ten have more than one disability (15%) (Figure 5). The largest share say they have a disability related to a mental health condition, which is significantly higher than non-LGBT+ women (16% vs. 4%). Just over one in ten (15%) LGBT+ women report having a developmental disability, such as a learning disability, compared to 2% of non-LGBT+ women. One in ten (11%) LGBT+ report having a physical disability compared to 6% of non-LGBT+ women. A similar share of LGBT+ and non-LGBT+ women report having a sensory condition, such as being visually impaired or deaf (1%).

One in Five Reproductive Age LGBT+ Women Report Having a Disability With One in Ten Having More Than One Disability

6. About four in ten LGBT+ women (43%) report that they have been treated unfairly or with disrespect by a doctor or health care provider, especially based on their age, weight, or gender.

Nearly twice as many LGBT+ women (aged 18-49) compared to non-LGBT+ women (43% vs. 24%) the same age have felt that a doctor, health care provider or other staff treated them unfairly or with disrespect at some point in the past 2 years (Figure 6). They cite weight, gender, and age as the top reasons they were treated unfairly or with disrespect. Compared to non-LGBT+ women, a larger share of LGBT+ women say there was a time in the past 2 years when a health provider ignored a direct request they made or a question they asked (34% vs. 20%), assumed something about them without asking (32% vs. 19%), didn’t believe they were telling the truth (32% vs. 16%), suggested they were personally to blame for a health problem they were experiencing (29% vs. 13%), and refused to prescribe pain medication they thought they needed (15% vs. 9%). Eight percent (8%) of LGBT+ women say they have been treated unfairly or with disrespect because of their sexual orientation during a health care visit in the past 2 years.

LGBT+ Women Are More Likely to To Report They've Experienced Negative Interactions With Health Care Providers

7. Many LGBT+ women report experiencing mental health challenges. Half of reproductive age LGBT+ women describe their mental health as fair or poor compared to a quarter of non-LGBT+ women, and many say they have not gotten mental health services in the past year.

Half of LGBT+ women (aged 18-49) describe their mental health or emotional wellbeing as fair or poor compared to a quarter of non-LGBT+ women (50% vs. 27%) (Figure 7). While half of LGBT+ women say they have received mental health services from a doctor, counselor, or other mental health professional (51%), about half also say there was a time in the past 12 months when they thought they might need mental health services or medication, but didn’t get them (54%).

Half of Reproductive Age LGBT+ Women Describe Their Mental Health as Fair or Poor

8. LGBT+ women report experiences with intimate partner violence at almost double the rate of non-LGBT+ women.

Over one in three reproductive age LGBT+ women say they have experienced intimate partner violence in the past 5 years, compared to 20% of non-LGBT+ women (Figure 8). Rates of all aspects of IPV asked about in the survey are twice as high in LGBT+ women compared to non-LGBT+ women. Approximately one in five LGBT+ women said that in the past five years, a current or former partner has made them fear for their or their family and friends’ safety (21%), tried to control most or all of their daily activities (23%), hurt them physically (19%), or forced them into sexual activity (21%).

A Third of LGBT+ Women Have Experienced Intimate Partner Violence in the Past 5 Years

9. Similar shares of sexually active LGBT+ and non-LBGT+ reproductive age women say they used contraception in the past year.

Eight in ten (81%) sexually active LGBT+ women report using contraception in the past year, similar to the share among non-LGBT+ women (81%). One in ten (10%) sexually active LGBT+ women say they were not using contraception. While a younger group, smaller shares of sexually active LGBT+ women report being pregnant or trying to conceive compared to non-LGBT+ women (5% vs. 9%). The shares of LGBT+ and non-LGBT+ women report being unable to conceive was the same (4%). One in ten LGBT+ women say they or their partners use contraception solely for reasons outside of preventing pregnancy, which is significantly higher than non-LGBT+ women (11% vs. 5%) (Figure 9).

Similar Shares of Sexually Active LGBT+ and Non-LGBT+ Women Used Contraception in the Past Year

10. Over a third (38%) of LGBT+ women have been pregnant including nearly one in ten (9%) who report having have had an abortion, both shares considerably lower rates than non-LGBT+ reproductive age women.

A larger share of reproductive age LGBT+ women say they have never been pregnant compared to non-LGBT+ women (62% vs. 35%) (Figure 10). About one in ten (11%) LGBT+ women say they or their partner have ever needed fertility assistance, including medical advice, testing, services or medication to help an individual or their partner become pregnant or prevent a miscarriage, which is similar to the 14% of non-LGBT+ women who have needed fertility assistance.

Over a Third of Reproductive Age LGBT+ Women Have Been Pregnant and Nearly One in Ten Have Had an Abortion

5 Key Facts About Medicaid and Veterans

Published: Jun 30, 2025

The One Big Beautiful Bill passed by the House is projected by the Congressional Budget Office to reduce federal Medicaid spending by $793 billion over the next 10 years, a cut that could lead to 10.3 million fewer people enrolled in Medicaid in 2034. The Senate Finance Committee’s draft reconciliation includes similar provisions. Medicaid currently provides health care coverage to 1 in 10 veterans (1.6 million people), and for some, it is their only source of coverage, especially if they do not qualify for military health benefits such as care provided by the Department of Veterans Affairs (VA health care), or TRICARE, the health insurance program administered by the Department of Defense for eligible active-duty service members, retirees, and their families.

The Department of Veterans Affairs operates a nationwide health care system, but access is not guaranteed. Eligibility for VA health care depends on a veteran’s service history, discharge status, income, and whether a health condition is connected to their military service. As a result, about half of veterans are enrolled in VA health care. TRICARE, meanwhile, is generally limited to active-duty members and military retirees.

Medicaid helps fill gaps in coverage for veterans who are low-income, have disabilities, or are otherwise ineligible for military health benefits. Many veterans use Medicaid alongside Medicare or VA health care, particularly as they age and their health needs increase. Veterans enrolled in Medicaid have complex health conditions, including high rates of disability, mental illness, and substance use disorders. Medicaid ensures regular access to care for these veterans, helping them manage chronic conditions, access a broader range of providers outside the VA system, and pay for services not covered by VA health care, such as different forms of long-term care. It also reduces out-of-pocket costs that can pose a barrier to care. This brief presents key facts about veterans enrolled in Medicaid and examines how proposed changes could affect their coverage and access to care.

1. Over the past decade, the number of veterans has declined, but the percent of veterans with Medicaid has increased.

In 2023, there were approximately 16 million veterans ages 19 and older in the United States. The veteran population is both aging and shrinking: nearly half of all veterans are 65 and older, and the total number has declined by 7 million over the past decade, from 23 million in 2013, as older veterans from World War II, the Korean War, and the Vietnam War have passed away, and fewer individuals have entered military service in the recent years.

As the veteran population changes, so too have the pathways to coverage. The Affordable Care Act (ACA) created a new pathway to coverage for veterans who might otherwise have been uninsured by expanding Medicaid eligibility to nearly all adults with incomes up to 138% of the Federal Poverty Level ($21,597 for an individual in 2025). Medicaid expansion covers adults who are parents of dependent children whose income is above the eligibility limit for parent coverage and adults who do not have dependent children and who were previously not eligible for Medicaid. Forty-one states, including DC, have adopted Medicaid expansion, and nearly seven in ten (69%) veterans ages 19 and older who have Medicaid coverage live in a state that has expanded Medicaid.

Since the implementation of Medicaid expansion, the share of veterans with Medicaid, either as their sole source of coverage or in combination with other insurances, has increased, and the share of those who are uninsured has dropped. Between 2013 and 2023, Medicaid enrollment among all veterans increased from 8% to 10% (Figure 1), representing 1.6 million veterans in 2023. However, the share of veterans enrolled in Medicaid varies across states, ranging from as low as 6% to as high as 15% (Appendix Table ). In 2023, 11% of veterans in Medicaid expansion states were enrolled in Medicaid, compared to 9% in non-expansion states. Over the 2013-2023 period, the uninsured rate for veterans fell by more than half, dropping to 2% from 6% (Figure 1). Studies link Medicaid expansion to increased coverage, improved access to care, greater healthcare affordability, and better health .

Over the Past Decade, the Number of Veterans Has Declined, but the Percent of Veterans With Medicaid Has Increase

2. Medicaid often supplements coverage for an aging veteran population.

Among those 1.6 million veterans with Medicaid coverage, most had additional forms of insurance. While some rely on Medicaid as their only source of coverage, it more often supplements other types of insurance by covering services that other payers may not, such as long-term care. For veterans who are also enrolled in Medicare, Medicaid can help cover both premiums and cost-sharing responsibilities, reducing out-of-pocket costs for services like doctor visits, hospital stays, and prescription drugs.

Only 17% of veterans with Medicaid were covered by Medicaid alone. The remaining 83% had at least one other source of coverage. The most common combination was Medicaid and Medicare, which accounted for 60% of all veterans with Medicaid (some of whom were also enrolled in VA health care). This high share reflects the aging veteran population; half of all veterans with Medicaid were 65 and older. Many of today’s veterans served during the Vietnam and Gulf Wars. Smaller percentages of veterans were also enrolled in VA health care (17%), or another other form of insurance coverage, such as TRICARE or employer-sponsored insurance (6%).

Medicaid Often Supplements Coverage for an Aging Veteran Population

3. Veterans with Medicaid have higher disability rates than those who are not covered by Medicaid.

Nearly half (49%) of veterans covered by Medicaid, either as their only source of coverage or in combination with other insurance, report having a disability, compared to fewer than three in ten (29%) veterans who are not covered by Medicaid (Figure 3). A person is considered to have a disability if they experience difficulty with hearing, vision, cognitive function, mobility, self-care, or independent living. While disability rates increase with age among all veterans, the difference in the rates between those with Medicaid and those not covered by Medicaid are especially pronounced in their working-age years. Among veterans ages 27 to 49, 33% of those with Medicaid reported a disability, compared to 17% of those with other coverage. The gap is even wider among veterans ages 50 to 64, with 51% of Medicaid enrollees reporting having a disability compared to 20% of those with other coverage. Veterans 65 and older have the highest disability rates of any age group, but even among this group, a higher percentage of veterans with Medicaid have a disability (55%) compared to those without (40%).

Veterans With Medicaid Have Higher Disability Rates Than Those Who Are Not Covered by Medicaid

4. Medicaid supports regular access to care for veterans who have high rates of chronic conditions.

Veterans covered by Medicaid often have complex health needs. Nearly half (45%) of veterans with Medicaid describe their health as fair or poor, more than twice the share among those not covered by Medicaid (18%) (Figure 4). All veterans have high rates of chronic conditions (82% for those with Medicaid and 79% for those without), but some conditions are more common among veterans with Medicaid. Specifically, behavioral health conditions affect a larger share of veterans with Medicaid, with 46% reporting any form of mental illness and 26% reporting substance use disorder (SUD), compared to 17% and 13%, respectively, among those without Medicaid. Medicaid provides access to care, including mental health and SUD care for veterans. Among veterans covered by Medicaid, 41% received mental health or SUD treatment in the past year, nearly twice the share of those without Medicaid (21%).

Medicaid Supports Regular Access to Care for Veterans Who Have High Rates of Chronic Conditions

5. Nearly seven in ten working-age veterans with Medicaid are working, but work varies by age, disability, and parental status.

Nearly seven in ten (68%) working-age veterans (ages 19 to 64) enrolled in Medicaid are working, excluding those who receive Supplemental Security Income or Social Security Disability Insurance, or are dually enrolled in Medicare (Figure 5). The share of veterans in this age group varies by state (Appendix Table 2). Veterans who are older (ages 50 to 64), have a disability, or do not have dependent children are less likely to be working:

  • The share of veterans who are working declines with age: 79% of those ages 19 to 26 are working, compared to 59% of those ages 50 to 64.
  • While 75% of veterans without a disability are working, that share drops to 51% among those with a disability.
  • Parents are more likely to be in the workforce than veterans without dependent children (78% vs 60%), likely reflecting their relatively younger age and lower rates of disability.

Proposed changes to Medicaid that would impose work and reporting requirements as a condition of eligibility could negatively affect veterans and lead to coverage loss among those who are unable to work or those unable to report or document work or exemption criteria.

Nearly Seven in Ten Working-Age Veterans With Medicaid Are Working, but Work Varies by Age, Disability, and Parental Status

Appendix Tables

Veterans Ages 19 and Older Enrolled in Medicaid by State, 2023
Age Distribution of Veterans Ages 19 and Older Enrolled in Medicaid by State, 2023

How Affordability of Employer Coverage Varies by Family Income

Published: Jun 30, 2025

People in lower-income families with employer coverage spend a greater share of their income on health costs than those with higher incomes, and the cost of employer sponsored health insurance—including premiums, deductibles, and other out-of-pocket costs—has risen steadily over time. Low-income workers offered health insurance through their employer are typically not eligible for subsidies on the Affordable Care Act (ACA) Marketplaces, even if they would face lower costs to buy coverage and with reduced cost sharing.

This analysis uses information from the 2024 Annual Social and Economic Supplement (ASEC) to the Current Population Survey to look at the share of family income people with employer-based coverage pay toward their premiums and out-of-pocket payments for medical care. It considers non-elderly people living with one or more family members who are full-time workers and have employer-based coverage.

The analysis is available through the Peterson-KFF Health System Tracker, an online information hub dedicated to monitoring and assessing the performance of the U.S. health system.

Fraud in Marketplace Enrollment and Eligibility: Five Things to Know

Authors: Kaye Pestaina, Rayna Wallace, Michelle Long, Meghan Salaga, and Emma Lee
Published: Jun 30, 2025

This analysis was updated on July 11, 2025, to reflect enactment of the 2025 budget reconciliation law, which was signed into law on July 4, 2025, and the changes it makes to ACA Marketplace standards.

Rooting out fraud has been one of the primary reasons given for changes to ACA Marketplace enrollment and eligibility standards included in the Trump administration’s final Marketplace integrity and affordability rule (“final regulation”), and in the recently enacted budget reconciliation law. In the final regulation, the Centers for Medicare and Medicaid Services (CMS) points to “dramatic levels of improper enrollment” in Marketplace plans that CMS says have involved fraudulent actions by some agents, brokers, and web brokers. The final regulation and the budget reconciliation law seek to address alleged fraud by instituting new standards for consumers to enroll in Marketplace coverage, from additional paperwork requirements to “verify” a consumer’s estimated household income to obtain advanced premium tax credits (APTC) to significant new administrative steps and new payments for consumers to continue Marketplace coverage. Few changes are made in the final regulation concerning oversight of entities alleged to have engaged in fraudulent activities, and none are included in the budget reconciliation law.

This brief explains what is known about fraud and improper enrollment in ACA Marketplace plans and what the final regulation and budget reconciliation law will do to change current Marketplace enrollment and eligibility standards.

1. The Affordable Care Act (ACA) gives the federal government broad authority to combat Marketplace fraud, alongside existing state oversight of private health insurance.

The Affordable Care Act (ACA) gives the Secretary of the Department of Health and Human Services (HHS) the authority to determine appropriate activities to reduce fraud and abuse in the administration of Marketplaces and to investigate Marketplace activity, “in coordination with” the Inspector General (OIG) of HHS. The HHS Secretary oversees these functions through the Center for Medicare and Medicaid Services (CMS), with at least two CMS offices involved in combating ACA fraud—the Center for Consumer Information and Insurance Oversight (CCIIO) and the Center for Program Integrity (CPI). These agencies, along with the HHS OIG, have a role in protecting the financial and program integrity of ACA programs. The Department of Justice litigates civil and criminal actions involving alleged health care fraud and abuse.

Fraud oversight is just one part of these agencies’ program integrity functions. These agencies are charged with protecting government resources, as well as program beneficiaries (consumers), by making sure that enrollment and required government payments are accurate and provided without delay. This involves ongoing audits of actors involved in the administration of Marketplaces and oversight of all individuals involved in ACA Marketplace enrollment and eligibility—from the agencies that run the program, to consumers and insurers, as well as those who assist in enrolling consumers, from agents and brokers to Navigators.

Improper enrollment or improper government payments of federal subsidies are fraudulent only if there is an intentional act to deceive or misrepresent facts in order to enroll or receive these benefits. The ACA does not have its own definition of “fraud” specific to Marketplace plans, but agencies can look to existing definitions that have been part of Medicare and Medicaid program integrity standards for some time.

In addition to this broad authority to oversee program integrity in the Marketplace, the ACA provides that if an applicant for Marketplace coverage or subsidies “knowingly and willfully” provides false or fraudulent information, the applicant may be subject to a civil penalty of up to $250,000 (smaller penalties apply where a consumer negligently provides false information in applying for Marketplace coverage). The civil penalty extends to “any person,” including an agent or a broker that directly provides false or incorrect information related to a Marketplace enrollment. In addition, any person who receives information from a Marketplace applicant in order to apply for coverage is subject to a civil penalty if they do not keep this information confidential.

The ACA also states that any payments made in connection with Marketplaces are subject to the False Claims Act if these payments include any federal funds. The False Claims Act is a century-old law that is designed to prevent and punish any individual or organization that defrauds the federal government. This could include circumstances where an individual intentionally presents, or causes to be presented, a false or fraudulent claim to the federal government. The ACA increased the penalties available for False Claims Act violations.

Marketplaces were created by the ACA as a platform for individuals to enroll in private insurance coverage and to apply for income-based federal subsidies. While the coverage is private—making it different from the public programs like Medicare and Medicaid, Marketplaces rely on federal dollars to (1) pay for and administer advance premium tax credits (APTCs) and cost-sharing reductions (CSRs) that help most enrollees pay for coverage, and (2) fund the agency, CMS, that runs the federally-facilitated Marketplace (FFM) (HealthCare.gov) for the states that elect not to operate their own Marketplace. CMS, along with the Internal Revenue Service (IRS) (part of the Treasury Department), set up a complex process to determine who is eligible for Marketplace coverage and financial assistance.

Oversight of these processes and the extent of each federal agencies’ authority to police the program at the federal level is still developing, as federal regulators and enforcers interpret and implement existing requirements. Recent federal activity in this area is discussed below.

The federal government functions exist alongside state oversight. States are the primary regulators of the private insurance coverage available in the Marketplaces and 20 states run their own Marketplace. As a result, each state has its own parallel authority to oversee the integrity of the programs they run and have their own fraud and abuse authority to deal with bad actors in the system, including insurers and those that sell insurance for these insurers, such as agents and brokers. As discussed below, states license the agents and brokers that sell Marketplace coverage.

2. Improper enrollment in Marketplace coverage and subsidies is not the same as fraud.

The ACA contains a unique structure for determining eligibility for Marketplace coverage and for eligibility for financial assistance (APTCs and CSRs). Eligibility is largely determined based on the projected household income of a consumer for the coming year—not on the consumer’s past or current income. Specifically, at open enrollment in the fall before the January 1 coverage year, the consumer is asked to estimate what their household income will be in the coming year.

In addition to open enrollment, there are limited special opportunities for individuals to enroll in Marketplace plans during the coverage year. These “special enrollment periods,” or SEPs, allow individuals to enroll in Marketplace coverage and obtain APTCs during the year if they meet specific criteria. Determining eligibility for SEPs also requires consumers to make an educated guess (estimate) about what their total annual household income will be at the end of the year.

Consumers, especially those with low incomes, often face difficulty predicting future income. KFF analysis found that individuals, especially those with low wages and unstable work, experience significant swings in income throughout the year. For those near poverty, predicting annual income may be especially difficult. Many people with incomes just above poverty at the beginning of the year end up below the federal poverty level (FPL) by the end of the year, and conversely, many who start out with incomes below poverty end up with incomes above poverty. Three in five (61%) people with starting incomes below poverty end the year with an income more than 20% different than their income during the first three months of the year. People with incomes below poverty ($15,060 for a single person in 2025) are not eligible for premium tax credits.

In setting up the Marketplace enrollment structure, Congress recognized that an individual’s annual income might end up being higher or lower than what they estimated when they applied for coverage. This difference could mean that a consumer appears to be “improperly enrolled” in Marketplace coverage or “improper payments” of Marketplace subsidies are paid by the federal government, even though the consumer did not intend to deceive or misrepresent their income. Recognizing this possibility, Congress provided for a process to “reconcile” APTC payments at the end of the year, once a consumer’s actual household income is known.

This is how the process works now: If a consumer is eligible for an APTC, these payments are made by the IRS directly to the insurer of the Marketplace plan that the consumer selects. The consumer does not directly receive these APTCs. If an individual’s actual household income at the end of the year was higher than the consumer estimated, the IRS may have paid too much money on behalf of the consumer to the insurer for APTCs. As a result, the consumer must “repay” the IRS the excess premium tax credit when the consumer files their income tax. Congress included provisions in the ACA that prohibit the federal government from requiring individuals below certain income levels to pay the full amount of excess premium tax credits (often referred to as “repayment limits or caps”). The example below illustrates how this works under current law:

Carla is a 27-year-old rideshare driver in Florida who also does seasonal work throughout the year. She estimated her 2024 income at $27,000 (179% of the FPL) and a $3,136 advance premium tax credit (APTC) was applied for Carla to purchase a benchmark Silver plan with a monthly premium of $3,595. She ended up working more that year than she initially expected, and as a result, she earned $37,650 (about 250% FPL), higher than what she estimated it would be. When filing taxes in 2025, she finds out that she should have received only $2,089 in APTC based on her actual income, meaning that her insurer was paid $1,047 more than Carla was eligible for in APTC. Due to her low income, however, Carla is not required to pay the full $1,047 to the IRS. Under repayment caps, Carla pays $950.

In this example, although Carla’s insurer received more APTC amounts than it should have, Carla did not intentionally underestimate her expected income (engage in fraud) in order to gain undue tax credits. She made an estimate that was reconciled at the end of the year when her actual household income was known, following the process Congress created in the ACA. The budget reconciliation law eliminates the repayment limits.

 Agents and brokers are state-licensed professionals who sell health insurance and assist consumers with selecting and enrolling in a health plan. Agents and brokers generally receive commissions from health insurance companies for enrolling individuals in health plans. A “web broker” is an individual or group of agents, brokers or business entities registered with the federal Marketplace that “develops and hosts” a non-Marketplace website that interfaces with the Marketplace to assist consumers with direct enrollment in Marketplace plans. Accusations of fraud have involved actions by these entities to fraudulently enroll consumers in Marketplace coverage in order to obtain commission payments from insurance companies. These fraudulent enrollments typically involve one of the following scenarios:

  • Unauthorized Enrollment: Enrolling an individual in Marketplace coverage without their consent
  • Unauthorized Switching: Switching an individual already enrolled in a Marketplace plan to another Marketplace plan without their consent

Brokers have played a large part in the Marketplace enrollment surge in recent years (Figure 1). According to KFF analysis of CMS data, during open enrollment for the 2021 plan year, brokers assisted 55% of active plan selections in HealthCare.gov states, increasing to 78% for 2024. Approximately one in five of all HealthCare.gov enrollments were “passive” (automatic) re-enrollments during these years (21% for 2021-2023, and 22% for 2024). We do not know how many of those who were automatically re-enrolled may have been assisted by a broker at some point during open enrollment. Broker-assisted enrollment data from 2016 to 2020 are among all HealthCare.gov enrollments, including automatic re-enrollments, so are not directly comparable with the 2021-2024 data. For context, however, 40% of all HealthCare.gov enrollments in 2016 were broker-assisted.

The Share of HealthCare.gov Enrollments Facilitated by an Agent or Broker Increased From Just Over Half in 2021 to Just Over 3/4 in 2024

Between January 2024 and August 2024, CMS received 183,553 complaints of unauthorized enrollments, and 90,863 complaints of unauthorized switching of plans sold on the FFM (HealthCare.gov). CMS suspended 850 brokers for reasonable suspicion of fraudulent or abusive behaviors related to unauthorized plan switches and unauthorized enrollments between June and October 2024. Some of the entities suspended were web brokers approved and registered by CMS to host an application for Marketplace coverage on their own websites through processes called direct enrollment (DE) and enhanced direct enrollment (EDE). These functions are discussed below.

CMS took action to resolve the complaints, putting safeguards into place to protect consumers from broker fraud. For example, CMS announced that starting in July 2024, it would block agents and brokers from modifying a consumer’s HealthCare.gov enrollment unless the agent or broker has already assisted the consumer with enrollment in the past. Also, agents and brokers must enter into a three-way call with consumers and the Marketplace Call Center when trying to make changes to an account they are not already associated with.

Fraud allegations brought wide-ranging reactions from Congress in the summer of 2024. Some House Republican leaders called for further investigation, alleging that recent legislative and regulatory changes made to Marketplace rules (specifically, enhanced APTCs and Biden-era regulations aimed at reducing barriers for consumers signing up for Marketplace coverage) created incentives that encouraged Marketplace fraud. Democratic Congressional leaders, on the other hand, introduced legislation aimed at improving oversight and accountability for agents, brokers and marketing entities that engage in fraud.

Consumers sued brokers alleging fraudulent enrollment. In April 2024, consumers (and some brokers) brought class action litigation against specific brokers, web brokers, and marketing companies that generate sales leads (called “lead generators”) alleging, among other things, that the unauthorized switching and enrollment were part of a widespread scheme to obtain broker commissions that resulted in harm to enrollees and to brokers that originally placed an enrollee in coverage before the switch. While the case has since been dismissed, the plaintiffs alleged that the parties involved “created, sold, purchased and/or financed the purchase of leads that deceived consumers into thinking that they would receive cash cards and other cash benefits.” Leads include information such as consumer names and contact information that agents and brokers use to generate business. Many individuals and groups are in the business of lead generation and are not themselves licensed as agents and brokers. They sell or provide this information to those licensed to sell insurance.

How the alleged scheme worked: The complaint alleged a complicated scheme involving multiple parties. Marketing agencies and other individuals developed social media ads that falsely offered free cash rewards. Consumers that clicked on the ad were brought to a landing page where they were asked to provide specific information with the promise of cash. This information was captured and sold to agents and brokers who, using an enhanced direct enrollment platform, enrolled consumers in Marketplace coverage without their knowledge or switched their existing coverage to another plan.

Some brokers involved in the case brought an action against the federal government. In August 2024, TrueCoverage, LLC and Benefitalign LLC, two of the entities that had been sued in the April 2024 litigation and that had been suspended from the ACA Marketplaces, sued HHS and CMS after they were blocked for engaging in conduct that “compromised and placed consumers’ personally identifiable information (“PII”) and the integrity of the Exchanges at risk.” The case was dropped by the plaintiffs in October 2024, following a court decision denying the plaintiffs’ request for emergency relief. The court found that current regulation permits CMS to suspend direct enrollment entities based on “circumstances” that pose a “risk” that is “unacceptable.” Proof that systems have been compromised is not required.

Many suspended brokers were reinstated in 2025, according to CMS. It was reported that by March 2025, CMS had reinstated at least some of the brokers that had been suspended. It is not clear whether the reinstated brokers had demonstrated to HHS that they had remedied the cause of the suspension, as required in a regulation finalized by the Biden administration in January 2025. In June 2025, CMS released a Frequently Asked Questions (FAQs) document related to the removal of more than 1,000 brokers from its agent/broker suspension and termination list.

While these fraud allegations received nationwide attention in 2024, federal investigations of agents and brokers date back to at least 2018 (before the availability of enhanced APTCs and the Biden administration’s enrollment changes). Law enforcement action against agents and brokers include allegations of activity as far back as 2018. For example:

  • The Justice Department, in February 2025, charged two individuals with intentionally enrolling consumers in fully subsidized Marketplace plans between 2018 and 2022 that they were not eligible for in order to obtain commission payments. The indictment alleges that the individuals used misleading and deceptive sales tactics that targeted low-income individuals and provided false addresses and social security numbers. The trial is scheduled for later this year.
  • Another recent Justice Department indictment alleges similar activity dating back to 2019.
  • Annual HHS/DOJ reports on health fraud and abuse enforcement note investigations of agents and brokers going back to 2019. For example, the annual report on fraud enforcement activity for FY 2019 noted that CMS “reviewed cases of agent and broker misconduct and took administrative actions including terminating CMS’s agreements with agents and brokers and imposing civil monetary penalties on those agents and brokers who were found to have engaged in misconduct.” An FY 2023 report stated that CMS had received over 73,000 consumer complaints involving such misconduct as consumers being enrolled in federal Marketplace policies without their consent. That year, CMS “conducted over 80 investigations of outlier and high-risk agents and brokers, and made recommendations for administrative action, including suspension and termination of an agent’s and/or broker’s registration to sell policies on the FFM.”

4. Agents and brokers (including web brokers) who assist in Marketplace enrollment are regulated by both the federal government and states. 

Clearing the pathway to allow brokers to assist consumers to enroll in Marketplace plans aligns with an ACA goal to increase consumer access to comprehensive health coverage. However, the history of broker-related fraudulent enrollment activity points to the importance of oversight of these entities. This not only protects consumers but also ensures that brokers operating in good faith with adequate control and accountability for the third parties that assist them can still provide enrollment help for Marketplace consumers. Both the federal government and states have authority to regulate agents and brokers.

Federal Marketplace oversight related to brokers’ conduct has developed over time aimed at protecting consumers from fraud, as well as preventing deceitful marketing practices and other potentially harmful conduct. The ACA requires the Secretary of HHS to establish procedures where States may allow agents and brokers to enroll individuals in Marketplace plans and assist them in applying for Marketplace subsidies. With this authority, CMS has developed and continues to update requirements agents and brokers must meet in order to assist consumers to enroll in Marketplace coverage. CMS has developed a framework that is different from CMS agent and broker requirements for Medicare Advantage plans. In Medicare Advantage, the insurers have a legal responsibility to ensure agents and brokers comply with federal (and state) requirements. For Marketplace plans, CMS has set standards to regulate agents and brokers directly, without accountability flowing through the insurers that hire them.

In the early years of ACA Marketplace regulation, rules largely included in annual CMS regulations added a range of requirements including a process for broker termination and suspension, standards for the display of Qualified Health Plan (QHP) information and disclaimers that must be posted when certain QHP information is not available, and standards of conduct for agents and brokers selling plans on the FFM.

New technology allows more consumers to enroll in Marketplaces but raises new concerns. “Direct Enrollment” (DE) is a process that allows insurers and web brokers to enroll consumers in coverage directly from their websites. Initially, the direct enrollment pathway allowed the consumer to start the process on a web broker’s own website, but then had to be redirected back to HealthCare.gov to complete the eligibility application before returning to the web broker site to select a plan. Improved technology has added new enrollment pathways that allow agents and brokers to complete the entire eligibility application and enroll consumers in coverage on their own third-party website platforms, without being redirected to HealthCare.gov. This process is known as “Enhanced Direct Enrollment” (EDE).

Although EDE was praised for its potential to increase HealthCare.gov enrollments, as with any new technology, there are and continue to be concerns about privacy and security of consumer information, the potential for fraud, and the possibility that EDE could lead to consumers receiving inaccurate or misleading information that might affect eligibility determinations and consumer choice. In March 2016, CMS announced its intent to implement this new enrollment pathway in the federally-facilitated Marketplace but delayed implementation of the EDE pathway until 2018 and added new safeguards, including a process for HHS-approved third-party entities to periodically monitor and audit agents and brokers using the DE or EDE pathways.

Use of EDE begins and grows; CMS makes further changes to agent and broker standards. The Trump administration expanded the use of the EDE pathway for the federal Marketplace with CMS’s approval of its first Enhanced Direct Enrollment partner, HealthSherpa, in December 2018.

  • CMS reported that DE and EDE pathways were utilized for 37% of all active HealthCare.gov plan selections during 2021 open enrollment, up from 29% during 2020 open enrollment, attributing its growth to increased use of the EDE pathway. The EDE process has historically only been available in HealthCare.gov states; however, in 2024, Georgia became the first state-based Marketplace (SBM) to partner with EDE entities.
  • HealthSherpa reported that more than 95% of total EDE enrollments came through its EDE implementations during the 2021 open enrollment.
  • CMS implemented Help On Demand, a referral service allowing consumers using HealthCare.gov to request enrollment assistance from licensed agents and brokers.
  • CMS added new requirements specific to issuers, agents, and brokers as direct enrollment grew. In 2019, the Trump administration rescinded a requirement that only HHS-approved auditors conduct third-party audits of these entities, allowing issuers, agents, and brokers to choose their own auditors.

Continuing consumer complaints of unauthorized agent and broker enrollment resulted in further changes to agent and broker oversight. Regulations issued during the Biden administration updated agent and broker oversight requirements, including:

  • In 2023, to address enrollments done without consumer consent, CMS established new requirements that require agents, brokers, and web brokers in the federal Marketplace to verify that the eligibility application information they collected has been reviewed and confirmed by the consumer before submission. Receipt of the consumer’s consent has to be documented by agents, brokers, and web brokers.
  • To clarify the reach of federal enforcement against agents and brokers, standards finalized in January 2025 allow CMS to hold “lead agents”—typically executives or others in leadership of broker agencies –accountable for misconduct or noncompliance that they direct or oversee.
  • CMS clarified its authority to take immediate action to suspend a broker’s or agent’s access to the DE and EDE pathways and their ability to transmit information to the Marketplace when circumstances pose an “unacceptable risk” to enrollees, the accuracy of the Marketplace’s eligibility determinations, or the Marketplace’s information technology systems.

States also oversee insurance agents and brokers. Agents and brokers are required to be licensed in every state where they sell health insurance and are also required to complete the CMS Agent and Broker Federally-facilitated Marketplace (FFM) registration to sell Marketplace plans. To further combat fraud and other deceptive practices, the National Association of Insurance Commissioners (NAIC) reports that every state and the District of Columbia (DC) has made insurance fraud a crime for at least some lines of insurance, and 42 states and DC have insurance fraud bureaus that investigate claims of illegal insurance activities and work to prosecute insurance fraud. The NAIC’s model state law, Unfair Trade Practices Act (Model 880), which describes activities considered “unfair or deceptive acts or practices” in the insurance industry, has been adopted in some form by 45 states and the District of Columbia.

States that operate their own Marketplaces currently have considerable flexibility to establish additional policies and procedures in their Marketplaces for agents and brokers. States can go beyond the requirements set out in federal regulations for oversight. For example, Idaho’s SBM stated that its online platform requires multi-factor authorization and only consumers can add an agent to their account. Massachusetts’s SBM does not use brokers nor does it permit EDEs to enroll consumers. California’s SBM requires that agents be specifically added by the consumer through their consumer portal (or consent can be verified through a three-way call), and consumers can edit and remove permissions on that portal.

Some states have been proactive in law enforcement actions related to Marketplace agent and broker fraud. For example, Massachusetts and California took action related to fraudulent Marketplace enrollments concerning a scheme involving substance use disorder treatment centers a few years ago. Although there have been allegations of Marketplace broker fraud in Florida in recent years, information on recent enforcement activity by the state is not available.

5. Final regulation and budget reconciliation law introduce new paperwork and other enrollment requirements for Marketplace consumers but make few changes to broker oversight.

In the final Marketplace Integrity and Affordability rule, released on June 20, 2025, CMS says that Marketplace fraud occurred due to the widespread availability of zero-dollar out-of-pocket premium plans following the implementation of enhanced premium tax credits and enrollment policy changes during the Biden administration. The final regulation introduces many significant changes to Marketplace enrollment standards, verification processes, and documentation requirements. Some of these changes apply to both the federal Marketplace and state-based marketplaces and many will expire at the end of the 2026 plan year. The 2025 budget reconciliation law includes some related provisions (without an expiration date) as well as some additional enrollment and eligibility changes.

The final regulation addresses concerns about fraud in the Marketplace primarily by implementing stricter consumer-facing verification and eligibility procedures as well as by limiting enrollment opportunities. Some examples of the provisions include:

  • Requiring Marketplaces to generate a data matching inconsistency if a consumer estimates that their income will be between 100% and 400% of the FPL (between $15,650 and $62,600 for a single person in 2025), but IRS data or other data sources show their past income was below 100% of the FPL. Takes effect in August 2025 and expires at the end of the 2026 plan year.
  • No longer requiring Marketplaces to accept an applicant’s or enrollee’s estimate of projected household income when tax return data is unavailable. Under the regulation, Marketplaces will be required to confirm income with other data sources and require that applicants submit documentation that confirms their income. Takes effect in August 2025 and expires at the end of the 2026 plan year.
  • Removing the low-income SEP that allows low-income consumers to enroll in a Marketplace plan during the year if their estimated income is no more than 150% of the FPL ($23,475 for a single person in 2025). Takes effect in August 2025 and expires at the end of the 2026 plan year (see similar, permanent provision below). 
  • Requiring consumers in FFM states who are automatically re-enrolled in a $0-premium plan (because tax credits fully cover their premium) to confirm or update their eligibility during Open Enrollment or face a $5 monthly charge. Applies to the 2026 plan year only and does not apply to SBM states.
  • Shortening the Open Enrollment period so that, for all Marketplaces, Open Enrollment must begin no later than November 1 and end no later than December 31. Begins with the 2027 Open Enrollment period and does not expire. 

Although there are some related provisions in the final regulation and the budget reconciliation law, the law contains several additional provisions related to eligibility and enrollment, which do not expire. For example, the law:

  • Removes APTC repayment limits and requires all enrollees, including those with low incomes, to repay the entirety of any excess premium tax credits that were paid to their insurer. Begins with the 2026 plan year.
  • Prohibits eligibility for APTCs for Marketplace consumers who qualify for special enrollment periods based solely on their income relative to the poverty level, beginning with the 2026 plan year.
  • Eliminates eligibility for APTCs for certain low-income, lawfully present immigrants by excluding individuals such as refugees, asylees, and survivors of human trafficking. Begins in 2027.
  • Establishes new requirements for consumers to verify specific information before they can receive APTCs. This provision could effectively end automatic re-enrollment for most Marketplace consumers. Consumers will still be permitted to enroll in a health plan while awaiting confirmation of eligibility, but they will not receive APTCs until after their eligibility is verified. Begins with the 2028 plan year. 

See this KFF analysis for additional details on the ACA-related provisions in the 2025 budget reconciliation law.

Changes include few reforms to agent and broker oversight. There is only one provision in the final rule that specifically addresses agents and brokers. The final regulation clarifies the standard that CMS must prove to terminate a broker contract as the “preponderance of the evidence” standard of proof. The rule defines “preponderance of the evidence” as proof by evidence that, when compared to opposing evidence, leads to the conclusion that the fact at issue is more likely true than not. This provision appears to be aimed at providing more transparency to agents and brokers about the standard the government will use to determine whether they have breached their contract with CMS or other standards of conduct agents and brokers are required to meet. No reforms to broker and agent oversight are included in the budget reconciliation law.