News Release

Walgreens and Greater Than AIDS Partner with Health Departments and Community Organizations to Provide Free HIV Testing and Information in 250+ Cities on National HIV Testing Day (June 27)

Largest Coordinated HIV Testing Event in the Nation

Published: Jun 15, 2022

DEERFIELD, Ill. & SAN FRANCISCO, June 15, 2022 – Walgreens and Greater Than AIDS, a public information initiative of KFF (Kaiser Family Foundation), are teaming up with health departments and community organizations in more than 250 cities to host the largest coordinated National HIV Testing Day (NHTD) event in the nation. Click here for a list of participating Walgreens stores and hours to get a free HIV test on Monday, June 27.

“The last two years of COVID-19 saw declines in HIV testing, and many places are still not at the levels they were before,” said Tina Hoff, a senior vice president, KFF. “We are thrilled to support our community partners in getting out the word about the importance of routine HIV testing in both treatment and prevention and continue our partnership with Walgreens.”

According to the U.S. Centers for Disease Control and Prevention, about 13% of the estimated 1.2 million people in the U.S. living with HIV today are not aware of their status. Early diagnosis and treatment are vital to preserving health and preventing transmission.

Nearly 300 local health departments and community organizations will be at participating Walgreens stores to provide free, confidential and fast test results on-site, without the need to schedule an appointment. Counselors will be on hand to answer questions about HIV prevention and treatment options, including PrEP, a medication that offers another effective means to reduce the risk of getting HIV.

“HIV testing is recommended as part of routine health care, yet many Americans are not getting tested as often as advised. As a result, many people living with HIV are unaware of their status,” said Kevin Ban, MD, chief medical officer, Walgreens. “That’s why Walgreens and Greater Than AIDS, together with our community partners, are expanding free and confidential HIV testing—to help people know their HIV status and take control of their health.”

The Greater Than AIDS and Walgreens National HIV Community Partnership is an ongoing commitment to work with local health departments and community organizations to expand HIV testing and information through non-traditional settings. Since 2011, more than 72,000 free HIV tests have been provided as part of the annual event, including over 15,000 self-tests provided during the height of the COVID-19 pandemic to be administered at home.

Walgreens has supported people living with HIV/AIDS since the beginning of the epidemic more than 40 years ago. Walgreens invests in training of its pharmacy team members to address the specific challenges faced by people living with HIV, supports several local and national HIV organizations and continues to participate in ongoing research to help end the HIV epidemic.

Participating Walgreens stores and testing hours for this year’s NHTD activation are available here. Abbott, BioLytical Laboratories and OraSure Technologies, Inc. have provided community partners with donated HIV tests in support of the 2022 program.

About Walgreens

Walgreens (www.walgreens.com) is included in the United States segment of Walgreens Boots Alliance, Inc. (Nasdaq: WBA), an integrated healthcare, pharmacy and retail leader serving millions of customers and patients every day, with a 170-year heritage of caring for communities. As America’s most loved pharmacy, health and beauty company, Walgreens purpose is to champion the health and well-being of every community in America. Operating nearly 9,000 retail locations across America, Puerto Rico and the U.S. Virgin Islands, Walgreens is proud to be a neighborhood health destination serving approximately 9 million customers each day. Walgreens pharmacists play a critical role in the U.S. healthcare system by providing a wide range of pharmacy and healthcare services. To best meet the needs of customers and patients, Walgreens offers a true omnichannel experience, with fully integrated physical and digital platforms supported by the latest technology to deliver high-quality products and services in local communities nationwide.

About Greater Than AIDS

Greater Than AIDS is a leading national public information response from KFF focused on communities most affected. Through targeted media messages and community outreach, Greater Than AIDS and its partners work to increase knowledge, reduce stigma and promote actions to stem the spread of the disease.

About KFF

KFF (Kaiser Family Foundation) is a nonprofit organization focusing on national health issues, as well as the U.S. role in global health policy. KFF develops and runs its own policy analysis, polling, journalism and communications programs, sometimes in partnership with major news organizations. No affiliation with Kaiser Permanente.


[i] HIV.gov U.S. Statistics. Fast Facts. https://www.hiv.gov/hiv-basics/overview/data-and-trends/statistics. Last updated June 2, 2021. Accessed May 27, 2022.

Key Characteristics of Infants and Implications of the Recent Formula Shortage

Published: Jun 9, 2022

In recent weeks, the United States has been grappling with a baby formula shortage following supply chain issues, a voluntary recall, and the closing of a plant that produces a large share of the country’s formula. Data for the week ending May 28th show that the nationwide out-of-stock percentage for baby formula reached 74% among U.S. retailers. Since it is recommended that infants receive breast milk or formula until they are age one, this shortage has had a significant impact across the country. Infants in low-income families and infants of color, who are often covered by Medicaid, may be particularly impacted by the shortage resulting in potential short and long-term health risks. To better understand who may be particularly affected and at risk from the formula shortage, we analyzed data from the 2019 American Community Survey and data from the Centers for Disease Control and Prevention’s (CDC’s) National Immunization Survey for infants born in 2018 to describe the size and characteristics of the U.S. infant population as well as their use of formula.

Who does the formula shortage impact?

As of 2019, there were approximately 3.4 million infants under the age of one in the U.S..1  Almost half of children under the age of one are children of color, including more than a quarter who are Hispanic (25.4%), 13.1% who are Black, and 4.2% who are Asian (Figure 1). Smaller shares are American Indian or Alaska Native (AIAN) or Native Hawaiian or Other Pacific Islander (NHOPI) (<1% each). Nearly four in ten children under the age of one live in a family with income below 200% of the Federal Poverty Level (FPL), including 18.2% below poverty and 21.1% between 100-200% FPL (the FPL was $20,578 for a family of three in 2019). Over four in ten (42.0%) of all children under the age of one are covered by Medicaid/CHIP.

Distribution of Children Under Age 1 by Race/Ethnicity, 2019

More than half (54%) of infants born in 2018 received formula, either exclusively or as a supplement, by three months of life (Figure 2). The CDC reports that 46% of babies born in 2018 were exclusively breastfed through three months of age and 26% through six months. The CDC also reports that, among babies born in 2018, 19% of breastfed infants were supplemented with formula within two days of life.

Percent of Infants Born in 2018 Who Were Exclusively Breastfed by Age

Infants in low-income families, infants of color, and infants living in rural communities are more likely to use formula and therefore may be hardest hit by the formula shortage. Infants in lower income households are less likely than those in higher income households to report exclusive breastfeeding through the first three months of life (Figure 3). Similarly, data show that lower shares of Black and Hispanic infants are exclusively breastfed through their first three months of life compared to White infants (Figure 3). CDC data also show Black infants born in 2018 are less likely to be ever breastfed compared to Asian, White, and Hispanic infants. Infants living in rural areas are also less likely to be ever breastfed than those in urban areas. In addition to already being more likely to use formula, low-income families also may have less time and resources to search for and purchase in-stock formula, and those living in rural areas may have fewer retailers available in their proximity to access formula. Moreover, babies with complex health needs may require specific formula types, which may be more difficult to find.

Percent of Infants Born in 2018 Exclusively Breastfed Through 3 Months by Federal Poverty Level

Medicaid and CHIP cover many infants that are likely being hardest hit by the formula shortage. The majority of children under the age of one covered by Medicaid and CHIP are infants in low-income families and infants of color, who are more likely to be impacted by the formula shortage.2  Over one-third (34%) of all children who reported receiving formula during the first 12 months of their life were covered by Medicaid/CHIP only.3  Also, infants with Medicaid/CHIP as their sole source of coverage were more likely to report receiving formula for the first time before 6 months old compared to infants with private insurance only (Figure 4).

Share of Infants Who Were Less Than 6 Months Old When First Fed Formula by Health Insurance Coverage, 2020

Almost half of all formula in the U.S. is purchased by families enrolled in WIC. WIC is a nationwide program designed to support low-income women, infants, and children up to age five found to be at nutritional risk. State WIC programs provide infant formula to WIC participants and typically enter into rebate contracts with infant formula manufacturers, providing one brand of formula in exchange for a rebate. CDC data show infants enrolled in WIC are less likely to report ever being breastfed compared to those not receiving or ineligible for WIC. In addition, approximately three quarters of individuals eligible for the Special Supplemental Nutrition Program for WIC were also enrolled in Medicaid.

What are the implications of the formula shortage?

There may be health and economic consequences for infants and families who are not able to access enough formula. Baby formula provides vitamins and nutrients essential for a baby’s growth during an important period of child development. Without these nutrients, children can face significant short- and long-term health complications, including dehydration, slow growth, behavior problems, and developmental delays. Diluting formula or formula alternatives can also be dangerous for babies, slowing growth and possibly causing health issues including seizures. The data above suggest that low-income infants and infants of color may be at increased risk for facing these health risks, which may contribute to widening disparities in health for these groups. Infants with allergies or special health needs may also find it more difficult to find the specific formula they need, increasing their risk for health complications. Moreover, as the primary source of coverage for a majority of low-income children, Medicaid programs would be responsible for providing medical care to infants experiencing health complications. Further, the formula shortage comes at a time when inflation and prices for household goods and gas have risen, putting a strain on family budgets. There may be financial implications for families, with some WIC recipients reporting paying out of pocket to obtain the formula they need.

There are limited options for families navigating the formula shortage. The Department of Health and Human Services advises families to try different brands of formulas and to try formulas made in a different country. For infants relying on hypogenic or medical specialty formula, families are advised to talk to a pediatrician or other health care provider about substitutes, who may also be able to submit urgent product requests to Abbott Nutrition, which is releasing some specialty formulas on a case-by-case basis. As a major source of coverage for infants, Medicaid providers and health plans can be a source of trusted information to families about formula options and switching formula brands. State health agencies and WIC offices are also providing tips and information on how to access formula during this time.

A number of legislative actions have been taken to increase access to formula, especially for low-income families. While the formula plant that shutdown recently reopened, it will take weeks to bring the plant to full capacity and the shortage is expected to last until July. In the meantime, the Biden Administration has invoked the Defense Production Act (DPA) and is expediting the import of infant formula through Operation Fly Formula and addressing price gouging. President Biden also recently signed the Access to Baby Formula Act of 2022 into law, which waives certain WIC requirements during an emergency, and states are adopting flexibilities that expand the brands, sizes, and types of formula available to WIC recipients and allow for exchanges of formula purchased by WIC recipients. The House also passed a bill on May 18th that provides $28 million in emergency funding to the U.S. Food and Drug Administration (FDA) to provide resources to address the shortage and prevent future shortages. While these measures are expected to increase the availability of formula in the short-term, some are raising questions on the consolidation of the U.S baby formula market and how a shortage like this will be prevented in the future.

  1. KFF analysis of the 2019 American Community Survey. ↩︎
  2. KFF analysis of the 2019 American Community Survey. ↩︎
  3. KFF analysis of the 2020 National Survey of Children’s Health. Only children ages 0-5 were asked about formula feeding, and children less than 12 months were excluded from estimates. ↩︎
Poll Finding

KFF Health Tracking Poll: Views on and Knowledge about Abortion in Wake of Leaked Supreme Court Opinion

Published: Jun 9, 2022

Findings

For decades, KFF polling has provided insights into national and state-level reproductive health care policy including multiple public opinion polls examining the experiences and attitudes of the general public as well as the group most impacted by such policies – women between the ages of 18 and 49. This latest KFF poll was fielded the week following the leak of a draft of the U.S. Supreme Court opinion on Dobbs v. Jackson Women’s Health Center. If the final ruling in the case resembles the leaked draft, the Court would overturn Roe v. Wade and end the constitutional right to abortion. This analysis examines the public’s attitudes and understanding of the future of reproductive health and abortion access in the U.S. and looks at the role abortion and a decision on Dobbs may play in the upcoming midterm elections this November.

Key Findings:

  • Majorities of U.S. adults are aware of the leaked draft of the pending Supreme Court decision, and majorities across gender and partisanship say it is either “very likely” or “somewhat likely” the Supreme Court will be overturning Roe v. Wade this year. With this in mind, nearly two-thirds of adults do not want to see the decision overturned, and a large majority (74%) say abortion should be a personal choice and not something that is regulated by law.
  • Among those who live in the 17 states1  where abortion is certain or very likely to be banned if Roe v. Wade is overturned, majorities are aware that getting an abortion would be much harder in their state as a result of such a decision. However, partisans differ on whether this increased difficulty is a good or a bad thing, with Republicans more likely to say it would be a “good thing” that abortion would be harder to access in their state and Democrats more likely to view it as a “bad thing.”
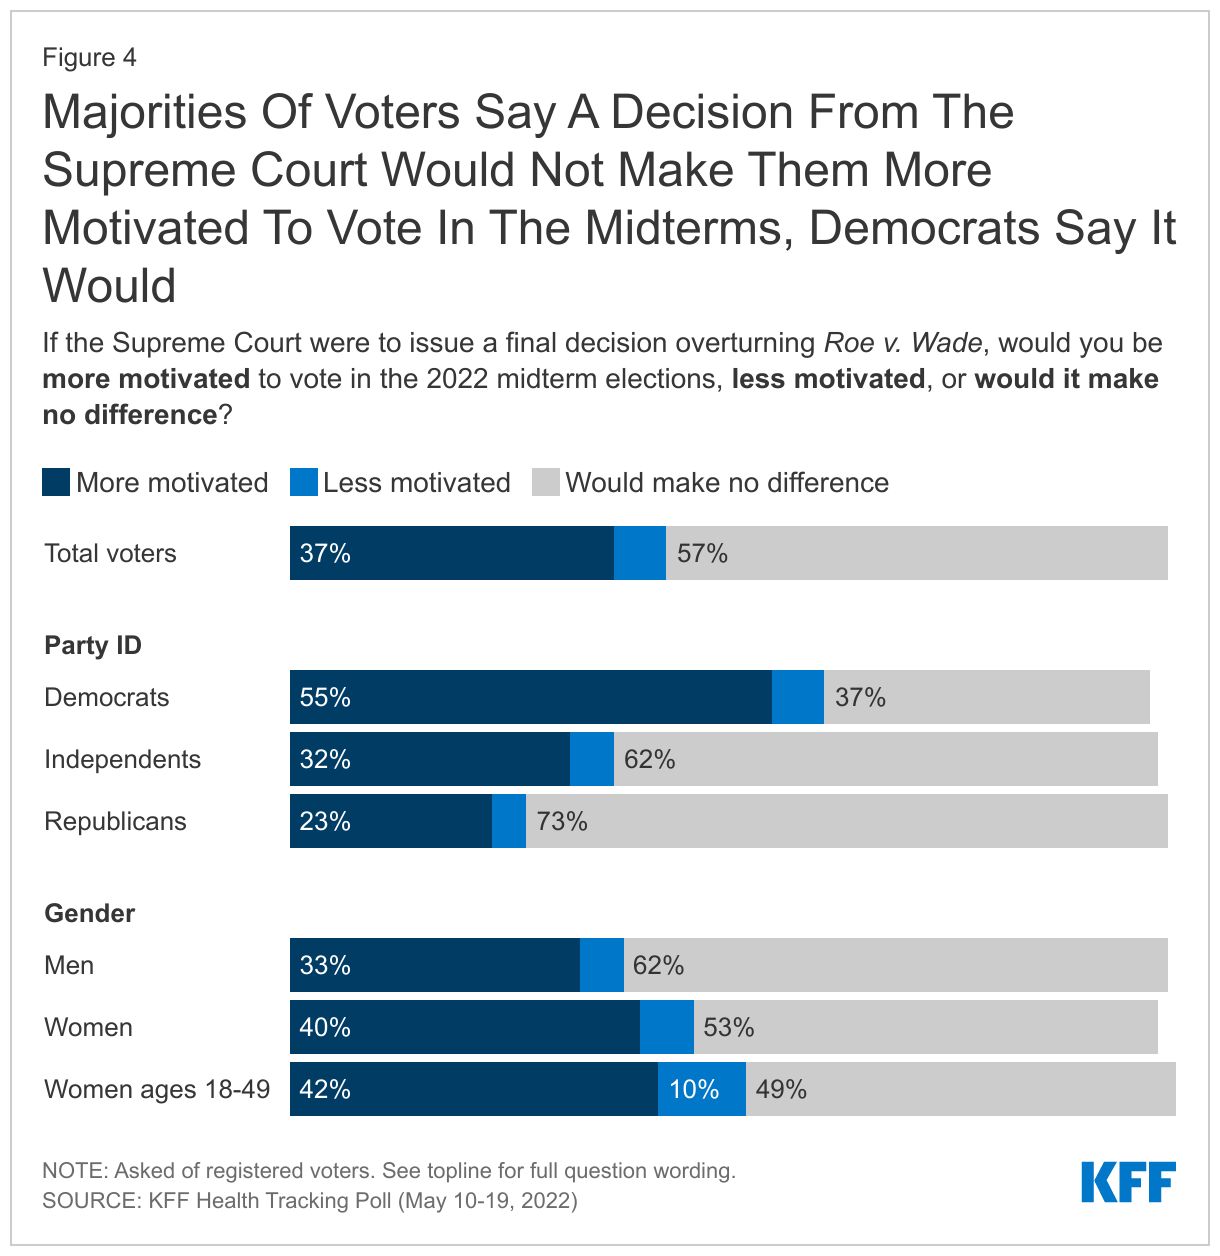
  • Looking ahead to the role this decision could play in the anticipated Republican Wave in the midterm elections this November, most voters (57%) say a Supreme Court ruling overturning Roe v. Wade would not make a difference in their motivation to vote in the upcoming midterms and some (6%) say it would make them less motivated to vote. On the other hand, nearly four in ten voters (37%) say such a decision would make them more motivated to vote, including at least half of all Democratic voters (55%) and Democratic voters in states where abortion is likely or certain to be banned if Roe is overturned (51%). Majorities of Republican voters (73%) and Republican women voters (74%) say it would not make a difference in their motivation to vote.
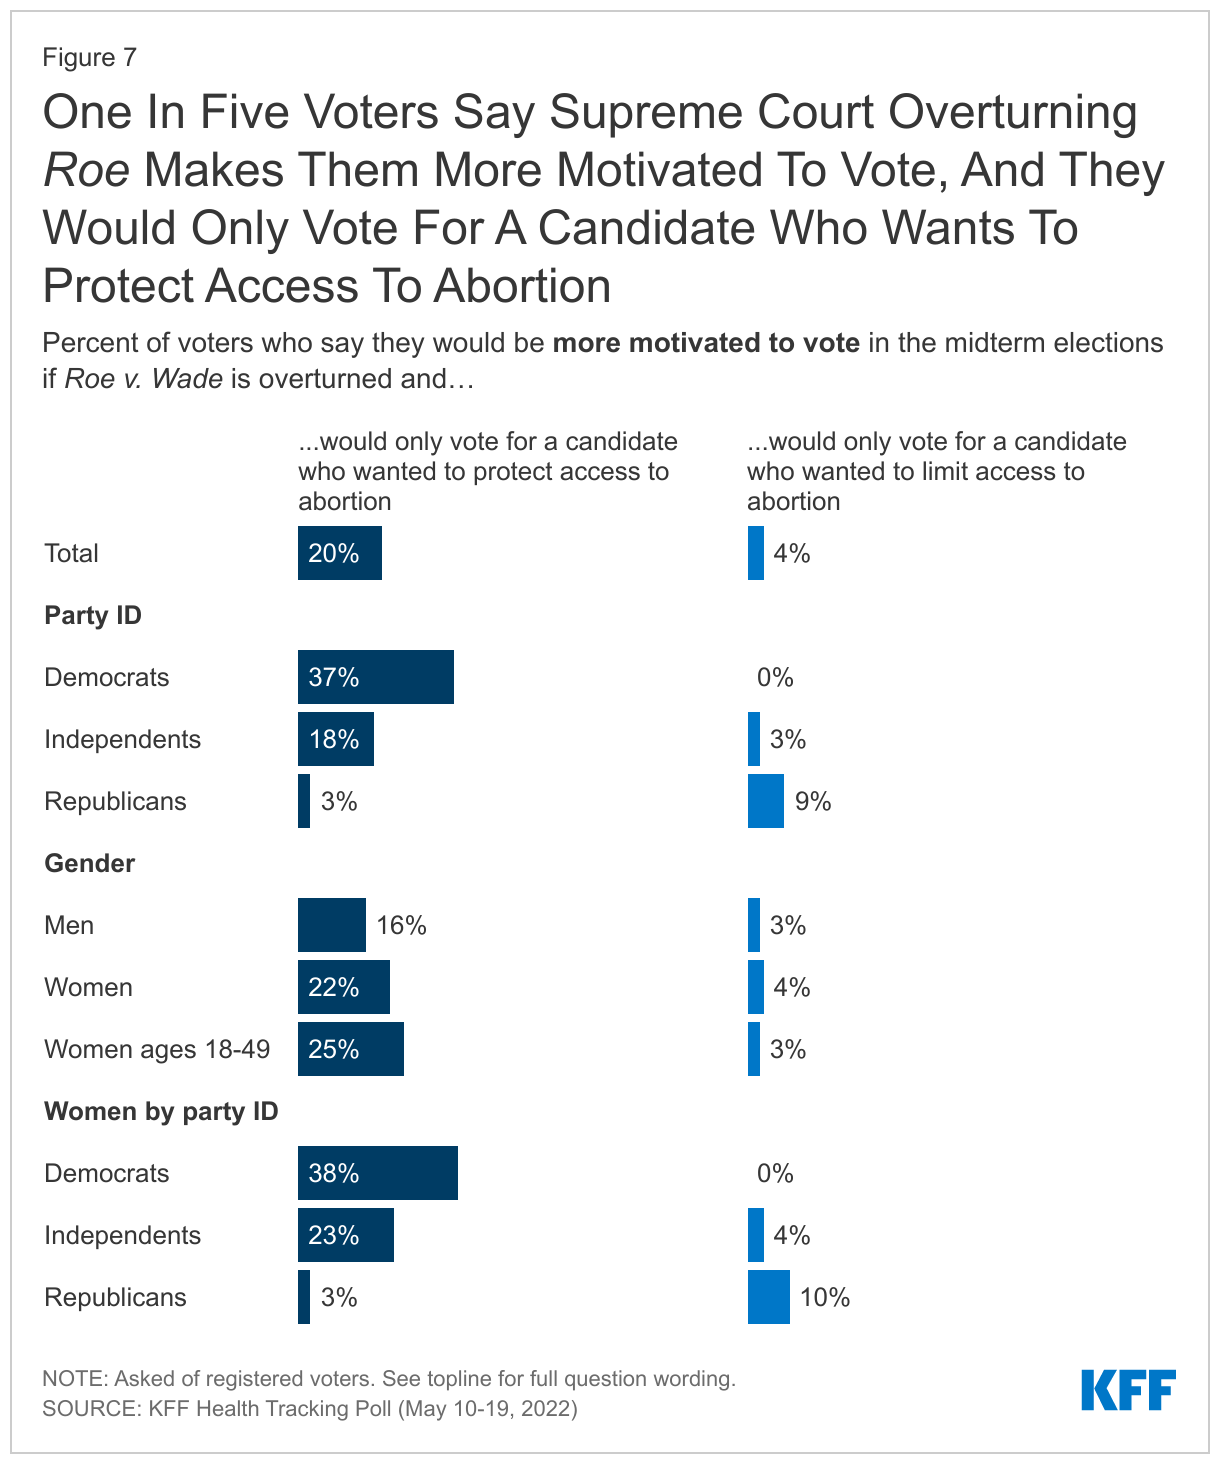
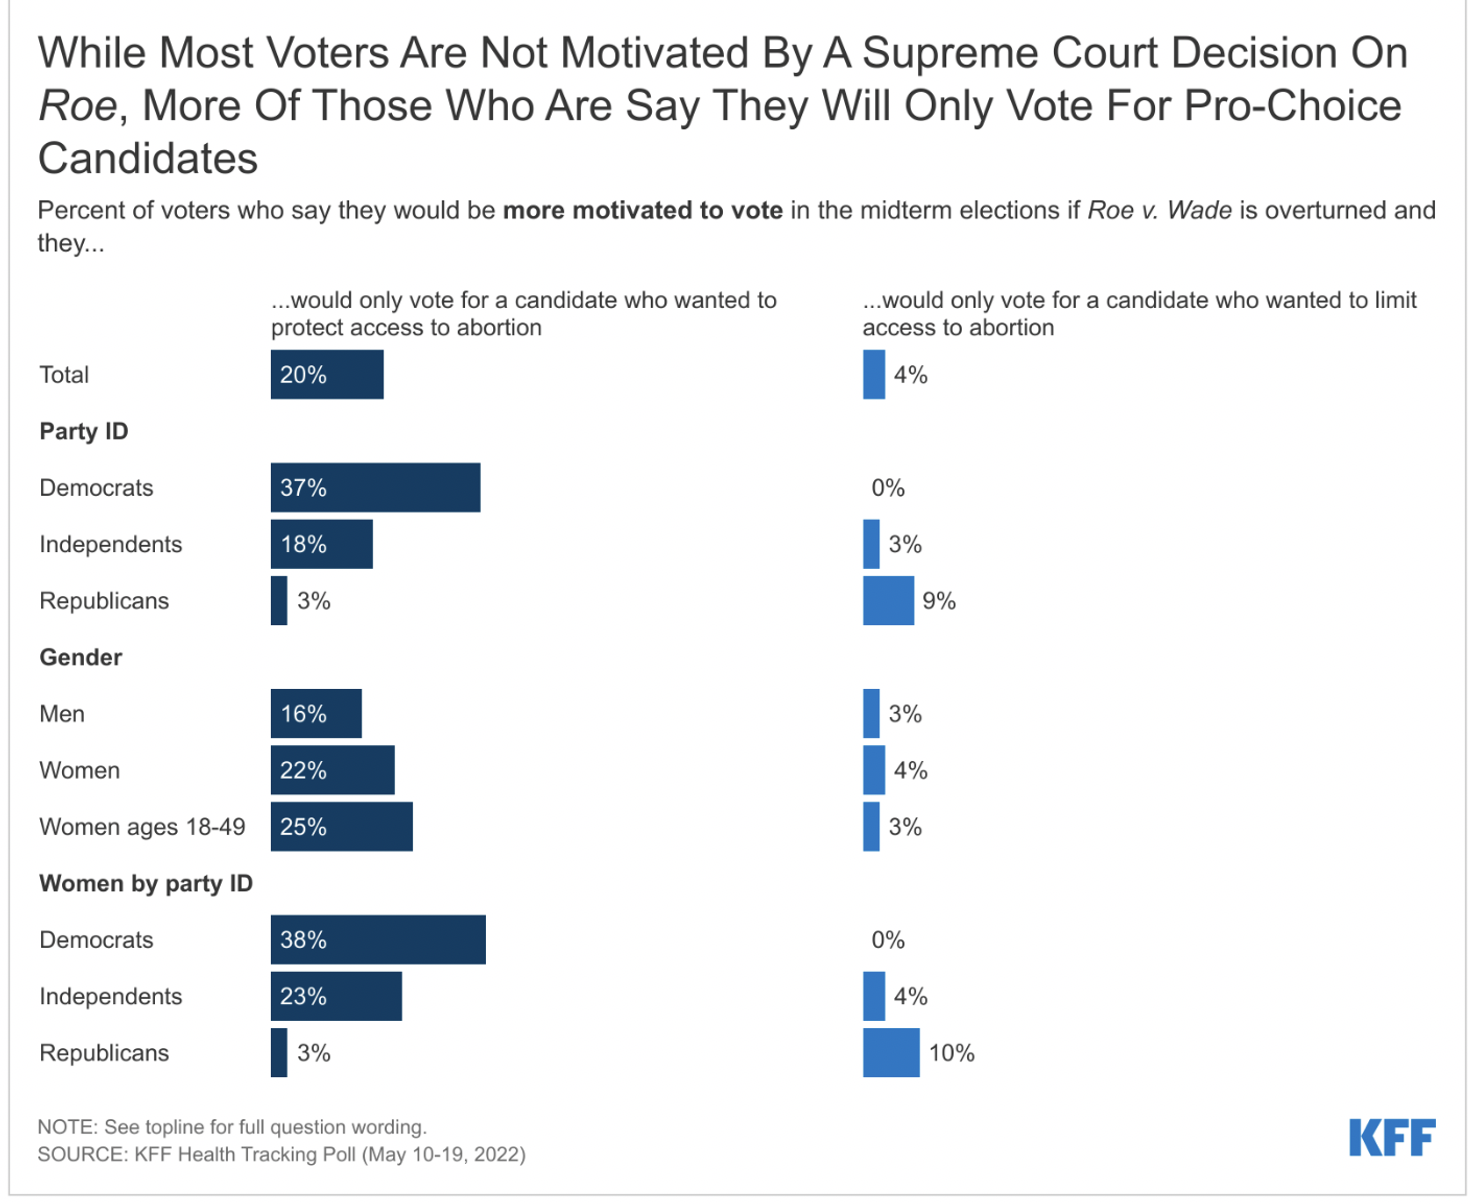
  • While a Supreme Court ruling overturning Roe v. Wade doesn’t appear to motivate a majority of voters overall, there is a small share of voters (20%) who say they would be more motivated to vote and that they would only support a candidate who shares their view and wants to protect access to abortion. This includes nearly four in ten Democratic voters, Democratic women voters, and one-fourth of women voters ages 18-49. A smaller share of voters (4%) says they would be more motivated to vote by the Supreme Court decision, but in the opposite direction – to only support candidates who want to limit access to abortions.
  • There is an age divide among voters who prefer candidates who want to protect abortion access, that crosses partisanship and gender lines, with voters under age 50, regardless of party identification and gender, more likely to prefer such candidates compared to their older counterparts. For example, while fewer than four in ten male voters ages 50 and over (37%) say they prefer a candidate who wants to protect abortion access, this rises to a majority (56%) of male voters ages 18-49. Most voters who prefer a candidate who wants to protect access to abortion say they would not vote for a candidate who disagreed with them on this issue (63%), compared to half of those who prefer a candidate who wants to limit access to abortion.
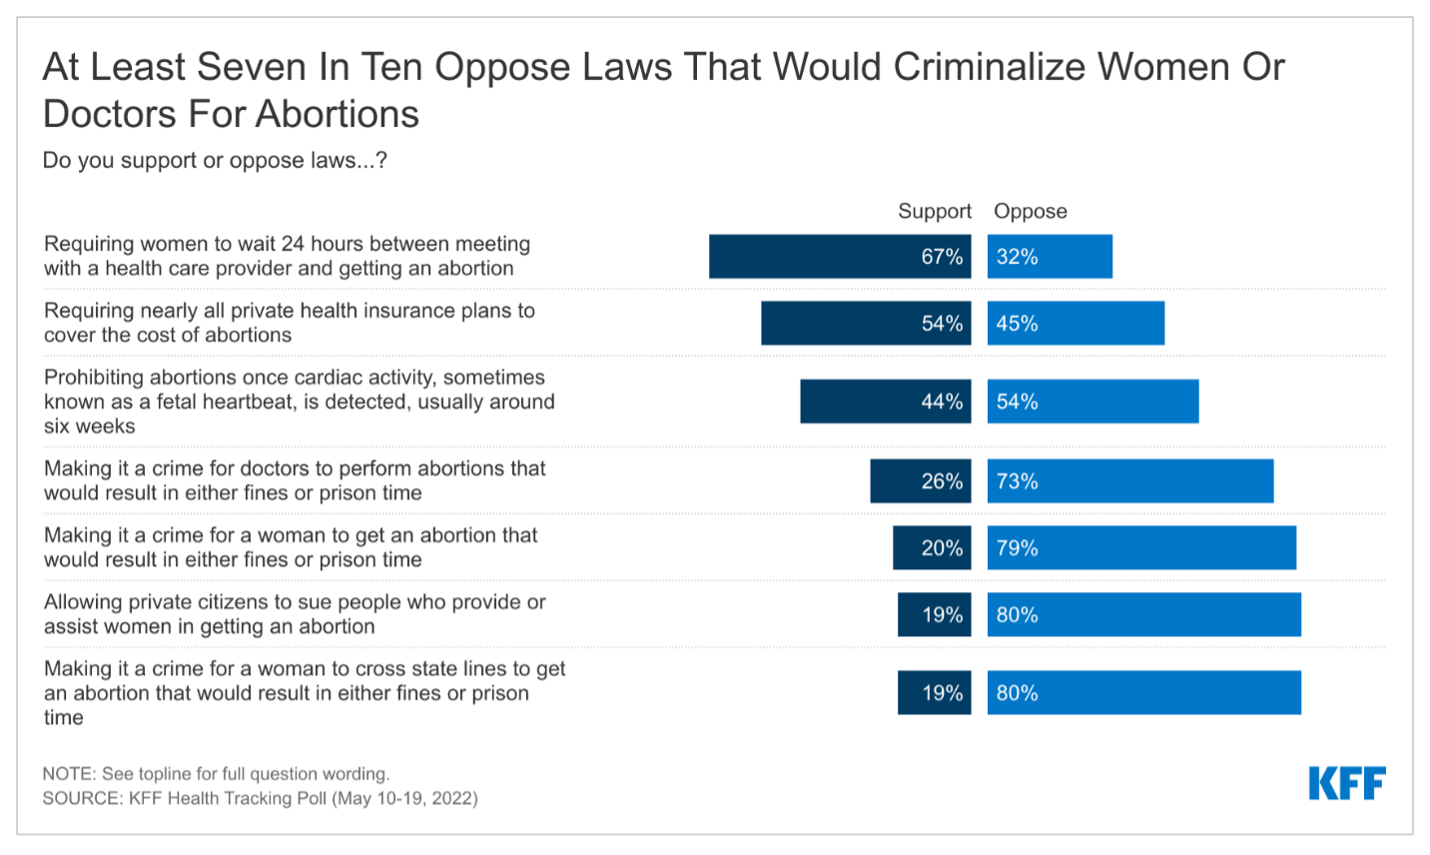
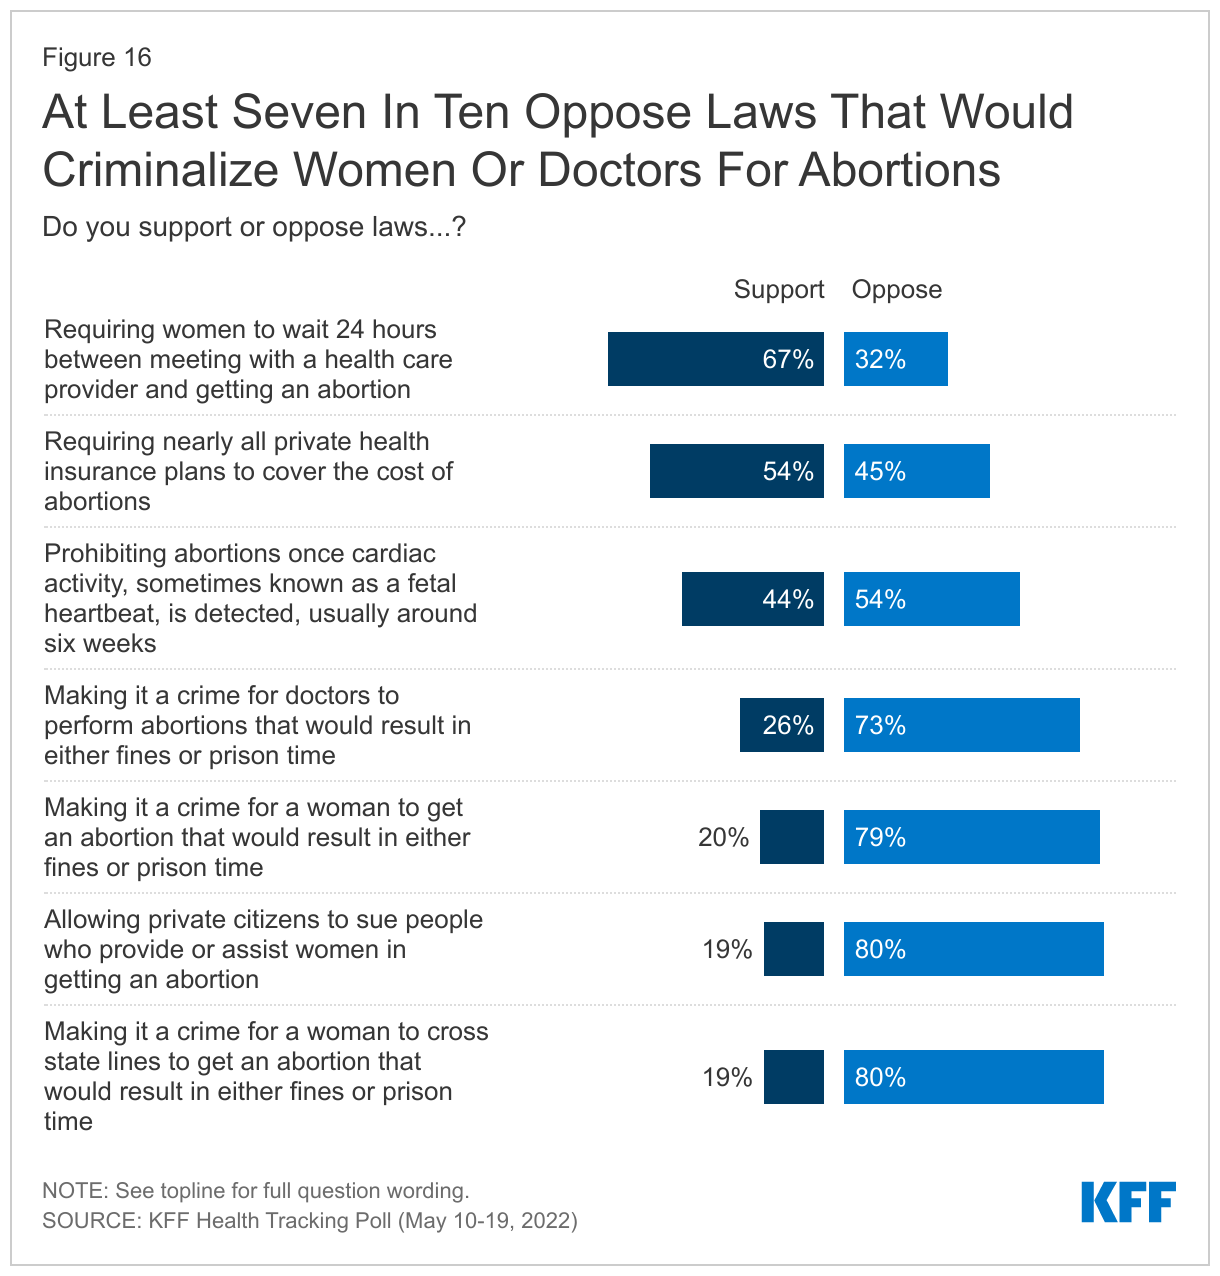
  • If the Supreme Court overturns Roe v. Wade, states will set their own abortion policies without any federal constitutional standards. This poll finds there is some support for state restrictions on abortions, such as requiring women to wait 24 hours between a meeting with a health care provider and getting an abortion (67% support). However, majorities oppose other state laws, including at least three-fourths who oppose laws that would make it a crime for women to get an abortion (79%), allowing private citizens to sue people who provide or assist women in getting an abortion (80%), or making it a crime to cross state lines to obtain an abortion (80%).
  • This KFF poll also finds that there are significant knowledge gaps on the prevalence and the overall safety of abortions. Additionally, a majority of adults (73%) and of women between ages 18-49 (60%) have not heard of mifepristone or medication abortion, the method in which most abortions occur in the U.S.

The Supreme Court Draft Opinion Leak

On May 2, 2022, Politico published a leaked draft opinion of the U.S. Supreme Court on Dobbs v. Jackson Women’s Health Center that would overturn the precedent set by Roe v. Wade and Planned Parenthood v. Casey, eliminating federal protections to the right to an abortion. The Supreme Court acknowledged the authenticity of the draft but stated, “it does not represent a decision by the Court or the final position of any member on the issues in the case.” If the draft opinion is indicative of the final opinion to be released later this month, the constitutional right to an abortion established by the 1973 case would be overturned and it would be again up to individual states to decide whether to restrict or uphold a right to abortion services. Unlike other cases regarding abortion rights since Roe v. Wade, the Dobbs case comes at a time when the ideological composition of the Supreme Court is conservative by a strong majority 6-3, and the case’s plaintiffs, the state of Mississippi, have asked, the Court to outright overturn Roe v. Wade.

Awareness of the Leaked Supreme Court Opinion Draft

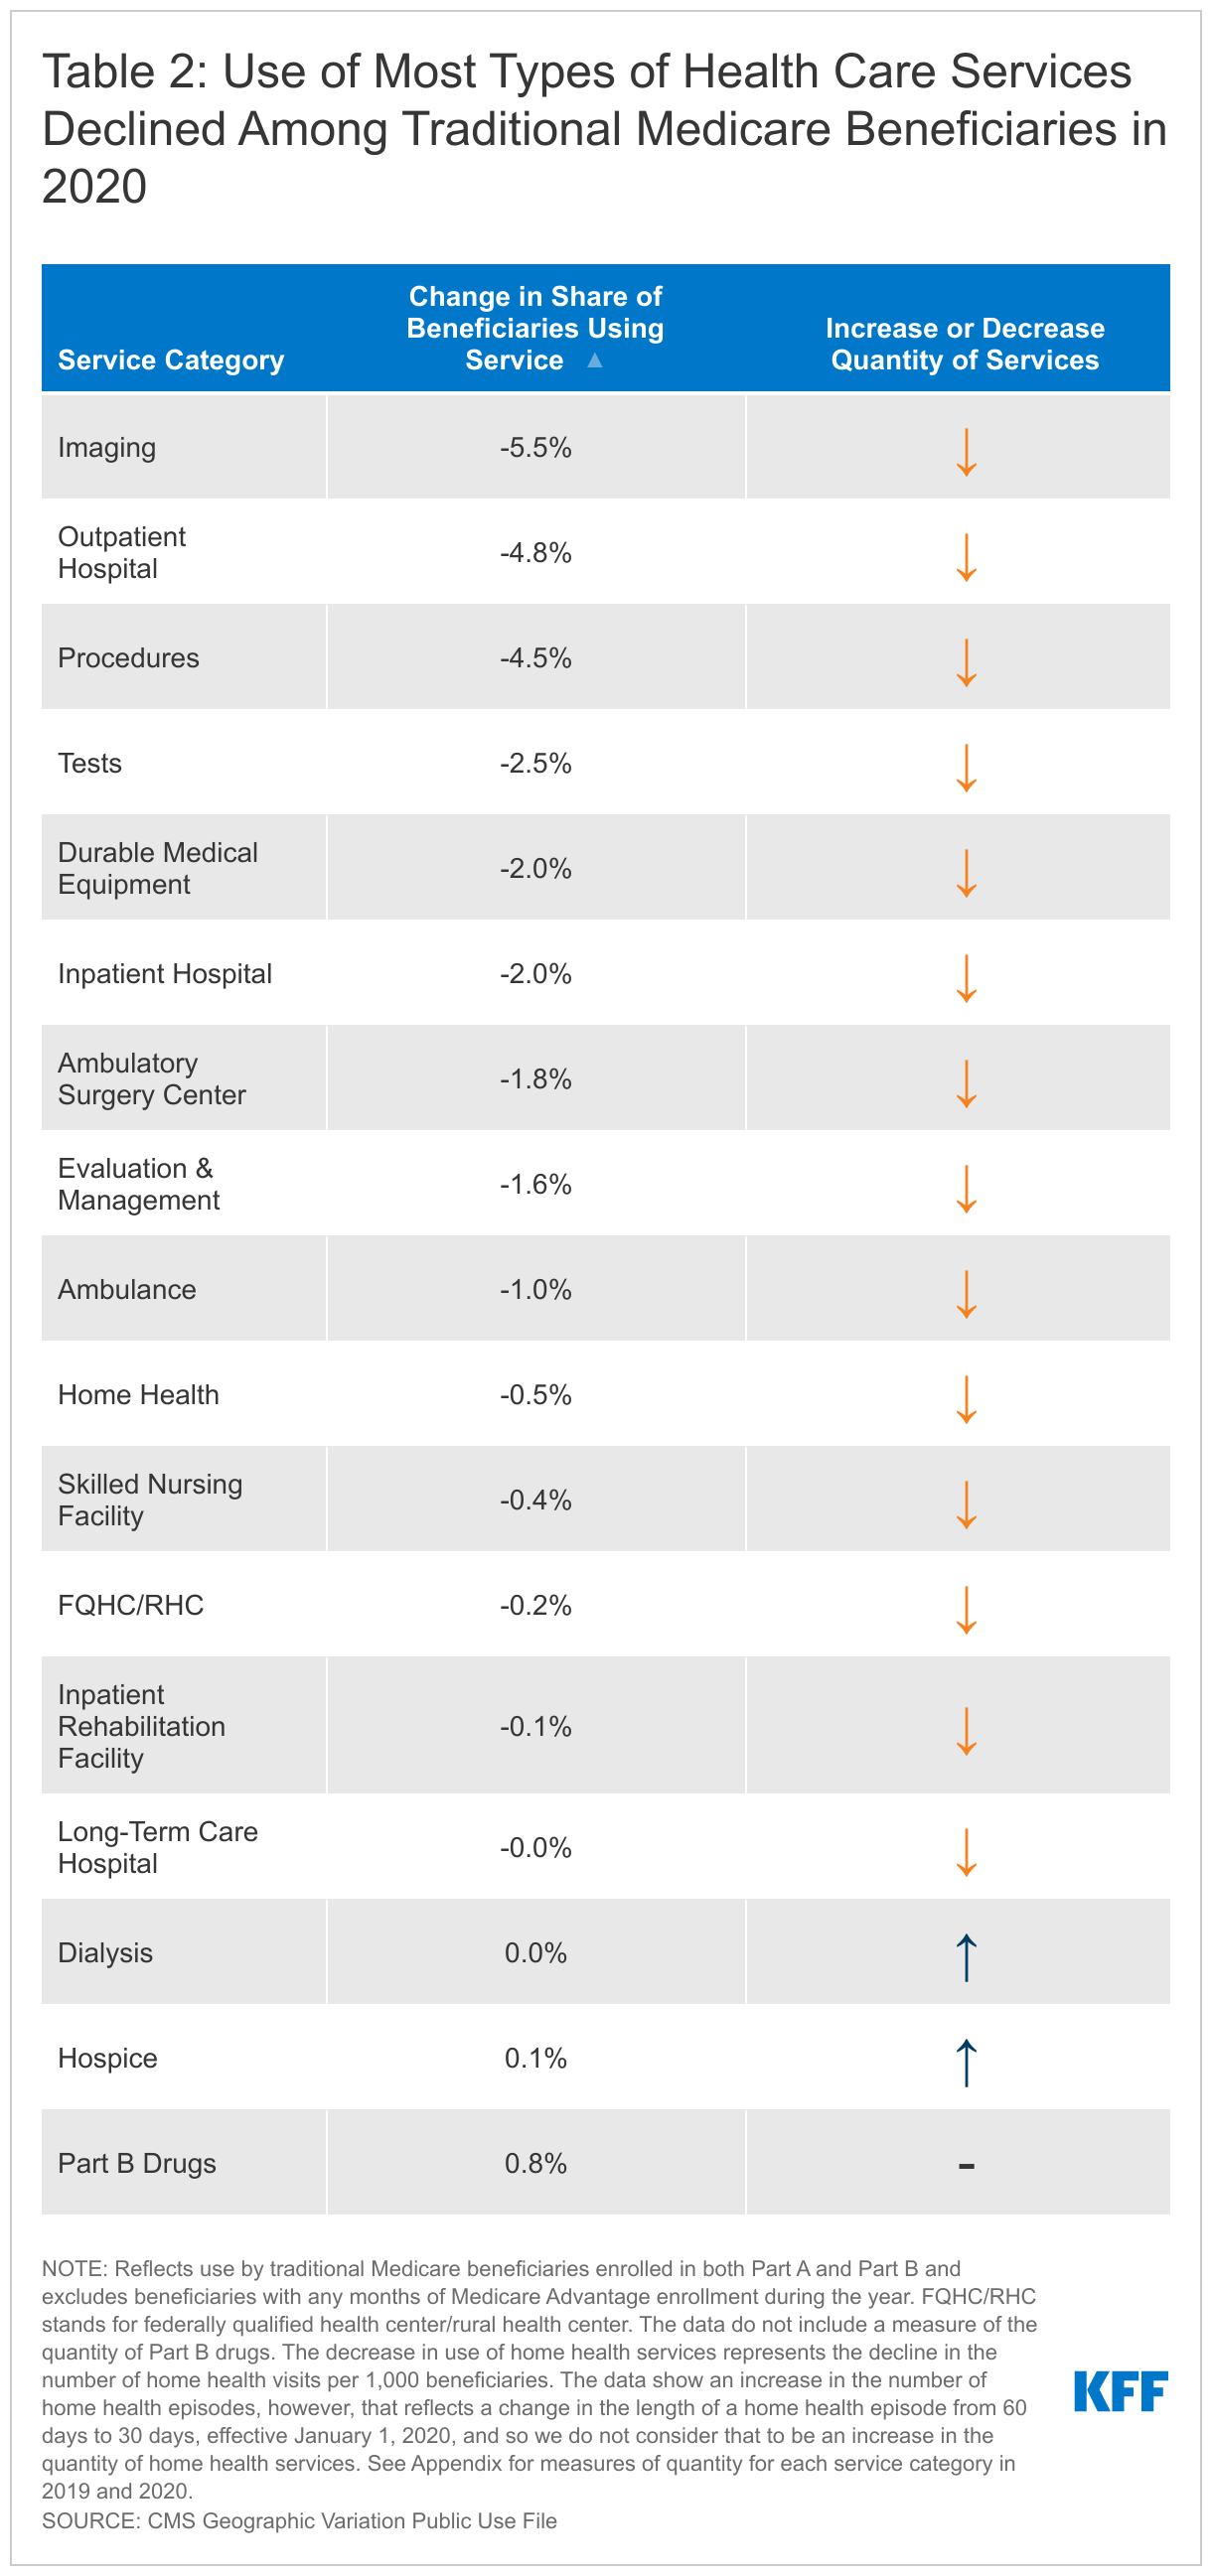
Majorities of the U.S. public, across gender and partisanship, say they have heard at least some about the draft opinion that was leaked to the press, including more than one-third (37%) who say they have heard “a lot” about it. Notably, the group most likely to be impacted by this decision – women of reproductive age (ages 18 to 49)2  – report hearing the least about the leak, with a quarter (23%) saying they have heard “a lot” and nearly half saying they’ve heard “little” (24%) or “none at all” (23%).

Majorities Of Adults Across Partisans And Gender Have Heard &quot;A Lot&quot; Or &quot;Some&quot; About The Leaked Supreme Court Draft Opinion On Dobbs

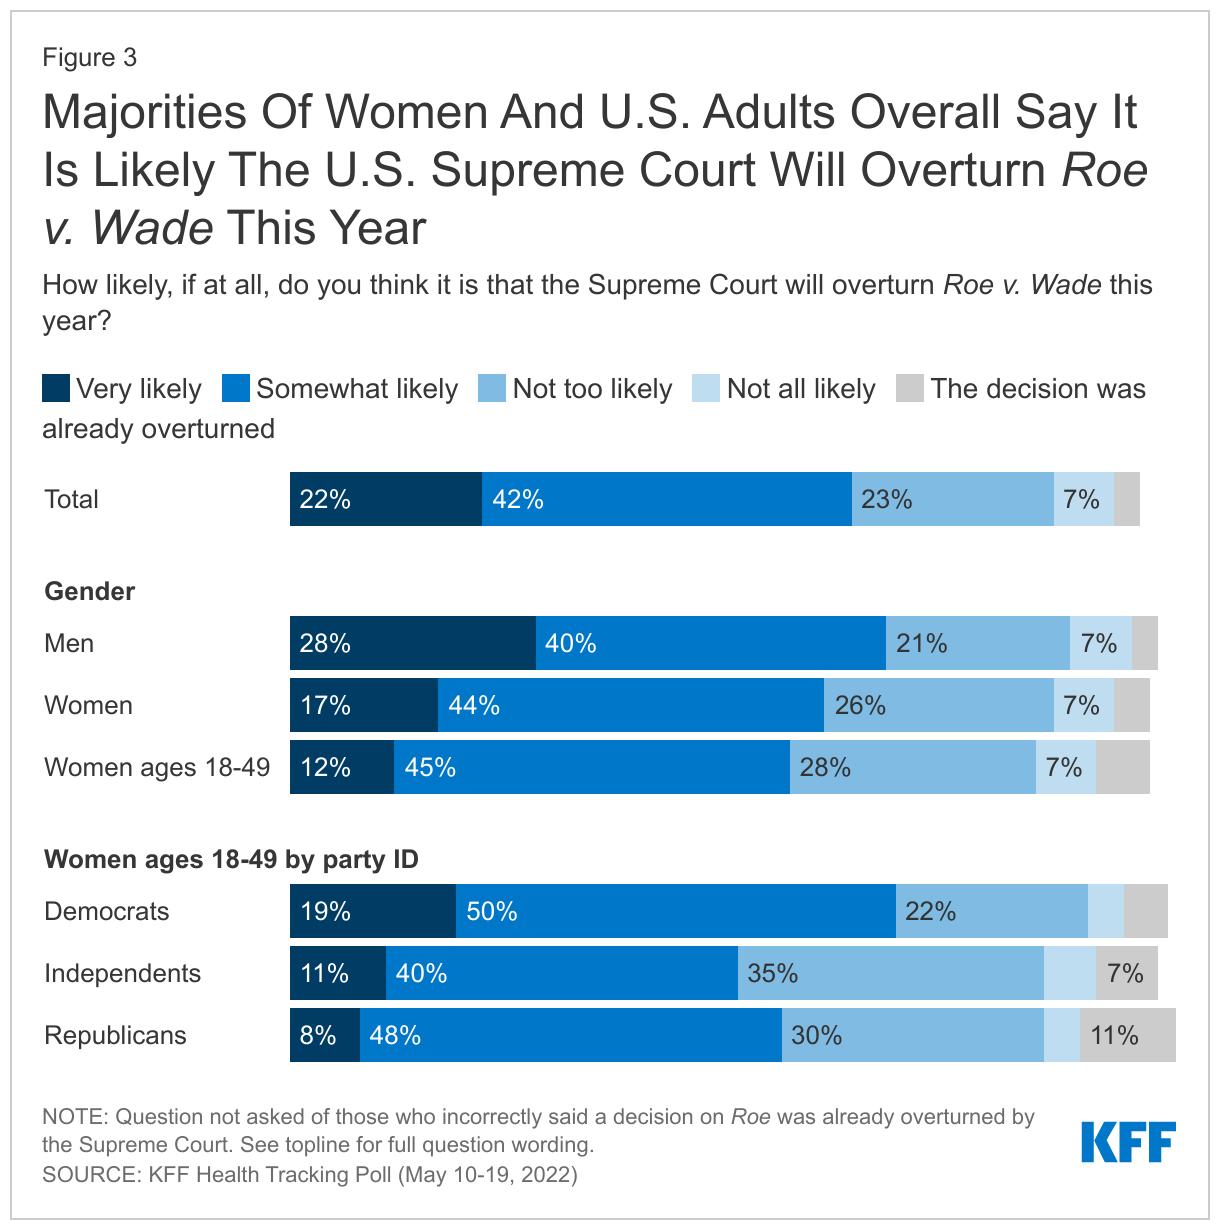
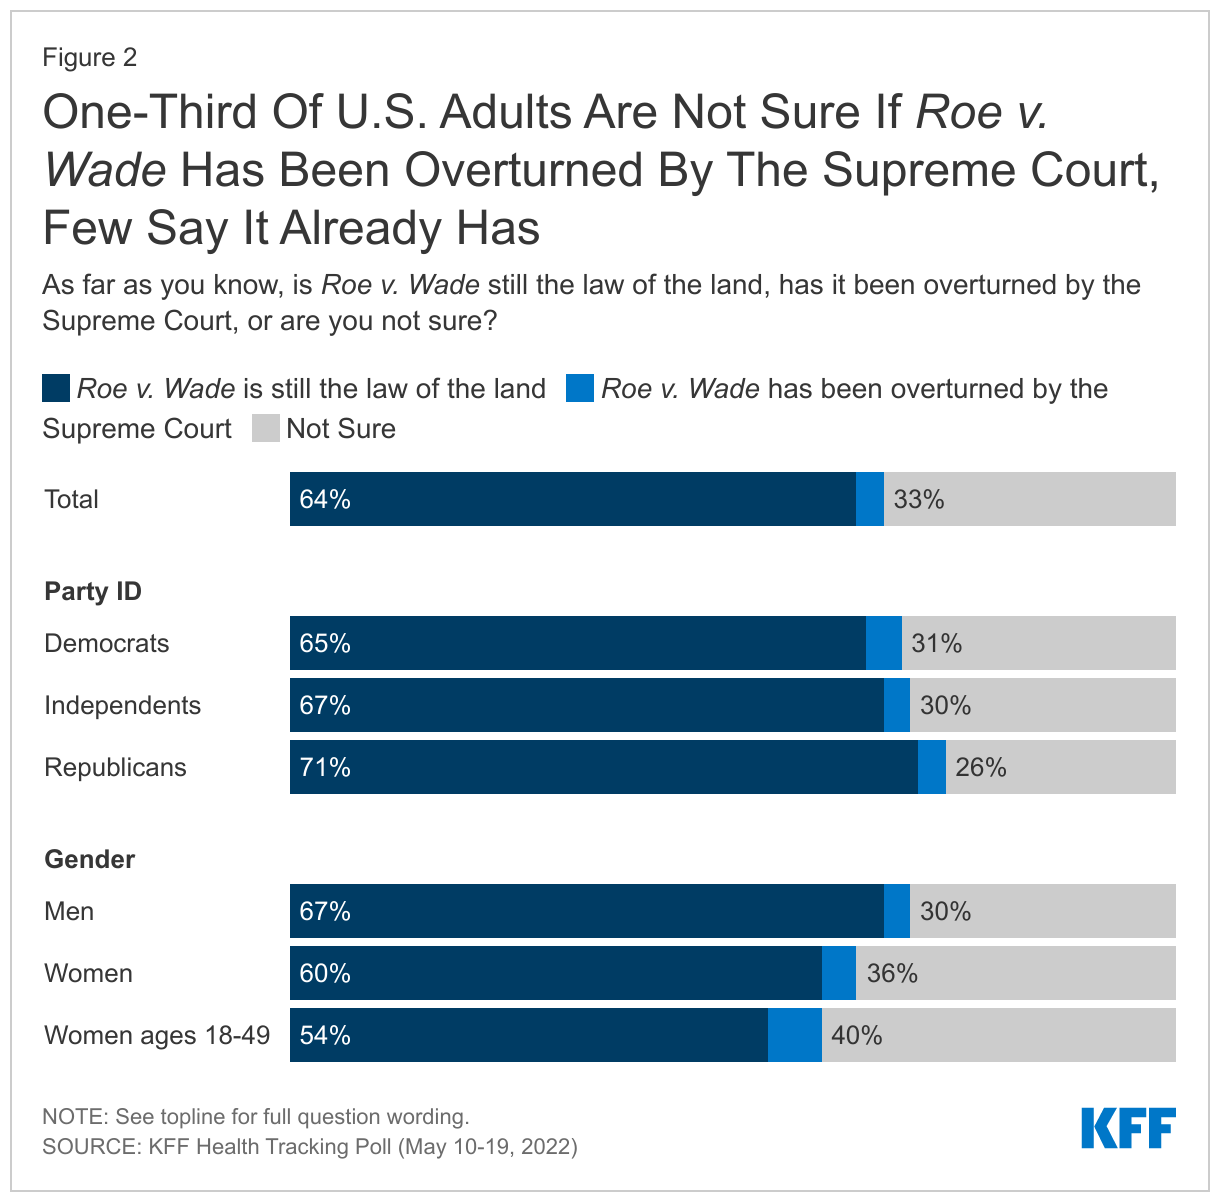
There is some confusion among the public about what the leaked draft of the Supreme Court opinion portends for the current and future state of abortion access in the country. The poll, conducted immediately following the leak of the draft opinion, finds that while about two-thirds (64%) are aware Roe v. Wade remains the law of the land, a small share (3%) incorrectly believe it has already been overturned and another third (33%) are unsure. Women are more likely than men to say it has already been overturned or that they are not sure (40% v. 33%). Nearly half of women ages 18-49 either say it has already been overturned (6%) or they are not sure (40%).

One-Third Of U.S. Adults Are Not Sure If Roe v. Wade Has Been Overturned By The Supreme Court, Few Say It Already Has

Two-thirds of adults say it is either “very likely” (22%) or “somewhat likely” (42%) that the Supreme Court will overturn Roe this year. While few (6%) women ages 18-49 incorrectly believe Roe v. Wade has already been overturned, most say that it is “very likely” (12%) or “somewhat likely” (45%) that Roe will be overturned. About one-third (35%) of women ages 18-49 do not think this is likely to happen this year.

Majorities Of Women And U.S. Adults Overall Say It Is  Likely The U.S. Supreme Court Will Overturn Roe v. Wade This Year

Supreme Court and Motivation in the Midterm Elections

If Roe v. Wade is overturned by the U.S. Supreme Court and the decision on abortion legislation is left to the states, the latest KFF polling finds a candidates’ positions on abortion could be a salient issue for a certain segment of Democratic-leaning voters but only motivates a small share of voters.

While a majority of voters (57%) say the Supreme Court overturning Roe v. Wade would not make a difference in their motivation to vote in the upcoming midterm and some (6%) say they would be less motivated, about four in ten voters (37%) say such a decision would make them more motivated to vote. As many election forecasters are projecting a Republican wave in the upcoming midterms, the poll finds the Supreme Court decision may motivate Democratic voters but fewer Republican or independent voters. More than half (55%) of Democratic voters say the Supreme Court decision will make them more motivated to vote. Majorities of Republican voters (73%), independent voters (62%), and Republican women voters (74%) say it would not make a difference to their motivation.

Majorities Of Voters Say A Decision From The Supreme Court Would Not Make Them More Motivated To Vote In The Midterms, Democrats Say It Would

A majority of voters who are motivated by the Supreme Court decision are pro-choice (75%), younger (55% under age 50), half are Democrats (51%), and about four in ten are liberal (38%). Similar shares of Black voters (40%), Hispanic voters (37%), and White voters (35%) report a Supreme Court decision overturning Roe would make them more motivated to vote. In addition, about one in five voters who say they would be motivated by the Supreme Court decision are Republican (18%), want a candidate who will limit access to abortions (19%), are conservative (21%) and independent (22%).

How Candidates’ Stance On Abortion May Impact Voters

If the Supreme Court overturns Roe v. Wade, between now and the midterm elections, one would expect the issue will become more salient in the midterms with increased attention in campaign advertisements and candidate talking points.3  The KFF Tracking Poll finds this salience may play an important role in persuading a small share of voters.

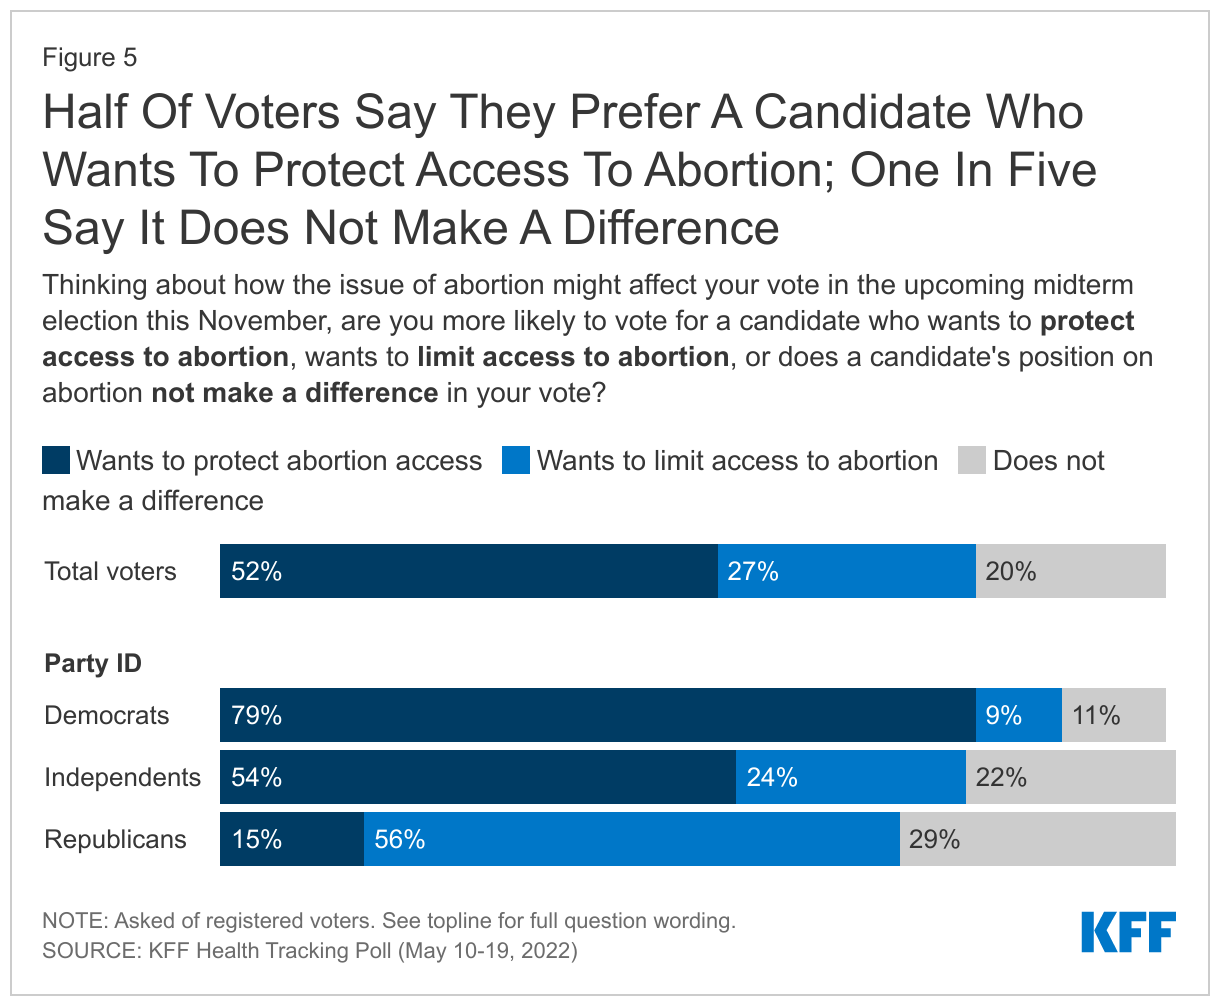
About half (52%) of voters overall say they are more likely to vote for a candidate in the upcoming election who wants to protect access to abortion, about one-quarter (27%) are more likely to vote for a candidate who will limit access to abortion, and one in five voters say a candidate’s position on abortion does not matter to their vote. Eight in ten (79%) Democratic voters say that they are more likely to vote for a candidate in the upcoming election who wants to protect access to abortion, 9% prefer a candidate who wants to limit access to abortion, and 11% say a candidate’s position on abortion would make no difference to their vote. At least half of Republicans say they want to vote for someone who wants to limit access to abortion (56%), 15% prefer a candidate who wants to protect access to abortion, and a sizeable three in ten (29%) Republican voters say it does not make a difference to their vote. Half (54%) of independent voters prefer a candidate who wants to protect access to abortion while half are split between preferring a candidate who wants to limit abortion (24%) or that it does not matter to their vote (22%).

Half Of Voters Say They Prefer A Candidate Who Wants To Protect Access To Abortion; One In Five Say It Does Not Make A Difference

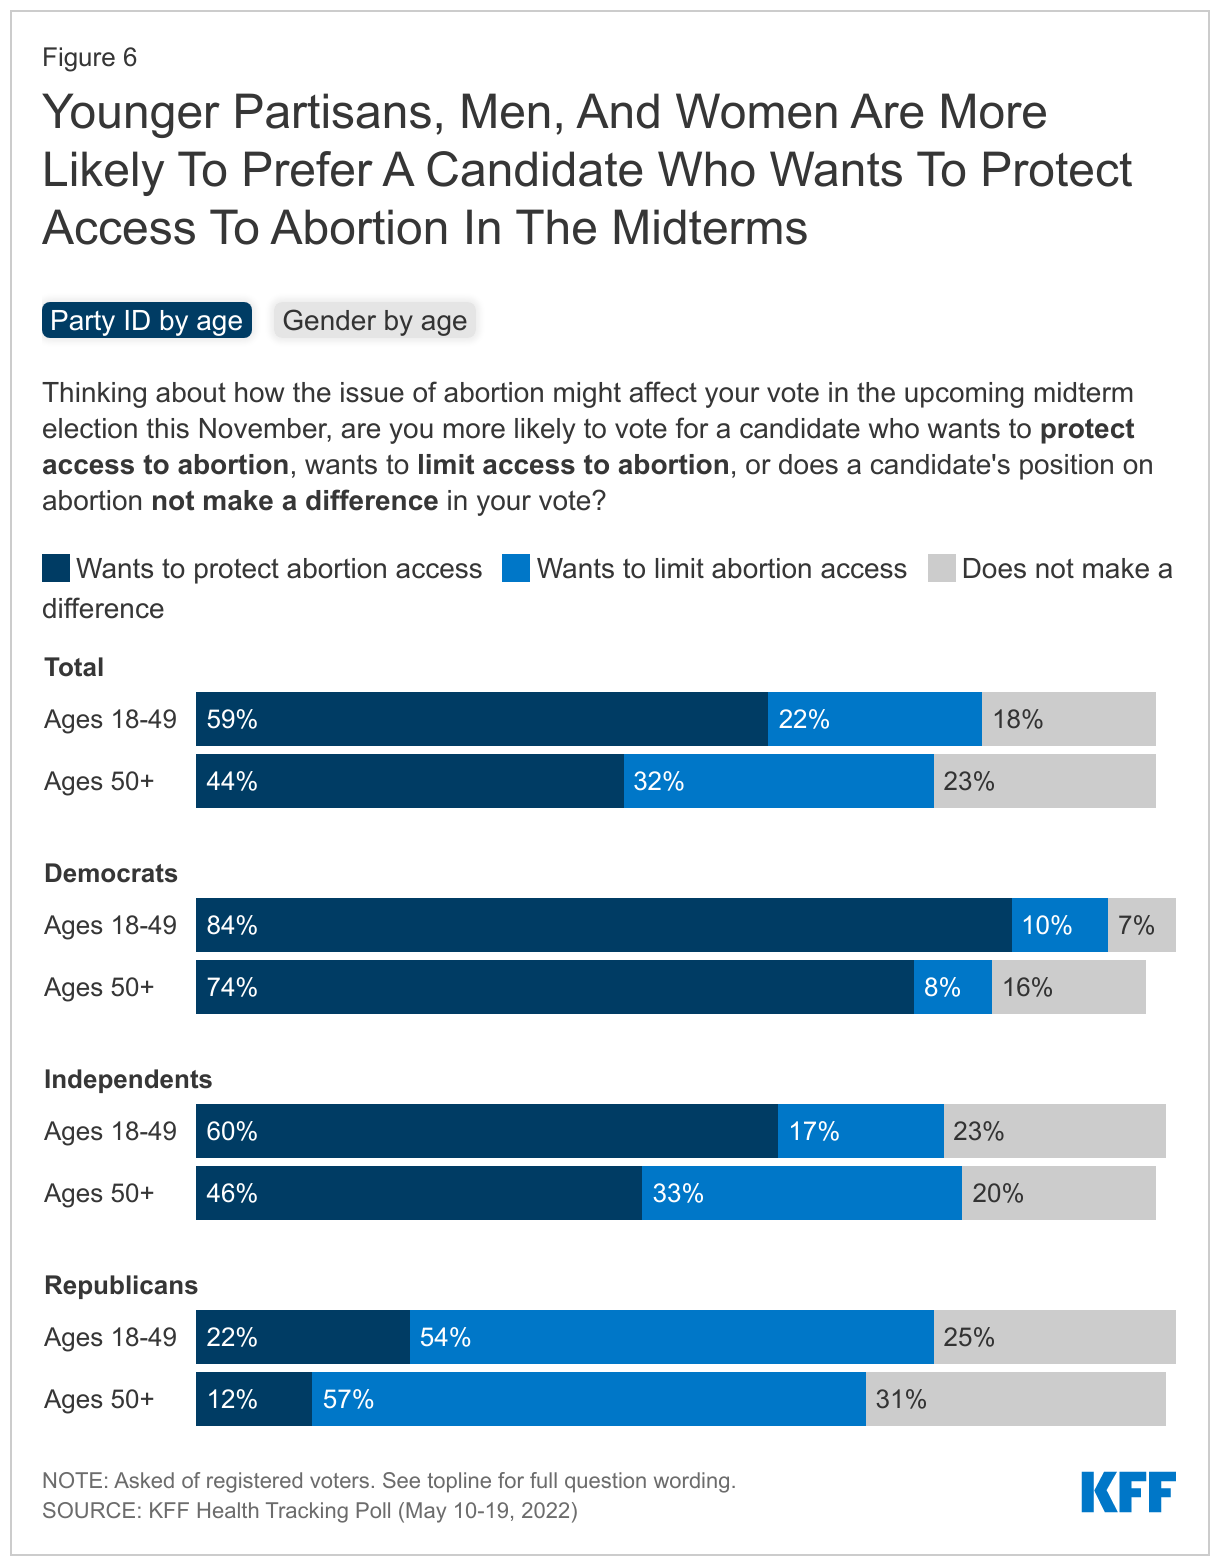
Across key demographics, groups that typically lean more Democratic consistently report they want a candidate who will protect access to abortions. For example, more than half of Black voters (58%) and Hispanic voters (52%) say they are more likely to vote for such a candidate. In addition, younger voters are more likely than their older counterparts to say they want a candidate who will protect access to abortion, with six in ten (59%) voters ages 18-49 saying they are more likely to vote for a candidate who wants to protect access to abortion, compared to less than half (44%) of voters ages 50 and older.  This age divide on the issue of abortion is consistent with other studies and this poll finds the age divide exists across partisans and gender, with younger independents, Republicans and men being more likely than their older counterparts to say that they are more likely to vote for a candidate that wants to protect access to abortion.

Younger Partisans, Men, And Women Are More Likely To Prefer A Candidate Who Wants To Protect Access To Abortion In The Midterms

While the Supreme Court overturning Roe v. Wade doesn't appear to motivate a majority of voters overall, there is a small share of voters (20%) who say they would be more motivated to vote, and they would only support a candidate who shares their view, and they want candidates to protect access to abortion. This includes nearly four in ten Democratic voters, Democratic women voters, and one-fourth of women voters ages 18-49. A smaller share of voters (4%) say they are more motivated to vote by the Supreme Court decision, but in the opposite direction - to support candidates who want to limit access to abortions.

One In Five Voters Say Supreme Court Overturning Roe Makes Them More Motivated To Vote, And They Would Only Vote For A  Candidate Who Wants To Protect Access To Abortion

In Their OWn Words, Voters Say What About Overturning Roe Motivates Their Vote

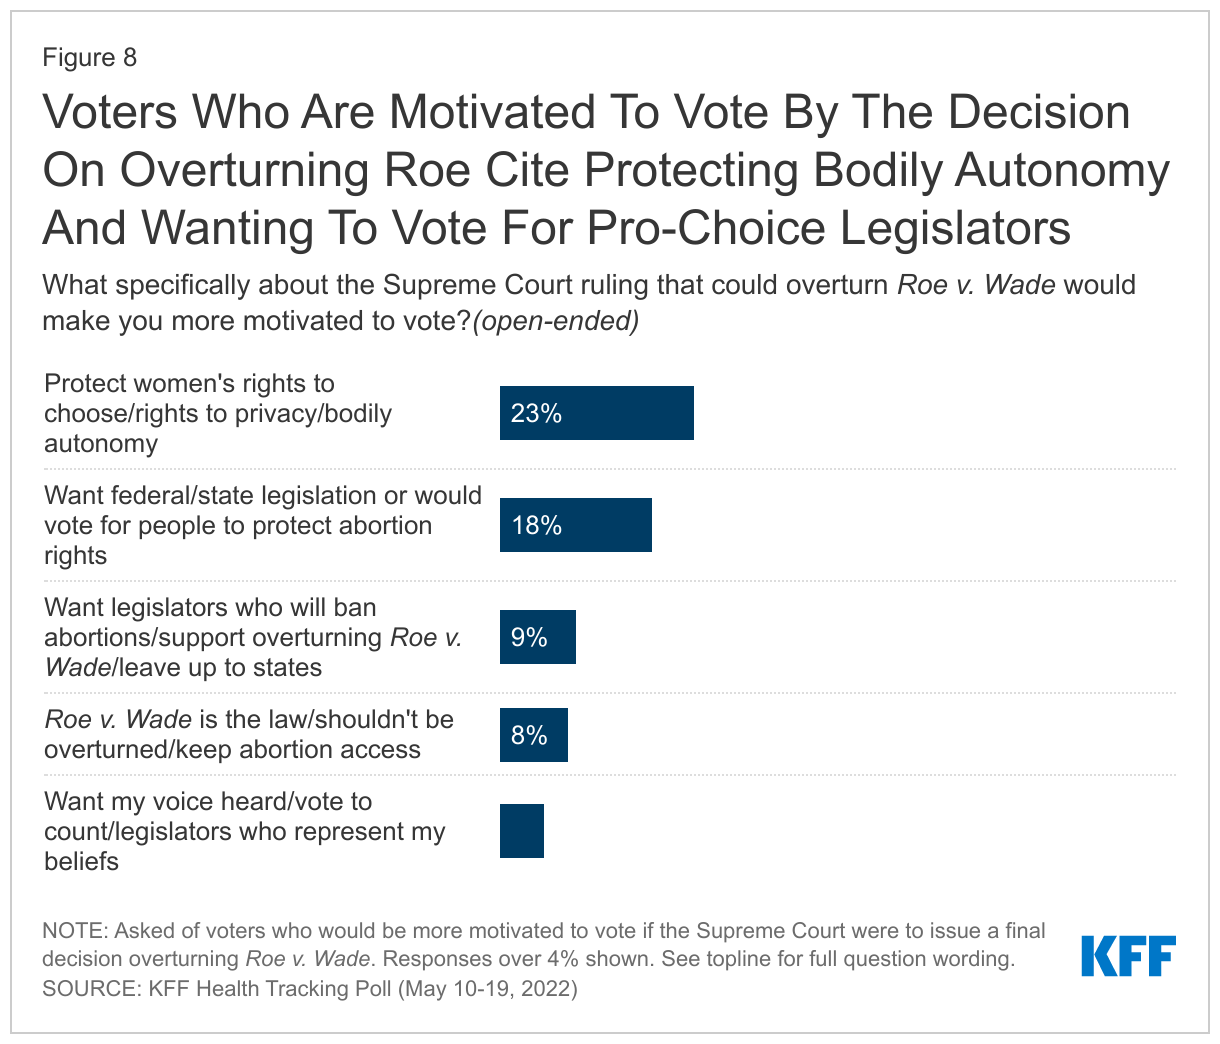
When asked to say in their own words what it is about a Supreme Court decision overturning Roe that would make them more motivated to vote, about one-fourth cite a need to protect women’s rights to choose, rights to privacy and bodily autonomy (23%), about one in five mention wanting legislation to codify the right to an abortion or to vote for people who will protect abortion rights (18%), and 8% say that Roe v. Wade is the law and should not be overturned. About one in ten (9%) say they are motivated by wanting legislators who will ban abortions or support overturning Roe v. Wade. Five percent of voters who are motivated by Roe say that it is about having their voices heard and wanting legislators who represent their beliefs.

Voters Who Are Motivated To Vote By The Decision On Overturning Roe Cite Protecting Bodily Autonomy And Wanting To Vote For Pro-Choice Legislators

In Their Own Words: What specifically about the Supreme Court ruling that could overturn Roe v. Wade would make you more motivated to vote?

Among those who prefer a candidate who will protect access to abortion:

“I feel very strongly that everyone should have access to abortion, and I would be even more inclined to use my right to vote to help myself and others who think alike.” -21 year-old Democratic woman, Kentucky

“Voting in politicians who will protect abortion rights in their state if the federal government won't do it themselves.” -25 year-old Democratic woman, Florida “I'm actually not a person to jump out and vote but, on this issue, if my vote would make a difference then I will vote.” -37 year-old independent woman, California

“Protecting access to health care will make me even more likely to vote in the midterms.” -47 year-old independent man, Arizona

“I'm moderate not conservative. Every choice of a woman has different circumstances. I feel they should not all be subject to one blanket law. Democrats are more open minded about that.” -48 year-old Democratic woman, Missouri

In Their Own Words: What specifically about the Supreme Court ruling that could overturn Roe v. Wade would make you more motivated to vote?

Among those who want a candidate who will limit access to abortion:

"Vote for people in my state that would restrict abortion.” -79 year-old Republican woman, Missouri

“We need more moral minded leaders voted in.” -73 year-old Republican woman, Tennessee

“It would stop some of the murder of the pre-born.” -82 year-old Republican woman, Texas

“I would not want to see abortions done unless under certain circumstances.” -48 year-old Republican woman, Florida

“Murder shouldn’t be legal.” -46 year-old independent man, Minnesota

Public’s Opinion on Overturning Roe v. Wade, State Restrictions

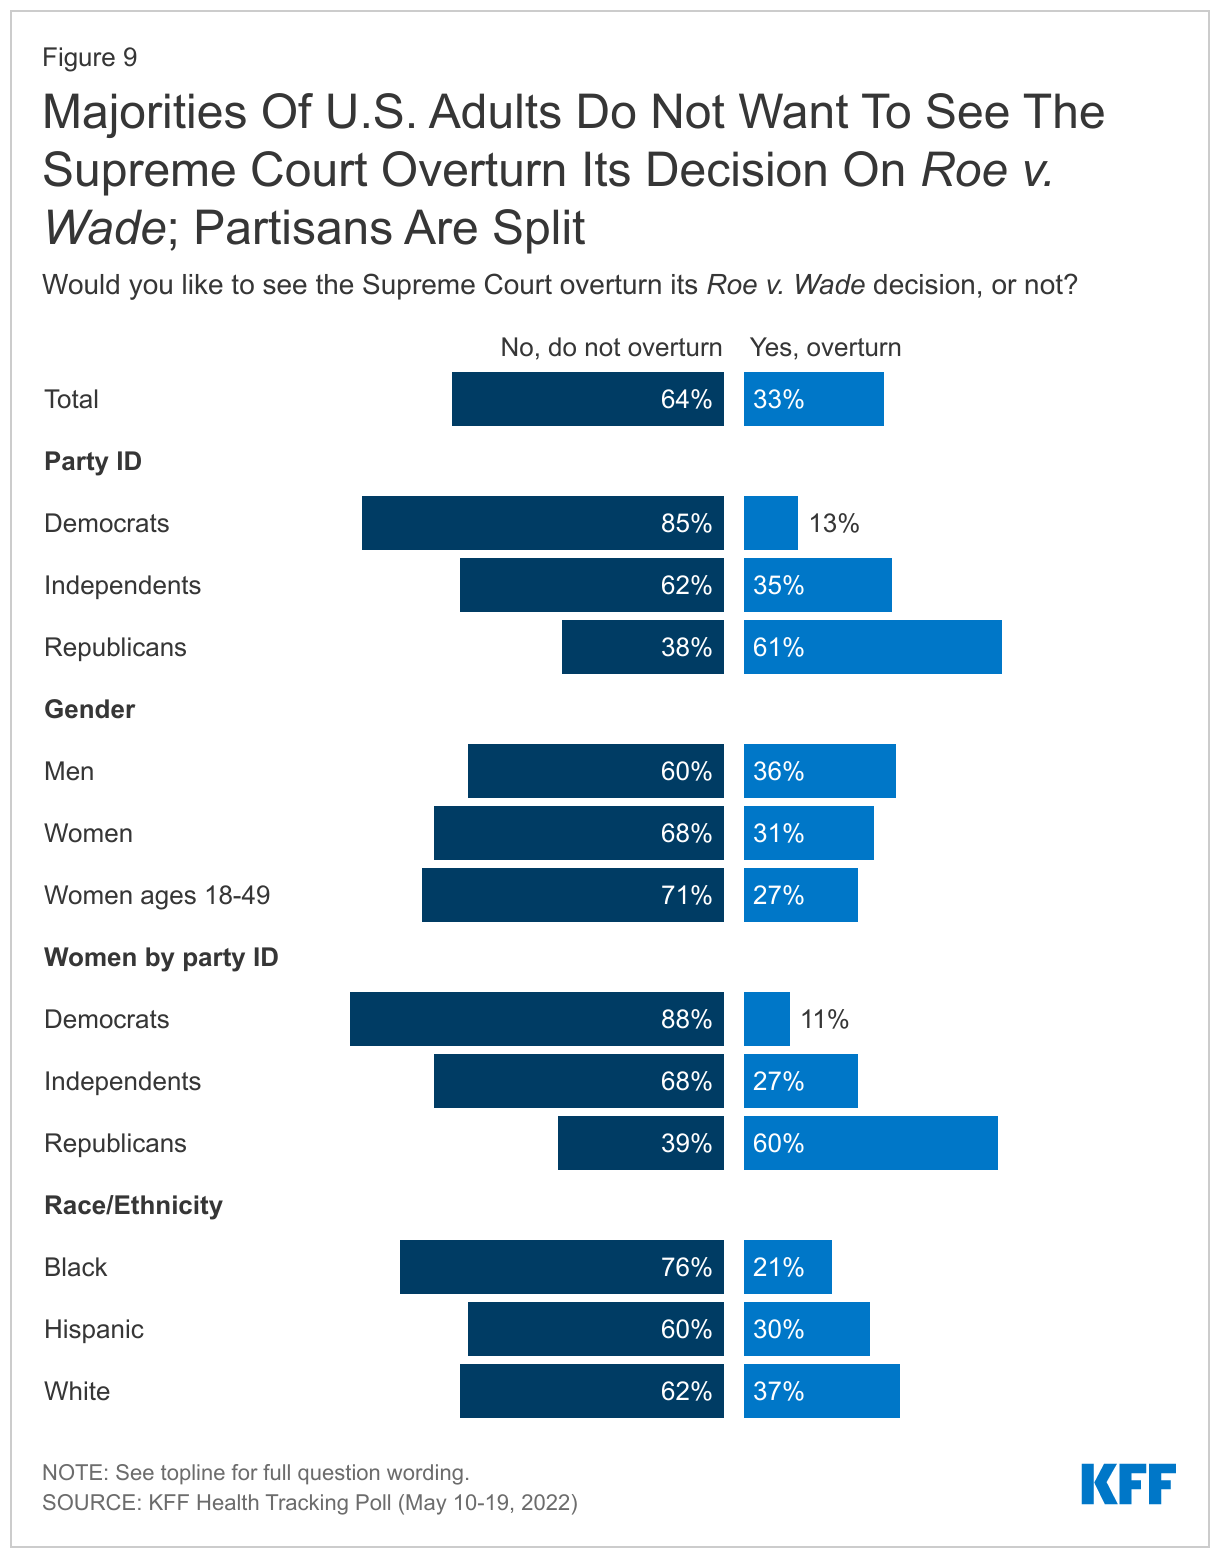
KFF polling has consistently found that a majority of the public do not want to see Roe v. Wade overturned and the latest KFF poll is no different. About two-thirds (64%) U.S. adults say they do not want to see the Supreme Court overturn Roe v. Wade, while one-third of adults say they would like to see the case overturned. Majorities across gender and racial and ethnic groups say they don’t want to see it overturned, but there are differences by partisanship. Six in ten (61%) Republicans want to see the law overturned while a large majority of Democrats (85%) and six in ten independents (62%) do not want the Supreme Court to overturn Roe.

Majorities Of U.S. Adults Do Not Want To See The Supreme Court Overturn Its Decision On Roe v. Wade; Partisans Are Split

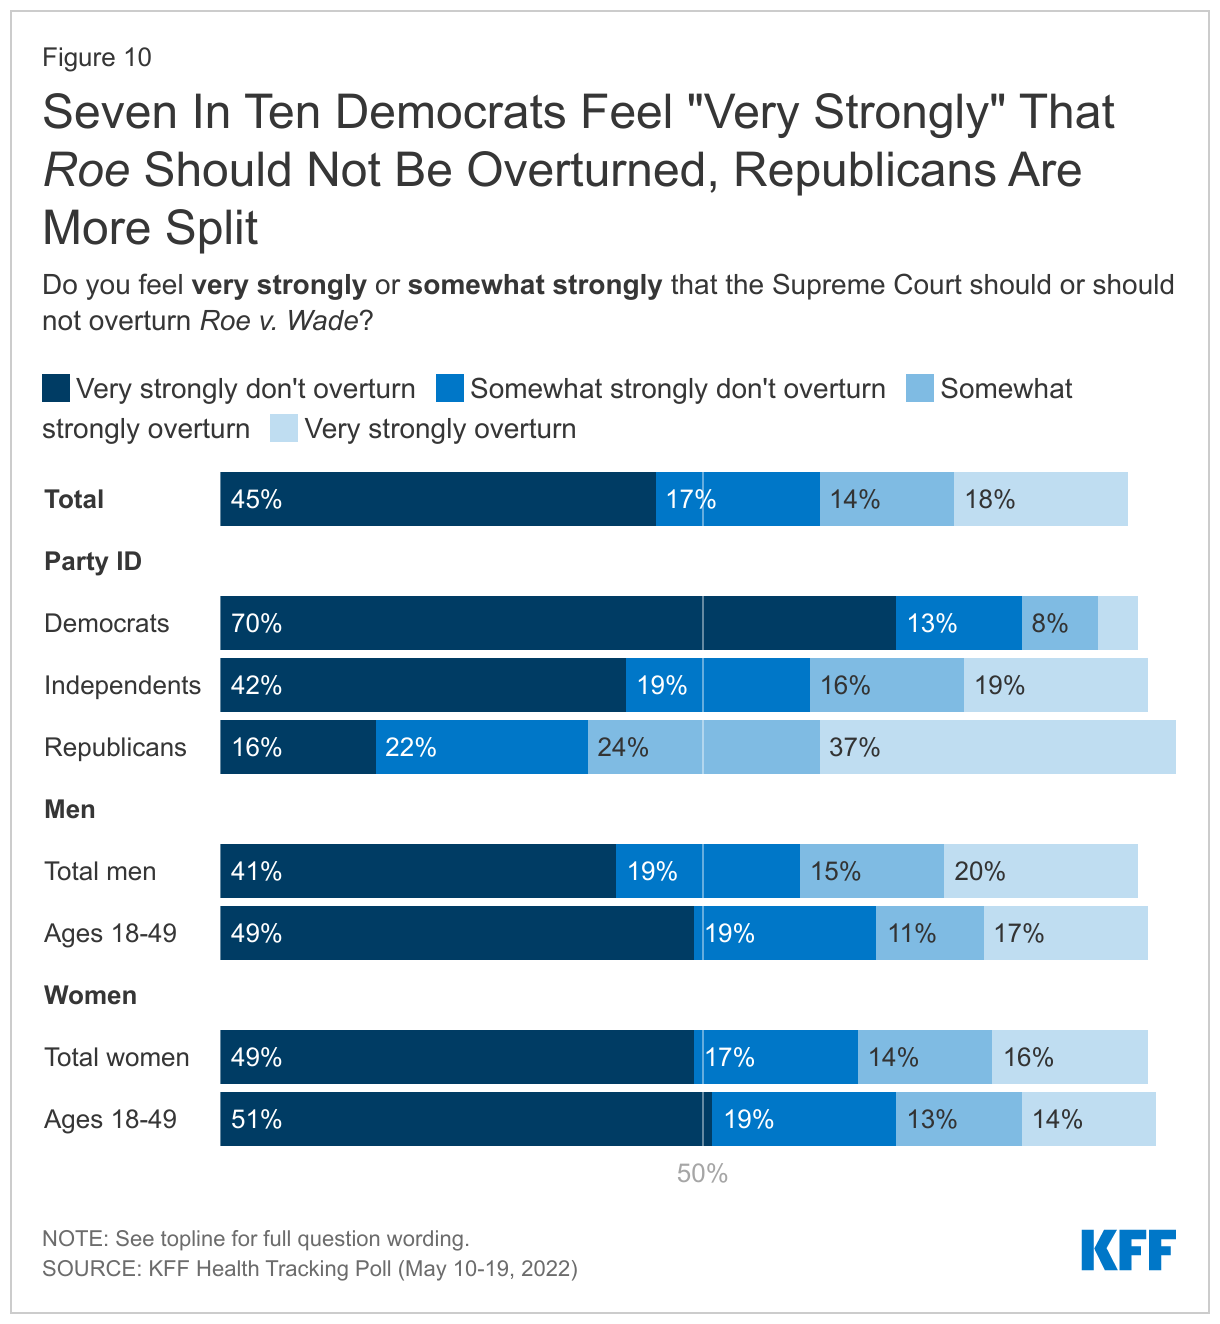
Once again, saliency lies on the side of those who want to protect abortion rights. While a large majority of Democrats (70%) say they feel “very strongly” that Roe v. Wade should not be overturned, Republicans are not as coalesced, with the about half as many Republicans (37%) feel “very strongly” that it should be overturned. A further one-quarter (24%) of Republicans feel “somewhat strongly” that Roe should be overturned, and a similar share (22%) feels “somewhat strongly” that it should not be overturned.

Seven In Ten Democrats Feel &quot;Very Strongly&quot; That Roe Should Not Be Overturned, Republicans Are More Split

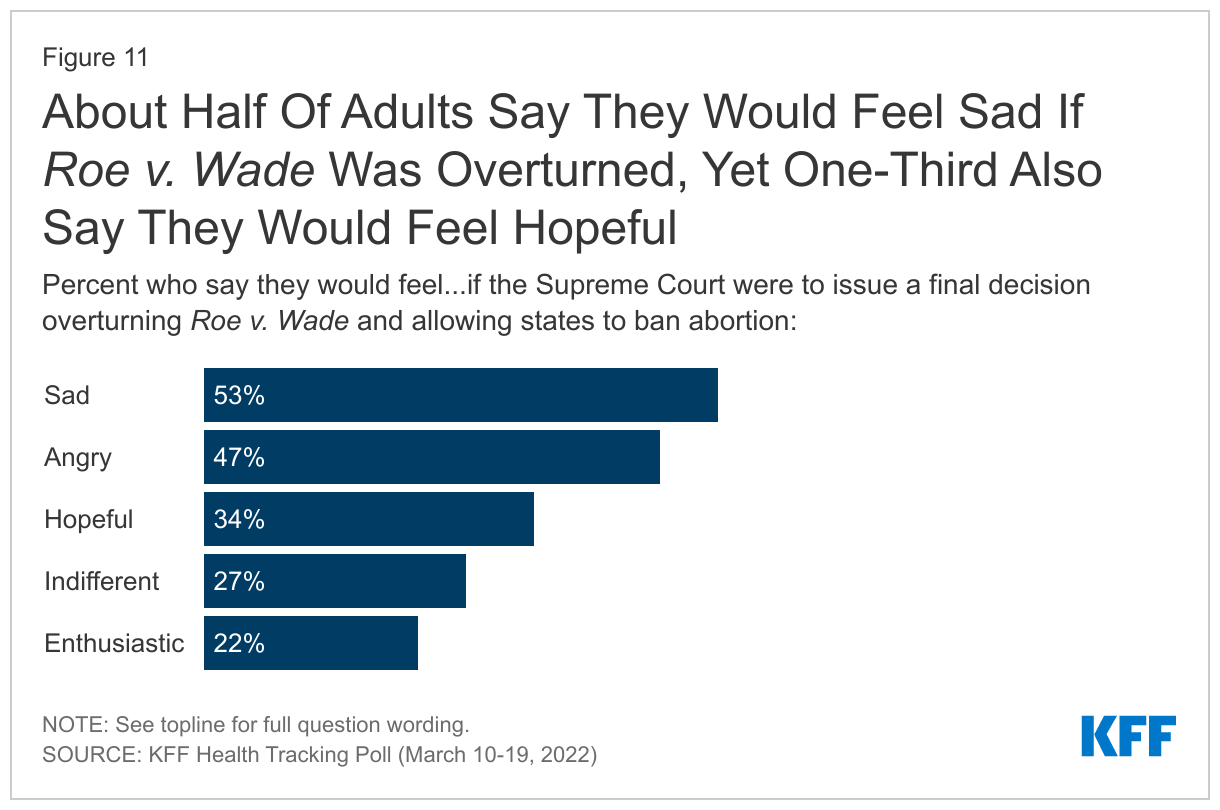
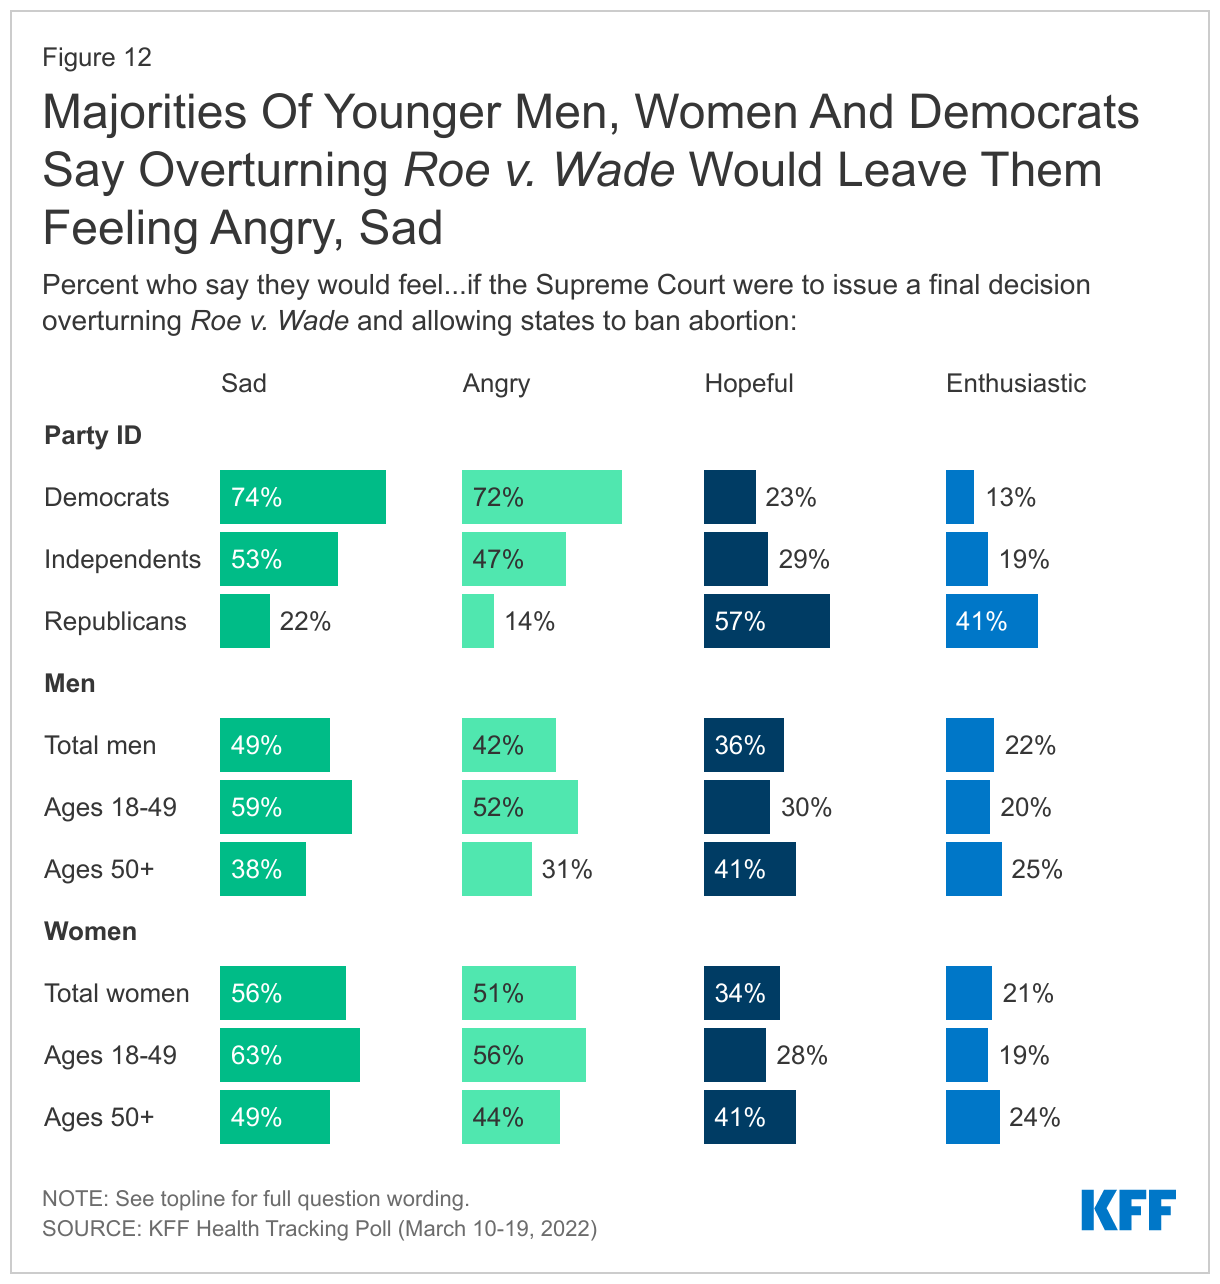
The public has mixed feelings on the potential for the Supreme Court to overturn Roe v. Wade and allowing states to ban abortion, with about half of adults reporting that they would feel “sad” (53%) or “angry” (47%), and fewer saying they would feel “hopeful” (34%), “indifferent” (27%) or “enthusiastic” (22%) about this decision.

About Half Of Adults Say They Would Feel Sad If Roe v. Wade Was Overturned, Yet One-Third Also Say They Would Feel Hopeful

Partisans have very different emotional responses to the possibility of the Supreme Court overturning Roe v. Wade, with nearly three-fourths of Democrats reporting they would be “sad” (74%) or “angry” (72%), while more than half of Republicans saying they would feel “hopeful” (57%) and four in ten would be “enthusiastic” (41%).

While a majority of women report they would be “sad” (56%) or angry” (51%) if the Supreme Court overturned Roe, there are differences among women – and men – across age groups. Majorities of adults under age 50 – both men and women – say they would feel “sad” or “angry” if Roe were overturned while four in ten older men and women say they would feel “hopeful” if this occurred.

Majorities Of Younger Men, Women And Democrats Say Overturning Roe v. Wade Would Leave Them Feeling Angry, Sad

Most Say Abortion Should Be Personal Choice Rather Than Regulated, Some Support For Limited State Regulations

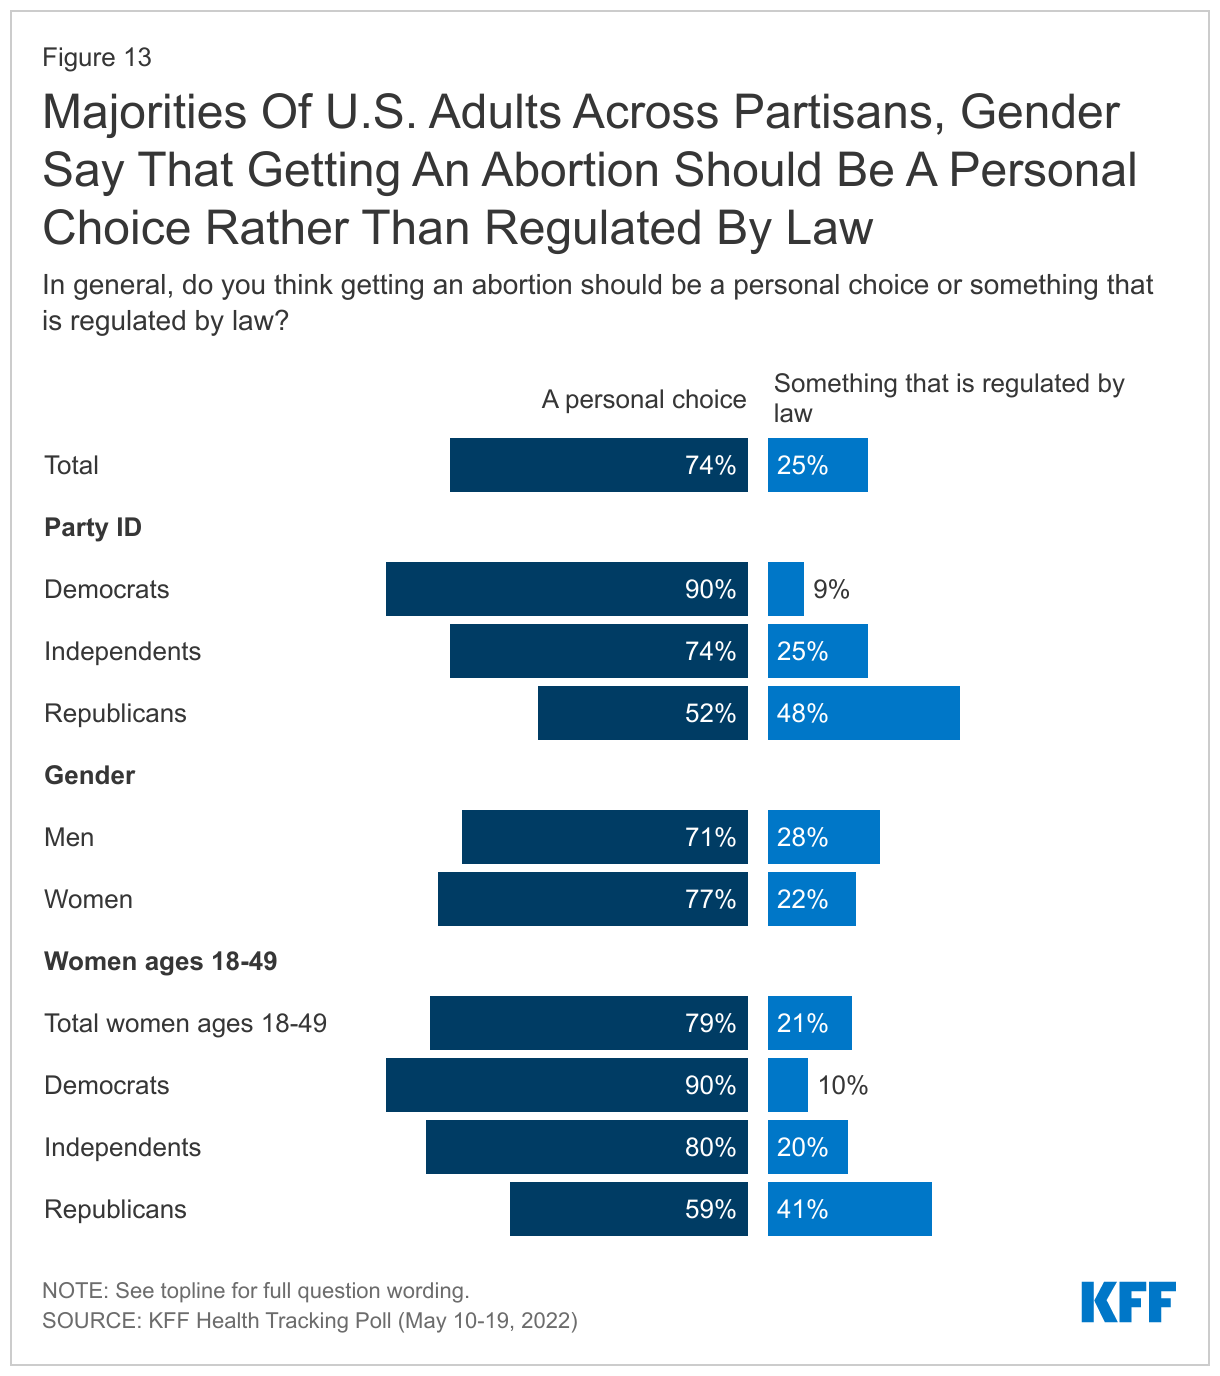
Despite divided views on the future of Roe v. Wade, the public is somewhat more aligned in believing that getting an abortion should be a personal choice rather than one regulated by the government. Three in four U.S. adults say generally, getting an abortion should be a personal choice (74%), while one in four say it should be something that is regulated by law. Large majorities of Democrats (90%) and independents (74%) say it should be a personal choice, while Republicans are split (52% saying it should be a personal choice and 48% say it should be regulated by law). Eight in ten (79%) women ages 18-49 say that getting an abortion should be a personal choice, including majorities across party; nine in ten (90%) Democratic women, eight in ten (80%) independent women and about six in ten (59%) Republican women ages 18-49 say this should be a personal choice.

Majorities Of U.S. Adults Across Partisans, Gender Say That Getting An Abortion Should Be A Personal Choice Rather Than Regulated By Law

Awareness Of State-Specific Abortion Legislation

Landscape of state-level abortion legislation in the U.S. if Roe v. Wade is overturned:

If Roe v. Wade is overturned, the availability and legality of abortion will vary from state to state, with many already preparing for the impending Supreme Court ruling and defining what a post-Roe world would look like in their states. Should the Court rule to overturn Roe v. Wade, abortion will likely become illegal immediately in 17 states that either already have laws that ban abortion that predate Roe v. Wade or have passed laws limiting abortion to the maximum extent permitted by federal law.4  Three states (GA, OH and SC) have 6 week bans that courts have temporarily blocked but could become effective soon after a decision overruling Roe v. Wade.

In contrast, 16 states and Washington, D.C., have explicit laws in place codifying the right to an abortion in their state. Many of these states have enacted new laws and are also considering bills  to expand funding and access to people who live in states where abortion will be banned or restricted, as well as legal protections for clinicians and patients who obtain abortions.5 

In the remaining states, the future of abortion access is less clear, and will likely depend on the political parties in office in the coming years.

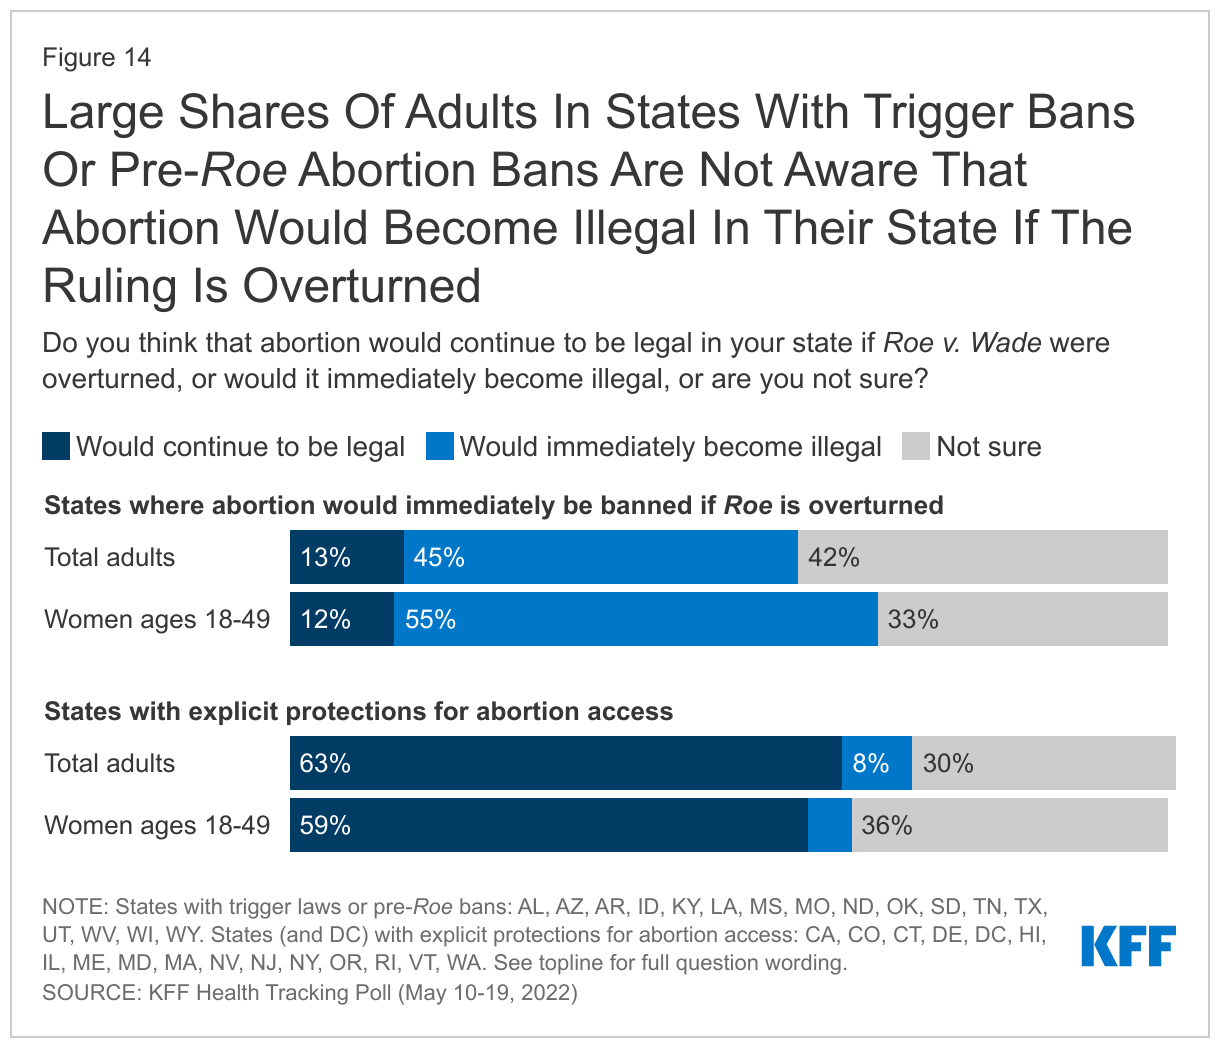
Just over four in ten (45%) of those living in the 17 states with laws that would likely ban abortion immediately, known as trigger laws, or abortion bans still in place since before Roe v. Wade was decided in 1973, are aware that if Roe v. Wade is overturned, abortion will no longer be legal in their state, while four in ten (42%) are not sure, and 13% say it would continue to be legal. While a small majority (55%) of women ages 18-49 in these states are aware that abortion would immediately be banned in their state, nearly half are either not sure (33%) or incorrectly believe abortions would continue to be legal (12%).

Two-thirds (63%) of those living in states where the right to an abortion is explicitly protected are aware that abortion would continue to be legal if the case was overturned, while three in ten are unsure, and few (8%) think it would no longer be legal in their state.

Large Shares Of Adults In States With Trigger Bans Or Pre-Roe Abortion Bans Are Not Aware That Abortion Would Become Illegal In Their State If The Ruling Is Overturned

Populations Most Affected by Abortion Bans

If Roe v. Wade is overturned and many states across the country move to ban or restrict abortion access, people of color, lower-income people, and younger people would be disproportionately impacted by the laws largely due to the high cost of travel to neighboring states. The states seeking to ban abortions are concentrated heavily in the South, which has large shares of Black and Hispanic adults, the Plains which has a large Indigenous population, and the Midwest. Despite a few states passing legislation that would protect out-of-state residents seeking abortions in their state, many people in these populations would still be unable to travel to neighboring states to access abortion, forcing them to either seek abortion services outside of recognized clinical care, or carry their pregnancy to term.

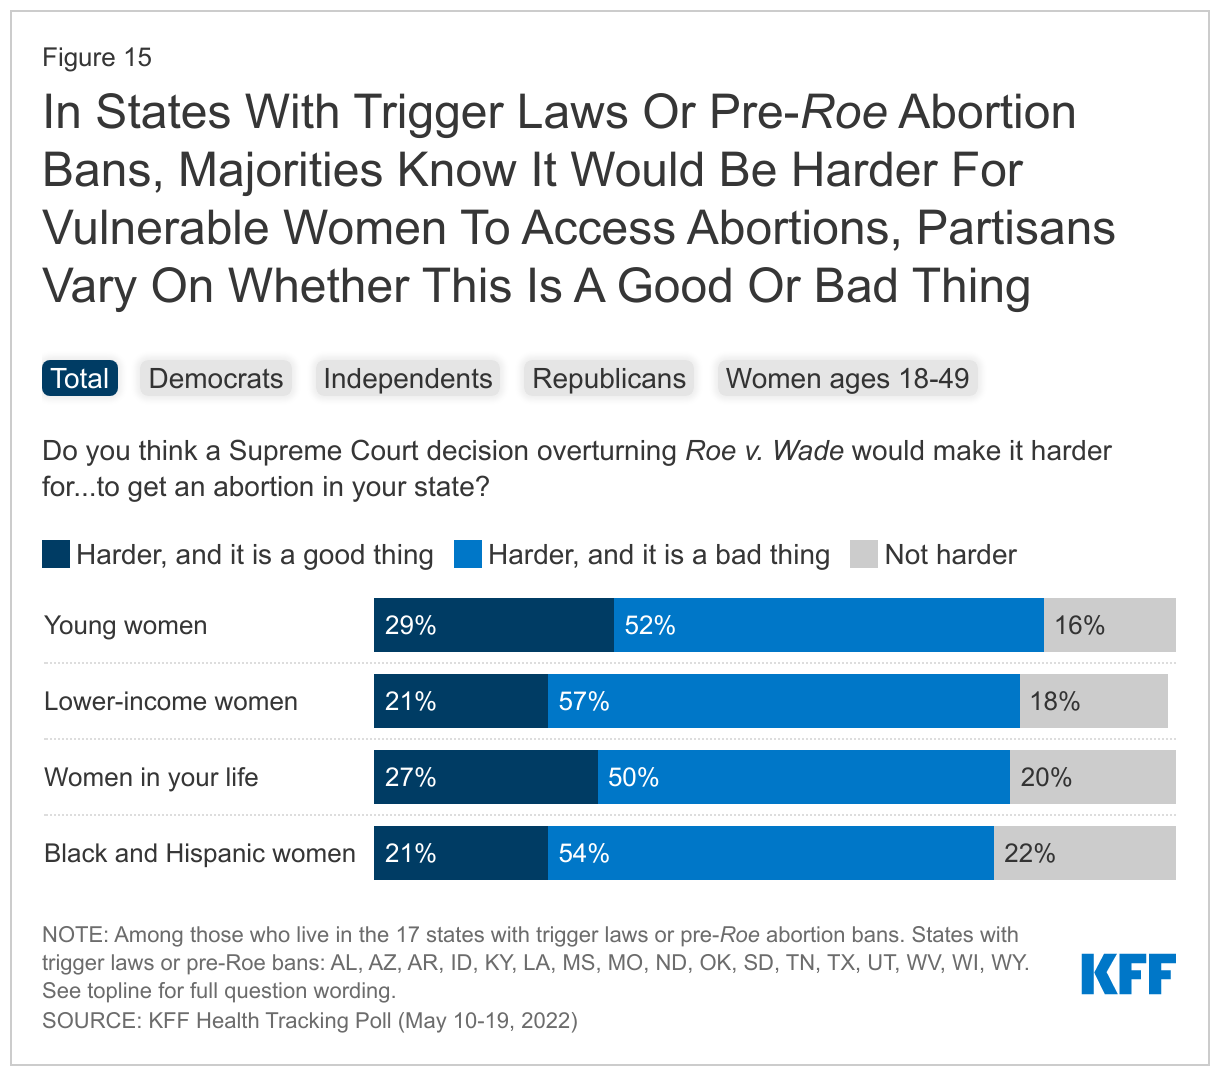
Large majorities of adults who reside in states with trigger laws or pre-Roe abortion bans know that for various groups of women, getting an abortion will prove more difficult in their state if Roe is overturned. In the states where the right to an abortion will be most vulnerable, eight in ten say that a Supreme Court decision overturning Roe v. Wade will make it harder for young women (82%), lower-income women (78%), Black and Hispanic women (76%), and the women in their life (77%) to get an abortion in their state.

While there is widespread awareness of the impacts on certain populations, partisans differ on their assessment of whether this is a “good thing” or a “bad thing,” with larger shares of Republicans saying it is a “good thing” that it would be harder for each of these groups to get an abortion in their state and larger shares of Democrats viewing it as a “bad thing.” Notably, at least one in five Republicans say that it would be a “bad thing” that it would be more difficult for these groups to obtain an abortion.

Among women of reproductive age in these states, about six in ten believe overturning Roe v. Wade would make abortion harder to access in their state and that this is a “bad thing”, while between two and three in ten say making abortion harder to access would be a “good thing.”

In States With Trigger Laws Or Pre-Roe Abortion Bans, Majorities Know It Would Be Harder For Vulnerable Women To Access Abortions, Partisans Vary On Whether This Is A Good Or Bad Thing

State Legislation On Abortion

The Supreme Court’s 1992 decision for Planned Parenthood v. Casey established the right of states to regulate abortion services before viability as long as the regulation does not place an “undue burden” on women seeking an abortion. “Undue burden” is shorthand for a state regulation that has been found to have the purpose or effect of placing a substantial obstacle in the path of a person seeking an abortion. Since the Casey decision in 1992, many states have enacted a wide range of restrictions such as counseling, ultrasound and waiting period requirements; parental notification and consent requirements, restrictions on insurance coverage for abortion, and regulations specific to facilities and clinicians providing abortions. If the Supreme Court overrules Roe v. Wade, states will be able to enact abortion regulations without having to pass the “undue burden” standard and states could pass restrictions that could effectively block abortion access without actually passing a ban on abortion.

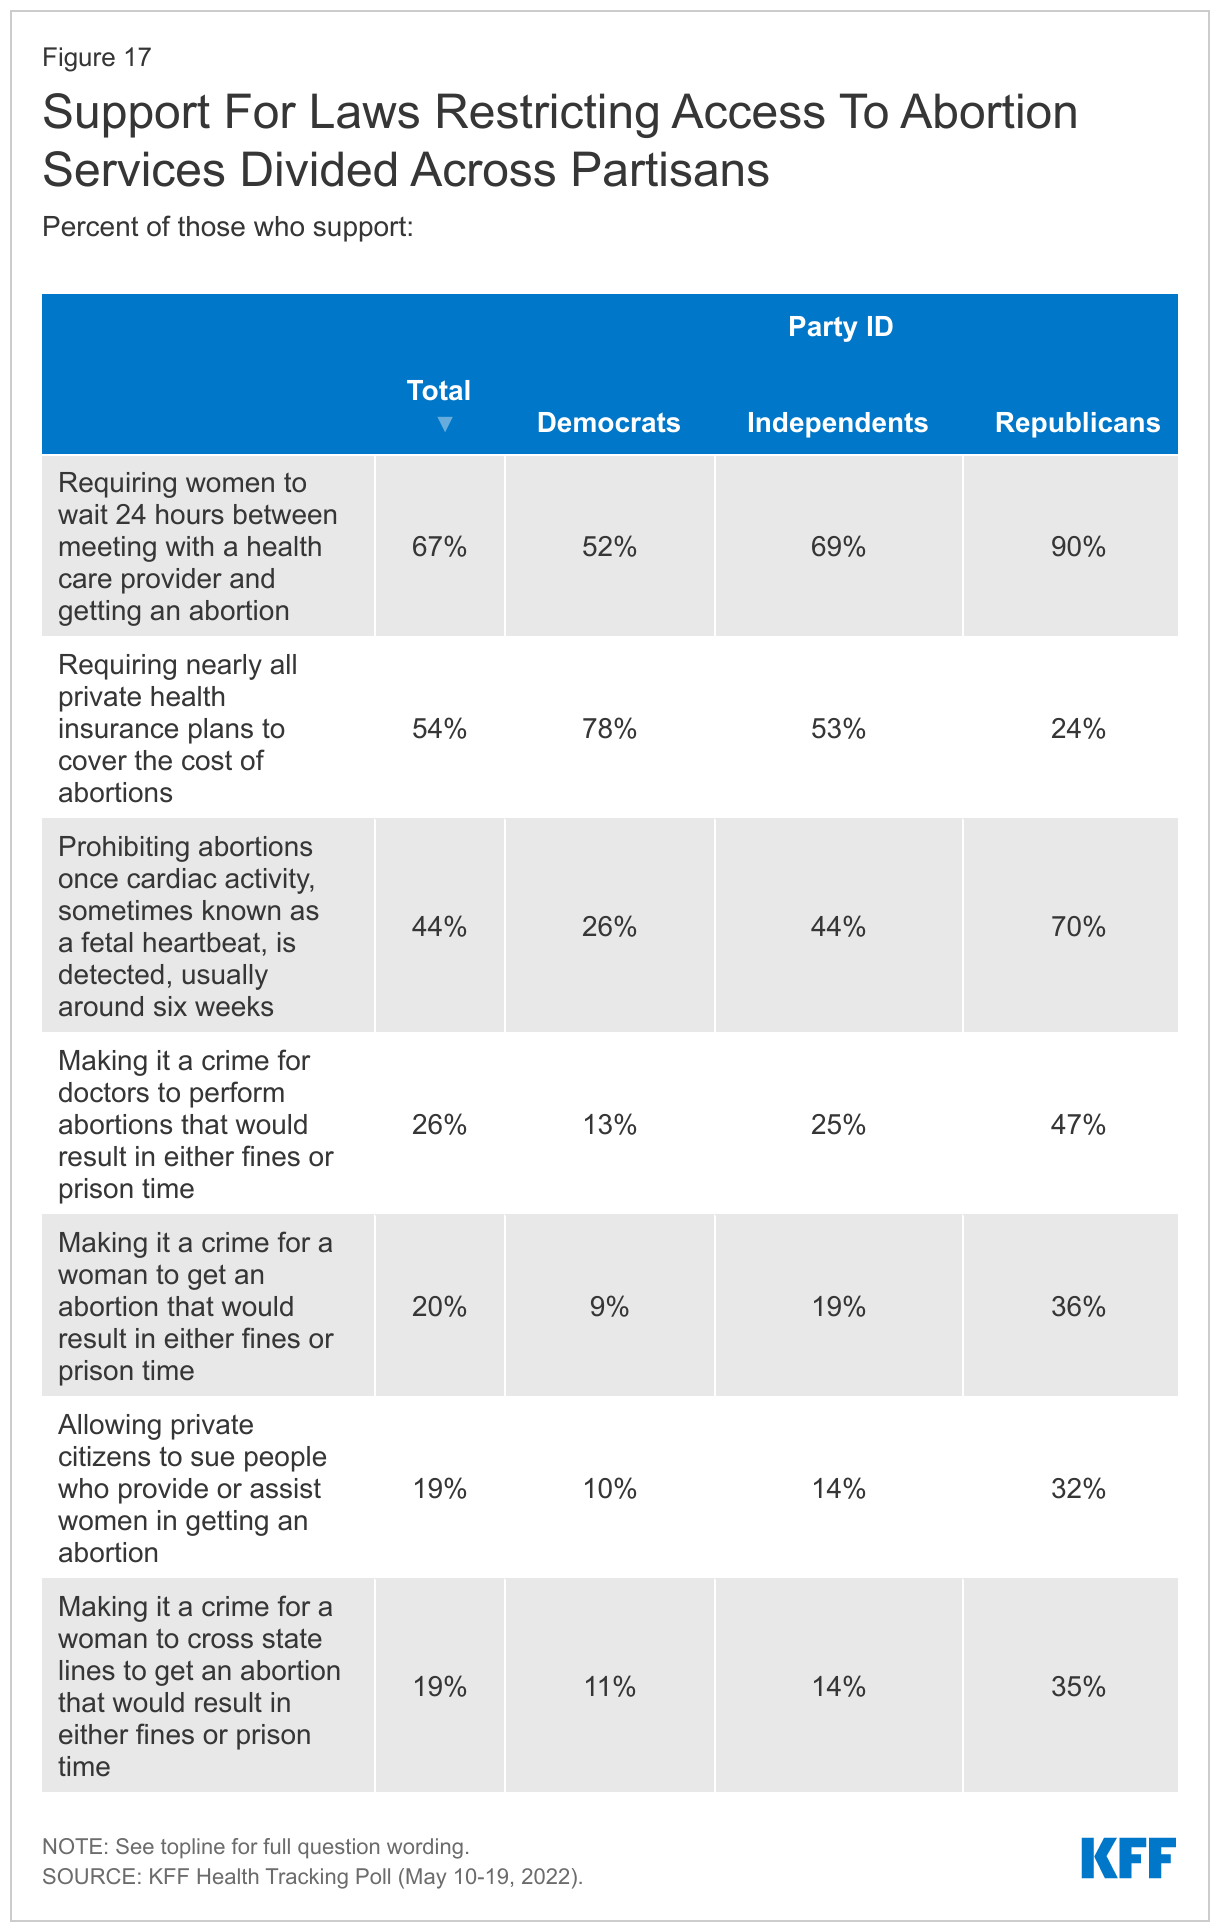
Among the public, there is some support for certain state-level restrictions on women seeking abortions, but majorities of the U.S. public oppose criminalizing women, doctors, or people who assist those seeking abortion care. Waiting periods are a common regulation on abortion and 27 states have enacted waiting periods ranging from 18 to 72 hours after contacting the clinic. Two-thirds of the public (67%) support laws requiring women to wait 24 hours between meeting with a health care provider and getting an abortion. Gestational limits are another type of law that states have enacted to limit how far into a pregnancy an abortion can be performed. Recently, several states have passed laws banning abortions after the time in which fetal cardiac activity can be detected, around 6 weeks of pregnancy (which is often before a person knows they are pregnant). While many of these laws have been blocked, this type of ban on all but the earliest abortions is currently in effect in Texas. Forty-four percent of adults support laws prohibiting abortions “once a fetal heartbeat is detected, which is usually around six weeks” (44%), while 54% are opposed to these types of laws. While this is unchanged from a 2019 KFF poll, that poll found that when the public was told that six weeks is usually before many women know they are pregnant, opposition to this policy increased to six in ten.

Large majorities oppose making it a crime for doctors to perform abortions (73%) or for women to get abortions (79%). With the impending Supreme Court decision on Roe, some states have passed restrictions to ban abortions using civil enforcement and penalties. Oklahoma and Texas have laws in effect that allow private citizens to sue people who provide or abet women in getting an illegal abortion. Some state legislators have considered making it a crime to travel across state lines to obtain an abortion, but such a law is not currently in effect in any state. KFF polling finds that eight in ten oppose each of these types of laws. It is also worth noting that several states have taken action to uphold the right or expand access to abortion and also protect doctors practicing in their states from criminal or civil liabilities for performing abortions in their state.

Interactive DataWrapper Embed

There is also majority opposition to many of these state policies on abortion among those who reside in states where there are trigger laws or pre-Roe abortion bans. At least two-thirds of people living in these 17 states oppose criminalizing doctors for performing abortions (69%), making it a crime for women to cross state lines to get an abortion (76%), making it a crime for a woman to get an abortion (74%), or allowing private citizens to sue people who provide or assist in abortions (78%).

Partisans differ in their level of support for these state-level abortion policies. A majority of Republicans support a 24-hour waiting period (90%) and prohibiting abortions once there is cardiac activity (70%). However, less than half of Republicans now support making it a crime for doctors to perform abortions that would result in fines or prison time (47%, down from 58% in 2019), making it a crime for women to get an abortion (36%, down from 49% in 2019), allowing private citizens to sue people who provide or assist women in getting abortions (32%) or making it a crime for a woman to cross state lines to get an abortion (35%). Independents are also less likely than they were in 2019 to support laws that would criminalize doctors (25%, down from 34% in 2019). About one in five independents continue to support criminalizing women seeking an abortion (19% v. 23% in 2019).

With the exception of the law that requires women to wait 24 hours between meeting a health care provider and getting an abortion, fewer than half of Democrats and independents support these laws.

Support For Laws Restricting Access To Abortion Services Divided Across Partisans

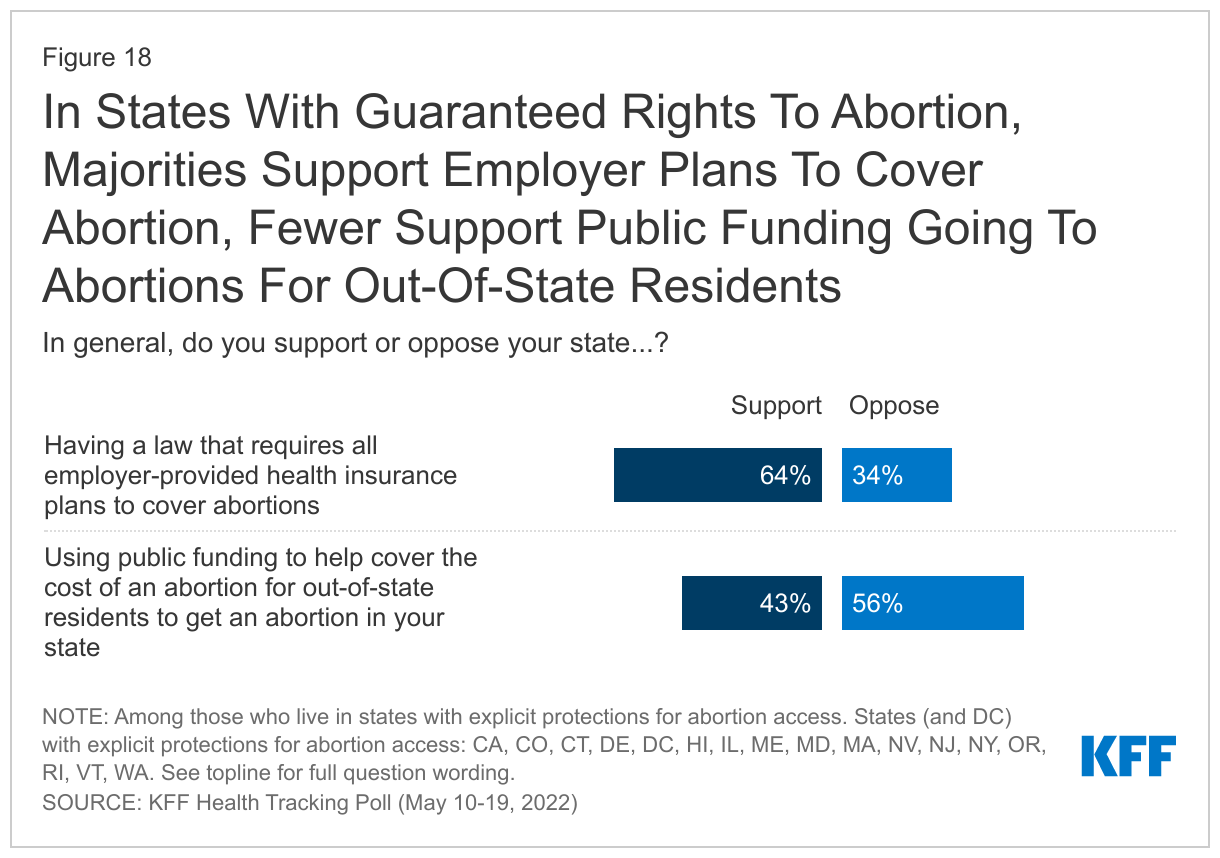
In states that have protected the right to an abortion, there is growing momentum to provide public funding to support their clinics to provide abortion care to out-of-state women who seek an abortion in their state. Among those who live in a state that has laws in place protecting the right to an abortion, majorities oppose (56%) using public funding to cover these costs. However, two-thirds (64%) would support a law that would require all employer provided health insurance plans to cover an abortion.

In States With Guaranteed Rights To Abortion, Majorities Support Employer Plans To Cover Abortion, Fewer Support Public Funding Going To Abortions For Out-Of-State Residents

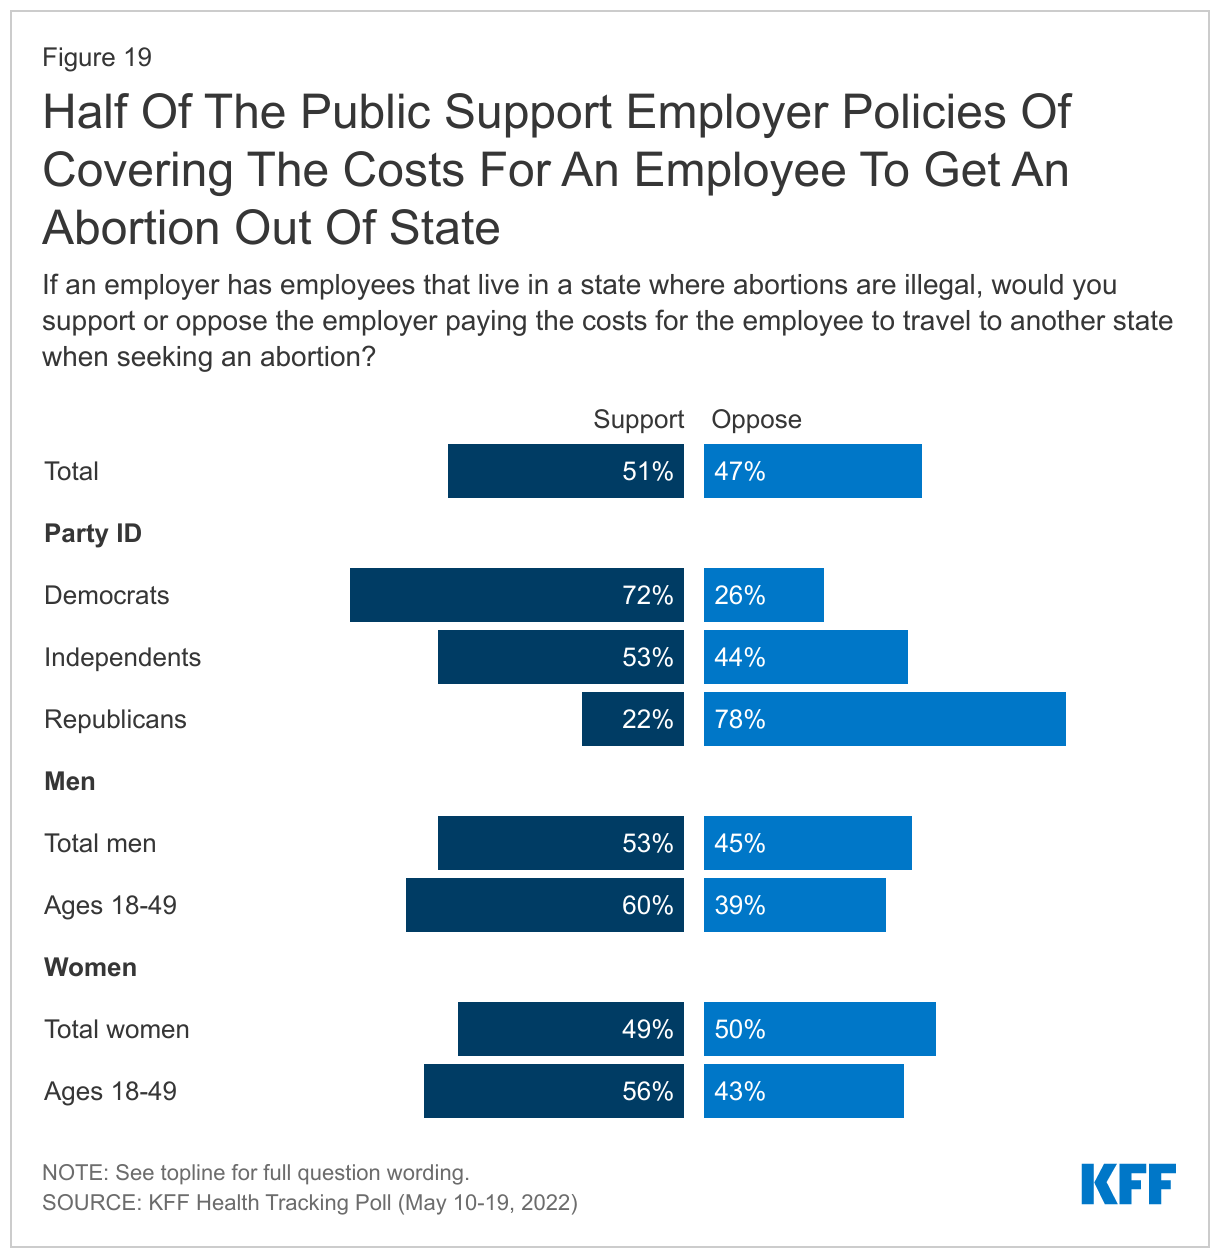
If abortion is banned in many states across the country, the costs associated with obtaining an abortion will increase for those who are able to travel out of state to obtain abortion services. Some employers have begun offering to cover travel expenses for employees who need to travel out of state to obtain an abortion. Asked if they would support or oppose employers paying the travel costs for an employee to travel out-of-state to obtain an abortion if abortion is not available where they reside, a slim majority (51%) of U.S. adults say they would support this and 47% oppose. Seven in ten (72%) Democrats support this, and nearly eight in ten (78%) Republicans oppose. Independents are divided, with about half saying they support (53%) or oppose (44%) this workplace benefit. Younger adults across gender are more likely than their older counterparts to support this benefit.

Half

Gaps Remain in Public’s Knowledge About Abortion, Birth Control

This KFF poll examines what Americans know about abortion services and finds there are significant knowledge gaps on the prevalence and the overall safety of abortions.

How common are abortions? The number of abortions performed in the U.S. has been steadily decreasing over the last several decades, and reached a historic low in 2017, of 11.4 abortions per 1,000 women ages 15 to 44, although it increased slightly (by 2%) between 2017 and 2019. The decline in abortion rates is often attributed to greater affordability of contraception and increased use of highly effective long-acting reversible contraception such as IUDs and contraceptive implants. Still, using 2014 abortion rates, an estimated 1 in 4 reproductive-aged women (24%) will have had an abortion by age 45.

Does abortion cause breast cancer? No. The link between abortions and breast cancer has been refuted by The National Cancer Institute (NCI) and the American College of Obstetricians and Gynecologists (ACOG) but was used in misinformation campaigns from the 1970s until the early 2000s.

Does abortion cause infertility? No. A major study of the quality and safety of abortion by the National Academies of Science, Engineering, and Medicine found no association between abortion and secondary infertility. Only a minute fraction (0.23%) of legal abortions in a clinical setting in the U.S. have complications that could lead to infertility.

Is abortion safe? Yes. Abortion has fewer complications than many other common procedures, such as wisdom tooth removal (7%), tonsil removal (8-9%), appendix removal (13%), and childbirth (29%).

At what point in pregnancy do most abortions occur? The vast majority of abortions occur early in pregnancy; most (79%) occur at ≤9 weeks gestation, while almost all (93%) are performed at ≤13 weeks gestation (also referred to as the 1st trimester). Abortions later in pregnancy, at ≥21 weeks gestation, are rare, comprising only 1.2% of all abortions.

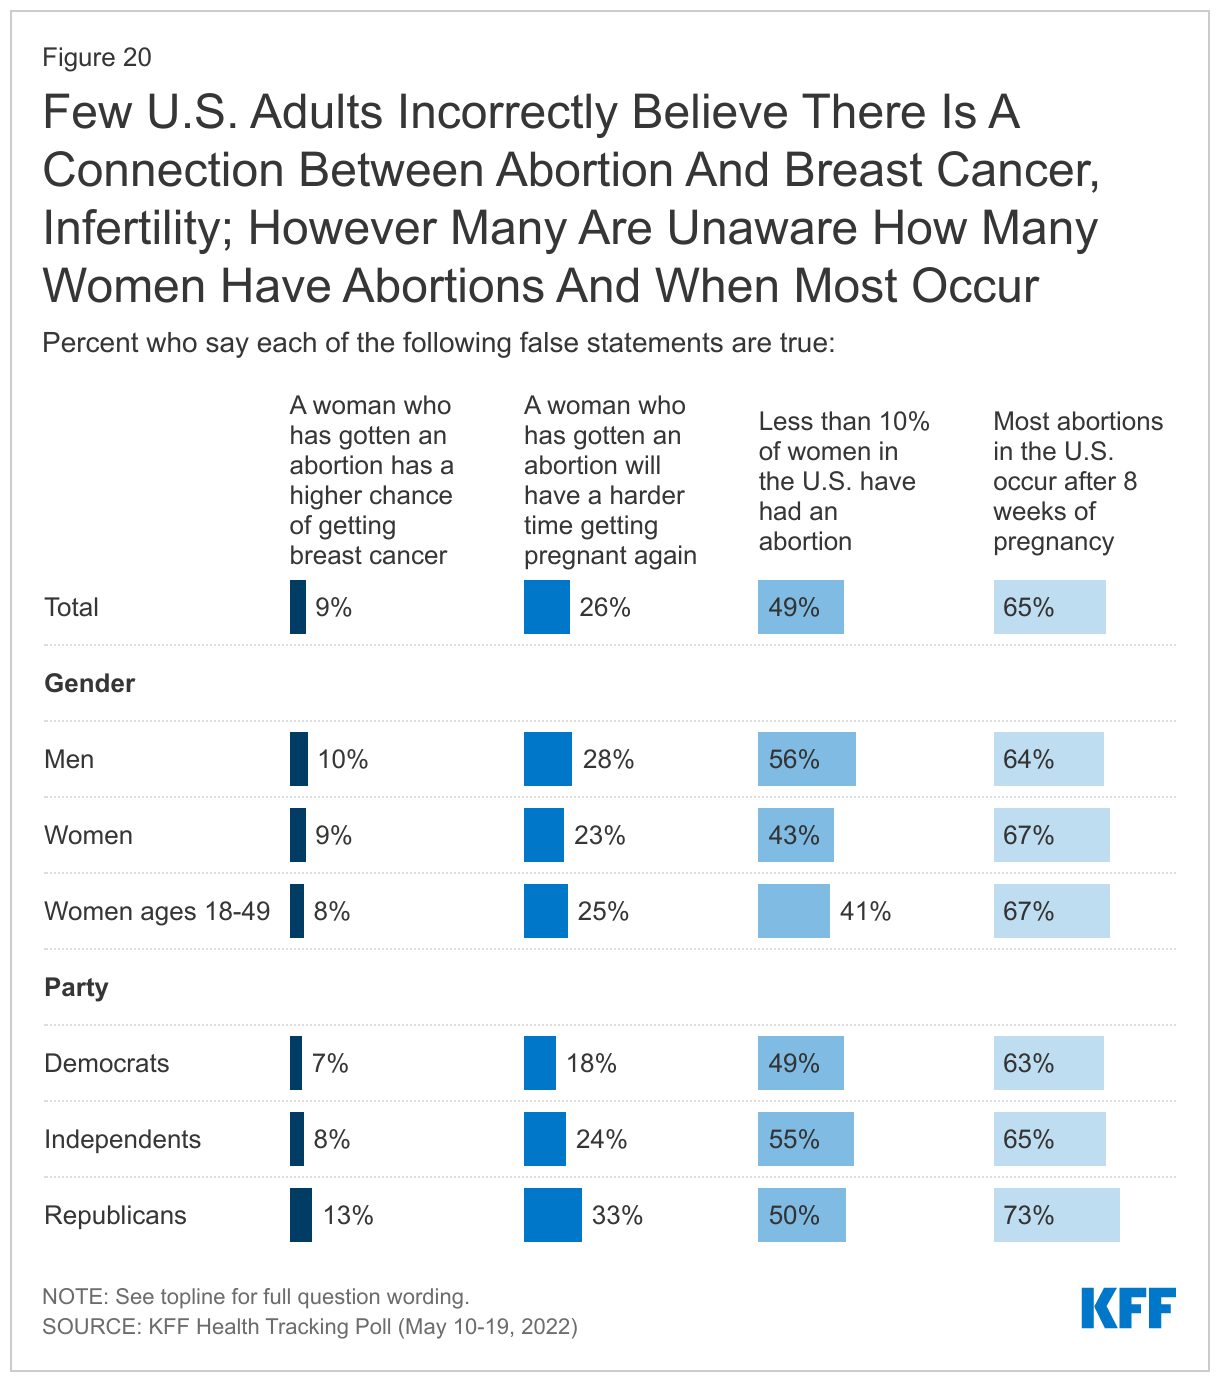
Two-thirds of U.S. adults (64%) say that they or someone they know has had an abortion, including at least six in ten Democrats, independents and Republicans, men, and women. Yet, about half of U.S. adults (49%) incorrectly say that less than 10% of women in the U.S. have had an abortion, when the actual share is closer to one-quarter. Men are more likely than women to underestimate the share of women who have had an abortion, with six in ten (56%) of men saying it is true that less than 10% of women have had an abortion.

A large majority of the public (87%) across partisan and age groups correctly says that it is false that a woman who has gotten an abortion has a higher risk of getting breast cancer. However, a small share (9%) of all adults, rising to 13% of Republicans, believe this to be true. Three quarters (72%) of U.S. adults correctly say that a woman who has gotten an abortion will not have a harder time getting pregnant again, while one-fourth (26%) say that this statement is true, rising to one-third of  Republicans.

Many also do not know at what point in pregnancy most abortions occur. Majorities (65%) incorrectly say most abortions occur after eight weeks of pregnancy, while one-third (32%) correctly say most occur fewer than eight weeks into pregnancy. Few, however, believe that most abortions occur more than 20 weeks into pregnancy (2%).

Few

How much does an abortion cost? Recent research finds that the median out-of-pocket cost of a first-trimester abortion is close to $600 for those who self-pay, not including costs that could be incurred to travel out of state or take time off from work.

Cost can be a barrier for women seeking abortion care, as many adults cannot afford the expense and not all health insurance plans cover abortion services. In fact, among women ages 18 to 49 who are insured, more than eight in ten (84%) say that they do not know if their insurance plan covers the cost of an abortion. Just 6% say that their insurance plan does cover the cost of an abortion, and one in ten say it does not. Most women of reproductive age do not know the cost of an abortion during the first trimester in the U.S. Just 14% correctly say that the cost out-of-pocket for a first-trimester abortion is between $500 and $700, while one-third (32%) are unsure of the cost, and many both over and underestimate the cost of this procedure.

Medication Abortion

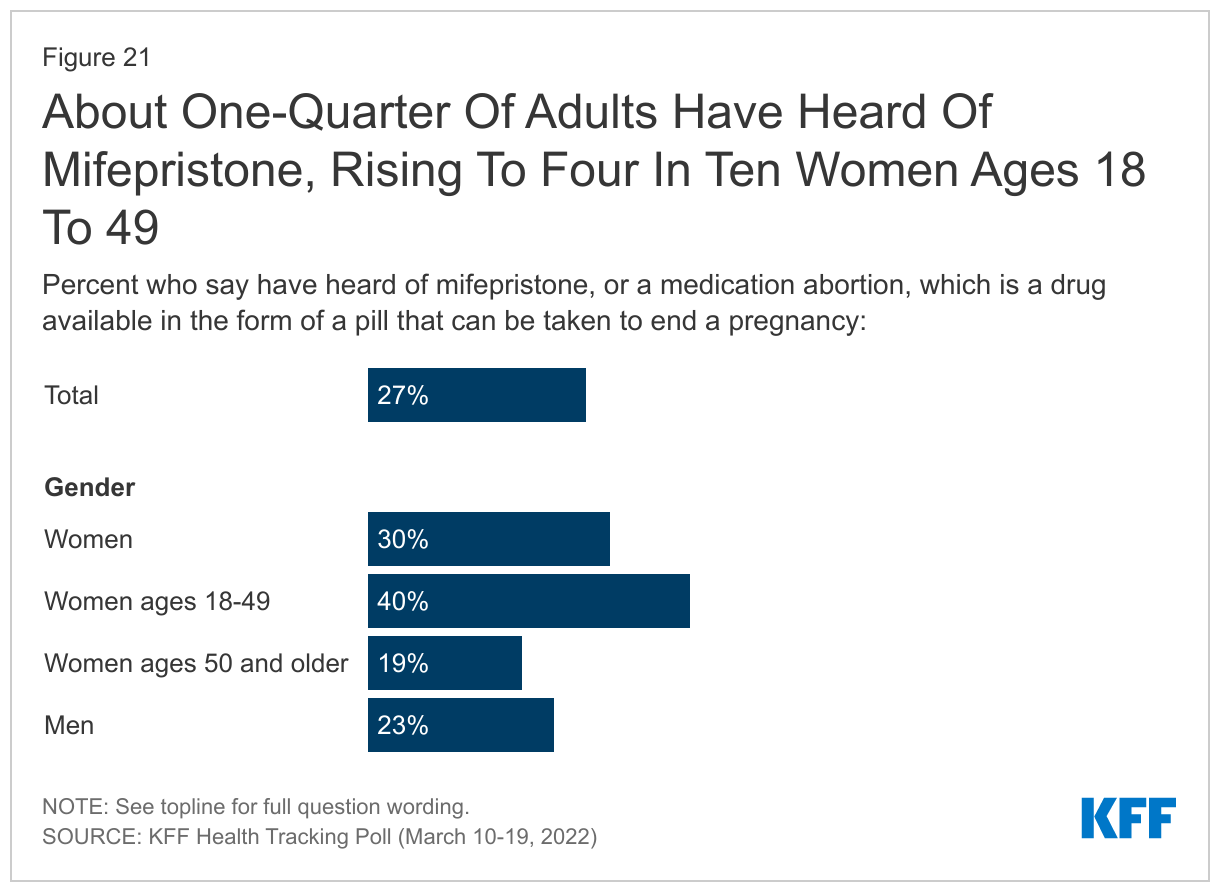
While medication abortion now accounts for more than half of all abortions in the U.S., fewer than three in ten U.S. adults (27%) say they have heard of the medication abortion pill known as mifepristone, up slightly from 2019 (21%). Women ages 18-49 (40%) are twice as likely as women ages 50 and older (19%) and men (23%) to say they have heard of the medication abortion pill.

About

Of those who had heard of it, 63% (17% of total) correctly say that mifepristone can be effectively used to end a pregnancy up to the first 10 weeks. Few (12%) incorrectly say it is effective at any point during pregnancy. Six in ten of those who have heard of mifepristone (59%, 16% of total) know that a prescription is required to get medication abortion pills, while four in ten either incorrectly say it is available without a prescription (13%) or that they are unsure (28%).

Small Majorities Support requiring in-person appointments for Medication Abortion Prescriptions

Since the start of the COVID-19 pandemic, medical providers have been expanding their use of telehealth to consult with patients on issues that do not require in-person appointments. The expansion of telehealth has given some people access to health care when they otherwise would not be able to due to barriers to access, time, and distance required to travel to providers. The FDA no longer requires mifepristone to be dispensed in-person in a clinical setting, which has enabled people in many states to obtain the medications through the mail rather than having to go to a clinic or provider to receive the medication.

However, some states have explicitly banned the use of telehealth for abortion and others have instituted policies such as ultrasound requirements that necessitate the physical presence of the prescribing clinician, despite the FDA’s finding that the use of telehealth for medication abortion is safe.6  Among the 27% of U.S. adults who have heard of mifepristone, six in ten (16% of all adults) say they support the policy already in effect in 19 states that requires patients to have an in-person appointment to obtain a prescription for medication abortion pills, while 40% (11% of all adults) are opposed to such a requirement.

Some Confusion remains about difference between Emergency Contraceptive Pills and Medication Abortion

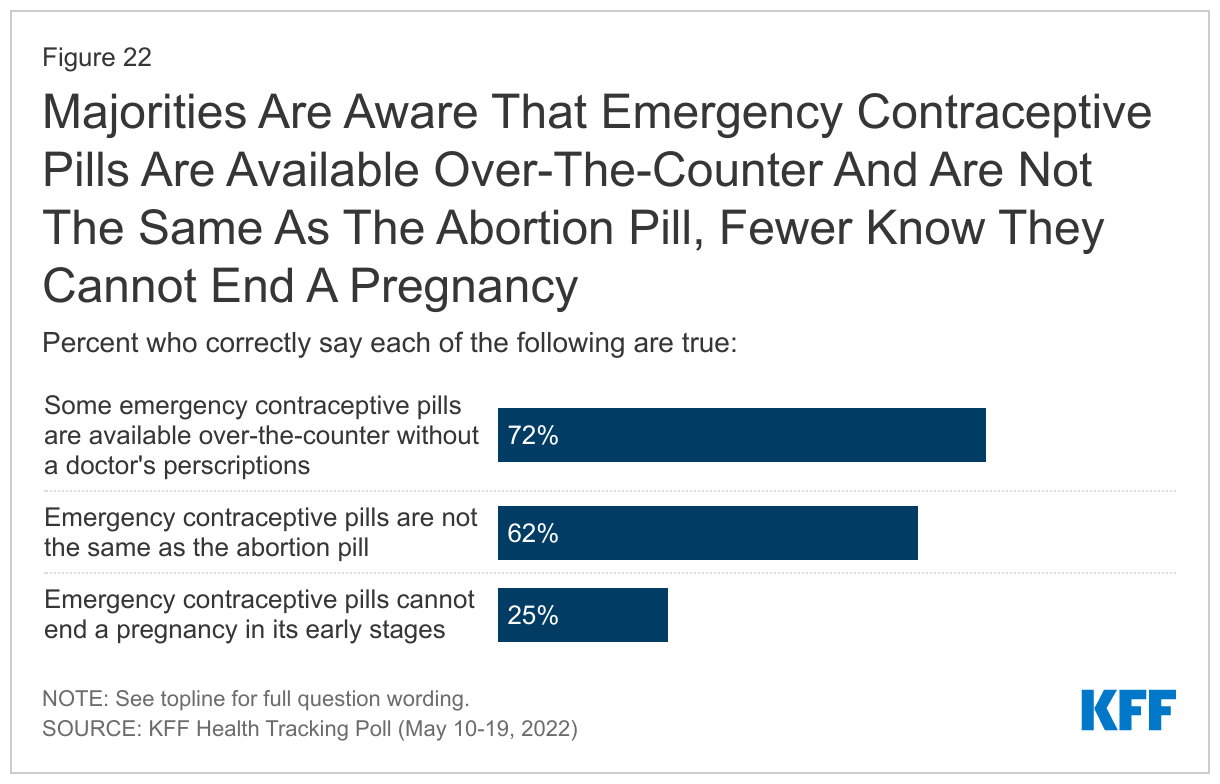
Some state lawmakers have discussed the possibility of placing additional restrictions or limits on the use of emergency contraceptive pills. Most U.S. adults (92%), have heard of emergency contraceptive pills, sometimes called the morning after pill or “Plan B,” similar to the share who had heard of it in 2019 and up from 85% in 2003, shortly after it was approved by the FDA. Yet some knowledge gaps remain when it comes to how the pills work. While most are aware that emergency contraceptive pills are not the same as the abortion pill (62%), and that some types are available over-the-counter without a doctor’s prescription (72%), a substantial share (73%) incorrectly think that emergency contraceptive pills can end a pregnancy in its early stages.

Majorities

Methodology

This KFF Health Tracking Poll was designed and analyzed by public opinion researchers at the Kaiser Family Foundation (KFF). The survey was conducted May 10-19, 2022, online and by telephone among a nationally representative sample of 1,537 U.S. adults. Interviews were conducted in English and in Spanish (n=95). The sample includes 1,285 adults reached through the SSRS Opinion Panel either online (n=1,246) or over the phone (n=39), with an oversample of women aged 18 to 49 (n=615). The SSRS Opinion Panel is a nationally representative probability-based panel where panel members are recruited randomly in one of two ways: (a) Through invitations mailed to respondents randomly sampled from an Address-Based Sample (ABS) provided by Marketing Systems Groups (MSG) through the U.S. Postal Service’s Computerized Delivery Sequence (CDS); (b) from a dual-frame random digit dial (RDD) sample provided by MSG. For the online panel component, invitations were sent to panel members by email followed by up to four reminder emails.

Another 252 interviews were conducted from a random digit dial telephone sample of prepaid cell phone numbers obtained through MSG. Phone numbers used for the prepaid cell phone component were randomly generated from a cell phone sampling frame with disproportionate stratification aimed at reaching Hispanic and non-Hispanic Black respondents. Stratification was based on incidence of the race/ethnicity groups within each frame.

The combined cell phone and panel samples were weighted to match the sample’s demographics to the national U.S. adult population using data from the Census Bureau’s 2021 Current Population Survey (CPS). Weighting parameters included sex, age, education, race/ethnicity, region, and education. The sample was also weighted to match patterns of civic engagement from the September 2017 Volunteering and Civic Life Supplement data from the CPS. The sample was also weighted to match frequency of internet use from the National Public Opinion Reference Survey (NPORS) for Pew Research Center.  The weights take into account differences in the probability of selection for each sample type (prepaid cell phone and panel). This includes adjustment for the sample design and geographic stratification of the cell phone sample, within household probability of selection, and the design of the panel-recruitment procedure.

The margin of sampling error including the design effect for the full sample is plus or minus 3 percentage points. Numbers of respondents and margins of sampling error for key subgroups are shown in the table below. For results based on other subgroups, the margin of sampling error may be higher. Sample sizes and margins of sampling error for other subgroups are available by request. Sampling error is only one of many potential sources of error and there may be other unmeasured error in this or any other public opinion poll. Kaiser Family Foundation public opinion and survey research is a charter member of the Transparency Initiative of the American Association for Public Opinion Research.

GroupN (unweighted)M.O.S.E.
Total1,537± 3 percentage points
Gender
Total women925± 4 percentage points
Women ages 18-49615± 5 percentage points
Total men594± 5 percentage points
Men ages 18-49291± 7 percentage points
Race/Ethnicity
White, non-Hispanic843± 4 percentage points
Black, non-Hispanic248± 8 percentage points
Hispanic306± 7 percentage points
Party identification
Democrats524± 5 percentage points
Republicans340± 6 percentage points
Independents391± 6 percentage points
Registered voters
Total voters1,227± 3 percentage points
Democratic voters459± 6 percentage points
Republican voters300± 7 percentage points
Independent voters316± 7 percentage points

Endnotes

  1. States that have enacted trigger bans or have a pre-Roe ban include: AL, AZ, AR, ID, KY, LA, MS, MO, ND, OK, SD, TN, TX, UT, WV, WI, WY. While Michigan has a pre-Roe abortion ban on its books, a Michigan judge recently blocked this law while litigation challenging the law as violating the Michigan State Constitution proceeds. ↩︎
  2. Data and research often assume cisgender identities and may not systematically account for people who are transgender and non-binary. This survey aims to be as inclusive as possible, allowing non-binary and transgender individuals to answer questions that best reflect their identity. ↩︎
  3. The Wesleyan Media Project finds that after the leak of the Supreme Court draft opinion, the number of U.S. House, Senate and gubernatorial ads mentioning abortion increased substantially, with 22% of pro-Democratic House ads and 24.5% of pro-Republican House ads mentioning abortion in the week following the opinion leak, up from 6.2% and 13.5% the week prior to the leak respectively. ↩︎
  4. States that have enacted trigger bans or have a pre-Roe ban include: AL, AZ, AR, ID, KY, LA, MS, MO, ND, OK, SD, TN, TX, UT, WV, WI, WY. While Michigan has a pre-Roe abortion ban on its books, a Michigan judge recently blocked this law while litigation challenging the law as violating the Michigan State Constitution proceeds. ↩︎
  5. States that have enacted protections for the right to an abortion: CA, CO, CT, DE, HI, IL, ME, MD, MA, NV, NJ, NY, OR, RI, VT, WA, DC. ↩︎
  6. Laws in AZ, AR, MO, LA, TX, and WV specifically ban telehealth for abortion consultations. ND, SD, NE, KS, OK, MS, AL, TN, KY, IN, NC, and SC “have enacted laws that require the clinician providing a medication abortion to be physically present during the procedure, effectively prohibiting the use of telehealth to dispense medication for abortion remotely.” All other states allow telehealth to be used for dispensing medication abortion in line with FDA regulations. See more from a KFF fact sheet on medication abortion here. ↩︎
News Release

Majority of Voters Say Overturning Roe Won’t Impact the Likelihood of Them Voting in Midterm Elections, But 1 in 5 of Voters and 1 in 4 Younger Women Voters Say it Will Motivate Them More And They Will Only Vote For A Pro-Choice Candidate

Published: Jun 9, 2022

Majorities Oppose State Laws Criminalizing Abortion, Even Those Living In States Where Abortion Will Become Illegal If Roe Is Overturned

Misconceptions Around Abortions Persist With Most Women of Reproductive Age Unaware Of Medication Abortion And Many Confusing It With Emergency Contraception

More than a third (37%) of voters say that they would be more motivated to vote in November’s Midterm Election if the Supreme Court overturns the Roe v. Wade decision establishing a constitutional right to an abortion, and this group is largely pro-choice and leans Democratic, finds a new KFF Health Tracking Poll focused on abortion issues.

Fielded after news broke about a leaked draft opinion in the pending Dobbs v. Jackson case that would overturn Roe, the findings suggest that a decision to overturn Roe could narrow a midterm voter enthusiasm gap, projected to favor the Republican party over the Democratic party. However, a majority of  voters (57%) say a ruling overturning Roe would not influence their motivation to vote in the midterms.

One in five of all voters (20%) say both that such a decision would make them more motivated to vote and that they would only vote for a candidate who wants to protect access to abortion. This group includes nearly four in ten Democratic voters (37%), Democratic women voters (38%), and a quarter of women voters under age 50 (25%).

Far fewer voters (4%) say they are both more motivated to vote by the Supreme Court decision and would only support candidates who want to limit access to abortions.

Nearly two thirds (64%) of the public overall say they do not want the Supreme Court to overturn Roe, while a third (33%) say they would like to see this happen. There are partisan differences, with most (61%) Republicans wanting to see Roe overturned, while a large majority of Democrats (85%) and most independents (62%) do not.

Partisan differences also exist on whether abortion should be a personal choice or regulated by law. Those who say it should be a personal choice include large majorities of Democrats (90%) and independents (74%), and about half (52%) of Republicans. Among women under age 50, eight in ten (79%) say that getting an abortion should be a personal choice, including a majority (59%) of younger Republican women. Overall, three quarters (74%) of the public say abortion should be a personal choice, while a quarter (25%) say it should be a matter of law.

Majorities Oppose States Criminalizing Abortion, Even in States with Existing Trigger Laws or Pre-Roe Abortion Bans

If Roe were overturned, states would set their own abortion policies without any federal constitutional standards, and 17 states already have laws in place that would effectively outlaw abortion in their state.

Less than half (45%) of those living in those 17 states are aware that abortion would become illegal in their states in Roe were overturned, with the rest either unsure (42%) or incorrectly believing abortion would continue to be legal (13%).

The survey finds that large majorities of the public, including those living in states with such trigger laws, oppose a variety of laws that would penalize abortion with either fines or prison time, including making it a crime:

  • For a woman to get an abortion (79% of the public opposes, including 74% of those in states with trigger laws).
  • For a woman to cross state lines to get an abortion (80% opposes, including 76% of those in states with trigger laws).
  • For a doctor to perform an abortion (73% oppose, including 69% of those in states with trigger laws).

Similar majorities (80% of the public, including 78% of those residing in states with trigger laws) say they oppose a law that would allow private citizens to sue people who provide or assist women in getting an abortion. (Texas and Oklahoma already have laws in effect that allow such lawsuits.)

In contrast,  two thirds (67%) of the public, support laws that require women to wait at least 24 hours after meeting with a health care provider and getting an abortion.

The public is more closely divided on laws that would prohibit abortions once cardiac activity (sometimes called a fetal heartbeat) is detected around six weeks, with a narrow majority (54%) opposing such laws and large minority (44%) favoring them.

Nationally, a slim majority (51%) of adults say they would favor employers covering expenses for an employee who has to travel out of state to obtain an abortion if one is not available where they reside, while nearly as many (47%) would oppose such a law.

In 16 states and the District of Columbia, there is a right to abortion codified in state laws. Nearly two thirds (64%) of residents in these states say they favor a law to require employer health plans to cover an abortion. A narrow majority (56%) oppose using public funds to cover the cost of abortion for people coming from out-of-state to get an abortion in their state.

Abortion Misconceptions Persist, With Most Unaware of Medication Abortion

The poll also finds that the public, including women under age 50, have significant knowledge gaps around abortion and emergency contraception.

Medication abortion using a pill called mifepristone now accounts for more than half of all abortions nationally, yet just of a quarter (27%) of adults overall and four in ten (40%) women under age 50 say they have heard of it.

In contrast, the vast majority (92%) of adults have heard of emergency contraceptive pills , sometimes called the morning-after pill or “Plan B.”  However, a majority (73%) incorrectly believe emergency contraceptive pills can end pregnancy in its early stages. In reality, emergency contraceptive pills cannot end an established pregnancy.

The survey was conducted from May 10-19, 2022 among a nationally representative sample of 1,537 adults including 615 women between the ages of 18 and 49. Interviews were conducted in English and Spanish online (1,246) and by telephone (291). The margin of sampling error is plus or minus 3 percentage points for the full sample and 5 percentage points from the sample of women, 18-49. For results based on subgroups, the margin of sampling error may be higher.

Ahead of the final decision on the pending Supreme Court case on abortion access, you can find related KFF resources.

How Many Are Not Up to Date with Vaccination in Counties with Elevated COVID-19 Community Levels?

Authors: Anna Rouw, Krutika Amin, Cynthia Cox, and Jennifer Kates
Published: Jun 8, 2022

NOTE: A more recent version of this analysis is available here.

With the recent Omicron wave causing increased cases and hospitalizations, the Centers for Disease Control and Prevention (CDC) has warned that more than a half of the U.S. population lives in a county with a medium to high COVID-19 community level – that is, with relatively high numbers of new COVID-19 cases per 100,000, new COVID-19 hospital admissions, and strains on hospital capacity due to COVID-19. In addition to recommending vaccination and boosters for everyone age 5 or older, CDC also recommends wearing masks in public indoor settings in counties with high COVID-19 community levels; in medium-level counties, CDC says masking should be considered based on personal risk.

An individual’s vulnerability to the virus that causes COVID-19 may depend on a number of factors including, but not limited to, their vaccination status, history of prior infection, age, health status, and amount of exposure. CDC data indicate the risk of hospitalization or death due to COVID-19 is significantly higher among those who are unvaccinated compared to those vaccinated with at least a primary series and especially compared to those who also received a booster dose.

We sought to better understand how many people might be particularly vulnerable in the current context because they are either unvaccinated, including those who are not yet eligible for vaccination (children under 5 years old), or not up to date on vaccines and live in counties with elevated (“medium” or “high”) COVID-19 community levels in the U.S.—areas where the CDC recommends masking in at least some circumstances. We define being “up to date” on vaccines as having received a primary series and at least one booster dose. Although CDC now recommends second booster shots for people ages 50 and over or those who are immunocompromised, there are currently no county-level data available on the number of booster doses people have received. We used CDC’s COVID-19 community levels and vaccination data by county as of June 2, 2022 (see Methods for more detail).

Findings

  • There are 120 million people living in counties with elevated COVID-19 community levels who are not up to date on their COVID-19 vaccines. These include those who are unvaccinated, partially vaccinated, and those who are vaccinated but not yet boosted, putting them at higher risk of severe illness and death. Together, they represent about half of all those in the U.S. who are not up to date on vaccines.
100 Million People Who Are Not Up To Date On COVID-19 Vaccines And Live In Counties With Elevated COVID-19 Community Levels
  • Of these, 36 million people in these counties are unvaccinated including 14 million living in counties with high COVID-19 community levels. In total, we estimate that 41% of unvaccinated people (those who did not receive any COVID-19 vaccine doses) in the U.S. live in a county with medium or high COVID-19 community levels.
  • There are another 20 million people in these counties who are partially vaccinated including 8 million living in counties with high COVID-19 community levels. In total, we estimate that 61% of all partially vaccinated people (those who received at least one COVID-19 vaccine dose but did not complete the primary series) in the U.S. live in a county with medium or high COVID-19 community levels.
  • Additionally, there are 64 million people who are vaccinated but not yet boosted and live in counties with elevated community levels, including 25 million who live in high-level counties. In total, we estimate 58% of people in the U.S. who are vaccinated with a primary series but remain un-boosted live in medium or high COVID-19 community level counties.
Share Of State Population Not Up To Date With COVID-19 Vaccines

Implications

CDC recommends that all people mask indoors in areas that have high COVID-19 community levels, and that people living in medium-level counties mask based on their personal risk. People who live in these areas who are not up to date on vaccines are among those who are particularly vulnerable during a surge. This is especially the case for the 14 million people who are unvaccinated and live in high COVID-19 community level counties; for these individuals, their risk of hospitalization and death from COVID-19 is significantly higher than if they were vaccinated. In addition, people who received their primary COVID-19 vaccine series but have not yet received a booster also face greater risks than those who have been boosted, since immunity can wane over time and new viral variants and subvariants make breakthrough infections more likely. Although we do not include them in this total, there are others who are at risk even if they have received a booster shot, for example those who are immune compromised or who are recommended to receive a second booster but have not yet done so. Finally, even individuals who live in counties deemed to be at low COVID-19 community levels, particularly those who have an underlying health condition or are older, may face risk and even serious health outcomes if they were to get COVID, especially if they remain unvaccinated or unboosted. As such, masking would offer significant protection to them as well.

These data underscore the significant vulnerability to COVID-19 illness that still exists at this time, more than a year since vaccines became widely available in the U.S. to most people. As such, they point to the importance of employing other public health measures, such as masking and testing, in addition to vaccination, in many parts of the country.

Methods

COVID-19 Community Level: COVID-19 community level data were sourced from the Centers for Disease Control and Prevention (CDC) “United States COVID-19 Community Levels by County,” using data released on June 2, 2022. Counties lacking a COVID-19 community level were excluded.

COVID-19 Vaccinations: County-level data on COVID-19 vaccinations were sourced from the CDC “COVID-19 Vaccinations in the United States, County” using data reported as June 2, 2022. Only data from the 50 states and District of Columbia were included (data from territories were excluded as territories are not included in the COVID-19 community level dataset). Counties lacking any vaccination data were also excluded from this analysis. In some cases, the residence county is unknown, and therefore these vaccination data cannot be attributed to a specific county. However, for states where only one COVID-19 community level was possible as of June 2, 2022, namely, Arkansas (Low), Delaware (High), the District of Columbia (Medium), and Rhode Island (Medium), vaccination data with unknown county information but attributed to these states were coded as the corresponding COVID-19 community level. Other vaccination data without county information and not attributed to these states were excluded from the analysis. For this reason, we are potentially overestimating the number of people not up to date on vaccination. We define up to date on COVID-19 vaccination as people who have completed a primary series and received a booster. We calculate the number not up to date on COVID-19 vaccination as population in each county minus people who received primary series and booster. We calculate the number of unvaccinated people as the difference between the county population and the number of people who have received at least a first dose of a COVID-19 vaccine. In few counties where the population estimate exceeds the number of people who have received a first dose of the COVID-19 vaccine, the number of unvaccinated individuals is assumed to be 0. We calculate people who are partially vaccinated as the number of people who completed primary series minus those who received at least one dose. We calculate the number of people that have completed a primary series but not received a booster as the difference between the number of people who have completed a primary series and the number of people who have received a booster dose. Although the CDC now recommends that all immunocompromised individuals and people over the age of 50 receive a second booster dose, there are currently no county-level data available on the number of booster doses received. Therefore, we are unable to capture how many individuals are fully up to date on COVID-19 vaccines. (An earlier version of this analysis stated there were 100 million people who were not up-to-date on vaccines in counties with elevated risk. We have updated this analysis to include 20 million partially vaccinated people for a total of 120 million people.)

Demographics and Health Insurance Coverage of Nonelderly Adults With Mental Illness and Substance Use Disorders in 2020

Published: Jun 6, 2022

The pandemic has worsened underlying mental illness and substance use disorders, particularly for some subgroups, and challenges accessing treatment may have increased. In this issue brief, we use 2020 data from the National Survey on Drug Use and Health (NSDUH) to examine key characteristics, coverage and health status of nonelderly adults with mental illness or substance use disorders to help inform ongoing federal and state efforts to improve quality and expand access.

This analysis relies on the NSDUH definitions of mild, moderate, or serious mental illness using DSM-IV criteria. Those with serious mental illness (SMI) often have difficulties with daily living activities, comorbid conditions like substance use disorders and physical conditions, and in general, people with mental illness die earlier than those without. NSDUH uses DSM-V diagnostic criteria to assess the presence of substance use disorders. These disorders are categorized into mild, moderate, and severe groups depending on symptom severity. In addition to legal substances such as alcohol and sometimes marijuana, substance use disorders can also involve illicit substances such as opioids and cocaine. Due to the pandemic, NSDUH data is limited to the first and fourth quarter of 2020, with survey data collection shifting from in-person interviews to web-based surveys, so data cannot be compared to other years. Small sample sizes prevent subgroup analyses among the uninsured population.

Key findings include the following:

  • Mental illness and substance use disorders affects one-third (64.5 million) of all nonelderly adults in 2020 and are most prevalent among young adults and White people. Other data and research point to worsening mental health for young adults and people of color during the pandemic. The lower rates among people of color may reflect underdiagnosis among these groups. Data show that women have higher rates of mental illness, while men have higher rates of substance use disorder.
  • Most nonelderly adults with mental illness or substance use disorder are covered by private insurance (58%), but Medicaid enrollees are more likely to experience those conditions. Medicaid enrollees also have the highest overall prevalence of moderate to severe mental illness or substance use disorders.
  • Among nonelderly adults with a moderate to severe mental illness or substance use disorder, Medicaid enrollees are more likely than those with private insurance to have chronic health conditions and to report fair or poor health.

What is the prevalence of mental illness and substance use disorders and what are the characteristics of people with these conditions?  

One-third (33%) of all nonelderly adults have a mental illness or substance use disorder.  Mental illness affects 23% (45.3 million) of nonelderly adults, with 11% having mild conditions, 6% moderate, and 6% severe conditions. Approximately 18% (34.7 million) of nonelderly adults experience some form of substance use disorder, with milder disorders (10%) accounting for the majority. People with severe mental illness and substance use disorders often have complex health needs including multiple comorbidities, more difficulties with daily living, and a higher likelihood of premature death. An estimated 8% (15.5 million) have both and a mental illness and a substance use disorder and combined, 33% (64.5 million) of nonelderly adults have a mild, moderate, or severe mental illness or substance use disorder (Figure 1).

Share of Nonelderly Adults with Mental Illness or Substance Use Disorder in 2020

Mental illness or substance use disorder is most common in young adults and nonelderly White people. Mental illness is most common in young adults aged 18 to 25 (30%) and lowest in adults 50 to 64 (17%). Among young adults aged 18 to 25, the rate of substance use disorders is 24%, twice as high as that of adults aged 50 to 64 (12%). More than one-quarter (26%) of White people experience mental illness; this is the highest rate of any race or ethnicity. White people are more likely to report substance use disorders (19%) compared to Hispanic people (14%) and Black people (16%). These findings for higher rates hold true for mild, moderate and severe mental illness and substance use disorder and for concurrent mental illness and substance use disorder (Figure 2). Other data and research point to worsening mental health for young adults and people of color during the pandemic. A lack of culturally sensitive screening tools that accurately detect mental illness, coupled with structural barriers, may lead to underdiagnosis of  mental illness among people of color.

Women have higher rates of mental illness, while men have higher rates of substance use disorder. Compared to men, women are more likely to experience mental illness (29% versus 17%). However, in contrast to mental illness, substance use disorders are more common in males than females (20% versus 15%) (Figure 2).

Prevalence of Mental Illness and Substance Use Disorder in Nonelderly Adults by Demographic Characteristics

How are nonelderly adults with mental illness and substance use disorders covered and how does prevalence vary by coverage?  

Private insurance covers most nonelderly adults with mental illnesses and substance use disorders. Private insurance covers the majority of nonelderly adults with any mental illness (58%) and any substance use disorder (57%); combined, this represents over 37 million people with either condition covered by private insurance. Despite only covering 18% of the nonelderly adult population, Medicaid covers 23% of those with any mental illness and 21% of those with any substance use disorder, or an estimated 13.9 million people (Figure 3).

Distribution of Mental Illness and Substance Use Disorder in Nonelderly Adults, by Coverage Type

Mental illness and substance use disorders are most prevalent among nonelderly adults with Medicaid. As of 2020, an estimated 29% of Medicaid enrollees have a mental illness, relative to 21% of privately insured and 20% of uninsured people. About one in five (21%) Medicaid beneficiaries have a substance use disorder, similar to uninsured people (19%), but higher than privately insured people (16%). Further, Medicaid enrollees have the highest overall prevalence of moderate to severe mental illness or substance use disorders. Combined, 39% of Medicaid enrollees have a mental illness and/or substance use disorder, relative to 31% of privately covered and uninsured people. An estimated 11% of adults with Medicaid have both and a mental illness and a substance use disorder, relative to 7% of privately covered and 8% of uninsured people (Figure 4).

Share of Nonelderly Adults with Mental Illness or Substance Use Disorders in 2020, by Coverage Type

Among nonelderly adults with a moderate or severe mental illness or substance use disorder, Medicaid enrollees are more likely than those with private insurance to have chronic health conditions and to report fair or poor health. There is a high comorbidity between mental conditions and chronic physical conditions, which increases with severity of symptoms. The relationship is bidirectional, with physical conditions sometimes increasing the risk for mental conditions, and vice versa. Medicaid enrollees with moderate to severe mental illness or substance use disorders are more likely to report chronic conditions than those with private coverage, and a higher share reports two or more chronic conditions. Further, Medicaid enrollees with severe/moderate mental illness or substance use disorders report fair to poor health over twice as often as privately insured (36% and 13%, respectively) (Figure 5).

Health Status of Nonelderly Adults with Moderate or Severe Mental Illness or Substance Use Disorder in 2020

What are key issues to watch looking ahead?

As policy makers attempt to structure policy responses to address mental health and substance disorder needs, it is important to understand the coverage and characteristics of people experiencing these issues.  At the state level, states are implementing an array of policies to address mental illness and substance use disorders including policies to expand access through Medicaid. States will also be largely responsible for implementing the new ‘988’ hotline, including how to sustainably fund it. At the federal level, bipartisan efforts have formed to address the mental health crisis, including mental health packages and a legislative agenda from the Addiction and Mental Health Task Force, as well as federal monitoring of insurer mental health parity violations. The Biden administration announced its National Drug Control Strategy to combat addiction and the opioid epidemic and the Unity Agenda proposes improving behavioral health workforce capacity, improving access to care in integrated settings, and expanding insurer coverage requirements. Gaps in the delivery of behavioral health care are longstanding and complex, but emerging initiatives seek to improve access to and quality of services.

News Release

Community Health Centers Have Experienced Increased Demand for Social Services During the Pandemic and Have Added Capacity for Mental Health

Published: Jun 3, 2022

Community health centers have seen a rise in patients seeking non-medical services such as housing, food, nutrition, and transportation during the pandemic and have added new mental health and substance use disorder (SUD) services in response to growing need, according to a new KFF survey.

Over half of the health centers that responded to the survey said that, amid the economic disruption of the pandemic, more patients are seeking social and supportive services that complement primary care. A majority of centers reported providing on-site health literacy (71%) and transportation services (63%), while at least 4 in 10 report providing SNAP, WIC, or other nutritional services (44%) and healthy food options, such as an on-site food pantry or meal delivery (42%).

Nearly two-thirds of health centers said they added new in-person or virtual mental health services, including individual and group therapy services. And roughly half of health centers (48%) saw an increase in patients with opioid use disorder during the pandemic, with a rising share of health centers providing medication-assisted treatment services. These services were added at a time when health centers were also rolling out vaccination campaigns and other pandemic-related services in underserved communities.

The survey of community health centers, conducted in late 2021, probed the pandemic’s effect on services, the challenges health centers face and their preparedness for the unwinding of the public health emergency declaration.

Other key survey findings include:

  • While health centers ramped up telehealth services during the pandemic, nearly all cited patients’ lack of internet access (97%) and lack of comfort using telehealth technology (93%) as major or minor challenges.
  • Eighty-five percent of responding health centers cited staffing shortages as a challenge in providing social and supportive services. The vast majority also cited staffing issues as a barrier to providing mental health and substance use disorder services.
  • Eighty-one percent of responding health centers reported that it was very or somewhat difficult to schedule a specialist appointment for uninsured patients. Sixty-three percent reported difficulties scheduling such appointments for Medicaid fee-for-service patients, and 58 percent reported difficulties for Medicaid managed care patients.

In a separate policy watch, KFF analysts explain what steps community health centers are taking to prepare for the end of the federal public health emergency, during which states have been required to provide continuous coverage for Medicaid enrollees in order to receive enhanced federal funding during the pandemic. As of late 2021, roughly two-thirds of health centers were planning or taking actions to help their patients retain coverage, including reaching out to patients directly, increasing staff time on enrollment activities, and coordinating with legal services organizations.

Community Health Centers Are Taking Actions to Prepare for the Unwinding of the Public Health Emergency

Authors: Jennifer Tolbert, Lina Stolyar, and Bradley Corallo
Published: Jun 3, 2022

Community health centers, a national network of safety-net primary care providers serving low-income, medically underserved communities, also assist their patients and low-income community members with applying for and enrolling in health coverage, including Medicaid, the Children’s Health Insurance Program (CHIP), and Marketplace plans. Given this dual role, health centers are poised to be on the front lines of the unwinding of the Medicaid continuous enrollment requirement when the public health emergency (PHE) ends.

Provisions in the Families First Coronavirus Response Act (FFCRA) require states to provide continuous coverage for Medicaid enrollees until the end of the month in which the PHE ends in order to receive enhanced federal funding. The current PHE runs through July 15, 2022; however, it is expected to be extended for at least another three months. The Biden Administration has said that it will give states a 60-day notice before the PHE expires. When the PHE ends, states will begin processing redeterminations, and recent estimates indicate that between 5.3 million and 14.2 million Medicaid enrollees could lose coverage if they are no longer eligible or face administrative barriers despite remaining eligible.

Nearly half of health center patients are covered by Medicaid, meaning large coverage losses could have significant effects for health centers and their patients. Throughout the pandemic, health centers have provided a broad range of services to their Medicaid and other patients, including COVID-19 testing, treatment and vaccinations, mental health and opioid use disorder services, as well as social and supportive services. In 2020, health centers served over 13 million Medicaid patients who comprised 46% of total health center patients that year. The number and share of Medicaid patients served by health centers have likely increased since then as total Medicaid enrollment has continued to grow over the past year. As such, health centers have the ability to reach about one in six Medicaid enrollees through their patients alone and can reach even more by providing outreach and assistance to community members who are not patients.

With funding for enrollment activities included in their federal grants, health centers are able to employ staff and provide outreach and enrollment assistance throughout the year. In 2020, health centers employed over 4,200 enrollment assisters and provided over 3.5 million assists to individuals seeking help in applying for or renewing coverage. Those numbers are down slightly from 2019 when health centers employed over 4,400 enrollment assistance staff and provided about five million assists. Both staffing and enrollment assistance visits will likely need to increase in the coming year If health centers hope to meet expected demand for assistance.

Anticipating the end of the PHE, health centers are taking steps to prepare, including by contacting patients and bolstering enrollment staff. According to findings from a survey of health centers conducted in late 2021, roughly two-thirds (66%) of health centers were planning or taking actions to help their patients retain coverage when the PHE expires (Figure 1). Overall, just under half of health centers had already begun reaching out or planned to reach out to patients to assist them with renewing coverage:

  • 47% said they would schedule or were planning to schedule advance appointments to assist patients with coverage renewals;
  • 47% planned to send reminders to patients regarding the need to renew coverage; and
  • 46% said they would identify all patients at risk of losing coverage and flag their charts for reminders.

Health centers also reported plans to boost enrollment assistance staff capacity:

  • 43% planned to increase staff time on enrollment activities (23% said they were already increasing staff time) and
  • 41% had hired or planned to hire new staff.
Share of Health Centers Taking or Planning Select Actions in Preparation for the Unwinding of Continuous Enrollment Requirement

Health centers can be effective in raising awareness about Medicaid renewal requirements and in providing the help needed for enrollees to maintain Medicaid or transition to other coverage. The Centers for Medicare and Medicaid Services (CMS) encourages states to reach out to key stakeholders as they develop their plans for resuming normal operations. As of late 2021, about one in five health centers said they had received information from their state or primary care association regarding their state’s plan. That number is expected to increase as states finalize their plans and once there is greater clarity on when the PHE will end. Until then, health centers appear to be moving forward with their own plans for providing outreach and assistance to underserved and medically vulnerable Medicaid enrollees.

How Community Health Centers Are Serving Low-Income Communities During the COVID-19 Pandemic Amid New and Continuing Challenges

Authors: Jessica Sharac, Lina Stolyar, Bradley Corallo, Jennifer Tolbert, Peter Shin, and Sara Rosenbaum
Published: Jun 3, 2022

Executive Summary

Community health centers are a national network of safety-net primary care providers serving low-income, medically underserved communities. In addition to providing comprehensive primary care services, health centers have aided in national, state, and local responses to the coronavirus pandemic by providing a range of services designed to slow the spread and lessen the severity of COVID-19. Based on findings from a national survey of health centers, this brief examines how the pandemic has affected health center patients and services as well as the ongoing challenges health centers and their patients face. Key findings include:

Impact of the Pandemic on Health Center Patients and Services

  • Health centers increased their use of telehealth services in response to the pandemic. The pandemic necessitated a rapid expansion of health centers’ telehealth services as patients avoided in-person care due to the risk of infection, federal guidance to avoid nonessential care, and social distancing requirements. While in-person visits have rebounded, health centers’ use of telehealth services continues to be higher than before the pandemic.
  • Health centers reported an increase in the number of patients seeking housing, food and nutrition, and transportation services due to the economic disruptions caused by the pandemic. Health centers provide a range of social and supportive services to complement primary care. Compared to before the pandemic, over half of responding health centers said they saw an increase in the number of patients seeking housing services, food and nutrition services, and transportation services. A majority of responding health centers reported providing health literacy (71%) and transportation services (63%) on-site, while at least four in ten reported providing SNAP, WIC, or other nutritional services (44%) and healthy food options, such as a food pantry or meal delivery (42%), on-site.
  • In the wake of a growing need for mental health and substance use disorder (SUD) services during the pandemic, health centers added new services. Since the start of the pandemic, 64% of health centers reported adding at least one new mental health or SUD service (including new telehealth options). However, health centers indicated that staffing shortages and patients’ inability to access services through telehealth (e.g., due to lack of internet access or computers/phones) as the most common challenges to providing mental health and SUD services.
  • The share of health centers providing medication-assisted treatment (MAT) for treating opioid use disorder (OUD) increased during the pandemic. Roughly half of health centers (48%) saw an increase in patients with OUD compared to the start of the pandemic. The number of health center patients nationally who received MAT for OUD grew by 27% from 2019 to 2020, spurred by an infusion of federal grants for behavioral health services at health centers in the years leading up to the pandemic and the ongoing need for these services.

Key Issues to Watch

  • Health centers face ongoing challenges recruiting and retaining staff and financial implications related to changes to the 340B Drug Discount Program. Among responding health centers, recruiting new employees and retaining current employees were cited as top challenges by 78% and 54% of responding health centers, respectively, and are consistent with challenges reported in previous years. Looking ahead, health centers may face financial challenges as they transition out of the pandemic. A majority of health centers reported that certain actions by pharmaceutical manufacturers and pharmacy benefit managers (PBMs) related to access to and reimbursement for 340B drugs have had a negative effect on revenue.
  • The unwinding of the Medicaid continuous enrollment requirement could lead to coverage disruptions for many health center patients and revenue declines for health centers. The loss of Medicaid coverage among health center patients could lead to an increase in uncompensated care costs for health centers. At the same time, the temporary infusion of federal COVID-19 grant funding for health centers will end and federal funding for some programs that helped health centers during the pandemic, such as the HRSA COVID-19 Uninsured Program, faces an uncertain future.


Issue Brief

Introduction

Community health centers are a national network of safety-net primary care providers serving low-income, medically underserved communities. In addition to providing comprehensive primary care services, health centers have aided in national, state, and local responses to the coronavirus pandemic by providing a range of specific services designed to slow the spread and lessen the severity of COVID-19. These include providing both rapid and PCR tests, administering vaccines, and distributing masks and testing supplies and oral antiviral pills, while continuing to treat the ongoing health needs of their patients.

Additional federal grant funding made available during the pandemic has helped health centers to respond to the needs of their patients and weather the financial uncertainty related to the pandemic. However, health centers face uncertainty on a number of fronts, including the unwinding of the Medicaid continuous enrollment requirement and the loss of temporary telehealth flexibilities when the COVID-19 public health emergency (PHE) ends, as well as the lack of additional federal COVID-19 funding for programs like the Health Resources and Services Administration’s (HRSA’s) COVID-19 Uninsured program.

To understand how the pandemic has affected health center patients and services as well as the challenges health centers and their patients face, KFF and the Geiger Gibson/RCHN Community Health Foundation Research Collaborative at the George Washington University surveyed health centers in the 50 states and District of Columbia (DC). This survey was conducted in late 2021 and focused on the pandemic’s effect on services, the effects of policies on health center programs, the impact of changes made to the 340B Drug Discount Program, preparedness for the PHE unwinding, and the challenges health centers face. This brief presents survey findings for all responding health centers and also reports data from an ongoing biweekly survey conducted by HRSA.

Impact of the Pandemic on Health Centers and Their Patients

Responding to Changing Patient Needs

Health centers’ use of telehealth services increased during the pandemic. The pandemic necessitated a rapid expansion of health centers’ provision of telehealth services amid a decline in in-person visits as patients avoided in-person care due to the risk of infection, federal guidance to avoid nonessential care, and social distancing requirements. As a result, the use of telehealth increased compared to prior to the pandemic and peaked in April 2020 when more than 50% of visits on average were conducted virtually. The most recent data as of May 2022 show that telehealth visits have decreased somewhat, with about 15% of visits on average provided virtually, but still remain higher than pre-pandemic levels.

Telehealth has helped to maintain or improve access to care during the pandemic, but health centers reported challenges in providing virtual services to patients. Nearly all responding health centers cited lack of internet access among patients (97%) and lack of comfort using telehealth technology among patients (93%) as major or minor challenges to providing telehealth services (Figure 1). Additionally, over seven in ten responding health centers (72%) reported inadequate reimbursement for audio-only or telephonic telehealth services as a challenge.

Top Five Challenges for Health Centers in Providing Telehealth Services

Temporary policies enacted in response to the pandemic enabled health centers’ pivot to telehealth services; ending these policies could lead health centers to reduce the use of telehealth. During the public health emergency, many state Medicaid agencies, Medicare, and private insurers enacted temporary telehealth policies to improve accessibility and to provide enhanced reimbursement for telehealth. Additionally, the federal government, through the Federal Communications Commission, also provided one-time grant funding to providers (including health centers) to increase access to telehealth during the pandemic. Nearly eight in ten responding health centers (79%) reported that they would reduce the use of telehealth if these temporary telehealth flexibilities put in place by state Medicaid agencies and other payers do not remain in place.

Health centers contributed to COVID-19 vaccination, testing, and treatment efforts, reaching underserved and vulnerable populations. Supported by temporary federal grants in response to the pandemic as well as a number of national programs directly supplying health centers with tests, vaccines, therapeutics, and masks, health centers began providing new COVID-19-related services in 2020 and became an important national resource for equitably distributing these services in underserved communities. For example, according to data from a biweekly survey conducted by the Health Resources and Services Administration (HRSA), health centers have reported administering1  more than 20 million vaccine doses (roughly 4% of all vaccinations), with more than two-thirds (69%) of vaccine doses administered to people of color. Health centers that responded to our 2021 survey reported taking actions to increase COVID-19 vaccinations uptake, including by encouraging staff to talk to patients about the vaccine during visits (96%), posting information about the vaccine on social media (92%), and conducting community outreach (71%). The HRSA survey also revealed that roughly three in ten health centers utilized mobile vans, pop-up clinics, or other events out in the community to provide the vaccine and conduct outreach in May 2022.

Increased Demand for Services

Social Services

Health centers provided a range of social and supportive services both on-site and through referrals. A majority of responding health centers reported providing health literacy (71%) and transportation services (63%) on-site, while at least four in ten reported providing SNAP, WIC, other nutritional services (44%), healthy food services (42%), and education services (40%) (Appendix Table 1). We did not ask about case management, which is a required service of the Health Center Program and should be offered on-site or through referral at all health centers.

Health centers reported an increase in the number of patients seeking housing, food and nutrition, and transportation services during the pandemic. The pandemic caused economic disruptions, particularly for lower-income workers and families and contributed to an increased need for certain social services. Compared to before the pandemic, over half of responding health centers said they saw an increase in the number of patients seeking housing services (69%), food and nutrition services (63%), and transportation services (53%) (Figure 2).

Share of Health Centers That Saw Increases in Select Social and Supportive Services Since the Start of the Pandemic
Mental Health and Substance Use Disorder Services

With an uptick in mental health problems, substance use disorders (SUD), and difficulty accessing behavioral health care during the pandemic, health centers have sought to expand access to these services. Going into the pandemic, nearly all health centers provided mental health services on-site and most provided SUD services. By late 2021, over six in ten (64%) health centers reported that they added a new mental health or SUD service. Almost half of responding health centers (47%) added individual therapy as a new service in-person, via telehealth, or both, while around one in five of responding health centers added group therapy and support groups as a new service (21% and 18%, respectively) (Figure 3). Additionally, about a third added counseling (34%) or medication (31%) for medication-assisted treatment (MAT) for opioid use disorder (OUD) as a newly offered in-person or virtual service since the start of the pandemic.

Share of Health Centers That Added Mental Health or Substance Use Disorder (SUD) Services During the Pandemic
Opioid Use Disorder Services

Many health centers saw an increase in patients with OUD compared to the start of the pandemic. Health centers have historically played a significant role in addressing the opioid crisis as community-based providers with the capacity to provide medication-assisted treatment (MAT) for treating opioid use disorder (OUD). Increasingly, health centers are providing MAT, the standard of care, for OUD treatment. Prior to the pandemic, between 2016 and 2019, HRSA awarded more than $1.4 billion in federal grants to enable health centers to expand access to mental health and substance use disorder (SUD) services. Health centers used these grants to increase staff, improve the integration of behavioral health and primary care, and expand delivery of MAT services.

The number of health center patients nationally who received MAT for OUD has grown substantially during the pandemic, likely reflecting the infusion of funding for behavioral health services for health centers in the years leading up to the pandemic and the ongoing need for these services. Additionally, four in ten responding health centers saw an increase in patients with a prescription OUD and 42% saw an increase in non-prescription OUD compared to the start of the pandemic (Figure 4).

Share of Health Centers Reporting an Increase in the Number of Patients with Opioid Use Disorder Compared to Before the Pandemic

The share of health centers providing MAT increased during the pandemic. Drug overdose deaths increased by 39% nationally from March 2020 to December 2021 and, along with a reported increase in OUD patients, more health centers reported that they provided on-site MAT services for OUD. Over seven in ten (71%) responding health centers reported that their health center provides MAT medication on-site—62% provide MAT medications with OUD counseling and 9% provide only MAT medications—up from 64% in 2019 (Figure 5). The capacity of health centers to provide MAT services has also increased. Over six in ten (61%) responding health centers reported having the capacity to treat all patients who seek MAT services on-site, compared to 53% in 2019 (Figure 5).

Share of Health Centers That Provide Select Medication-Assisted Treatment Services

Most health centers that provide MAT services for OUD offer more than one medication, giving providers more options to meet patients’ needs. OUD treatment includes the use of one of three medications (methadone, naltrexone, and buprenorphine) along with counseling. Of responding health centers that provide MAT services, two-thirds (67%) provided two OUD medications on-site, up from 60% in 2019, and 4% offer all three medications.

Challenges Facing Health Centers

Managing Patient Needs

While most health centers reported being able to see new patients in a timely manner for routine medical and SUD services, fewer health centers said they could schedule mental health and dental visits within two weeks. Close to three-fourths of responding health centers said that new patients could schedule a routine medical visit (76%) or SUD service visit (73%) on a walk-in basis or within two weeks (Figure 6). Smaller shares of responding health centers said that new patients could make a mental health service appointment on a walk-in basis or within two weeks (61%) and 40% said that new patients could schedule routine dental visits in the same time frame. These findings may reflect both the effects of the pandemic, as well as continuing challenges in providing these services that predate the pandemic.

Wait Times for New Patients for Services at Health Centers

Health centers reported difficulties scheduling timely medical appointments for patients with specialists outside of their health centers, especially for uninsured and Medicaid patients (Figure 7). Over eight in ten (81%) responding health centers reported that it was very or somewhat difficult to schedule an appointment with a specialist for their uninsured patients, while 63% reported difficulties scheduling appointments for Medicaid fee-for-service patients (FFS), which was comparable to the share that reported difficulties for Medicaid managed care patients (58%). Over two-thirds of health center patients are uninsured or enrolled in Medicaid. Fewer health centers reported challenges scheduling appointments for their Medicare (37%) or privately insured patients (28%). Additionally, roughly half of responding health centers said that increased availability of telehealth during the pandemic made no difference in helping to obtain timely appointments with specialists outside their organization, despite the nearly universal increase in telehealth use during the pandemic at health centers and most other outpatient providers. Only about one-third of responding health centers said telehealth made scheduling appointments with specialists outside their organization easier while 10% or less said telehealth made obtaining outside appointments harder.

Scheduling Appointments With Specialists Outside of Health Centers for Patients by Insurance Type

Despite the increased need for certain mental health, SUD, and social and supportive services, health centers cited staffing shortages as the top challenge to providing these services (Figure 8). Almost nine in ten (85%) responding health centers cited staffing shortages as a challenge in providing social and supportive services while nearly eight in ten (79%) and seven in ten (69%) reported staffing issues as a barrier to providing mental health and SUD services, respectively. While health centers have been able to shift to telehealth, especially for mental health visits, almost half of responding health centers cited patients’ inability to access mental health and SUD services through telehealth as a common challenge (50% for mental health and 49% for SUD services). Other barriers to providing social and supportive services included lack of reimbursement, cited by 71% of responding health centers, and lack of physical space for services, cited by 67% of health centers. Fewer health centers reported these barriers to providing mental health and SUD services.

Share of Health Centers Reporting Select Challenges in Providing Mental Health, SUD, and Social and Supportive Services

Key Issues to Watch

Health centers face new challenges related to access to and reimbursement from the 340B Drug Discount Program. The 340B Drug Discount Program provides discounted prescription medications to safety net providers, including health centers, allowing them to pass on saving to their patients and to support operations. Virtually all responding health centers (96%) reported that they participate in the 340B Drug Discount Program either through on-site pharmacies or through contracts with outside pharmacies. Among responding health centers that participate in 340B, 86% indicated that they contract with an outside pharmacy to provide 340B drugs to their patients. Recently, pharmaceutical manufacturers have limited the sale of 340B drugs to contract pharmacies. In addition, some pharmacy benefit managers (PBMs), which help to administer and manage prescription drug benefits on behalf of health insurers or state Medicaid agencies, are paying lower rates to 340B-qualified entities than to non-340B entities. Nearly seven in ten (69%) responding health centers with contract pharmacies in the 340B program reported that manufacturers’ restrictions on contract pharmacies have had a negative impact on revenue, and over half (52%) of responding health centers said PBMs’ practice of paying lower rates to 340B entities has had a negative impact on their revenue. A smaller share of responding health centers (28%) said state policy decisions to shift pharmacy benefits from Medicaid managed care to Medicaid fee-for-service had a negative effect while 44% said they did not know the impact.

The end of the continuous enrollment requirement will likely affect millions of Medicaid enrollees, creating uncertainty for health centers and their patients. Provisions in the Families First Coronavirus Response Act (FFCRA) require states to provide continuous coverage for Medicaid enrollees until the end of the month in which the public health emergency (PHE) ends in order to receive enhanced federal funding. The current PHE is in place until mid-July 2022 though it is likely to be extended again. When the PHE ends, states will begin processing redeterminations and many health center patients could lose coverage if they are no longer eligible or face administrative barriers despite remaining eligible. Recent estimates show that between 5.3 million and 14.2 million Medicaid enrollees could lose coverage following the end of the PHE. Most health centers (66%) reported they have taken or plan to take actions to boost eligibility staff to assist their patients with renewals. However, the loss of Medicaid coverage among patients could have financial implications for health centers.

Staff recruitment and retention remain common concerns at health centers nationally. Consistent with challenges in providing key health services, among responding health centers, recruiting new employees and retaining current employees were cited as top overall challenges by 78% and 54% of responding health centers, respectively (Figure 9). These workforce issues, perennial challenges for health centers, have been exacerbated by the pandemic. Inadequate physical space (30%), decreased patient visits (24%), and changes to the 340B program (21%) were also among the top challenges for responding health centers. The share of health centers reporting increasing costs to operate health centers and a high number of uninsured patients as top challenges declined from previous years. In 2019, roughly half (52%) of health centers cited increased operating costs as a major challenge and 24% cited high numbers of uninsured patients. In contrast, in 2021, less than one-third cited increasing operational costs (whether due to COVID-19-related expenses or for other reasons) and just over 10% reported uninsured patients as a major challenge. However, the situation could shift again with the end of the public health emergency if expected coverage losses occur and lead to increased financial strain.

Share of Health Centers Reporting Select Challenges

Conclusion

The COVID-19 pandemic has been disruptive for health centers, as for other health care providers, and health centers have adapted to meet patient needs. The pandemic led to declines in utilization of certain services and forced health centers to shift the services they offer and how they deliver care. In response, health centers pivoted to providing telehealth services and have played an active role in COVID-19 testing and vaccination efforts, aided by temporary federal COVID-19 relief funding. They have also responded to the mental health crisis that surfaced during the pandemic by increasing access to mental health, SUD, and OUD services.

Looking ahead, the financial and operational disruptions that health centers have confronted throughout the pandemic will not abate overnight when the PHE declaration ends. Patients will continue to need care, but many are likely to lose Medicaid coverage as states unwind the Medicaid continuous enrollment requirement and, in turn, health centers could see an increase in uncompensated care costs. At the same time, the temporary infusion of federal COVID-19 grant funding for health centers will end and future federal funding for some programs that helped health centers during the pandemic, such as the HRSA COVID-19 Uninsured Program, face an uncertain future. Moreover, ongoing actions by pharmaceutical manufacturers and PBMs limiting access to and reimbursement for 340B drugs have had a negative effect on some health centers’ budgets. In addition to these continued financial uncertainties, health centers are facing ongoing workforce challenges that have been exacerbated by the pandemic. How health centers transition out of the pandemic and address these concurrent challenges will affect how low-income communities access primary care and related services.

Methods

The National Survey of Community Health Centers and Their Response to the Coronavirus Pandemic and Changes to the 340B Program (“2021 survey”) was conducted by KFF and the Geiger Gibson Program in Community Health Policy at the George Washington University in partnership with the National Association of Community Health Centers (NACHC) and supported by the RCHN Community Health Foundation. The survey was fielded from September to December 2021 to the CEOs or project directors of 1,342 federally-funded health centers in the 50 states and the District of Columbia (DC) listed in the 2020 Uniform Data System (UDS). There were 357 responses from 48 states and DC, with a resulting 27% response rate. We verified that there were no duplicate responses from any one health center and that every response answered at least one question in addition to identifying information, which was our criteria for inclusion in the analysis. The survey data were weighted using 2020 UDS data on patient size (total patients), share of patients who are racial/ethnic minorities, and total revenue per patient.

Additional funding support for this brief was provided to the George Washington University by the RCHN Community Health Foundation.

Appendix

Appendix Table 1: Share of Health Centers That Provide Select Social and Supportive Services

Endnotes

  1. Health centers report the number of vaccinations received by health center patients in the HRSA Health Center COVID-19 Survey. The survey’s questionnaire asks health centers to report the total number of patients receiving a vaccine, and HRSA has clarified that this count includes health center patients receiving vaccinations anywhere, including in settings other than the health center. However, we expect that health centers delivered the vast majority of vaccinations reported in the survey, and the number of patients reported through the survey receiving their vaccinations elsewhere is likely minimal. ↩︎

Traditional Medicare Spending Fell Almost 6% in 2020 as Service Use Declined Early in the COVID-19 Pandemic

Published: Jun 1, 2022

In 2020, spending for traditional Medicare beneficiaries declined for the first time in more than two decades. The drop in spending followed the sharp decline in the use of health care services during the initial months of the COVID-19 pandemic, and reflects a decrease in spending among traditional Medicare beneficiaries on most health care goods and services. The lower spending in traditional Medicare contributed to the relatively slower growth in Medicare spending overall in 2020. However, total Medicare spending increased in 2020 because federal payments per Medicare Advantage enrollee rose 6.9%. Medicare Advantage payments were determined in mid-2019 prior to the pandemic, and therefore, did not reflect the lower utilization that occurred in 2020.

This analysis uses recently released data from the Centers for Medicare & Medicaid Services (CMS) to examine trends in spending and utilization by type of health care service between 2010 and 2020 for Medicare beneficiaries who were enrolled in both Part A and Part B of traditional Medicare. (Similar data for beneficiaries enrolled in Medicare Advantage or for prescription drug spending are not available.) The data include both Medicare and beneficiary out-of-pocket spending on Part A and Part B covered services, but not Part D prescription drug spending. Understanding how spending and utilization changed across different types of services in 2020 is useful for identifying areas where beneficiaries delayed or skipped care in response to the pandemic, which could have longer-term implications for health outcomes and Medicare spending.

We find that Medicare spending declined across most, but not all, types of services, as a smaller share of beneficiaries used most types of Medicare-covered health care services in 2020 compared to 2019. Specifically:

  • Total spending on Part A and Part B services for traditional Medicare beneficiaries was $348.0 billion in 2020, a decrease of 5.8% ($21.4 billion) from 2019.
  • Spending per traditional Medicare beneficiary for Part A and Part B services fell 3.6%, or $402, to $10,739 per person in 2020, compared to $11,142 per person in 2019.
  • The decline in traditional Medicare spending reflects decreases in spending for most types of services, ranging from 0.1% less for durable medical equipment to 13.1% less for procedures, compared to 2019. Only spending on skilled nursing facilities, Part B drugs, and hospice increased in 2020
  • Use of nearly all types of services by traditional Medicare beneficiaries was lower in 2020 compared to 2019. Only three types of services had increases across all measures of utilization: hospice, dialysis, and Part B drugs. Skilled nursing facilities had lower use but higher spending (see KFF analysis, Amid the COVID-19 Pandemic, Medicare Spending on Skilled Nursing Facilities Increased More than 4% Despite an Overall Decline in Utilization).
  • Among traditional Medicare beneficiaries, average spending per user increased for 12 of the 17 types of services examined.

Findings

Spending

total Spending fell 5.8%, or $21.4 billion, for traditional medicare beneficiaries in 2020

Total spending for traditional Medicare beneficiaries was $348.0 billion. That is $21.4 billion, or 5.8%, lower than in 2019 and represents the only year-over-year decline since 2010 (Figure 1).

Total Spending for Traditional Medicare Beneficiaries Declined in 2020

Traditional medicare spending per person was 3.6%, OR $402, lower in 2020 than 2019

The decline in total spending for traditional Medicare beneficiaries was driven by a decrease in spending per person, which fell 3.6%, or $402, in 2020 compared 2019 ($10,739 vs. $11,142) (Figure 2). Although spending per person also declined in 2012 and 2014, the decrease in those years was relatively small ( -0.2% in 2012 and -0.1% in 2014). In addition, there was a small drop in the number of beneficiaries enrolled in traditional Medicare in 2020 (data not shown), continuing a trend of declining enrollment in traditional Medicare as the share of Medicare beneficiaries opting for Medicare Advantage has grown.

Spending Per Person for Traditional Medicare Beneficiaries Fell $402  in 2020

Traditional medicare spending fell across most types of services in 2020

The decrease in Medicare spending reflects a decline in spending for almost all types of Medicare-covered services between 2019 and 2020. The largest declines in dollar terms were for the largest categories of spending: inpatient hospital spending fell $7.9 billion (from $117.1 billion to $109.2 billion, 37.0% of total), outpatient hospital spending fell $5.1 billion (from $60.5 billion to $55.4 billion, 24.1% of total) and evaluation & management (office visit) spending fell $3.7 billion (from $34.3 billion to $30.6 billion, 17.2% of total) (Figure 3 and Table 1).

Inpatient Hospital Services Accounted for Over One-Third of the Decline in Traditional Medicare Spending in 2020

As a percent of 2019 spending for the respective service categories, spending on procedures declined the most, falling 13.1% (from $23.7 billion to $20.6 billion), followed by spending on imaging (-12.9%, from $7.9 billion to $6.9 billion) and spending on Federally Qualified Health Centers/Rural Health Centers (-11.7%, from $2.1 billion to $1.8 billion). In contrast, spending increased for skilled nursing facilities, Part B drugs and hospice (Table 1).

Traditional Medicare Spending Fell Across Most Types of Services in 2020

Utilization

Use of nearly all types of services fell between 2019 and 2020

The share of traditional Medicare beneficiaries using specific types of services fell across most categories and was generally accompanied by a decline in the total number of services provided (Table 2). For example, the largest drop in the share of traditional Medicare beneficiaries using a particular type of service was for imaging services, which was 5.5 percentage points lower in 2020 compared to 2019 (64.7% vs 70.2%). Consistent with this decline, traditional Medicare beneficiaries had 574 fewer imaging events per 1,000 beneficiaries in 2020 than in 2019. Outpatient hospital services had the next largest drop in the share of beneficiaries using the service, declining 4.8 percentage points in 2020 compared to 2019 (from 66.4% to 61.6%). There was a corresponding decrease in the number of outpatient hospital visits, which declined by 702 visits per 1,000 beneficiaries in 2020 compared to 2019. See Appendix table for complete 2019 and 2020 utilization data by service category.

Use of Most Types of Health Care Services Declined Among Traditional Medicare Beneficiaries in 2020

use increased for hospice, dialysis and part b drugs

While use of Medicare-covered services generally declined, the share of beneficiaries using hospice, dialysis and Part B drugs increased very modestly, by less than 1 percentage point, between 2019 and 2020. There was also an increase in the number of hospice stays (+2 stays per 1,000 beneficiaries) and days (+58 days per 1,000 beneficiaries) and the number of dialysis visits (+9 visits per 1,000 beneficiaries) in 2020 compared to 2019 (see Appendix). (The data do not include the number of times beneficiaries used Part B drugs because of reported difficulty in constructing a standardized measure.)

Spending Per User

spending per user increased Across 12 of the 17 service categories

While both spending and utilization declined across most types of services between 2019 and 2020, average spending per user increased for 12 of the 17 categories. In dollar terms, the largest increases were for long-term care hospitals (+$4,364, 10.2%), skilled nursing facilities (+$2,724, 16.3%), inpatient rehabilitation facilities (+$2,269, 9.7%), and inpatient hospital (+$1,825, 8.5%). These increases indicate that the beneficiaries who used inpatient hospital and post-acute care services in 2020 required more intensive, and therefore costly, care than beneficiaries who used these services in 2019. The largest decrease per user was for dialysis (-$431, -1.6%), which also saw an increase in the number of users and number of visits, suggesting that all else equal, the new use was relatively lower cost.

Traditional Medicare Spending Per User Increased Across Most Types of Services in 2020

Discussion

Total spending among the 32 million traditional Medicare beneficiaries with both Part A and Part B fell in 2020, the first year of the COVID-19 pandemic, corresponding to lower service use across most types of Medicare-covered health care services compared to 2019. The lower spending in traditional Medicare contributed to the relatively slower growth in Medicare spending overall in 2020. However, because spending on Medicare Advantage continued to grow, total Medicare spending rose slightly in 2020. Payments to Medicare Advantage plans are determined prior to the plan benefit year (in mid-2019 for 2020) and so did not incorporate the effects of the pandemic on health care utilization, though plans have historically been paid more per enrollee, on average, than similar beneficiaries would have cost in traditional Medicare. Consistent with higher payments and lower utilization, Medicare Advantage plans had higher gross margins and lower medical loss ratios, on average, in 2020 compared to 2019, suggesting that they became more profitable during the pandemic. Enrollment in Medicare Advantage has grown rapidly over the last decade, reaching nearly 40% of all Medicare beneficiaries in 2020, and is projected to exceed 50 percent of total Medicare population by 2025. That growth in enrollment, and the higher growth in spending per Medicare Advantage enrollee compared to traditional Medicare, has contributed to Medicare Advantage accounting for an increasing share of Medicare spending, and contributed to increases in total Medicare spending.

It is not yet known the extent to which the decline in use across most types of health care services may have affected health outcomes of traditional Medicare beneficiaries. The Medicare population is at risk of having negative effects from delaying or forgoing care because they have relatively high health needs. More than one-fifth of Medicare beneficiaries have five or more chronic conditions and almost one-third have at least one functional impairment. It is possible that the decline in use could have negative implications for future health if people delayed routine care and screenings or were unable to schedule procedures in a timely manner, missing the opportunity for early diagnosis and treatment. The drop in utilization also has the potential to lead to higher future health care spending if more health care services are required or if treatments are more intensive. In addition, Medicare beneficiaries were hit hard by COVID-19, with people age 65 and older accounting for a disproportionate share of cases and deaths. While the long-term effects of COVID-19 are not yet known, they are likely to have a greater impact on people ages 65 and older, including corresponding health care use and Medicare spending.

While use of health care services declined sharply in 2020, that did not necessarily translate into a loss of revenue for most providers because of policies adopted by Congress, states, and both the Trump and Biden Administrations. For example, Congress established the Provider Relief Fund, which authorized $178 billion in funding, nearly all of which has been disbursed, to compensate providers for lost revenue and unexpected costs due to the pandemic.

The decline in spending for traditional Medicare beneficiaries in 2020 represents the first decrease in spending since 1999. The previous decline was primarily a result of changes to Medicare provider payments enacted as part of the Balanced Budget Act of 1997. In contrast, the decrease in 2020 was driven by lower use of health care services amid the COVID-19 pandemic. There is a question of whether any of the changes in spending and use will be sustained, though the expectation is that these were most likely one-time, or otherwise short-lived, changes. While actual data for 2021 is not yet available, Medicare spending is projected to have rebounded and is expected to continue to grow in coming years.

This work was supported in part by Arnold Ventures. We value our funders. KFF maintains full editorial control over all of its policy analysis, polling, and journalism activities.

Appendix

Use of Medicare-Covered Services in 2019 and 2020, by Service Type