Ending the Public Health Emergency for Medicaid Home- and Community-Based Services

Authors: Alice Burns, Maiss Mohamed, and Robin Rudowitz
Published: Apr 19, 2023

People who use home- and community-based services (HCBS) are at heightened risk of serious illness or death from exposure to COVID-19 and disproportionately likely to need hospital or nursing facility care if HCBS are unavailable. However, during the pandemic, there were fewer workers available and willing to provide services and extra safety precautions were required to prevent COVID-19 infection. Recognizing those challenges, the federal government provided states with new authorities to maintain access to HCBS during the public health emergency (PHE). The PHE has been in place since 2020 and will end on May 11, 2023. This policy watch explores the potential implications of ending the PHE for Medicaid HCBS programs, including new or continued workforce challenges and potential reductions in patients’ access to care.

In 2020, an estimated 6 million people used HCBS according to CBO estimates. HCBS are provided in peoples’ homes and other non-institutional settings. They include medical and supportive services that assist people with the activities of daily living (such as eating, bathing, and dressing) and instrumental activities of daily living (such as preparing meals, managing medications, and housekeeping). They are provided to people who need such services because of aging, chronic illness, or disability and may include personal care, adult daycare, home health aide services, transportation, and supported employment. Medicare generally does not cover HCBS and in 2020, Medicaid spent $162 billion on HCBS—a majority of the $245 billion in total HCBS spending. Although all states offer some HCBS through Medicaid, most services are optional for states, and states may cover different services for different types of Medicaid enrollees. To be eligible for Medicaid HCBS, individuals must have limited financial resources and significant functional impairments.

How Did States Support Medicaid HCBS During the PHE?

States used several types of authorities when responding to the COVID-19 PHE, including disaster-relief state plan amendments, 1115 waivers, and Appendix K changes to 1915c waivers. When the PHE ends on May 11, 2023, changes made through a disaster-relief state plan amendment or 1115 waiver will also end. Changes made using the Appendix K authority will expire within 6 months of the PHE ending (December 11, 2023). With 437 changes to HCBS programs made under Appendix K, it was the most widely used authority. Examples of Appendix K uses include changing processes for determining eligibility, authorizing services, and paying providers; expanding provider qualifications or which providers are eligible to be paid; and expanding the service delivery models. Some changes have ended already, others have been transitioned to permanent authorities, and some will end between May and November 2023 if not also transitioned.

In a survey of states on Medicaid HCBS in 2022, many states reported using PHE authorities to bolster their HCBS programs by expanding eligibility and services and addressing workforce challenges (Figure 1). Within the category of eligibility and enrollment, nearly all states reported making it easier for people to access HCBS through virtual evaluations (49 states), 10 states reported increasing the number of waiver slots, and 5 states reported increasing eligibility limits. In terms of services, the most common change was providing HCBS via telehealth (47 states), followed by increasing utilization limits (37 states). Half of the states added new HCBS and around a quarter removed prior authorization requirements.

Many states reported that they planned to continue the PHE policies after the authority expires, but in other cases, states expect the policies will end or have not yet decided.  Fewer than half of states that allowed virtual evaluations reported plans to continue doing so after the PHE ends, and eligibility levels will return to their pre-pandemic levels in at least four of the five states with higher limits. Most states reported that they plan to continue providing HCBS via telehealth, but prior authorization and utilization limits may return to pre-pandemic levels in half or more of states that had made changes.

States Used Public Health Emergency Authorities to Make Wide-Ranging Changes to Their Medicaid HCBS Programs

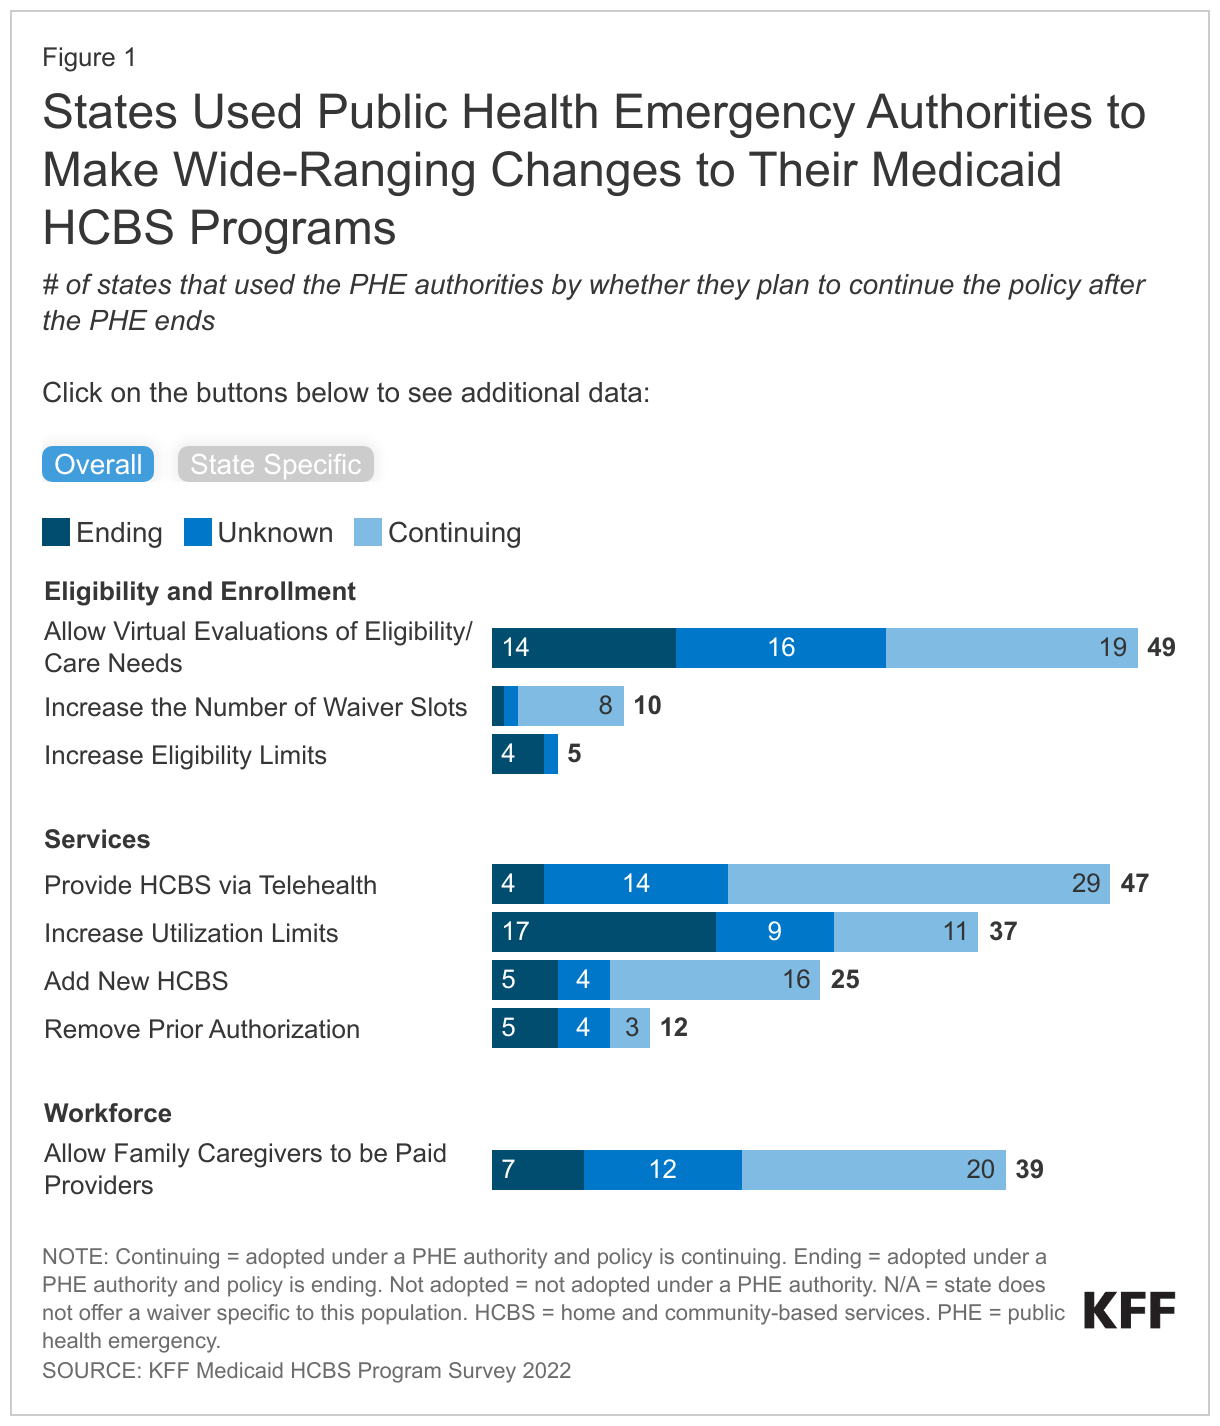
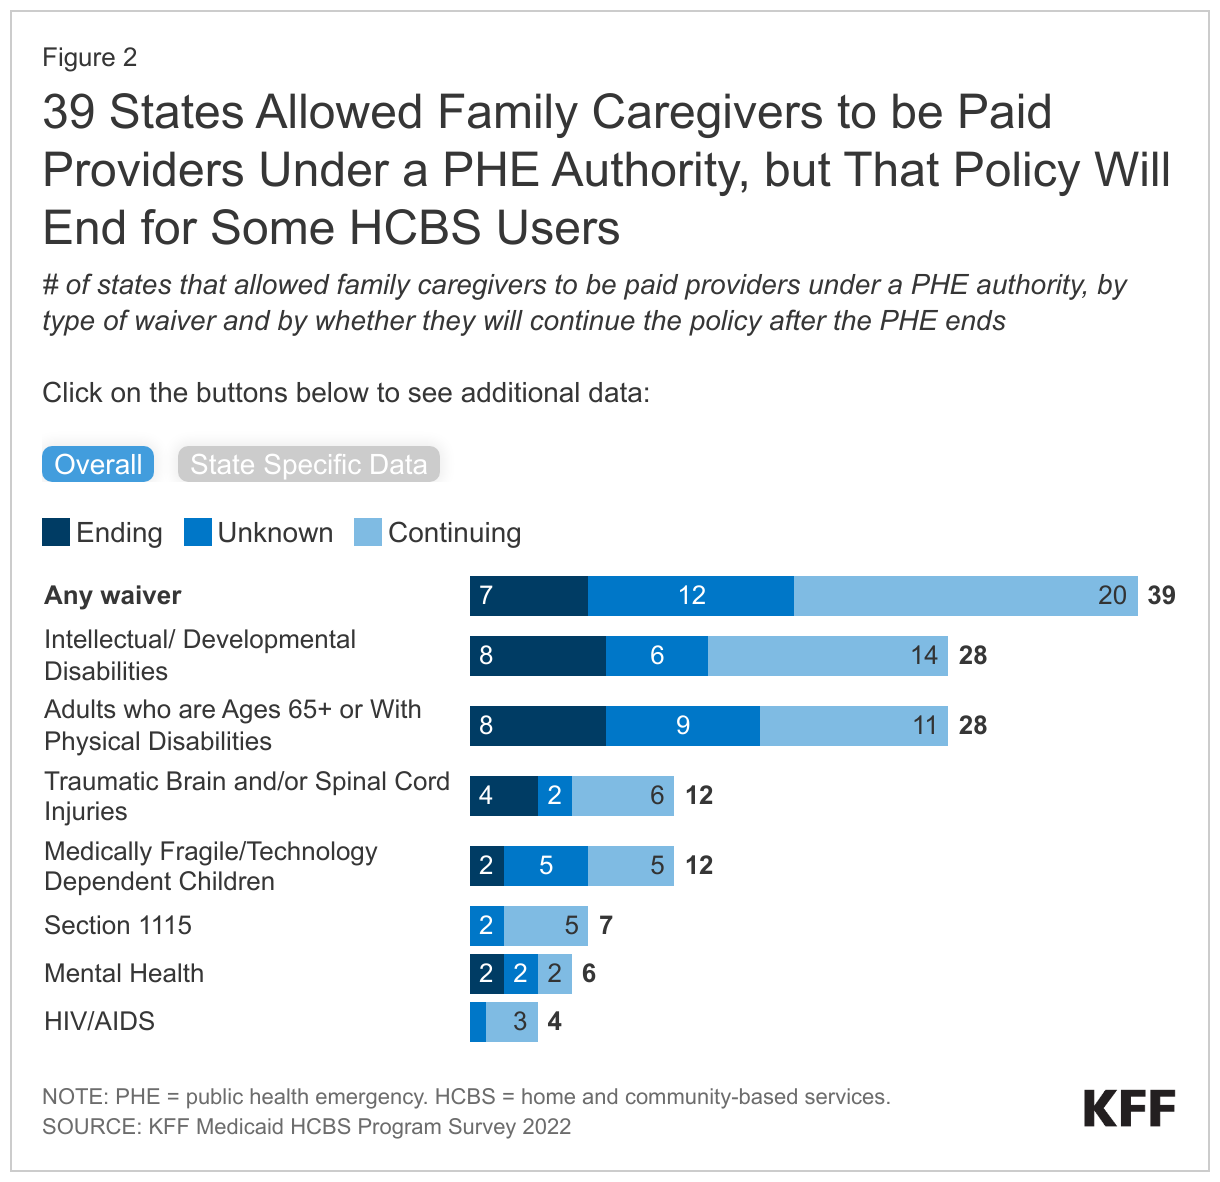
During the PHE, most states (39) reported responding to workforce challenges by allowing family caregivers to be paid, but only 20 states plan to continue that policy after the PHE ends (Figure 2). In a 2022 survey, states reported that maintaining a workforce was the biggest challenge for HCBS programs and the primary effect of COVID-19 on HCBS programs was to amplify existing workforce shortages. Recent analysis on the Peterson-KFF Health System Tracker shows that, as of October 2022, the number of workers providing long-term services and supports was measurably lower than in early 2020. Allowing family caregivers to be paid providers was an important tool in responding to shortages of HCBS workers stemming from the pandemic, but this authority will be ending in many states—even as workforce shortages persist.

Most states provide HCBS through “waiver” programs that allow them to limit eligibility and, in many cases, to people with certain types of health conditions. In a 2022 survey of states, the most frequently reported waivers were those serving people with intellectual or development disabilities (47 states), and of those, 28 states allowed family caregivers to be paid providers. When the PHE ends, 14 states will continue the policy, but 8 states are planning to end it, and the outcome is undecided in 6 states. The second most reported waivers were for adults ages 65 and older or with physical disabilities (42 states), and of those, 28 states allowed family caregivers to be paid providers. That policy will continue in 11 states, end in 8 states, and is unknown in 9 states.

39 States Allowed Family Caregivers to be Paid Providers Under a PHE Authority, but That Policy Will End for Some HCBS Users

What to Watch in Medicaid HCBS as the PHE Ends?

Looking ahead, the loss of PHE flexibilities could further exacerbate workforce challenges for HCBS programs. Many elements of life have started to return to pre-pandemic norms, but Medicaid HCBS programs continue to face major workforce challenges. Loss of the PHE flexibilities—and in many states, the end of paying family caregivers—may further exacerbate those challenges. Some challenges may be addressed, in part, with HCBS funding from the American Rescue Plan Act, which states may spend until March 31, 2025. A recent analysis of states’ spending plans for those funds found that 32 states were increasing payment rates for HCBS providers, 39 were funding provider training and certifications, and many states were engaging in other activities that could help bolster the HCBS workforce.

Unwinding the Medicaid continuous enrollment provision may create additional challenges for people who use HCBS. Between February 2020 and March 2023, states received enhanced federal funding for Medicaid in exchange for keeping people continuously enrolled in Medicaid. States were able to resume disenrollments starting April 1, 2023 and the enhanced federal funding will phase down through December 2023 if certain conditions are met. During the unwinding, some people who use HCBS could lose their Medicaid eligibility—either because they are no longer eligible or because they face administrative barriers to complete renewals. The phasing-out of enhanced federal funding could create state budget pressure and result in fewer resources for optional services such as HCBS in response.

Longer-term it is unclear whether more significant changes for HCBS are possible, including potential changes that would attempt to reduce or eliminate HCBS waiting lists. On April 18, the White House issued a statement summarizing a series of executive actions that include provisions aimed at strengthening the HCBS workforce. Those provisions include enhancing job quality for people who provide Medicaid HCBS, providing support for family caregivers of people with dementia through Medicare, and supporting HCBS workers who want to further professionalize or join a union. The president’s budget has called for an additional $150 billion in funding for Medicaid HCBS and there are legislative proposals that would increase federal funding for HCBS. However, proposals to increase federal funding for Medicaid HCBS face long odds in a divided Congress. There are competing proposals to significantly reduce the federal government’s spending on Medicaid, though those are unlikely to gain support of the White House or Democrats in the Senate. At the same time, states face pressure to provide HCBS to the growing number of people who need long-term services and supports and wish to receive them in their homes.

News Release

KFF Health News’ “Diagnosis: Debt” Series Wins Top Digital Media Honor from the National Institute for Health Care Management (NIHCM) Foundation

Published: Apr 19, 2023

KFF Health News has taken top honors in the National Institute for Health Care Management (NIHCM) Foundation’s 2023 Awards in Journalism and Research for its series “Diagnosis: Debt.” The multifaceted reporting partnership among KFF Health News, NPR, and CBS News explores the scale, impact, and causes of medical debt in America.

“Diagnosis: Debt” won first place in the digital media category, which included more than 70 entries from news organizations including The Washington Post, ProPublica, and NBC News. Judges cited the series for its powerful and compelling use of storytelling, graphics, and original data to illustrate one of the most difficult issues affecting patients today.

“Diagnosis: Debt” examined the stories behind the more than 100 million people in America who have been pushed into debt by the nation’s health care system, revealing the epidemic of medical debt that has become a defining feature of the American system. In personal, multimedia stories, “Diagnosis: Debt” documented the suffering and sacrifices this burden forces on patients and their families.

“This project is at the heart of our mission at KFF Health News: in-depth journalism that looks at the impact of the health system on people,” said KFF President and CEO Drew Altman, founding publisher of KFF Health News.

The project drew on a nationwide poll, the “KFF Health Care Debt Survey,” designed and analyzed by KFF’s journalists and public opinion researchers, as well as new research into debt and hospital finances, and original investigations by reporters. The investigations included a review of thousands of court records to expose debt collection by nursing homes and an analysis of hospital contracts obtained through public records requests. The most ambitious effort reflected a detailed examination of billing and collection policies at hundreds of U.S. hospitals, many of which resisted public disclosures. That reporting informed an interactive data visualization that allows readers to see the practices of hospitals near them.

The yearlong project was led by Noam N. Levey, a senior correspondent at KFF Health News, and his editor, Kelly Johnson, and included work by Aneri Pattani, a correspondent at KFF Health News; Yuki Noguchi, a correspondent on the Science Desk at NPR; Anna Werner, a consumer investigative national correspondent for CBS News; Juweek Adolphe, a web developer and designer; Bram Sable-Smith, a Midwest correspondent at KFF Health News; Megan Kalata, a writer at KFF Health News; and Terry Byrne, copy chief at KFF Health News. KFF Health News continues to explore the topic.

Medical debt has also been a focus of KFF’s recent policy analysis work, including resources such as “The Burden of Medical Debt in the United States,” “Americans’ Challenges with Health Care Costs,” and “Could Consumer Assistance Be Helpful to People Facing Medical Debt?

News Release

Nearly Half of Those Likely Eligible for DACA are Uninsured

Published: Apr 14, 2023

Yesterday, the Biden Administration announced a plan to expand eligibility for Medicaid and ACA Marketplace health coverage to Deferred Action for Childhood Arrivals (DACA) recipients. A KFF analysis finds 47% of individuals likely eligible for DACA are uninsured compared to 10% of U.S. born individuals in their age group.

The analysis estimates that among those likely eligible for DACA:

  • 84% are in a family with at least one full-time worker,
  • 54% of adults work full-time,
  • 43% have incomes below 200% of the federal poverty level.

DACA recipients are more likely to be in low-wage jobs without employer-sponsored health insurance. For those without employer coverage or the ability to afford individual market coverage, they are currently prohibited from enrolling in Medicaid, CHIP and ACA Marketplace coverage. A few states do provide state-funded health coverage regardless of immigration status.The Biden Administration is planning to take administrative action to provide health coverage. However, the future of the DACA program is uncertain pending federal court decisions.The updated brief provides an overview of the DACA program and its roughly 580,000 active recipients at the end of 2022.

PEPFAR Reauthorization on the Horizon

Published: Apr 14, 2023

In this Think Global Health (an initiative from the Council on Foreign Relations) opinion piece, Jennifer Kates and Kellie Moss discuss what could happen as Congress considers reauthorizing the United States’ signature initiative on global health.

Who are PEPFAR’s Beneficiaries?: Analysis of Populations Served in 2022

Published: Apr 14, 2023

Introduction

The U.S. President’s Emergency Plan for AIDS Relief (PEPFAR), the largest initiative addressing a single disease globally, provides a range of prevention, testing, and treatment services to people living with and at risk for HIV. PEPFAR reports that it has saved 25 million lives since its inception and currently supports antiretroviral treatment and other services for millions. Its efforts aim to reach the highest burden populations and improve HIV outcomes in those who are most affected, including women and adolescent girls, men and adolescent boys, children, and people in key and other priority population groups.

To get a better understanding of PEPFAR’s beneficiaries, we analyzed PEPFAR’s Monitoring, Evaluation, and Reporting (MER) indicator data for 2022, representing data from 62 supported PEPFAR countries. We looked specifically at the demographic characteristics of those served by the program, including by sex and age, and which services they used. We also analyzed data on key populations served (defined by PEPFAR to include men who have sex with men, transgender people, sex workers, people who inject drugs, and people in prisons and other closed settings) as well as PEPFAR’s priority populations (clients of sex workers, members of military and other uniformed services, displaced persons, and mobile populations), supplementing MER data with PEPFAR expenditure data, as MER data on these populations were limited, for 2022.

Overall, in 2022, PEPFAR provided testing services to 64.1 million people, including 2.2 million who newly tested positive for HIV (See Figure 1). In addition, PEPFAR supported the provision of antiretroviral treatment (ART) to 19.9 million people in 2022, or about three-quarters of all people living with HIV in PEPFAR countries (and almost half of all those on ART globally).1  PEPFAR newly enrolled 2.1 million on ART in 2022. The majority of people served by PEPFAR in 2022 were female, including 59% of those tested and 63% of those on ART, and most were ages 15 or older (See Figures 2 and 3). Of the 15.3 million people on ART with a documented viral load result, 14.6 million (95%) were virally suppressed (See Figure 4).

PEPFAR also provided preventive services2  to 3.9 million people from key populations and 5.4 million from priority populations, and newly enrolled 1.5 million people3  on pre-exposure prophylaxis (PrEP) (See Figure 5).

More than a quarter of the 62 PEPFAR countries analyzed here have already reached global targets for epidemic control.4 

Taken together, these data indicate that PEPFAR is reaching large shares of people with and at risk for HIV. Still, as noted below, there are some populations who lag behind, particularly younger age groups, with children less likely to have received ART or to be virally suppressed. Data on specific groups follow.

PEPFAR Beneficiaries Across the Clinical Cascade
PEPFAR Beneficiaries Across the Clinical Cascade: Population by Sex/Age
PEPFAR Beneficiaries Across the Clinical Cascade: Distribution by Sex/Age
PEPFAR Beneficiaries with Suppressed Viral Loads: Shares by Sex/Age
Number of People PEPFAR Reached with HIV Preventive Services

Women and Adolescent Girls

  • In 2022, PEPFAR provided testing services to 38.1 million women and adolescent girls (ages 15+), 1.2 million of whom newly tested positive. Those between the ages of 15-24 accounted for the largest share of women and adolescent girls tested (37% or 14 million), followed closely by those ages 25-34 (36% or 13.7 million); this latter group accounted for the largest share newly testing positive (39% or 483,000) (See Figures 6 and 7).
  • PEPFAR supported ART for 12.6 million women and adolescent girls in 2022, including 1.2 million newly enrolled on ART. Most were ages 35 or older, although among those newly enrolled, those ages 25-34 represented the largest share (See Figures 6 and 7).
  • Almost all (96% or 9.4 million) women and adolescent girls on ART with a documented viral load result were virally suppressed. Their age distribution is similar to that of those enrolled on ART overall, with most ages 35 and older. Viral suppression was lowest among the youngest cohort, those ages 15-24 (See Figures 6-8).
  • PEPFAR also provided ART to 732,000 HIV-positive pregnant women to help reduce the risk of mother-to-child transmission during pregnancy.
  • PEPFAR newly enrolled 920,000 women and adolescent girls on PrEP to prevent HIV infection.
  • Finally, 2.1 million adolescent girls and young women, ages 10-24, participated in PEPFAR’s DREAMS programming in 2022.5 
PEPFAR Beneficiaries Across the Clinical Cascade: Women and Adolescent Girls, Population by Age
PEPFAR Beneficiaries Across the Clinical Cascade: Women and Adolescent Girls, Distribution by Age
PEPFAR Beneficiaries with Suppressed Viral Loads: Women and Adolescent Girls, Shares by Age

Men and Adolescent Boys

  • In 2022, PEPFAR provided HIV testing services to 17.6 million men and adolescent boys, including 826,000 who newly tested positive. Those ages 25-34 accounted for the largest share – a third – of men and adolescent boys tested (33% or 5.8 million) and of those newly testing positive (33% or approximately 274,000) (See Figures 9 and 10).
  • PEPFAR supported ART for 6.6 million men and adolescent boys in 2022, including 802,000 newly enrolled on ART. Most were ages 35 or above, although, as with women, among those newly enrolled on ART, those ages 25-34 represented the largest share (See Figures 9 and 10).
  • Almost all men and adolescent boys on ART with a documented viral load result were virally suppressed (95% or 4.7 million). Their age distribution is similar to that of those enrolled on ART overall, with most ages 35 and older. Viral suppression was lowest among men ages 15-24 (89%) and highest among those 45+ (96%) (See Figures 9-11).
  • PEPFAR newly enrolled 531,000 men and adolescent boys on PrEP to prevent HIV infection.
  • PEPFAR also reached 2 million men and boys6  with voluntary medical male circumcision services in 2022.
PEPFAR Beneficiaries Across the Clinical Cascade: Men and Adolescent Boys, Population by Age
PEPFAR Beneficiaries Across the Clinical Cascade: Men and Adolescent Boys, Distribution by Age
PEPFAR Beneficiaries with Suppressed Viral Loads: Men and Adolescent Boys, Shares by Age

Children

  • In 2022, PEPFAR provided HIV testing services to 5.5 million children (under age 15).7  Approximately 74,000 children newly tested positive. Children under age 5 accounted for the largest share (39% or 2.1 million) of children tested and those newly positive (40% or approximately 30,000) (See Figures 12 and 13).
  • PEPFAR supported ART for approximately 658,000 children, including 80,000 (12%) newly enrolled on ART. Almost half of those newly enrolled on ART were under age 5 (See Figures 12 and 13).
  • Of children on ART with a documented viral load result, most (86% or approximately 457,000) were virally suppressed. Viral suppression was lowest among children under age 5 (77%) and higher for those ages 5-9 and 10-14 (87%, respectively) (See Figure 14).
  • Approximately 846,000 children born to HIV-positive pregnant women had a virologic test within the first 12 months of age. Very few infants (approximately 11,000) newly tested positive (See Figure 15).
  • 7.2 million people,8  including children who are orphaned, living with, affected by, or at risk of becoming infected with HIV, living with caregivers who are living with HIV, or have a combination of these factors, as well as caregivers of these children, were served by PEPFAR’s orphans and vulnerable children (OVC) programs in 2022.
PEPFAR Beneficiaries Across the Clinical Cascade: Children, Population by Age
PEPFAR Beneficiaries Across the Clinical Cascade: Children, Distribution by Age
PEPFAR Beneficiaries with Suppressed Viral Loads: Children, Shares by Age
PEPFAR Testing Services for Infants

Key Populations

  • In 2022, PEPFAR provided preventive services to 3.9 million people from key populations.9 
  • PEPFAR expenditure data indicates that in 2022, PEPFAR expenditures for key populations totaled $223 million, of which 28% or $62 million was designated for a specific key population group.10  The largest share was for services for sex workers ($28 million), followed by men who have sex with men ($19 million). Services for transgender people represented the smallest share of expenditures ($1.1 million) (See Figure 16).
PEPFAR Funding for Key Populations

Priority Populations

  • In 2022, PEPFAR provided preventive services11  to 5.4 million people from priority populations.12 
  • PEPFAR spending on priority populations was $101 million in 2022, of which $31 million was designated for a specific priority population group as follows: members of the military and other uniformed services ($28 million), displaced persons ($1.6 million), clients of sex workers ($708,000), and mobile populations13  ($697,000) (See Figure 17).14 
PEPFAR Funding for Priority Populations

Methods

This data note is based on KFF analysis of data from PEPFAR’s Monitoring, Evaluation, and Reporting (MER) dataset and PEPFAR’s expenditure dataset on PEPFAR’s Panorama Spotlight dashboard.  MER data classified as “Unknown age” were included in the “Overview of PEPFAR beneficiaries” section as “Age not known;” however, these data were not included in the population-specific sections since lack of information about age did not allow this data to be correctly placed by population (i.e., Women and adolescent girls 15+, children <15, etc.). MER data classified as “Coarse” (data that are not further disaggregated into detailed age groups) were included in the population-specific sections of the analysis as “Age not known.” This analysis does not include MER data classified as “Retired Age Band,” as these age bands are no longer used and accounted for very small numbers of people tested and newly testing positive. MER data for children <15 were classified in the data as “Unknown sex.” Totals were calculated for each indicator based on the guidance provided in the PEPFAR Monitoring, Evaluation, and Reporting Indicator Reference Guide. All amounts included in this analysis are rounded. Financial data were interpreted based on the guidance provided in the PEPFAR Financial Classification Reference Guide. Financial data represent the total expended resources during the 12-month 2022 fiscal year period (October 1 - September 30, 2022).

  1. Based on 2021 data from UNAIDS, from: UNAIDS, HIV estimates with uncertainty bounds 1990-Present, accessed: https://www.unaids.org/en/resources/documents/2022/HIV_estimates_with_uncertainty_bounds_1990-present. ↩︎
  2. These data include people who received HIV testing services and one of the following prevention activities: targeted information/education/communication, outreach/empowerment, condoms, lubricant, STI testing or screening, ART linkage, TB services, viral hepatitis services, reproductive health services, MAT, or needle syringe program services. See: PEPFAR, FY22 MER 2.6 Indicator Reference Guide, accessed: https://www.state.gov/wp-content/uploads/2021/09/FY22-MER-2.6-Indicator-Reference-Guide.pdf. ↩︎
  3. These data represent people newly enrolled on PrEP to prevent HIV infection and only include those ages 15 and older. See: PEPFAR, FY22 MER 2.6 Indicator Reference Guide, accessed: https://www.state.gov/wp-content/uploads/2021/09/FY22-MER-2.6-Indicator-Reference-Guide.pdf. ↩︎
  4. Based on 2021 data from UNAIDS, from: UNAIDS, AIDSinfo database, accessed: https://aidsinfo.unaids.org/. ↩︎
  5. Countries designate their own primary packages of services for DREAMS interventions. These interventions are not limited to health sector services but also include services that may directly or indirectly increase girls’ risk to HIV, such as parenting/caregiver programs, cash transfers, educational subsidies, risk reduction, community engagement, violence prevention and post-violence care. See: PEPFAR, DREAMS Core Package of Interventions Summary, accessed: https://www.state.gov/wp-content/uploads/2019/08/DREAMS-Core-Package.pdf. ↩︎
  6. The age of people supported by these services ranged from birth to 50+. See: PEPFAR, FY22 MER 2.6 Indicator Reference Guide, accessed: https://www.state.gov/wp-content/uploads/2021/09/FY22-MER-2.6-Indicator-Reference-Guide.pdf. ↩︎
  7. Data for children <15 were classified in the data as “Unknown sex.” See: PEPFAR, FY22 MER 2.6 Indicator Reference Guide, accessed: https://www.state.gov/wp-content/uploads/2021/09/FY22-MER-2.6-Indicator-Reference-Guide.pdf. ↩︎
  8. Beneficiaries served by the Orphans and Vulnerable Children (OVC) program include active, graduated, transferred, and exited beneficiaries who were served within the reporting period. See: PEPFAR, FY22 MER 2.6 Indicator Reference Guide, accessed: https://www.state.gov/wp-content/uploads/2021/09/FY22-MER-2.6-Indicator-Reference-Guide.pdf. ↩︎
  9. PEPFAR, “Key Populations” webpage, accessed: https://www.state.gov/key-populations/. PEPFAR, FY22 MER 2.6 Indicator Reference Guide, accessed: https://www.state.gov/wp-content/uploads/2021/09/FY22-MER-2.6-Indicator-Reference-Guide.pdf. ↩︎
  10. Funding that was not designated for a specific key population group includes funding that is not targeted, targeted at more than one key population group, or where the resources for the activities are not distinct by the key population group. PEPFAR, Financial Classifications Reference Guide, accessed: https://datim.zendesk.com/hc/en-us/articles/360015671212-PEPFAR-Financial-Classifications-Reference-Guide. ↩︎
  11. Countries, along with the PEPFAR implementing partner, design a set of interventions for each priority population. See: PEPFAR, FY22 MER 2.6 Indicator Reference Guide, accessed: https://www.state.gov/wp-content/uploads/2021/09/FY22-MER-2.6-Indicator-Reference-Guide.pdf. ↩︎
  12. Priority populations are defined within the context of and by each country and may include: adolescent girls and young women (AGYW), adolescent boys and young men, men, clients of sex workers, people who are displaced, fishing communities, military or others in uniformed service, mobile populations, and non-injecting drug users. See: PEPFAR, FY22 MER 2.6 Indicator Reference Guide, accessed: https://www.state.gov/pepfar-fy-2022-mer-indicators/. ↩︎
  13. Mobile populations include fishing, farming, mining, and migrant workers, and truck/commercial drivers and transport workers. See: PEPFAR, FY22 MER 2.6 Indicator Reference Guide, accessed: https://www.state.gov/wp-content/uploads/2021/09/FY22-MER-2.6-Indicator-Reference-Guide.pdf. ↩︎
  14. Funding that was not designated for a specific population group is referred to as “not disaggregated.” This funding includes funding that is not targeted, targeted at more than one priority population group, or where the resources for the activities are not distinct by the priority population group. See: PEPFAR, Financial Classifications Reference Guide, accessed: https://datim.zendesk.com/hc/en-us/articles/360015671212-PEPFAR-Financial-Classifications-Reference-Guide ↩︎

A Conversation with Dr. Rochelle Walensky on Meeting Our Public Health Challenges

Published: Apr 13, 2023

Program:

  • Introductory remarks by Dr. Altman, president and CEO, KFF
  • Remarks by Dr. Walensky
  • Discussion and Q&A with Dr. Walensky and Dr. Monroe, moderated by Dr. Kates

Speaker Bios (in order of appearance)

Photo of Drew Altman

Drew Altman, PhD

President & Chief Executive Officer, KFF

Drew Altman is president and chief executive officer of KFF, a position he has held for more than 30 years. He is a leading expert on national health policy issues and an innovator in the nonprofit field.

Dr. Altman built KFF with the mission the organization pursues today–to serve as a nonpartisan source of trusted information for policymakers, the media, the health policy community, and the public. He is also founding publisher of KFF Health News, the largest health newsroom in the U.S., which reports on health issues and distributes its articles through major news outlets across the country.

Dr. Altman was commissioner of the Department of Human Services for the state of New Jersey, director of Health and Human Services at The Pew Charitable Trusts, vice president of the Robert Wood Johnson Foundation, and served in a senior position in the Health Care Financing Administration in the Carter administration. He is a member of the National Academy of Medicine and the Council on Foreign Relations.

Dr. Altman earned his doctorate in political science at the Massachusetts Institute of Technology and completed his postdoctoral work at Harvard University before moving on to public service. He holds an honorary doctorate from the Morehouse School of Medicine.

Rochelle P. Walensky, MD, MPH

Director of the Centers for Disease Control and Prevention

Rochelle P. Walensky, MD, MPH, is the Director of the Centers for Disease Control and Prevention and the Administrator of the Agency for Toxic Substances and Disease Registry. She is an influential scholar whose pioneering research has helped advance the national and global response to HIV/AIDS. Dr. Walensky is also a well-respected expert on the value of testing and treatment of deadly viruses.

Dr. Walensky served as Chief of the Division of Infectious Diseases at Massachusetts General Hospital from 2017-2020 and Professor of Medicine at Harvard Medical School from 2012-2020. She served on the front line of the COVID-19 pandemic and conducted research on vaccine delivery and strategies to reach underserved communities.

Dr. Walensky is recognized internationally for her work to improve HIV screening and care in South Africa and nationally for motivating health policy and informing clinical trial design and evaluation in a variety of settings.

She is a past Chair of the Office of AIDS Research Advisory Council at the National Institutes of Health, Chair-elect of the HIV Medical Association, and previously served as an advisor to both the World Health Organization and the Joint United Nations Programme on HIV/AIDS.

Originally from Maryland, Dr. Walensky received her Bachelor of Arts from Washington University in St. Louis, her Doctor of Medicine from the Johns Hopkins School of Medicine, and her Master of Public Health from the Harvard School of Public Health.

Photo of Jen Kates

Jennifer Kates, PhD

Senior Vice President, KFF

Director of Global Health & HIV Policy

Dr. Jen Kates is Senior Vice President and Director of Global Health & HIV Policy at KFF, where she oversees policy analysis and research focused on the U.S. government’s role in global health and on the global and domestic HIV epidemics. She has also helped to lead KFF’s work on the COVID-19 pandemic. Widely regarded as an expert in the field, she regularly publishes and presents on global health and HIV policy issues and is particularly known for her work analyzing donor government investments in global health; assessing and mapping the U.S. government’s global health architecture, programs, and funding; and tracking and analyzing major U.S. HIV programs and financing, and key trends in the HIV epidemic, an area she has been working in for close to thirty years. Prior to joining KFF in 1998, Dr. Kates was a Senior Associate with The Lewin Group, a health care consulting firm, where she focused on HIV policy, strategic planning/health systems analysis, and health care for vulnerable populations. Among other prior positions, she directed the Office of Lesbian, Gay, and Bisexual Concerns at Princeton University.

Dr. Kates has served on numerous federal and private sector advisory committees on global health and HIV issues, including the Presidential Advisory Council on HIV/AIDS (PACHA), PEPFAR’s Scientific Advisory Board, the NIH Office of AIDS Research Advisory Council, the CDC/HRSA Advisory Committee on HIV, Viral Hepatitis and STD Prevention and Treatment (CHACHSPT), the board of the Global Fund to Fight AIDS, Tuberculosis and Malaria, and the Governing Council of the International AIDS Society. She is also a lecturer at the Johns Hopkins School of Advanced International Studies.

Dr. Kates received her Ph.D. in Health Policy from George Washington University. She holds a Bachelor’s degree from Dartmouth College, a Master’s degree in Public Affairs from the Princeton School of Public and International Affairs and a Master’s degree in Political Science from the University of Massachusetts.

Judy Monroe, MD

President & CEO, CDC Foundation

Dr. Judith Monroe, president and CEO of the CDC Foundation, has dedicated her career to protecting people and saving lives. She joined the CDC Foundation in February 2016 as president and CEO, following her role as a deputy director of the U.S. Centers for Disease Control and Prevention (CDC) and director of CDC’s Office of State, Tribal, Local and Territorial Support.

In her work at the CDC Foundation, Dr. Monroe advances priority programs that improve the health of people across America and around the world. The CDC Foundation mobilizes philanthropic and private-sector resources to support CDC’s critical health protection work, managing hundreds of programs in the United States and in more than 140 countries.

Dr. Monroe received her doctor of medicine from the University of Maryland and a bachelor of science degree from Eastern Kentucky University. She completed her residency in family medicine at the University of Cincinnati, a rural faculty development fellowship through East Tennessee State University, and a mini-fellowship in obstetrics through the University of Wisconsin. She also participated in the State Health Leadership Initiative at Harvard University’s Kennedy School of Government and received an honorary doctorate from Purdue University in Health and Human Services.

Poll Finding

Americans’ Experiences With Gun-Related Violence, Injuries, And Deaths

Published: Apr 11, 2023

Findings

Key Findings

  • Experiences with gun-related incidents are common among U.S. adults. One in five (21%) say they have personally been threatened with a gun, a similar share (19%) say a family member was killed by a gun (including death by suicide), and nearly as many (17%) have personally witnessed someone being shot. Smaller shares have personally shot a gun in self-defense (4%) or been injured in a shooting (4%). In total, about half (54%) of all U.S. adults say they or a family member have ever had one of these experiences.
  • Gun-related injuries and deaths, as well as worries about gun violence, disproportionately affect people of color in the U.S. Three in ten Black adults (31%) have personally witnessed someone being shot, as have one-fifth of Hispanic adults (22%). One-third of Black adults (34%) have a family member who was killed by a gun, twice the share of White adults who say the same (17%). In addition, one-third of Black adults (32%) and Hispanic adults (33%) say they worry either “every day,” or “almost every day” about themselves or someone they love being a victim of gun violence (compared to one in ten White adults). And one in five Black adults (20%) and Hispanic adults (18%) feel like gun-related crimes, deaths, and injuries are a “constant threat” to their local community, more than double the share among White adults (8%).
  • The majority (84%) of U.S. adults say they have taken at least one precaution to protect themselves or their families from the possibility of gun violence, including nearly six in ten (58%) who have talked to their children or other family members about gun safety, and more than four in ten who have purchased a weapon other than a gun, such as a knife or pepper spray (44%), or attended a gun safety class or practiced shooting a gun (41%). About a third (35%) have avoided large crowds, such as music festivals, or crowded bars and clubs to protect themselves or their families from the possibility of gun violence. Three in ten (29%) have purchased a gun to protect themselves or their family from the possibility of gun violence. Smaller shares, but still at least one in seven, have avoided using public transit (23%), changed or considered changing the school that their child attends (20%), avoided attending religious services, cultural events or celebrations (15%), or moved to a different neighborhood or city (15%).
  • One in seven (14%) adults say a doctor or other health care provider has asked if they own a gun or if there are guns in the home, while about one in four (26%) parents of children under 18 say their child’s pediatrician has asked them about guns in the home. Few (5%) adults say a doctor or other health care provider has ever talked to them about gun safety.
  • Four in ten (41%) adults report living in a household with a gun. Among this group, more than half say at least one gun in their home is stored in the same location as the ammunition (52%), 44% say a gun is stored in an unlocked location, and more than one-third report a gun is stored loaded (36%). Overall, three in four (75%) adults living in households with guns say any of their guns are stored in one of these ways, representing three in ten overall adults (31%). About four in ten (44%) parents of children under age 18 say there is a gun in their household. Among parents with guns in their home, about one-third say a gun is stored loaded (32%) or stored in an unlocked location (32%). More than half of parents (61%) say any gun in their homes is stored in the same location as ammunition.

Many Say They Or A Family Member Have Experienced Or Witnessed A Shooting, Or Have Been Threatened With A Gun

The latest polling from KFF finds a majority (54%) of U.S. adults have either personally or had a family member who has been impacted by a gun-related incident, such as witnessing a shooting, being threatened by gun, or being injured or killed by a gun. When asked about their own personal experience, one in five report that they have been threatened with a gun (21%), while nearly as many (17%) say they have witnessed someone being shot. Small but important shares report experiencing other gun-related incidents, including 4% who have been injured by a gun, and 4% who have shot a gun in self-defense. The share who have shot a gun in self-defense rises to 18% among adults whose current or past job included the use of guns, such as military or law enforcement work.

When asked about their family members, about three in ten adults (31%) say they have a family member who has been threatened with a gun, while a similar share (28%) say a family member has witnessed someone being shot. One in five (20%) adults say a family member has been injured by a gun, and 19% say a family member has been killed by a gun, including death by suicide. About half of deaths (55%) in the U.S. involving guns are suicides.

Bar chart showing percent of adults who have experienced gun-related incidents broken down by type of incident, percent of adults who have a family member who has experienced gun-related incidents broken down by type, and the percent of adults who have, or a family member has, experienced at least one of the specific above gun-related incidents.

The latest KFF poll finds experiences with shootings are pervasive but even more commonly reported among people of color. While many factors, such as income, education, age, gender, and where they live can play a role in people’s experiences with gun-related incidents and worries about gun violence, race and ethnicity consistently is one of the strongest demographic predictors of both experiences and worries.1 

Black adults (31%) are about twice as likely as White adults (14%) to say they have personally witnessed someone being shot and are also twice as likely to have a family member who has been killed by a gun (34% compared to 17% of White adults). Appendix Table 1 shows each reported incidence asked about by racial and ethnic groups.

Bar chart showing percent of adults who have been personally threatened with a gun, who have witnessed someone being injured from a gun, and who have had a family member killed by a gun. Each row shows the percent of Black, Hispanic, and White adults who report experiencing these items.

Black Adults Are More Likely To Report Being Worried About Being Victims Of Gun Violence, See Gun Violence As A Constant Threat

While a majority of adults (82%) say they worry “sometimes” or less often that they or someone they love will be a victim of gun violence, small but important shares say they worry either “every day,” (8%) or “almost every day” (10%) about this. Larger shares of Black and Hispanic adults compared to White adults say they frequently worry about themselves or someone they love being a victim of gun violence. One-third of Black adults (32%) and Hispanic adults (33%) say they worry either “every day,” or “almost every day” about themselves or someone they love being a victim of gun violence, compared to one in ten (10%) White adults.

One-fourth of parents of children under 18 say they worry “every day” (12%) or “almost every day” (13%) about themselves or a loved one being a victim of gun violence. Adults who have personally experienced or had a family member experience a gun-related incident are almost twice as likely to say they worry “every day” than those who have not (11% vs. 6%). In a sign of how pervasive gun violence is, how often someone worries about a loved one being a victim of gun violence does not vary much among all age groups under the age of 65.

Bar chart showing percent of adults who say they worry every day, almost every day, sometimes, rarely, and never about a loved one being a victim of gun violence. Individual bars show percentages by race/ethnicity, experience with gun-related incidents, and parent status.

Half (51%) of U.S. adults say gun-related crimes, injuries, and deaths, are a “constant threat” in their local community (11%) or a “major concern but not a constant threat” (40%). Majorities of Black adults (62%) and Hispanic adults (62%) say gun-related activities are either a major concern or a constant threat, while less than half (45%) of White adults say the same. Notably, 8% of White adults say gun-related activity is a constant threat, less than half the share of Black adults (20%) or Hispanic adults (18%) who say the same.

Those living in urban areas are more concerned about the threat of gun-related crimes, injuries, and deaths compared to those living in other types of areas. About six in ten (62%) adults living in urban areas say gun activity is a constant threat or a major concern, compared to about half (48%) of those who live in suburban areas and about three in ten (29%) rural adults.

Women are also more likely than men to say gun-related crimes, injuries, and deaths are either a constant threat or major concern in their local communities (58% vs. 43%).

Bar chart showing percent of adults who respond "A constant threat," "a major concern but not a constant threat," "a minor concern," and "not a concern." Individual bars show percent of adults by gender, race/ethnicity, community type, and experience with gun-related incidents.

Overall, most adults say they feel either “very” (41%) or “somewhat” (41%) safe from gun violence in their neighborhoods. The groups most likely to say they feel “not too safe” or “not safe at all” from gun violence in their neighborhood are also among the groups most likely to say they worry about someone they love being a victim of gun violence. One in six (17%) Black adults say they feel “not safe at all” from gun violence in their neighborhood, a substantially larger share compared to White adults (2%) and nearly twice as many as compared to Hispanic adults (9%).

Similar shares of people living in urban areas (25%) also say they feel not too safe or not safe at all. About one in five women (22%) say they do not feel safe from gun violence, including 6% who say they feel not safe at all. Larger shares of adults who have experienced gun-related incidents, either personally or had a family member who has, say they feel unsafe from gun violence in their neighborhood than do adults who have not experienced gun-related incidents (23% vs. 13% not too safe or not safe at all).

Bar chart showing percent of adults who respond "very safe," "somewhat safe," "not too safe," and "not safe at all." Individual bars show percent of adults by gender, race/ethnicity, community type, and experience with gun-related incidents.

More Than Eight In Ten Adults Have Taken At Least One Precaution To Protect Themselves Or Their Families From The Possibility Of Gun Violence

Large majorities of adults (84%) say they have taken at least one precaution to protect themselves or their families from the possibility of gun violence. Nearly six in ten (58%) adults say they have talked to their child or other family members about gun safety, including majorities of White adults (62%), Hispanic adults (56%) and Black adults (54%). At least four in ten adults have taken defensive actions, including 44% who say they have purchased a weapon other than a gun, such as a knife, pepper spray, or something else, and 41% who say they have attended a gun safety class or practiced shooting a gun. Nearly half of White adults (47%) say they have taken a gun safety class or practiced shooting a gun, a substantially larger share than Black adults (34%) or Hispanic adults (32%) who say they have done so.

About one in three (35%) adults say they have avoided large crowds, such as music festivals or crowded bars and clubs to help protect themselves or their families from the possibility of gun violence. This figure is driven largely by Black adults, of whom more than half (55%) say they have done this, compared to about four in ten (43%) Hispanic adults and three in ten (29%) White adults.

About three in ten (29%) adults say they have purchased a gun as a precaution against gun violence, including slightly larger shares of White adults (35%) than Black adults (24%) or Hispanic adults (20%). Smaller, but important shares of adults report that they have taken other steps to protect themselves or their families from gun violence, including one in four (23%) who say they have avoided using public transit, one in five (20%) who say they changed or considered changing the school their child attends, and one in seven (15%) who have avoided attending religious services, cultural events, or celebrations, or who have moved to a different neighborhood or city (15%).

Bar chart showing percent of adults who report having taken certain actions to protect themselves or their families from the possibility of gun violence. Each row shows the percent of adults by total adults, Black adults, Hispanic adults, and White adults.

Public Awareness And Experiences Talking With Health Care Providers About Gun Safety

Few Adults Say A Health Care Provider Has Talked To Them About Gun Safety

In 2016, the American Medical Association (AMA) adopted a policy calling gun violence in the U.S. a “public health crisis” and since then, medical schools have increasingly offered gun-related content to train doctors about how to talk about gun safety with their patients. However, the latest KFF poll finds that more than eight in ten (86%) adults say they have never had a doctor or other health care provider ask if they own a gun or if there are guns in the home. Overall, 5% say a doctor or health care provider has talked with them about gun safety.

About one in four (26%) parents report that their child’s pediatrician has asked about gun ownership and guns in the home, yet, overall, less than one in ten (8%) say the pediatrician talked to them about gun safety.

Bar chart showing percent of adults who report that a health care provider has asked if they own a gun or if there are guns in the home, percent of adults who report that a doctor or health care provider has talked to them about gun safety, percent of adults who report that their child's pediatrician has asked if they own a gun or if there are guns in the home, and percent of adults who report that their child's pediatrician has talked to them about gun safety.

Three In Four Adults Living In A Household With A Gun Say It Is Stored Either Unlocked, Loaded, Or In The Same Location As Ammunition

About four in ten (41%) adults say they live in a household with a gun. Among this group, slightly more than half (52%) say at least one gun in their home is stored in the same location as ammunition, while about half (47%) say a gun is not stored in the same location as ammunition. More than four in ten (44%) say any gun in their house is stored in an unlocked location, and just over a third (36%) say any of the guns in their household are stored loaded. Collectively, three in four adults (75%) with guns in their household (31% of all adults) say any of the guns in their house are stored in the same location as ammunition, in an unlocked location, or loaded.

Bar chart showing percent of adults who responded "Yes," and "No" to specific ways to store a gun in their household.

About four in ten (44%) parents of children under age 18 report there is a gun in their household. Parents with guns in their homes are less likely than those without children to say they store their guns loaded or unlocked. About one-third of parents who have guns in their home say their guns are stored loaded (32%) or stored in an unlocked location (32%). More than half of parents (61%) say any gun in their homes are stored in the same location as ammunition. Taken as a whole, a majority (78%) of parents in gun-owning households say a gun is stored in any one of these ways.

Bar chart showing percent of parents in gun-owning household who responded "Yes" and "No" to specific ways to store a gun in their household.

Knowledge On Some Gun Violence Facts Is Somewhat Limited

Despite the ubiquitous news of gun violence in this country and that so many people have experienced gun-related incidents, the public is largely unaware of the extent to which guns are responsible for the deaths of young people and the cause of death in many suicides. About half (49%) of the public is aware that guns are the leading cause of death for children and teenagers ages 1-19 in the U.S, which recently became the case in 2020 according to an analysis of data from the Centers for Disease Control and Prevention (CDC). Past KFF analysis of CDC and IMHME data has found that the U.S. is alone among peer countries in the number of deaths of children and teens by guns. In no other peer country are guns a top cause of childhood and teenage mortality. In the survey, Black adults (71%) and Hispanic adults (60%) are more likely than White adults (42%) to be aware that guns are the leading cause of death for those under the age of 20 in the U.S.

Slightly less than half (46%) of adults are aware that more than half of deaths in the U.S. involving guns are suicides. Indeed, in the U.S., about half of deaths (55%) in the U.S. involving guns are suicides according to the Centers for Disease Control and Prevention  and about half of suicides (52%) are committed by guns according to the National Institute of Health (NIH).

2 bars showing percent of adults who are aware that guns are the leading cause of death in children in teenagers and that more than half of deaths involving guns are suicides.

Appendix

Table showing percent of adults who have experienced gun-related incidents broken down by type and percent of adults that have a family member who has experienced gun-related incidents broken down by type. Each column shows the percent by total adults, Black adults, Hispanic adults, and White adults.

Methodology

This KFF Health Tracking Poll was designed and analyzed by public opinion researchers at KFF. The survey was conducted March 14-23, 2023, online and by telephone among a nationally representative sample of 1,271 U.S. adults in English (1,198) and in Spanish (73). The sample includes 986 adults reached through the SSRS Opinion Panel either online or over the phone (n=33 in Spanish). The SSRS Opinion Panel is a nationally representative probability-based panel where panel members are recruited randomly in one of two ways: (a) Through invitations mailed to respondents randomly sampled from an Address-Based Sample (ABS) provided by Marketing Systems Groups (MSG) through the U.S. Postal Service’s Computerized Delivery Sequence (CDS); (b) from a dual-frame random digit dial (RDD) sample provided by MSG. For the online panel component, invitations were sent to panel members by email followed by up to three reminder emails. 961 panel members completed the survey online and panel members who do not use the internet were reached by phone (25).

Another 285 (n=40 in Spanish) interviews were conducted from a random digit dial telephone sample of prepaid cell phone numbers obtained through MSG. Phone numbers used for the prepaid cell phone component were randomly generated from a cell phone sampling frame with disproportionate stratification aimed at reaching Hispanic and non-Hispanic Black respondents. Stratification was based on incidence of the race/ethnicity groups within each frame. Respondents in the phone samples received a $15 incentive via a check received by mail, and web respondents received a $5 electronic gift card incentive (some harder-to-reach groups received a $10 electronic gift card).

The online questionnaire included two questions designed to establish that respondents were paying attention. Cases that failed both attention check questions, those with over 30% item non-response, and cases with a length less than one quarter of the mean length by mode were flagged and reviewed. Cases were removed from the data if they failed two or more of these quality checks. Based on this criterion, no cases were removed.

The combined cell phone and panel samples were weighted to match the sample’s demographics to the national U.S. adult population using data from the Census Bureau’s 2021 Current Population Survey (CPS). Weighting parameters included sex, age, education, race/ethnicity, region, and education. The sample was weighted to match patterns of civic engagement from the September 2017 Volunteering and Civic Life Supplement data from the CPS and to match frequency of internet use from the National Public Opinion Reference Survey (NPORS) for Pew Research Center.  Finally, the sample was weighted to match patterns of political party identification based on a parameter derived from recent ABS polls conducted by SSRS polls. The weights take into account differences in the probability of selection for each sample type (prepaid cell phone and panel). This includes adjustment for the sample design and geographic stratification of the cell phone sample, within household probability of selection, and the design of the panel-recruitment procedure.

The margin of sampling error including the design effect for the full sample is plus or minus 3 percentage points. Numbers of respondents and margins of sampling error for key subgroups are shown in the table below. For results based on other subgroups, the margin of sampling error may be higher. Sample sizes and margins of sampling error for other subgroups are available by request. Sampling error is only one of many potential sources of error and there may be other unmeasured error in this or any other public opinion poll. KFF public opinion and survey research is a charter member of the Transparency Initiative of the American Association for Public Opinion Research.

GroupN (unweighted)M.O.S.E.
Total1,271± 3 percentage points
Race/Ethnicity
White, non-Hispanic706± 5 percentage points
Black, non-Hispanic206± 9 percentage points
Hispanic248± 8 percentage points

Endnotes

  1. A series of logistic regressions were run to examine which demographic variables were statistically significant predictors of both reported experiences of gun-related incidents, as well as worries about a loved one being a victim of gun violence. In each model, Black and Hispanic identity remained a strong predictor as well as education and age. Younger adults and those with lower levels of education were also more likely to report both personal and familial experiences with gun violence. Running a model with only White adults, income is also a significant predictor, as those with lower levels of income are more likely to report experiences with gun-related incidents. ↩︎
News Release

One in Five Adults Say They’ve Had a Family Member Killed by a Gun, Including Suicide, and One in Six Have Witnessed a Shooting; Among Black Adults, a Third Have Experienced Each

Three in Four Adults in Households with Guns Say at Least One Gun in Their Home is Either Unlocked, Loaded, or Kept with Ammunition

Published: Apr 11, 2023

Experiences with gun-related incidents are common across the country, with about one in five adults saying that they have personally been threatened with a gun (21%) or had a family member killed by a gun, including by suicide (19%), finds a new KFF survey about Americans’ experiences with gun-related violence and incidents. One in six (17%) say they personally witnessed someone being shot.

Smaller shares say that they have shot a gun in self-defense (4%) or personally been injured by one (4%). In all, slightly more than half (54%) of all adults say they have a connection to at least one of these gun-related incidents.  

Black adults (34%) are about twice as likely as White (17%) or Hispanic (18%) adults to say that they have a family member who was killed by a gun.  They are also about twice as likely as White adults to say they witnessed someone being shot (31% v. 14%), with Hispanic adults in between (22%).

Among the public overall, the vast majority say they worry at least “sometimes” that they or someone in their family will become a victim of gun violence. This includes small but important shares who say they worry about it “every day” (8%) or “almost every day” (10%).

About a third of both Hispanic (33%) and Black (32%) adults say they worry daily or almost daily that a family member will become a victim of gun violence, three times the share of White adults (10%). 

Parents of children under age 18 are more likely than other adults to say they worry daily or almost daily (24% v. 15%).

While most adults overall say they feel either “very” (41%) or “somewhat” (41%) safe from gun violence in their neighborhoods, significant shares say they feel “not too safe” (13%) or not safe at all (5%). One in six Black adults (17%) don’t feel at all safe in their neighborhoods, far greater than the share of White (2%) or Hispanic (9%) adults. 

About four in 10 adults (41%), and a similar share of parents with children at home (44%), say that they live in a household with guns. 

Among all adults with guns in their homes, three in four (75%) say that the guns are stored in ways that don’t reflect some common gun-safety practices.

Specifically, about half (52%) say that a gun in their home is stored in the same location as ammunition; more than four in 10 (44%) say that a gun is kept in an unlocked location; and more than third (36%) say that a gun is stored loaded.

Among parents in gun-owning households, about a third (32%) store a gun in an unlocked location, and the same share (32%) say a gun is stored loaded. Most (61%) store a gun in the same location as ammunition.

Small Shares Say Their Doctor or Child’s Pediatrician Talked to Them About Guns or Gun Safety

Amid a push for health professionals to treat gun safety as a public health issue, one in seven (14%) adults say that a health care provider has ever asked them if there were guns in their home, and 5% say that they talked about gun safety.

Among parents, a quarter (26%) say a pediatrician has ever asked them about guns in the home, and 8% say they talked about gun safety.Designed and analyzed by public opinion researchers at KFF, the survey was conducted from March 14-23, 2023, online and by telephone among a nationally representative sample of 1,271 U.S. adults, in English and in Spanish. The margin of sampling error is plus or minus 3 percentage points for the full sample. For results based on other subgroups, the margin of sampling error may be higher.

Strategies to Manage Unwinding Uncertainty for Medicaid Managed Care Plans: Medical Loss Ratios, Risk Corridors, and Rate Amendments

Authors: Elizabeth Hinton, Jada Raphael, and Kathleen Gifford
Published: Apr 10, 2023

Introduction

Managed care is the dominant delivery system for Medicaid enrollees with 72% of Medicaid beneficiaries nationally enrolled in comprehensive managed care organizations (MCOs), accounting for 52% of total Medicaid spending (or more than $376 billion) in FY 2021. States pay MCOs on a capitated basis – that is, a fixed per member per month payment that must be “actuarially sound” when set. Capitation rates are typically established prospectively for a 12-month rating period, regardless of changes in health care costs or utilization.1  However, as pandemic-related enrollment increases, utilization decreases, and other cost and acuity changes began to emerge, the Centers for Medicare & Medicaid Services (CMS) allowed states to modify managed care contracts and many states implemented COVID-19 related “risk corridors” (where states and health plans agree to share profit or losses), allowing for the recoupment of funds.

States and plans are now facing another period of heightened fiscal uncertainty due to the expiration of the continuous enrollment period (introduced at the start of the pandemic) on March 31, 2023. While millions could lose coverage during the unwinding – with some current enrollees no longer eligible, and others falling through the cracks due to renewal procedures — Medicaid MCOs may see overall average member acuity increase, since people who need more health care may be more likely to stay enrolled. This would result in higher per member utilization and costs. As they developed their 2023 MCO capitation rates, some states may have built in enrollment and acuity change assumptions related to unwinding, but considerable uncertainty remains.

This brief draws on data from KFF’s 22nd annual Medicaid budget survey to provide a high-level snapshot of states with minimum medical loss ratio (MLR) and remittance requirements and risk corridors (defined in Table 1 below) in place as of July 1, 2022 that may provide financial protection and limits on financial risk for states and plans as the unwinding unfolds. This brief also discusses states’ ability to amend capitation rates (during the rating period and retroactively) as the unwinding plays out.

Risk Mitigation Strategies and Rate Amendments

Background

As of July 2022, 41 states, including DC, contract with comprehensive, risk-based managed care plans to provide care to at least some of their Medicaid beneficiaries. Medicaid managed care organizations provide comprehensive acute care (i.e., most physician and hospital services) and in some cases long-term services and supports to Medicaid beneficiaries. MCOs accept a set per member per month payment for these services and are at financial risk for the Medicaid services specified in their contracts. Under federal law, payments to Medicaid MCOs must be actuarially sound.2 , 3  Actuarial soundness means that “the capitation rates are projected to provide for all reasonable, appropriate, and attainable costs that are required under the terms of the contract and for the operation of the managed care plan for the time period and the population covered under the terms of the contract.”

Unlike fee-for-service (FFS), capitation provides upfront fixed payments to plans for expected utilization of covered services, administrative costs, and profit. Plan rates are usually set for a 12-month rating period and must be reviewed and approved by CMS each year. States may use a variety of mechanisms to adjust plan risk, incentivize plan performance, and ensure payments are not too high or too low, including risk-sharing arrangements (including risk corridors), risk and acuity adjustments, medical loss ratios (MLRs, which reflect the proportion of total capitation payments received by an MCO spent on clinical services and quality improvement), or incentive and withhold arrangements.

In response to unanticipated COVID-19 costs and conditions that led to decreased utilization, CMS permitted states to make pandemic-related adjustments to managed care contracts and capitation rates to provide financial protection and limits on financial risk for states and plans. In 2021, more than half of MCO states reported implementing COVID-19-related risk corridors in their 2020 or 2021 contracts, and many states reported the recoupment of funds as a result. Since the start of the pandemic, Medicaid enrollment overall has grown substantially, resulting in increased MCO enrollment as well. Enrollment growth has been primarily attributed to the Families First Coronavirus Response Act (FFCRA) provision that required states to ensure continuous enrollment for Medicaid enrollees in exchange for a temporary increase in the Medicaid match rate.

The Consolidated Appropriations Act, 2023 ends the continuous enrollment provision and allows states to resume disenrollments starting April 1, 2023. States must initiate all renewals and other outstanding eligibility actions within 12 months. CMS has issued specific guidance allowing states to permit MCOs to update enrollee contact information and facilitate continued enrollment. The share of individuals disenrolled (and the pace of disenrollment) across states will vary due to differences in how states prioritize and process renewals. When states begin disenrollments, Medicaid managed care plans may see the acuity of their membership increase with implications for per member utilization and costs. In a recent KFF survey of non-profit safety net managed care plans, plans reported they expect the risk profile (or acuity) of members to increase (as a result of the unwinding), as plans anticipate “stayers” will be sicker than “leavers.” Plans also reported they expect MLRs to increase.

This brief describes minimum MLR and remittance requirements and risk corridors arrangements in place as of July 2022 that may provide financial protection and limits on financial risk for states and plans as another period of heightened uncertainty approaches. The brief also discusses states’ ability to amend previously certified and approved capitation rates already in place, including retroactive rate changes under certain circumstances. CMS requires states to document risk-sharing mechanisms (including MLR requirements and risk corridor arrangements) in health plan contracts and rate certification documents prior to the start of the rating period. States may be using a variety of other risk mitigation strategies and profit-sharing approaches, including profit caps, experience rebates, risk pools, reinsurance, and stop loss requirements, which are not covered in this issue brief.

Minimum Medical Loss Ratios (MLRs) and Remittance Requirements

WHAT ARE MLR AND REMITTANCE REQUIREMENTS?

The Medical Loss Ratio reflects the proportion of total capitation payments received by an MCO spent on clinical services and quality improvement, where the remainder goes to administrative costs and profits. To limit the amount that plans can spend on administration and keep as profit, CMS published a final rule in 2016 that requires states to develop capitation rates for Medicaid to achieve an MLR of at least 85% in the rate year.4 , 5  Plans must calculate and report an MLR and submit an annual MLR report to the state (within 12 months after the end of the contract year).6  A review conducted in 2020 by the HHS Office of Inspector General found that while most plans submitted required annual MLR reports, almost half were incomplete, while over a third of states indicated that they did not review all MLR data for accuracy. States are required to submit a summary of plans’ MLR reports annually to CMS with their rate certification and, as of October 1, 2022, are required to use the standard reporting template released by CMS. States are also required to submit an Annual Managed Care Program report that must include financial performance information for each MCO, including MLR experience.

While there is no federal requirement for Medicaid plans to pay remittances to the state if they fail to meet the MLR standard, states have discretion to require remittances. (A state and the federal government share in any remittances in proportion to the state’s federal matching rate—if the state requires remittances). For a limited time (from federal fiscal years 2021 through 2023), The Substance Use Disorder Prevention that Promotes Opioid Recovery and Treatment for Patients and Communities (SUPPORT) Act permits states to keep their regular state share of any remittances paid by Medicaid plans for expansion adults rather than only 10%.7  President Biden’s FY 2024 Budget proposes to require Medicaid managed care plans to meet an 85% minimum MLR and to require states to collect remittances if plans fail to meet the minimum MLR, estimating $20 billion in Medicaid savings over 10 years. Analysis of National Association of Insurance Commissioners (NAIC) data for the Medicaid managed care market show that average loss ratios in 2021 (in aggregate across plans) remained lower by three percentage points from 2019 (implying increased profitability).

WHAT ARE STATES DOING?

Nearly all MCO states reported a minimum MLR requirement is always in place for MCOs as of July 1, 2022 (Figure 1). While states must use plan reported MLR data to set future payment rates so that plans will “reasonably achieve” an MLR of at least 85%, states are not required to set a minimum MLR for their managed care plans. If states set a minimum MLR requirement, it must be at least 85%.8  Our findings represent a slight increase in the number of states that reported minimum MLR requirements compared to findings from OIG’s 2020 review. A few states noted that minimum MLRs may vary by program. Tennessee reported plans to implement a minimum MLR with remittance requirement in 2023 and Texas, a state with no state MLR requirement, reported an “experience rebate” requirement calculated on a graduated basis as a percentage of net income.

State Medicaid MCO Minimum Medical Loss Ratio (MLR) Requirements in Place as of July 1, 2022

More than two-thirds of MCO states report they always require remittance payments when an MCO does not meet minimum MLR requirements (Figure 2). Twenty-eight states reported that they always require MCOs to pay remittances, while five states indicated they sometimes require MCOs to pay remittances (Figure 2). States reporting that they sometimes require remittances may limit this requirement to certain MCO contracts. For example, Utah limits its remittance requirements to MCO contracts for the adult expansion population. Seven states do not require remittances (including four states that do not set a minimum MLR requirement).9 

State Medicaid MCO Minimum Medical Loss Ratio (MLR) Remittance Requirements in Place as of July 1, 2022

Risk Corridors

Nearly half of responding MCO states reported risk corridors were always in place in MCO contracts as of July 1, 2022 (Figure 3). Risk corridors provide financial protection to MCOs and limits on financial risk to states. Risk corridors allow states and health plans to share profit or losses (at percentages specified in plan contracts) if aggregate spending falls above or below specified thresholds (“two-sided” risk corridor). Risk corridor thresholds may be tied to a target MLR. Risk corridors may cover all/most medical services (and members) under a contract or may be more narrowly defined, covering a subset of services or members. States may introduce risk corridors on a time-limited basis – for example, following the expansion of coverage to new groups (e.g., ACA Medicaid expansion adults). Massachusetts reported an overall market risk corridor in addition to individual plan risk corridors. CMS allowed states to retroactively implement risk mitigation strategies, including risk corridors, in response to unanticipated costs and decreased utilization related to the COVID-19 pandemic.10 ,11  A few states reported implementing pandemic-related risk corridors beginning in 2020 but eliminated them in 2022 or 2023.

State Medicaid MCO Risk Corridors in Place as of July 1, 2022

Rate Amendments

Even if the risk mitigation strategies described above are in place, states may determine rate amendments are necessary if their actual unwinding experience differs significantly from the assumptions used for the initial certified rates. During the rating period, states may increase or decrease rates by 1.5% per rate cell (which apply to population subgroups with one or more common characteristics such as age, gender, eligibility category, and geographic region) without seeking CMS approval for the change (different rules apply for states with approved rate ranges per cell).12  To make a larger change, the state must submit a rate amendment for federal approval that addresses and accounts for all differences from the most recently certified rates. A state may also determine that a retroactive adjustment to capitation rates (i.e., change to previously paid rates) is necessary. Retroactive adjustments are permissible under certain circumstances but must be certified by an actuary and approved by CMS. In the preamble to its 2020 final rule, CMS noted that states can adopt retroactive rate adjustments when substantial coverage changes occur mid-year or adjustments are necessary to address disease outbreaks, launches of high-cost prescription drugs, or other unforeseen circumstances that increase benefit costs.

Looking Ahead

In a dynamic environment where future MCO enrollment and utilization levels are uncertain, risk mitigation tools – like MLR and remittance requirements and risk corridors – can help states and MCOs plan for the unknown, ensuring greater fiscal certainty for both. With the Medicaid continuous coverage requirement ending this spring, another period of Medicaid enrollment and utilization uncertainty is beginning. While all states are now resuming Medicaid redeterminations or will soon, the pace and timing of those redeterminations will vary by state resulting in fiscal implications that are unique to each state. Risk mitigation strategies may provide financial protection and limits on financial risk for states and plans as the unwinding unfolds. In its 2022-2023 Medicaid Managed Care Rate Development Guide, released in April 2022, CMS recommended that all states “implement a 2-sided risk mitigation strategy for rating periods impacted by the public health emergency.”

As the process plays out in each state, more current data may help inform states whether mid-year rate amendments may be needed. State Medicaid programs use the most recent and accurate enrollment, cost, and utilization data available to ensure that MCO capitation rates are actuarially sound and that MCOs are not over-paid or under-paid for the services they deliver. In most states, Medicaid redeterminations will occur over 10-12 months that will cross more than one MCO contracting year (as most states contract on a state fiscal year or a calendar year basis) and while MCO membership losses will be immediately apparent, new utilization and acuity trends may take longer to discern. As they developed their 2023 MCO capitation rates, some states may have built in enrollment and acuity change assumptions related to unwinding (e.g., like in Arizona), but considerable uncertainty remains. Executives of publicly-traded companies that operate Medicaid MCOs (including Elevance13  and UnitedHealth Group14 ) have expressed confidence in states and their 2023 Medicaid rate-setting actions to date; however, MCOs will likely closely monitor utilization and acuity changes going forward. Sarah London, CEO of Centene, noted during the Q4 2022 earnings call: “We are focused on ensuring that state program rates reflect any shifting of the risk pool created by membership changes. We recognize the dynamics in each market are different, so we are leveraging our data to support early collaborative discussions with our state partners.”15 

This brief draws on work done under contract with Health Management Associates (HMA) consultants Kathleen Gifford, Aimee Lashbrook, Mike Nardone, and Matt Wimmer.

  1. Medicaid and CHIP Payment And Access Commission, “Medicaid Managed Care Capitation Rate Setting,” March 2022; https://www.macpac.gov/wp-content/uploads/2022/03/Managed-care-capitation-issue-brief.pdf. ↩︎
  2. These requirements apply to comprehensive risk-based plans as well as limited-benefit plans (e.g., those providing only dental or behavioral health services). ↩︎
  3. The 2016 final rule on Medicaid managed care significantly strengthened the standards that states must meet in developing actuarially sound capitation rates and that CMS will apply in its review and approval of rates ↩︎
  4. Julia Paradise and MaryBeth Musumeci, CMS's Final Rule on Medicaid Managed Care: A Summary of Major Provisions, (Washington, DC: KFF, June 9, 2016), https://modern.kff.org/medicaid/issue-brief/cmss-final-rule-on-medicaid-managed-care-a-summary-of-major-provisions/. ↩︎
  5. The 85% minimum MLR is the same standard that applies to Medicare Advantage and private large group plans. ↩︎
  6. Center for Medicare and Medicaid (CMS), “Medicaid Managed Care Regulations with July 1, 2017 Compliance Dates,” last updated June 30, 2017, https://www.medicaid.gov/federal-policy-guidance/downloads/cib063017.pdf. ↩︎
  7. Center for Medicare and Medicaid (CMS), “Medicaid Managed Care Frequently Asked Questions (FAQs) – Medical Loss Ratio,” June 5, 2020, https://www.medicaid.gov/sites/default/files/Federal-Policy-Guidance/Downloads/cib060520_new.pdf. ↩︎
  8. 42 CFR § 438.8(c). ↩︎
  9. Georgia House Bill 1013, signed into law by Governor Kemp on April 4, 2022, establishes an MLR remittance requirement for MCOs effective for contract rating periods beginning on and after July 1, 2023. According to a 2021 Report by the HHS Office of Inspector General, Georgia did not have a state minimum MLR or remittance requirement in place as of September 2020. Further, rate certification reports reviewed for FY 2022 indicate that no MLR requirements were in place for FY 2022. (See:  Medicaid Rates for the Georgia Families and the Planning for Healthy Babies Program, July 1, 2021─June 30, 2022 Contract Period, Guidehouse for the State of Georgia Department of Community Health, April 1, 2021, and Medicaid Rates for the Georgia Families 360° Program, July 1, 2021─June 30, 2022 Contract Period, Guidehouse for the State of Georgia Department of Community Health, April 1, 2021, accessed at HMA Information Services.) ↩︎
  10. Center for Medicare and Medicaid (CMS), “Medicaid Managed Care Options in Responding to COVID-19,” May 14, 2020, https://www.medicaid.gov/sites/default/files/Federal-Policy-Guidance/Downloads/cib051420.pdf. ↩︎
  11. CMS, COVID-19 Frequently Asked Questions (FAQs) for State Medicaid and Children’s Health Insurance Program (CHIP) Agencies (last updated June 30, 2020), https://www.medicaid.gov/state-resource-center/downloads/covid-19-faqs.pdf (pgs. 83-84 V.C.6). ↩︎
  12. During the rating period, states may increase or decrease rates by a “de minimis amount” per rate cell. Federal regulations define the de minimis amount as 1.5% per rate cell (§438.7(c)(3)). If, however, the state initially elects to certify a rate range for a rate cell, the state is not permitted to use this de minimis change authority but may increase or decrease a capitation rate within a rate range by up to 1% during the rating period without submission of a new rate certification as long as the resulting rate does not fall outside of the 5 percent range limit allow by federal regulations (42 CFR §438.4(c)(2)(iii)). ↩︎
  13. John Gallina, Executive Vice President and Chief Financial Officer of Elevance Health Inc., stated: "We’ve been working very closely with our state partners on Medicaid and feel very good about the rating actions.” ↩︎
  14. Tim Spilker, CEO of UnitedHealthcare Community and State, indicated that states had taken redeterminations into account when setting rates for 2023 and further noted: “[R]evenue is in line with our expectations and consistent with the outlook that we shared in November. So, we're appreciative of the balanced rational view that our states have taken as they've looked ahead, knowing that we've got many factors coming forward.” ↩︎
  15. Centene Corporation 4th Quarter 2022 Earnings Call Transcript, February 7, 2023. ↩︎

Q & A: Implications of Two Conflicting Federal Court Rulings on the Availability of Medication Abortion and the FDA’s Authority to Regulate Drugs

Published: Apr 8, 2023

On June 13, 2024, the Supreme Court of the United States ruled in Alliance for Hippocratic Medicine (AHM) v. FDA that the AHM does not have standing to sue the FDA for injury. However, three state Attorneys’ Generals have intervened in this case in district court, and it is unclear how this action will shape the case when it goes back to the 5th Circuit Court of Appeals and then back to the originating federal district court.

On April 7, 2023, two conflicting rulings on the provision of mifepristone, the drug used for medication abortion, were issued by two separate federal court judges, one in Texas and one in Washington State. Judge Mathew Kacsmaryk, the judge in the US District Court for the Northern District of Texas Amarillo Division, issued a preliminary injunction in the case, Alliance for Hippocratic Medicine v. FDA, blocking the FDA’s approval of mifepristone dating back to 2000. The judge has stayed his decision for seven days to give the FDA time to appeal, but the ruling effectively impacts the entire nation and would effectively revoke the FDA approval granted to mifepristone in 2000.

On the same afternoon, Judge Thomas O. Rice from the United States District Court in the Eastern District of Washington ruled in a case that was filed by the Oregon and Washington Attorneys General joined by 16 other Attorneys General. The AGs are challenging the FDA’s decision to impose restrictions on prescribing and dispensing mifepristone through the Risk Evaluation and Mitigation System (REMS), claiming the restrictions on the dispensing of the drug imposed by the FDA are unnecessary and limit its availability. This ruling orders the FDA to maintain the current availability of mifepristone in the 17 states and DC, the plaintiffs in this case.

As a result, the FDA has conflicting orders: to suspend its approval mifepristone on one hand and not to alter its approval effective January 2023, on the other. Because these two federal court rulings conflict, the Supreme Court could be called upon to resolve this conflict and decide the merits of both cases. This Q&A summarizes some of the key issues related to these rulings.

Who are the plaintiffs that are suing to block medication abortion?

The plaintiffs in the Texas case, Alliance for Hippocratic Medicine (a newly formed anti-abortion advocacy coalition); the American Association of Pro-Life Obstetricians and Gynecologists; the American College of Pediatricians; and the Christian Medical and Dental Associations, as well as three individual doctors challenged the FDA’s approval of mifepristone, one of the drugs used in medication abortion. The plaintiffs are challenging the FDA’s approval process and subsequent modifications of the conditions for dispensing mifepristone (known as REMS) as being beyond the FDA’s authority. The plaintiffs also contend that an 1873 anti-obscenity law, the Comstock Act, prohibits the mailing of any medication used for abortion (for details on the case see: Legal Challenges to the FDA Approval of Medication Abortion Pills). The Judge’s ruling in this case directs the FDA to suspend its approval of the mifepristone while the litigation continues, but gives the FDA seven days to appeal the case to the 5th Circuit before the order takes effect. This ruling would block the sale and distribution of mifepristone in the entire country, and would also block access to the drug in states where abortion is legal and protected.

What is the lawsuit filed by Democratic State Attorneys General?

The Oregon and Washington Attorneys General joined by 16 other Attorneys General are also challenging the FDA’s decision-making about mifepristone, but rather than challenging the FDA approval process, the plaintiffs are calling into question the FDA’s decision to impose restrictions on prescribing and dispensing mifepristone through the Risk Evaluation and Mitigation System (REMS). As of January 3, 2023, mifepristone can only be prescribed by a certified provider and the drug can only be provided by a certified pharmacy or clinician. The judge in this case has issued a preliminary injunction blocking the FDA from changing any rules that would impact the availability of mifepristone in states bringing the lawsuit (WA, OR, CO, CT, IL, NV, AZ, RI, OR, DE, MI, NM, VT, HA, MD, ME, MN, PA, and DC).

What is medication abortion?

The most common medication abortion regimen in the United States involves the use of two different medications: mifepristone and misoprostol, which are FDA approved. Mifepristone, also known as the abortion pill, or RU-486 is sold under the brand name Mifeprex and through a generic manufactured by GenBioPro in the United States. The FDA has found that medication abortion is a safe and highly effective method of pregnancy termination. When taken up to 70 days of pregnancy, the medication abortion regimen successfully terminates the pregnancy 99.6% of the time, with a 0.4% risk of major complications, and an associated mortality rate of less than 0.001 percent (0.00064%). Mifepristone was first approved by the FDA in 2000, and by 2021, over half of abortions in the US were medication abortions. Despite being available for medication abortion for over two decades, there is still considerable confusion about the drug in this country. A KFF poll conducted in January 2023 found that about half of the public was unsure as to whether medication abortion is legal in their state, including four in ten (41%) women ages 18 to 49 and half of women living in states where abortion is legal.

A little-known fact is that mifepristone, under the brand name Korlym, was also FDA-approved in 2012 without any REMS to manage blood sugar levels (hyperglycemia) in adults with endogenous Cushing’s syndrome. Korlym is a higher dose of mifepristone than Mifeprex and is taken daily.

There is also a different medication abortion protocol using misoprostol alone that is more commonly used internationally. Misoprostol is frequently used in obstetrics and gynecology for procedures like the medical management of miscarriage, induction of labor, cervical ripening before surgical procedures, and the treatment of postpartum hemorrhage. While misoprostol is FDA approved for many medical uses, it has not been FDA approved for abortions, meaning it is used “off label” for this purpose in the US. The regimen is also recommended for up to 70 days (10 weeks) of pregnancy. Research has shown the misoprostol-only regimen to be a safe and highly effective method of pregnancy termination, however it may result in a higher incidence of side effects. Some U.S. telehealth organizations have been providing the misoprostol-only regimen as an option for medication abortion for several years.

Will medication abortion continue to be available?

It is too soon to tell what the impact will be on the availability of medication abortion. It’s not known how the FDA will act in response to the two conflicting rulings. The FDA approves drugs for the whole country and does not vary its approval by state. If the FDA is forced to suspend its approval of mifepristone, some clinics may respond to this ruling by switching from the mifepristone/misoprostol regimen to using a higher dose of misoprostol alone.

What is the next step in the litigation?

Hours after Judge Kacsmaryk’s ruling, the FDA filed a notice of appeal to the US Court of Appeals for the 5th Circuit and Attorney General Merrick Garland said the government would request a stay to block this ruling while the appeal is considered. If the 5th Circuit does not grant this request, the FDA is likely to appeal immediately to the Supreme Court of the United States to block the ruling during the appeal process. If the case is appealed but the courts do not provide a stay, then the distribution of mifepristone could be halted across the nation pending the final outcome of the case.

The FDA may not appeal Judge Rice’s decision as it directs the FDA to keep the status quo. The Attorneys General who brought the case may appeal the decision to the 9th Circuit to seek an injunction to block the enforcement of the REMS approved in January 2023.

As both of these cases involve the FDA approval and provision of mifepristone, it is likely that if they reach the Supreme Court, it will review the cases together.

Are there other lawsuits that involve mifepristone?

Some are questioning how the new state authority to regulate or ban abortion intersects with the Federal FDA’s authority to regulate drugs. There are currently two cases in federal court challenging state abortion prohibitions and restrictions on federal preemption grounds. The maker of a generic mifepristone medication, GenBioPro, Inc., is challenging West Virginia’s total abortion ban, and an ob-gyn, Dr. Amy Bryant, is challenging the abortion restrictions in North Carolina, which include requirements that mifepristone be dispensed in person by a physician following a state-mandated counseling session and a 72-hour waiting period. In both cases, plaintiffs argue that the FDA’s authorization and regulation of mifepristone preempt state law banning the use of the medication or regulating its use more strictly, and given this, enforcement of the state laws should be blocked. If these lawsuits are successful, people living in states where abortion is banned could access medication abortion.

What impact do these rulings have on the FDA’s approval of other drugs?

These rulings will likely have implications far beyond abortion, though it is still too soon to tell. Court challenges such as these could open the door for other actors to potentially sue to block the approval of existing or new drugs that may be considered controversial, such as vaccines or treatments for conditions that are at the crosshairs of so-called “culture wars.” Manufacturers may be reluctant to bring to market certain new drugs or treatments if they are concerned that a court ruling could block their approval in the future.