VOLUME 26

States Expand Access to Ivermectin as Cancer Myths Continue, and Abortion Pill Faces False Water Supply Claim


Summary

This volume examines how unsupported claims about ivermectin as a cancer treatment have coincided with legislative efforts to expand access to the drug. It also explores the promotion of unproven “detox” supplements in response to falsehoods about the spike protein from the COVID-19 virus and vaccine, along with the unsubstantiated claim that byproducts from medication abortion pills contaminate the water supply. Lastly, it analyzes the renewed debate over ADHD diagnoses and treatments, including how stigma and shifting policy may affect treatment access.


Recent Developments

State Policy Changes Follow Ongoing Promotion of Ivermectin as Cancer Treatment

Callista Images / Getty Images

Persistent unsupported claims about ivermectin’s effectiveness in treating a range of diseases, including cancer and COVID-19, have coincided with state-level policy efforts to make the drug more accessible. While some studies have suggested ivermectin may enhance the efficacy of chemotherapy and immunotherapy drugs, its use for cancer treatment has not been extensively studied in humans and it is not approved by the Food and Drug Administration (FDA) for this purpose. Oral ivermectin is currently FDA-approved to treat certain parasitic infections in humans, like strongyloidiasis and onchocerciasis, and topical forms are approved to treat head lice and rosacea. Some social media users, though, continue to promote it as a cancer treatment, often sharing personal testimonials that frame the drug as a “miracle cure.” KFF’s monitoring of social media found that the share of cancer-related posts mentioning ivermectin doubled, albeit from a small share to start, in the first half of 2025 compared to all of 2024, with such posts accounting for more than 4% of all cancer-related content identified in our search this year. Between May 28 and June 26, some of the most-engaged-with posts relating to ivermectin as a cancer treatment came from a medical influencer with more than 565,000 followers on X. Their posts called ivermectin a “cutting-edge” cancer treatment and cited anecdotal stories of alleged success treating cancer with ivermectin and other anti-parasitic drugs.

Sixteen states have introduced or passed bills that would make ivermectin available over-the-counter, although pharmacists have expressed reluctance to dispense it without FDA approval for non-prescription or off-label use. Although some share personal stories of themselves or people they know treating their cancer with ivermectin, no major health organizations or regulatory bodies have approved it for cancer treatment, and the use of ivermectin could pose health risks. According to the FDA, ivermectin can interact with other medications, including blood thinners, and overdoses may lead to seizures, coma, or death. Claims that ivermectin can treat cancer may also lead some patients to pursue alternative treatments or delay effective therapies, both of which may result in higher mortality rates.

Polling Insights: KFF polling from 2023 found that about half (48%) of the public has heard the false claim that ivermectin is an effective treatment for COVID-19. While few adults overall say they think this myth is definitely true (6%), seven in ten express uncertainty, saying it is either “probably true” (26%) or “probably false” (44%).

There are notable partisan differences when it comes to believing or leaning toward believing this false claim. About half (48%) of Republicans say it is either “definitely true” or “probably true” that ivermectin is an effective treatment for COVID-19, compared to about three in ten independents (28%) and one in five Democrats (18%).

Few Adults Think the Myth That Ivermectin Can Effectively Treat COVID-19 is Definitely True, But Seven in Ten Express Uncertainty

Unproven “Detoxes” for Spike Protein from COVID-19 Virus and Vaccine Gain Renewed Attention Online

CHRISTOPH BURGSTEDT/SCIENCE PHOTO LIBRARY / Getty Images

Mentions of alleged spike protein “detoxes” have increased on social media, fueled by continued falsehoods that the spike protein produced during COVID-19 exposure or vaccination lingers in the body and causes long-term harm. There is no evidence that the spike protein from vaccines is toxic or remains in the body for an extended period, yet “detox” products continue to be marketed online. The largest volume of social media mentions in 2025, as identified in our search of terms related to spike protein “detoxes,” occurred on May 26, following reports of alleged vaccine-related injuries. Mentions rose again in June when a podcast host posted on X promoting a $90 supplement that claims to “break down spike protein and disrupt its function.” In reality, the spike protein produced by an mRNA vaccine only attaches to the outer layer of cells to trigger an immune response against future illness and typically clears from the body after a few days.

A popular “detox” formula, which is marketed by a medical doctor whose credentials were revoked for promoting false claims about COVID-19 vaccines, contains nattokinase, bromelain, and curcumin. These supplements are generally considered safe, but their use as spike protein detoxes lacks scientific support and may carry risks. Nattokinase and bromelain have blood-thinning properties that can interact with anticoagulant or antiplatelet medications, potentially increasing the risk of excessive bleeding. Curcumin may pose similar risks and has been associated with liver injury in some cases. Infectious disease doctors warn that promoting unnecessary and potentially harmful “detox” products may further erode public trust in the safety of COVID-19 vaccines.

Abortion Opponents Fabricate Concerns About Water Contamination in Effort to Restrict Access to Abortion Pills

KFF / Getty Images

The baseless narrative that medication abortion pills, particularly mifepristone, contaminate the water supply through urine and menstrual blood is circulating online alongside unfounded claims that abortion pill byproduct in water systems can lead to negative impacts on fertility, public health, and the environment. Federal agencies and independent researchers have found no evidence that mifepristone contaminates the water supply at levels that cause harm, but unsupported claims have appeared sporadically over the past few years, recently gaining traction in late June.

On June 17, a report from an advocacy group that opposes abortion access alleged that over 40 tons of fetal remains and abortion pill byproducts have entered the water system, potentially causing infertility and other reproductive health problems. The report did not include any evidence to substantiate the allegation. While the report was not covered by major news outlets, it circulated widely through non-mainstream news, anti-abortion advocacy groups, and policymakers who called for federal agencies to test the water supply for abortion pill byproducts. The following day, twenty-five House and Senate Republicans signed a letter to the Environmental Protection Agency (EPA) calling for an investigation into the matter. Later, a video clip circulated widely online of a U.S. congresswoman who opposes abortion stating, without evidence, that the water supply is “severely contaminated” by abortion drugs. Social media users who shared the clip amplified the claim, including one X user with more than 259,000 followers. Others questioned the legitimacy of the claim by noting that the FDA and environmental scientists have found no basis for this claim.

An environmental assessment conducted as a part of the FDA’s approval process for the drug estimated its environmental concentration to be less than one part per billion – an amount considered too low to affect standard test organisms. The FDA has described that estimate as conservative because it does not account for metabolism of the drug by the human body or the ability of wastewater treatment plants to remove pharmaceuticals from water. Despite a lack of evidence of harm, state lawmakers in Wyoming and Texas introduced bills earlier this year aiming to mandate testing of water supplies for excreted fetal tissue and abortion medication byproduct. As access to mifepristone remains at risk, these narratives and legislative efforts may contribute to further restrictions on abortion access through arguments not grounded in science and unrelated to medical safety or reproductive rights. Additionally, elevating these unproven claims to call for a federal investigation, despite the lack of scientific basis, could further erode trust in public health institutions and regulatory bodies.

Debate Over ADHD Medication Resurfaces on Social Media

AndreyPopov / Getty Images

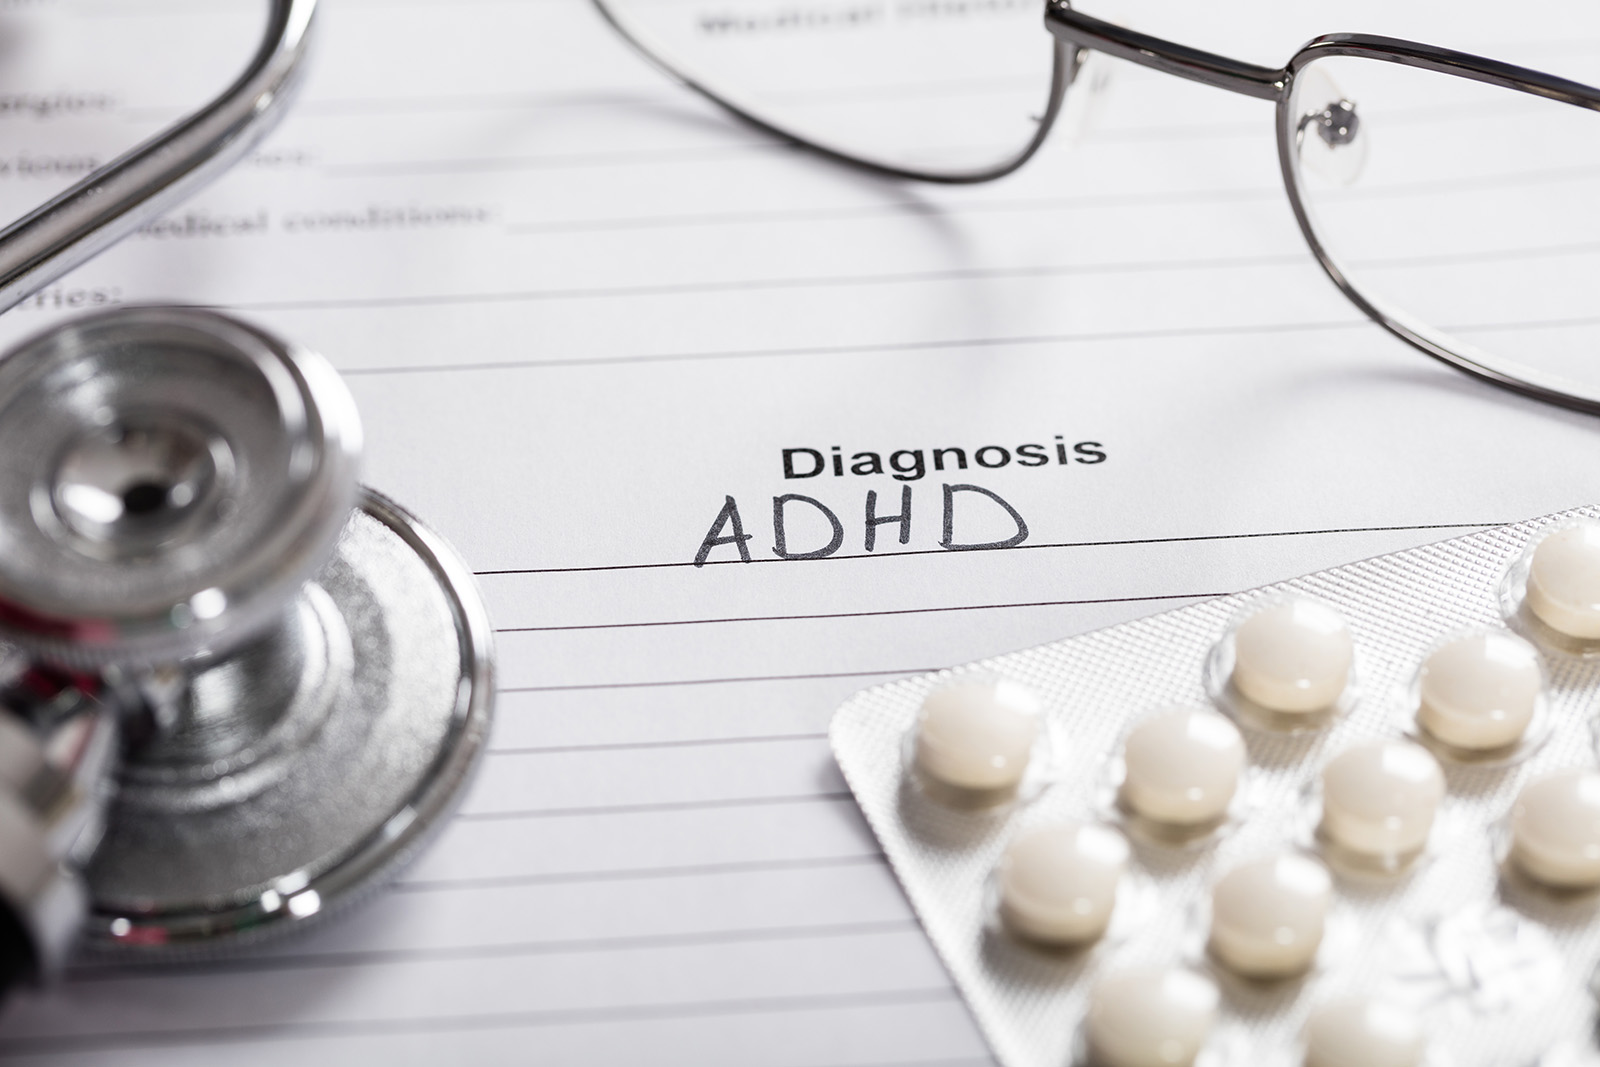
Concerns about the overmedicalization of attention-deficit hyperactivity disorder (ADHD) have existed for decades, with the scientific community divided over how often the condition is overdiagnosed or overtreated. The ongoing debate coincides with rising diagnoses, although nearly one-third of those diagnosed receive no treatment. A 2021 scoping review found evidence of overdiagnosis and overtreatment, particularly among youth with mild symptoms, but other literature attributes rising diagnoses to shifting diagnostic criteria, greater public awareness, and historic disparities in underrepresented populations.

The long-running public debate was renewed by the resurfacing of a 2005 interview with actor Tom Cruise, who criticized the legitimacy of psychiatric diagnoses and pharmaceutical treatments. The video, reposted in late May, became the most shared post on X identified through our search of terms related to ADHD medications between May 27 and June 25. Some users praised Cruise’s skepticism and repeated claims that pharmaceutical companies have over-influenced mental health care. Others repeated stigmatizing claims about ADHD medication, including linking it to violence, despite multiple studies showing that ADHD medications reduce the risk of criminality, self-harm, and other adverse outcomes. These narratives may contribute to stigma around ADHD and its treatment, potentially dissuading individuals or parents from seeking or continuing treatment. Claims of overmedicalization have also influenced recent policy discussions. A May report from the White House’s Make America Healthy Again (MAHA) Commission identified overmedicalization as a key factor in childhood chronic disease. The report further claimed that there is evidence that ADHD medications do not improve long-term outcomes, but ADHD specialists and advocacy groups have argued that the research cited is flawed and does not account for changes in medication practices. Proposed changes by the Drug Enforcement Administration (DEA) to its telemedicine rules have also raised concern about access to ADHD medication. The agency said it received 38,000 comments on its proposed rules, many of which expressed concern that the changes might limit availability. Nearly half of adults with ADHD reported having used telehealth to receive treatment.


AI & Emerging Technology

Study Finds Small Language Changes Can Alter AI Medical Advice

Abdullah Durmaz / Getty Images

As medical providers seek to incorporate artificial intelligence (AI) tools in clinical environments, new research from the Massachusetts Institute of Technology (MIT) finds that large language models (LLMs) may generate inconsistent medical advice to users based on small changes to patient messages, like including typos, extra white spaces, or colloquial language. Researchers tested four commonly used LLMs by introducing minor, non-clinical language changes designed to simulate messages that might be written by different patient populations seeking advice from these models. This included people with limited English proficiency or health anxiety.

Across all of the altered messages, LLMs were 7-9% more likely to recommend self-management solutions rather than seeking medical care. The study compared these recommendations to those of clinicians and found that in many cases, the AI suggested self-management when providers would recommend escalating medical care. The effect was amplified for women, with researchers noting that the models made about 7% more errors for female patients and were more likely to recommend self-management. Researchers cautioned that the models’ sensitivity to irrelevant linguistic cues, particularly those designed to mimic vulnerable populations, could lead to uneven care recommendations and reinforce health disparities.

About The Health Information and Trust Initiative: the Health Information and Trust Initiative is a KFF program aimed at tracking health misinformation in the U.S., analyzing its impact on the American people, and mobilizing media to address the problem. Our goal is to be of service to everyone working on health misinformation, strengthen efforts to counter misinformation, and build trust. 


View all KFF Monitors

The Monitor is a report from KFF’s Health Information and Trust initiative that focuses on recent developments in health information. It’s free and published twice a month.

Sign up to receive KFF Monitor
email updates


Support for the Health Information and Trust initiative is provided by the Robert Wood Johnson Foundation (RWJF). The views expressed do not necessarily reflect the views of RWJF and KFF maintains full editorial control over all of its policy analysis, polling, and journalism activities. The data shared in the Monitor is sourced through media monitoring research conducted by KFF.

Donor Government Funding for HIV in Low- and Middle-Income Countries in 2024

Authors: Adam Wexler, Jennifer Kates, and Eric Lief
Published: Jul 10, 2025

Overview

This report, Donor Government Funding for HIV in Low- and Middle-Income Countries in 2024, tracks funding levels of the donor governments that collectively provide the bulk of international assistance for AIDS through bilateral programs and contributions to multilateral organizations. The new report, produced as a partnership between KFF and UNAIDS, provides the latest data available on donor funding disbursements based on data provided by governments. It includes their bilateral assistance to low- and middle-income countries and contributions to the Global Fund to Fight AIDS, Tuberculosis and Malaria as well as UNITAID.

Previous versions by publish date:

July 2023 (.pdf)

July 2022 (.pdf)

July 2021 (.pdf)

July 2020 (.pdf)

July 2019 (.pdf)

July 2018 (.pdf)

July 2017 (.pdf)

July 2016 (.pdf)

July 2015 (.pdf)

July 2014 (.pdf)

September 2013 (.pdf)

July 2012 (.pdf)

July 2011 (.pdf)

July 2010 (.pdf)

July 2009 (.pdf)

July 2008 (.pdf)

June 2007 (.pdf)

July 2006 (.pdf)

July 2005 (.pdf)

Key Findings

In 2025, the donor government funding landscape fundamentally changed. Under the new administration, the United States, the largest donor to HIV in the world, has instituted significant changes to global health programs including freezing, and then cancelling, most global HIV projects, restricting allowable activities, and seeking to cut HIV funding by at least 40%, actions which have collectively driven down disbursements. In addition, several other large donors to HIV – the United Kingdom, Germany and France – have also signaled reductions in their development assistance budgets. As such, this report, which focuses on both bilateral and multilateral funding for HIV provided by donor governments in 2024 and shows an increase over 2023, is likely the high watermark as funding will likely decline moving forward. While the U.S. has shouldered much of the burden of funding the HIV response, its abrupt reductions leave large gaps and could set back the HIV response, as some studies have already found. Key findings are as follows:

  • Donor government funding for HIV increased in 2024 compared to the prior year. Disbursements for combined bilateral and multilateral support were US$8.37 billion in 2024, an increase of US$460 million compared to 2023 (US$7.91 billion), in current U.S. dollars (not adjusted for inflation).1  Funding increased even after accounting for exchange rate fluctuations. Looking more broadly, donor government funding for HIV in 2024 was at its highest level since 2014 (US$8.60 billion), but still below that peak.
  • The increase in 2024 was almost entirely due to the timing of disbursements by the U.S., not actual changes in funding commitments. The timing of disbursements, or payouts, by donor governments fluctuates each year and those fluctuations can affect overall levels of funding availability, independent of donor funding commitments. In 2024, the U.S. government’s disbursements for HIV increased significantly, while the U.K.’s payout declined, but both were due to the timing of payouts. Other donors had similar fluctuations. Because the U.S. is the largest donor, its fluctuations drove up overall funding levels in 2024.
  • Bilateral funding increased in 2024, driven by payout timing. Bilateral funding totaled US$5.87 billion in 2024, an increase of US$241 million compared to 2023 (US$5.63 billion), with five donors providing increased disbursements. The increase was primarily the result of higher funding from the U.S., due to the timing of payouts, and the U.K., as well as slight increases from Australia, Japan, and Norway. Funding from eight donor governments decreased and two remained flat.
  • Multilateral funding, which is the main channel of support for HIV used by most donor governments, also increased in 2024, similarly due to the timing of contributions. Multilateral funding totaled US$2.50 billion in 2024, an increase of US$218 million compared to 2023 (US$2.28 billion). Six donor governments increased multilateral support, while four remained flat, and five declined. Most multilateral funding for HIV was provided to the Global Fund (US$2.27 billion or 91%) with smaller amounts provided to UNAIDS (US$169 million or 7%) and UNITAID (US$59 million or 2%). The timing of payments to the Global Fund drove the multilateral increase in 2024.
  • The U.S. has consistently been the largest donor to HIV. In 2024, the U.S. provided US$6.69 billion for HIV (bilateral and multilateral combined), accounting for 80% of total donor government support.2  France was the second largest donor (US$314 million, 4%), followed by Germany (US$226 million, 3%), the U.K. (US$218 million, 3%), and the Netherlands (US$192 million, 2%).3 ,4  Even when standardized by the size of its economy (per million GDP), the U.S. ranked first. The next largest donor, per million GDP, was the Netherlands, followed by Denmark, France, and Norway.

Looking ahead, donor government funding for HIV is expected to decline in 2025 and beyond. Due to the new administration’s actions targeting U.S. foreign assistance programs, including for global health and HIV, U.S. disbursements for HIV this year are well below prior year levels.5  In addition, the administration has asked Congress to rescind (formerly cancel) approximately US$400 million in bilateral HIV funding for 2025 and has proposed reducing the HIV budget by at least 40% in 2026. If these cuts were to materialize, other donor governments would have to more than double their HIV funding to maintain current levels. Given that the U.S. has already reduced HIV spending in 2025 and several other large donors have announced plans to reduce foreign assistance, funding for HIV in low- and middle-income countries is highly likely to decline.

Report

Introduction

This report provides the latest available data on donor government resources provided to address HIV in low- and middle-income countries, reporting on disbursements made in 2024. It is part of a collaborative tracking effort between UNAIDS and KFF that began almost 20 years ago, just as new global initiatives were being launched to address the epidemic. The analysis includes data from all 33 members of the Organisation for Economic Co-operation and Development (OECD)’s Development Assistance Committee (DAC), as well as non-DAC members who report data to the DAC. Data are collected directly from donor governments, UNAIDS, the Global Fund, and UNITAID, and supplemented with data from the DAC. Of the 33 DAC members, fifteen provide 98% of total disbursements for HIV; data for these donors are presented individually. For the remaining 18 DAC members, data are provided in aggregate. All totals are presented in current U.S. dollars (amounts are not adjusted for inflation). While totals include both bilateral and multilateral assistance for the entire period (2002-2024), detailed disaggregated bilateral and multilateral amounts for all donors are only available starting in 2011 (see Methodology for more detail).

Importantly, given that the donor government funding landscape fundamentally changed in 2025, the data provided here likely represent a high watermark for HIV funding. Under the new administration, the United States, the largest donor to HIV in the world, began instituting significant changes to global health programs in January 2025, including freezing, and then cancelling, most global HIV projects, restricting allowable activities, and seeking to cut HIV funding by at least 40%, actions which have collectively driven down disbursements. If U.S. reductions continue and future cuts were to be enacted, other donor governments would have to more than double their funding to maintain current levels. Yet several other large donors to HIV – the United Kingdom, Germany and France – have also signaled reductions in their development assistance budgets, making it highly likely that future funding will be reduced.

Findings

Total Funding

In 2024, donor government funding for HIV through bilateral and multilateral channels totaled US$8.37 billion in current USD (not adjusted for inflation) and accounted for approximately 44% of the US$18.7 billion estimated by UNAIDS to be available to address HIV.6 ,7 ,8 ,9  As per UNAIDS estimates, domestic resources accounted for 52%, and the remainder (4%) was from foundations, other multilateral organizations, and UN agencies.

Donor government funding for HIV in 2024 increased by US$460 million compared to 2023 (US$8.37 in 2024 compared to US$7.91 billion in 2023) and reached the highest level since 2014 (US$8.60 billion), though it is still below that highpoint (See Figure 1 and Table 1).10 

HIV Funding from Donor Governments, 2002-2024

Donor Government Funding for HIV (bilateral & multilateral), 2011-2024 (current USD in millions)

The increase in 2024 was almost entirely due to the timing of disbursements, or payouts, by donor governments, which can fluctuate from year-to-year, not actual changes in funding commitments. For instance, U.S. disbursements increased significantly in 2024 while funding from the U.K. declined, but both were due to the timing of payouts. As two of the world’s largest donors, these fluctuations can have an outsized impact on the overall amount of available funding in a given year.

The U.S. continued to be the largest donor to HIV efforts, providing US$6.69 billion and accounting for 80% of total donor government funding in 2024.11  The second largest donor was France (US$314 million, 4%), followed by Germany (US$226 million, 3%), the U.K. (US$218 million, 3%), and the Netherlands (US$192 million, 2%).12 ,13  In 2024, 91% of total donor government funding for HIV was provided by these five donors.

Bilateral Disbursements

Bilateral disbursements for HIV from donor governments – that is, funding disbursed by a donor on behalf of a recipient country or region – totaled US$5.87 billion in 2024, an increase of US$241 million compared to 2023 (US$5.63 billion). Despite the increase, bilateral funding from most donor governments decreased or remained flat and most of the overall increase was attributable to the U.S. and the U.K. When the increases from the U.S. and U.K. are removed, bilateral funding from all other donor governments declined by US$49 million in 2024 (US$237 million) compared to 2023 (US$286 million). These trends were the same after accounting for exchange rate fluctuations.

Bilateral disbursements from the U.S. increased by almost US$200 million in 2024 (US$5.43 billion) compared to 2023 (US$5.23 billion), due to the timing of payouts, but not actual increases in funding commitments. In fact, bilateral HIV funding as specified by the U.S. Congress in annual appropriations bills has been flat for several years (see Figure 2).14 ,15 

Bilateral HIV Funding from the United States, Appropriations vs. Disbursements, 2011-2024

Multilateral Contributions

Multilateral contributions from donor governments to the Global Fund, UNITAID, and UNAIDS for HIV – funding disbursed by donor governments to these organizations which in turn use some (Global Fund and UNITAID) or all (UNAIDS) of that funding for HIV – totaled US$2.50 billion in 2024 (after adjusting for an HIV share to account for the fact that the Global Fund and UNITAID address other diseases). This represents an increase of US$218 million compared to 2023 (US$2.28 billion).16 ,17  The Global Fund accounted for most of the multilateral funding for HIV in 2024 (US$2.27 billion or 91%), followed by UNAIDS (US$169 million or 7%) and UNITAID (US$59 million or 2%).

The increase in 2024 disbursements was due to the timing of payments to the Global Fund, particularly from the U.S., which is required by law not to exceed 33% of total contributions to the Global Fund from all donors and results in significant year-to-year differences depending on the amounts other donors have provided.18  In addition, funding from donor governments to the Global Fund often fluctuates reflecting different Global Fund pledge periods. For instance, some donors choose to “front-load” contributions (e.g., the U.K. fulfilled almost its entire pledge for 2023-2025 in 2023 resulting in a significant decrease in 2024), while others choose to fulfill pledges towards the end of the pledge period (e.g., Australia and Denmark did not provide any contribution in 2023, but both fulfilled more than half their pledges in 2024).

Most donor governments provide the majority of their HIV funding through multilateral organizations. In 2024, eleven provided more than 80% of their HIV funding multilaterally; only Denmark, the Netherlands, the U.K., and the U.S. provided a larger share bilaterally (Figure 3). While the U.K. provided most of its HIV funding bilaterally in 2024, this was entirely due to the timing of payments to the Global Fund. The U.K. fulfilled almost its entire pledge to the Global Fund for 2023-205 in 2023 resulting in significantly lower levels of multilateral funding in 2024. In fact, between 2019-2023, most HIV funding from the U.K. was provided through multilateral channels.

HIV Funding from Donor Governments by Funding Channel, 2024

Fair Share

There are different ways to measure donor government contributions to HIV, relative to one another. While the U.S. government provides the largest amount of funding for HIV, for example, it also has the largest economy in the world. To assess relative contributions, or “fair share”, two measures were used: ranking by overall funding amount and ranking by funding for HIV per US$1 million GDP, to adjust for the size of donor economies (See Table 2):

  • Rank by share of total donor government funding for HIV: By this measure, the U.S. ranked first in 2024, followed France, Germany, the U.K., and the Netherlands. The U.S. has ranked #1 in absolute funding amounts since tracking efforts began.
  • Rank by funding for HIV per US$1 million GDP: By this measure, the U.S. ranks first, followed by the Netherlands, Denmark, France, and Norway (See Figure 4).19 

Assessing Fair Share Across Donor Governments, 2024

Donor Government Ranking by Funding for HIV per US$1 Million GDP, 2024

Looking Forward

Donor government funding for HIV in low and middle-income countries is likely to decline in 2025. While the anticipated decline is largely due to actions by the new administration, which have already resulted in lower disbursements in 2025, other donor governments have also indicated plans to reduce foreign assistance. Looking beyond 2025, the new administration has proposed to reduce HIV funding by at least 40% in 2026. Since the U.S. is the world’s largest donor to the global HIV response, a cut in funding of this size would require other donor governments to more than double their funding to fill the gap, an increase that seems unlikely. While final funding amounts are determined by the U.S. Congress, the administration’s actions may continue to have the effect of reducing HIV funding from the U.S.

This work was supported in part by the Joint United Nations Programme on HIV and AIDS (UNAIDS) and the Bill & Melinda Gates Foundation. KFF maintains full editorial control over all of its policy analysis, polling, and journalism activities.

Adam Wexler and Jen Kates are with KFF. Eric Lief is an independent consultant. Joint United Nations Programme on HIV and AIDS (UNAIDS).

Methodology

This project represents a collaboration between the Joint United Nations Programme on HIV/AIDS (UNAIDS) and KFF. Data provided in this report were collected and analyzed by UNAIDS and KFF.

Totals presented in this analysis include both bilateral funding for HIV in low- and middle-income countries, core contributions to UNAIDS, and the estimated share of donor government contributions to the Global Fund and UNITAID that are used for HIV. Amounts are based on analysis of data from the 32 donor government members of the Organisation for Economic Co-operation and Development (OECD) Development Assistance Committee (DAC) in 2024 who had reported Official Development Assistance (ODA). Bilateral and multilateral data were collected from multiple sources. Disaggregated bilateral and multilateral data are only available starting from 2011.

Data on gross domestic product (GDP) were obtained from the International Monetary Fund’s World Economic Outlook Database and represent current price data for 2024 (see: https://www.imf.org/en/Publications/WEO/weo-database/2025/April).

Bilateral Funding:Bilateral funding is defined as any earmarked (HIV-designated) amount, including earmarked non-core (“multi-bi”) contributions to multilateral organizations, such as UNAIDS. Data included in this report represent funding assistance for HIV prevention, care, treatment and support activities, but do not include funding for international HIV research conducted in donor countries (which is not considered in estimates of resource needs for service delivery of HIV-related activities).

The research team collected the latest bilateral funding data directly from twelve governments: Australia, Canada, Denmark, France, Germany, Ireland, Japan, the Netherlands, Norway, Sweden, the United Kingdom, and the United States during the first half of 2025, representing the fiscal year 2024 period. Direct data collection from these donors was desirable because they represent the preponderance of donor government assistance for HIV and the latest official statistics – from the Organisation for Economic Co-operation and Development (OECD) Creditor Reporting System (CRS) (see: http://www.oecd.org/dac/stats/data) – are from 2023 and do not include all forms of international assistance (e.g., certain funding streams provided by donors, such as HIV components of mixed-purpose grants to non-governmental organizations). Data for all other member governments of the OECD DAC – Austria, Belgium, the Czech Republic, the European Commission, Estonia, Finland, Greece, Hungary, Iceland, Italy, Korea, Lithuania, Luxembourg, New Zealand, Poland, Portugal, the Slovak Republic, Slovenia, Spain, and Switzerland – which collectively accounted for less than 5 percent of bilateral disbursements in each of the past several years, were obtained from the OECD CRS database and are from calendar year 2023.

In 2025, France provided data revising prior year amounts to account for “set-aside” funding (adjusted for an HIV-share) that supports Global Fund related activities. While this funding is considered part of France’s pledge to the Global Fund, it is not counted by the Global Fund as a direct contribution and is instead included under bilateral totals in this analysis. Due to this update, amounts presented in this report will differ from prior reports.

Where donor governments were members of the European Union (EU), the research team ensured that no double-counting of funds occurred between EU Member State reported amounts and European Commission (EC) reported amounts for international HIV assistance. Figures obtained directly using this approach should be considered as the upper bound estimation of financial flows in support of HIV-related activities.

Reflecting deliberate strategies of integrating HIV activities into other activity sectors, some donors use policy markers to attribute portions of mixed-purpose projects to HIV. This is done, for example, by the Netherlands and the U.K. The bilateral figures submitted by the UK Foreign, Commonwealth & Development Office (FCDO) for the financial year 2024/25 are based on an existing FCDO ‘HIV policy marker’. Ireland and Denmark also attribute percentages of multipurpose projects to HIV. Canada breaks its mixed-purpose projects into components by percentage. Germany, Norway, and Sweden provided data much more conservatively, consistent with DAC constructs and purpose codes. Apart from targeted HIV/AIDS programs, bilateral health programs mainly focusing on health systems strengthening are also designed to contribute to the HIV response in partner countries.

Bilateral assistance data represent disbursements. A disbursement is the actual release of funds to, or the purchase of goods or services for, a recipient. Disbursements in any given year may include disbursements of funds committed in prior years and in some cases, not all funds committed during a government fiscal year are disbursed in that year. In addition, a disbursement by a government does not necessarily mean that the funds were provided to a country or other intended end-user.

Amounts presented are for the fiscal year period, which varies by country. The U.S. fiscal year runs from October 1-September 30. The fiscal years for Canada, Japan, and the U.K. are April 1-March 31. The Australian fiscal year runs from July 1-June 30. The European Commission, Denmark, France, Germany, Italy, Ireland, the Netherlands, Norway, and Sweden use the calendar year. The OECD uses the calendar year, so data collected from the CRS for other donor governments reflect January 1-December 31. Most UN agencies use the calendar year, and their budgets are biennial.

All data are expressed in current US dollars (USD), unless otherwise noted. Where data were provided by governments in their currencies, they were adjusted by average daily exchange rates to obtain a USD equivalent, based on foreign exchange rate historical data available from the U.S. Federal Reserve (see: http://www.federalreserve.gov/) or the OECD.

Funding totals presented in this analysis should be considered preliminary estimates based on data provided and validated by representatives of the donor governments who were contacted directly.

Multilateral Funding:Multilateral funding includes core contributions to UNAIDS, as well as contributions to the Global Fund (see: http://www.theglobalfund.org/en/) and UNITAID (see: http://www.unitaid.org/#end). All Global Fund contributions were adjusted to represent 52% of the donor’s core contribution, reflecting the Fund’s reported grant approvals for HIV-related projects to date and includes funding for HIV/TB activities. UNITAID contributions were adjusted to represent 46% of the donor’s core contribution, reflecting UNITAID’s reported attribution for HIV-related projects.

Data obtained from UNAIDS, the Global Fund, and UNITAID were already adjusted to represent a USD equivalent based on date of receipts.

UNAIDS core contributions reflect amounts received in 2024. In 2024, the Netherlands provided two core contributions to UNAIDS; the first payment was provided for the 2024 contribution, while the second was a prepayment of the 2025 contribution. Global Fund and UNITAID contributions from all governments correspond to amounts received during the 2024 calendar year, regardless of which contributor’s fiscal year such disbursements pertain to.

In addition to contributions supporting the Global Fund’s and UNITAID’s core activities, some donor governments provided significant funding to these multilateral organizations for COVID-related efforts between 2020-2023. These COVID-specific contributions were not included in totals in this analysis. The U.S., for example, provided almost US$1.9 billion in such funding to the Global Fund during 2022.

Other than contributions provided by governments to the Global Fund and UNITAID, un-earmarked general contributions to United Nations entities, most of which are membership contributions set by treaty or other formal agreement (e.g., the World Bank’s International Development Association or United Nations country membership assessments), are not identified as part of a donor government’s HIV assistance even if the multilateral organization in turn directs some of these funds to HIV. Rather, these would be considered as HIV funding provided by the multilateral organization, as in the case of the World Bank’s efforts, and are not considered for purposes of this report.

Appendix

Donor Government Funding for HIV (current USD in millions), 2023 & 2024

Endnotes

  1. Between 2020-2023, some donor governments provided COVID-specific emergency contributions to the Global Fund and UNITAID in addition to their contributions for core activities. For the purposes of this report, these COVID-specific amounts have been excluded as they cannot be attributed to a specific area, such as HIV. ↩︎
  2. U.S. totals represent funding amounts provided through regular appropriations only. In 2021, the U.S. Congress appropriated additional emergency supplemental funding for bilateral HIV activities and for the Global Fund to address the impacts of the COVID-19 pandemic. These emergency supplemental funding amounts are not included in overall U.S. totals. ↩︎
  3. In 2025, France provided data revising prior year amounts to account for “set-aside” funding (adjusted for an HIV-share) that supports Global Fund related activities. While this funding is considered part of France’s pledge to the Global Fund, it is not counted by the Global Fund as a direct contribution and is instead included under bilateral totals in this analysis. Due to this update, amounts presented in this report will differ from prior reports. ↩︎
  4. Total HIV funding from the Netherlands in 2024 includes two core contributions to UNAIDS; the first payment was provided for the 2024 contribution, while the second was a prepayment of the 2025 contribution. ↩︎
  5. KFF analysis of data from USAspending.gov and Treasury.gov. ↩︎
  6. Donor government disbursements are a subset of overall international assistance for HIV in low-and-middle-income countries, which also includes funding provided by other multilateral institutions, UN agencies, and foundations. ↩︎
  7. UNAIDS, “UNAIDS Global AIDS Update 2025: AIDS, Crisis and the Power to Transform”, July 2025. ↩︎
  8. UNAIDS estimates that US$18.7 billion was available for HIV from all sources (domestic resources, donor governments, multilaterals, and philanthropic organizations) in 2024. In addition, while the amounts presented in this analysis include donor contributions to multilateral organizations, the UNAIDS estimate of total available resources for HIV includes the actual disbursements made by multilateral organizations in 2024 rather than the donor government contributions to these entities. ↩︎
  9. The donor share of total available resources includes bilateral disbursements as well as an adjusted share of Global Fund and UNITAID disbursements (the donor government share of contributions to each of the multilaterals in 2024 is applied to the disbursements from these multilaterals for the same year). ↩︎
  10. KFF & UNAIDS, “Donor Government Funding for HIV in Low- and Middle-Income Countries in 2023”, July 2024. ↩︎
  11. U.S. totals represent funding amounts provided through regular appropriations only. In 2021, the U.S. Congress appropriated additional emergency supplemental funding for bilateral HIV activities and for the Global Fund to address the impacts of the COVID-19 pandemic. These emergency supplemental funding amounts are not included in overall U.S. totals. ↩︎
  12. In 2025, France provided data revising prior year amounts to account for “set-aside” funding (adjusted for an HIV-share) that supports Global Fund related activities. While this funding is considered part of France’s pledge to the Global Fund, it is not counted by the Global Fund as a direct contribution and is instead included under bilateral totals in this analysis. Due to this update, amounts presented in this report will differ from prior reports. ↩︎
  13. Total HIV funding from the Netherlands in 2024 includes two core contributions to UNAIDS; the first payment was provided for the 2024 contribution, while the second was a prepayment of the 2025 contribution. ↩︎
  14. KFF, “The U.S. President’s Emergency Plan for AIDS Relief (PEPFAR)”, May 2025. ↩︎
  15. U.S. totals represent funding amounts provided through regular appropriations only. In 2021, the U.S. Congress appropriated additional emergency supplemental funding for bilateral HIV activities and for the Global Fund to address the impacts of the COVID-19 pandemic. These emergency supplemental funding amounts are not included in overall U.S. totals. ↩︎
  16. Between 2020-2023, some donor governments provided COVID-specific emergency contributions to the Global Fund and UNITAID in addition to their contributions for core activities. For the purposes of this report, these COVID-specific amounts have been excluded as they cannot be attributed to a specific area, such as HIV. ↩︎
  17. In 2024, 52% of the Global Fund’s disbursements and 48% of UNITAID’s disbursements were directed to HIV activities. These percentages were applied to the full donor government contributions to these multilateral organizations to calculate the “HIV-share” (see Methodology for additional details). ↩︎
  18. The U.S. has had a long-standing legislative requirement that total U.S. contributions to the Global Fund could not exceed 33% of all contributions (see “KFF – The U.S. & The Global Fund to Fight AIDS, Tuberculosis and Malaria”), which results in year-to-year fluctuations in U.S. payouts to the Global Fund depending on when other donors provide funds. However, this requirement technically expired in March when the authorization legislation ended (see “KFF – PEPFAR Reauthorization: Side-by-Side of Legislation Over Time”). ↩︎
  19. GDP estimates are from the International Monetary Fund’s (IMF) World Economic Outlook (WEO) Database (accessed July 2025). ↩︎

Health Provisions in the 2025 Federal Budget Reconciliation Bill

Updated: July 8, 2025


Note: KFF now has a clean summary of the health care provisions in the 2025 federal budget reconciliation law as well as a separate implementation timeline highlighting key dates in the law.

This side-by-side comparison tool compares the health care provisions in the House-passed and Senate-passed 2025 budget reconciliation law to each other and prior law. The Senate-passed bill ultimately passed the House on July 3 and was signed into law by President Trump on July 4. The comparison is divided into four categories: Medicaid, the Affordable Care Act, Medicare and Health Savings Accounts (HSAs). It also compares the provisions to a earlier draft of the bill passed by the House on May 22.

Summary of House Reconciliation Bill

Topics:

Health Provisions in the 2025 Federal Budget Reconciliation Bill

Updated: July 8, 2025


Note: KFF now has a clean summary of the health care provisions in the 2025 federal budget reconciliation law as well as a separate implementation timeline highlighting key dates in the law.

This side-by-side comparison tool compares the health care provisions in the House-passed and Senate-passed 2025 budget reconciliation law to each other and prior law. The Senate-passed bill ultimately passed the House on July 3 and was signed into law by President Trump on July 4. The comparison is divided into four categories: Medicaid, the Affordable Care Act, Medicare and Health Savings Accounts (HSAs). It also compares the provisions to a earlier draft of the bill passed by the House on May 22.

Summary of HSA-Related Provisions in 2025 Reconciliation Bill

Health Provisions in the 2025 Federal Budget Reconciliation Bill

Updated: July 8, 2025


Note: KFF now has a clean summary of the health care provisions in the 2025 federal budget reconciliation law as well as a separate implementation timeline highlighting key dates in the law.

This side-by-side comparison tool compares the health care provisions in the House-passed and Senate-passed 2025 budget reconciliation law to each other and prior law. The Senate-passed bill ultimately passed the House on July 3 and was signed into law by President Trump on July 4. The comparison is divided into four categories: Medicaid, the Affordable Care Act, Medicare and Health Savings Accounts (HSAs). It also compares the provisions to a earlier draft of the bill passed by the House on May 22.

In addition to the changes included in the law, if Congress takes no further action, the increase in the deficit would trigger mandatory spending cuts, also known as sequestration, under the Statutory Pay-As-You-Go Act of 2010. These cuts would total approximately $500 billion to Medicare over 2026–2034, according to the Congressional Budget Office, based on an increase in the deficit of $2.3 trillion over 10 years. The required spending cuts to Medicare could be larger based on the Senate-passed bill that was enacted into law, which is estimated to increase the deficit by $3.4 trillion over 10 years

Summary of Medicare Provisions in 2025 Reconciliation Bill

Health Provisions in the 2025 Federal Budget Reconciliation Bill

Updated: July 8, 2025


Note: KFF now has a clean summary of the health care provisions in the 2025 federal budget reconciliation law as well as a separate implementation timeline highlighting key dates in the law.

This side-by-side comparison tool compares the health care provisions in the House-passed and Senate-passed 2025 budget reconciliation law to each other and prior law. The Senate-passed bill ultimately passed the House on July 3 and was signed into law by President Trump on July 4. The comparison is divided into four categories: Medicaid, the Affordable Care Act, Medicare and Health Savings Accounts (HSAs). It also compares the provisions to a earlier draft of the bill passed by the House on May 22.

Summary of ACA-Related Provisions in the 2025 Reconciliation Bill

We’ve Never Seen Health Care Cuts This Big

Author: Larry Levitt
Published: Jul 1, 2025

In this July 1 column for The New York Times Opinion section, KFF Executive Vice President for Health Policy Larry Levitt explains how the budget reconciliation bill passed by the Senate on July 1 is effectively a partial repeal of the Affordable Care Act (ACA) and, if signed into law, the resulting reductions in Medicaid and ACA Marketplace coverage would make it “the biggest rollback in federal support for health coverage ever.”

10 Key Data Points About the Experiences of LGBT+ Women and Their Access to Care

Published: Jun 30, 2025

Health disparities and health access-related challenges persist among the LGBTQ+ community.  While there have been various state and federal efforts over the last several years to address equity in the LGBT+ community, including with respect to health care access, nondiscrimination, and data collection, recent Trump Administration policy actions could reverse these developments. Additionally, potential changes in the health policy landscape could lead to insurance coverage losses, which could stand to exacerbate existing access challenges. In particular, efforts to restrict access to gender affirming care, including for adults, could lead to more medical mistrust, and reduce willingness to engage in the health system.

This brief presents key data points on the health care experiences of LGBT+ women from the KFF Women’s Health Survey, a nationally representative survey of women in the United States conducted from May 13 – June 18, 2024. This online and by telephone survey includes a sample of 3,901 women of reproductive age (18-49). Respondents were asked about their gender and sexual orientation. The LGBT+ sample (n = 676) in this brief includes respondents who identified as women and also identified as non-binary or transgender and/or said their sexual orientation was lesbian or gay, bisexual, or something else. The non-LGBT+ sample are respondents who identified as other women, those who are cisgender and heterosexual.

1. One in six (17%) women of reproductive age identify as LGBT+, with the largest share of LGBT+ women identifying as bisexual.

One in six (17%) women of reproductive age identify as lesbian, gay, bisexual, transgender, non-binary or something else (LGBT+) (Figure 1). Women ages 18 to 35 are twice as likely to identify as LGBT+ compared to women ages 36 to 49 (23% vs. 9%).

Younger Reproductive Age Women Are Twice as Likely to Identify as Bisexual Compared to Older Reproductive Age Women

2. LGBT+ women are more likely to be younger than non-LGBT+ women but are similar in other demographic indicators.

Three in four reproductive age LGBT+ women are age 35 and younger (77%) compared to 53% of non-LGBT+ women (Figure 2). Nearly six in ten reproductive age LGBT+ women are White and nearly one in five are Hispanic, which is not significantly different than non-LGBT+ women. LGBT+ women are less likely to be Asian and more likely to identify as another race/ethnicity compared to non-LGBT+ women. Four in ten reproductive age LGBT+ women have household incomes below 200% of the federal poverty level (FPL), similar to non-LGBT+ women. Nine in ten live in an urban/suburban area, which is higher than non-LGBT+ women. A quarter of LGBT+ women are the parent or guardian of children under the age of 18, which is half the share of non-LGBT+ women (27% vs. 52%).

Three in Four Reproductive Age LGBT+ Women Are Age 35 and Younger and Fewer are Parents Compared to Non-LGBT+ Women

3. While the majority of reproductive age LGBT+ women have a regular health care provider, three in ten do not (31%). LGBT+ women are less likely to go to a private doctor’s office for care than non-LGBT+ women, but a higher share rely on clinics or do not have a place to go.

Despite being a younger population overall, LGBT+ women are more likely to report fair or poor health (Figure 3) than non-LGBT+ women. One in four reproductive age LGBT+ women (26%) describe their health as fair or poor compared to one in six non-LGBT+ women (16%). Most LGBT+ women have a usual site of care to go to when they are sick or need advice about health (92%), while only 8% say they do not have a place to go. LGBT+ women are less likely than non-LGBT+ women to go to a private doctor’s office for care, and a higher share do not have a place to go compared to non-LGBT+ women. While the majority of LGBT+ women have a regular doctor or health care provider (69%), three in ten do not (31%).

While the Majority of Reproductive Age LGBT+ Women Have a Regular Health Care Provider, Three in Ten Do Not

4. Similar shares of LGBT+ and non-LGBT+ women say they have received HIV and STI tests, but fewer report receiving a Pap test than non-LGBT+ women. One in seven (15%) LGBT+ women say they have never seen a doctor or nurse for an OBGYN exam.

Similar shares of LGBT+ women say they have received an HIV test (37% vs. 36%) and STI test (44% vs. 39%) compared to non-LGBT+ women in the past two years (Figure 4). However, a smaller share of LGBT+ women compared to non-LGBT+ women report receiving a Pap smear or Pap test to test for cervical cancer in the past two years. One in seven (15%) reproductive age LGBT+ women say they have never seen a doctor or nurse for an OBGYN exam, which was higher than non-LGBT+ women (10%).

Similar Shares of Reproductive Age LGBT+ Women Have Received HIV and STI Tests, But Fewer Have Received a Pap Test Compared to Non-LGBT+ Women

5. One in five reproductive age LGBT+ women report having a disability, twice the rate of non-LGBT+ women.

While a younger population, among reproductive age LGBT+ women report who report a disability, one in ten have more than one disability (15%) (Figure 5). The largest share say they have a disability related to a mental health condition, which is significantly higher than non-LGBT+ women (16% vs. 4%). Just over one in ten (15%) LGBT+ women report having a developmental disability, such as a learning disability, compared to 2% of non-LGBT+ women. One in ten (11%) LGBT+ report having a physical disability compared to 6% of non-LGBT+ women. A similar share of LGBT+ and non-LGBT+ women report having a sensory condition, such as being visually impaired or deaf (1%).

One in Five Reproductive Age LGBT+ Women Report Having a Disability With One in Ten Having More Than One Disability

6. About four in ten LGBT+ women (43%) report that they have been treated unfairly or with disrespect by a doctor or health care provider, especially based on their age, weight, or gender.

Nearly twice as many LGBT+ women (aged 18-49) compared to non-LGBT+ women (43% vs. 24%) the same age have felt that a doctor, health care provider or other staff treated them unfairly or with disrespect at some point in the past 2 years (Figure 6). They cite weight, gender, and age as the top reasons they were treated unfairly or with disrespect. Compared to non-LGBT+ women, a larger share of LGBT+ women say there was a time in the past 2 years when a health provider ignored a direct request they made or a question they asked (34% vs. 20%), assumed something about them without asking (32% vs. 19%), didn’t believe they were telling the truth (32% vs. 16%), suggested they were personally to blame for a health problem they were experiencing (29% vs. 13%), and refused to prescribe pain medication they thought they needed (15% vs. 9%). Eight percent (8%) of LGBT+ women say they have been treated unfairly or with disrespect because of their sexual orientation during a health care visit in the past 2 years.

LGBT+ Women Are More Likely to To Report They've Experienced Negative Interactions With Health Care Providers

7. Many LGBT+ women report experiencing mental health challenges. Half of reproductive age LGBT+ women describe their mental health as fair or poor compared to a quarter of non-LGBT+ women, and many say they have not gotten mental health services in the past year.

Half of LGBT+ women (aged 18-49) describe their mental health or emotional wellbeing as fair or poor compared to a quarter of non-LGBT+ women (50% vs. 27%) (Figure 7). While half of LGBT+ women say they have received mental health services from a doctor, counselor, or other mental health professional (51%), about half also say there was a time in the past 12 months when they thought they might need mental health services or medication, but didn’t get them (54%).

Half of Reproductive Age LGBT+ Women Describe Their Mental Health as Fair or Poor

8. LGBT+ women report experiences with intimate partner violence at almost double the rate of non-LGBT+ women.

Over one in three reproductive age LGBT+ women say they have experienced intimate partner violence in the past 5 years, compared to 20% of non-LGBT+ women (Figure 8). Rates of all aspects of IPV asked about in the survey are twice as high in LGBT+ women compared to non-LGBT+ women. Approximately one in five LGBT+ women said that in the past five years, a current or former partner has made them fear for their or their family and friends’ safety (21%), tried to control most or all of their daily activities (23%), hurt them physically (19%), or forced them into sexual activity (21%).

A Third of LGBT+ Women Have Experienced Intimate Partner Violence in the Past 5 Years

9. Similar shares of sexually active LGBT+ and non-LBGT+ reproductive age women say they used contraception in the past year.

Eight in ten (81%) sexually active LGBT+ women report using contraception in the past year, similar to the share among non-LGBT+ women (81%). One in ten (10%) sexually active LGBT+ women say they were not using contraception. While a younger group, smaller shares of sexually active LGBT+ women report being pregnant or trying to conceive compared to non-LGBT+ women (5% vs. 9%). The shares of LGBT+ and non-LGBT+ women report being unable to conceive was the same (4%). One in ten LGBT+ women say they or their partners use contraception solely for reasons outside of preventing pregnancy, which is significantly higher than non-LGBT+ women (11% vs. 5%) (Figure 9).

Similar Shares of Sexually Active LGBT+ and Non-LGBT+ Women Used Contraception in the Past Year

10. Over a third (38%) of LGBT+ women have been pregnant including nearly one in ten (9%) who report having have had an abortion, both shares considerably lower rates than non-LGBT+ reproductive age women.

A larger share of reproductive age LGBT+ women say they have never been pregnant compared to non-LGBT+ women (62% vs. 35%) (Figure 10). About one in ten (11%) LGBT+ women say they or their partner have ever needed fertility assistance, including medical advice, testing, services or medication to help an individual or their partner become pregnant or prevent a miscarriage, which is similar to the 14% of non-LGBT+ women who have needed fertility assistance.

Over a Third of Reproductive Age LGBT+ Women Have Been Pregnant and Nearly One in Ten Have Had an Abortion

5 Key Facts About Medicaid and Veterans

Published: Jun 30, 2025

The One Big Beautiful Bill passed by the House is projected by the Congressional Budget Office to reduce federal Medicaid spending by $793 billion over the next 10 years, a cut that could lead to 10.3 million fewer people enrolled in Medicaid in 2034. The Senate Finance Committee’s draft reconciliation includes similar provisions. Medicaid currently provides health care coverage to 1 in 10 veterans (1.6 million people), and for some, it is their only source of coverage, especially if they do not qualify for military health benefits such as care provided by the Department of Veterans Affairs (VA health care), or TRICARE, the health insurance program administered by the Department of Defense for eligible active-duty service members, retirees, and their families.

The Department of Veterans Affairs operates a nationwide health care system, but access is not guaranteed. Eligibility for VA health care depends on a veteran’s service history, discharge status, income, and whether a health condition is connected to their military service. As a result, about half of veterans are enrolled in VA health care. TRICARE, meanwhile, is generally limited to active-duty members and military retirees.

Medicaid helps fill gaps in coverage for veterans who are low-income, have disabilities, or are otherwise ineligible for military health benefits. Many veterans use Medicaid alongside Medicare or VA health care, particularly as they age and their health needs increase. Veterans enrolled in Medicaid have complex health conditions, including high rates of disability, mental illness, and substance use disorders. Medicaid ensures regular access to care for these veterans, helping them manage chronic conditions, access a broader range of providers outside the VA system, and pay for services not covered by VA health care, such as different forms of long-term care. It also reduces out-of-pocket costs that can pose a barrier to care. This brief presents key facts about veterans enrolled in Medicaid and examines how proposed changes could affect their coverage and access to care.

1. Over the past decade, the number of veterans has declined, but the percent of veterans with Medicaid has increased.

In 2023, there were approximately 16 million veterans ages 19 and older in the United States. The veteran population is both aging and shrinking: nearly half of all veterans are 65 and older, and the total number has declined by 7 million over the past decade, from 23 million in 2013, as older veterans from World War II, the Korean War, and the Vietnam War have passed away, and fewer individuals have entered military service in the recent years.

As the veteran population changes, so too have the pathways to coverage. The Affordable Care Act (ACA) created a new pathway to coverage for veterans who might otherwise have been uninsured by expanding Medicaid eligibility to nearly all adults with incomes up to 138% of the Federal Poverty Level ($21,597 for an individual in 2025). Medicaid expansion covers adults who are parents of dependent children whose income is above the eligibility limit for parent coverage and adults who do not have dependent children and who were previously not eligible for Medicaid. Forty-one states, including DC, have adopted Medicaid expansion, and nearly seven in ten (69%) veterans ages 19 and older who have Medicaid coverage live in a state that has expanded Medicaid.

Since the implementation of Medicaid expansion, the share of veterans with Medicaid, either as their sole source of coverage or in combination with other insurances, has increased, and the share of those who are uninsured has dropped. Between 2013 and 2023, Medicaid enrollment among all veterans increased from 8% to 10% (Figure 1), representing 1.6 million veterans in 2023. However, the share of veterans enrolled in Medicaid varies across states, ranging from as low as 6% to as high as 15% (Appendix Table ). In 2023, 11% of veterans in Medicaid expansion states were enrolled in Medicaid, compared to 9% in non-expansion states. Over the 2013-2023 period, the uninsured rate for veterans fell by more than half, dropping to 2% from 6% (Figure 1). Studies link Medicaid expansion to increased coverage, improved access to care, greater healthcare affordability, and better health .

Over the Past Decade, the Number of Veterans Has Declined, but the Percent of Veterans With Medicaid Has Increase

2. Medicaid often supplements coverage for an aging veteran population.

Among those 1.6 million veterans with Medicaid coverage, most had additional forms of insurance. While some rely on Medicaid as their only source of coverage, it more often supplements other types of insurance by covering services that other payers may not, such as long-term care. For veterans who are also enrolled in Medicare, Medicaid can help cover both premiums and cost-sharing responsibilities, reducing out-of-pocket costs for services like doctor visits, hospital stays, and prescription drugs.

Only 17% of veterans with Medicaid were covered by Medicaid alone. The remaining 83% had at least one other source of coverage. The most common combination was Medicaid and Medicare, which accounted for 60% of all veterans with Medicaid (some of whom were also enrolled in VA health care). This high share reflects the aging veteran population; half of all veterans with Medicaid were 65 and older. Many of today’s veterans served during the Vietnam and Gulf Wars. Smaller percentages of veterans were also enrolled in VA health care (17%), or another other form of insurance coverage, such as TRICARE or employer-sponsored insurance (6%).

Medicaid Often Supplements Coverage for an Aging Veteran Population

3. Veterans with Medicaid have higher disability rates than those who are not covered by Medicaid.

Nearly half (49%) of veterans covered by Medicaid, either as their only source of coverage or in combination with other insurance, report having a disability, compared to fewer than three in ten (29%) veterans who are not covered by Medicaid (Figure 3). A person is considered to have a disability if they experience difficulty with hearing, vision, cognitive function, mobility, self-care, or independent living. While disability rates increase with age among all veterans, the difference in the rates between those with Medicaid and those not covered by Medicaid are especially pronounced in their working-age years. Among veterans ages 27 to 49, 33% of those with Medicaid reported a disability, compared to 17% of those with other coverage. The gap is even wider among veterans ages 50 to 64, with 51% of Medicaid enrollees reporting having a disability compared to 20% of those with other coverage. Veterans 65 and older have the highest disability rates of any age group, but even among this group, a higher percentage of veterans with Medicaid have a disability (55%) compared to those without (40%).

Veterans With Medicaid Have Higher Disability Rates Than Those Who Are Not Covered by Medicaid

4. Medicaid supports regular access to care for veterans who have high rates of chronic conditions.

Veterans covered by Medicaid often have complex health needs. Nearly half (45%) of veterans with Medicaid describe their health as fair or poor, more than twice the share among those not covered by Medicaid (18%) (Figure 4). All veterans have high rates of chronic conditions (82% for those with Medicaid and 79% for those without), but some conditions are more common among veterans with Medicaid. Specifically, behavioral health conditions affect a larger share of veterans with Medicaid, with 46% reporting any form of mental illness and 26% reporting substance use disorder (SUD), compared to 17% and 13%, respectively, among those without Medicaid. Medicaid provides access to care, including mental health and SUD care for veterans. Among veterans covered by Medicaid, 41% received mental health or SUD treatment in the past year, nearly twice the share of those without Medicaid (21%).

Medicaid Supports Regular Access to Care for Veterans Who Have High Rates of Chronic Conditions

5. Nearly seven in ten working-age veterans with Medicaid are working, but work varies by age, disability, and parental status.

Nearly seven in ten (68%) working-age veterans (ages 19 to 64) enrolled in Medicaid are working, excluding those who receive Supplemental Security Income or Social Security Disability Insurance, or are dually enrolled in Medicare (Figure 5). The share of veterans in this age group varies by state (Appendix Table 2). Veterans who are older (ages 50 to 64), have a disability, or do not have dependent children are less likely to be working:

  • The share of veterans who are working declines with age: 79% of those ages 19 to 26 are working, compared to 59% of those ages 50 to 64.
  • While 75% of veterans without a disability are working, that share drops to 51% among those with a disability.
  • Parents are more likely to be in the workforce than veterans without dependent children (78% vs 60%), likely reflecting their relatively younger age and lower rates of disability.

Proposed changes to Medicaid that would impose work and reporting requirements as a condition of eligibility could negatively affect veterans and lead to coverage loss among those who are unable to work or those unable to report or document work or exemption criteria.

Nearly Seven in Ten Working-Age Veterans With Medicaid Are Working, but Work Varies by Age, Disability, and Parental Status

Appendix Tables

Veterans Ages 19 and Older Enrolled in Medicaid by State, 2023
Age Distribution of Veterans Ages 19 and Older Enrolled in Medicaid by State, 2023

How Affordability of Employer Coverage Varies by Family Income

Published: Jun 30, 2025

People in lower-income families with employer coverage spend a greater share of their income on health costs than those with higher incomes, and the cost of employer sponsored health insurance—including premiums, deductibles, and other out-of-pocket costs—has risen steadily over time. Low-income workers offered health insurance through their employer are typically not eligible for subsidies on the Affordable Care Act (ACA) Marketplaces, even if they would face lower costs to buy coverage and with reduced cost sharing.

This analysis uses information from the 2024 Annual Social and Economic Supplement (ASEC) to the Current Population Survey to look at the share of family income people with employer-based coverage pay toward their premiums and out-of-pocket payments for medical care. It considers non-elderly people living with one or more family members who are full-time workers and have employer-based coverage.

The analysis is available through the Peterson-KFF Health System Tracker, an online information hub dedicated to monitoring and assessing the performance of the U.S. health system.