Kaiser Family Foundation/CNN Working-Class Whites Poll
Executive Summary
Summary
The latest Kaiser Family Foundation/CNN partnership poll explores the views and experiences of white Americans without college degrees (a group defined in this survey as “working-class whites”), including how they feel about their own lives and the direction of the country, their attitudes towards government, their economic priorities, feelings about immigration and increasing racial and ethnic diversity, and personal experiences with employment and finances. It also compares this group’s attitudes and experiences with those of whites with college degrees, as well as those of blacks and Hispanics without college degrees (working-class blacks and Hispanics). Finally, the survey explores the views of different subgroups within the white working class, including variations by partisanship, age, income, region of the country, and religious identification.
CNN’s coverage:
White, Working Class & Worried: Full coverage
The anatomy of a white, working-class Trump voter
The ‘forgotten tribe’ in West Virginia; why America’s white working class feels left behind
2016: Last call for working class whites?
Working class whites blame Washington, but still want more government help
White working-class Americans have complicated view of Muslim immigrants
Alabama town mirrors US class divide on immigration
The economy stinks, but I’m doing OK, say working class whites
The shell-shocked white working class
White working-class evangelicals: Christian values are under attack
The truth about the white working class: A mosaic of their own
Introduction
The latest Kaiser Family Foundation/CNN partnership poll explores the views and experiences of white Americans without college degrees (a group defined in this survey as “working-class whites”1), including how they feel about their own lives and the direction of the country, their attitudes towards government, their economic priorities, feelings about immigration and increasing racial and ethnic diversity, and personal experiences with employment and finances. It also compares this group’s attitudes and experiences with those of whites with college degrees, as well as those of blacks and Hispanics without college degrees (working-class blacks and Hispanics). Finally, the survey explores the views of different subgroups within the white working class, including variations by partisanship, age, income, region of the country, and religious identification.
This report summarizes key findings from the survey, organized into four themes:
- Conventional wisdom: Ways the poll findings confirm conventional wisdom about the white working class and areas where the results contradict the common narrative about this group;
- Race versus class: Areas where whites without college degrees differ from and are similar to their working-class black and Hispanic counterparts;
- Not a monolith: the most interesting subgroup differences in attitudes within the white working class; and
- Politics and partisanship: Key findings related to the political alignments of the white working class and how they differ from white Americans with college degrees.
Summary of Findings
Section 1: Conventional Wisdom
Much has been studied and written about the white working class during the 2016 election season. In many ways, the findings from our survey confirm the findings from other studies, and conform to what has come to be “conventional wisdom” about the white working class:
- This group is unhappy about the direction of the country overall. Over half (53 percent) are very dissatisfied with the country’s economic situation, 47 percent say America’s best days are behind us, and 50 percent expect their children to have a worse standard of living than they have now – all much higher than for college-educated whites (Exhibit 1.1).
- The white working class is resentful of government and feels cut out of the political process. Two-thirds (68 percent) are dissatisfied with the influence people like them have on politics, 56 percent say the government in Washington does not represent their views well at all (Exhibit 1.2), and 62 percent say the federal government deserves all or most of the blame for the economic problems facing the working-class (Exhibit 1.3).
- Whites without a college degree are nervous about cultural changes taking place in the United States. About two-thirds (65 percent) say Christian values are under attack, and almost four in ten (38 percent) say increasing racial and ethnic diversity is harmful because “some people feel like they no longer belong” (Exhibit 1.4).
- This group has a more negative view of immigrants and immigration than other groups. Almost half (47 percent) see immigrants as a burden on the country, and 55 percent say the government should attempt to deport all people living in the country illegally (Exhibit 1.5). Over six in ten (63 percent) say that immigrants from Muslim countries increase the risk of terrorist attacks, and about half say that Latin American immigrants add to the crime problem and take jobs away from Americans – much higher than for other groups (Exhibit 1.6).
- Working-class white voters are a base of support for Donald Trump – six in ten say they would consider voting for him, compared with four in ten (39 percent) college-educated white voters and much smaller shares of black and Hispanic voters without college degrees (Exhibit 1.7). Two-thirds (68 percent) of working-class white voters say they would definitely not vote for Hillary Clinton, while half of college-educated whites and large majorities of working-class black and Hispanic voters say they’d consider voting for her (Exhibit 1.8).
In other ways, the survey findings run counter to the prevailing narrative about this group:
- Personally, things appear to be going well for the white working class. A large majority – 76 percent – say they are optimistic about how things are going in their own lives, and only 18 percent say they are angry (Exhibit 1.9). Nearly two-thirds (63 percent) are satisfied with their own personal financial situation (Exhibit 1.10).
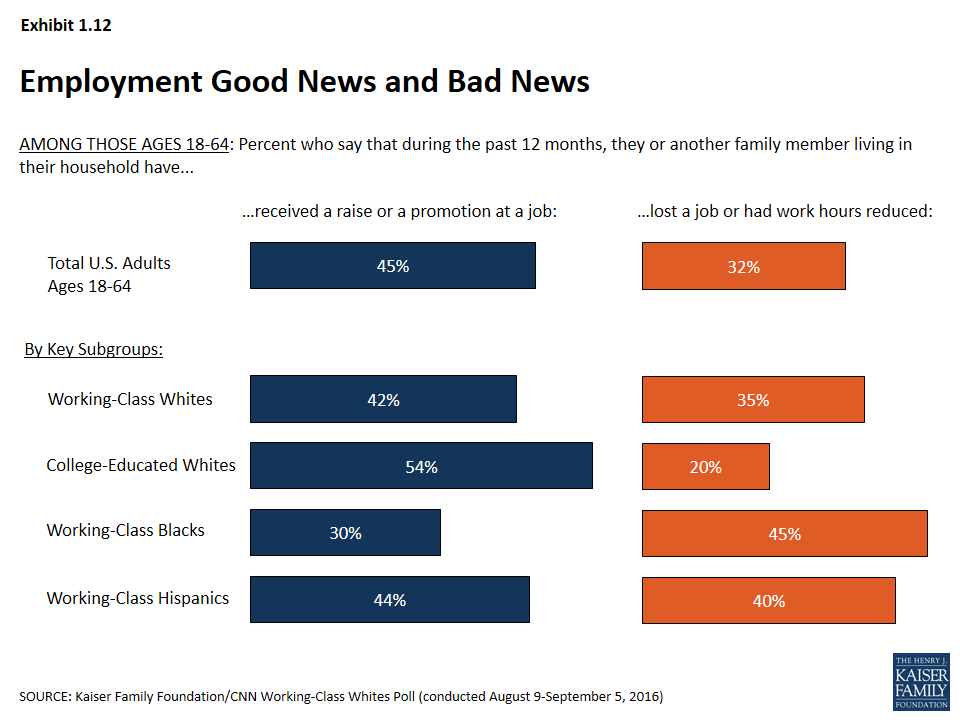
- Most working-age whites without college degrees are employed in secure jobs. Seventy-two percent of those ages 18-64 are employed either full- or part-time. More than three-quarters (77 percent) of those who are working feel their job is secure (Exhibit 1.11). More than four in ten (42 percent) of those under age 65 say they or someone in their household received a raise or a promotion in the past year (Exhibit 1.12).
- Trade is not a major driving issue for working-class whites. While seven in ten (69 percent) feel that trade agreements with other countries has cost the U.S. jobs, just 12 percent pick trade as the top economic issue for the next president to address, ranking behind the availability of good jobs, the income gap between the rich and poor, and taxes (Exhibit 1.13).
- Working-class whites are no more likely than whites with college degrees to report experiences with addiction. Thirty-one percent say someone close to them has been addicted to alcohol, prescription painkillers, or illegal drugs, almost identical to the share among whites with college degrees (Exhibit 1.14).
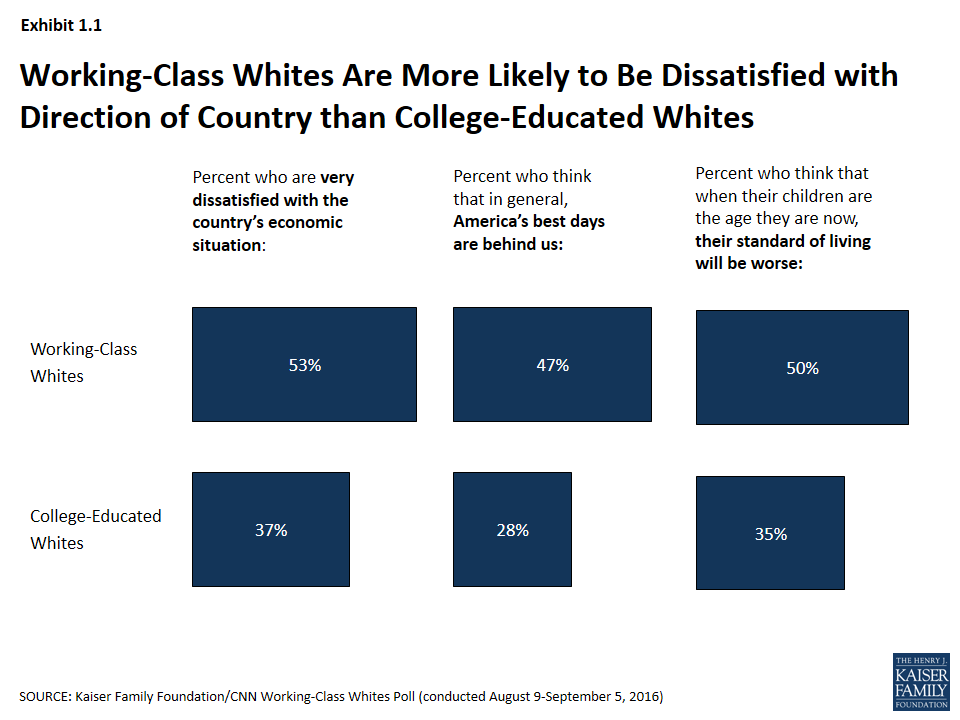
Working-Class Whites Are More Likely to Be Dissatisfied with Direction of Country than College-Educated Whites
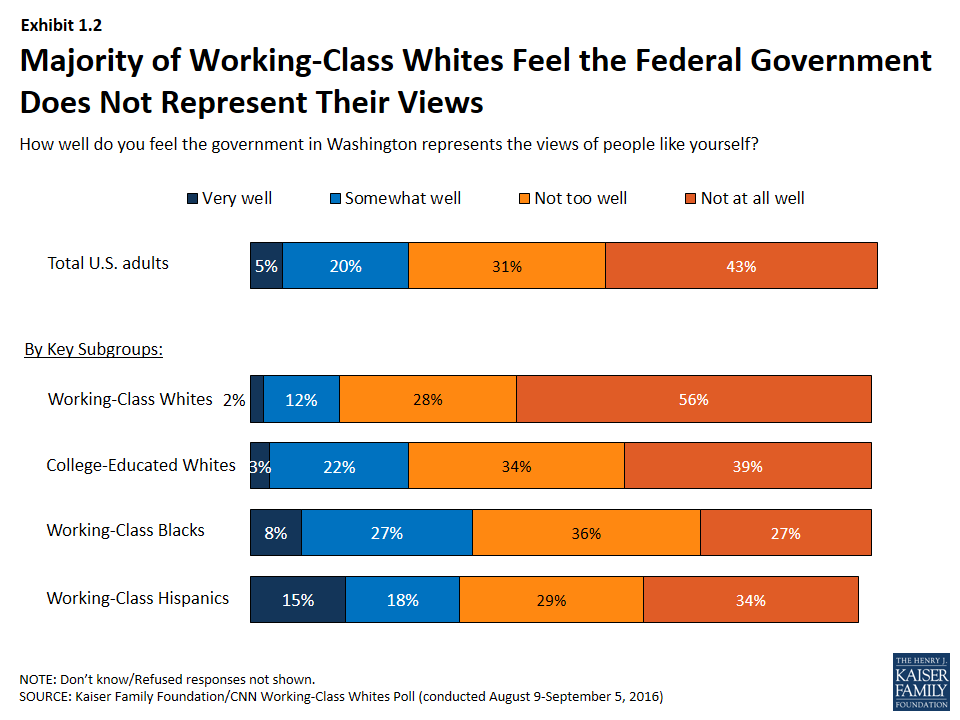
Majority of Working-Class Whites Feel the Federal Government Does Not Represent Their Views
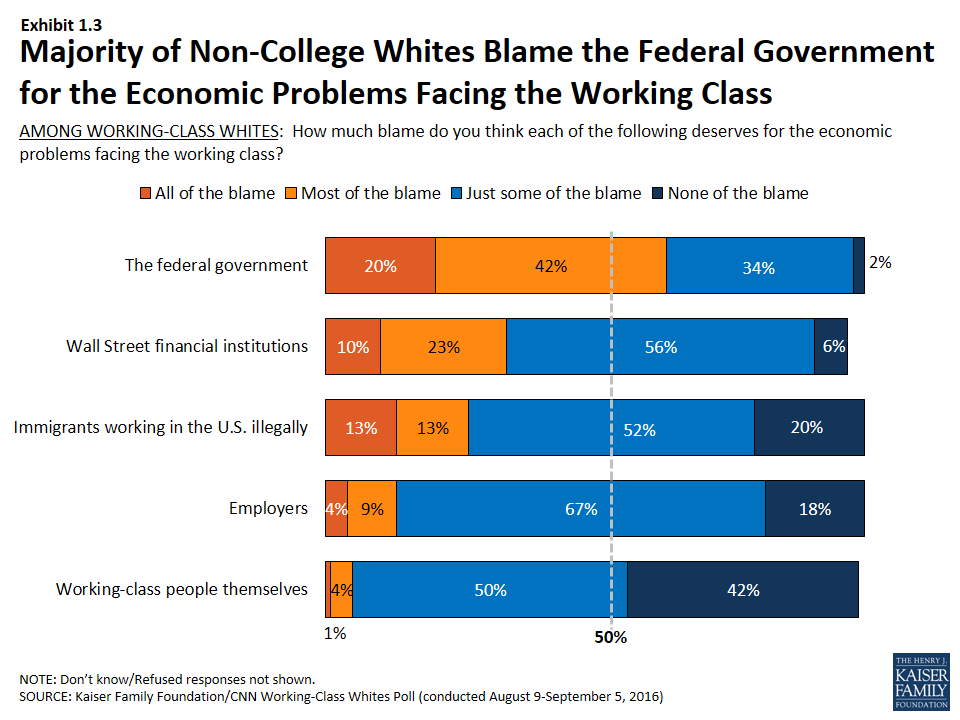
Majority of Non-College Whites Blame the Federal Government for the Economic Problems Facing the Working Class
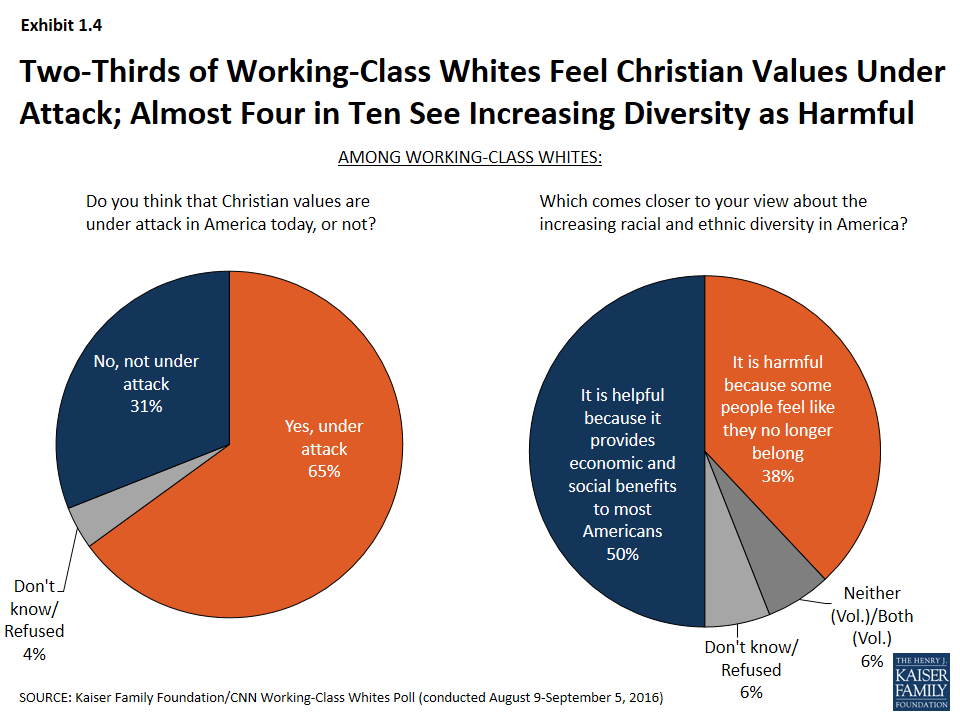
Two-Thirds of Working-Class Whites Feel Christian Values Under Attack; Almost Four in Ten See Increasing Diversity as Harmful
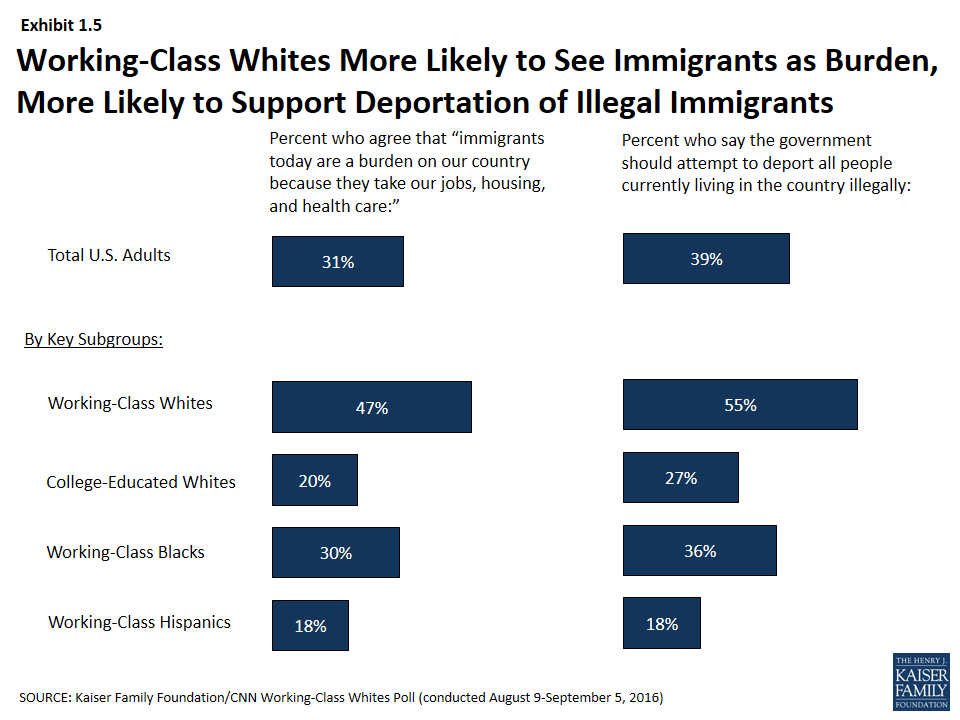
Working-Class Whites More Likely to See Immigrants as Burden, More Likely to Support Deportation of Illegal Immigrants
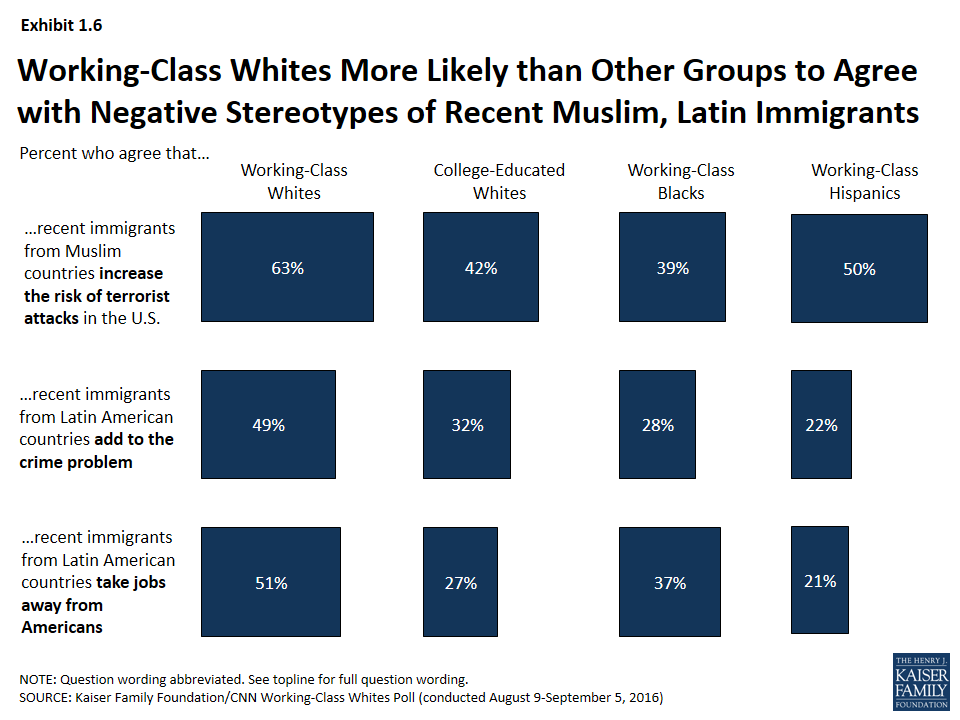
Working-Class Whites More Likely than Other Groups to Agree with Negative Stereotypes of Recent Muslim, Latin Immigrants
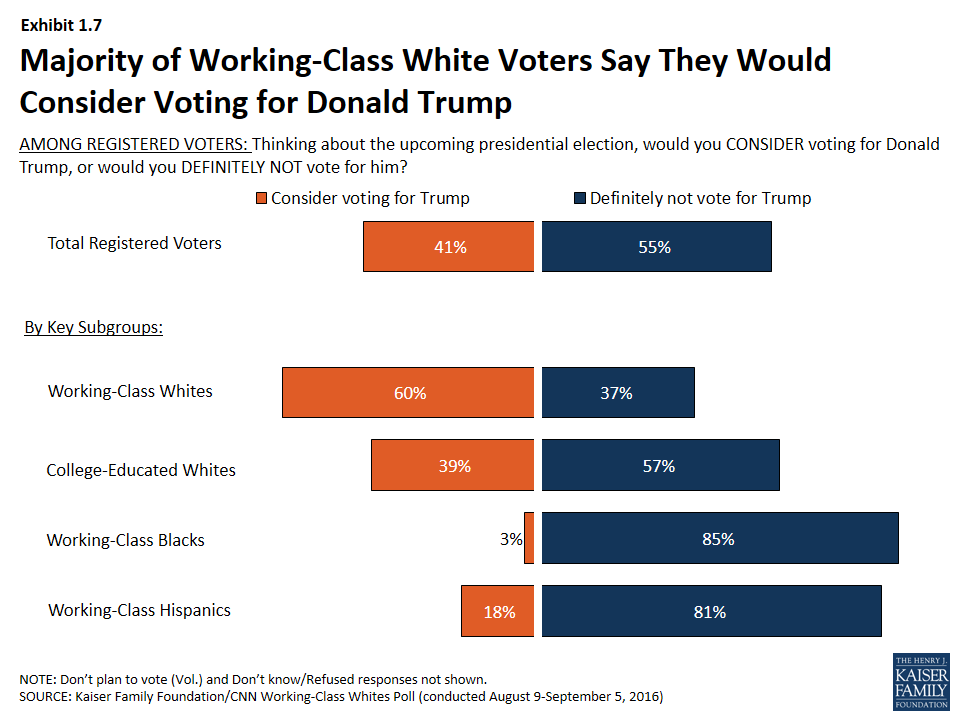
Majority of Working-Class White Voters Say They Would Consider Voting for Donald Trump
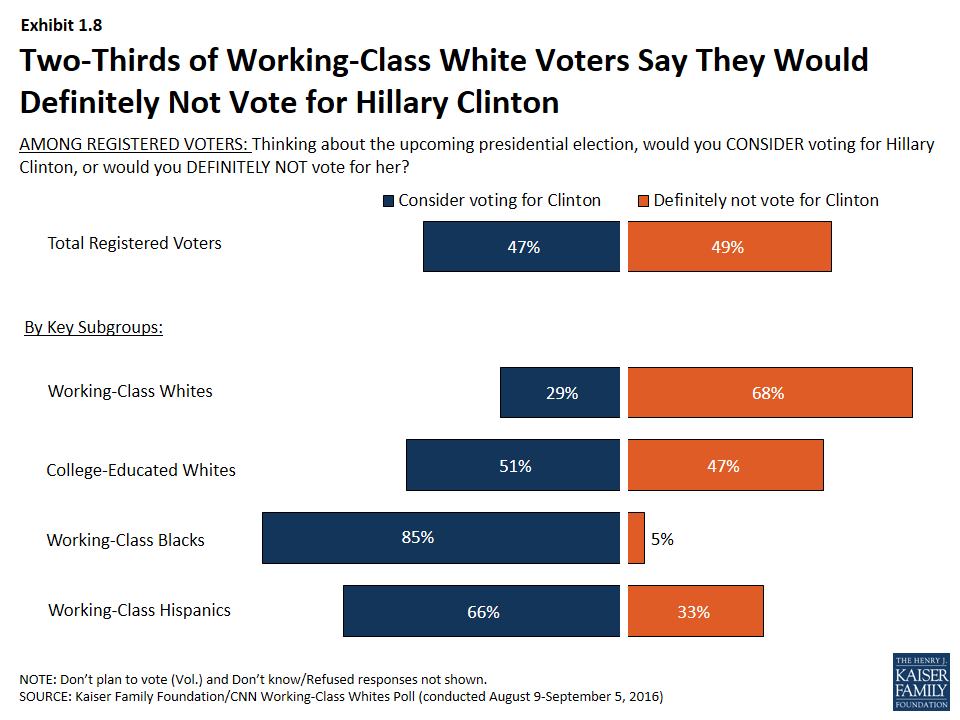
Two-Thirds of Working-Class White Voters Say They Would Definitely Not Vote for Hillary Clinton
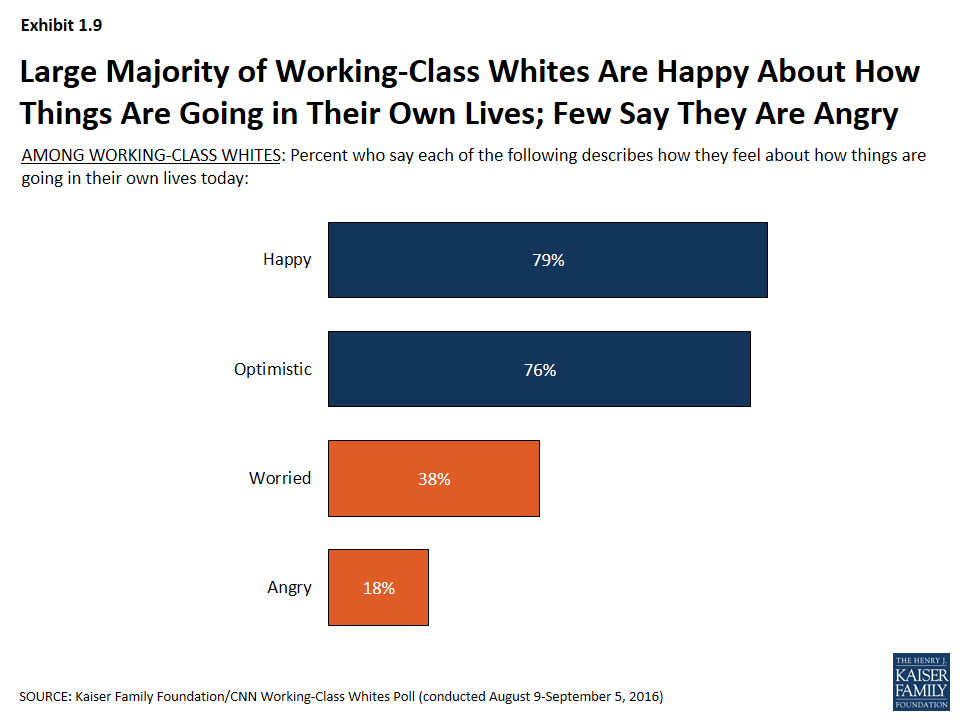
Large Majority of Working-Class Whites Are Happy About How Things Are Going in Their Own Lives; Few Say They Are Angry
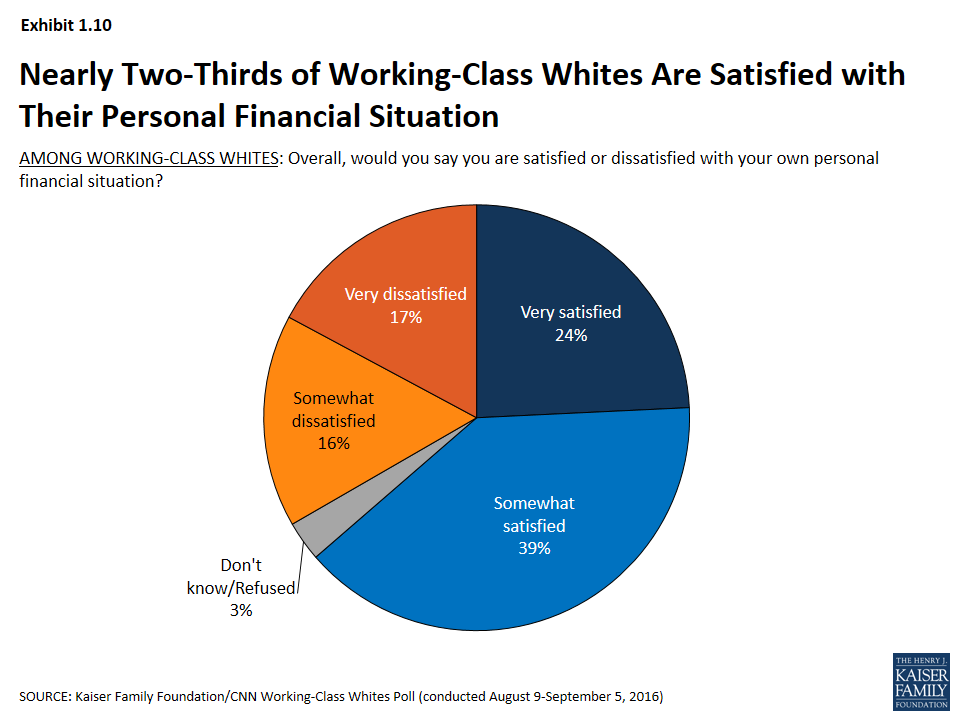
Nearly Two-Thirds of Working-Class Whites Are Satisfied with Their Personal Financial Situation
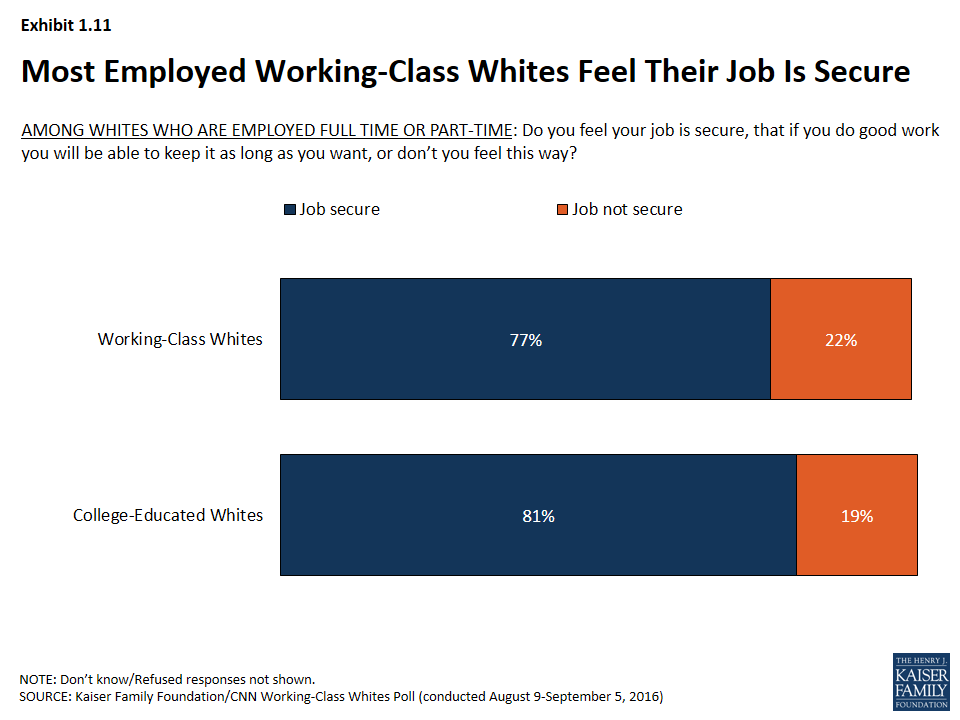
Most Employed Working-Class Whites Feel Their Job Is Secure
Employment Good News and Bad News
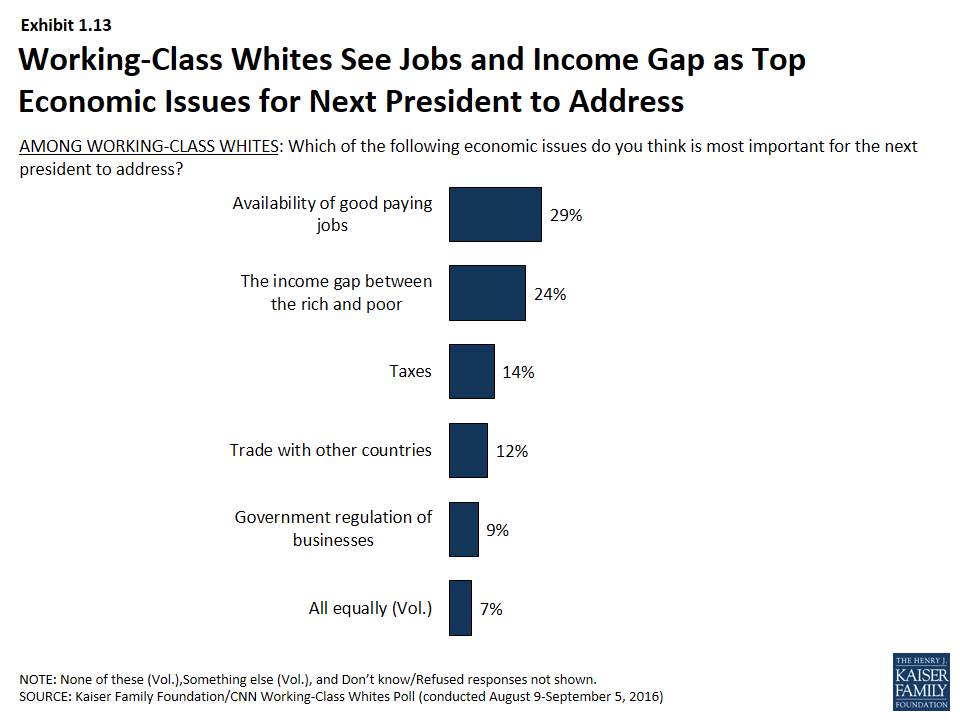
Working-Class Whites See Jobs and Income Gap as Top Economic Issues for Next President to Address
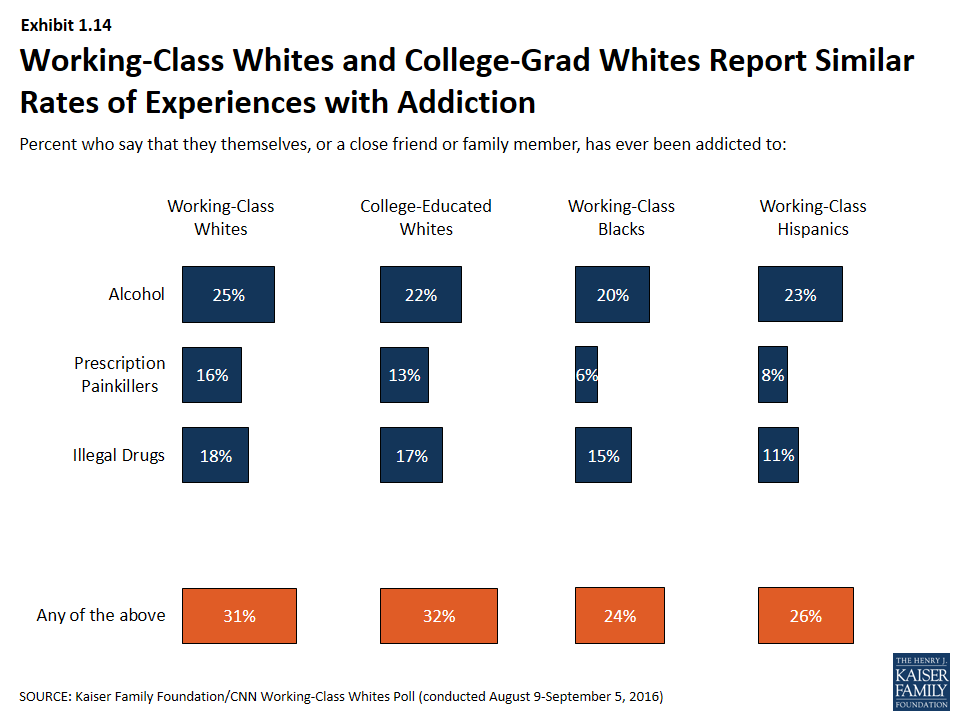
Working-Class Whites and College-Grad Whites Report Similar Rates of Experiences with Addiction
Section 2: Race versus Class
The survey reveals some differences between working-class whites and their black and Hispanic counterparts in some experiences and attitudes:
- Compared with working-class blacks and Hispanics, working-class whites are less likely to see their lack of a college degree as a barrier. Half (51 percent) say their life would be no different if they had a 4-year college degree, while about three-quarters of working-class blacks (73 percent) and Hispanics (74 percent) believe having a degree would make their lives better (Exhibit 2.1).
- Whites without college degrees differ from their black and Hispanic counterparts in their employment and housing situations. Among those of working age, just 14 percent of whites without college degrees are un- or under-employed, compared with 31 percent of working-class blacks and 22 percent of working-class Hispanics (Exhibit 2.2). Further, two-thirds (67 percent) of working-class whites say they are homeowners (including those who say they’re paying off a mortgage), about double the 32 percent of working-class blacks and 36 percent of working-class Hispanics who say they own homes (Exhibit 2.3).
- Whites without college degrees are less optimistic about their children’s future than their black and Hispanic counterparts; 23 percent expect their children to have a better standard of living than their own, compared with 36 percent of working-class blacks and 48 percent of working-class Hispanics (Exhibit 2.4).
- Attitudes towards immigration and trade differ by race within the working-class. Nearly half (47 percent) of working-class whites see immigrants as a burden on our country, while majorities of working-class blacks (57 percent) and Hispanics (74 percent) say they strengthen the country (Exhibit 2.5). On international trade, working-class whites (69 percent) are almost twice as likely as working-class blacks (37 percent) and Hispanics (37 percent) to think that trade agreements with other countries have cost the U.S. jobs (Exhibit 2.6).
- Some of these differences are driven by partisanship; working-class whites are much more likely than working-class blacks or Hispanics to identify as Republicans (34 percent versus 3 percent and 11 percent, respectively), and much less likely to identify as Democrats (22 percent versus 63 percent and 42 percent) (Exhibit 2.7).
However, it also reveals many ways in which these three groups report similar attitudes and experiences:
- Majorities of working-class whites (53 percent), blacks (74 percent), and Hispanics (61 percent) say the government doesn’t do enough to help “people like you,” while most college-educated whites (60 percent) say it does about the right amount (Exhibit 2.8).
- Majorities of working-class people across racial lines say it’s becoming harder for people like them to get ahead financially, find good jobs, own a home or have a secure retirement (though working-class blacks are less likely than whites to say it’s gotten harder to afford health care or get a good education) (Exhibit 2.9).
- Many working-class whites, blacks, and Hispanics report making various sacrifices in the past year to make ends meet. About half of whites and Hispanics in this group, and two-thirds of blacks say they’ve taken on an extra job or worked extra hours, and nearly as many say they’ve postponed medical or dental care. About four in ten working-class whites and blacks (along with a quarter of Hispanics) say they’ve unexpectedly taken money out of long-term savings, and about 3 in 10 in each group say they’ve increased their credit card debt. One notable difference: working-class blacks stand out as more likely than either whites or Hispanics in saying that they’ve borrowed money from friends or family in the past year (Exhibit 2.10).
- Still, the vast majority of working-class whites, blacks, and Hispanics, say they feel happy and optimistic about how things are going in their own lives (Exhibit 2.11).
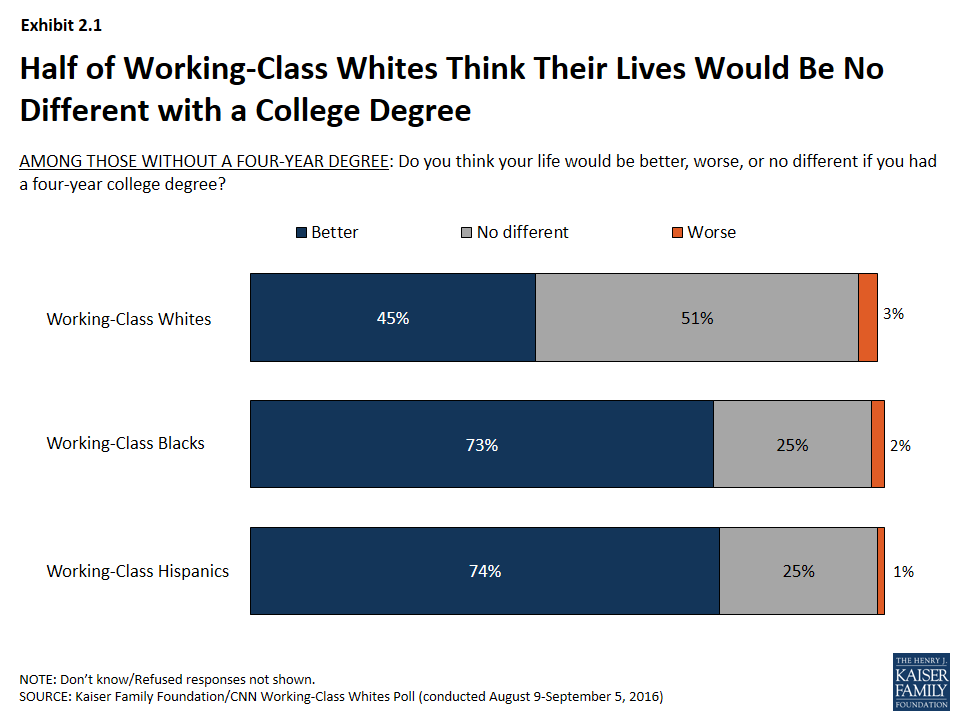
Half of Working-Class Whites Think Their Lives Would Be No Different with a College Degree
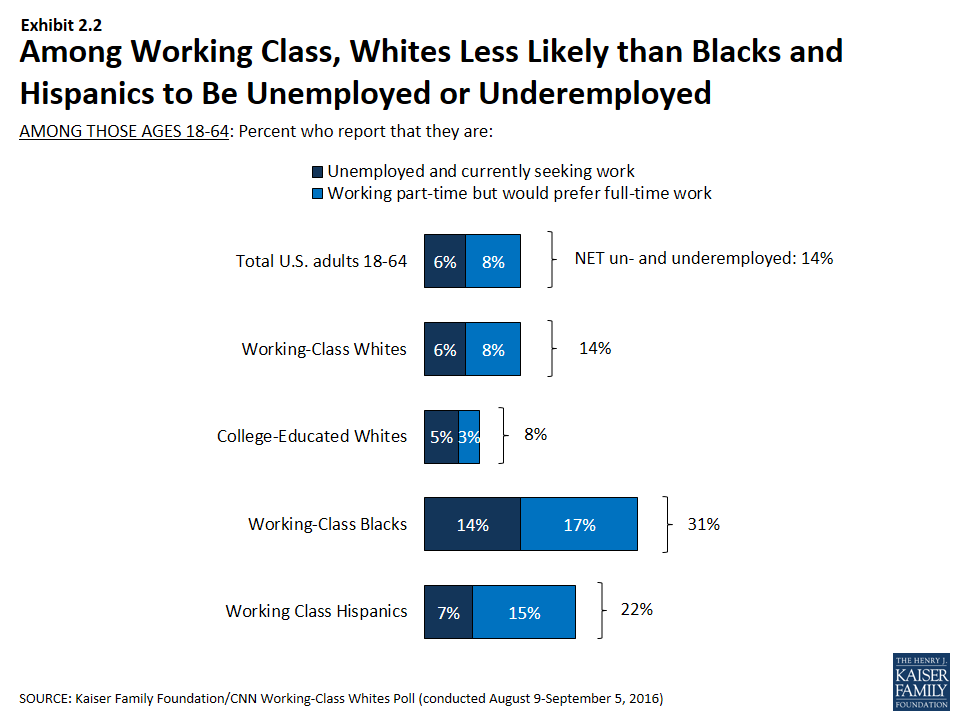
Among Working Class, Whites Less Likely than Blacks and Hispanics to Be Unemployed or Underemployed
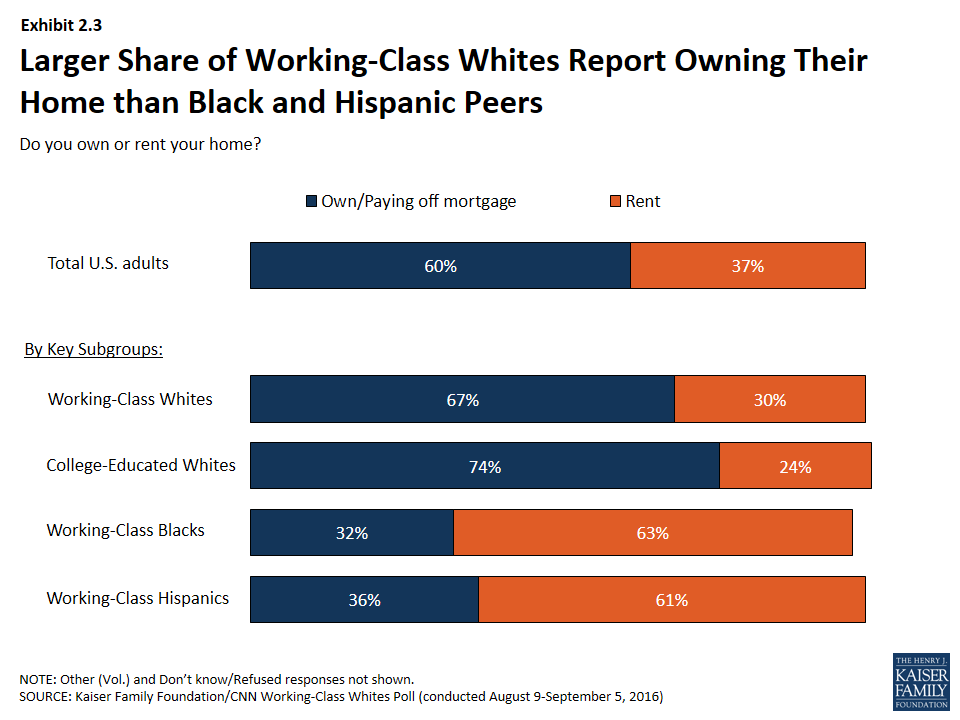
Larger Share of Working-Class Whites Report Owning Their Home than Black and Hispanic Peers

Working-Class Whites Less Likely to Express Optimism about Children’s Future than Black, Hispanic Peers
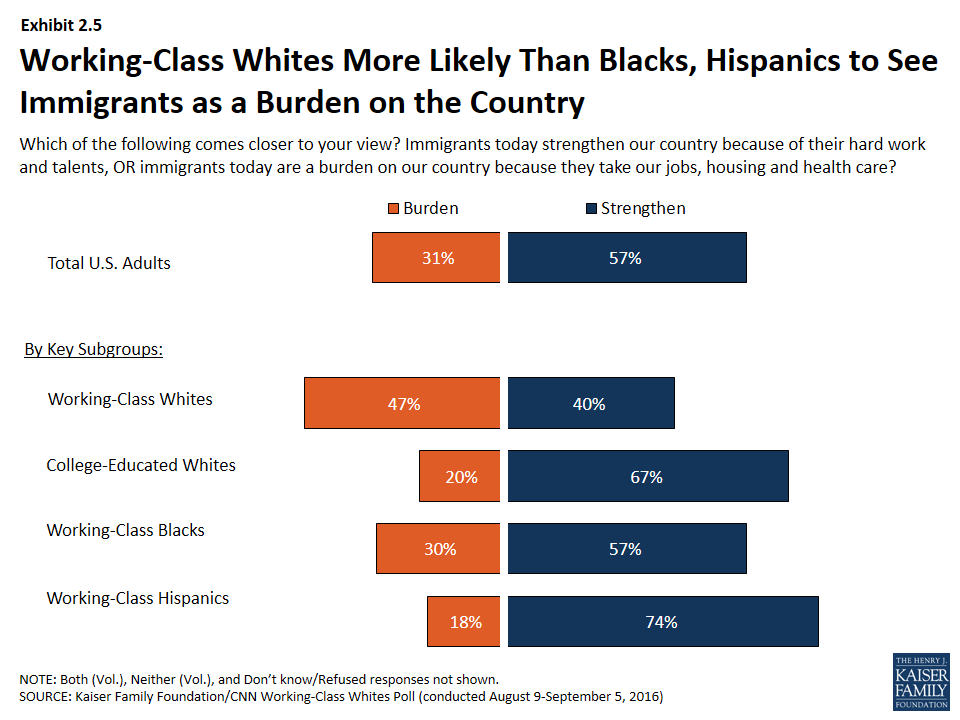
Working-Class Whites More Likely Than Blacks, Hispanics to See Immigrants as a Burden on the Country
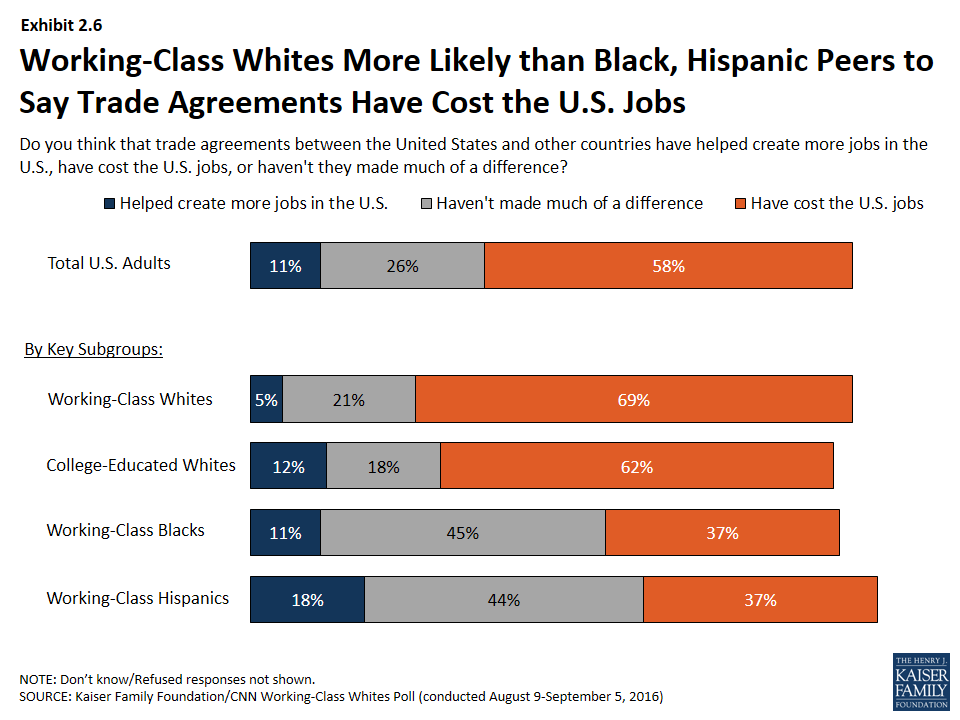
Working-Class Whites More Likely than Black, Hispanic Peers to Say Trade Agreements Have Cost the U.S. Jobs
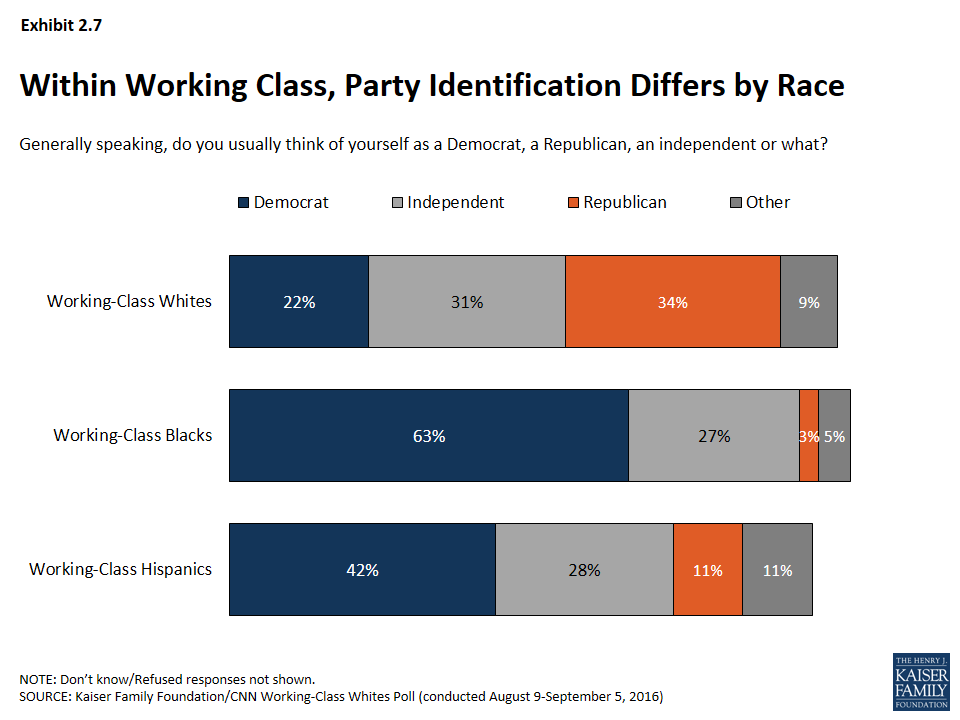
Within Working Class, Party Identification Differs by Race
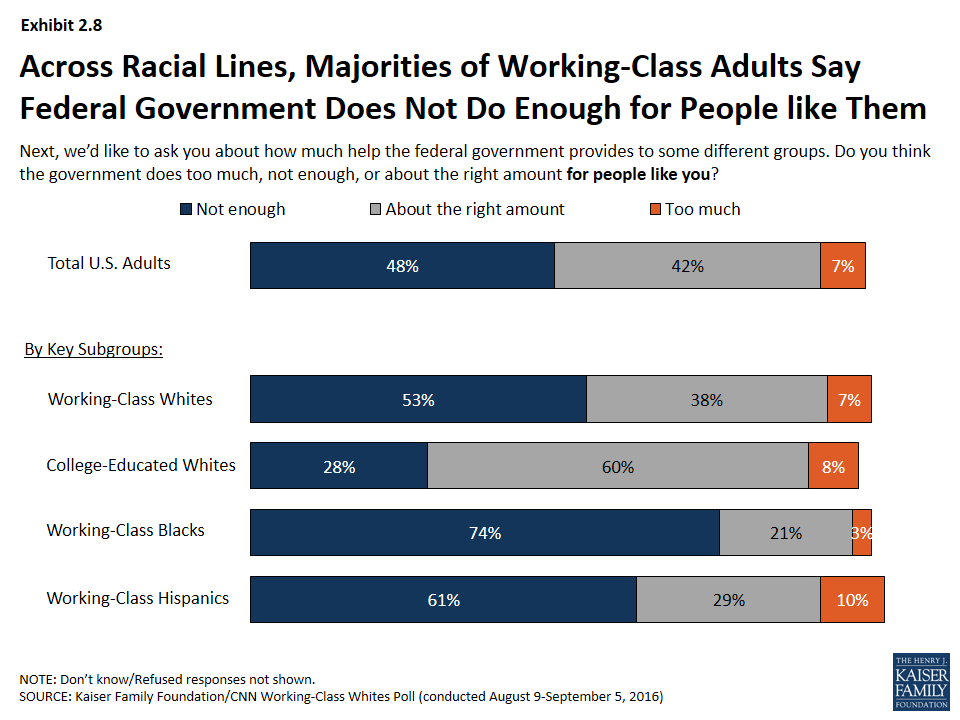
Across Racial Lines, Majorities of Working-Class Adults Say Federal Government Does Not Do Enough for People like Them
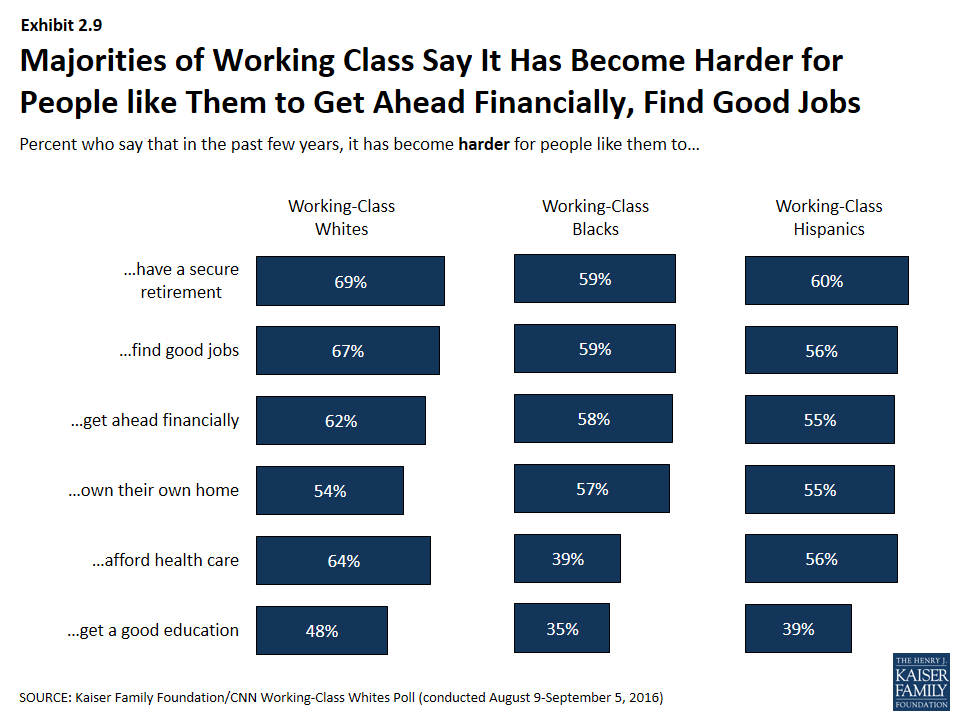
Majorities of Working Class Say It Has Become Harder for People like Them to Get Ahead Financially, Find Good Jobs
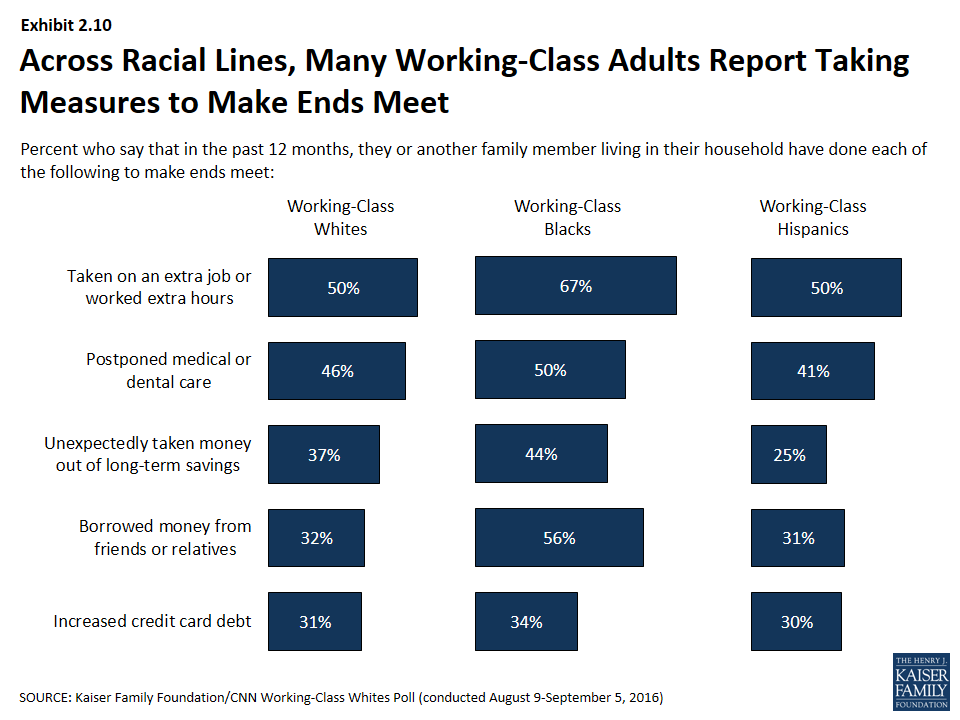
Across Racial Lines, Many Working-Class Adults Report Taking Measures to Make Ends Meet
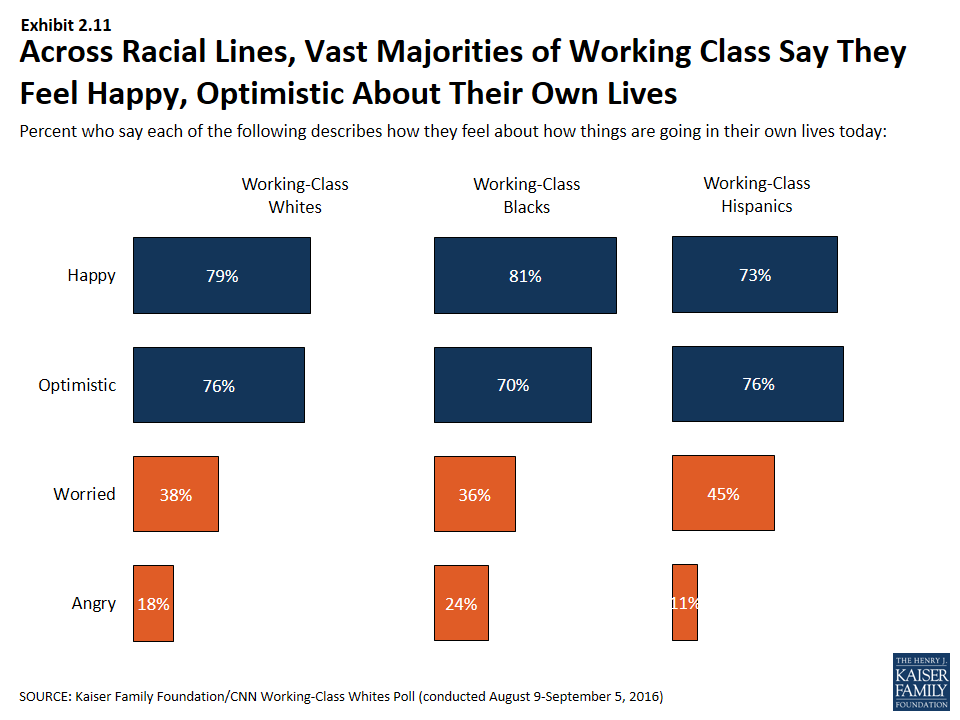
Across Racial Lines, Vast Majorities of Working Class Say They Feel Happy, Optimistic About Their Own Lives
Section 3: Not a Monolith
White Americans without college degrees are not a monolithic group in terms of their attitudes and experiences. Below are a few subgroup findings that illustrate some of the nuances within this group.
On the direction of the country:
- While working-class whites as a whole are split on whether America’s best days are ahead or behind, some groups stand out as more likely than others to see the country’s best days ahead (Democrats, those with higher incomes, those living in urban areas, and those with no religious preference), while others stand out as more likely to believe the best days are in the past (Republicans, Evangelical Christians, those living in rural areas, and those with lower incomes) (Exhibit 3.1).
- Other groups are also more likely to believe America’s best days are behind us, including those who see immigrants as a burden on the country (61 percent), and those who say someone in their household has lost a job or had work hours reduced in the last year (57 percent) (Exhibit 3.2).
- Views on the future also differ by age; about a third of those under age 30 expect their children to have a worse standard of living than they do now, compared with half or more in older age groups (Exhibit 3.3).
On views of government:
- Views of whether the federal government is doing enough to help “people like you” are strongly correlated with income; 69 percent of those with household incomes less than $30,000 say the government doesn’t do enough, more than twice the share of those earning $75,000 or more (31 percent) (Exhibit 3.4).
- Perhaps corresponding with this income difference, those who report that their household received at least one government benefit in the past year (excluding Medicare and Social Security, which are provided nearly universally to seniors), are more likely than those who receive no benefits to say the government doesn’t do enough to help people like them (63 percent versus 47 percent) (Exhibit 3.5).
- Rural working-class whites are more likely than those living in urban areas to say the federal government does not represent the views of people like them well at all (64 percent versus 52 percent) and that the government deserves all or most of the blame for the economic problems facing the working-class (71 percent versus 51 percent) (Exhibit 3.6).
On cultural change, immigration, and increasing diversity:
- Views on cultural changes vary among working-class whites by religious identification. For example, 89 percent of working-class whites who are Evangelical Christians believe Christian values are under attack in America today, compared with 73 percent of mainline Protestants, 61 percent of Catholics, and 41 percent of those with no religious preference. Similarly, 48 percent of Evangelical Christians say increasing diversity is threatening American culture, compared with 39 percent of mainline Protestants, 28 percent of Catholics, and 19 percent of those with no religious preference (Exhibit 3.7).
- Views on cultural changes also vary by age; 73 percent of 18-29 year-old working-class whites say that increasing racial and ethnic diversity is enriching American culture, a figure that stands at 51 percent among those ages 65 and over (Exhibit 3.8).
- There are also variations within working-class whites’ views on immigration; 61 percent of rural working-class whites say the government should attempt to deport all people living in the United States illegally, while about half (49 percent) of urban working-class whites agree (Exhibit 3.9).
- Working-class whites in the South are about twice as likely as those in other regions to say they’ve personally been negatively impacted by illegal immigrants taking jobs in their community (40 percent versus between 18 to 22 percent in other regions) (Exhibit 3.10).
On their personal lives:
- Almost half (45 percent) of working-class whites with household incomes under $30,000 say they are worried about how things are going in their own lives, compared with just 30 percent of those with incomes of at least $75,000 (Exhibit 3.11).
- One quarter (25 percent) of working-class whites in the South do not have health insurance, compared with between 5 and 10 percent in other regions (Exhibit 3.12).
On politics:
- Besides the obvious partisan differences in candidate support, there are also correlations between working-class whites’ attitudes and their level of support for presidential candidates. For example, 84 percent of working-class white voters who see increasing racial and ethnic diversity as a threat to US culture say they would consider voting for Donald Trump, compared with 45 percent of those who say diversity enriches the culture. Similarly, 78 percent of working-class white voters who say immigrants are a burden on the country say they would consider voting for Trump, compared with 38 percent of those who believe immigrants strengthen the country (Exhibit 3.13).
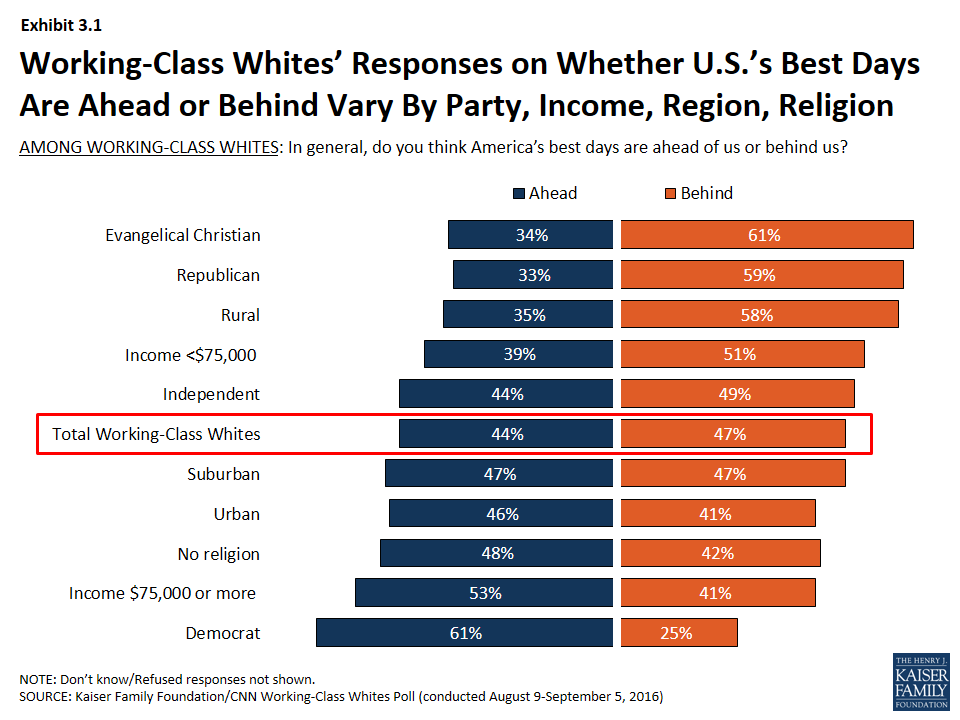
Working-Class Whites’ Responses on Whether U.S.’s Best Days Are Ahead or Behind Vary By Party, Income, Region, Religion
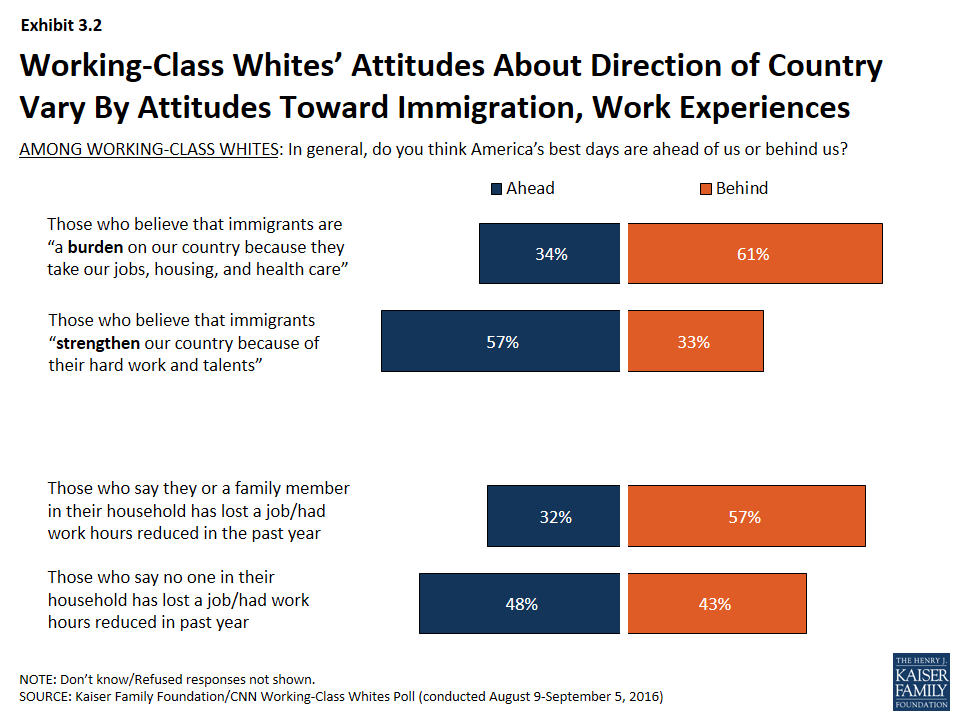
Working-Class Whites’ Attitudes About Direction of Country Vary By Attitudes Toward Immigration, Work Experiences
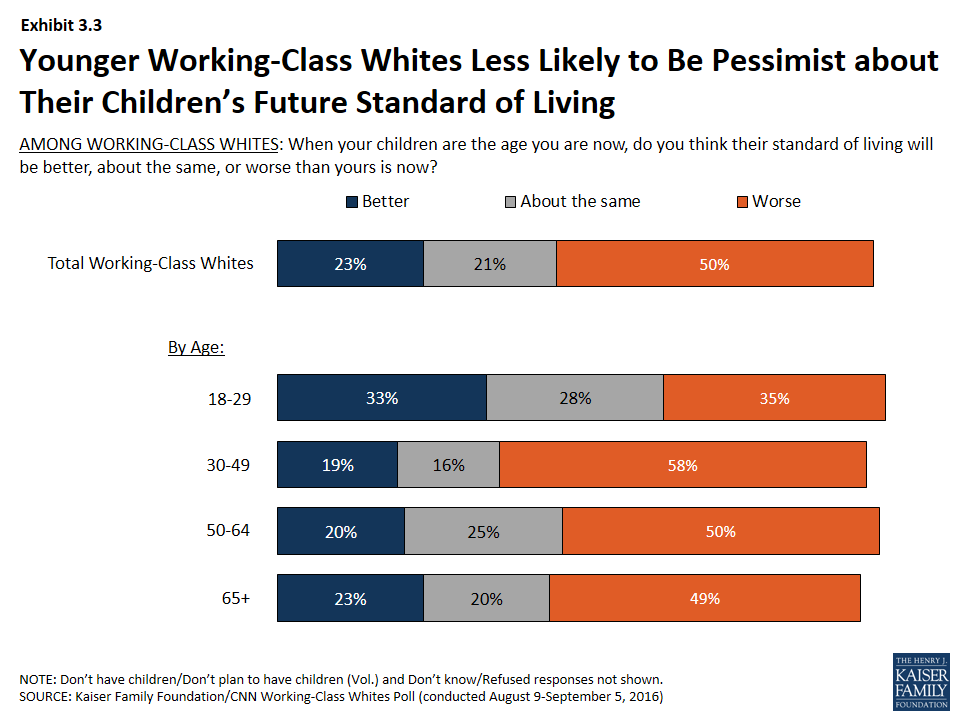
Younger Working-Class Whites Less Likely to Be Pessimist about Their Children’s Future Standard of Living
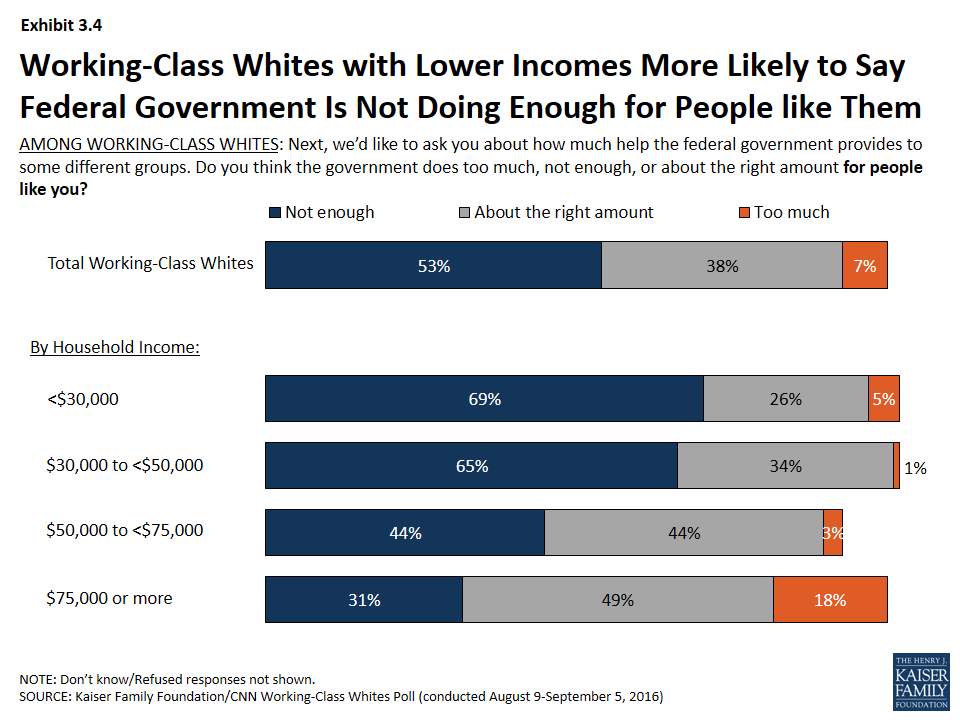
Working-Class Whites with Lower Incomes More Likely to Say Federal Government Is Not Doing Enough for People like Them
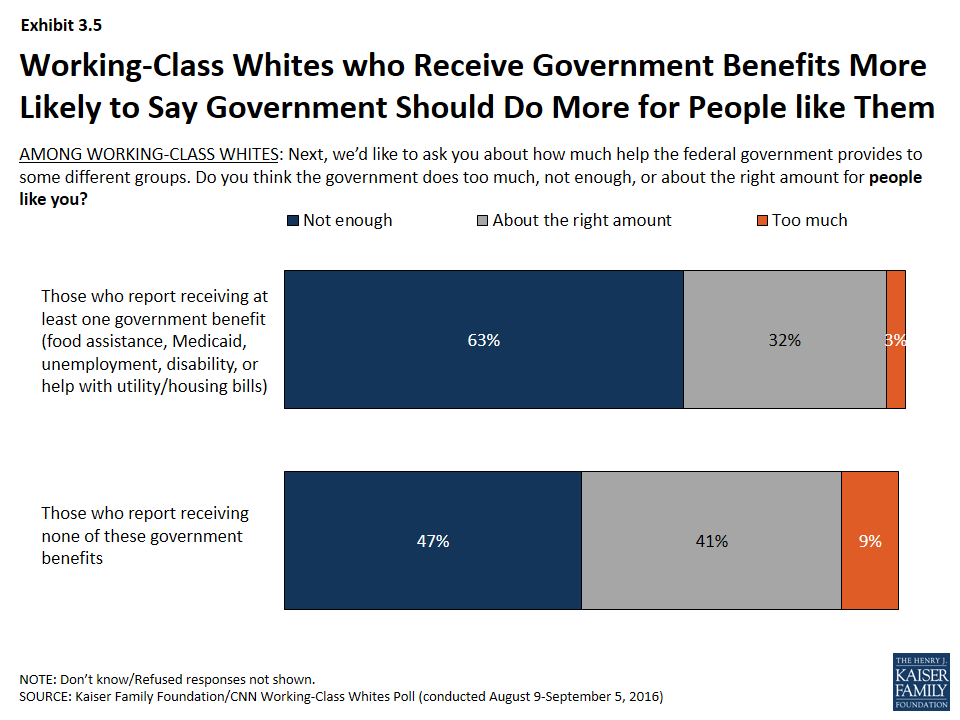
Working-Class Whites who Receive Government Benefits More Likely to Say Government Should Do More for People like Them
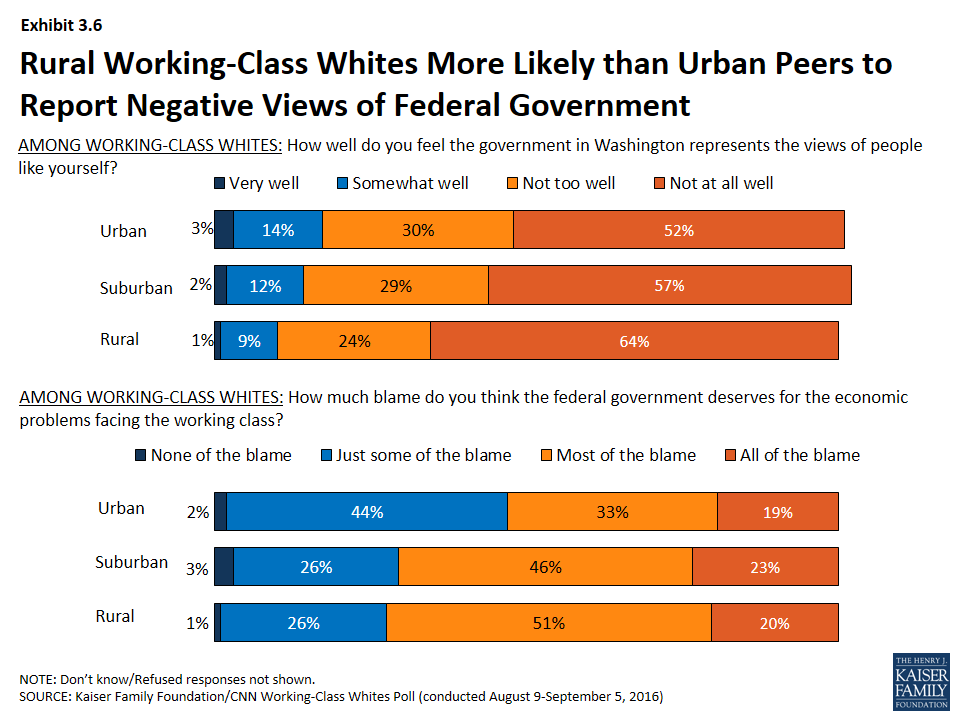
Rural Working-Class Whites More Likely than Urban Peers to Report Negative Views of Federal Government
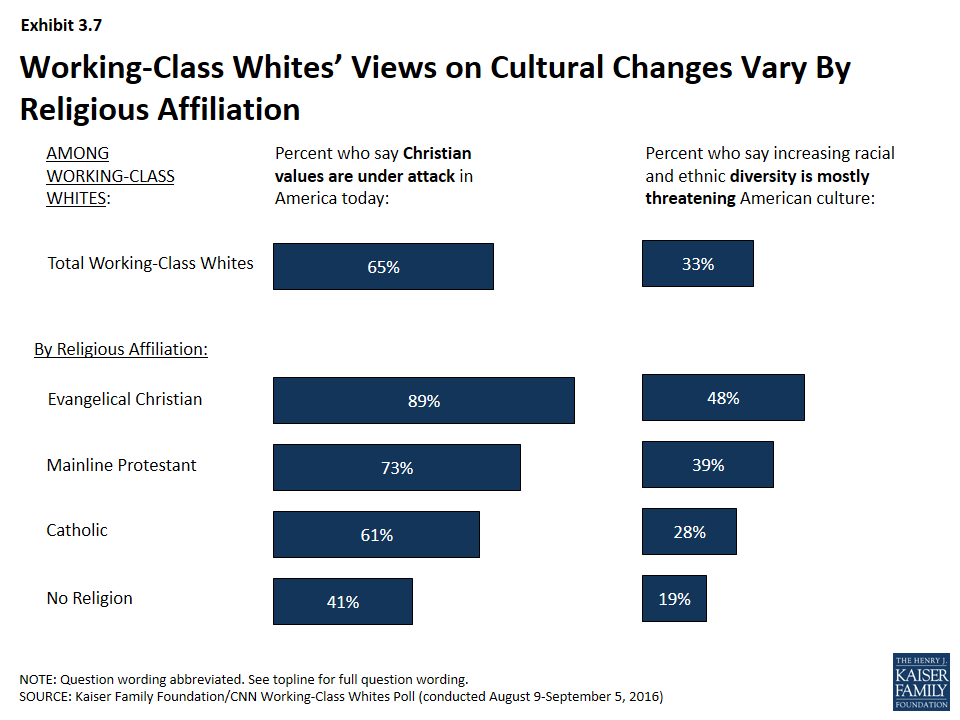
Working-Class Whites’ Views on Cultural Changes Vary By Religious Affiliation
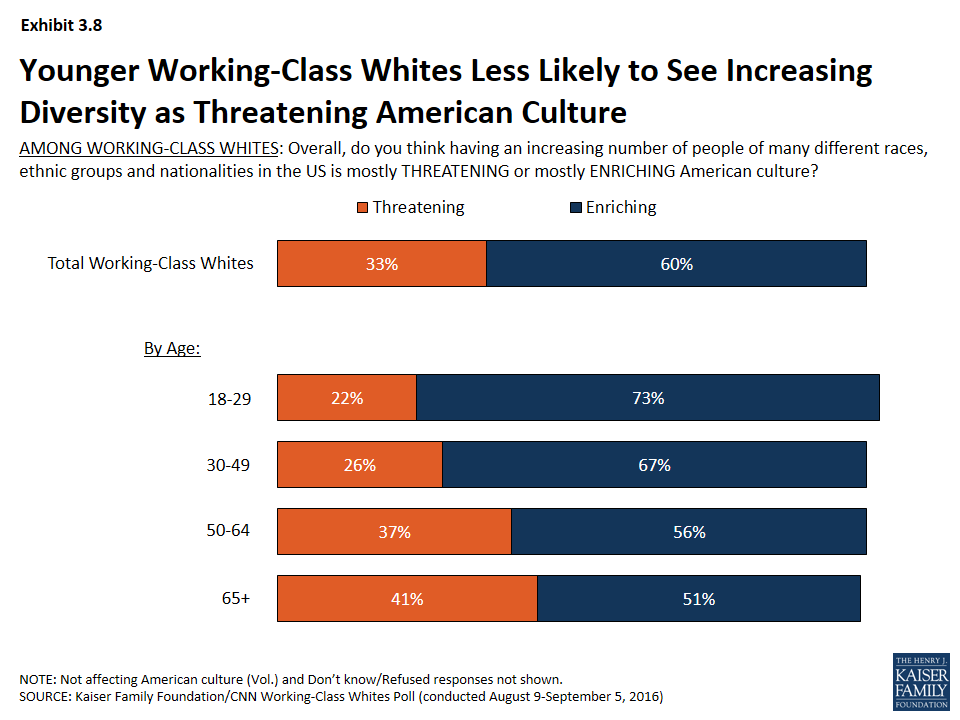
Younger Working-Class Whites Less Likely to See Increasing Diversity as Threatening American Culture
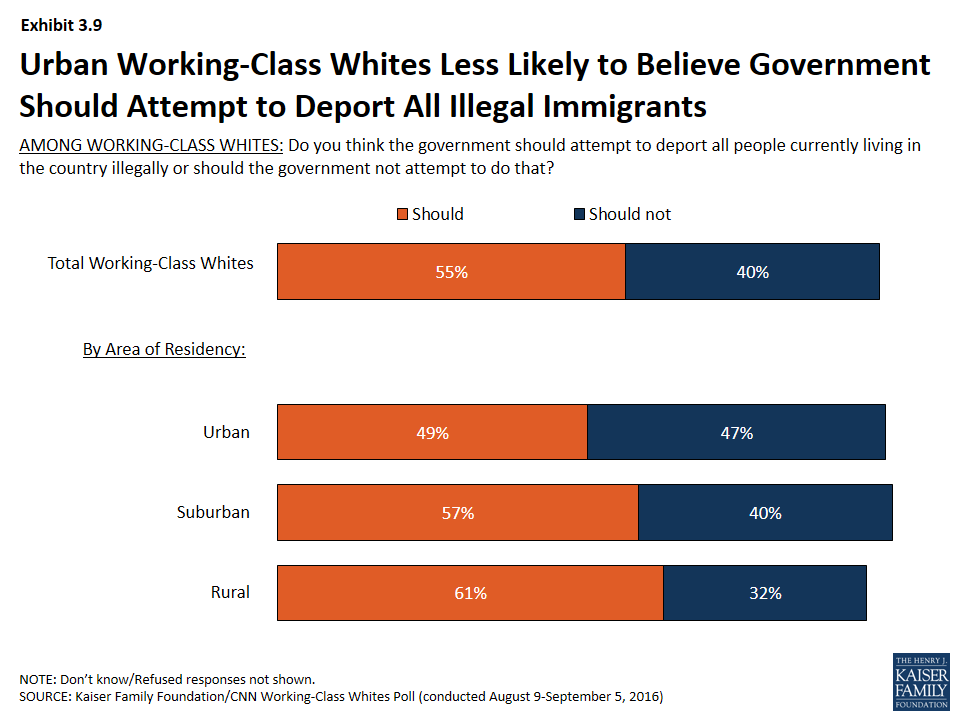
Urban Working-Class Whites Less Likely to Believe Government Should Attempt to Deport All Illegal Immigrants
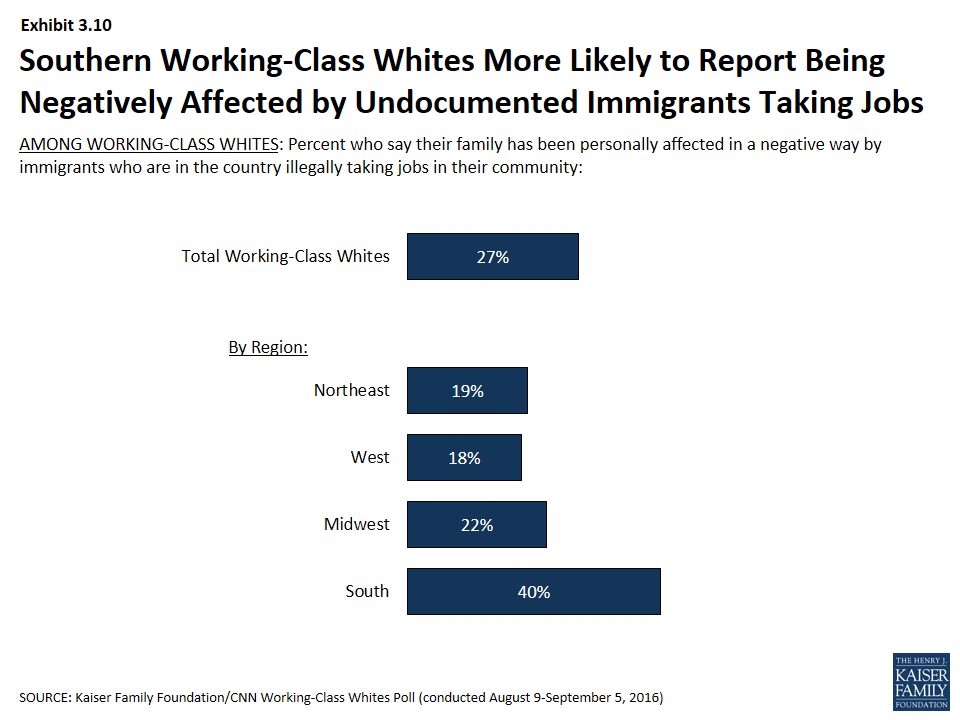
Southern Working-Class Whites More Likely to Report Being Negatively Affected by Undocumented Immigrants Taking Jobs
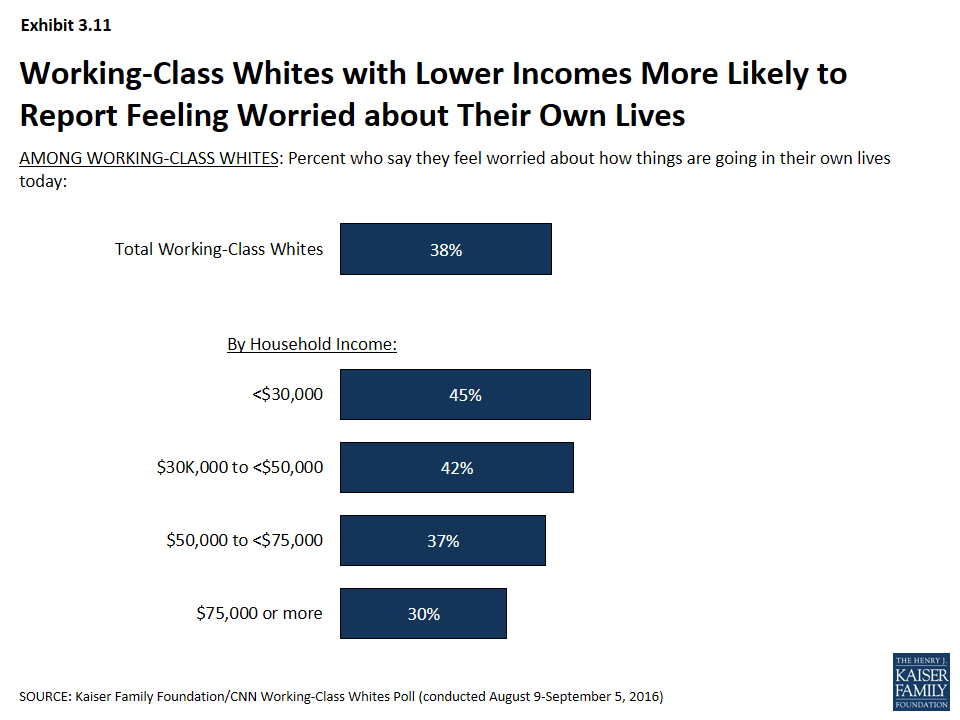
Working-Class Whites with Lower Incomes More Likely to Report Feeling Worried about Their Own Lives
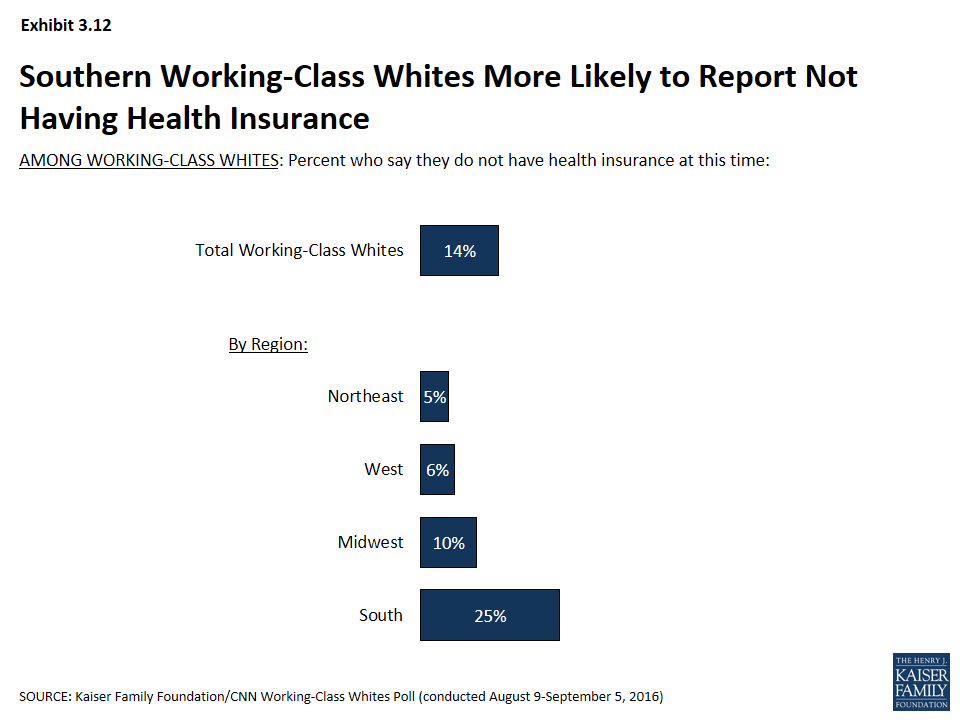
Southern Working-Class Whites More Likely to Report Not Having Health Insurance
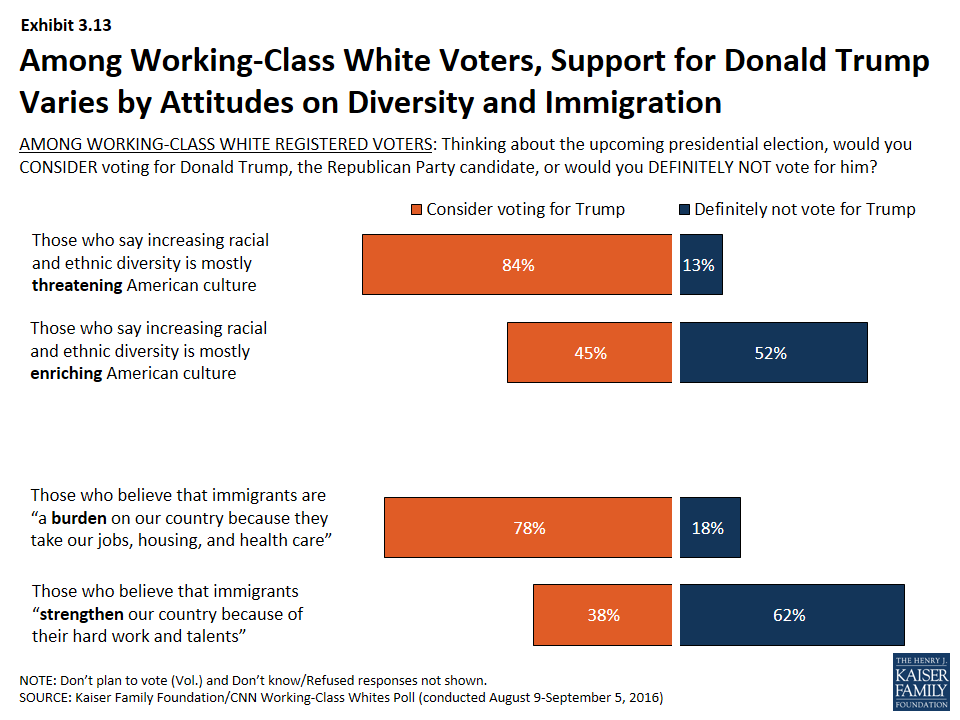
Among Working-Class White Voters, Support for Donald Trump Varies by Attitudes on Diversity and Immigration
Section 4: Politics and Partisanship
The survey reveals some large partisan gaps within the white working class, but also some areas where the attitudes of white partisans without college degrees differ sharply from their college-educated counterparts.
- Politically, whites without a college degree are about as likely as college-educated whites to identify as Republicans (34 percent versus 31 percent), but much less likely to identify as Democrats (22 percent versus 35 percent]. Four in ten working-class whites (42 percent) identify as conservative, while just 18 percent call themselves liberal (Exhibit 4.1).
- Among working-class whites, Republicans are much more likely than Democrats to say America’s best days are behind us (59 percent versus 25 percent), that they’re very dissatisfied with the country’s economic situation (62 percent versus 37 percent), and that they expect their children to have a worse standard of living than they do now (64 percent versus 33 percent) (Exhibit 4.2).
- Partisanship sharply divides what members of this group see as the top economic issue for the next president to address. Among Democrats in this group, 40 percent say the income gap between the rich and poor, 33 percent say the availability of good paying jobs, 10 percent say taxes, a scant 6 percent say trade and almost none cite government regulation of business. For Republicans in this group, jobs rank first (32 percent), followed by taxes (21 percent), with 13 percent pointing to trade, 12 percent to regulation and just 8 percent to the income gap (Exhibit 4.3).
- When asked about increasing racial and ethnic diversity generally and immigration specifically, there is a partisan gap among working-class whites. However, both Democrats and Republicans in this group tend to see those changes as more negative/threatening than do their college-educated counterparts. For example, the poll reveals a divide on whether immigrants to the U.S. strengthen or burden the country, with white working class Republicans most apt to see them as a burden (62 percent), 22 percentage points higher than among white Republicans with college degrees (40 percent]. Meanwhile, working-class white Democrats are almost 30 points more apt than college-grad white Democrats to say the same (35 percent versus 6 percent) (Exhibit 4.4).
- Having a college degree seems to play a bigger role than partisanship in people’s assessments of whether the federal government is doing enough to help people like them. About half of working-class white Democrats (55 percent) and Republicans (52 percent) say the federal government isn’t doing enough for “people like you,” while both Democrats and Republicans with college degrees are far less likely to say the same (26 percent and 30 percent, respectively) (Exhibit 4.5).
- There are some signs in the poll that white Democrats without college degrees are not as unified behind the Democratic Party as are Democrats with college degrees. For example, 22 percent of self-identified Democrats who are working-class white voters say they would consider voting for Donald Trump, versus just 2 percent of white Democrats with college degrees (Exhibit 4.6). And fully 23 percent of this group of Democrats say they would definitely not vote for Hillary Clinton, well above the 3 percent of white Democrats with college degrees who say the same. Republicans are more unified across this educational divide (Exhibit 4.7).
- More than 4 in 10 working-class white Democrats (44 percent) say Christian values are under attack in America today, compared with just 13 percent of white college-grad Democrats. More than 8 in 10 white Republicans say the same, regardless of education level (Exhibit 4.8).
- While white working class Democrats express mostly positive impressions of immigrants from Muslim and Latin American countries, they are considerably more likely than college-educated white Democrats to express skepticism of these immigrants. For example, 47 percent of white working class Democrats say immigrants from Muslim countries increase the risk of terrorist attacks in the U.S., compared with just 16 percent of college-educated white Democrats. And white working class Democrats are more than twice as likely as college-educated white Democrats to say immigrants from Latin American countries add to the crime problem (37 percent versus 14 percent), and more than three times as likely to say these immigrants take jobs away from Americans (39 percent versus 11 percent) (Exhibit 4.9).

Working-Class Whites Less Likely than College Educated Whites to Identify as Democrats, More Likely to Be Conservative

Among White Working Class, Republicans More Likely than Democrats to Be Dissatisfied, Pessimistic about Direction of Country
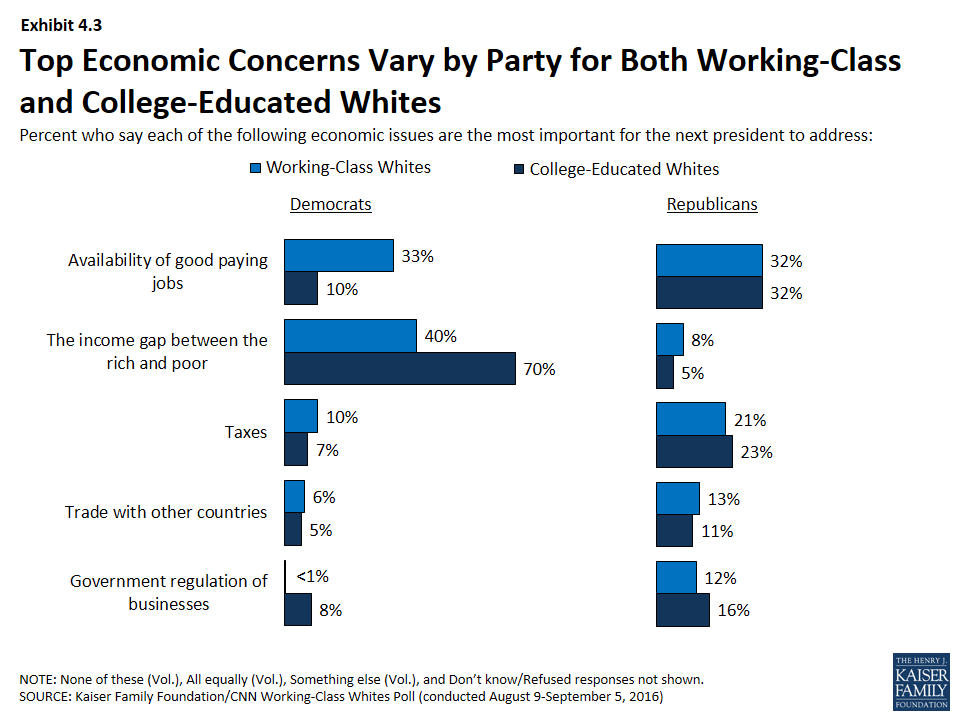
Top Economic Concerns Vary by Party for Both Working-Class and College-Educated Whites
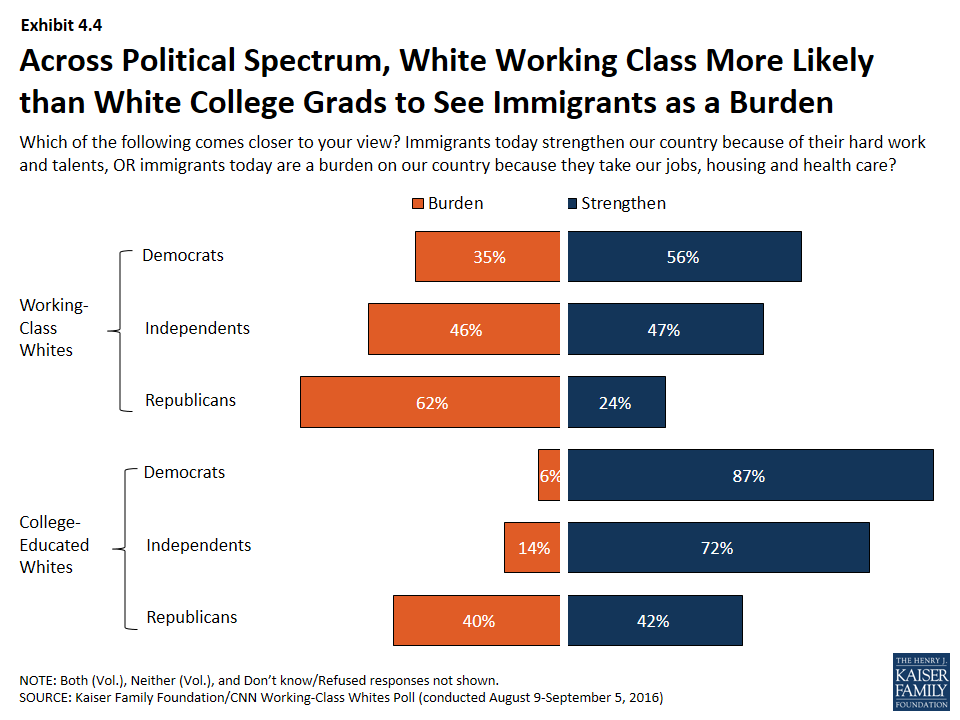
Across Political Spectrum, White Working Class More Likely than White College Grads to See Immigrants as a Burden
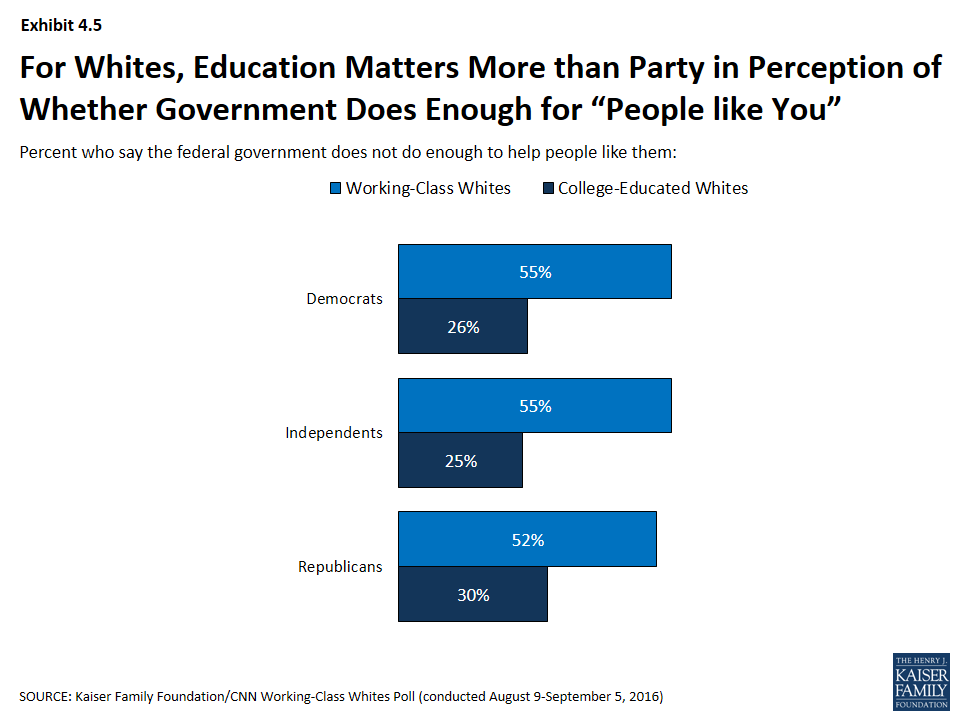
For Whites, Education Matters More than Party in Perception of Whether Government Does Enough for “People like You”
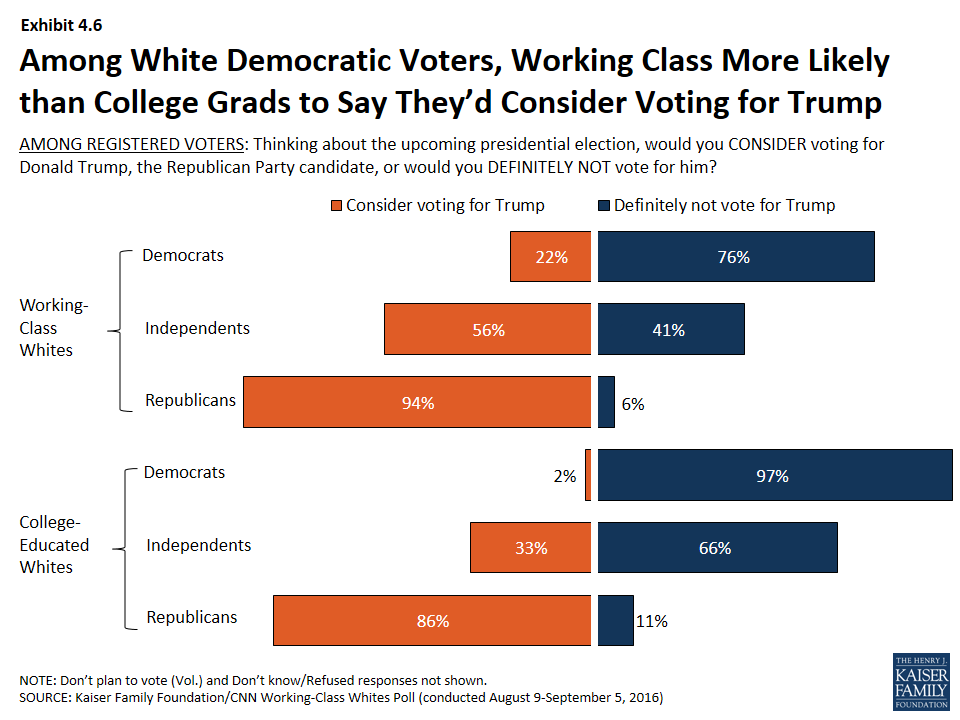
Among White Democratic Voters, Working Class More Likely than College Grads to Say They’d Consider Voting for Trump
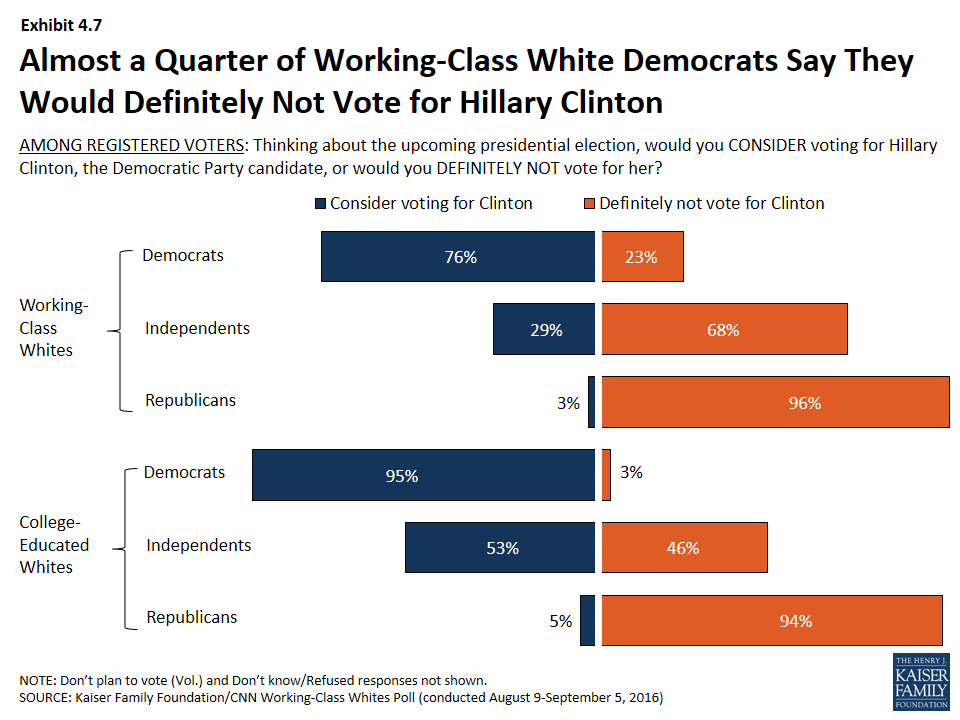
Almost a Quarter of Working-Class White Democrats Say They Would Definitely Not Vote for Hillary Clinton
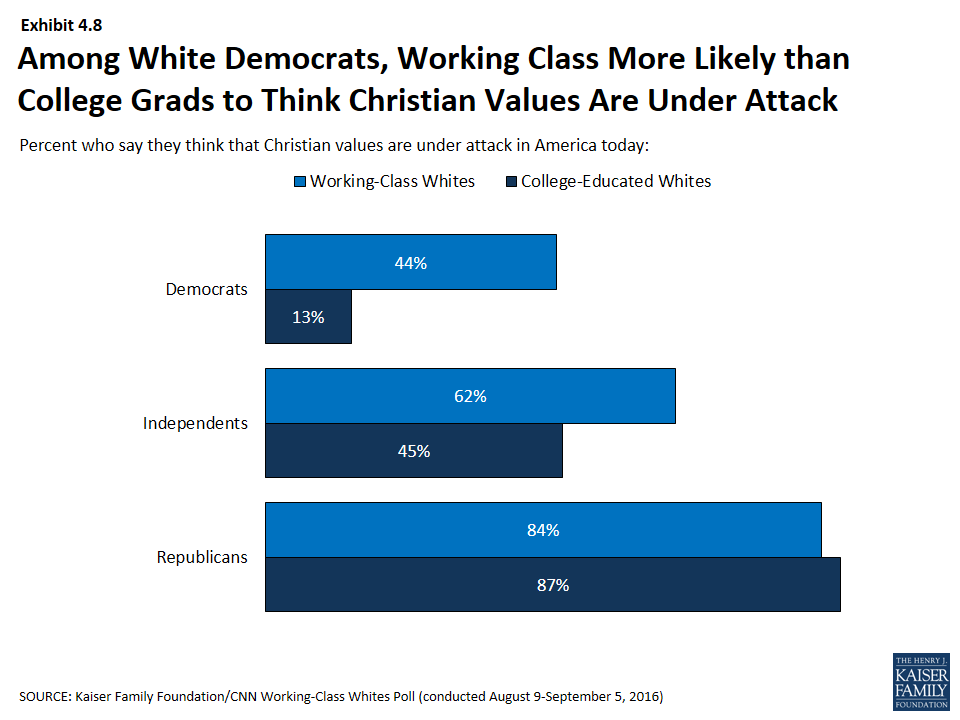
Among White Democrats, Working Class More Likely than College Grads to Think Christian Values Are Under Attack
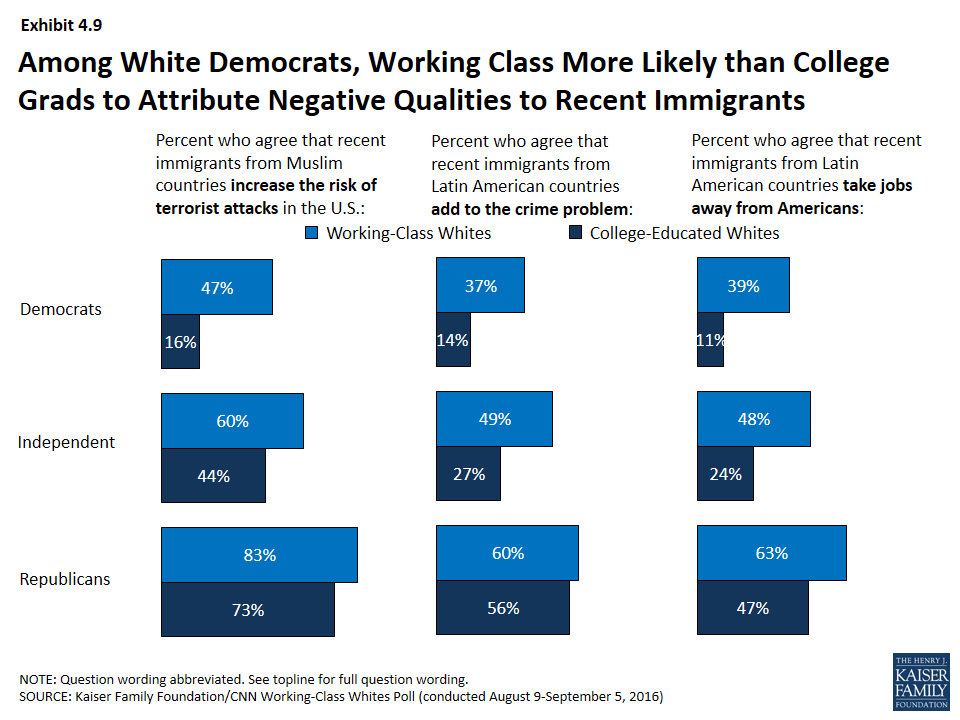
Among White Democrats, Working Class More Likely than College Grads to Attribute Negative Qualities to Recent Immigrants
Methodology
The Kaiser Family Foundation/CNN Working-Class Whites Poll was conducted August 9-September 5, 2016, among a nationally representative random digit dial (RDD) telephone sample of 1,614 adults ages 18 and older, living in the United States, including Alaska and Hawaii (Note: persons without a telephone could not be included in the random selection process). Computer-assisted telephone interviews conducted by landline (471) and cell phone (1,143, including 716 who had no landline telephone) were carried out in English and Spanish by SSRS. CNN and the Kaiser Family Foundation both contributed financing for the survey, and teams from both organizations worked together to develop the survey questionnaire and analyze the data. Each organization is responsible for its content.
For the purposes of this poll, “working-class�� is defined as those who have attained less than a four-year college degree, excluding those between the ages of 18-24 who are currently enrolled in school. “College graduates” includes those who have attained at least a four-year degree. To ensure there were enough respondents to capture the views and experiences of working-class whites, blacks, and Hispanics, the full sample includes additional interviews with randomly selected respondents from these groups (commonly referred to as an “oversample”), for a total of 701 working-class whites, 129 working-class blacks, and 136 working-class Hispanics. Results for all groups have been adjusted to reflect their actual national distribution (See weighting description below). The sample plan consisted of three elements: 1) respondents reached by RDD to landline telephones or cell phones (1098 total, including 385 working-class whites, 70 working-class blacks, 99 working-class Hispanics, and 329 whites with four-year college degrees); 2) respondents reached by RDD to landlines or cell phones within Census blocks with an estimated large share of white individuals with less than a college degree (294 total, including 181 working-class whites, 7 working-class blacks, 2 working-class Hispanics, and 77 whites with four-year college degrees), and 3) prescreened respondents reached by calling back phone numbers where respondents previously interviewed for other RDD surveys indicated that they had no college degree and were white (135), black (52), or Hispanic (35). Both the RDD landline and cell phone samples were provided by Marketing Systems Group (MSG).
To randomly select a household member for the landline samples, respondents were selected by asking for the adult male or female currently at home who had the most recent birthday based on a random rotation. If no one of that gender was available, interviewers asked to speak with the adult of the opposite gender who had the most recent birthday. For the cell phone samples, interviews were conducted with the adult who answered the phone.
A multi-stage weighting process was applied to ensure an accurate representation of the national adult population. The first stage of weighting involved corrections for sample design, including a correction for oversampling, the likelihood of non-response for the prescreened sample, and an adjustment to account for the fact that respondents with both a landline and cell phone have a higher probability of selection. The second weighting stage was conducted for working-class whites and for all other respondents separately, weighting to match estimates for the national population using data from the Census Bureau’s 2015 March supplement of the Current Population Survey (CPS). In addition, the distribution of phone use was estimated based on each group’s weighted phone use distribution as captured in the past year on the SSRS Omnibus poll, a weekly, nationally representative RDD landline and cell phone survey. The weighting parameters used were age, gender, race/ethnicity (for the non-working-class white sample), nativity (for Hispanic respondents only), education, marital status, census region, population density of the respondents’ county, and telephone use. In the final weighting stage, each group (working-class whites, all others) was weighted to reflect its actual share in the U.S. adult population. All statistical tests of significance account for the effect of weighting.
The margin of sampling error including the design effect for the full sample is plus or minus 3 percentage points. Numbers of respondents and margins of sampling error for key subgroups are shown in the table below. For results based on other subgroups, the margin of sampling error may be higher. Sample sizes and margins of sampling error for other subgroups are available by request. Note that sampling error is only one of many potential sources of error in this or any other public opinion poll. Kaiser Family Foundation public opinion and survey research is a charter member of the Transparency Initiative of the American Association for Public Opinion Research.
| Group | N (unweighted) | MOSE |
| Total | 1614 | +/-3 percentage points |
| White Working Class | 701 | +/-5 percentage points |
| White College Graduates | 406 | +/-6 percentage points |
| Black Working Class | 129 | +/-10 percentage points |
| Hispanic Working Class | 136 | +/-9 percentage points |
| Total Registered Voters (RV) | 1364 | +/-3 percentage points |
| White Working Class RV | 602 | +/-5 percentage points |
| White College Graduate RV | 377 | +/-6 percentage points |
| Black Working Class RV | 105 | +/-11 percentage points |
| Hispanic Working Class RV | 96 | +/-11 percentage points |
The full KFF/CNN poll results are representative of the U.S. adult population, including people of all races. The reported results focus on the total sample, reflective of all adult people in the U.S., as well as whites without college degrees, blacks without college degrees, Hispanics without college degrees, and whites who have graduated from college. While the responses for some smaller groups of the US population, for example, Asian-Americans and people of mixed race, are counted in the “total” poll responses, the number of respondents who identify as Asian or as mixed race was too small to report separately, since the margin of sampling error around any poll result from these subgroups would be so large that the result would be unreliable and potentially misleading.
Endnotes
Introduction
For purposes of this survey, we excluded from the “working-class” definition those adults between the ages of 18-24 who are currently enrolled in school.