Medicare Advantage 2014 Spotlight: Enrollment Market Update
Introduction
Despite concerns that payment changes enacted in the Affordable Care Act of 2010 (ACA) would lead to reductions in Medicare Advantage enrollment, the number and share of Medicare beneficiaries enrolling in Medicare Advantage plans has continued to climb.1 Since the enactment of the ACA, Medicare Advantage enrollment has increased by 4.6 million, or by 41 percent.2 Reductions in payments enacted in the ACA aimed to reduce historical overpayments to Medicare Advantage plans and to create more equity between Medicare payments made for beneficiaries in the traditional Medicare program and those joining Medicare Advantage plans. As of March of 2014, almost one in three (30 percent) people on Medicare (15.7 million beneficiaries) were enrolled in a Medicare Advantage plan, a 10 percent increase since March 2013.During the past year, Medicare Advantage enrollment has increased in virtually all states. Most of the enrollment growth since 2013 has been in the individual market, but group enrollment in Medicare Advantage plans accounted for almost one-third (32%) of the enrollment growth in 2014 and has been a major factor in the experience of some firms.
Average monthly premiums (weighted by enrollment) have remained relatively stable since 2012 ($35 per month in 2014). During this same period, however, average out-of-pocket spending limits have been on the rise, which could expose a subset of enrollees to higher costs – mainly those who have significant medical needs. Medicare Advantage plans, unlike traditional Medicare, are required to limit out-of-pocket costs for services covered under Parts A and B ($3,400 is recommended; $6,700 is the maximum). Between 2013 and 2014, the share of Medicare Advantage enrollees in plans with limits above $5,000 almost doubled, from 24 percent in 2013 to 44 percent in 2014. This Data Spotlight reviews national and state-level enrollment trends as of March 2014 and examines variation in enrollment by plan type and firm. It also analyzes the most recent data on premiums, out-of-pocket limits and prescription drug coverage in the Part D “donut hole” for Medicare Advantage enrollees.
Issue Brief
Overall Trends in Enrollment
Nationwide Enrollment. There are 15.7 million beneficiaries – 30 percent of the Medicare population – enrolled in a Medicare Advantage plan in 2014 (Exhibit 1).1 Between 2013 and 2014, total Medicare Advantage enrollment grew by almost 1.4 million, or 9 percent; since 2010, Medicare Advantage enrollment has increased by 4.6 million beneficiaries or 41 percent from 2010 to 2014. This pattern continues the rapid growth in enrollment that occurred concurrently with the introduction of Part D (prescription drug coverage) in 2006 and other changes in the Medicare Advantage program authorized by the Medicare Prescription Drug, Improvement and Modernization Act (MMA) of 2003. Medicare enrollment has continued to grow despite the fact that the average number of plans available to enrollees nationwide declined from a high of 48 plans in 2009 to 20 plans in 2012 and to 18 in 2014, as firms made changes to plans offered under their Medicare Advantage contracts.2
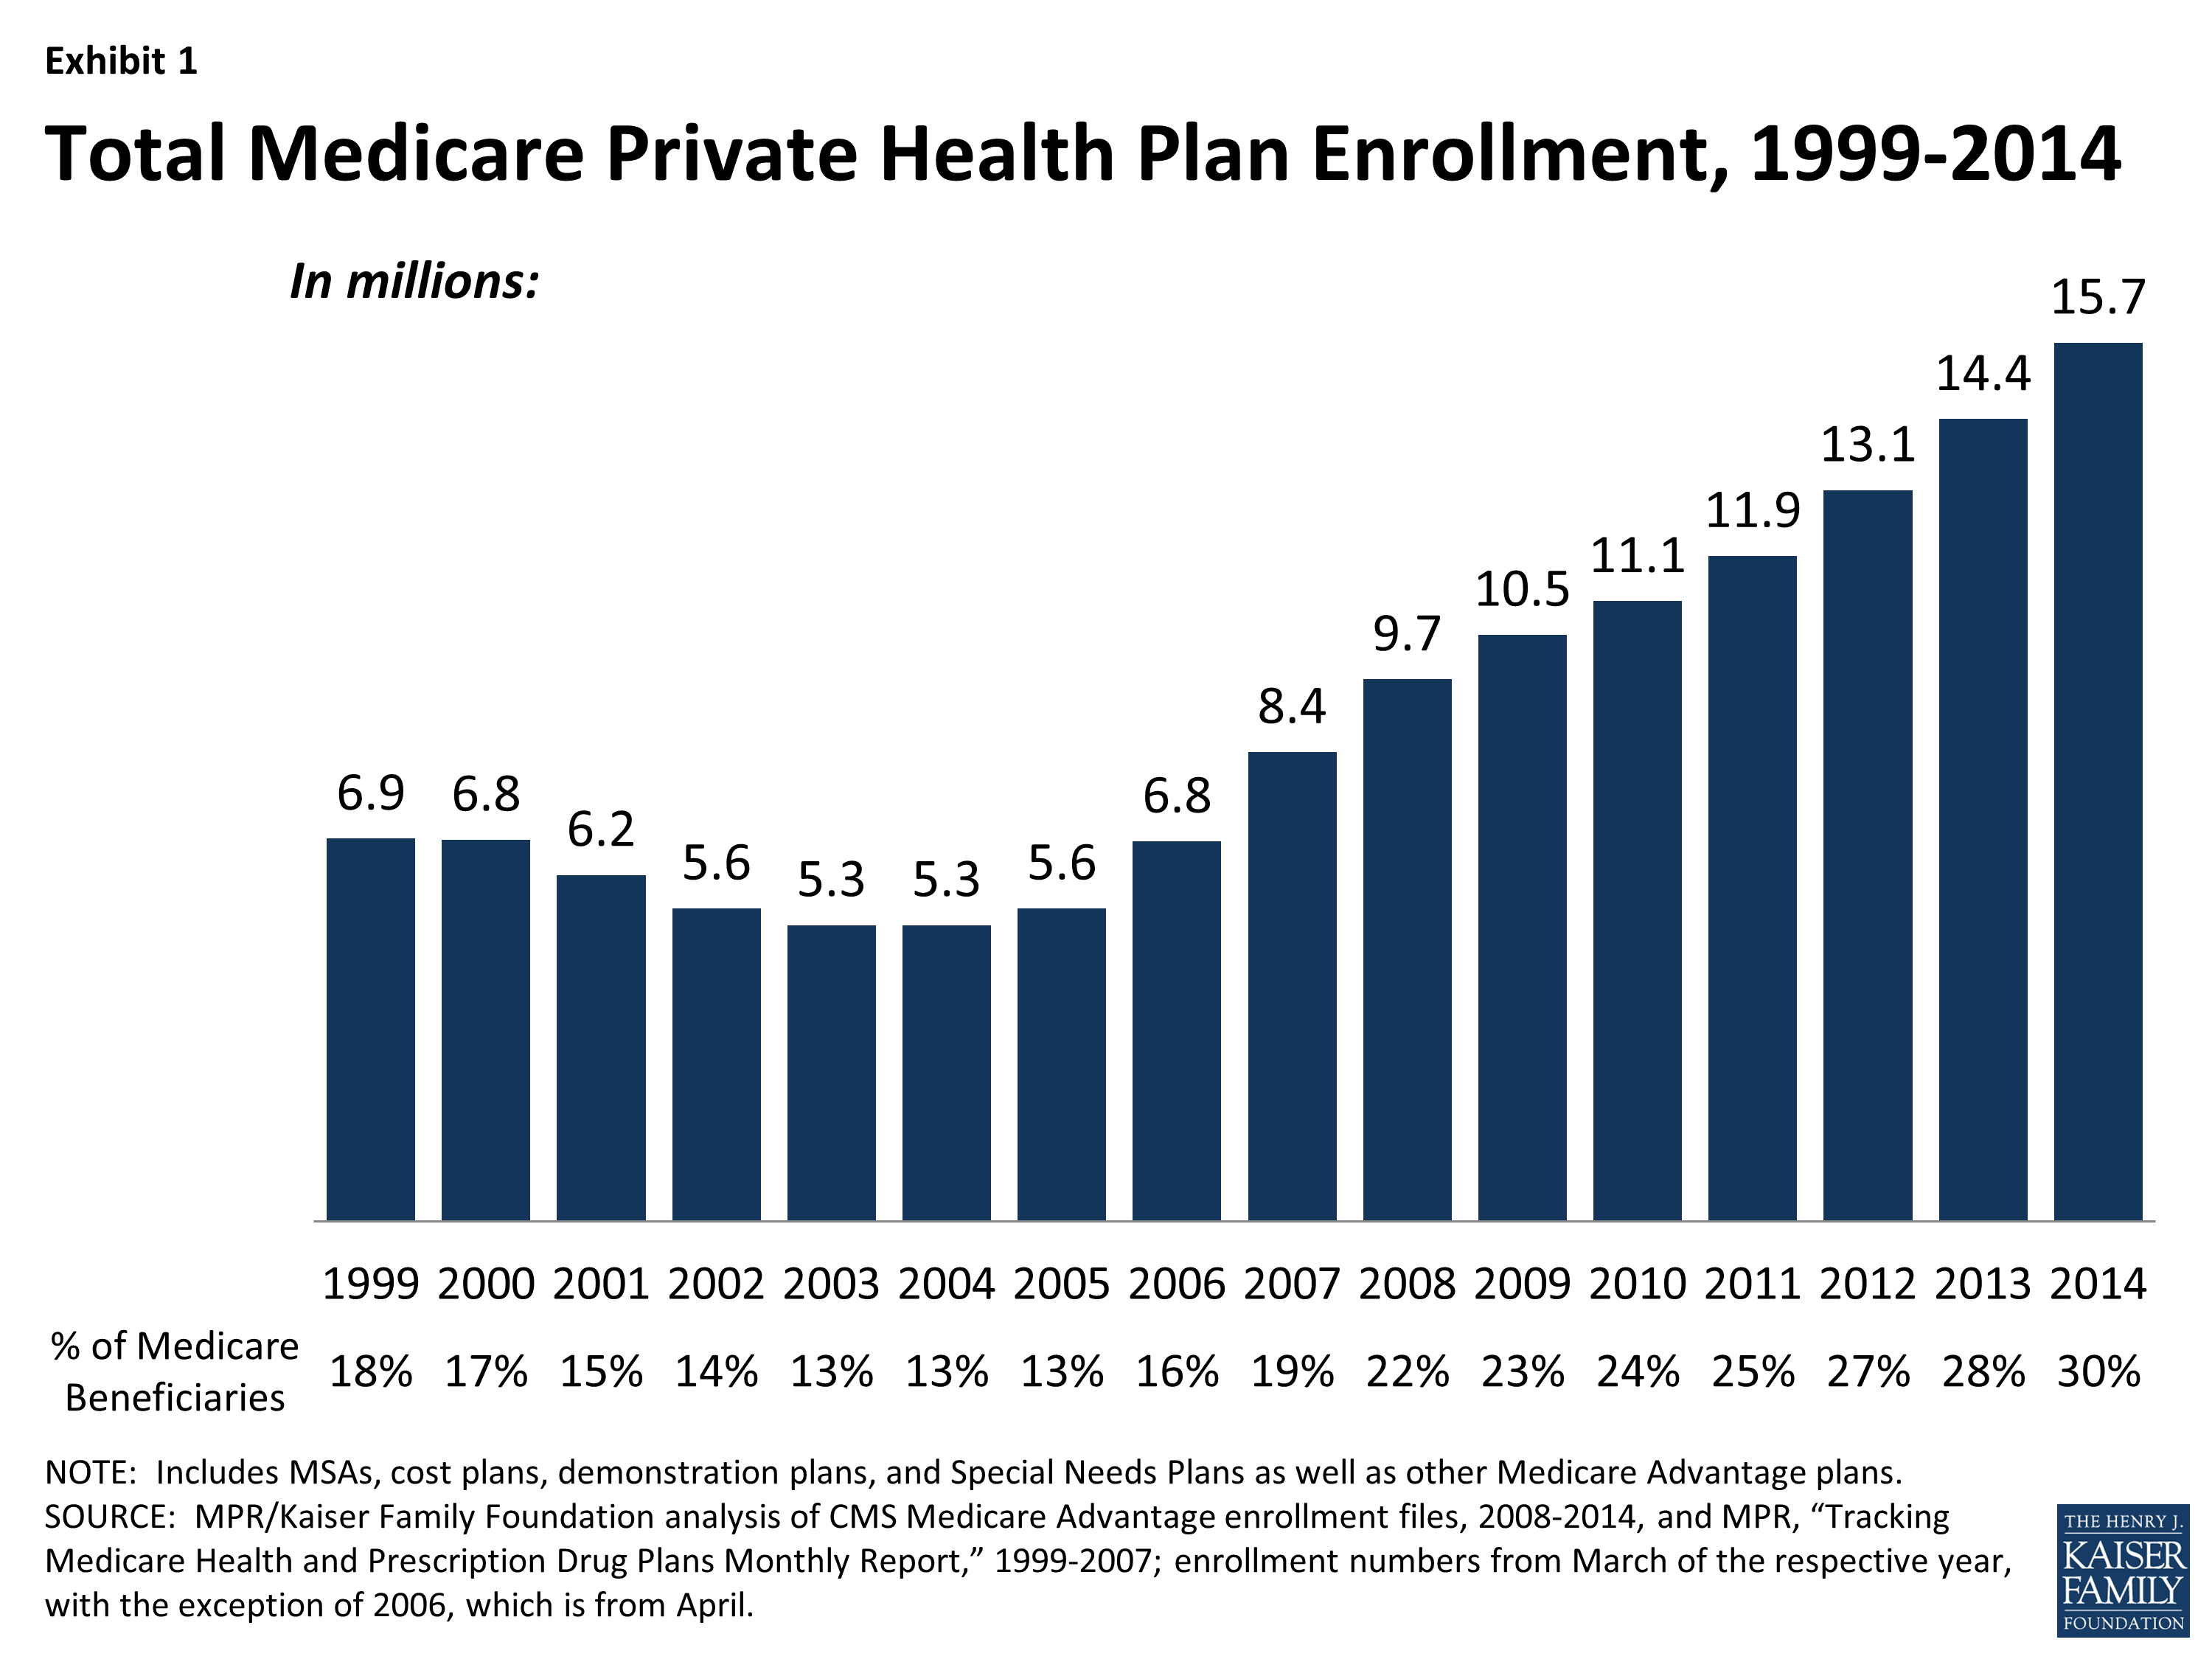
Exhibit 1: Total Medicare Private Health Plan Enrollment, 1999-2014
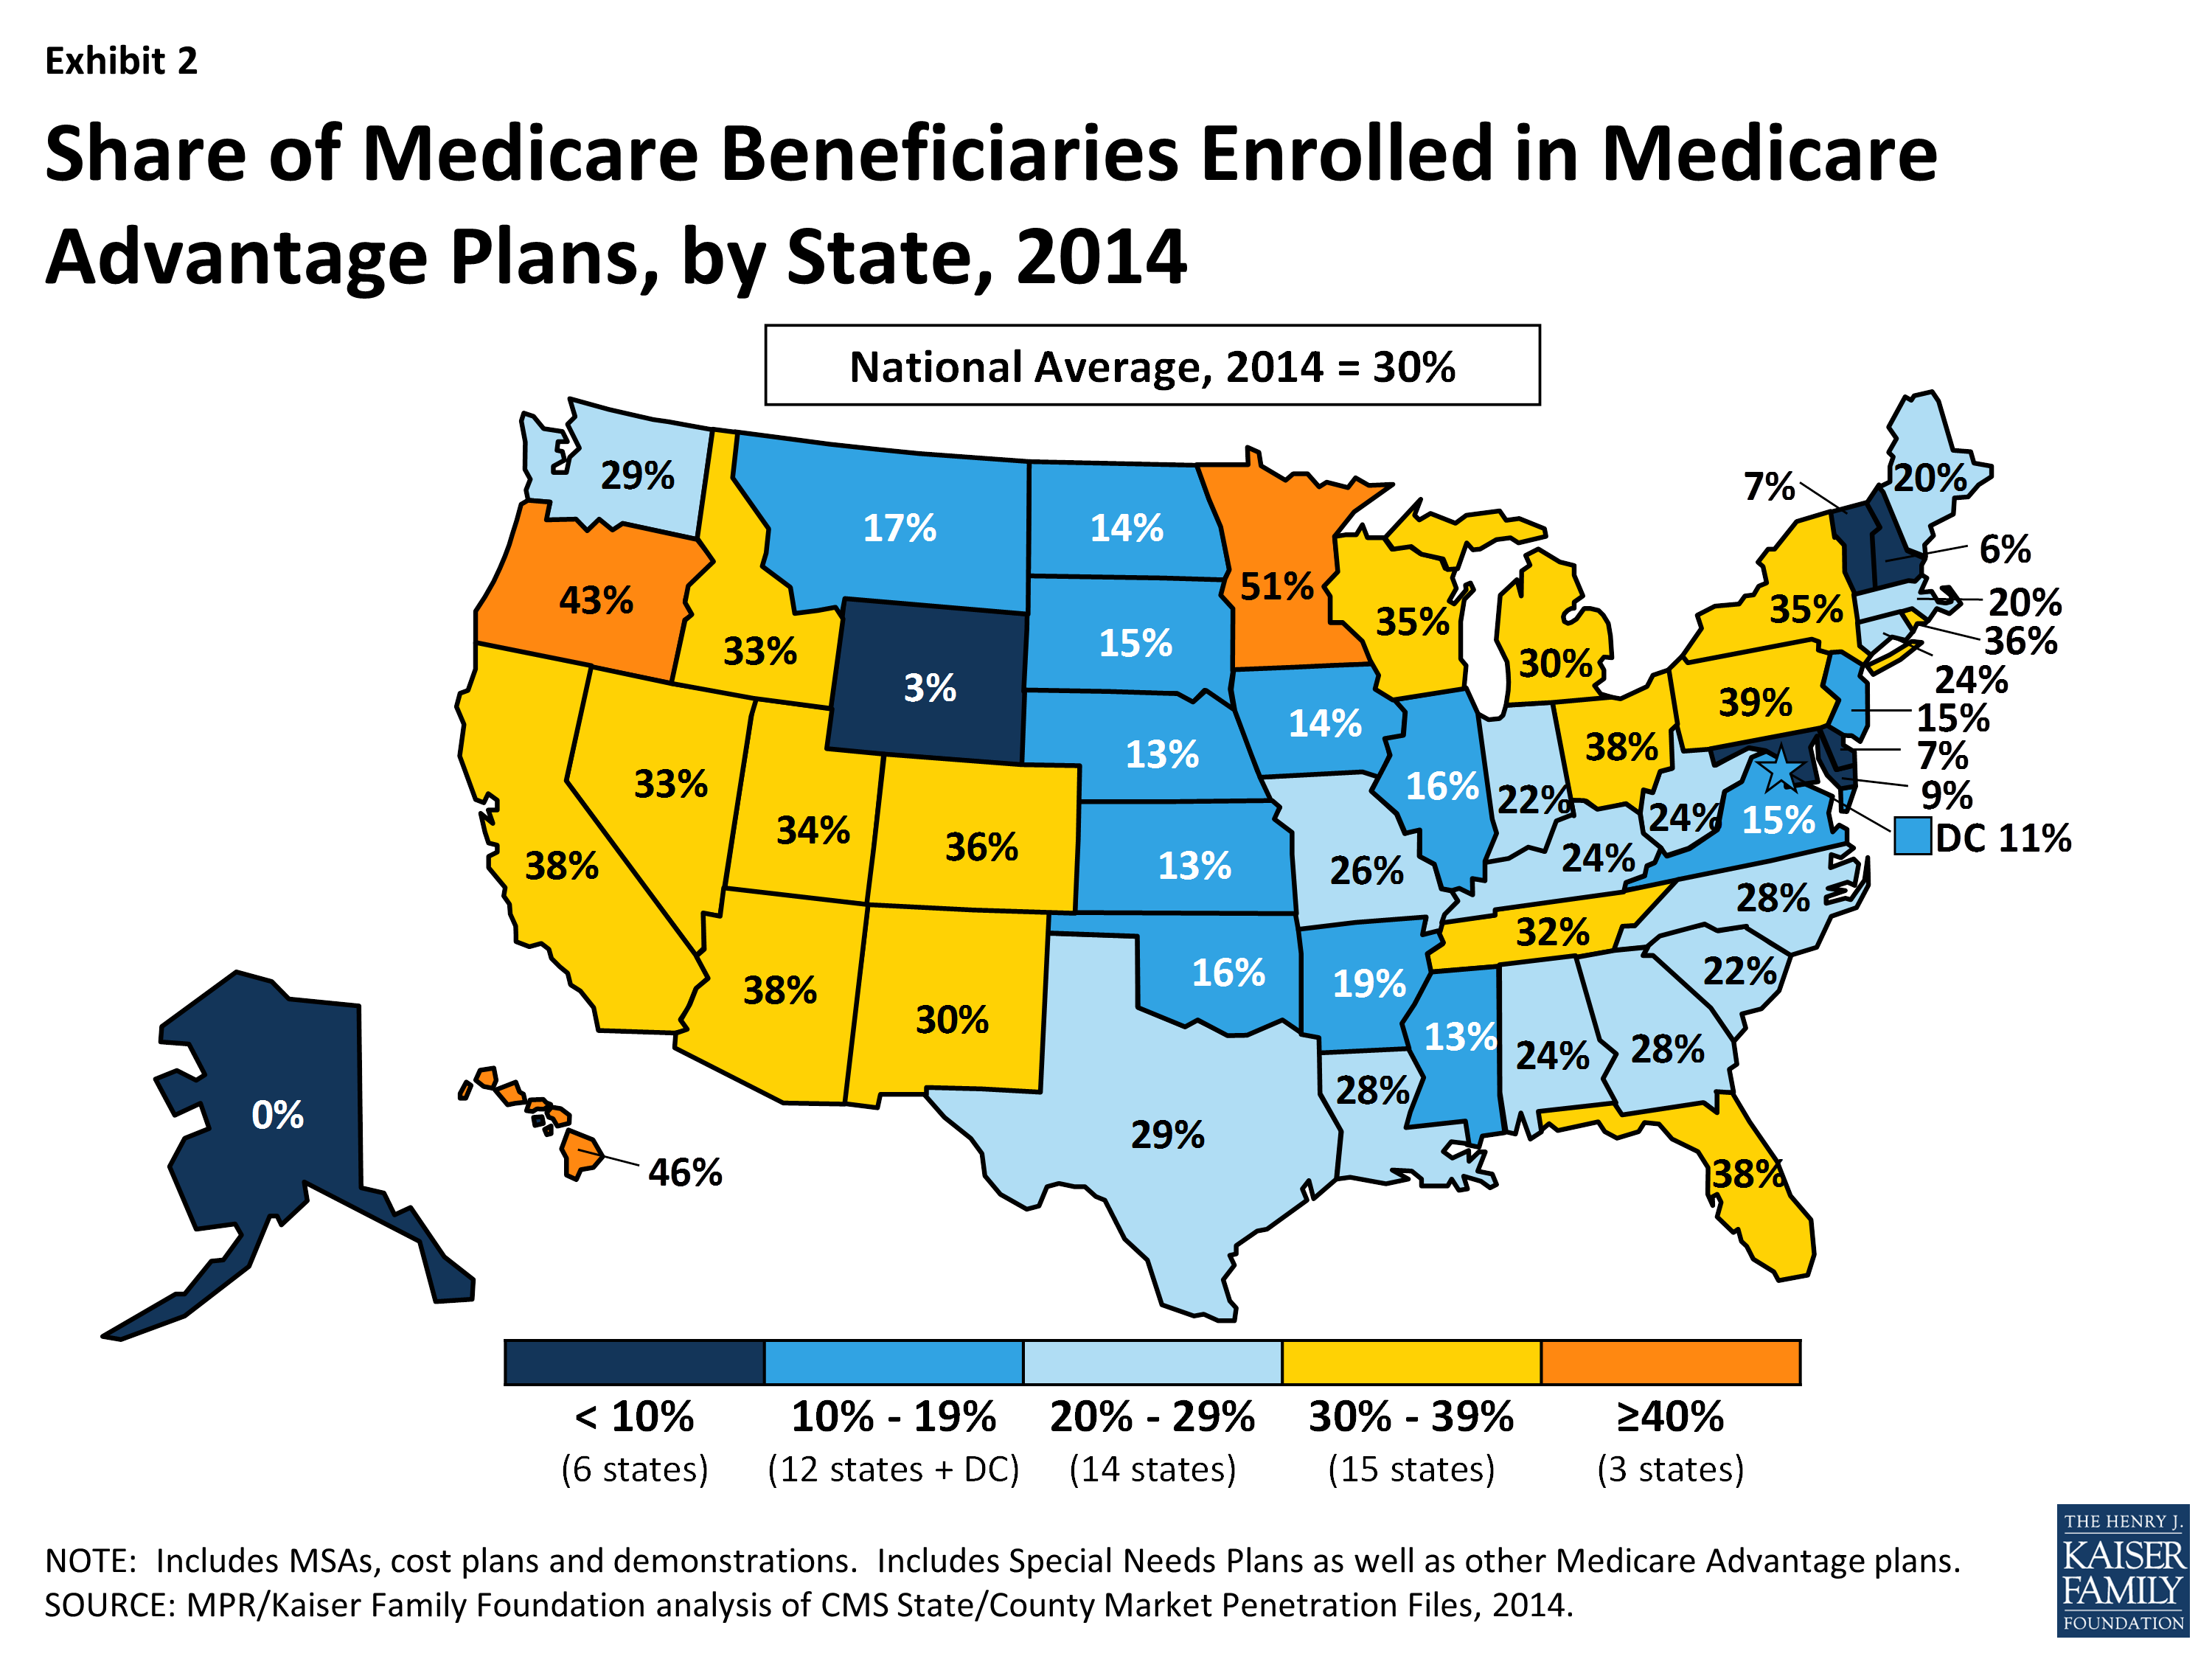
Exhibit 2: Share of Medicare Beneficiaries Enrolled in Medicare Advantage Plans, by State, 2014
Enrollment by State. Medicare Advantage enrollment continues to vary geographically (Table 1). In 2014, as in at least the prior two years, 6 states (AK, DE, MD, NH, VT and WY) had less than 10 percent of Medicare beneficiaries in Medicare Advantage plans (Exhibit 2). In contrast 18 states (versus 15 in 2013) have 30 percent or more of their beneficiaries enrolled in Medicare Advantage plans, including 3 (MN, OR, and HI) with 40 percent or more enrolled in Medicare Advantage plans. This variation reflects the urban origins of health maintenance organizations (HMOs) in Medicare Advantage and other factors, such as the history of managed care in the state and the prevalence of employer sponsored insurance for retirees.
Despite such variation, enrollment increased in virtually all states in 2014, with the exception of New Jersey where enrollment declined 2 percent. Among other states, 13 states experienced a growth in enrollment of 5 percent or less In 19 states, enrollment grew by 6-10 percent, in 9 states enrollment grew by 11-15 percent and in 7 states enrollment grew by 16 percent or more between 2013 and 2014. Very high rates of growth (such as 56 percent in Illinois and 45 percent in North Carolina) reflect the influence of the group market, and illustrate how a single change in coverage for an employment-based retiree group can move relatively large numbers of people within a state. Each of these states added over 100,000 group enrollees to Medicare Advantage between March 2013 and 2014. In most other states, enrollment in group plans had a far more modest effect on the growth in Medicare Advantage enrollment.
| Table 1. Medicare Advantage Enrollment and Penetration Rate, by State, 2013-2014 | ||||||
| State | 2013 Total Enrollment | 2014 Total Enrollment | Change in Total Enrollment, 2013-2014 | Percent Change in Enrollment, 2013-2014 | 2013 Penetration Rate | 2014 Penetration Rate |
| Total U.S. | 14,361,615 | 15,732,081 | 1,370,466 | 10% | 28% | 30% |
| Alabama | 203,951 | 220,640 | 16,689 | 8% | 22% | 24% |
| Alaska | N/A | N/A | N/A | N/A | N/A | N/A |
| Arizona | 384,851 | 401,626 | 16,775 | 4% | 38% | 38% |
| Arkansas | 98,322 | 107,713 | 9,391 | 10% | 17% | 19% |
| California | 1,937,350 | 2,061,617 | 124,267 | 6% | 37% | 38% |
| Colorado | 244,356 | 263,788 | 19,432 | 8% | 35% | 36% |
| Connecticut | 137,253 | 146,372 | 9,119 | 7% | 23% | 24% |
| Delaware | 10,941 | 12,623 | 1,682 | 15% | 7% | 7% |
| District of Columbia | 8,654 | 9,714 | 1,060 | 12% | 10% | 11% |
| Florida | 1,318,740 | 1,438,325 | 119,585 | 9% | 36% | 38% |
| Georgia | 350,142 | 404,628 | 54,486 | 16% | 25% | 28% |
| Hawaii | 103,346 | 108,143 | 4,797 | 5% | 46% | 46% |
| Idaho | 74,871 | 81,440 | 6,569 | 9% | 30% | 33% |
| Illinois | 209,200 | 326,678 | 117,478 | 56% | 11% | 16% |
| Indiana | 224,875 | 244,970 | 20,095 | 9% | 21% | 22% |
| Iowa | 74,520 | 77,032 | 2,512 | 3% | 14% | 14% |
| Kansas | 54,329 | 59,018 | 4,689 | 9% | 12% | 13% |
| Kentucky | 178,945 | 198,052 | 19,107 | 11% | 22% | 24% |
| Louisiana | 193,638 | 213,280 | 19,642 | 10% | 26% | 28% |
| Maine | 49,347 | 58,234 | 8,887 | 18% | 17% | 20% |
| Maryland | 73,239 | 76,464 | 3,225 | 4% | 8% | 9% |
| Massachusetts | 209,147 | 229,400 | 20,253 | 10% | 18% | 20% |
| Michigan | 478,923 | 547,372 | 68,449 | 14% | 27% | 30% |
| Minnesota | 415,638 | 448,301 | 32,663 | 8% | 49% | 51% |
| Mississippi | 64,000 | 69,962 | 5,962 | 9% | 12% | 13% |
| Missouri | 257,164 | 285,066 | 27,902 | 11% | 24% | 26% |
| Montana | 27,229 | 31,125 | 3,896 | 14% | 15% | 17% |
| Nebraska | 33,228 | 33,507 | 279 | 1% | 12% | 13% |
| Nevada | 126,441 | 135,599 | 9,158 | 7% | 32% | 33% |
| New Hampshire | 12,554 | 15,905 | 3,351 | 27% | 5% | 6% |
| New Jersey | 223,161 | 219,494 | -3,667 | -2% | 16% | 15% |
| New Mexico | 98,198 | 107,064 | 8,866 | 9% | 29% | 30% |
| New York | 1,062,329 | 1,151,620 | 89,291 | 8% | 33% | 35% |
| North Carolina | 328,020 | 475,432 | 147,412 | 45% | 20% | 28% |
| North Dakota | 13,716 | 15,202 | 1,486 | 11% | 12% | 14% |
| Ohio | 755,580 | 794,226 | 38,646 | 5% | 37% | 38% |
| Oklahoma | 102,224 | 106,706 | 4,482 | 4% | 16% | 16% |
| Oregon | 286,306 | 305,794 | 19,488 | 7% | 42% | 43% |
| Pennsylvania | 939,496 | 971,144 | 31,648 | 3% | 39% | 39% |
| Rhode Island | 68,306 | 70,627 | 2,321 | 3% | 35% | 36% |
| South Carolina | 167,292 | 193,641 | 26,349 | 16% | 20% | 22% |
| South Dakota | 18,781 | 22,242 | 3,461 | 18% | 13% | 15% |
| Tennessee | 338,124 | 376,577 | 38,453 | 11% | 29% | 32% |
| Texas | 889,551 | 990,399 | 100,848 | 11% | 27% | 29% |
| Utah | 101,751 | 107,139 | 5,388 | 5% | 33% | 34% |
| Vermont | 8,199 | 8,368 | 169 | 2% | 7% | 7% |
| Virginia | 181,455 | 196,993 | 15,538 | 9% | 15% | 15% |
| Washington | 305,289 | 329,087 | 23,798 | 8% | 28% | 29% |
| West Virginia | 83,922 | 96,604 | 12,682 | 15% | 21% | 24% |
| Wisconsin | 324,912 | 352,842 | 27,930 | 9% | 33% | 35% |
| Wyoming | 1,940 | 1,997 | 57 | 3% | 3% | 3% |
| NOTE: Includes employer-sponsored plans, special needs plans, and other private plans. N/A indicates too few (less than 50) enrollees to report. Total U.S. includes Puerto Rico. SOURCE: MPR/Kaiser Family Foundation analysis of CMS Medicare Advantage enrollment and Landscape files, 2013-2014. |
||||||
Trends in Enrollment by Plan Type
Nationwide Trends. HMOs, which were the original form of Medicare Advantage plan, account for almost two-thirds (64 percent) of Medicare Advantage enrollment in 2014, with 23 percent in local PPOs, 8 percent in regional PPOs, 2 percent in Private fee-for-service (PFFS) plans, and 3 percent in other types of plans (Exhibit 3). While the HMO market share has remained relatively stable in recent years, PPOs (especially local PPOs) have replaced the PFFS product as the dominant alternative plan attracting enrollees.

Exhibit 3: Distribution of Enrollment in Medicare Advantage Plans, by Plan Type, 2014
- HMOs. In 2014, 10.1 million Medicare beneficiaries were enrolled in HMOs, up from 9.3 million in 2013, an 8.6 percent increase (Exhibit 4). Nearly two-thirds of all Medicare Advantage enrollees are in an HMO in 2014 (64%), similar to each year since 2007.
- PPOs. In 2014, nearly one-third (31%) of Medicare Advantage enrollees are in either a local or regional PPO, with significantly higher enrollment in local than regional PPOs. Local PPOs have been authorized since the Balanced Budget Act of 1997 and regional PPOs have been authorized since 2006 under the MMA of 2003. However, enrollment in PPOs of any form has been relatively limited until recent years. Between 2007 and 2014, total PPO enrollment grew from about 500,000 to 4.9 million. A key difference between an HMO and a PPO is that the latter provides enrollees with the flexibility to see providers outside of the plan’s provider network, although cost sharing associated with out-of-network providers typically is substantially higher than for providers in a plan’s network.
- Local PPOs. Roughly three of four Medicare Advantage PPO enrollees are in a local PPO in 2014 (3.7 of 4.9 million). Local PPOs, like HMOs, are open to beneficiaries who live in specified counties. Since 2007, enrollment among Medicare beneficiaries in local PPOs has increased from 0.4 million to 3.7 million enrollees, up from 3.1 million in 2013.
- Regional PPOs. In contrast to the relatively rapid growth of local PPO enrollment, enrollment in regional PPOs has increased more slowly. In 2014, 1.2 million beneficiaries were enrolled in regional PPOs, up from 1.0 million in 2013 and 0.8 million in 2010. Regional PPOs are required to serve areas defined by one or more states with a uniform benefit package across the service area. The MMA of 2003 authorized the introduction of Regional PPOs to encourage more plans to serve rural areas Thus far, Regional PPOs have had limited traction nationwide, although they account for a not insignificant share of the market in a small number of states (Table A1).1
- PFFS. Enrollment in PFFS plans continued to decline in 2014, with only around 300,000 enrollees. This is one-quarter lower than in 2013, and considerably lower than the high of 2.2 million enrolled in 2009. The decline in enrollment in PFFS plans reflects a deliberate policy change included in the Medicare Improvements for Patients and Providers Act (MIPPA) of 2008 that required PFFS plans (with some county-specific exceptions) to have networks of providers by 2011. Such provider networks, legislators believed, were critical to creating the value sought from the Medicare Advantage program. The MIPPA requirements led to a dramatic decline in the number of PFFS plans offered, some of which were offered by companies that only offered PFFS plans and may not have thought that it was in their business interest to form networks.2 PFFS plans were the primary alternative to HMOs from 2007 through 2009 but their role in the Medicare Advantage market has now been more than eclipsed by that of PPOs.3
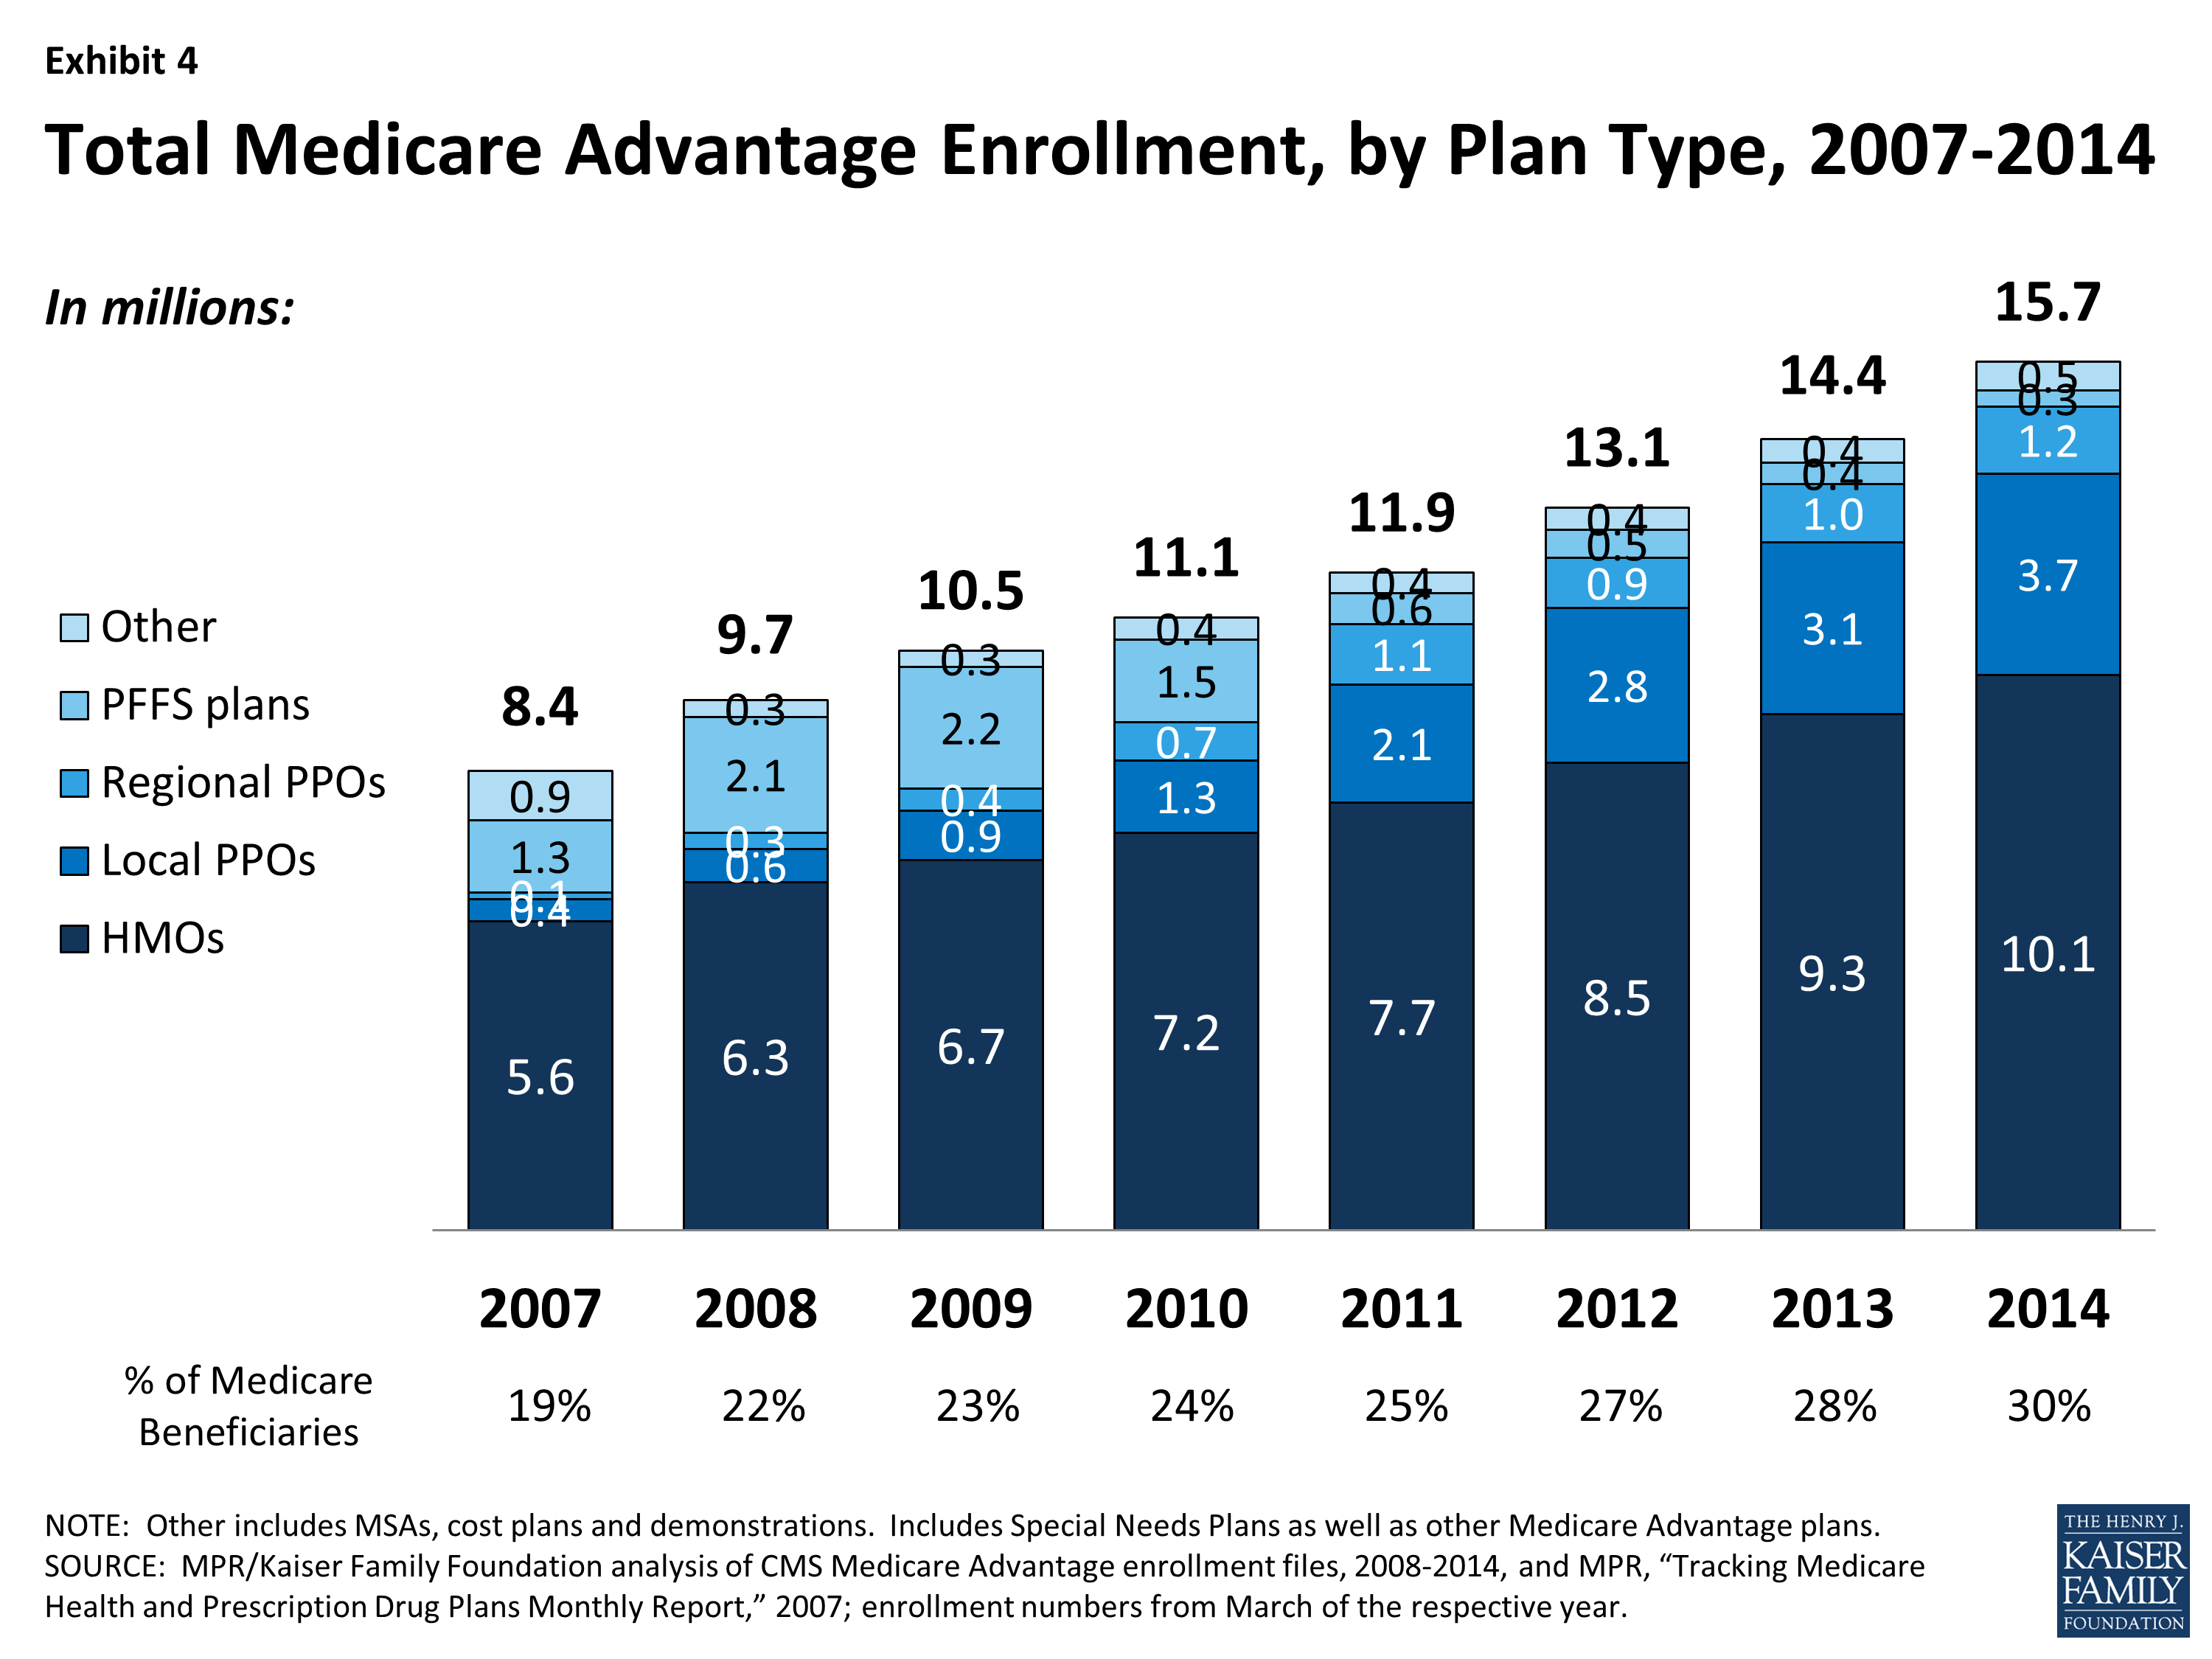
Exhibit 4: Total Medicare Advantage Enrollment, by Plan Type, 2007-2014
Geographic Variation in Trends by Plan Type. The distribution of Medicare Advantage enrollees, by plan type, varies across states (Table A1). HMOs account for 90 percent or more of Medicare Advantage enrollment in three states (AZ, CA, and NV), but less than one-third of total enrollment in 14 states (AK, GA, IN, KY, MN, MT, ND, NH, SC, SD, VT, WV, and WY) plus the District of Columbia. In states where HMOs are less dominant, local PPOs are most common, but in some states, beneficiaries tend to gravitate toward regional PPOs (SC, SD, VT), PFFS plans (WY,ND, SD) or cost plans (MN, DC). In Florida, most enrollees are in HMOs, but the state also has the largest number of regional PPO enrollees in the nation (almost 340,000). In Minnesota, more than 60 percent of private plan enrollees are in what is called a cost plan; Minnesota’s cost plan enrollees accounts for 58 percent of all cost plan enrollees nationwide. Policies that affect specific plan types will therefore have a differential effect from market to market, and across states.
Specialized Sectors of the Market
Group Enrollment. Most Medicare beneficiaries who enroll in Medicare Advantage plans do so as individuals, but a small share is enrolled through groups. The group market consists largely of employment-sponsored Medicare Advantage plans for retirees. Employers that offer health benefits to Medicare-eligible retirees have the option to contract with Medicare Advantage plans to provide supplemental benefits. Under these arrangements, the employer contracts with the Medicare Advantage insurer to provide its retirees supplemental benefits, and Medicare pays the plan a fixed payment per enrollee to provide Medicare benefits , which is supplemented by an employer plan premium for the additional benefits.1
In 2014, 3.0 million of the 15.7 million Medicare Advantage enrollees were in a group plan (Exhibit 5 and Table A2). Of this total, 59 percent were enrolled in local PPOs and 37 percent were enrolled in HMOs. In contrast to the individual market, PPOs account for a larger share of the group market than HMOs. The share of Medicare Advantage enrollees in group plans has never been very large, but the numbers are growing, consistent with trends in the overall Medicare Advantage market. In the recent past, group enrollment in Medicare Advantage has grown proportionately to the growth in the market overall; between 2008 and 2013, the number of group enrollees grew from 1.7 million to 2.5 million, but the relative share in the group market changed little over the time period (17.5% in 2008 versus 17.3% % in 2013). In the past year, group enrollment increased by 17 percent (0.4 million additional enrollees), rising at a faster rate than the 7.9 percent growth rate in the individual market (0.9million additional enrollees). Today, group enrollees account for 19 percent of the total Medicare Advantage population.
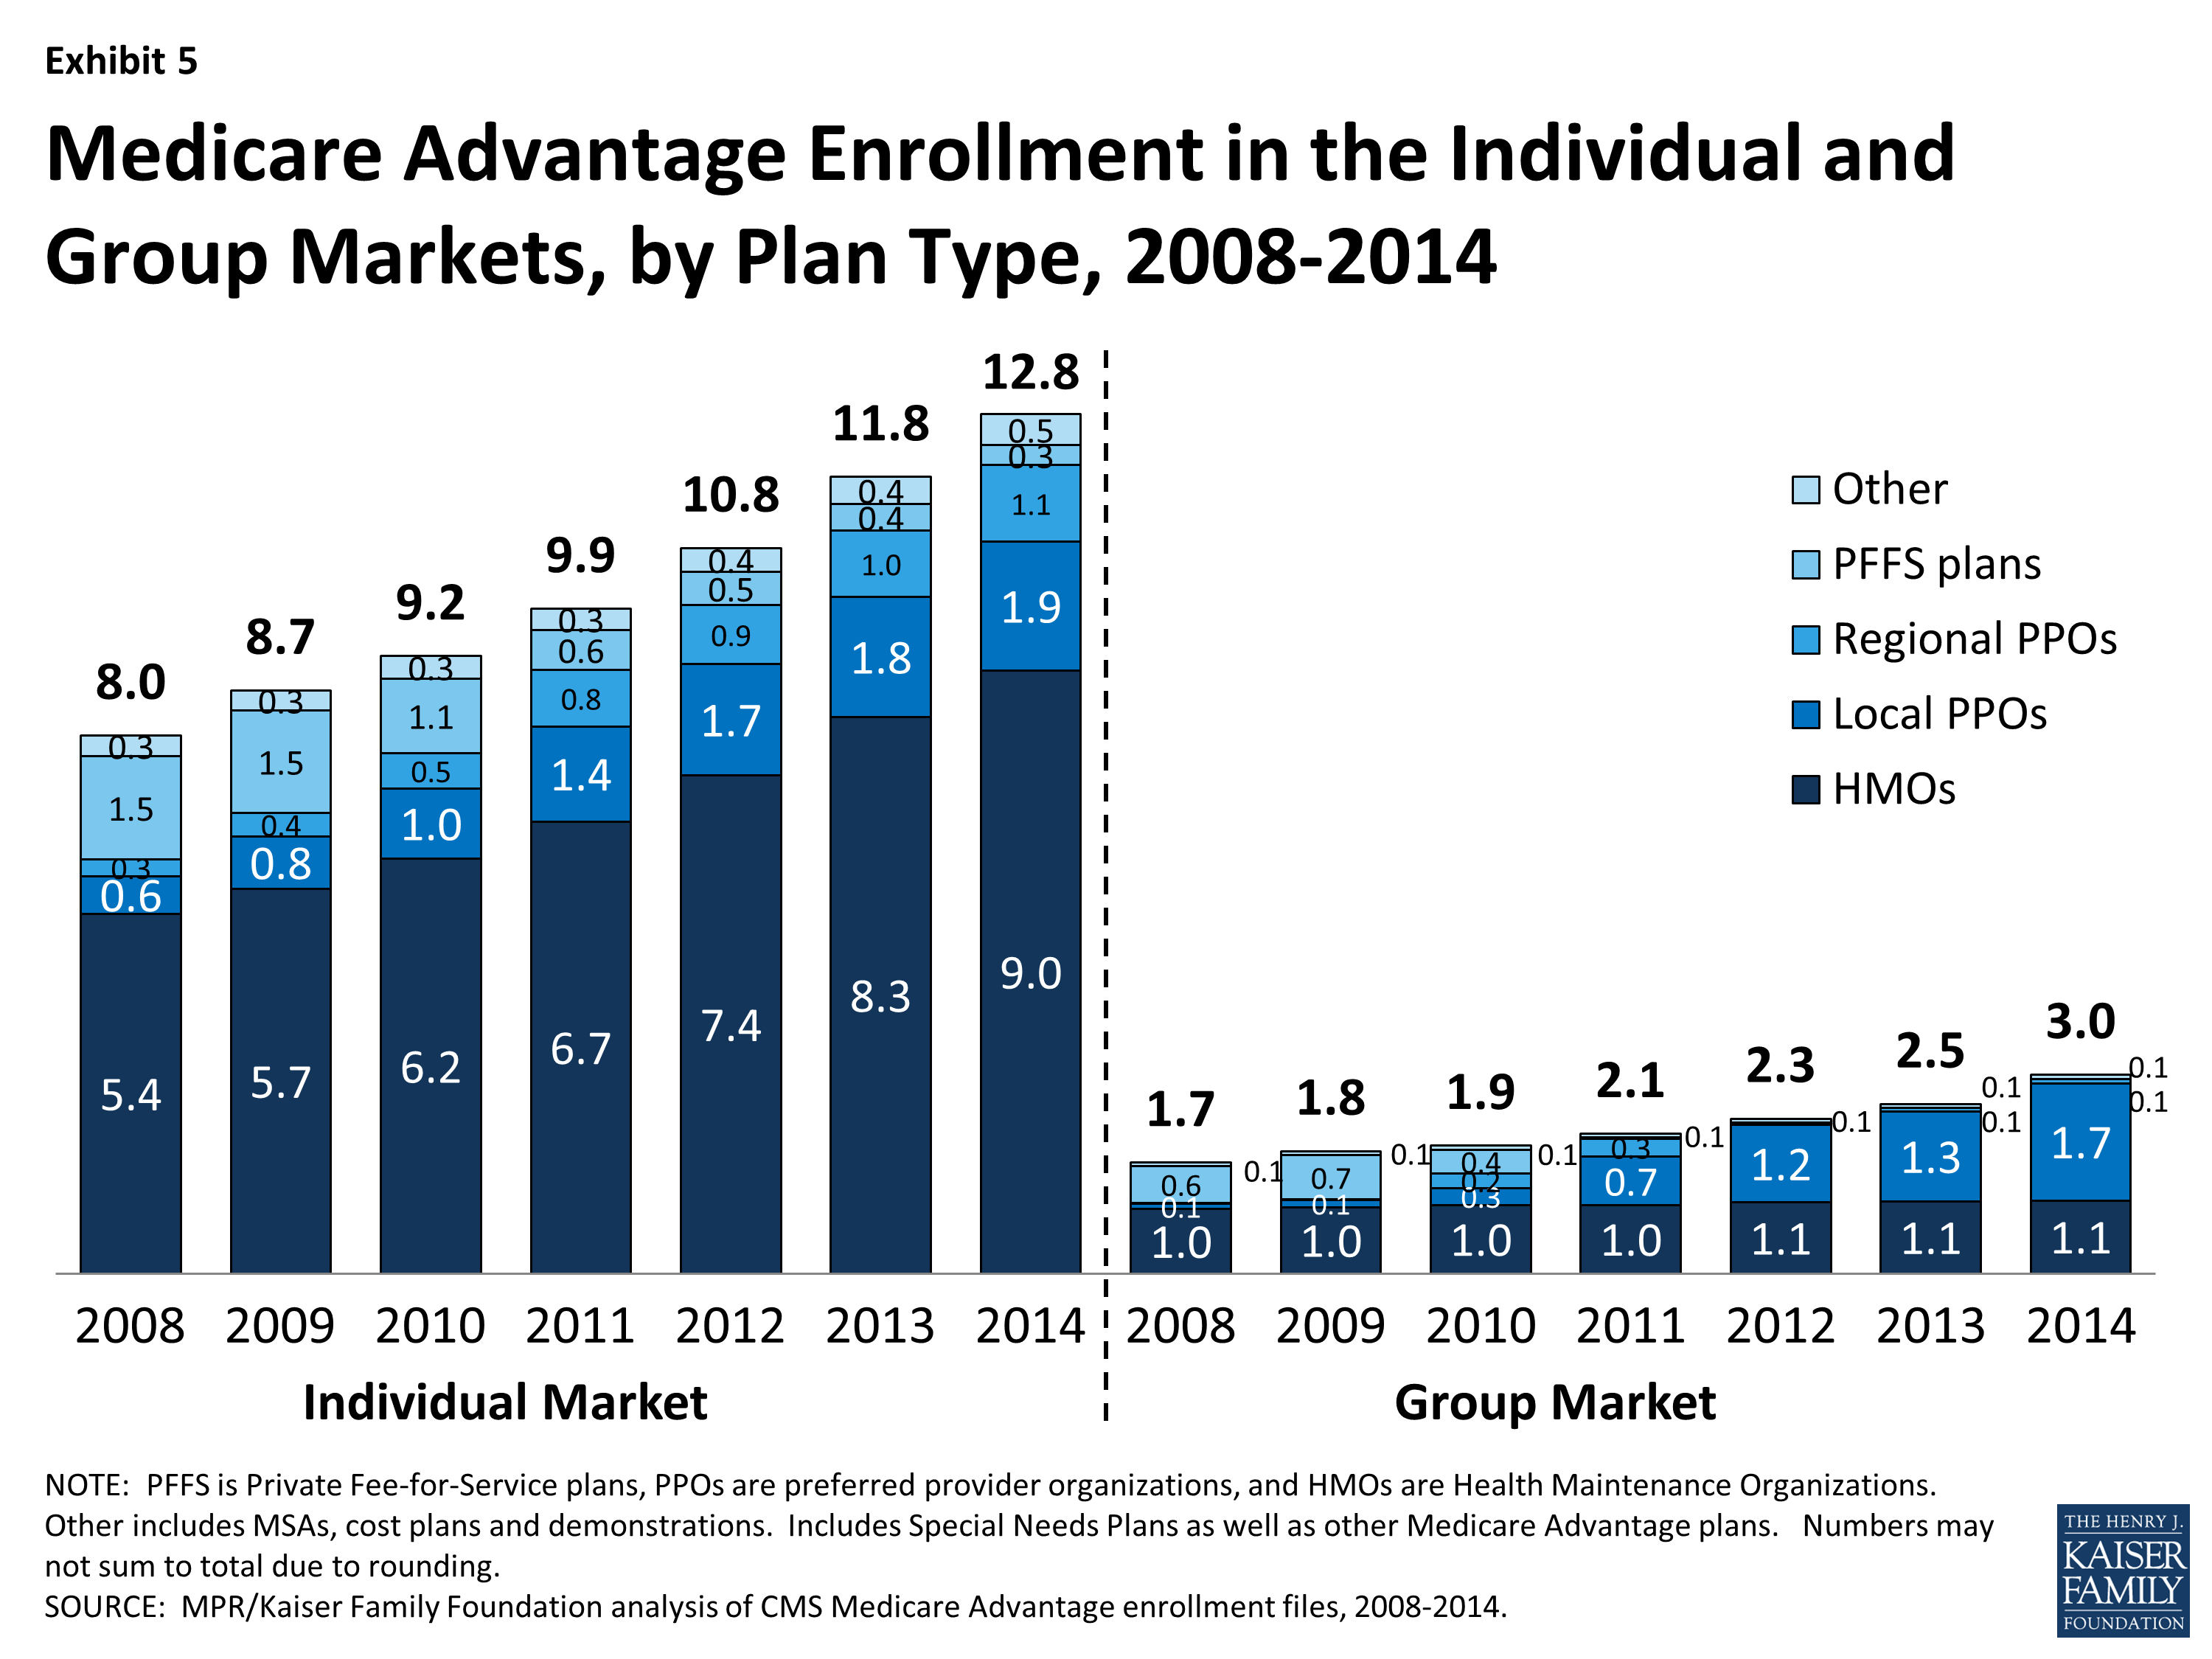
Exhibit 5: Medicare Advantage Enrollment in the Individual and Group Markets, by Plan Type, 2008-2014
According to the Medicare Payment Advisory Commission (MedPAC), group Medicare Advantage plans typically receive higher Medicare payments and have higher bids, on average, than plans offered in the individual Medicare Advantage market.2 Their analysis shows that the average payment to group Medicare Advantage plans was 109 percent of traditional Medicare spending whereas the average payment to all Medicare Advantage plans was 106 percent of traditional Medicare spending. MedPAC attributes the differences to incentives for firms in the group market to maximize Medicare revenue to offset employer costs by bidding at the benchmark, whereas firms in the individual Medicare Advantage market have an incentive to bid below the benchmark, in order to receive a rebate (a percent of the difference between the bid and the benchmark) with which they can provide extra benefits to individual plan enrollees. MedPAC has recommended changes in the way payments are made for group plans so that there is greater parity with the individual market.
The influence of employer groups on Medicare Advantage enrollment differs across the country depending on the prevalence of employers offering retiree health benefits, including public and unionized industries.3 States where a substantially larger share of Medicare Advantage enrollees are in group plans include West Virginia (57%), Michigan (49%), Kentucky (42%), Illinois (40%), Ohio (38%), District of Columbia (33%), and New Hampshire (33%). In other states, group enrollment tends to account for less than one-third of total Medicare Advantage enrollment.
Special Needs Plans. Special Needs Plans (SNPs) restrict enrollment to specific types of beneficiaries with significant or relatively specialized care needs, including beneficiaries: (1) dually eligible for Medicare and Medicaid (D-SNPs); (2) requiring a nursing home or institutional level of care (I-SNPs); or (3) with severe chronic or disabling conditions (C-SNPs.)
The most SNP enrollees are in HMOs (87%), with 10 percent enrolled regional PPOs and 3 percent in local PPOs. As a share of the total Medicare Advantage population (Exhibit 6 and Table A3), enrollment in SNPs is relatively low. The 1.9 million enrollees in such plans in 2014 account for about 12 percent of total Medicare Advantage enrollment.
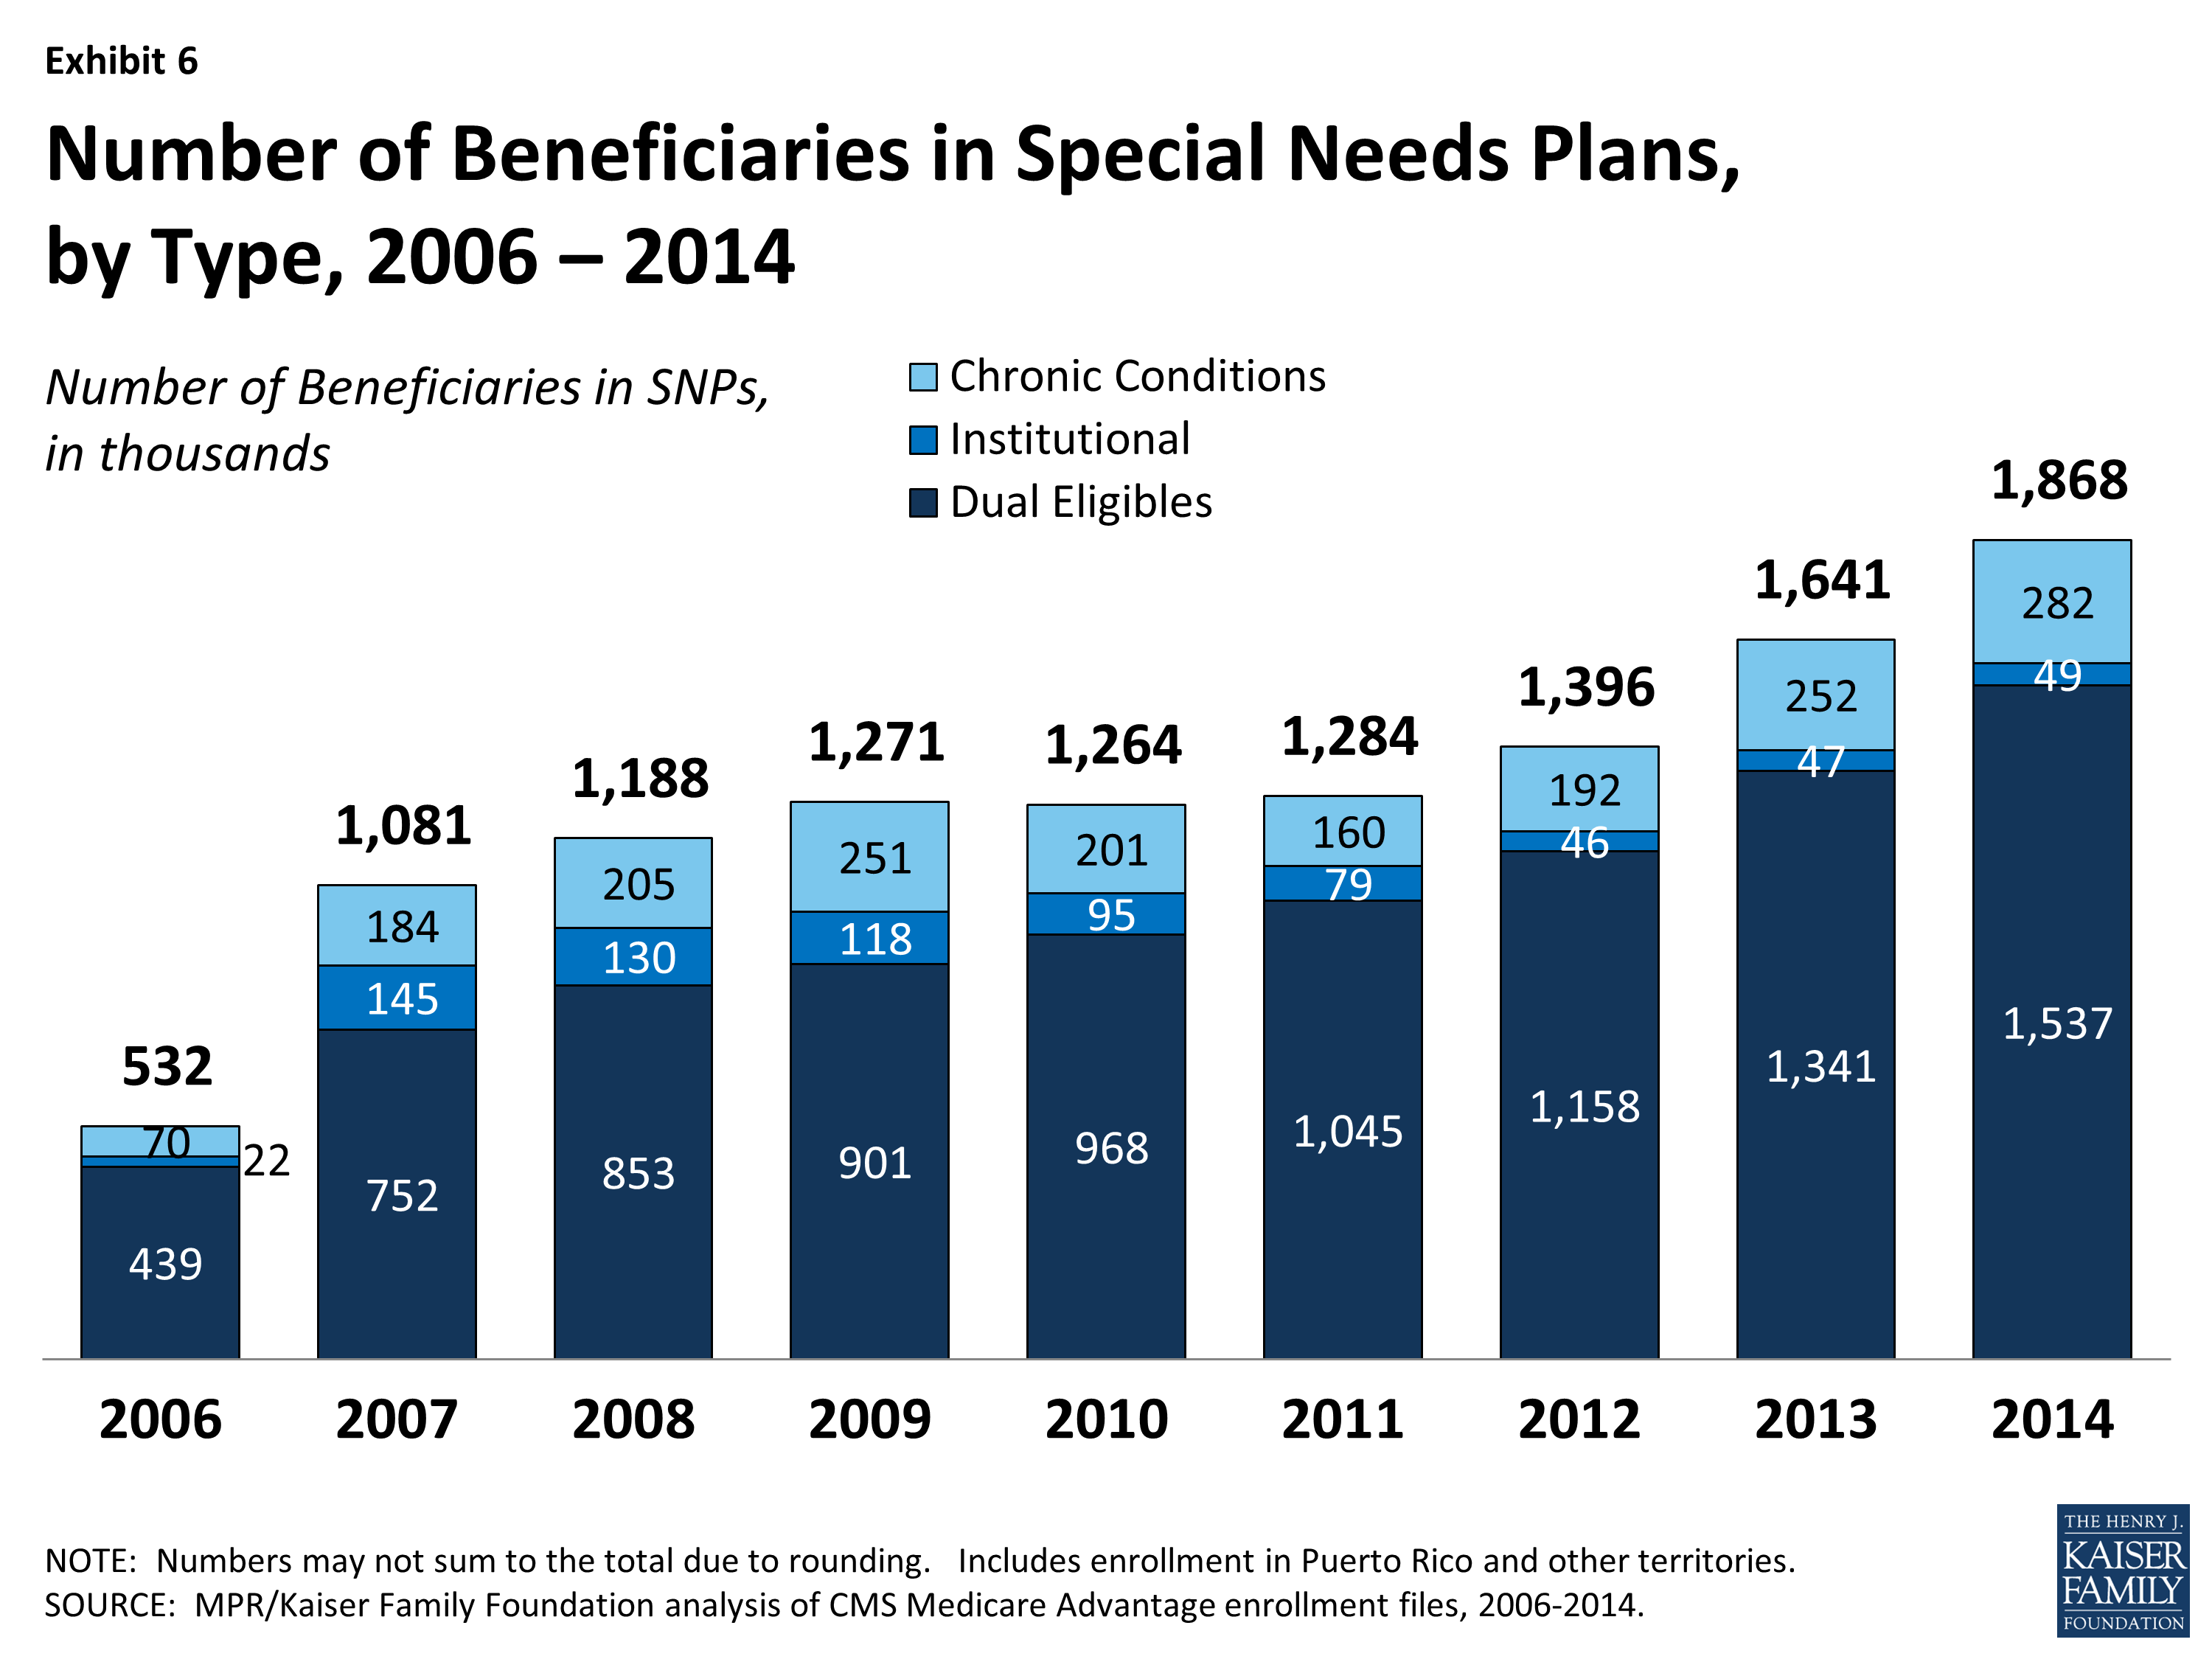
Exhibit 6: Number of Beneficiaries in Special Needs Plans, by Type, 2006 – 2014
Most SNP enrollees (1.5 million or 82%) are in plans serving those dually eligible for Medicare and Medicaid. Such enrollment varies greatly by state, and enrollment of dually eligible beneficiaries in SNPs is particularly prevalent in four states: Hawaii (62%), Arizona (44%), Utah (35%), and Minnesota (30%).
Separately, several states (including CA, MA, MN, NY, IL, OH, SC, VA, and WA) are undertaking demonstrations with CMS to improve the financial alignment of Medicare and Medicaid for dually eligible beneficiaries. In many states, SNPs may continue to operate separately from the demonstration, and dually eligible beneficiaries enrolled in these SNPs can remain in them. It is not clear how the demonstration will affect the growth in D-SNP enrollment over time in these states.
Premiums
Medicare Advantage enrollees are responsible for paying the Part B premium, in addition to any premium charged by the plan. The Medicare Advantage premium paid by enrollees reflects the difference between the plan’s costs of providing Part A and B benefits and any supplemental benefits offered, and the federal payment to the plan for the benefits. Plans receive a percentage of the difference between their bid and the maximum federal payment (known as a rebate) and are required to use this amount to offset any extra benefits not offered by traditional Medicare, any reduced cost sharing, or the Part B premium. If Part D is part of the plan, as it is for most enrollees, the plan may also use the rebate to reduce the Part D premium.
In this brief, we analyze premiums for Medicare Advantage plans that offer prescription drug benefits (MA-PDs) because the vast majority (88%) of Medicare Advantage enrollees in individual plans is in an MA-PD.
Average Premium Trends. The average enrollee in an MA-PD paid a monthly premium of about $35 in 2014, reflecting little change since 2012, and a reduction in average premiums since 2011 ($38) and 2010 ($43) (Exhibit 7). It is important to note, however, that the actual premium an enrollee pays varies by plan type and locale, as well as by decisions and preferences of enrollees, such as whether they are willing to pay more for a broader network or more generous benefits. Average premiums and trends in premiums paid by enrollees vary across plan types. Enrollee premiums in 2014 averaged $27 per month for HMOs, $32 per month for regional PPOs, $59 per month for local PPOs, and $63 per month for PFFS plans. Compared to 2013, the average HMO premium was unchanged whereas average premiums for local PPOs, regional PPOs, and PFFS plans increased by an average by $1, $3, and $11 per month, respectively. In 2014, enrollees are generally paying lower premiums in 2014 than in 2010, mainly due to the reduction in average HMO and local PPO premiums over that period and most enrollees are in HMOs and local PPOs in 2014.
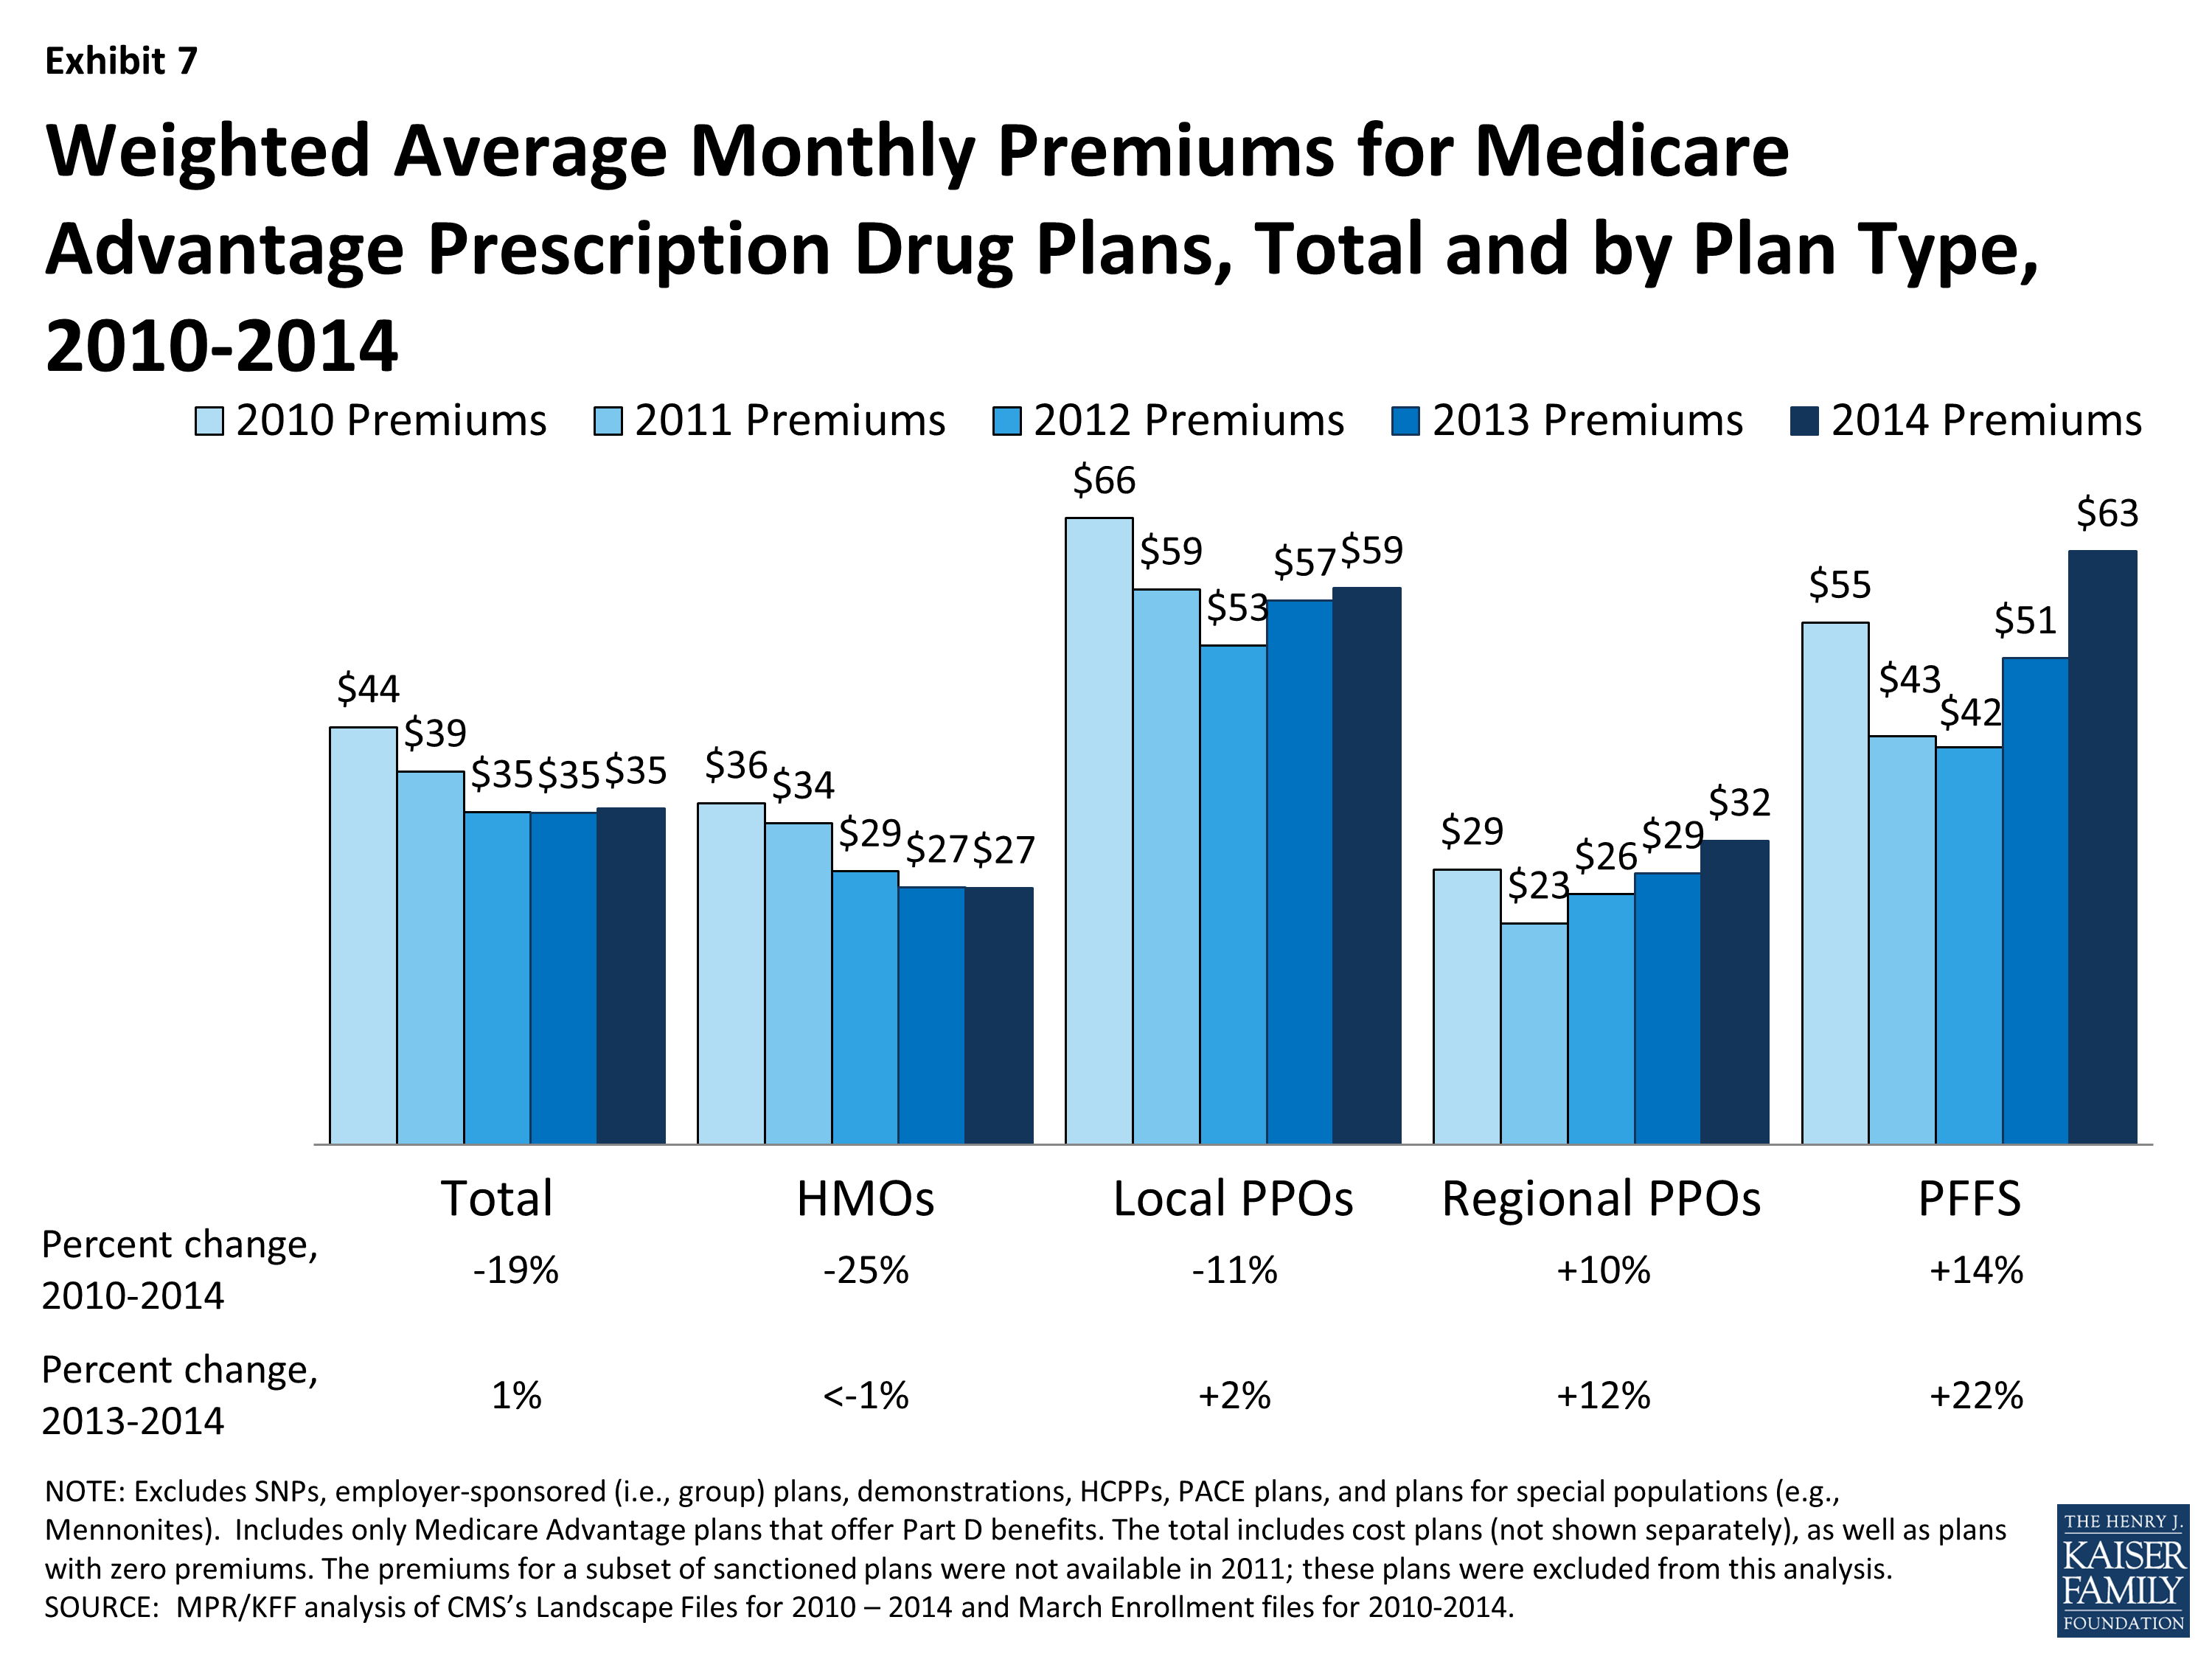
Exhibit 7: Weighted Average Monthly Premiums for Medicare Advantage Prescription Drug Plans, Total and by Plan Type, 2010-2014
In the fall of 2013, we calculated that beneficiaries who were enrolled in Medicare Advantage plans at that time would pay a premium of $39 per month in 2014, compared to $35 per month in 2013, which assumed they remained in the same plan.1 Among Medicare Advantage enrollees in 2014, the average premium actually paid by enrollees ($35 per month) is similar to that in 2014. The difference in estimates reflects both changes in beneficiaries enrolled in Medicare Advantage from 2013 to 2014 and shifts by enrollees among plans and plan types.
Zero Premium Plans. As in prior years, most Medicare beneficiaries (84%) had a choice of at least one MA-PD that charged no additional premium for coverage, other than the monthly Part B premium, also known as “zero premium plans”. Many plans view such products as good ways of attracting enrollees into Medicare Advantage since they often provide more benefits than traditional Medicare and “one stop shopping” that avoids separate decisions about Part D and supplemental coverage through various Medigap options.
In 2014, 56 percent of all Medicare Advantage plan enrollees were in zero premium MA-PDs (Exhibit 8). A larger than average share of enrollees in HMOs were enrolled in zero-premium plans (66%) while a much smaller than average share of PFFS enrollees were enrolled in such plans (17%). A substantially smaller share of local PPO enrollees than regional PPO enrollees were covered by a zero-premium plan (25% versus 54%). Further analysis is needed to assess the relationship between zero-premium plans and benefit design, and factors that motivate employers to offer zero premium products in some situations and not others.2
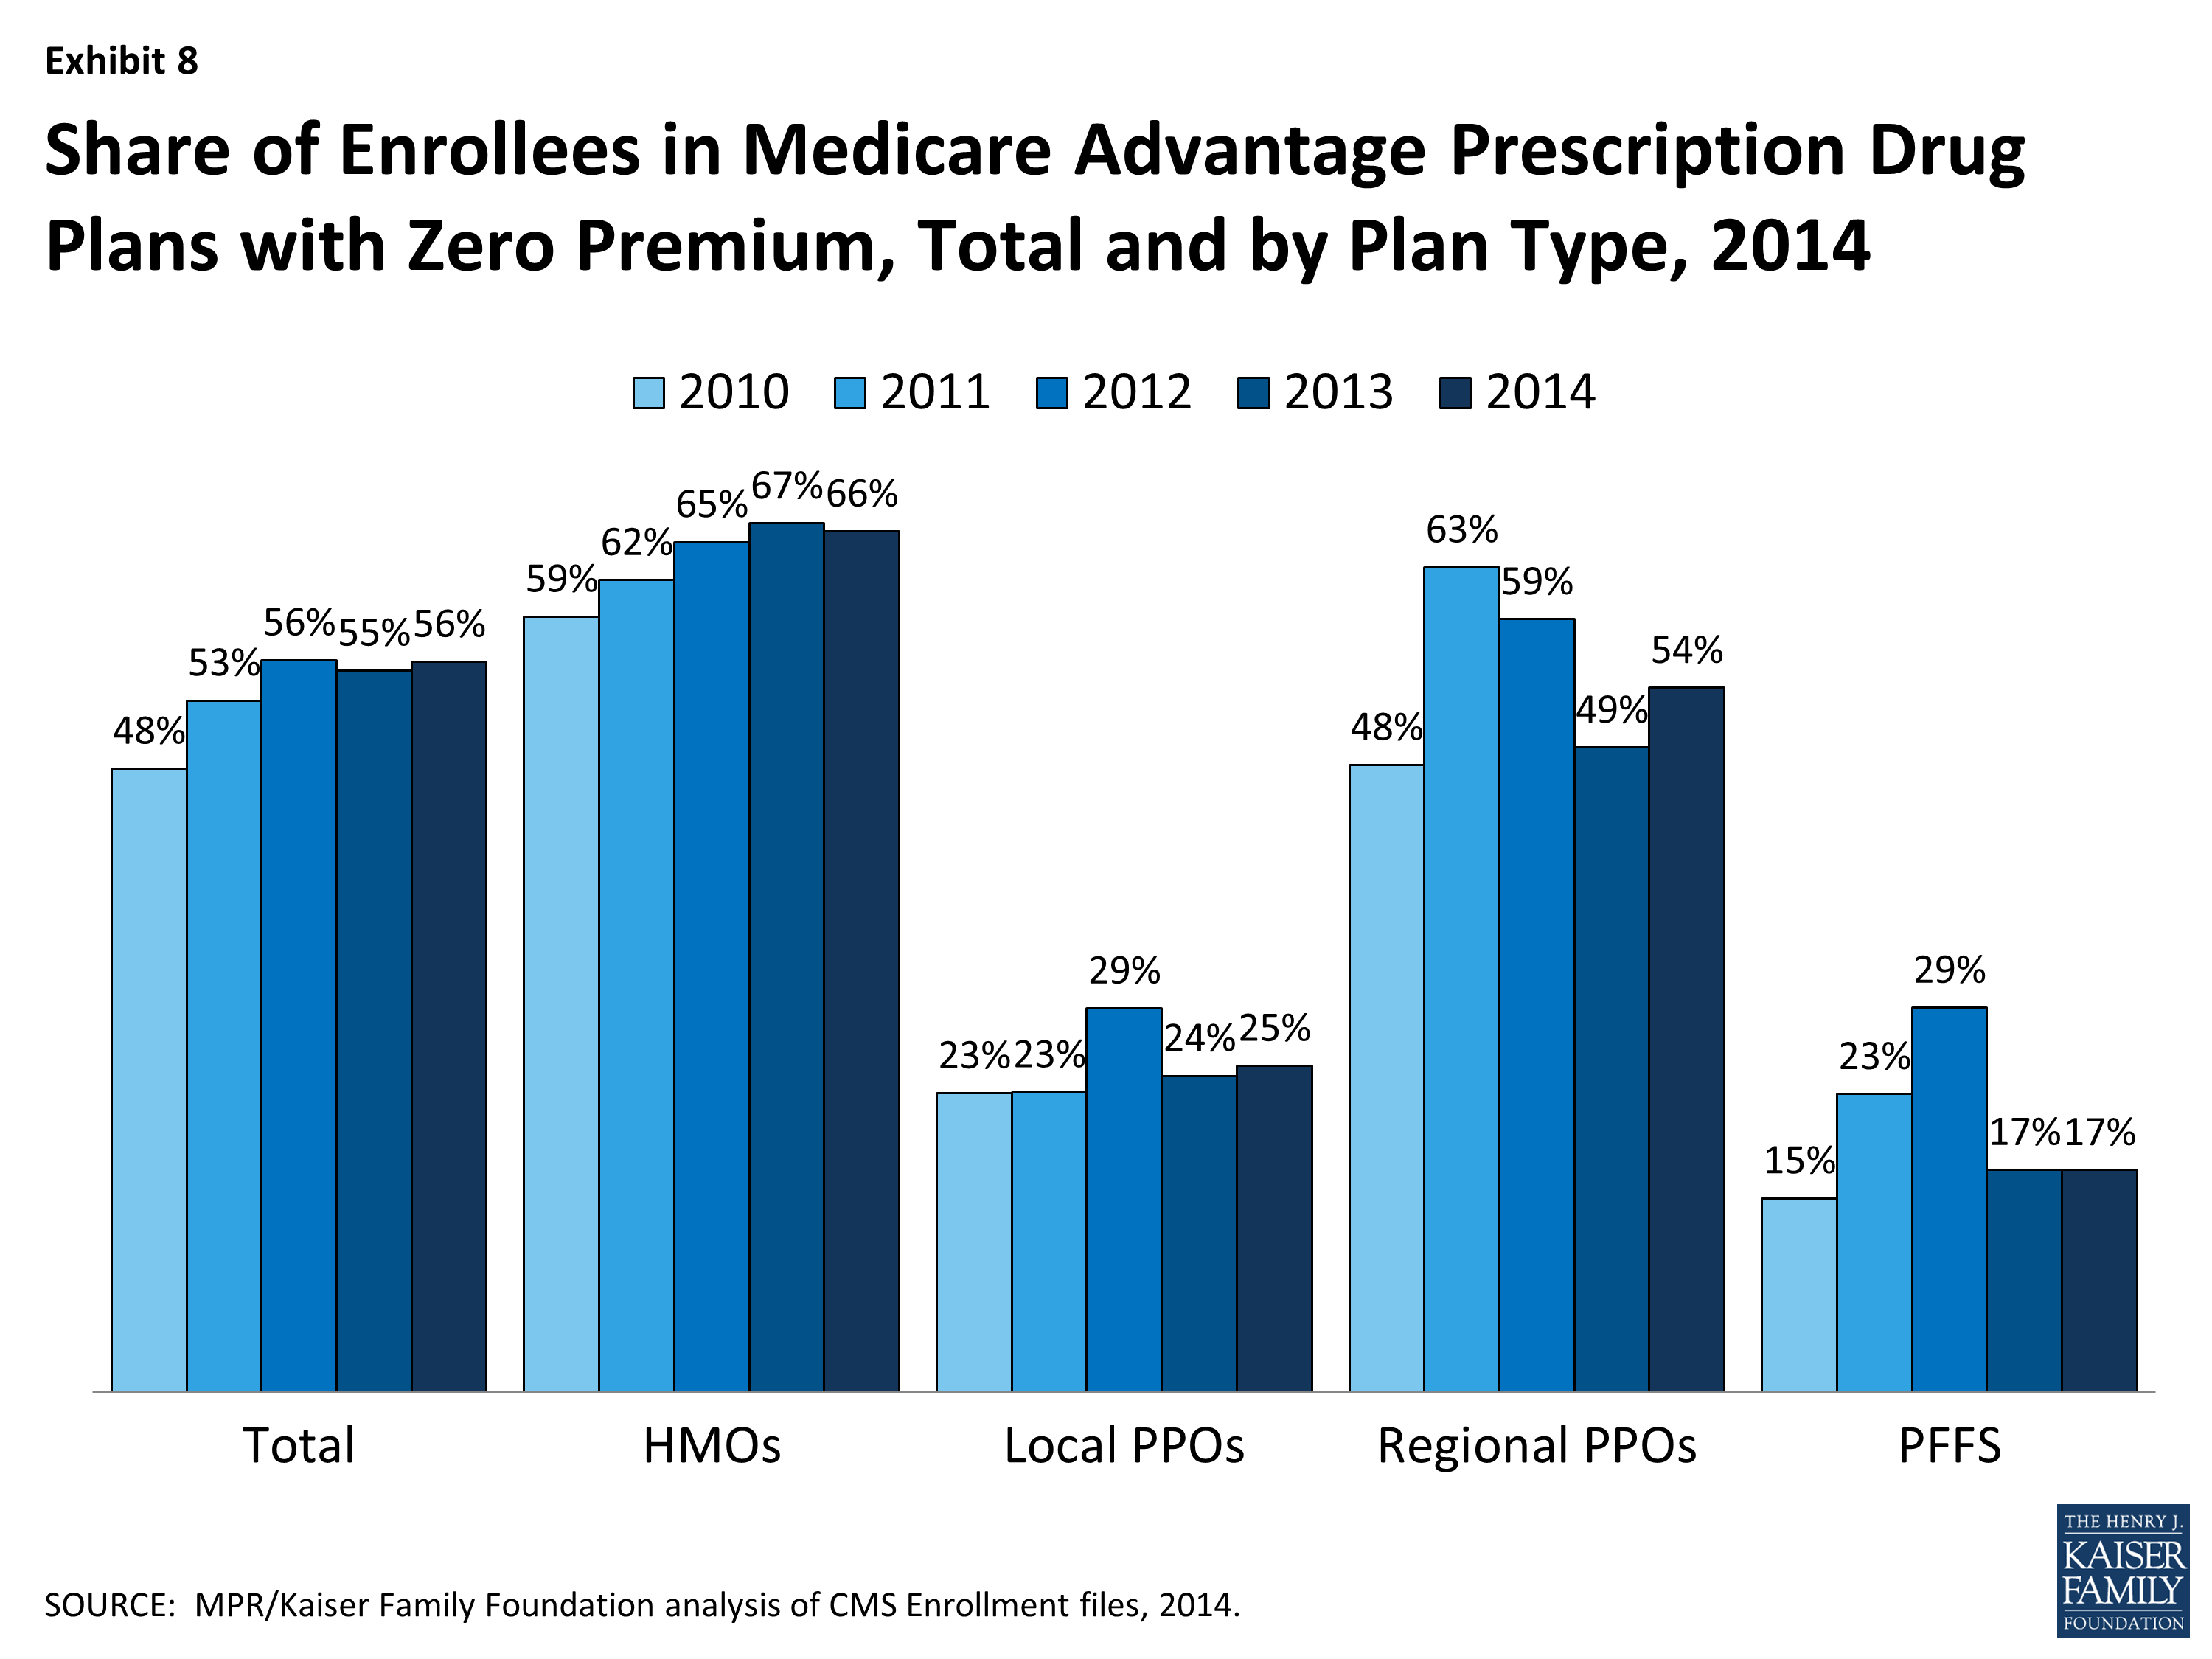
Exhibit 8: Share of Enrollees in Medicare Advantage Prescription Drug Plans with Zero Premium, Total and by Plan Type, 2014
Benefits
OUT OF POCKET LIMITS AND DONUT HOLE COVERAGE
In addition to analyzing premiums, we examined variations across plans and trends with respect to two types of benefits: the limit on out-of-pocket costs set by the plan and the availability of expanded Part D benefits relating to the coverage gap or “donut” hole.
Out-0f-Pocket Limits. Although traditional Medicare does not include an annual out of pocket limit on cost sharing for Medicare A and B benefits, CMS began requiring in 2011 that all Medicare Advantage plans have a limit below $6,700 annually and recommended a limit of $3,400 or lower. Since 2011, the share of beneficiaries in plans with limits below $3,400 has declined from 51 percent in 2011 to 33 percent in 2014 (Exhibit 9). During this time period, the share of enrollees in plans with limits above $5,000 almost doubled, from 24 percent in 2011 to 44 percent in 2014.
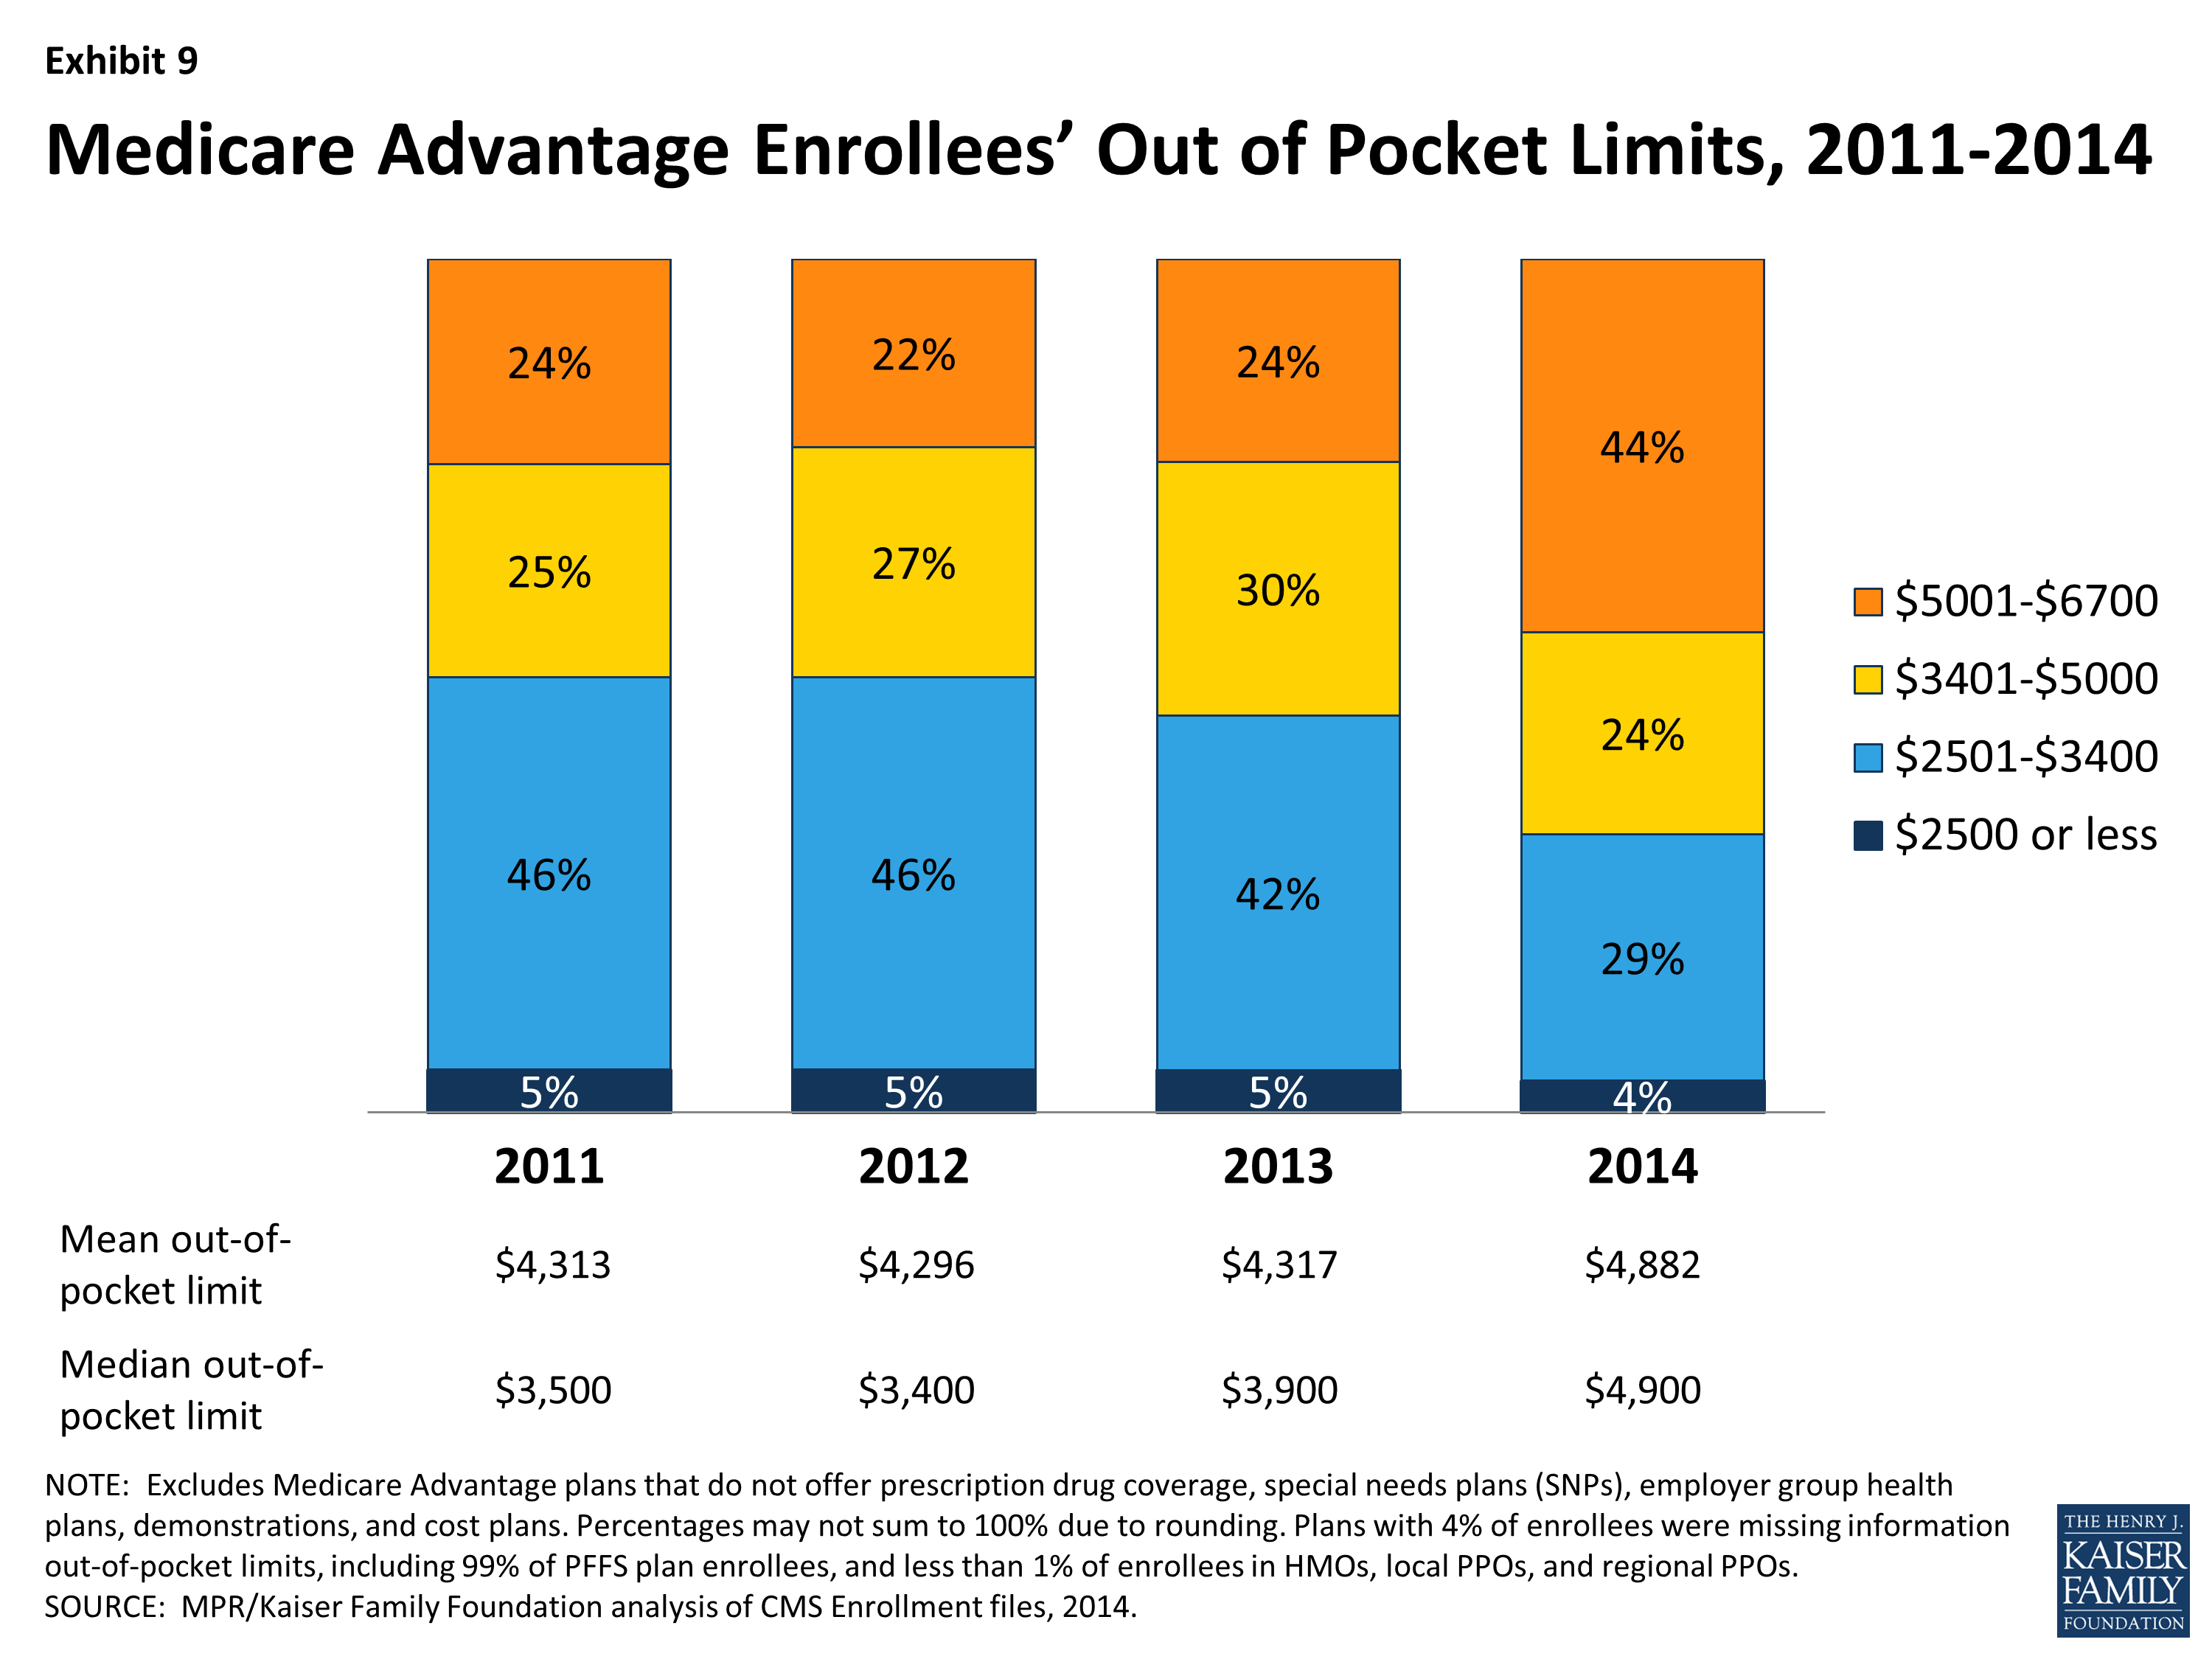
Exhibit 9: Medicare Advantage Enrollees’ Out of Pocket Limits, 2011-2014
Historically, HMOs have had the lowest average out of pocket limit and regional PPOs have had the highest average out of pocket limit (Exhibit 10). While this remains the case in 2014, limits have risen considerably across plans of all types. Virtually all regional PPO enrollees (98%), 43 percent of local PPO enrollees, and 38 percent of HMO enrollees are in a plan with a limit over $5,000 annually. While limits define ultimate financial liability rather than the amount an enrollee pays, limits are important and also valuable in communicating to beneficiaries their potential maximum liability, at least for in-network Medicare-covered benefits, in the plan.
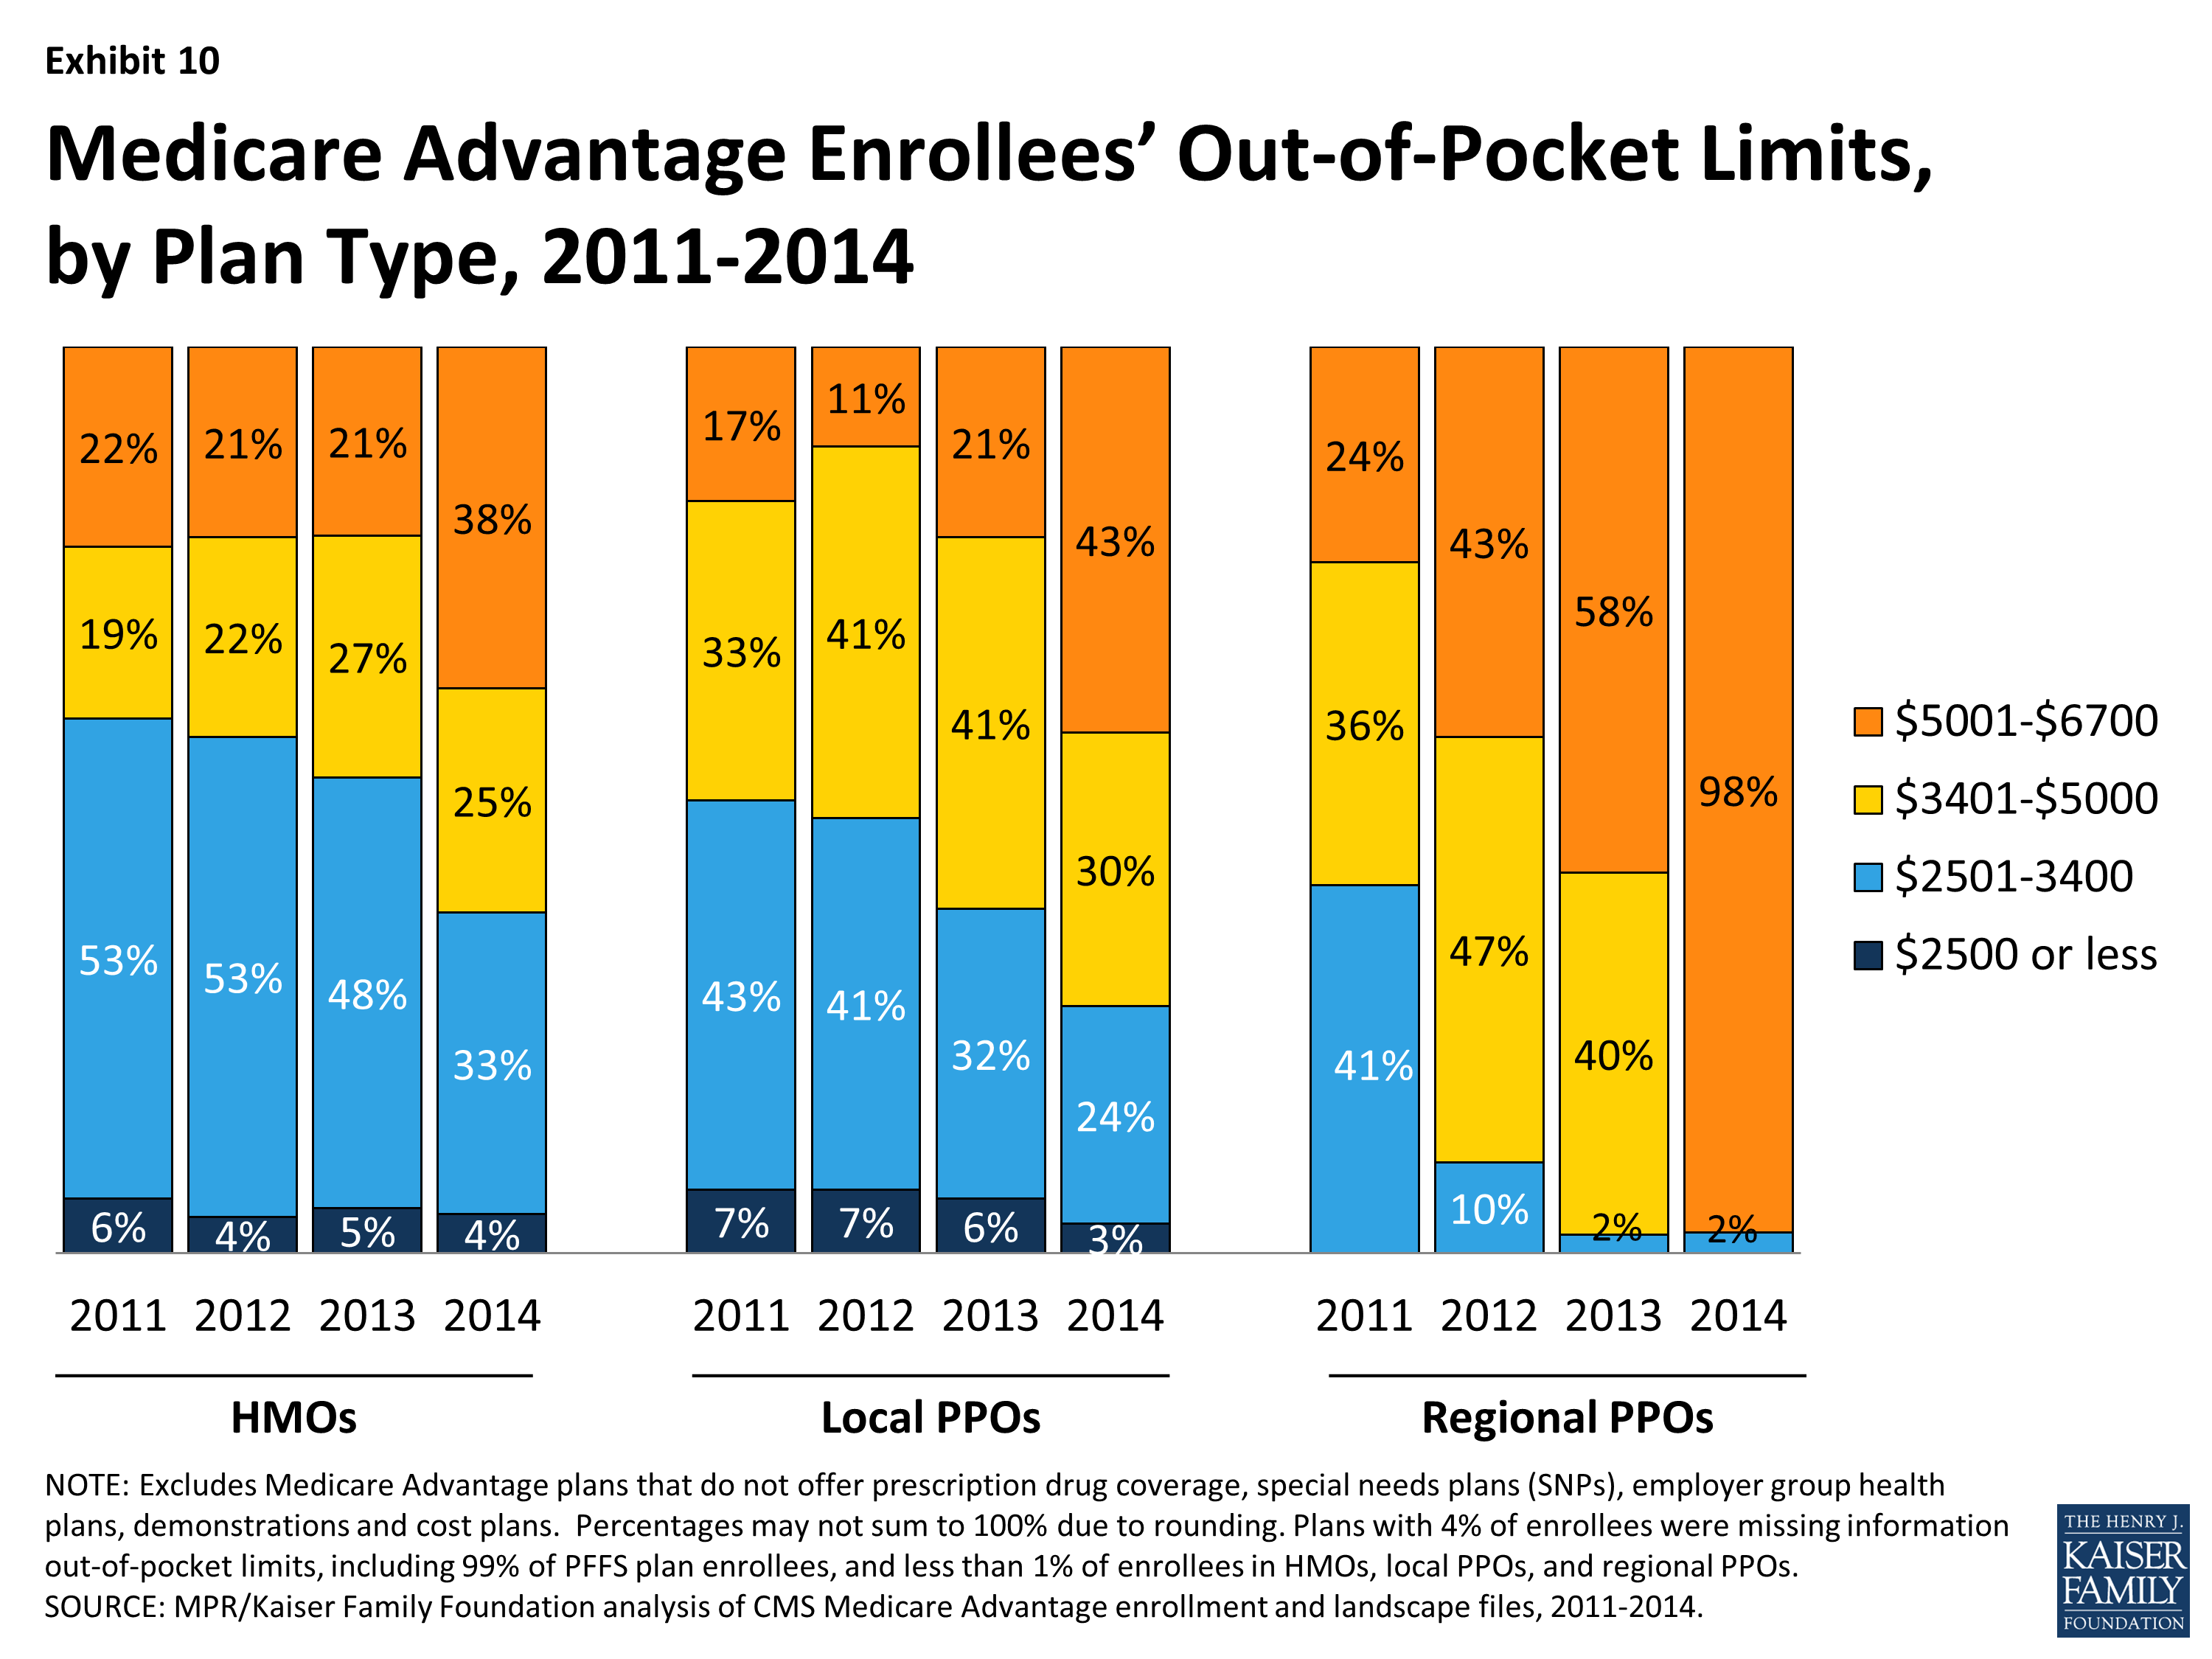
Exhibit 10: Medicare Advantage Enrollees’ Out-of-Pocket Limits, by Plan Type, 2011-2014
Coverage in the Part D Donut Hole. The standard Medicare Part D benefit in 2013 has a $310 deductible and 25 percent coinsurance up to an initial coverage limit of $2,850 in total drug costs, followed by a coverage gap (the so-called “donut hole”), until their total out of pocket Part D spending reaches $4,550 when the catastrophic limit kicks in and beneficiaries pay 5 percent of specified limits for drugs. The ACA gradually reduces the coverage gap until it is eliminated in 2020. In 2014, enrollees in plans with no additional gap coverage will pay 47.5 percent of the total costs of brands and 72 percent of the total cost of generics in the gap until they reach the catastrophic limit.
Covering a larger share of beneficiaries’ out-of-pocket costs in the “coverage gap” is one way Medicare Advantage plans can enhance benefits. In 2014, about half (49%) of all Medicare Advantage enrollees were in plans that offered no additional coverage in the gap (Exhibit 11). Twenty two percent were in plans with some additional coverage for generics and 27 percent with some additional coverage for both some generics and brand name drugs. A relatively small share of enrollees in regional PPOs had any additional gap coverage (30%) compared to enrollees in HMOs (57%). Most stand-alone Part D plans provide little or no gap coverage in 2014 beyond what is required under the standard benefit.1
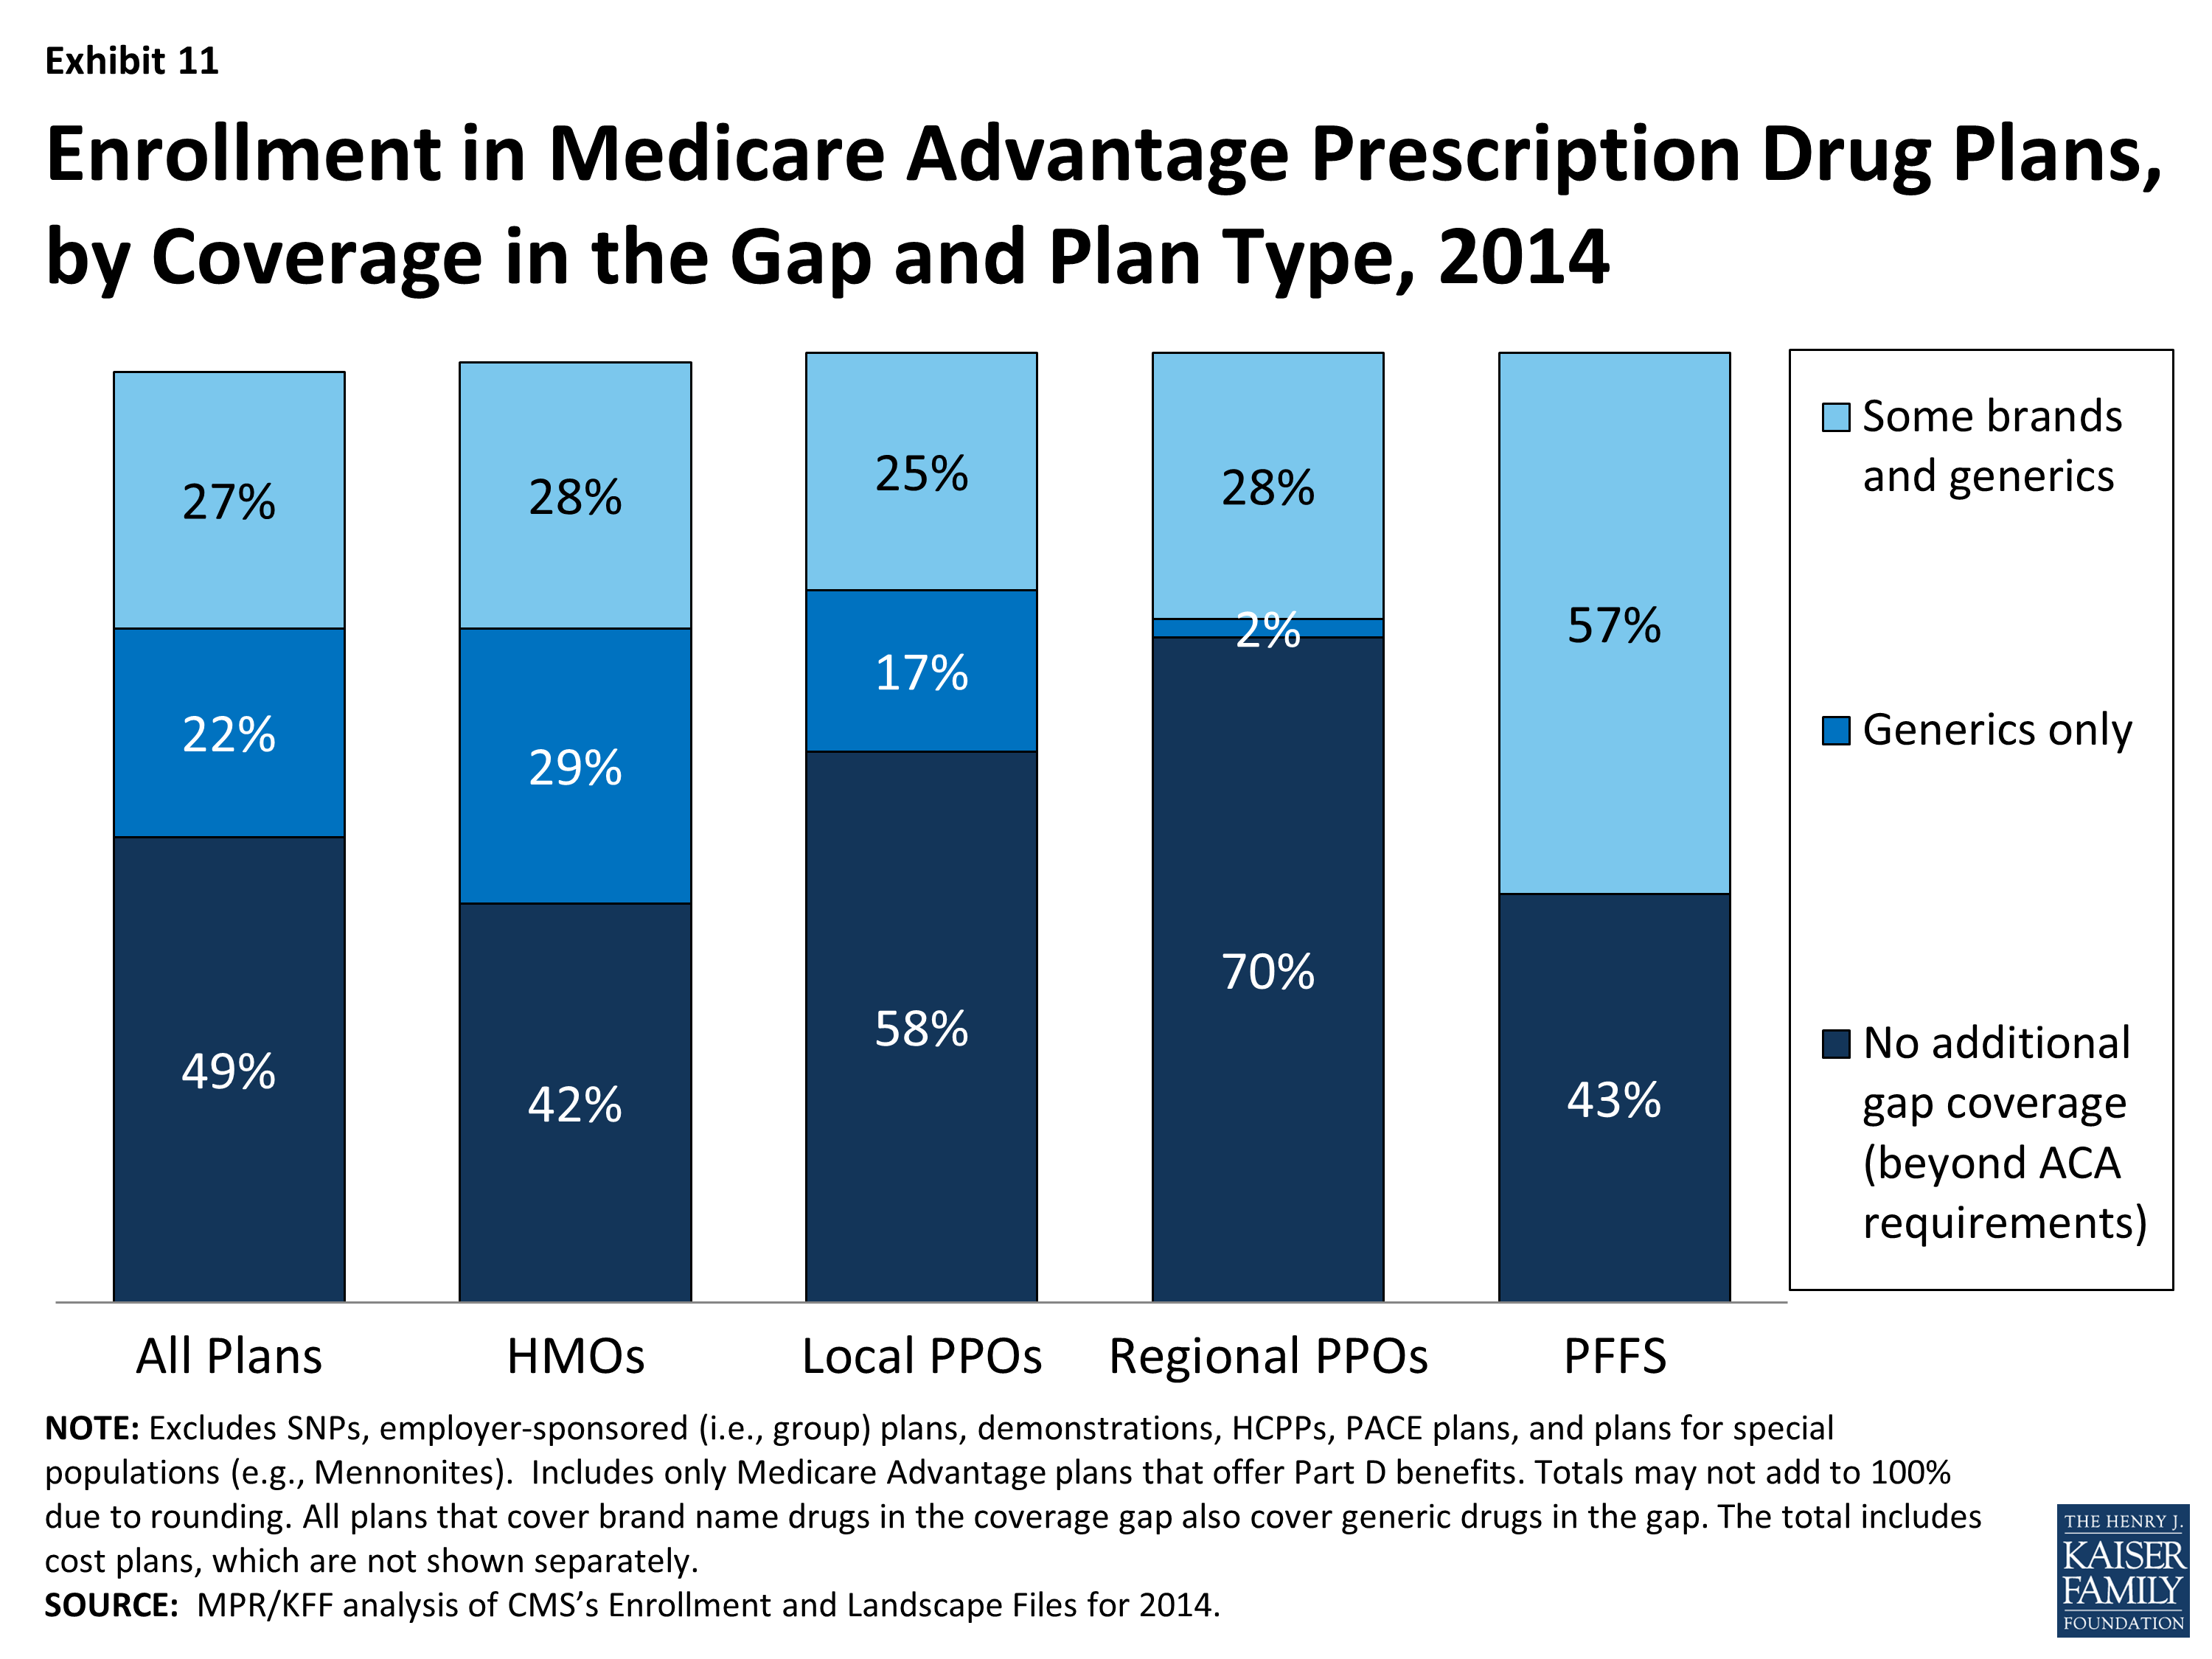
Exhibit 11: Enrollment in Medicare Advantage Prescription Drug Plans, by Coverage in the Gap and Plan Type, 2014
Firms and Market Structure
Enrollment by Firm. As in prior years, Medicare Advantage enrollment in 2014 tends to be highly concentrated among a small number of firms (Exhibit 12 and Table A4). In 2014, six firms or affiliates accounted for 72 percent of the market: United Healthcare (20%), Humana (17%), Blue Cross Blue Shield (BCBS) affiliated plans (17%), Kaiser Permanente (8%), Aetna (7%), and Cigna (3%). Another 6 national firms account for 5 percent of the market, including Wellcare, HealthNet, Universal American, Munich American Holding Corporation, and Wellpoint not affiliated with BCBS. The remaining enrollees are in plans offered by more locally or regionally focused firms.
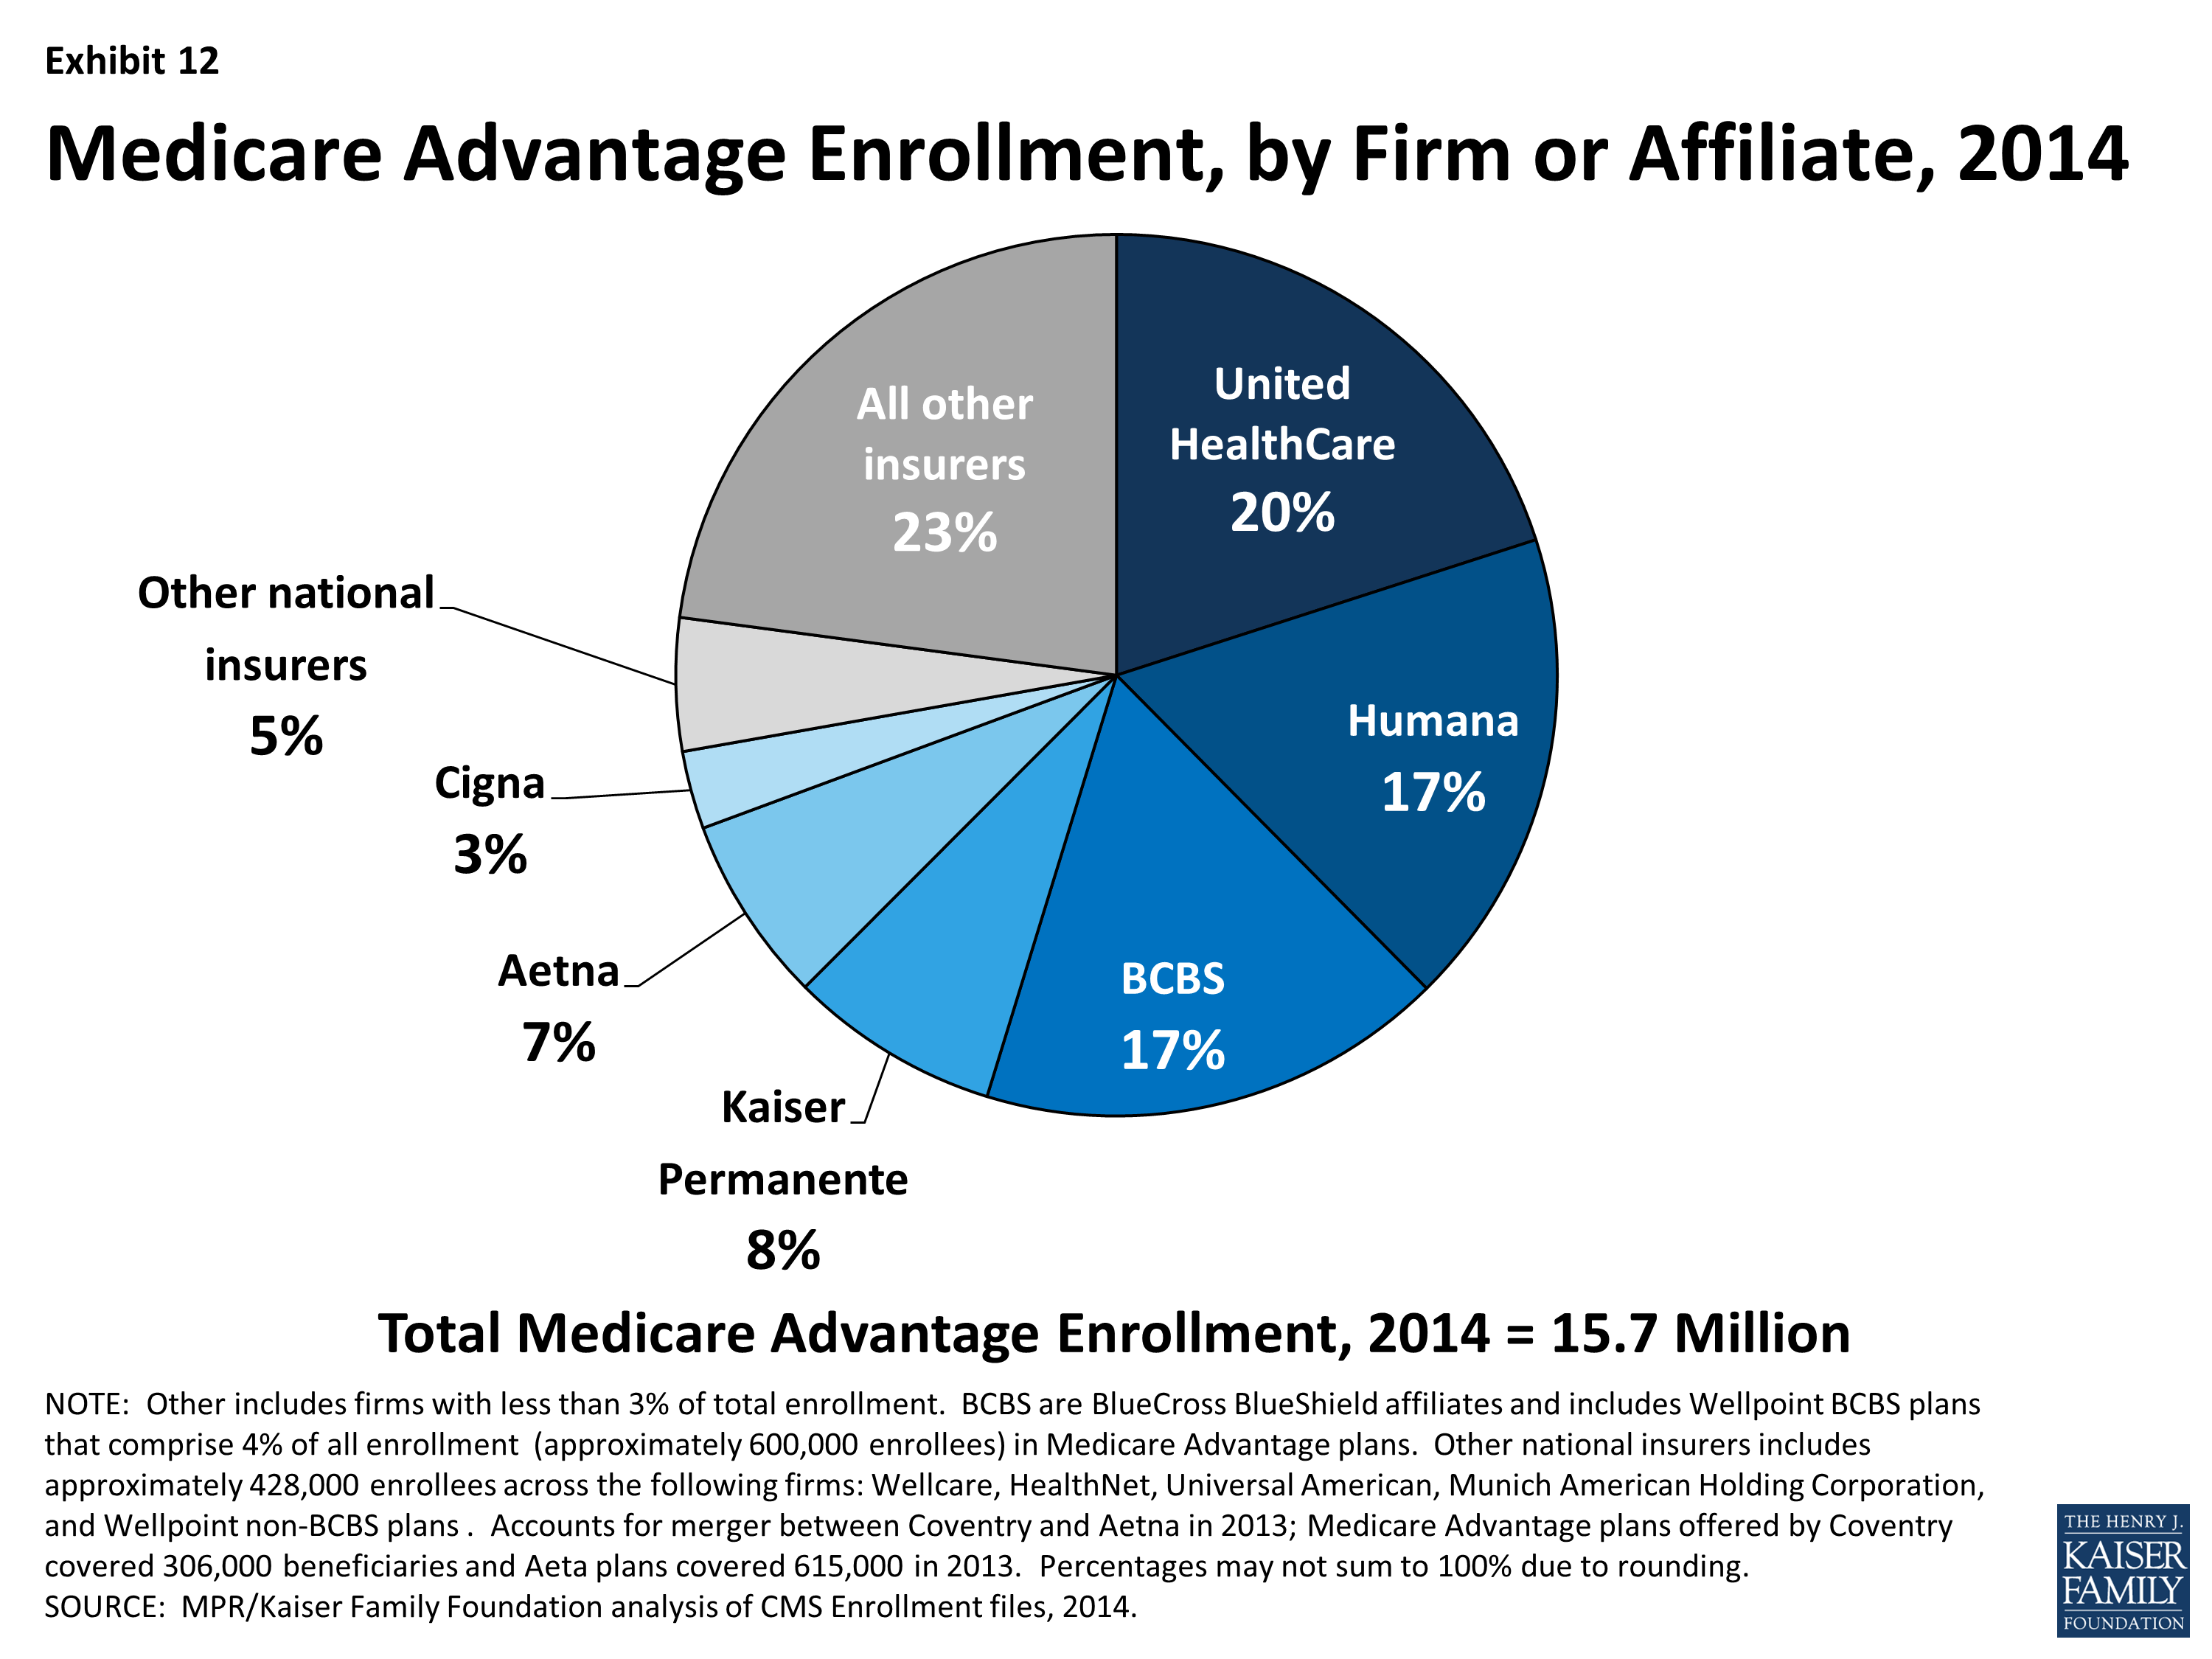
Exhibit 12: Medicare Advantage Enrollment, by Firm or Affiliate, 2014
Firms differ in how they position themselves in the market, including the plan types they offer. As has been the case historically, almost all of Kaiser Permanente’s enrollees (94%) are in HMOs and the remainder are in similarly structured cost plans (Exhibit 13). In contrast, United Healthcare’s enrollment is in HMOs, local PPOs, regional PPOs, and PFFS plans, in proportions that are similar with the nationwide enrollment distribution. Compared to United Healthcare, Humana and BCBS affiliated plans have a smaller share of their enrollment in HMOs (45% for each versus 62% for United Healthcare). Humana’s distribution of enrollment across plan types continues the shift from earlier years when a much larger share of Humana’s enrollees were in PFFS plans.
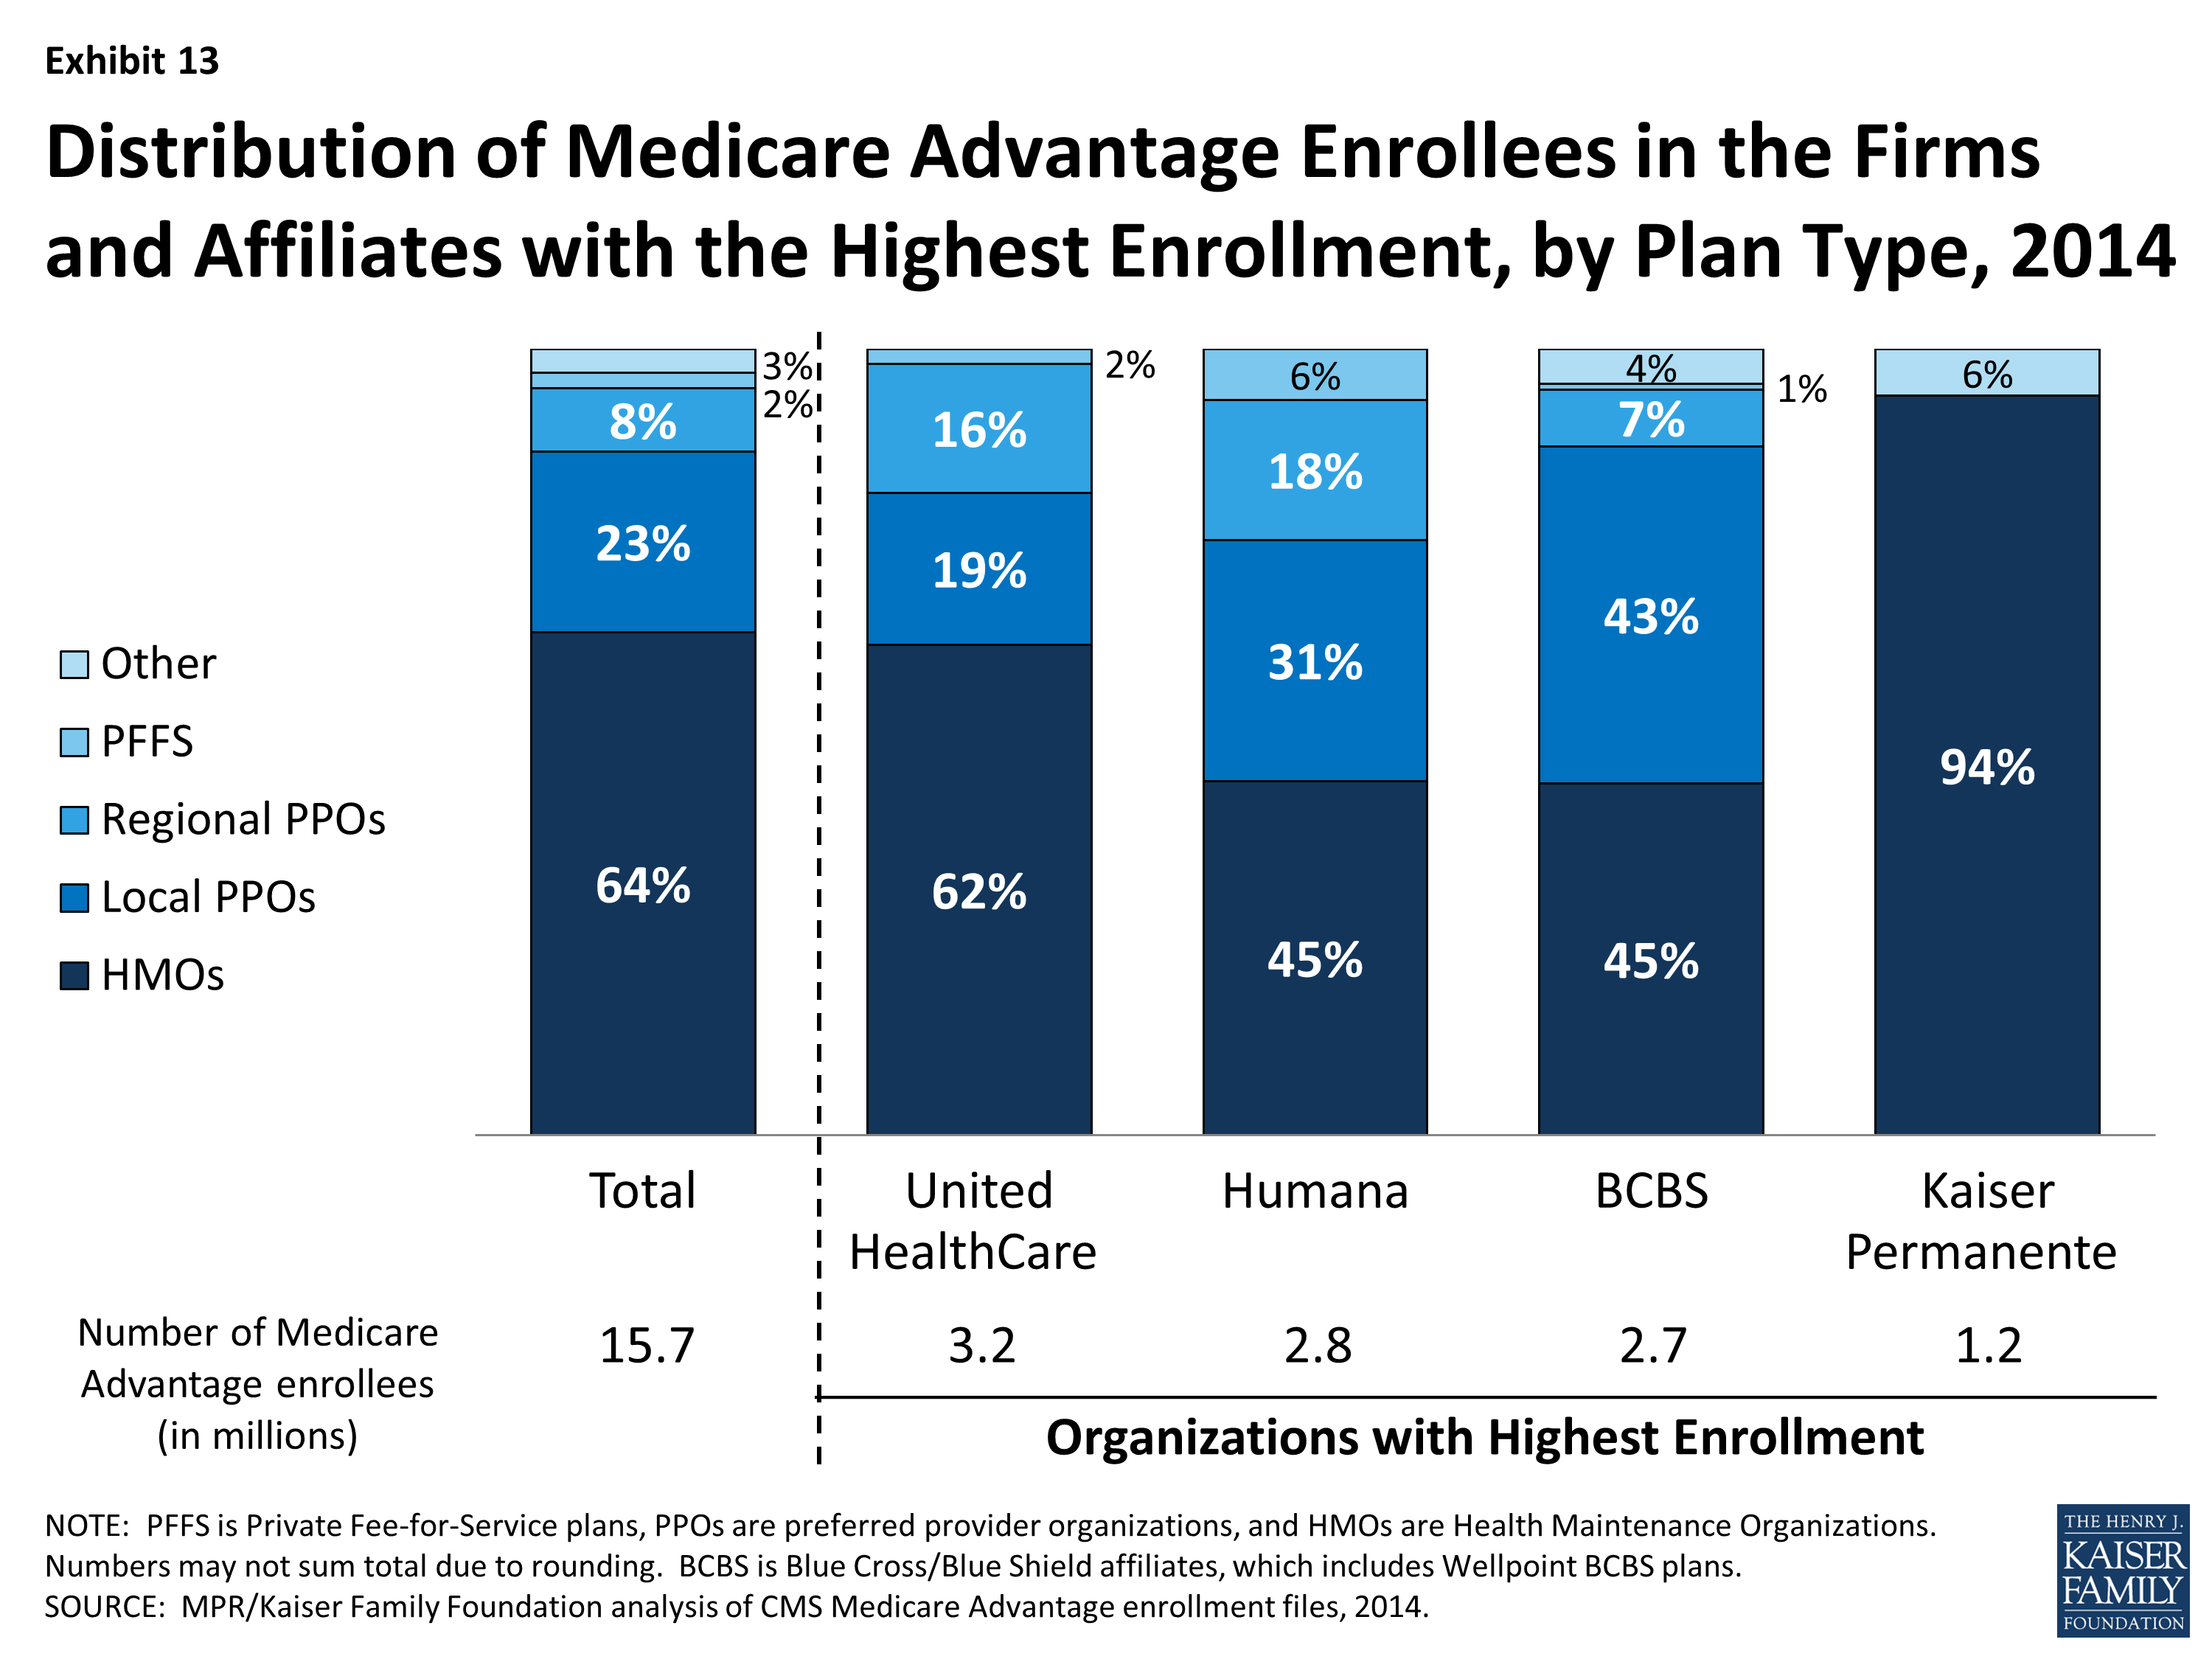
Exhibit 13: Distribution of Medicare Advantage Enrollees in the Firms and Affiliates with the Highest Enrollment, by Plan Type, 2014
Each of the large national firms in the Medicare Advantage market now has a sizeable share of enrollees from group accounts. Enrollment in group plans now represents 47 percent of enrollment in Aetna, 39 percent of enrollment in Kaiser Permanente, 23 percent of enrollment in BCBS affiliated plans, 17 percent of enrollment in Humana, and 14 percent of enrollment in United Healthcare (Table A4).
Between 2013 and 2014, some firms appear to have grown their group enrollment particularly rapidly, suggesting that they had a change in employers contracting with them. Growth in the group market accounts for all of the net growth in United Healthcare’s enrollment over the past year. Wellpoint BCBS’s total Medicare Advantage enrollment would have declined in the absence of a large increase in group enrollment (from roughly 28,000 to 120,000). In contrast, enrollment in Kaiser Permanente’s individual plans grew more rapidly than its group enrollment.1 Most of the growth in Medicare Advantage enrollment is in the individual market, but enrollment through group plans increased particularly rapidly in 2014 and has been a major factor in the experience of some firms.
Market Concentration by State. As is the case nationally, a small number of firms also dominate Medicare Advantage enrollment in most states (Exhibit 14). In all but one state (NY), the three largest firms or affiliates account for 50 percent or more of enrollment. In 20 states and the District of Columbia, 90 percent of enrollment or more is in the three largest plans and in 18 states, 75 percent of enrollment is in the three largest plans. Some states with highly concentrated markets (three firms accounting for at least 90 percent of enrollment) have relatively low Medicare Advantage penetration rates (AK, DE, KS, MS, MT, ND, NE, SD, VT, WY), but several other such states do not (LA, NC, NV, RI).

Exhibit 14: Combined Market Share of the Three Firms or Affiliates with the Largest Number of Medicare Advantage Enrollees in Each State, 2014
In 15 states and the District of Columbia, one company has more than half of total Medicare Advantage enrollment (Table A5). United Healthcare has the largest share in 19 states and is among the top three firms in an additional 19 states and the District of Columbia. Humana has the largest enrollment in 11 states and is among the top 3 in another 18 states. Plans offered by BCBS affiliates have the most enrollees in 8 states and are among the top firms in another 16 states. Kaiser Permanente’s presence is more geographically focused than other major national firms, with a heavy concentration in California, Colorado, the District of Columbia and Maryland. Kaiser Permanente has more enrollees than any other firm in California, the District of Columbia and Maryland. Locally dominant plans, that is, those with the most Medicare Advantage enrollees in their state include EmblemHealth (CT), Martin’s Point Health are (ME), Tufts Associated HMO (MA), New West (MT), Presbyterian Healthcare Services (NM), and Medica Holding Company (ND and SD).
Enrollment Across Counties with High and Low Traditional Medicare Spending. Over the years, Congress and various Administrations have made a number of changes to payment and participation rules for private risk-bearing plans that provide Medicare benefits under contract with the federal government, now called Medicare Advantage plans. Many of these changes have revolved around plan payment levels, seeking to balance having more plans participate with parity in payments between traditional Medicare and Medicare Advantage. The latest of these changes, which is included in the ACA, varies payment policy with the level of traditional Medicare spending in counties, grouped evenly into four quartiles by cost. Payments to plans now depend on the relationship between their bids and the counties’ traditional Medicare spending and also are increased by any quality based bonus payments the plan may receive. After being frozen in 2011 at 2010 levels, benchmarks (the maximum Medicare will pay a plan) are being adjusted down so that once payments are fully phased in they will range from 95 percent of traditional Medicare spending for counties in the top quartile of spending (e.g., Miami-Dade, FL) to 115 percent of traditional Medicare spending in the bottom quartile of such spending (e.g., Boise, ID).
Despite the payment changes, enrollment continues to grow across counties in each of the four quartiles of traditional Medicare spending (Table A6). Between 2013 and 2014, enrollment grew at a relatively similar rate in aggregate across in highest quartile counties (8.3%) as in the lowest quartile counties (8.7%), and higher, but not very much differently, in the two quartiles in between (10.7% and 12.3%, respectively). In 2014, overall penetration also was not very different across quartiles (ranging from 27% to 34%). Thus, enrollment continues to grow across counties that differ in traditional Medicare spending, which is not surprising given that Medicare Advantage penetration rates have historically been high in several low cost counties (e.g., Multnomah, OR and Boise, ID) as well as high cost counties (Miami-Dade, FL and Los Angeles, CA).
Conclusion
Discussion
Medicare Advantage enrollment continues to grow despite concerns that payment rate changes incorporated in the ACA will lead to a drop in enrollment, and a significant reduction in benefits. Enrollment trends suggest that Medicare Advantage remains an attractive option for a growing number of beneficiaries. Despite some turnover in the composition of available plans, beneficiaries continue to have many choices and the share of beneficiaries enrolled in Medicare Advantage continues to grow in virtually all states, suggesting that the market currently has sufficient choice to attract enrollees. Our analysis also shows that premiums paid by enrollees have remained fairly flat, with the average premium ($35 per month) the same as it was in 2012 and 2013.
Looking to the future, it is not clear if or how plans will modify their offerings, nor what the effect will be for beneficiaries. Thus far, there hasn’t been much of a change in the Medicare Advantage market, other than the increase in out-of-pocket limits and reports in the media that some insurers have scaled back provider networks. As payment reductions continue to be phased in, insurers may reduce the extra benefits they now offer, though they will still be required to provide benefits that are at least equivalent to those that are offered under traditional Medicare, in conjunction with a limit on out-of-pocket spending. Insurers will need to balance their interest in maintaining market share (and remain attractive to beneficiaries) against their ongoing interest in operating as profitably as possible.
Ultimately the form of both the overall Medicare program and Medicare Advantage will be shaped by the policy and fiscal climate. There are very different perspectives on the kinds of protections Medicare needs to provide for seniors and younger enrollees with disabilities, the appropriate level of Medicare spending and how to finance it, and how Medicare benefits should be provided. This larger context, and its relevance to the long term stability of the Medicare program, warrants explicit consideration as part of the debate on Medicare Advantage payment.
Marsha Gold is a Senior Fellow Emeritus with Mathematica Policy Research;
Gretchen Jacobson and Tricia Neuman are with the Kaiser Family Foundation;
Anthony Damico is an independent consultant.
Endnotes
Introduction
G. Jacobson, T. Neuman, and J. Huang, “Projecting Medicare Advantage Enrollment: Expect the Unexpected?” Kaiser Family Foundation, June 2013. Also see Alliance for Health Reform briefing, “The Future of Medicare Advantage: Are We on the Right Path?” June 2013; available at https://www.kff.org/medicare/event/june-10-briefing-the-future-of-medicare-advantage-are-we-on-the-right-path/
In this document, the ACA refers to the Patient Protection and Affordable Care Act os 2010 (P.L. 111-148; PPACA) as amended by the Health Care and Education Reconciliation Act of 2010 (P.L. 111-152).
Issue Brief
Overall Trends in Enrollment
Statistics include cost and demonstration plans even though they are organized under separate authority from Medicare Advantage. Enrollment includes those in Special Needs Plans, as well as regular Medicare Advantage plans and includes those enrolled individual plans and group plans. The analysis is based on publicly available CMS data from the contract/plan/state/county enrollment file. This file excludes enrollment in counties with fewer than 11 people in a plan in a county. County-plan records without a valid FIPS county identifier were also excluded from the analysis. These small exclusions add up to about 242,640 beneficiaries or 1.5 percent of total Medicare Advantage enrollment in March 2014.
M. Gold, G. Jacobson, A. Damico, and T. Neuman. “Medicare Advantage 2014 Data Spotlight: Plan Availability and Premiums,” Washington DC: Henry J. Kaiser Family Foundation, December 2013.
Trends in Enrollment by Plan Type
M. Gold “Medicare’s Private Plans: A Report Card on Medicare Advantage,” Health Affairs Web Exclusive, November 24, 2008.
For more information on PFFS plans, see M. Gold, G. Jacobson, A. Damico, and T. Neuman. “Medicare Advantage 2011 Data Spotlight: Plan Availability and Premiums,” Washington DC: Henry J. Kaiser Family Foundation, October 2010. J. Blum, R. Brown and M. Frieder “An Examination of Medicare Private Fee For Service Plans, Washington DC: Kaiser Family Foundation, March 2007.
M. Gold, “Medicare Advantage in 2008.” (Table 1: PFFS Contracts by Firm and Number of Counties Covered by the Contract, 2006-2008), Kaiser Family Foundation, June 2008.
Specialized Sectors of the Market
F. McArdle, T. Neuman and J. Huang. “Retiree Health Benefits at the Crossroads”. Washington DC: Henry J. Kaiser Family Foundation, April 2014.
Medicare Payment Advisory Commission “Chapter 13. The Medicare Advantage Program: Status Report” in Report to Congress: Medicare Payment Policy, Washington DC, March 2014. pp 323-349.
Kaiser Family Foundation and Health Research and Education Trust, “Section 11. Retiree Health Benefits.” Employer Health Benefits: 2013 Annual Survey. Washington, DC: Kaiser Family Foundation, 2013, pp. 191-199; and P. Fronstein and N. Adams. “Employment Based Retiree Health Benefits: Trends in Access and Coverage: 1997-2010.” EBRI Education and Research Institute, 2012.
Premiums
M. Gold, G. Jacobson, A. Damico, and T. Neuman. “Medicare Advantage 2014 Data Spotlight: Plan Availability and Premiums” Washington DC: Henry J. Kaiser Family Foundation, December 2013.
M. Gold and M. Hudson (2013, op site) and M. Gold, M. Hudson, G. Jacobson and T. Neuman “2010 Data Spotlight: Benefits and Cost Sharing” Washington DC: Henry J. Kaiser Family Foundation, February 2010.
Benefits
Kaiser Family Foundation. “The Medicare Part D Prescription Drug Benefit” Fact Sheet. Washington DC, November 2013.
Firms and Market Structure
M. Gold, “Medicare Advantage in 2008.” Kaiser Family Foundation, June 2008.