Data Note: How Has the Individual Insurance Market Grown Under the Affordable Care Act?
Updated with new data on May 12, 2015.
The individual (or “non-group”) insurance market has changed substantially under the Affordable Care Act (ACA). Starting in 2014, the health law put in place new rules for what types of plans can be sold, required insurance companies to guarantee access to everyone regardless of health status, and limited the factors insurers could use in setting premiums. The law also created new Health Insurance Marketplaces, where low- and moderate- income consumers without access to other affordable coverage could obtain federal tax credits to help them pay their premiums.
As of the end of open enrollment in 2014, 8 million people had signed up for coverage through the Marketplaces. Accounting for the fact that some of those people did not pay their premiums or subsequently dropped coverage – and for signups through special enrollment periods throughout the year – 6.7 million people were insured through marketplace plans as of October 15, 2014. However, it has been unclear precisely how many of these Marketplace enrollees were previously uninsured or how many would have purchased individual coverage directly from an insurer in the absence of the ACA.
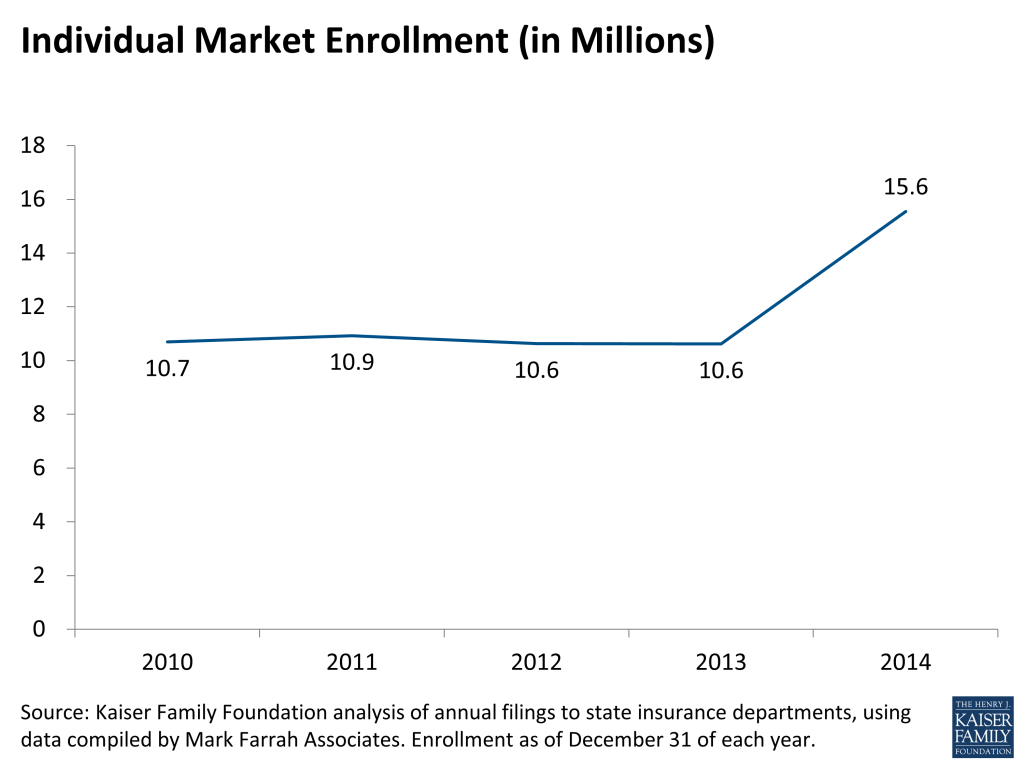
Kaiser Family Foundation analysis of recently-submitted 2014 filings by insurers to state insurance departments (using data compiled by Mark Farrah Associates) shows that 15.6 million people had major medical coverage in the individual insurance market – both inside and outside of the Marketplaces – as of December 31, 2014. Enrollment was up 4.9 million over the end of 2013, a 46% increase.
The insurance company filings do not break down whether coverage was purchased through a Marketplace or in the outside market, nor whether coverage was first purchased after January 1, 2014 and therefore subject to the new ACA insurance market rules. However, juxtaposing these enrollment figures with the federal government’s estimate of 6.7 Marketplace enrollees as of October 15, 2014 suggests that about 43% of all individual market coverage was purchased through the marketplaces in 2014. It also means that new enrollment in the individual market among those who would have otherwise been uninsured likely took place inside the Marketplaces, driven by the availability of premium subsidies. Among those signing up for Marketplace plans in 2014, 85% qualified for premium subsidies.
Looking by state (shown in Table 1), almost half of the individual market enrollment growth nationwide from 2013 to 2014 was in four states: California (843,607), Florida (653,997), Texas (505,931), and Georgia (330,520). The individual insurance markets in six states grew by more than 75%: Arkansas (168%), New York (141%), Rhode Island (104%), Maine (93%), Georgia (79%), and Florida (77%). (Note that Arkansas figures may include some people eligible for Medicaid who enrolled in marketplace plans through that state’s “private option” approach to the ACA’s Medicaid expansion.)
Two states – Colorado and Massachusetts – saw decreases in individual market enrollment. Both states had below average enrollment in their marketplaces as a share of the potential market, and in Colorado some people previously purchasing coverage on their own may have switched to Medicaid as eligibility expanded. Massachusetts had implemented an earlier health reform plan and experienced significant transitions in coverage as the ACA took effect. (Note that the data for Nebraska also show a decrease in enrollment, but a sizable plan has not yet filed).
As of the end of open enrollment for 2015, 11.7 million people had signed up for Marketplace coverage, an increase of 3.7 million over 2014. Not all of those new enrollees will pay their premiums and begin coverage, but it is likely that the individual market has continued to grow in 2015, though at a slower pace than in the first year of full ACA implementation. Over time, reaching new enrollees – particularly those who are uninsured – will be key to the long-term success of the law.
| Table 1: Change In Individual Market Enrollment From 2013-2014, by State | ||||
| 2014 Individual Enrollment | 2013 Individual Enrollment | Change | % Change | |
| National | 15,553,564 | 10,620,872 | 4,932,392 | 46% |
| Alaska | 23,641 | 14,127 | 9,514 | 67% |
| Alabama | 205,772 | 168,787 | 36,985 | 22% |
| Arkansas* | 303,258 | 113,288 | 189,970 | 168% |
| Arizona | 327,549 | 266,381 | 61,168 | 23% |
| California | 2,171,525 | 1,327,918 | 843,607 | 64% |
| Colorado | 271,835 | 282,628 | (10,793) | -4% |
| Connecticut | 160,253 | 121,004 | 39,249 | 32% |
| District of Columbia | 20,090 | 19,205 | 885 | 5% |
| Delaware | 32,463 | 21,562 | 10,901 | 51% |
| Florida | 1,499,569 | 845,572 | 653,997 | 77% |
| Georgia | 750,256 | 419,736 | 330,520 | 79% |
| Hawaii | 33,013 | 27,336 | 5,677 | 21% |
| Iowa* | 189,264 | 181,159 | 8,105 | 4% |
| Idaho | 150,065 | 90,810 | 59,255 | 65% |
| Illinois | 599,188 | 442,703 | 156,485 | 35% |
| Indiana | 231,276 | 171,525 | 59,751 | 35% |
| Kansas | 163,952 | 124,619 | 39,333 | 32% |
| Kentucky | 162,920 | 131,770 | 31,150 | 24% |
| Louisiana | 224,989 | 175,218 | 49,771 | 28% |
| Massachusetts | 72,208 | 79,233 | (7,025) | -9% |
| Maryland | 279,898 | 190,291 | 89,607 | 47% |
| Maine | 61,807 | 31,965 | 29,842 | 93% |
| Michigan | 473,091 | 344,173 | 128,918 | 37% |
| Minnesota | 293,349 | 248,066 | 45,283 | 18% |
| Missouri | 344,020 | 260,303 | 83,717 | 32% |
| Mississippi | 128,189 | 85,190 | 42,999 | 50% |
| Montana | 70,078 | 45,488 | 24,590 | 54% |
| North Carolina | 633,480 | 467,868 | 165,612 | 35% |
| North Dakota | 49,031 | 44,480 | 4,551 | 10% |
| Nebraska* | 110,243 | 124,753 | (14,510) | -12% |
| New Hampshire | 55,611 | 35,856 | 19,755 | 55% |
| New Jersey | 261,176 | 154,823 | 106,353 | 69% |
| New Mexico | 70,525 | 57,508 | 13,017 | 23% |
| Nevada | 118,296 | 96,694 | 21,602 | 22% |
| New York | 410,924 | 170,680 | 240,244 | 141% |
| Ohio | 380,508 | 330,617 | 49,891 | 15% |
| Oklahoma | 171,673 | 121,897 | 49,776 | 41% |
| Oregon | 210,211 | 160,047 | 50,164 | 31% |
| Pennsylvania | 640,486 | 461,811 | 178,675 | 39% |
| Rhode Island | 37,571 | 18,392 | 19,179 | 104% |
| South Carolina | 201,111 | 134,210 | 66,901 | 50% |
| South Dakota | 73,124 | 65,728 | 7,396 | 11% |
| Tennessee | 340,904 | 243,143 | 97,761 | 40% |
| Texas | 1,251,270 | 745,339 | 505,931 | 68% |
| Utah | 213,830 | 140,084 | 73,746 | 53% |
| Virginia | 416,010 | 317,414 | 98,596 | 31% |
| Vermont | 32,163 | 21,115 | 11,048 | 52% |
| Washington | 303,784 | 254,881 | 48,903 | 19% |
| Wisconsin | 258,986 | 177,607 | 81,379 | 46% |
| West Virginia | 42,225 | 24,665 | 17,560 | 71% |
| Wyoming | 26,904 | 21,203 | 5,701 | 27% |
| Source: Kaiser Family Foundation analysis of annual filings to state insurance departments, using data compiled by Mark Farrah Associates. Enrollment as of December 31 of each year.Notes: Arkansas enrollment may include some people who enrolled in Medicaid through the state’s “private option” approach to Medicaid Expansion. Some known exchange participants have not filed enrollment data (Cooportunity Health in NE and IA, and Prominence Health Plan in NV). Data are still preliminary and other insurers may not have filed. | ||||
Methods
This analysis is based on filings that insurers submit to state regulators. The source of the data was the Health Coverage Portal TM, a market database maintained by Mark Farrah Associates, which includes information from the National Association of Insurance Commissioners and California’s Department of Managed Health Care. The underlying data sources are the Supplemental Health Care Exhibit (SHCE) and the California Department of Managed Care.
Plans showing enrollment, but no premium income were excluded from the analysis. In 2014, this primarily affected three states (Georgia, Kentucky, and Missouri), where Wellcare was excluded (this insurer primarily services Medicaid enrollees and appears to have erroneously filed as major medical). Parkland Community Health Plan was also excluded from Texas enrollment figures for this reason.
Some insurers have not yet filed certain data elements, or may revise their filings. Because some known exchange participants (in AR, CO, NM, NY, MA, OR, RI, UT, and WA) appear to have not filed the SHCE, these plans’ enrollment data as reported on the Exhibit of Premiums, Enrollment, and Utilization (EPEU) were used instead. Data for Affinity, HealthFirst, MetroPlus, and Fidelis Care in NY were provided by state regulators and are included in the updated version of this analysis. Exchange participants in other states did not have annual enrollment data available from either of the two exhibits (Cooportunity Health in NE and IA, and Prominence Health Plan in NV) and are therefore not included in this analysis.
Two sizable insurers (Blue Cross of Idaho and Security Health Plan of Wisconsin) did not file 2014 enrollment on the SHCE, so annual enrollment figures from the EPEU were used instead. In some cases, the number of individual market enrollees reported by individual insurers on the exhibits used for this analysis does not match figures reported on other exhibits.
Data were accessed on April 23, 2015. The analysis is limited to the 50 states and the District of Columbia, and does not include the territories. Enrollment is measured by the number of covered lives in major medical coverage on December 31, 2014, and does not include specialty coverage.