Understanding the U.S. Immigrant Experience: The 2023 KFF/LA Times Survey of Immigrants
Overview
The Survey of Immigrants, a partnership between KFF and The Los Angeles Times, takes an in-depth look at the experiences of immigrants, a diverse group that makes up 16% of the U.S. adult population. Immigrants play an important role in the nation’s workforce and culture, and they also face unique experiences and struggles in their communities, workplaces, and health care settings. Nonetheless, they overwhelmingly express optimism about their futures in the U.S. and have high hopes for their children.
The survey is the largest nationally representative survey focused on immigrants, interviewing 3,358 immigrant adults in 10 languages. The results provide a deep understanding of immigrants’ experiences, reflecting their varied countries of origin and histories, immigration statuses, racial and ethnic identities, and socioeconomic backgrounds. In addition to the survey, KFF and The Los Angeles Times also conducted 13 focus groups with immigrant adults across the country.
Other KFF reports from the survey:
Health and Health Care Experiences of Immigrants
Political Preferences and Views on U.S. Immigration Policy Among Immigrants in the U.S.
Five Key Facts About Immigrants’ Understanding of U.S. Immigration Laws, Including Public Charge
Five Key Facts About Immigrants with Limited English Proficiency
Five Key Facts About Black Immigrants’ Experiences in the United States
Explore The Los Angeles Times’ “Immigrant Dreams” project:
In an increasingly pessimistic era, immigrants espouse a hallmark American trait — optimism, published Sept. 17, 2023
Ten languages, thousands of phone calls: Accurately polling immigrants posed unprecedented challenges, published Sept. 17, 2023
Column: We need immigrants more than ever. They keep hope in this country alive, published Sept. 17, 2023
Receiving food stamps won’t kill your green card chances. How ‘public charge’ works, published Sept. 17, 2023
Immigration scams are rampant. Here’s how to avoid getting taken, published Sept. 17, 2023
We asked immigrants across the country these questions. See how your answers line up, published Sept. 17, 2023
Black immigrants face more discrimination in the U.S. The source is sometimes surprising, published Sept. 21, 2023
Low wages, lousy shifts, little room for advancement: Immigrant workers describe on-the-job discrimination, published Oct. 19, 2023
‘Everything’s like a gamble’: U.S. immigration policies leave lives in limbo, published Nov. 30, 2023
Column: Are immigrants better off in Texas or California? It’s complicated, published Nov. 30, 2023
Column: Could immigrants be America’s new swing voter group, published Nov. 30, 2023
Medi-Cal will soon be open to all, ‘papers or no papers.’ She wants her neighbors to know, published Dec. 24, 2023
Acknowledgements
KFF would like to thank the Association of Asian Pacific Community Health Organizations, the Black Alliance for Just Immigration, Dr. May Sudhinaraset, the National Immigration Law Center, the National Resource Center for Refugees, Immigrants, and Migrants, and UnidosUS for their invaluable inputs, insights, and suggestions throughout the planning, fielding, and dissemination of this survey project.
Findings
Executive Summary
The Survey of Immigrants, conducted by KFF in partnership with the Los Angeles Times during Spring 2023, examines the diversity of the U.S. immigrant experience. It is the largest and most representative survey of immigrants living in the U.S. to date. With its sample size of 3,358 immigrant adults, the survey provides a deep understanding of immigrant experiences, reflecting their varied countries of origin and histories, citizenship and immigration statuses, racial and ethnic identities, and social and economic circumstances. KFF also conducted focus groups with immigrants from an array of backgrounds, which expand upon information from the survey (see Methodology for more details).
This report provides an overview of immigrants’ reasons for coming to the U.S.; their successes and challenges; their experiences at work, in their communities, in health care settings, and at home; as well as their outlook on the future. Recognizing the diversity within the immigrant population, the report examines variations in the experiences of different groups of immigrants, including by immigration status, income, race and ethnicity, English proficiency, and other factors. Given that this report includes a focus on experiences with discrimination and unfair treatment, data by race and ethnicity are often shown rather than by country of birth. A companion report provides information on immigrants’ health coverage, access to, and use of care, and further reports will provide additional details for other subgroups within the immigrant population, including more data by country of origin.
Key takeaways from this report include:
- Most immigrants – regardless of where they came from or how long they’ve been in the U.S. – say they came to the U.S. for more opportunities for themselves and their children. The predominant reasons immigrants say they came to the U.S. are for better work and educational opportunities, a better future for their children, and more rights and freedoms. Smaller but still sizeable shares cite other factors such as joining family members or escaping unsafe or violent conditions.
- Overall, a majority of immigrants say their financial situation (78%), educational opportunities (79%), employment situation (75%), and safety (65%) are better as a result of moving to the U.S. A large majority (77%) say their own standard of living is better than that of their parents, higher than the share of U.S.-born adults who say the same (51%)1 ,and most (60%) believe their children’s standard of living will be better than theirs is now. Three in four immigrants say they would choose to come to the U.S. again if given the chance, and six in ten say they plan to stay in the U.S. However, about one in five (19%) say they want to move back to the country they were born in or to another country, while an additional one in five (21%) say they are not sure.
- Despite an improved situation relative to their countries of birth, many immigrants report facing serious challenges, including high levels of workplace and other discrimination, difficulties making ends meet, and confusion and fears related to U.S. immigration laws and policies. These challenges are more pronounced among some groups of immigrants, including those who live in lower-income households, Black and Hispanic immigrants, those who are likely undocumented, and those with limited English proficiency. Given the intersectional nature of these factors, some immigrants face compounding challenges across them.
- Most immigrants are employed, and about half of all working immigrants say they have experienced discrimination in the workplace, such as being given less pay or fewer opportunities for advancement than people born in the U.S., not being paid for all their hours worked, or being threatened or harassed. In addition, about a quarter of all immigrants, rising to three in ten of those with college degrees, say they are overqualified for their jobs, a potential indication that they had to take a step back in their careers when coming to the U.S. or lacked career advancement opportunities in the U.S.
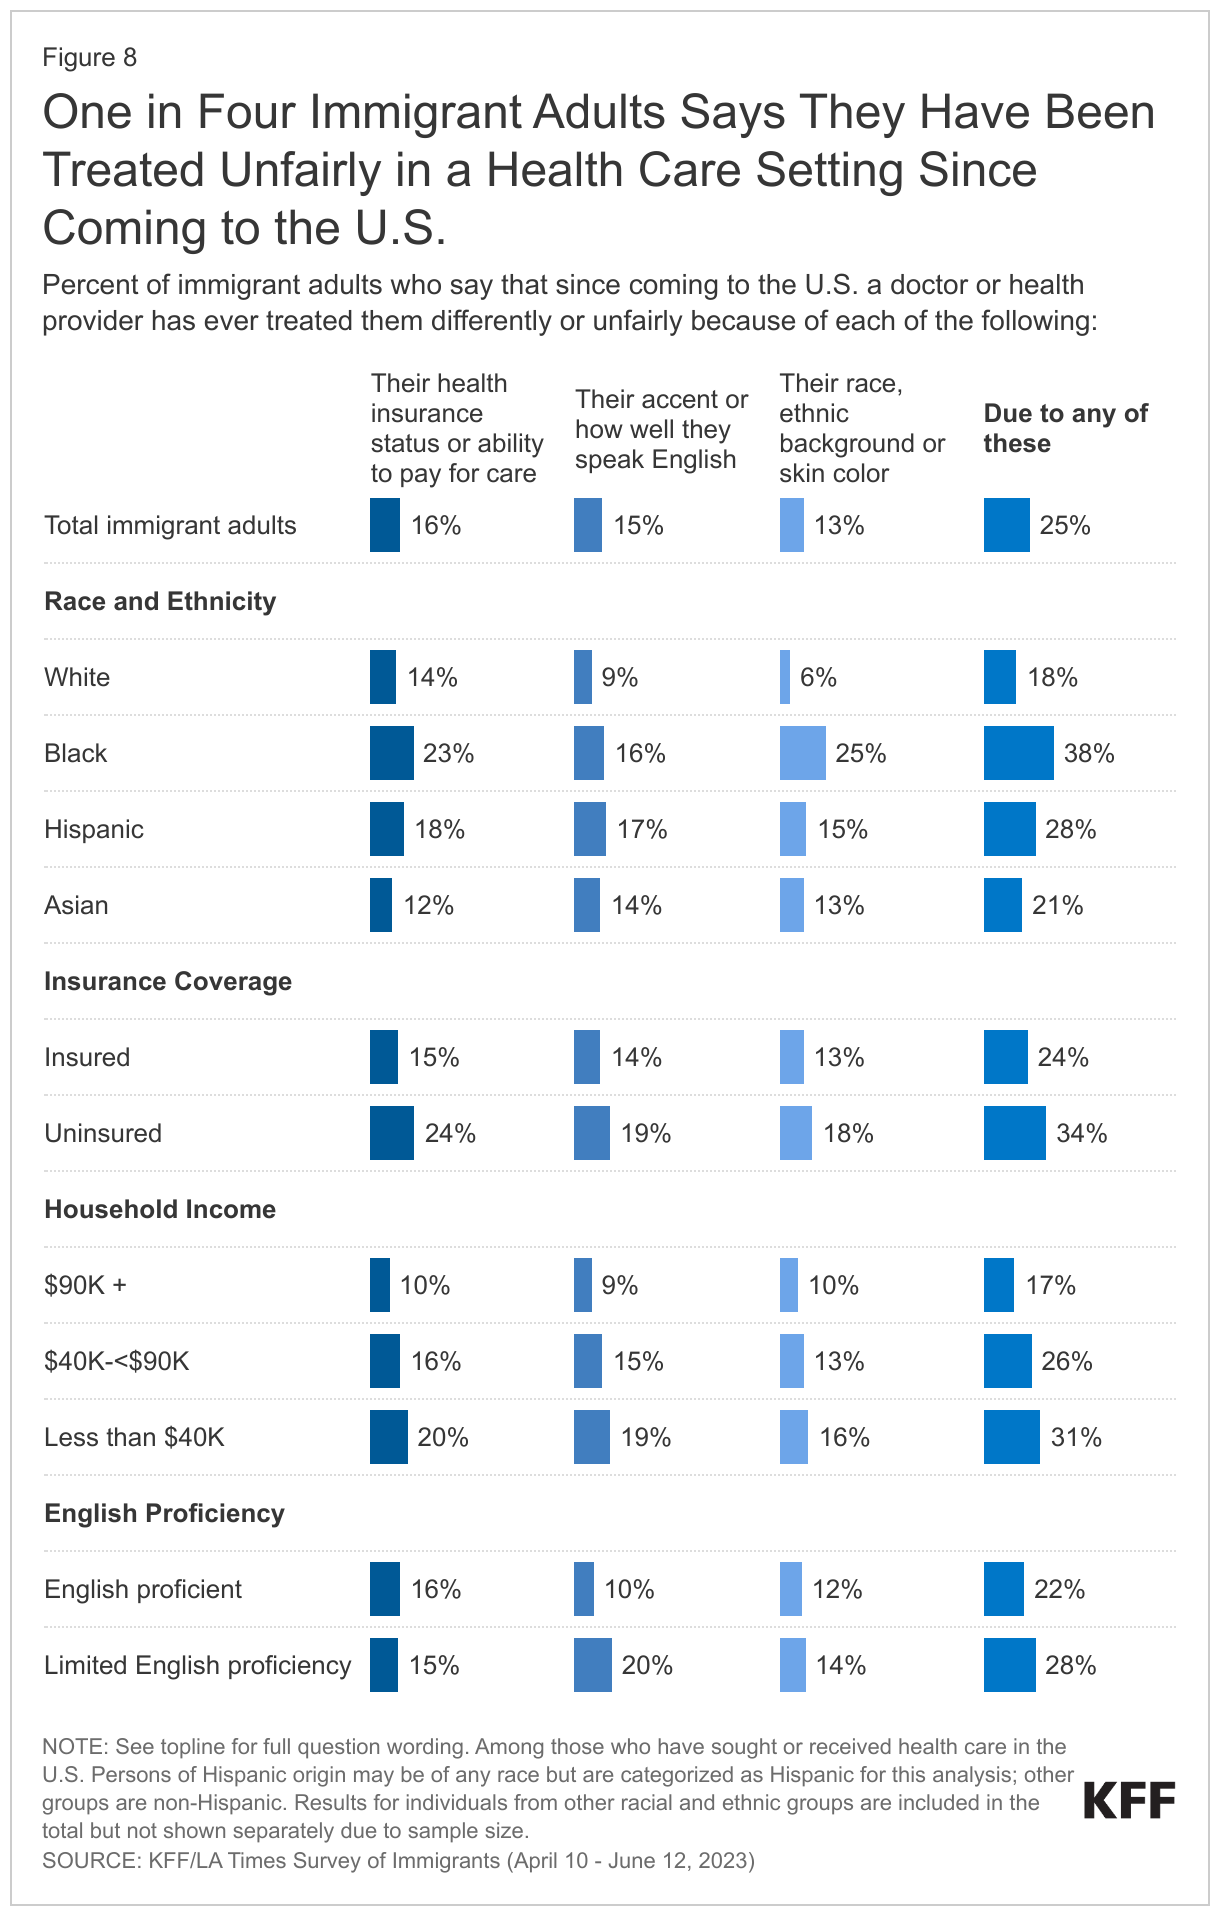
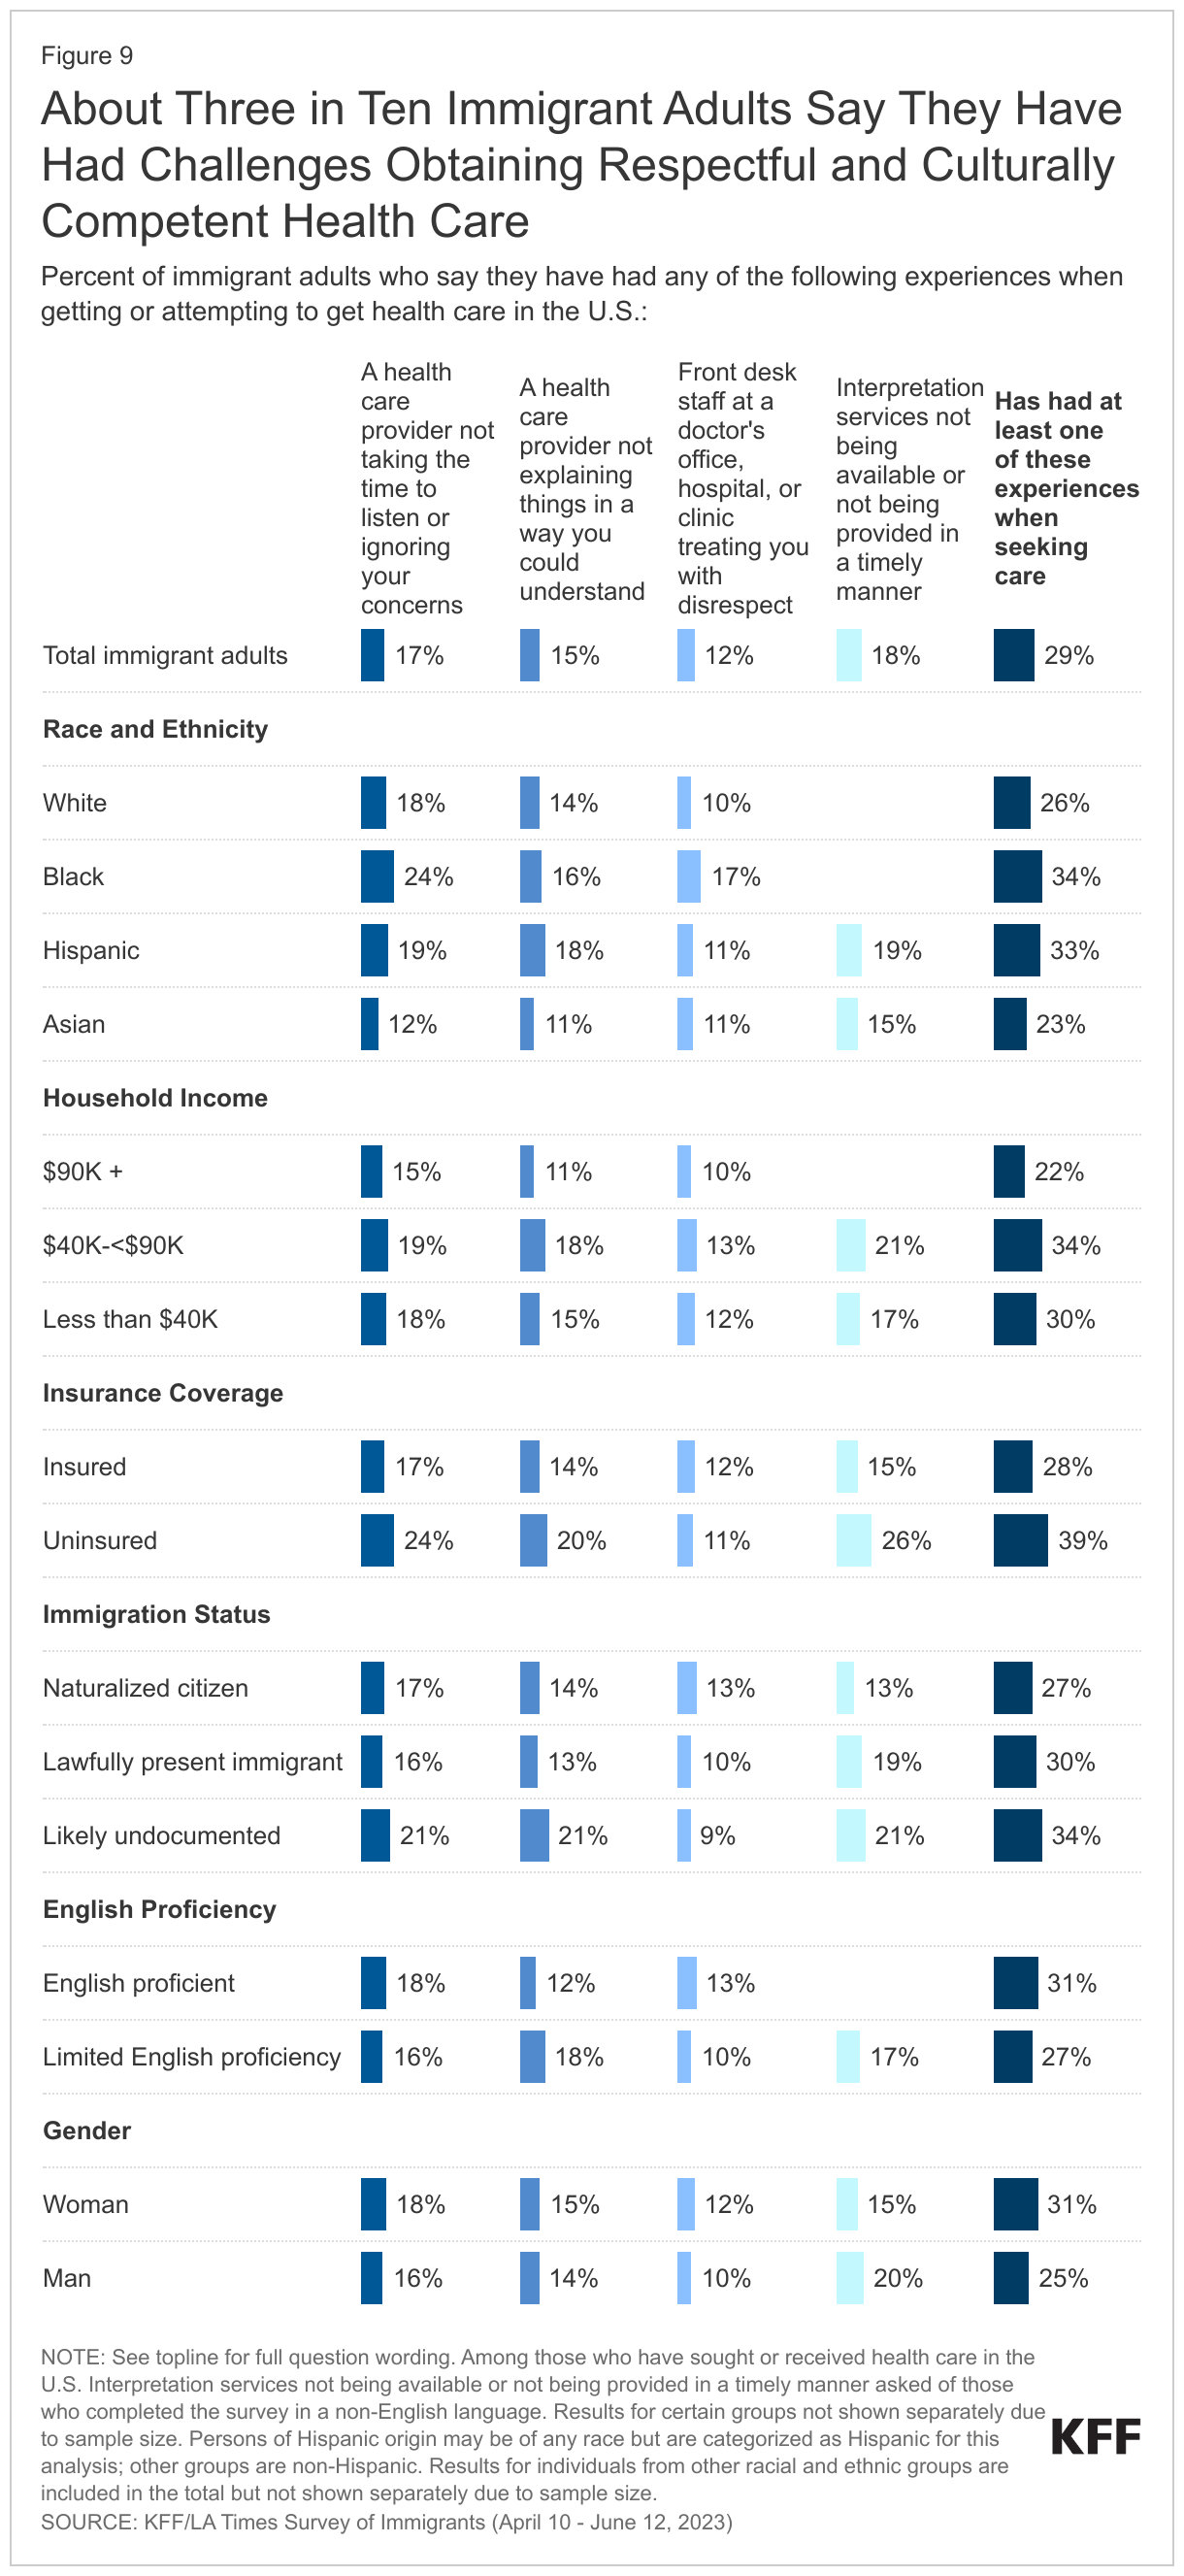
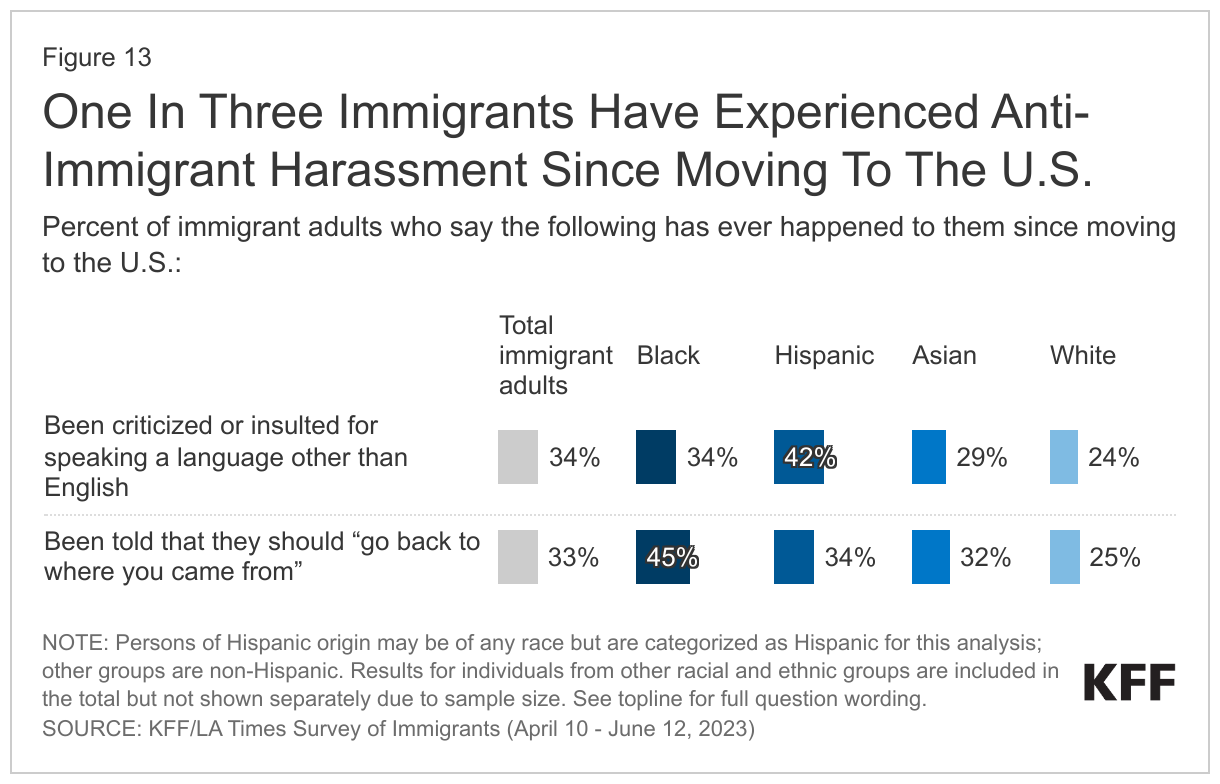
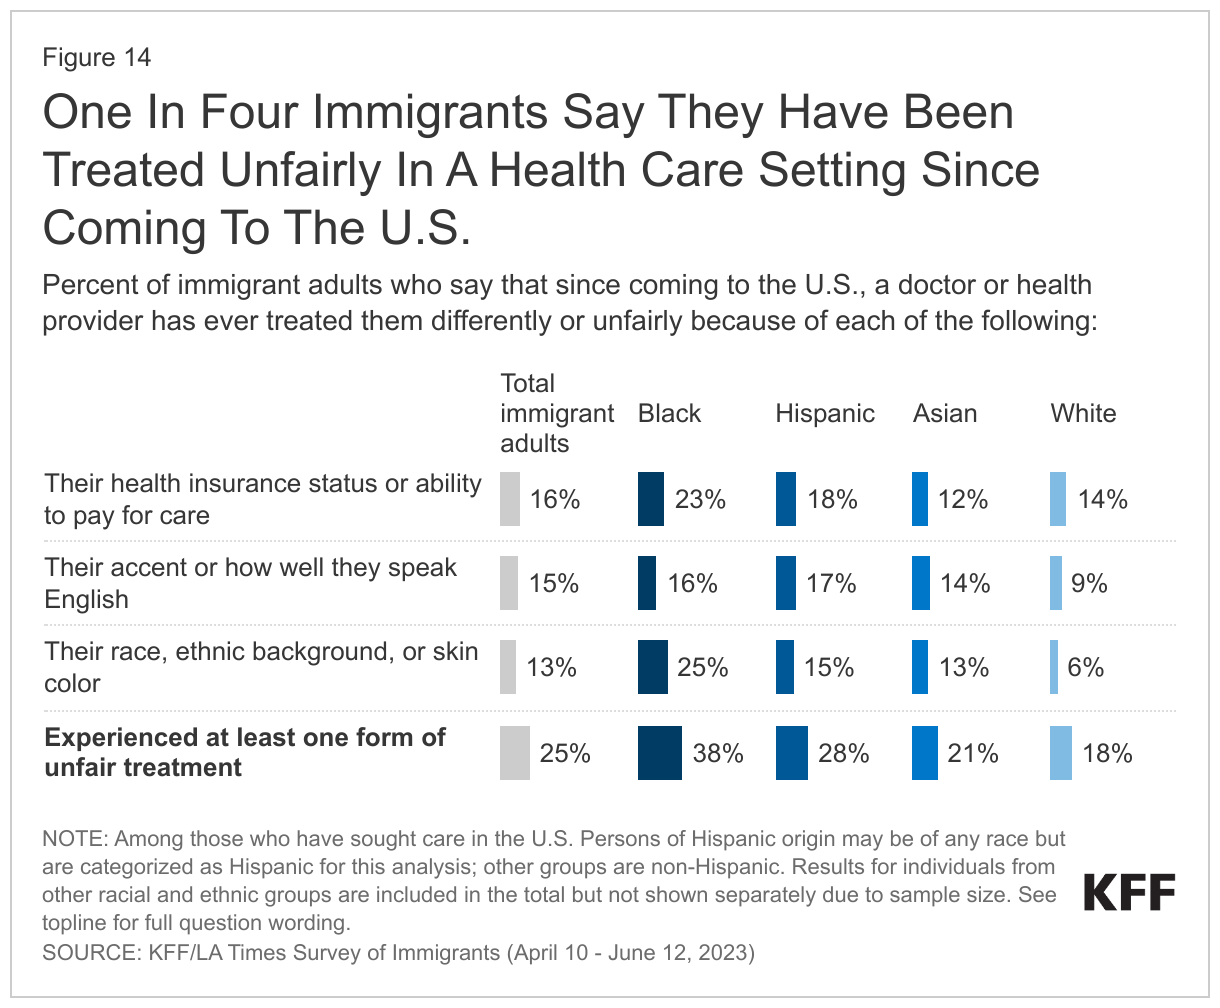
- About a third (34%) of immigrants say they have been criticized or insulted for speaking a language other than English since moving to the U.S., and a similar share (33%) say they have been told they should “go back to where you came from.” About four in ten (38%) immigrants say they have ever received worse treatment than people born in the U.S. in a store or restaurant, in interactions with the police, or when buying or renting a home. Some immigrants also report being treated unfairly in health care settings. Among immigrants who have received health care in the U.S., one in four say they have been treated differently or unfairly by a doctor or other health care provider because of their racial or ethnic background, their accent or how well they speak English, or their insurance status or ability to pay for care.
- Immigrants who are Black or Hispanic report disproportionate levels of discrimination at work, in their communities, and in health care settings. Over half of employed Black (56%) and Hispanic (55%) immigrants say they have faced discrimination at work, and roughly half of college-educated Black (53%) and Hispanic (46%) immigrant workers say they are overqualified for their jobs. Nearly four in ten (38%) Black immigrants say they have been treated unfairly by the police and more than four in ten (45%) say they have been told to “go back to where you came from.” In addition, nearly four in ten (38%) Black immigrants say they have been treated differently or unfairly by a health care provider. Among Hispanic immigrants, four in ten (42%) say they have been criticized or insulted for speaking a language other than English.
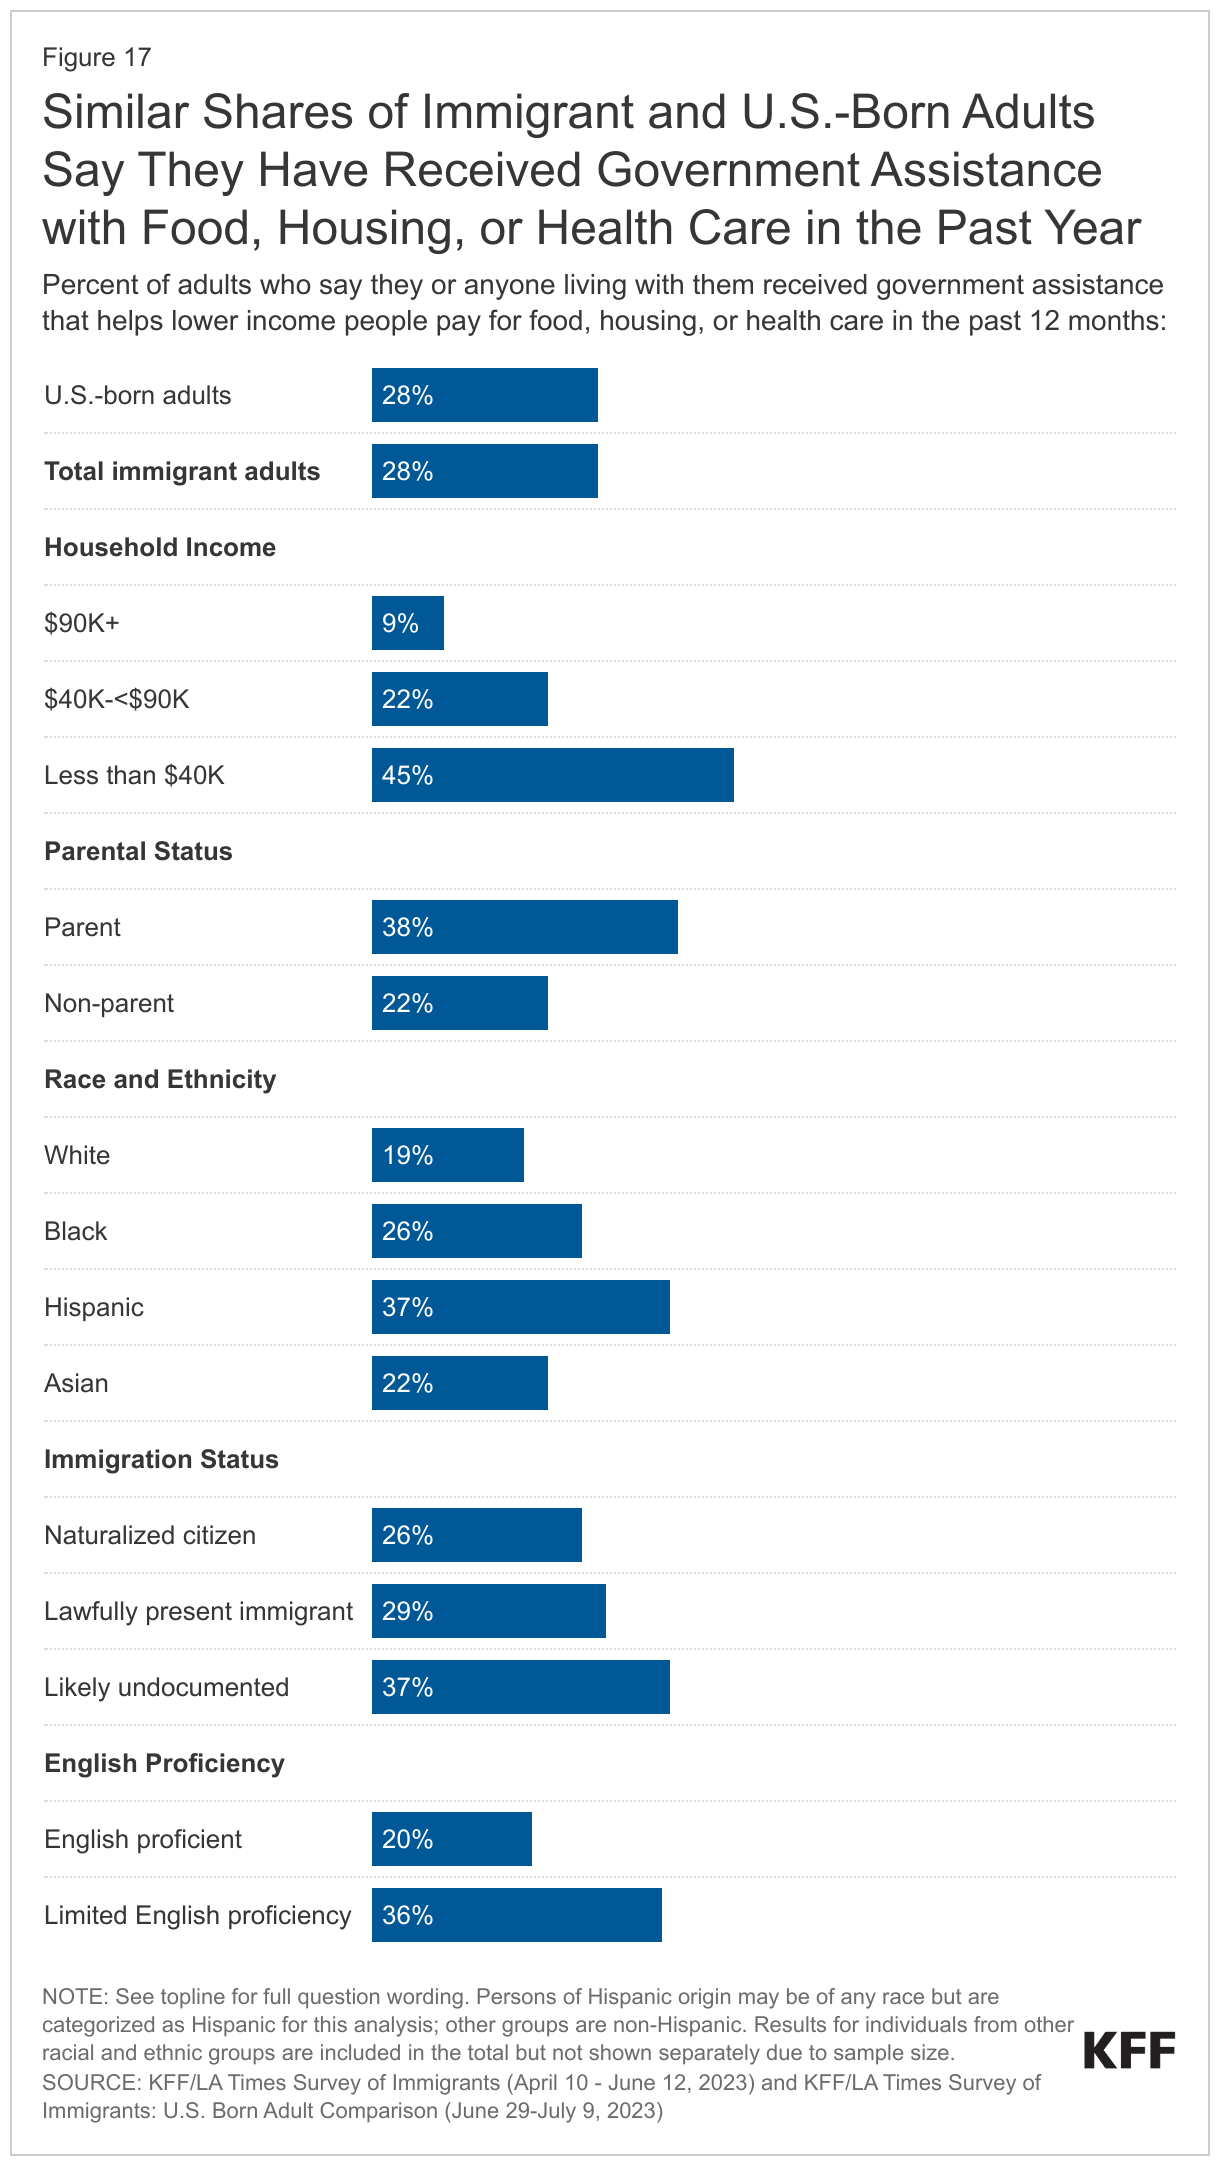
- Even with high levels of employment, one third of immigrants report problems affording basic needs like food, housing, and health care. This share rises to four in ten among parents and about half of immigrants living in lower income households (those with annual incomes under $40,000). In addition, one in four lower income immigrants say they have difficulty paying their bills each month, while an additional 47% say they are “just able to pay their bills each month.”
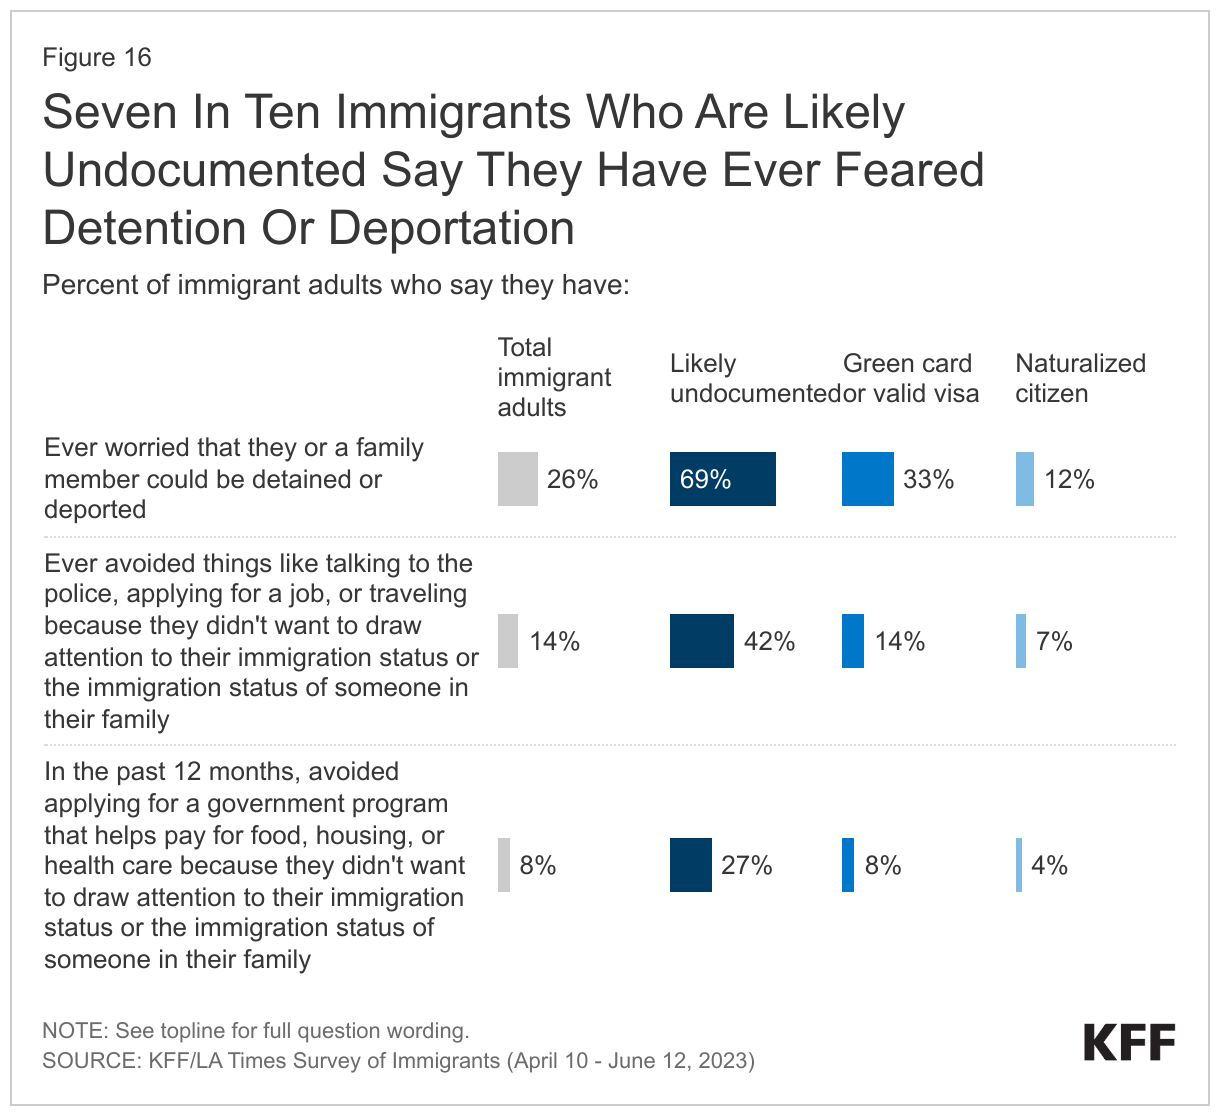
- Among likely undocumented immigrants, seven in ten say they worry they or a family member may be detained or deported, and four in ten say they have avoided things such as talking to the police, applying for a job, or traveling because they didn’t want to draw attention to their or a family member’s immigration status. However, these concerns are not limited to those who are likely undocumented. Among all immigrants regardless of their own immigration status, nearly half (45%) say they don’t have enough information to understand how U.S. immigration laws affect them and their families, and one in four (26%) say they worry they or a family member could be detained or deported. Confusion and lack of information extend to public charge rules. About three quarters of all immigrants, rising to nine in ten among likely undocumented immigrants, say they are not sure whether use of public assistance for food, housing, or health care can affect an immigrant’s ability to get a green card or incorrectly believe that use of this assistance will negatively affect the ability to get a green card.
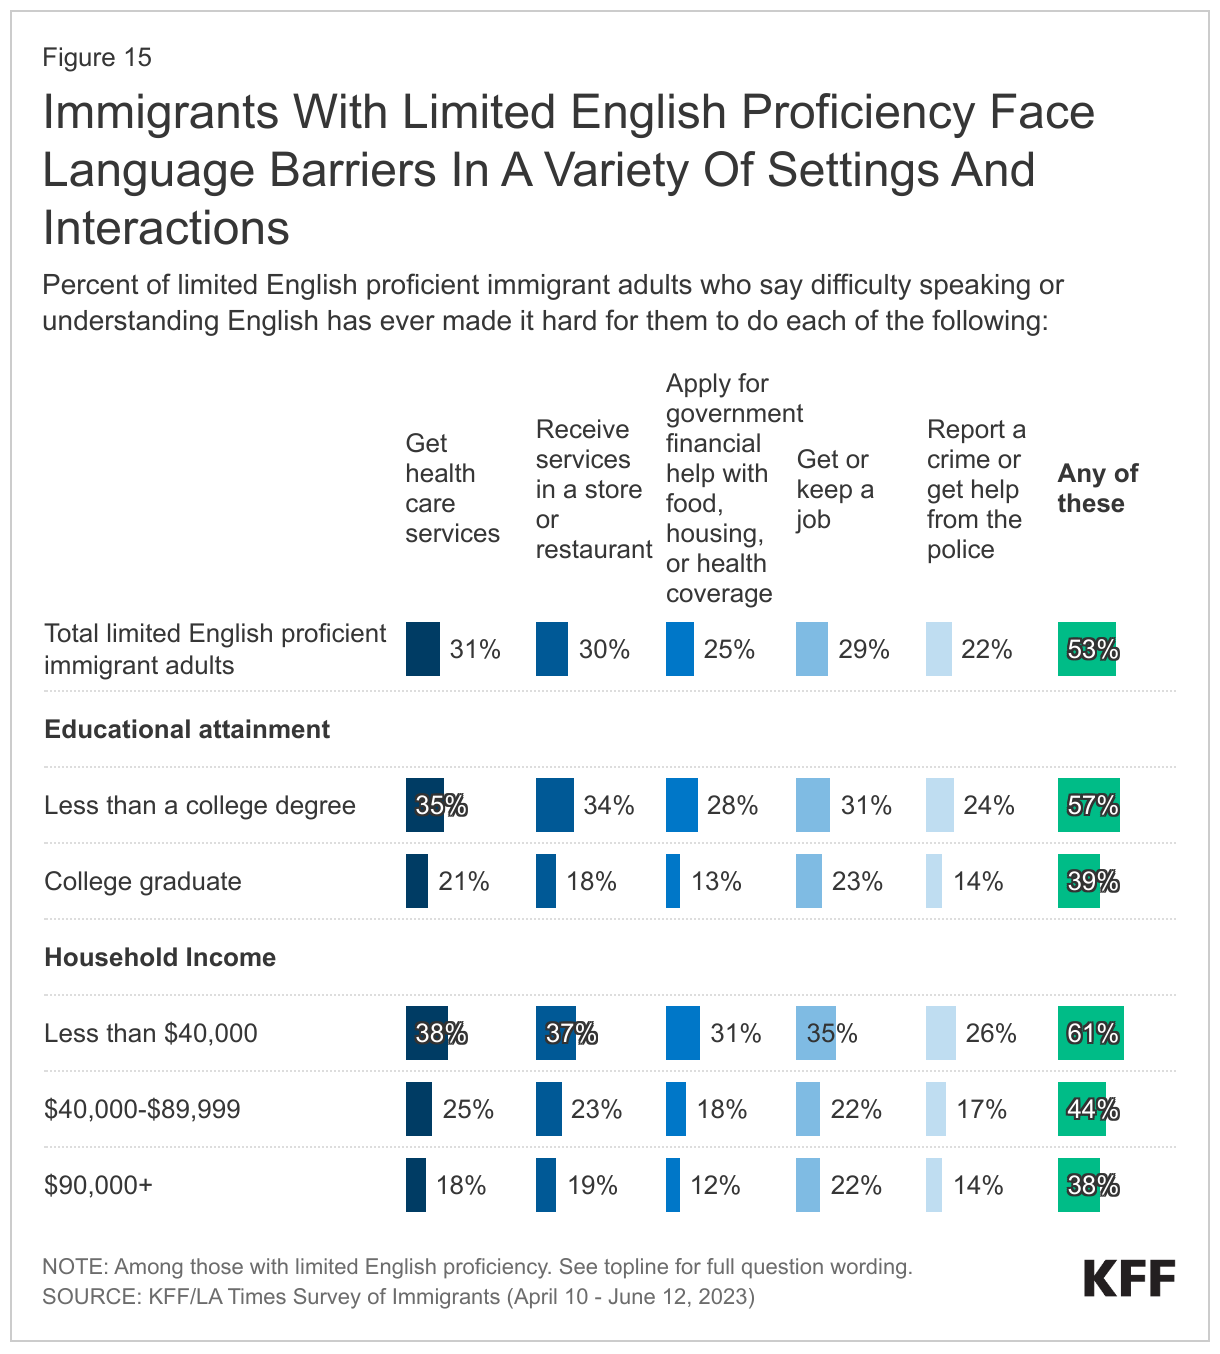
- About half of all immigrants have limited English proficiency, and about half among this group say they have faced language barriers in a variety of settings and interactions. About half (53%) of immigrants with limited English proficiency say that difficulty speaking or understanding English has ever made it hard for them to do at least one of the following: get health care services (31%); receive services in stores or restaurants (30%); get or keep a job (29%); apply for government financial help with food, housing, or health coverage (25%); report a crime or get help from the police (22%). In addition, one-quarter of parents with limited English proficiency say they have had difficulty communicating with their children’s school (24%). Working immigrants with limited English proficiency also are more likely to report workplace discrimination compared to those who speak English very well (55% vs. 41%).
Who Are U.S. Immigrants?
The KFF/LA Times Survey of Immigrants is a probability-based survey that is representative of the adult immigrant population in the U.S. based on known demographic data from federal surveys (see Methodology for more information on sampling and weighting). For the purposes of this project, immigrant adults are defined as individuals ages 18 and over who live in the U.S. but were born outside the U.S. or its territories.
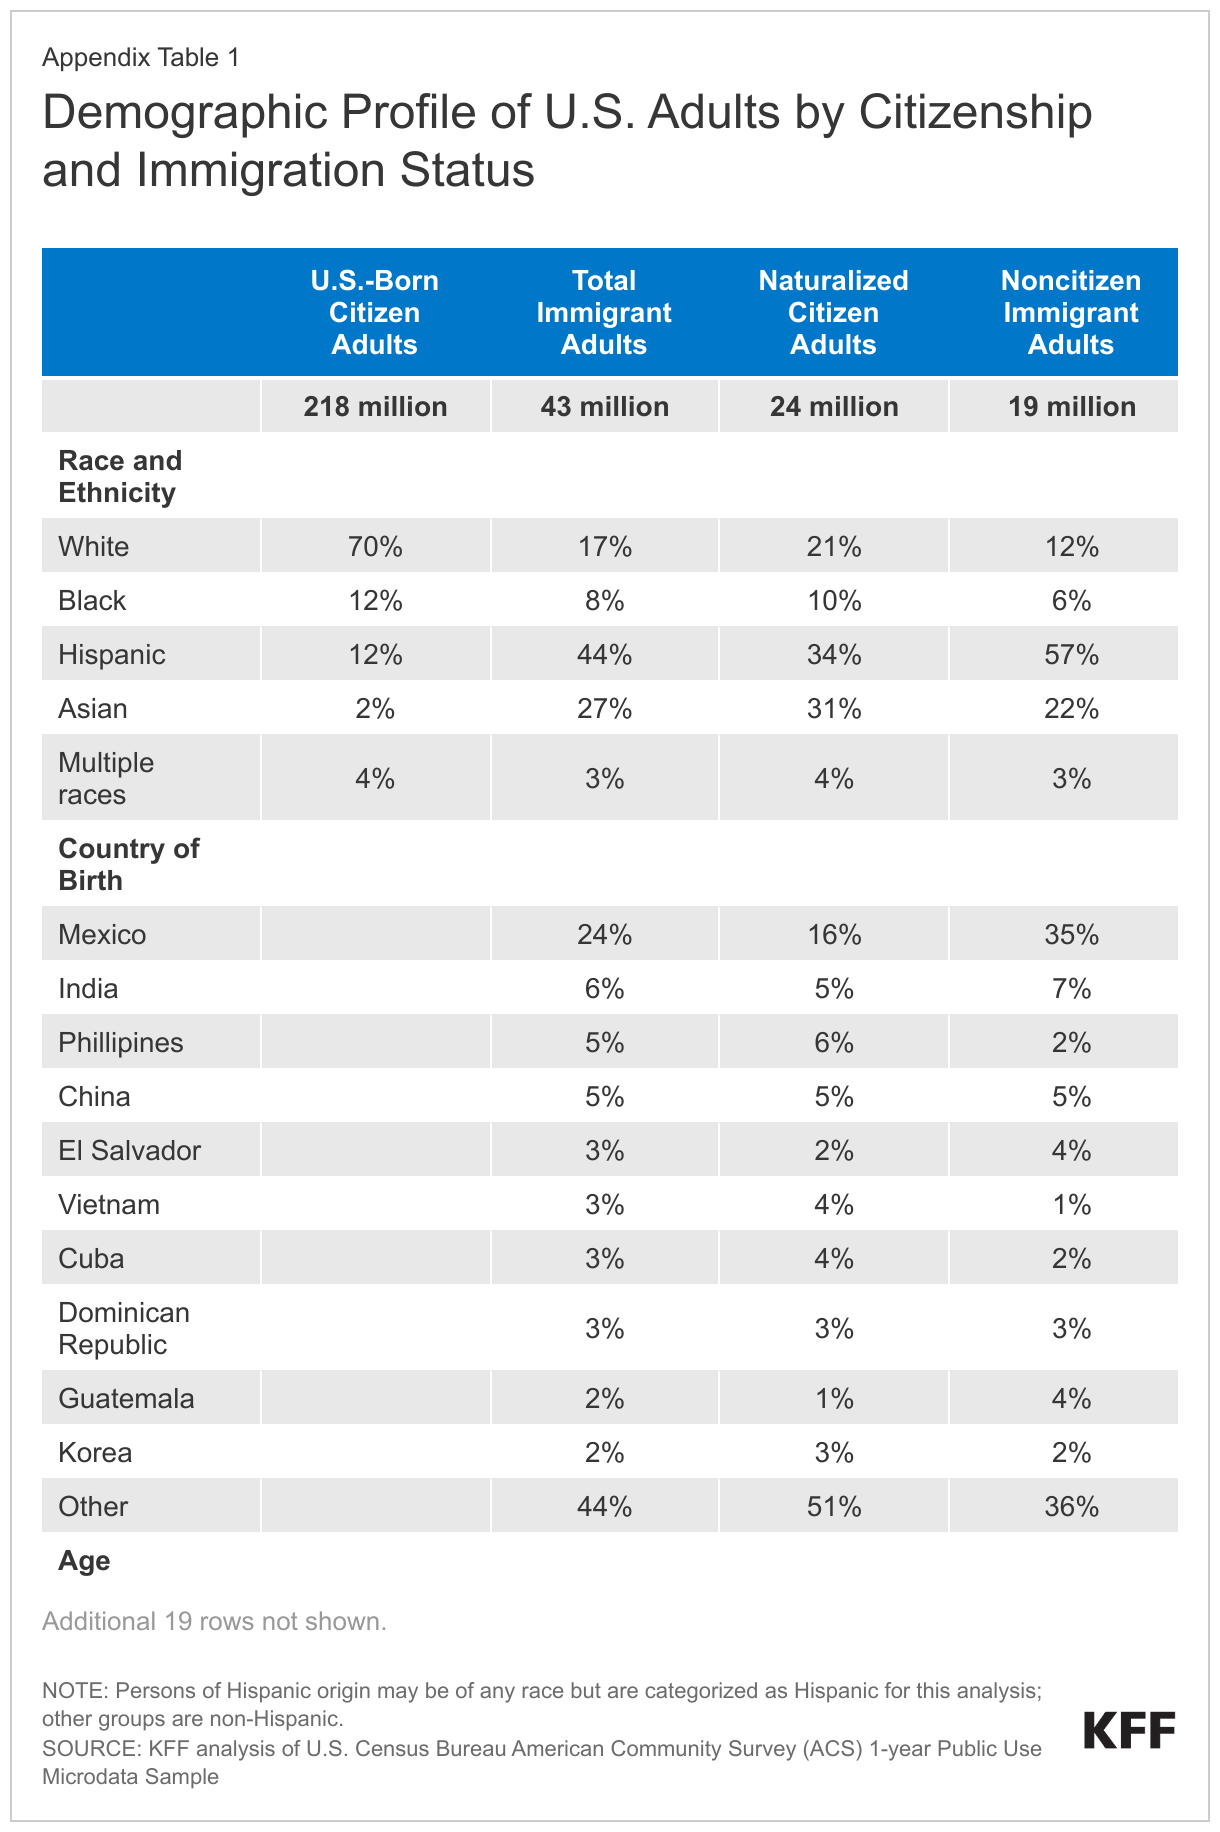
According to 2021 federal data, immigrants make up 16% of the U.S. adult population (ages 18+). About four in ten immigrant adults identify as Hispanic (44%), over a quarter are Asian (27%), and smaller shares are White (17%), Black (8%), or report multiple races (3%). The top six countries of origin among adult immigrants in the U.S. are Mexico (24%), India (6%), China (5%), the Philippines (5%), El Salvador (3%), and Vietnam (3%) although immigrants hail from countries across the world.
The immigrant adult population largely mirrors the U.S.-born adult population in terms of gender. While similar shares of U.S.-born and immigrant adults have a college degree, immigrant adults are substantially more likely than U.S.-born adults to have less than a high school education. About four in ten (40%) immigrants are parents of a child under 18 living in their household, and a quarter (25%) of children in the U.S. have an immigrant parent.
Slightly less than half (47%) of immigrant adults report having limited English proficiency, meaning they speak English less than very well. Regardless of ability to speak English, a large majority (83%) of immigrants say they speak a language other than English at home, including about four in ten (43%) who speak Spanish at home.
A majority (55%) of U.S. adult immigrants are naturalized citizens. The remaining share are noncitizens, including lawfully present and undocumented immigrants. KFF analysis based on federal data estimates that 60% of noncitizens are lawfully present and 40% are undocumented.2
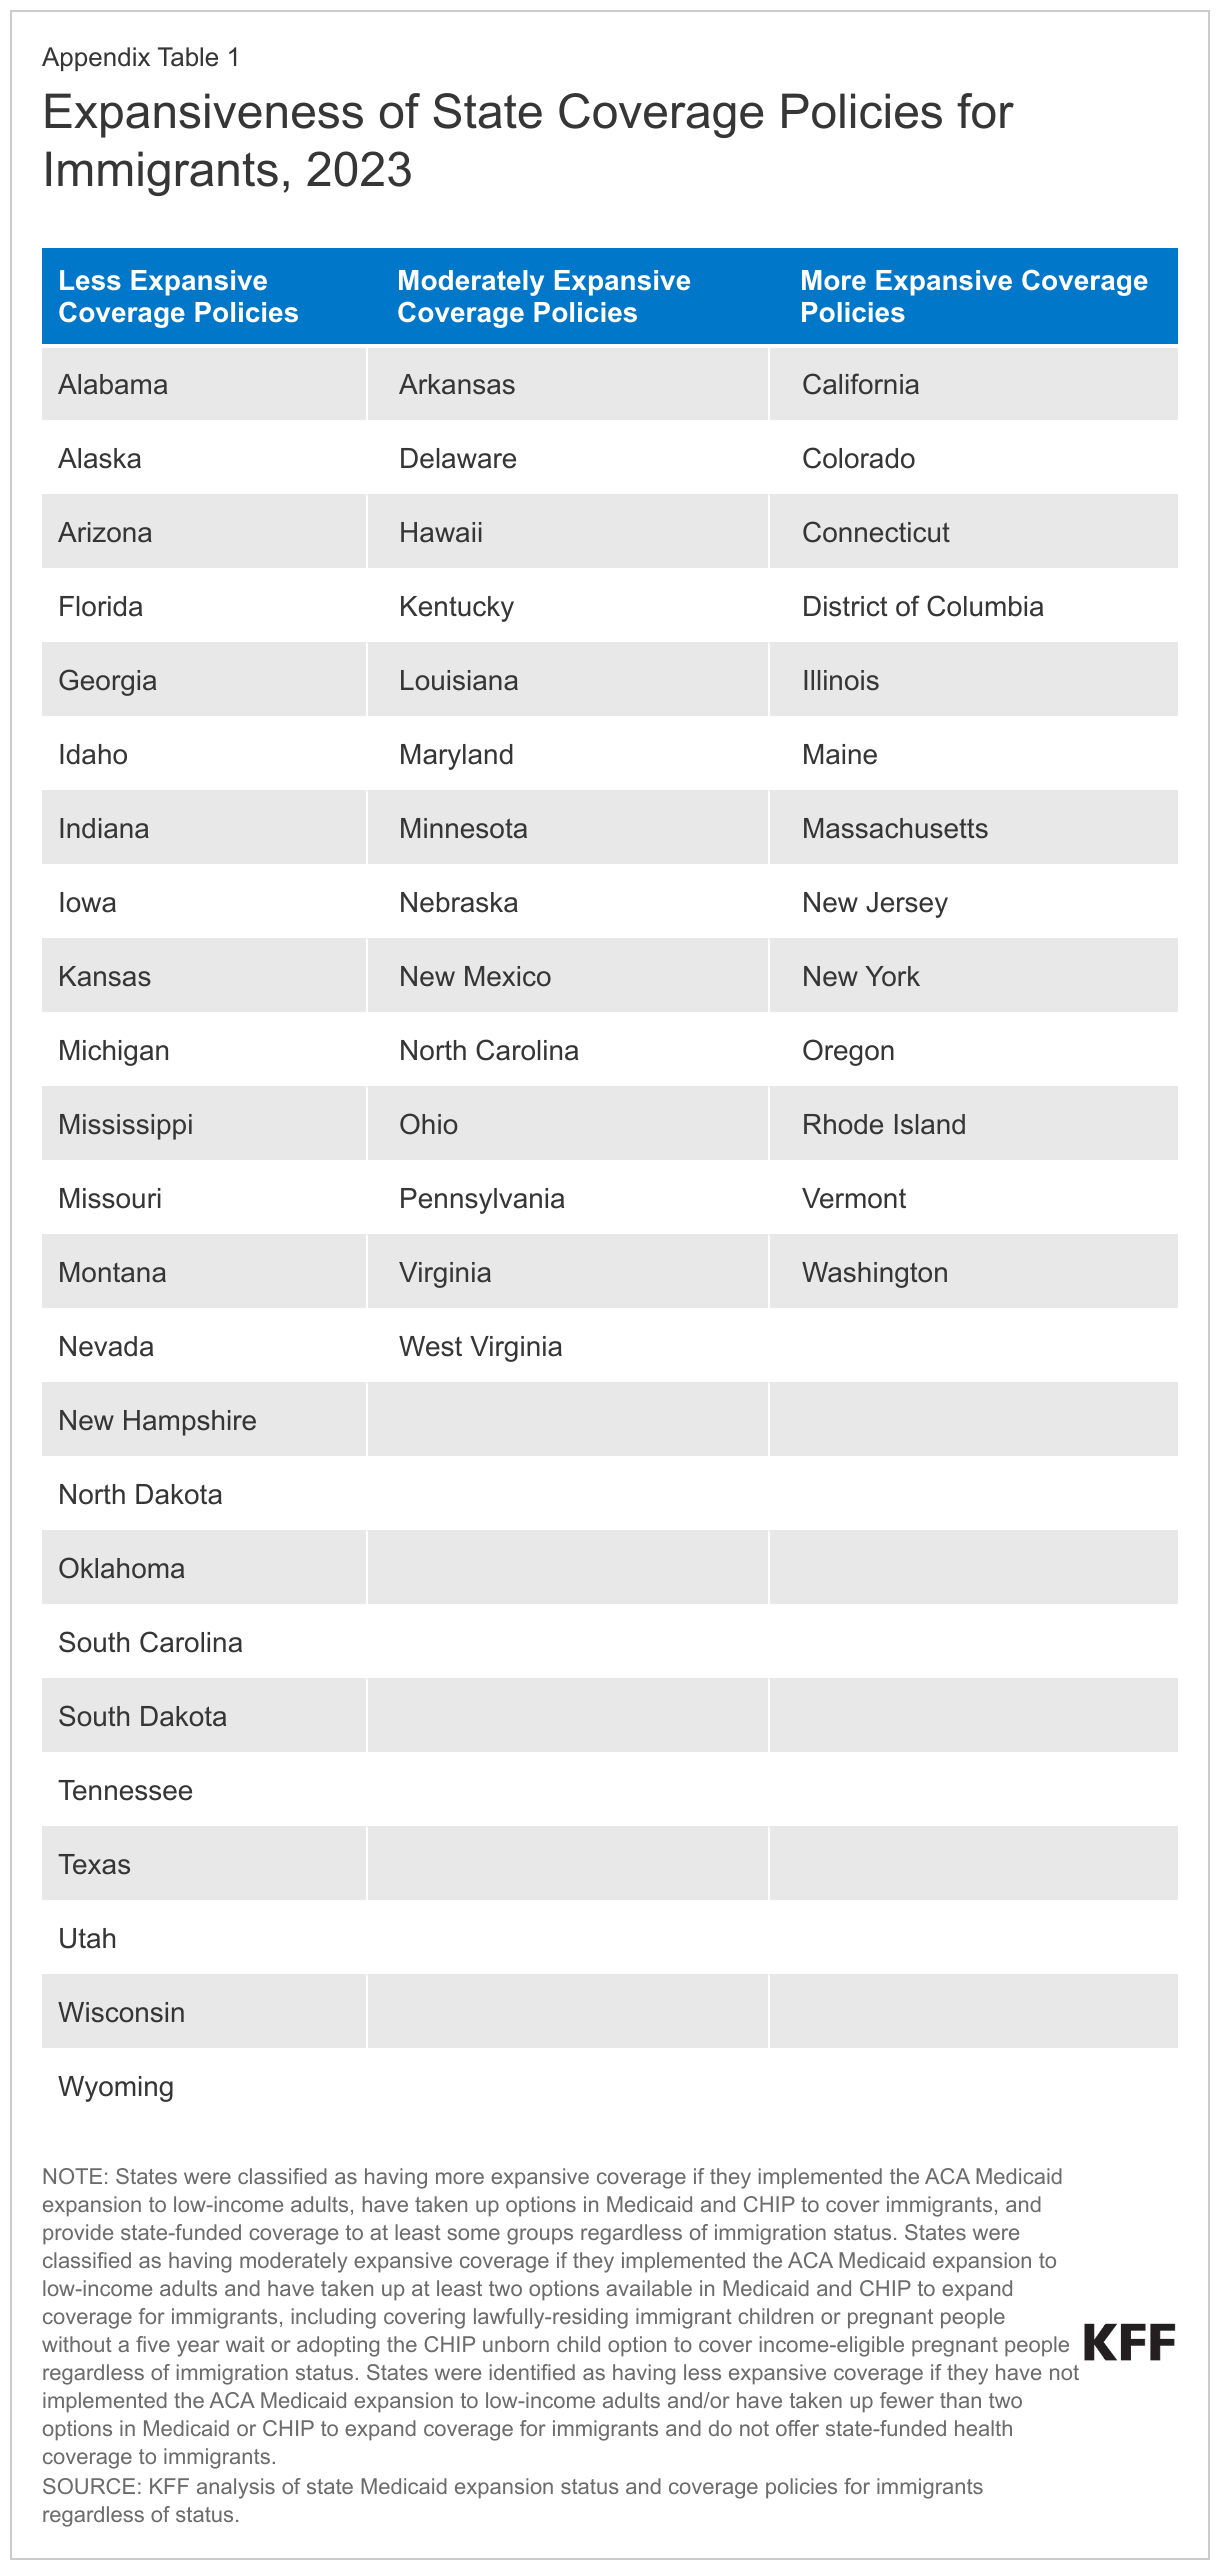
See Appendix Table 1 for a table of key demographics about the U.S. adult immigrant population compared to the U.S.-born adult population.
Key Terms Used In This Report
Limited English Proficiency: Immigrants are classified as having Limited English Proficiency if they self-identify as speaking English less than “very well.”
Immigration Status: Immigrants are classified by their self-reported immigration status as follows:
- Naturalized Citizen: Immigrants who said they are a U.S. citizen.
- Green Card or Valid Visa: Immigrants who said they are not a U.S. citizen, but currently have a green card (lawful permanent status) or a valid work or student visa.
- Likely Undocumented Immigrant: Immigrants who said they are not a U.S. citizen and do not currently have a green card (lawful permanent status) or a valid work or student visa. These immigrants are classified as “likely undocumented” since they have not affirmatively identified themselves as undocumented.
Race and Ethnicity: Data are reported for four racial and ethnic categories: Hispanic, Black, Asian, and White based on respondents’ self-reported racial and ethnic identity. Persons of Hispanic origin may be of any race but are categorized as Hispanic for this analysis; other groups are non-Hispanic. Results for individuals in other groups are included in the total but not shown separately due to sample size restrictions. Given that this report includes a focus on experiences with discrimination and unfair treatment, we often show data by race and ethnicity rather than country of birth. Given variation of experiences within these broad racial and ethnic categories, further reports will provide additional details for subgroups within racial and ethnic groups, including more data by country of origin.
Educational Attainment: These data are based on the highest level of education completed in the U.S. and/or in other countries as self-reported by the respondent. The response categories offered were: did not graduate high school, high school graduate with a diploma, some college (including an associate degree), university degree (bachelor’s degree), and post-graduate degree (such as Master’s, PhD, MD, JD).
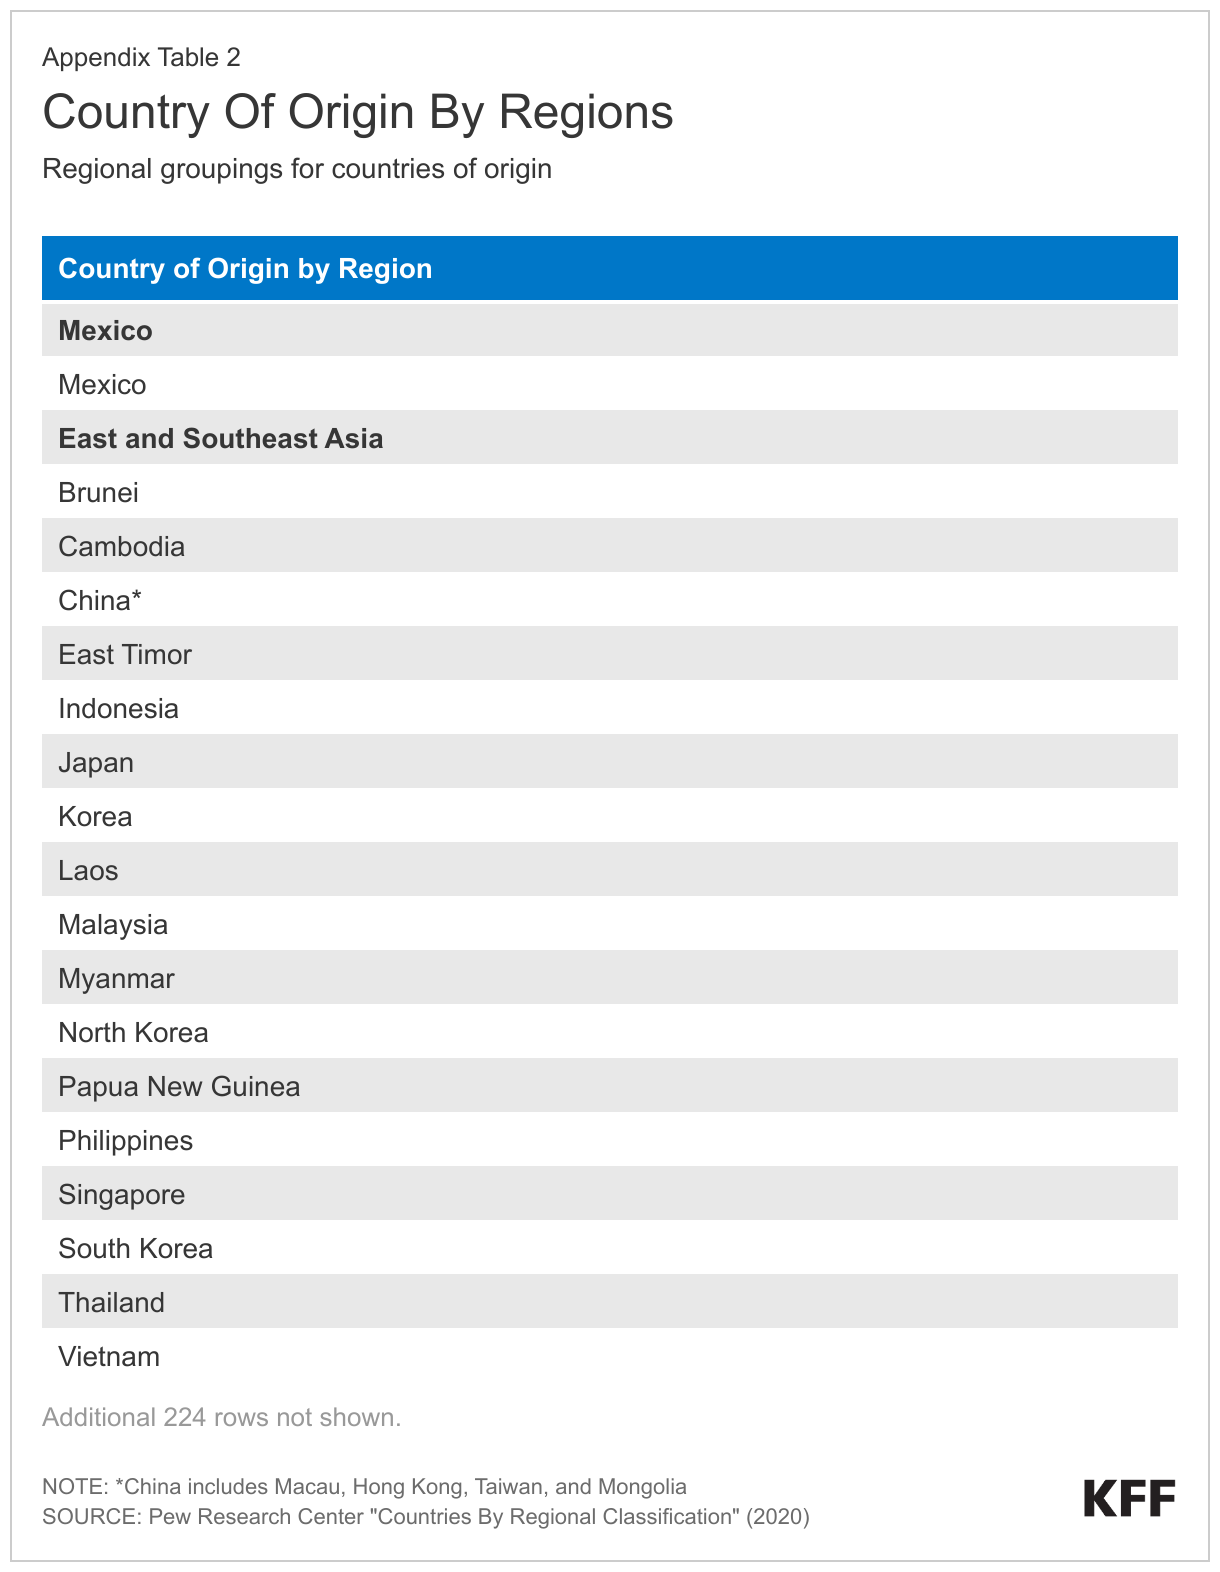
Country of Birth: “Country of birth” is classified based on respondents’ answer to the question “In what country were you born?” In some cases, countries are grouped into larger regions. See Appendix Table 2 for a list of regional groupings.
Why Do Immigrants Come to The U.S. And How Do They Feel About Their Life in the U.S.?
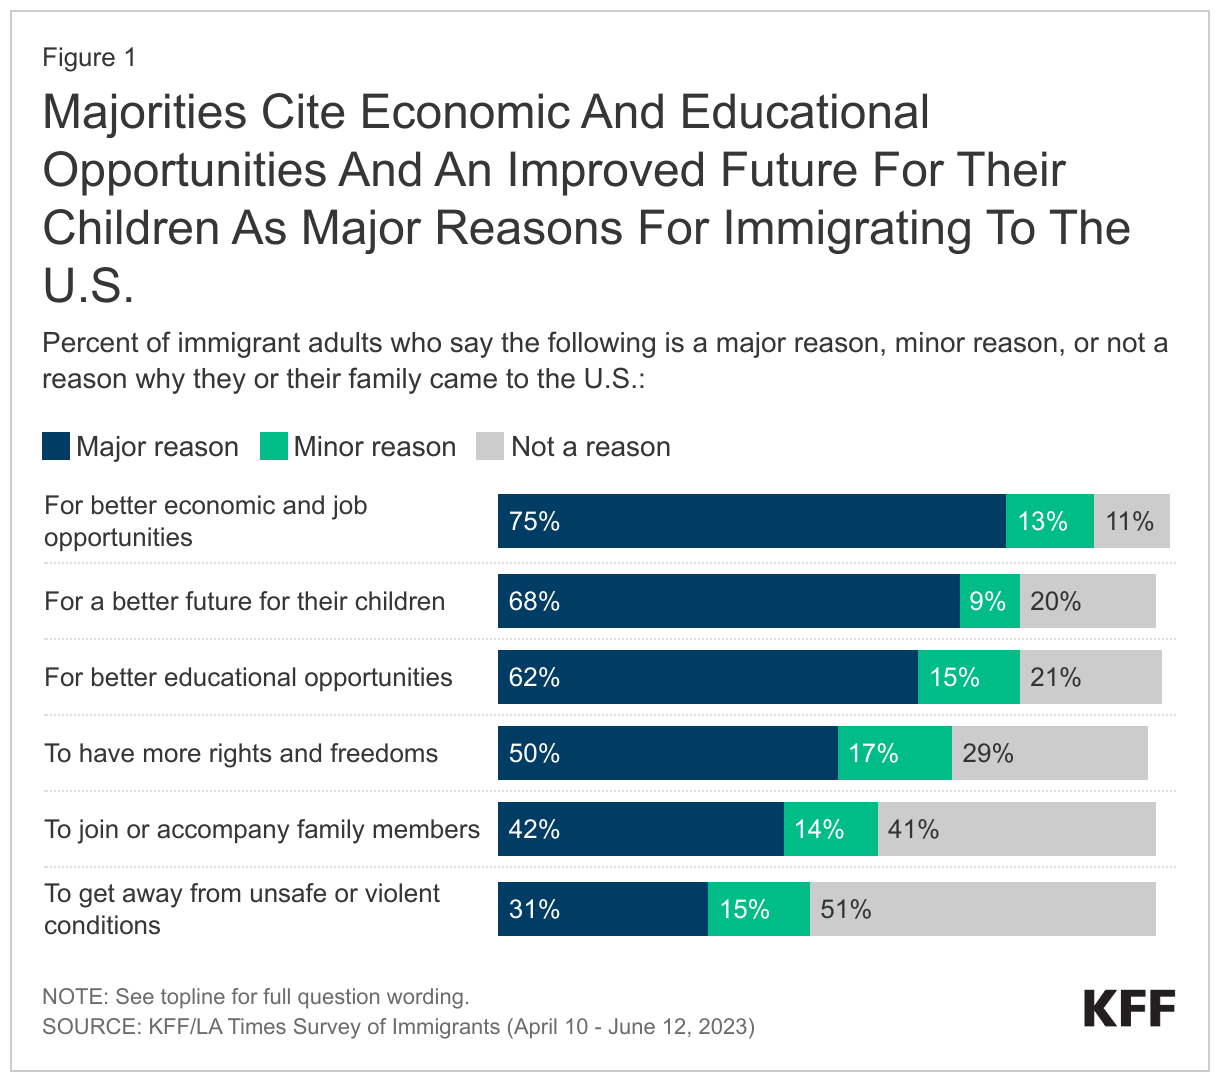
Immigrants cite both push and pull factors as reasons for coming to the U.S. For most immigrants, their major reasons for coming to the U.S. are aspirational, such as seeking better economic and job opportunities (75% say this is a major reason they came to the U.S.), a better future for their children (68%), and for better educational opportunities (62%). Half of immigrants say a major reason they or their family came to the U.S. was to have more rights and freedoms, including about three-quarters of immigrants from Central America (73%). Smaller but sizeable shares say other factors such as joining family members (42%) or escaping unsafe or violent conditions (31%) were major reasons they came. The share who cites escaping unsafe conditions as a major reason for coming to the U.S. rises to about half of likely undocumented immigrants (51%) and about six in ten (59%) immigrants from Central America.
In Their Own Words: Reasons for Coming to the U.S. from Focus Group Participants
Stories focus group participants told of why they came to the U.S. reflect the survey responses. While many pointed to economic and educational opportunities, some described leaving harsh economic and unsafe conditions in their home countries.
“I came to the U.S. hoping that my children will have better educational opportunity.” – 58-year-old Vietnamese immigrant woman in California
“[My husband] came here, and I followed him. So, he came, and I came with the kids afterwards…so we could have a better life. It’s not easy…we wanted to have…better opportunities for our children, for ourselves.” – 46-year-old Ghanian immigrant woman in New Jersey
“The thing is that there are more opportunities, and the standard of living is much better. We can make ends meet even through manual labor. That is not possible in Vietnam.” – 33-year-old Vietnamese immigrant man in Texas
“Then, my mom had to make a decision because the gangs took control of her place. They started asking for rent, extorting her life. If she didn’t pay the extortion, the rent, they were going to take me, or my siblings, or her. …since I was the oldest, she brought me, making the sacrifice of leaving behind my two siblings.” – 25-year-old Salvadorian immigrant man in California
“Actually, it wasn’t my decision to come. I left when I was 13 years old, fleeing from my country because I had a death threat, along with my eight-year-old sister. I didn’t want to come.” – 20-year-old Honduran immigrant woman in California
“Because of the earthquake, you know, I lost my house, and I wanted to go to a country with more opportunities and I came here.” – 30-year-old Haitian immigrant man in Florida
Most immigrants say moving to the U.S. has provided them more opportunities and improved their quality of life. When the survey asked immigrants to describe in their own words the best thing that has come from moving to the U.S., many similar themes arise: better opportunities, a better life in general, or a better future for their children are top mentions, as are education and work opportunities.
In Their Own Words: The Best Thing That Has Come From Moving To The U.S.
In a few words, what is the best thing that has come from you moving to the U.S.?
“Educational opportunities, economic opportunities, political and human rights, housing, food and basic needs, neighborhood safety, lower crime rates”- 28 year old Mexican immigrant woman in Nebraska
“Best education for my kids. Professional job. Healthy environment. Good system. The opportunities everywhere!” – 67-year-old Nepalese immigrant man in Maryland
“Better job, education, and economic opportunities” – 48-year-old Indian immigrant woman in North Carolina
“Education and improved quality of life in terms of obtaining basic needs” – 39-year-old Dominican immigrant woman in New Jersey
“Stability, freedom, better finance[s], having the opportunity to have a family” – 32-year-old Venezuelan immigrant man in New York
“Educational and employment opportunities for myself and my children” – 60-year-old Filipino immigrant woman in California
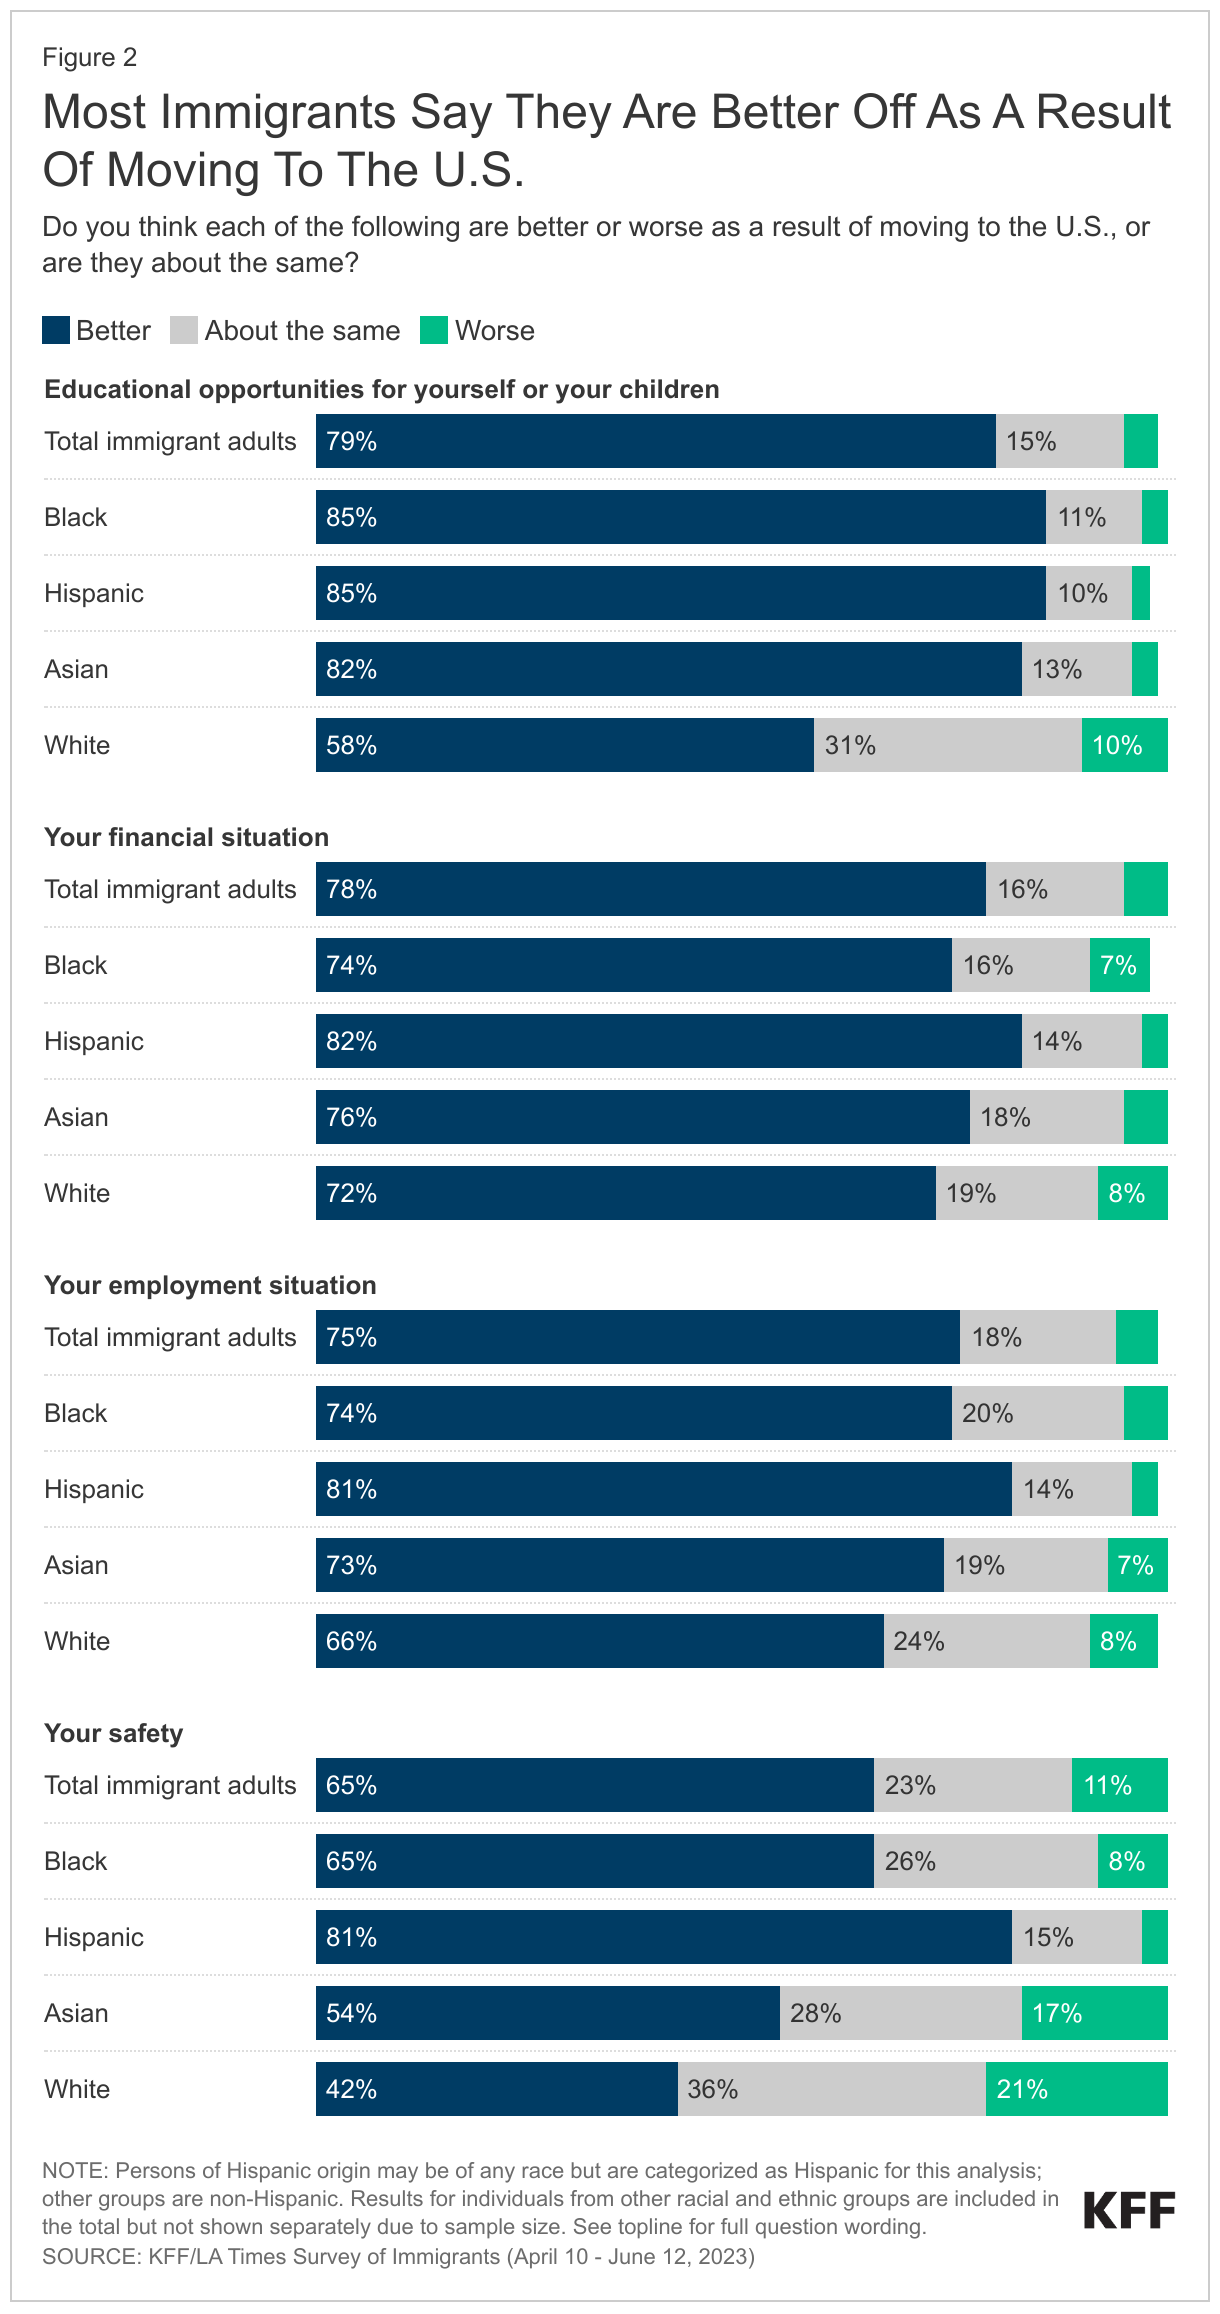
Most immigrants feel that moving to the U.S. has made them better off in terms of educational opportunities (79%), their financial situation (78%), their employment situation (75%), and their safety (65%). Safety stands out as an area where somewhat fewer –though still a majority–immigrants say they’re better off, particularly among White and Asian immigrants. A bare majority (54%) of Asian immigrants and fewer than half (42%) of White immigrants say their safety is better as a result of moving to the U.S., while about one in five in both groups (17% of Asian immigrants and 21% of White immigrants) say they are less safe as a result of coming to the U.S.
In Their Own Words: Safety Concerns In The U.S. From Focus Group Participants
In focus groups, some participants pointed to concerns about guns, drugs, and safety in the U.S., particularly in their children’s schools.
“Sometimes when you see on the television and they’re talking about shooting and these types of things. In Ghana we don’t have that—it’s safe, you walk around, you’re free.” – 38-year-old Ghanian immigrant woman in New Jersey
“I take my kids to school because, really, you have to go to school. But if I could have them at home and homeschool them, I’d do it. I wouldn’t let them go because I don’t feel safe anymore.” – 51-year-old Salvadorian immigrant man in California
“I’m from Mexico, and over there, you have to struggle to get a gun. Here, you can buy a gun like you’re buying candy at Walmart or somewhere.” – 37-year-old Mexican immigrant man in Texas
“Because in my children’s school, there are a lot of drugs found in its restrooms. …There is so much temptation for drugs here. It is not that safe.” – 49-year-old Vietnamese immigrant woman in Texas
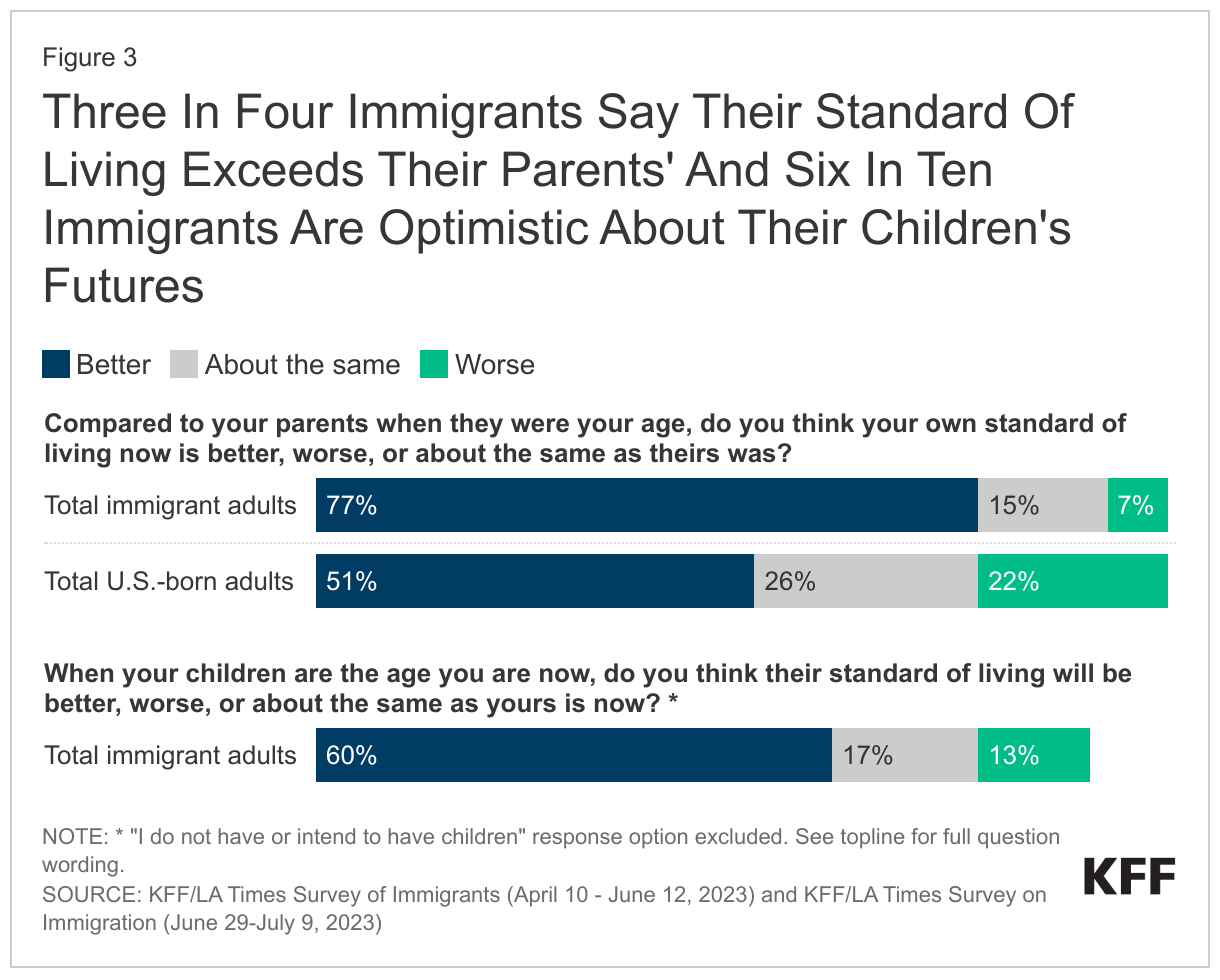
Most immigrants say they are better off compared with their parents at their age, and most are optimistic about their children’s future. When asked about their standard of living, three quarters (77%) of immigrants say their standard of living is better than their parents’ was at their age. This is substantially higher than the share of U.S.-born adults who say the same (51%). Many expect an even better future for their children. Six in ten immigrants believe their children’s standard of living will be better than theirs is now, with much smaller shares saying they think it will be worse (13%) or about the same (17%). Most immigrant parents also have positive feelings about the education their children are receiving. About three in four (73%) immigrant parents rate their child’s school as either “excellent” (35%) or “good” (38%), with a further one-sixth (17%) saying the school is “fair,” and 3% give it a “poor” rating.
In Their Own Words: Hopes For Their Children’s Future From Focus Group Participants
In focus groups, many participants described hopes and dreams for their children’s futures, which often center on improved educational and job opportunities. Some pointed to sacrifices they were making in their own lives for the future benefit of the children.
“I am old, so I came here for my children. That is the thing– We must pay dearly for it when we first came here, but since then, we have seen that life here is wonderful.” – 59-year-old Vietnamese immigrant man in California
“I want my daughter to achieve what I couldn’t…I want her to be better, so she doesn’t have to go through what I went through” – 32-year-old Mexican immigrant woman in California
“…I will not change anything for my kids or for myself. I think it didn’t work out like I expected to do, but I don’t regret it because my kids have the better chance to have a better education system.” – 42-year-old Ghanian immigrant woman in California
“These children, they were born there; they have the opportunity; they get the opportunity, they go to school for free; they get food when they get food; they don’t have these problems. I can say yes, their lives are better than before the life I had.” – 48-year-old Haitian immigrant woman in Florida
How Are Immigrants Faring Economically?
Like many U.S. adults overall, immigrants’ biggest concerns relate to making ends meet: the economy, paying bills, and other financial concerns. When asked in the survey to name the biggest concern facing them and their families in their own words, about one-third of immigrants gave answers related to financial stability or other economic concerns. No other concern rose to the level of financial concerns, though other common concerns mentioned include health and medical issues, safety, work and employment issues, and immigration status.
In Their Own Words: Biggest Concerns Facing Immigrant Families Are Economic
In a few words, what is the biggest concern facing you and your family right now?
“Low income, hard to survive as day to day cost of living is going up” – 65 year old Colombian immigrant man in Texas
“There are a lot of expenses. Groceries and gas prices are at a high price. It gets overwhelming with all the bills and trying to save money in this economy right now.” – 50-year-old Pakistani immigrant man in California
“High prices for rents and new homes” – 55-year-old Congolese immigrant man in Florida
“Retirement– will I need to keep working until I die?” – 64-year-old Dutch immigrant man in Colorado
“Biggest concern is with the inflation. It’s hard to keep up with buying groceries, gas paying the bills paying the mortgage and trying to live paycheck to paycheck worrying about if you’re gonna be able to afford paying the next bill.” – 35-year-old Mexican immigrant man in Nevada
“The house payment. The interest. Everything is really expensive. The food and the university for my son.” – 51-year-old Mexican immigrant woman in California
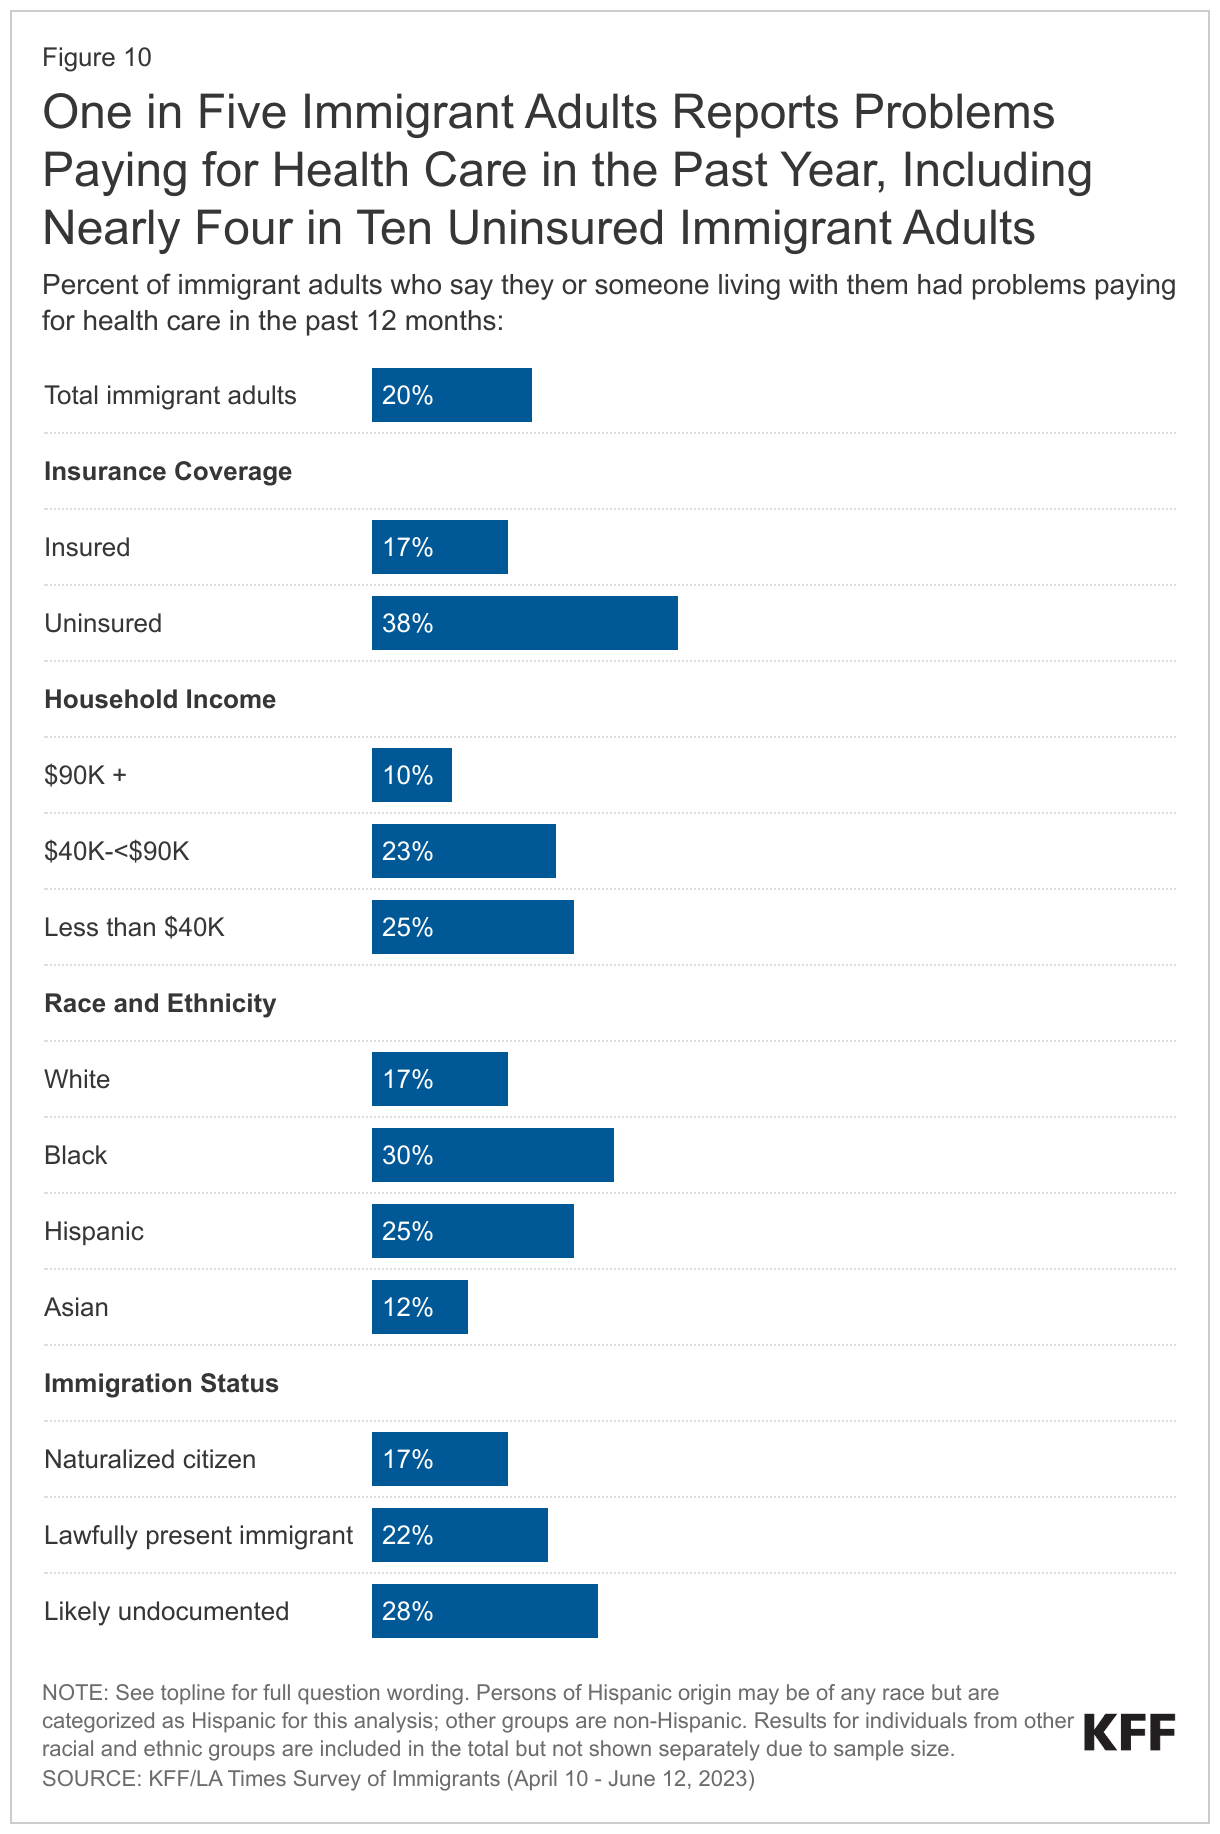
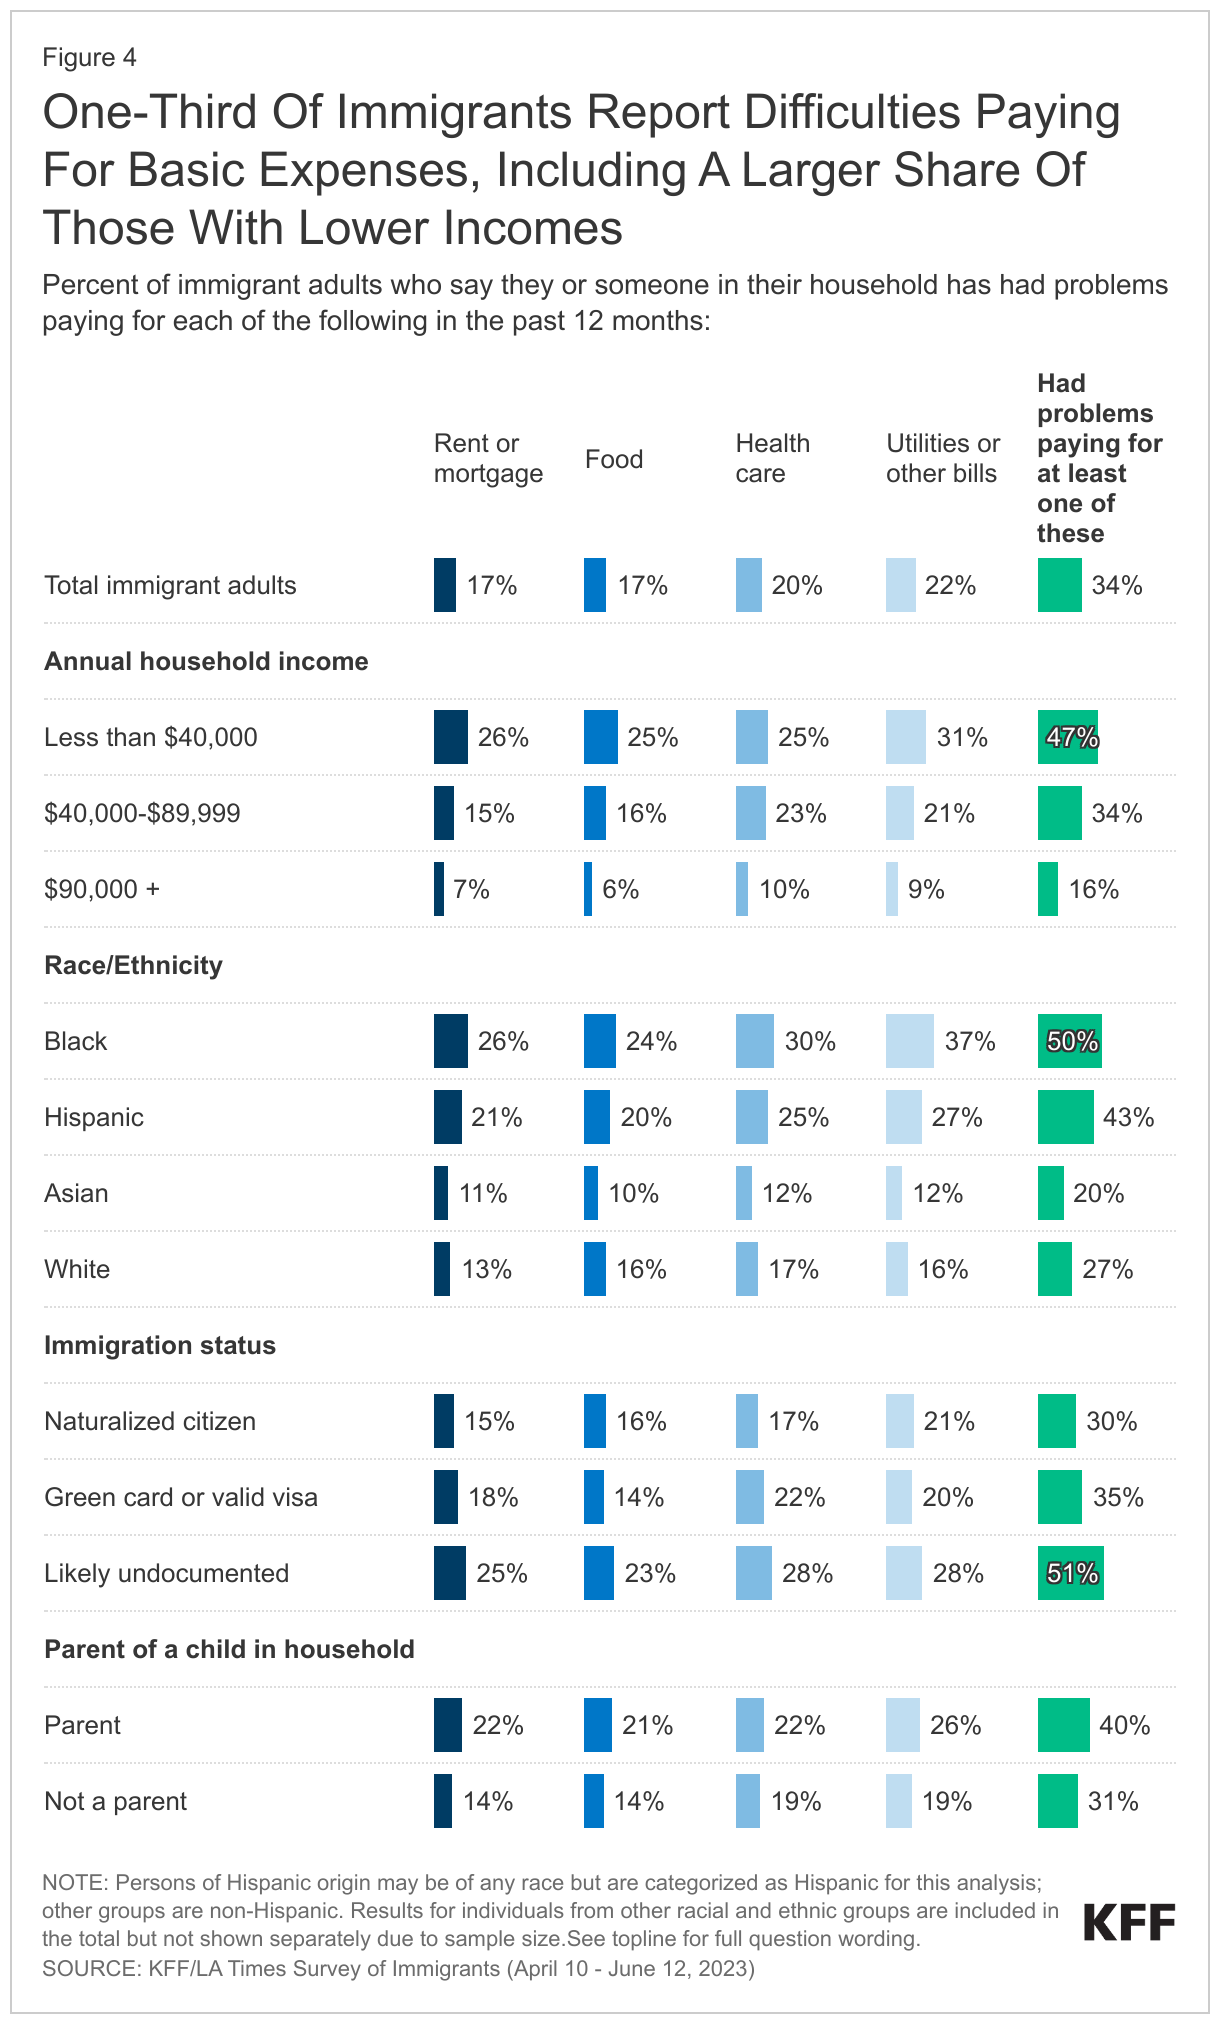
One in three immigrants report difficulty paying for basic needs. About one in three immigrants (34%) say their household has fallen behind in paying for at least one of the following necessities in the past 12 months: utilities or other bills (22%), health care (20%), food (17%), or housing (17%). The share who reports problems paying for these necessities rises to about half among immigrants who have annual household incomes of less than $40,000 (47%). The shares who report facing these financial challenges are also larger among immigrants who are likely undocumented (51%), Black (50%), or Hispanic (43%), largely because they are more likely to be low income. Additionally, four in ten immigrant parents report problems paying for basic needs.
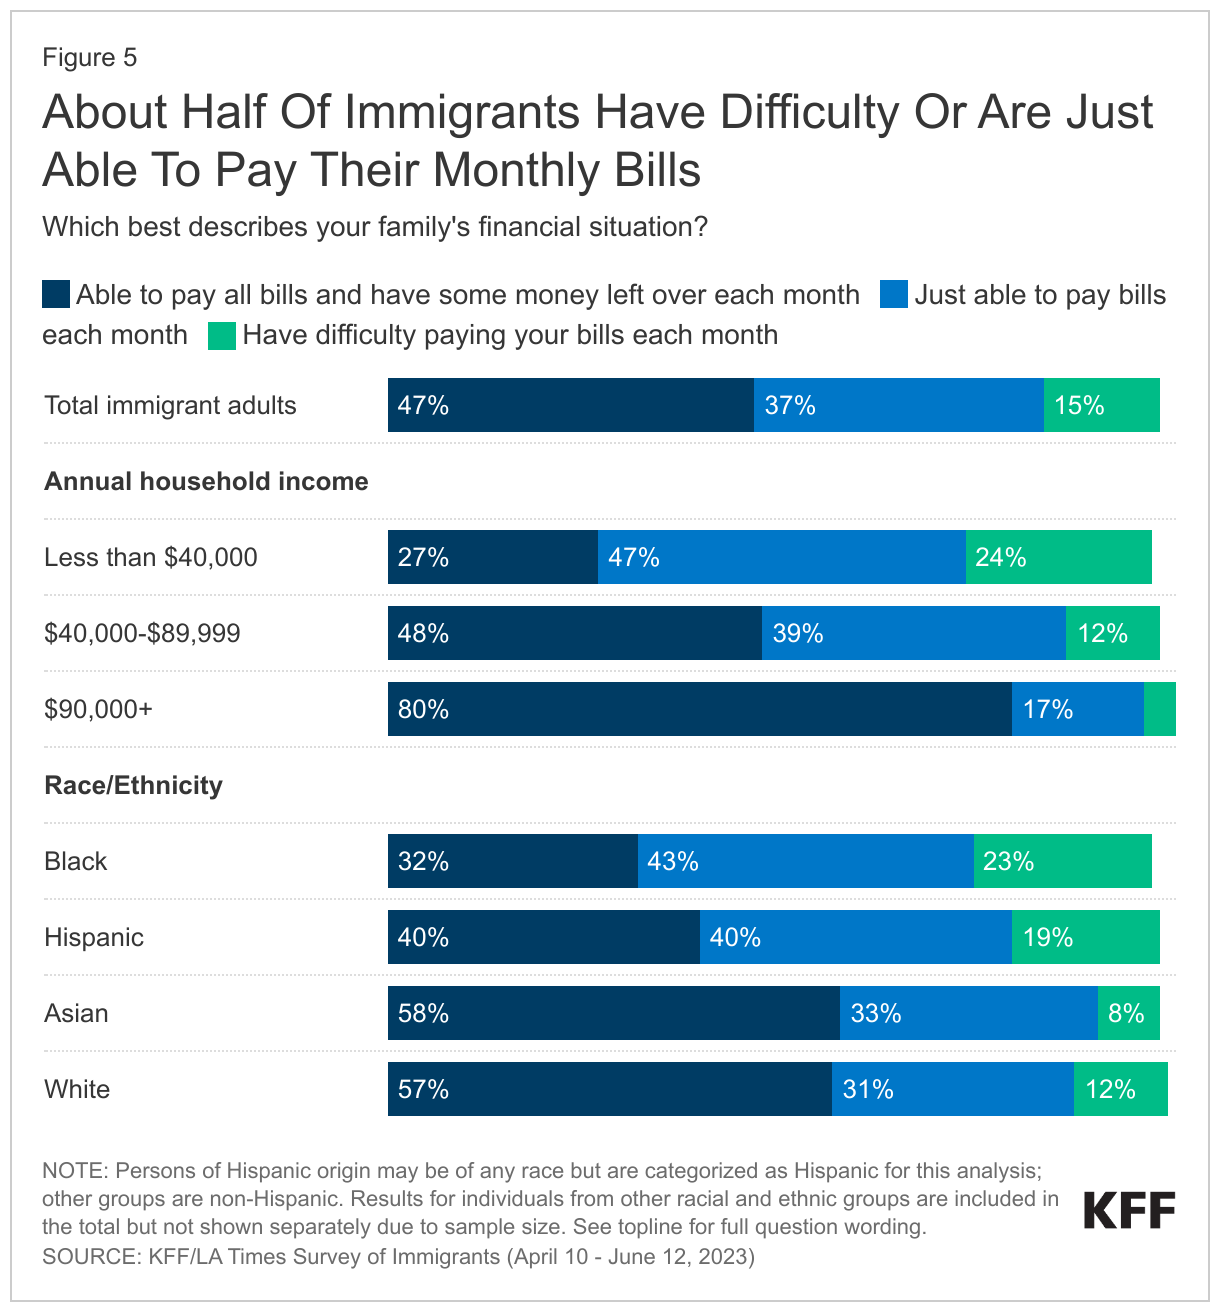
Beyond having trouble affording basic needs, a sizeable share of immigrants report they are just able to or have difficulties paying monthly bills. Nearly half (47%) of immigrants overall say they can pay their monthly bills and have money left over each month, while four in ten (37%) say they are just able to pay their bills and about one in six (15%) say they have difficulty paying their bills each month. Affordability of monthly bills varies widely by income as well as race and ethnicity. For example, only about a quarter (27%) of lower income immigrants say they have money left over after paying monthly bills compared with eight in ten (80%) of those with at least $90,000 in annual income. About six in ten immigrants who are White or Asian say they have money left over after paying their bills each month compared with four in ten Hispanic immigrants and one-third (32%) of Black immigrants, reflecting lower incomes among these groups.
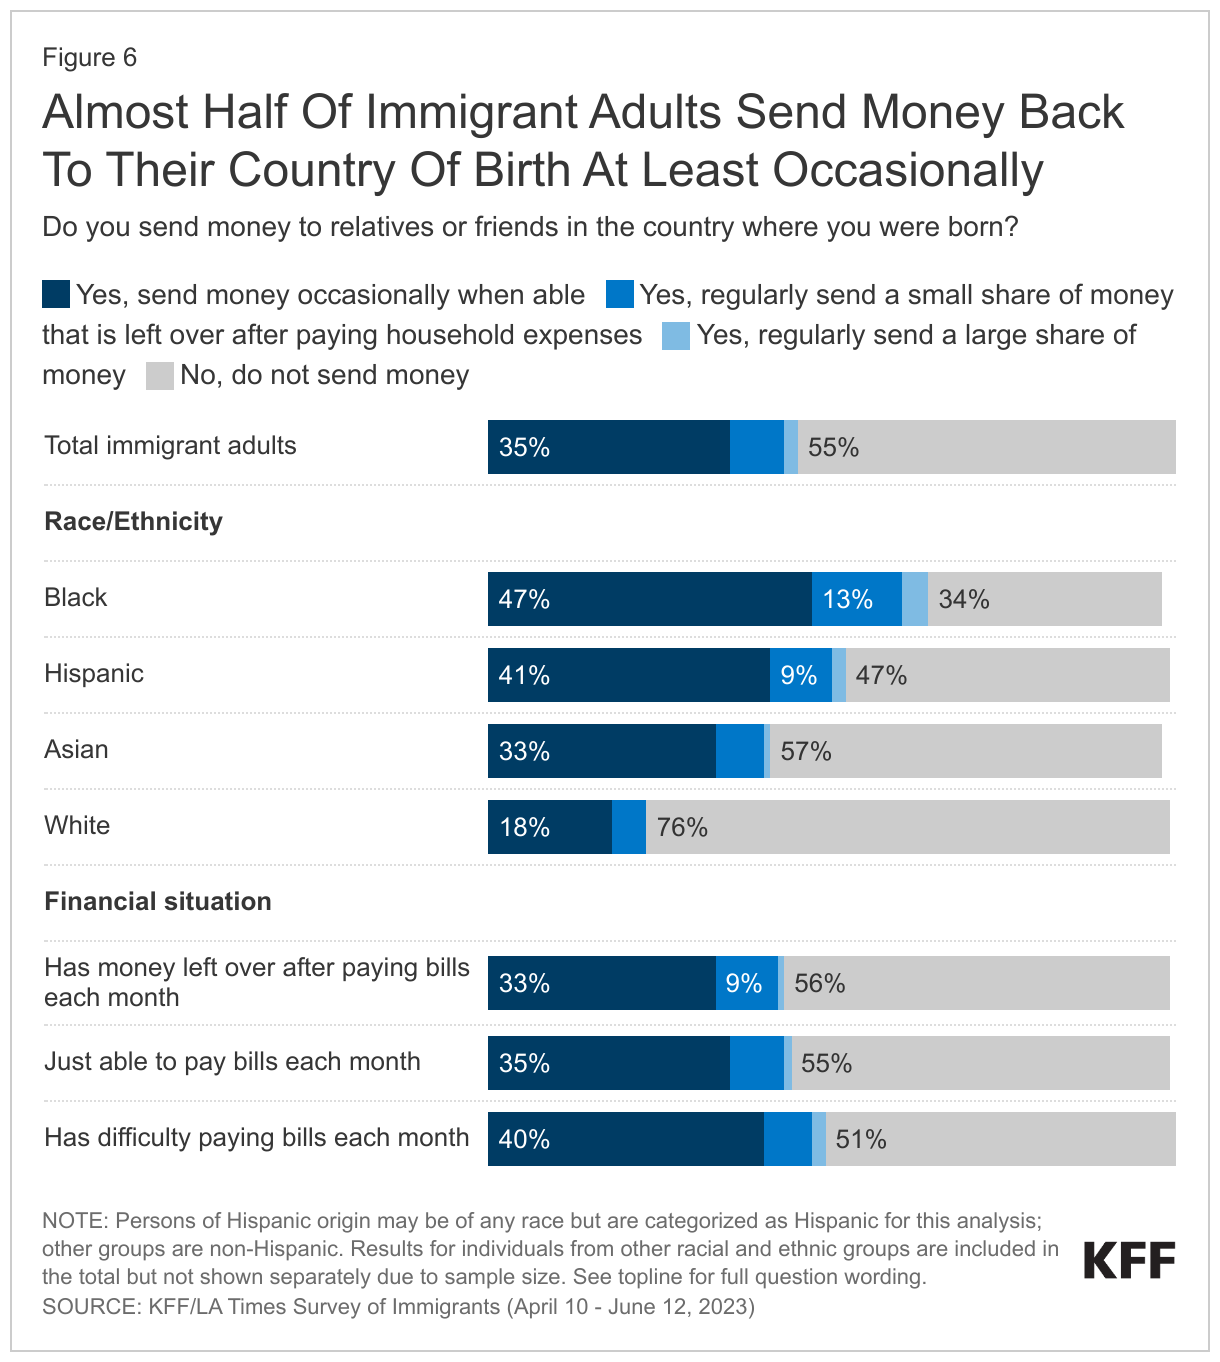
Despite these financial struggles, close to half of immigrants say they send money to relatives or friends in their country of birth at least occasionally. Overall, about one in three (35%) immigrants say they send money occasionally or when they are able. Much smaller shares report sending either small (8%) or large (2%) shares of money on a regular basis, and overall, most immigrants (55%) do not send money to relatives or family outside the U.S.
Similar shares of immigrants report sending money to their birth country regardless of their own financial struggles. About half (49%) of those who have difficulty paying their bills each month say they send money at least occasionally, as do 44% of those who say they just pay their bills and the same share of those who have money left over after paying monthly bills. Two-thirds (65%) of Black immigrants say they send money to their birth country at least occasionally, while about half (52%) of Hispanic immigrants and four in ten Asian immigrants (42%) report sending money. A much smaller share (24%) of White immigrants say they send money to the country where they were born.
What Are Immigrants’ Experiences In The Workplace?
Two-thirds of immigrants say they are currently employed, including nearly seven in ten of those under age 30, about three quarters of those between the ages of 30-64, and a quarter of those ages 65 and over. The remaining third include a mix of students, retirees, homemakers, and few (6%) unemployed immigrants. A quarter of working immigrants say they are self-employed or the owner of a business, rising to one-third (34%) of White working immigrants and nearly three in ten (27%) Hispanic working immigrants. Jobs in construction, sales, health care, and production are the most commonly reported jobs among working immigrants. KFF analysis of federal data shows that immigrants are more likely to be employed in construction, agricultural, and service jobs than are U.S.-born citizen workers.
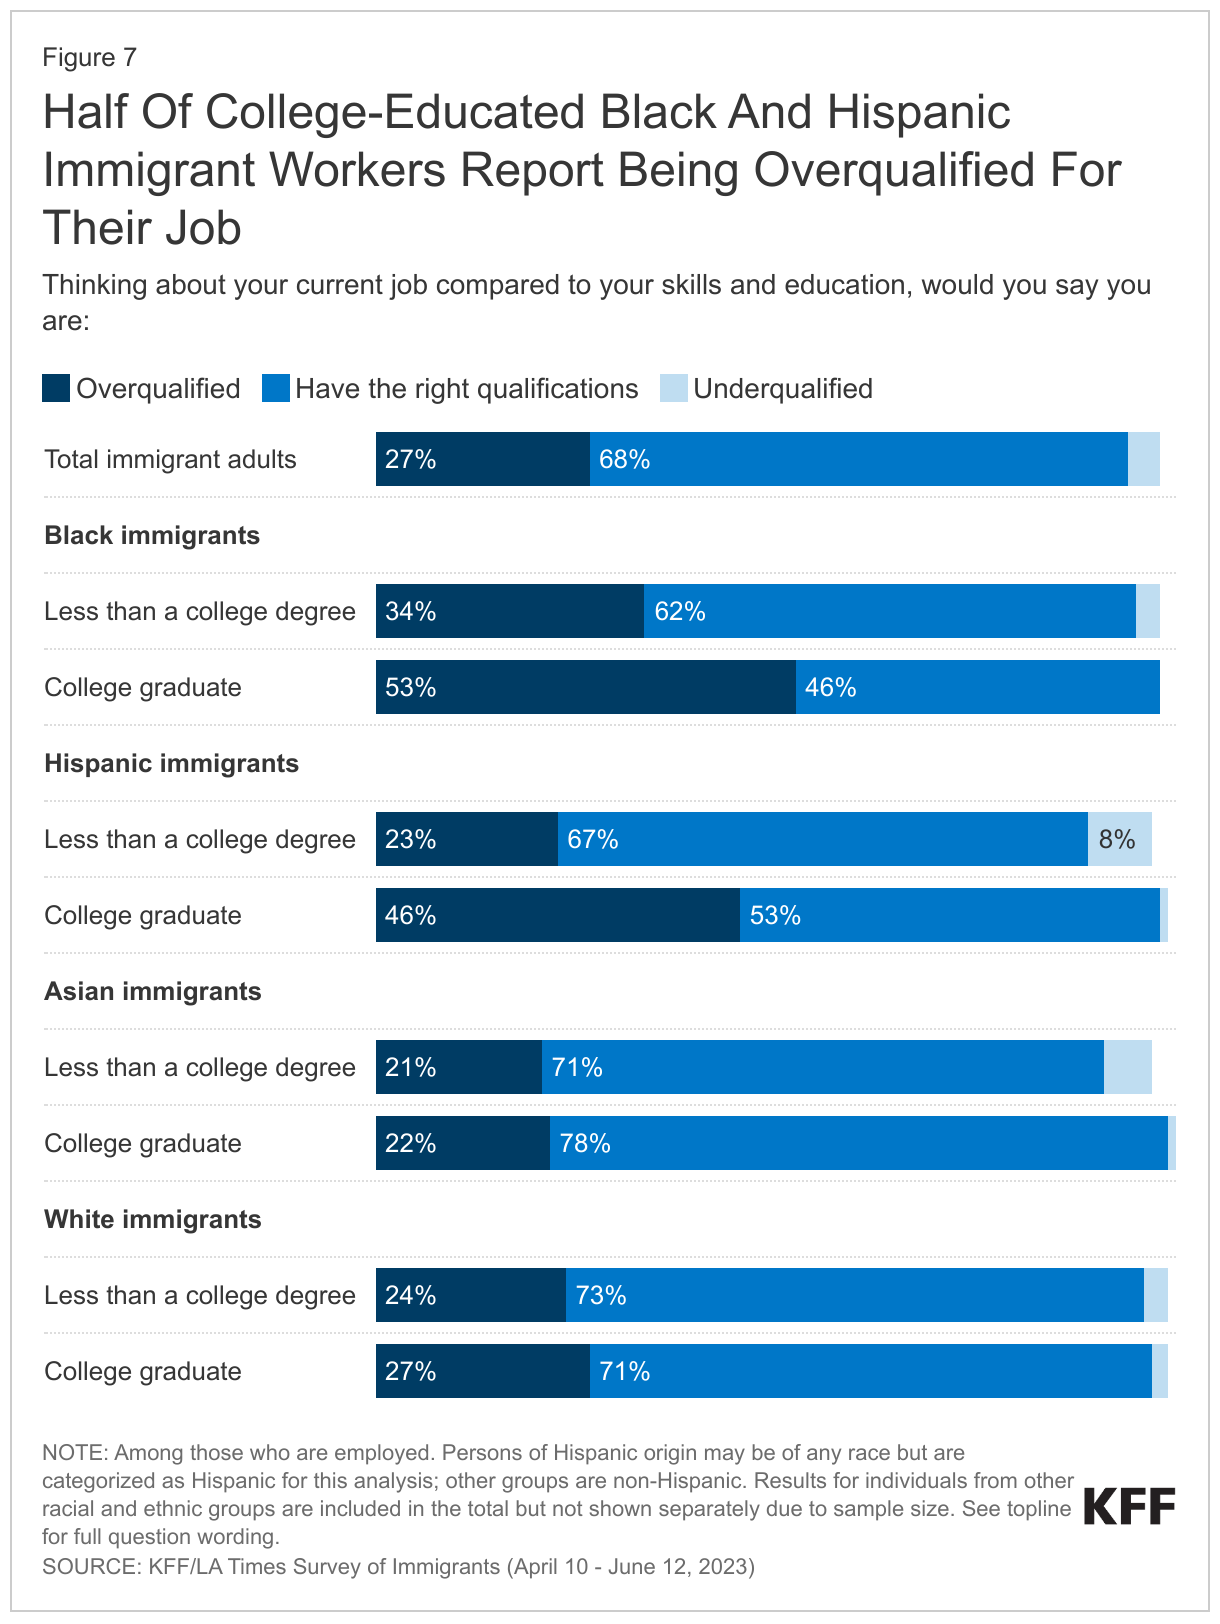
About a quarter of working immigrants feel they are overqualified for their job, rising to half of college-educated Black and Hispanic immigrants. A majority of working immigrants overall (68%) say they have the appropriate level of education and skills for their job, while about a quarter (27%) say they are overqualified, having more education and skills than the job requires. Just 4% say they are underqualified, having less education and skills than their job requires. In an indication that some immigrants are unable to obtain the same types of roles they were educated and trained for in the countries they came from, the share who feel overqualified for their current job rises to 31% among immigrants with college degrees. It is even higher among college-educated Black (53%) and Hispanic (46%) immigrants.
In Their Own Words: Work Experiences From Focus Group Participants
In focus groups, many immigrants expressed a desire to work and willingness to work in industries like construction, agriculture, and the service sector, which are often physically demanding. Some also described taking jobs that required less skills and education compared to those they held in their country of birth.
“We are the ones that work on the farms. We are the ones that cannot call out. We are the ones that even if our kids are sick, we can’t call our boss and say I can’t make it to work.” – 38-year-old Nigerian immigrant woman in New Jersey
“Yes, we have to put our effort in. It is more demanding. My hands and feet are sore. In exchange, I have a satisfactory level of income.” – 49-year-old Vietnamese immigrant woman in Texas
“…in Mexico, I was a preschool teacher. Being undocumented, obviously, you can’t work in the area you studied in, so now, I do cleaning.” – 36-year-old Mexican immigrant woman in Texas
“I used to work a white-collar job, now I do manual labor. My major used to hurt my mind, now it’s my arms and legs.” – 41-year-old Vietnamese immigrant woman in Texas
“My job entails picking up trash and cleaning toilets. I don’t like doing that. Who likes cleaning toilets? Who likes picking up other people’s trash, right? I don’t like it, but I’m in this job out of necessity.” – 20-year-old Honduran immigrant woman in California
“I only had [one] job back in Vietnam. Here I need to do four: a nanny, a maid, a house cleaner and a main job.” – 41-year-old Vietnamese immigrant woman in Texas
“The work in the field is hard. When it’s hot out, it gets up to 100 or 104. People work with grapes, so they pick the grapes. They work in the sun. There’s no air…. Snakes come out. Whatever comes out, you just keep picking with the machine. Snakes, mice, whatever. So, it’s hard. It’s hard.” – 32-year-old Mexican immigrant woman in California
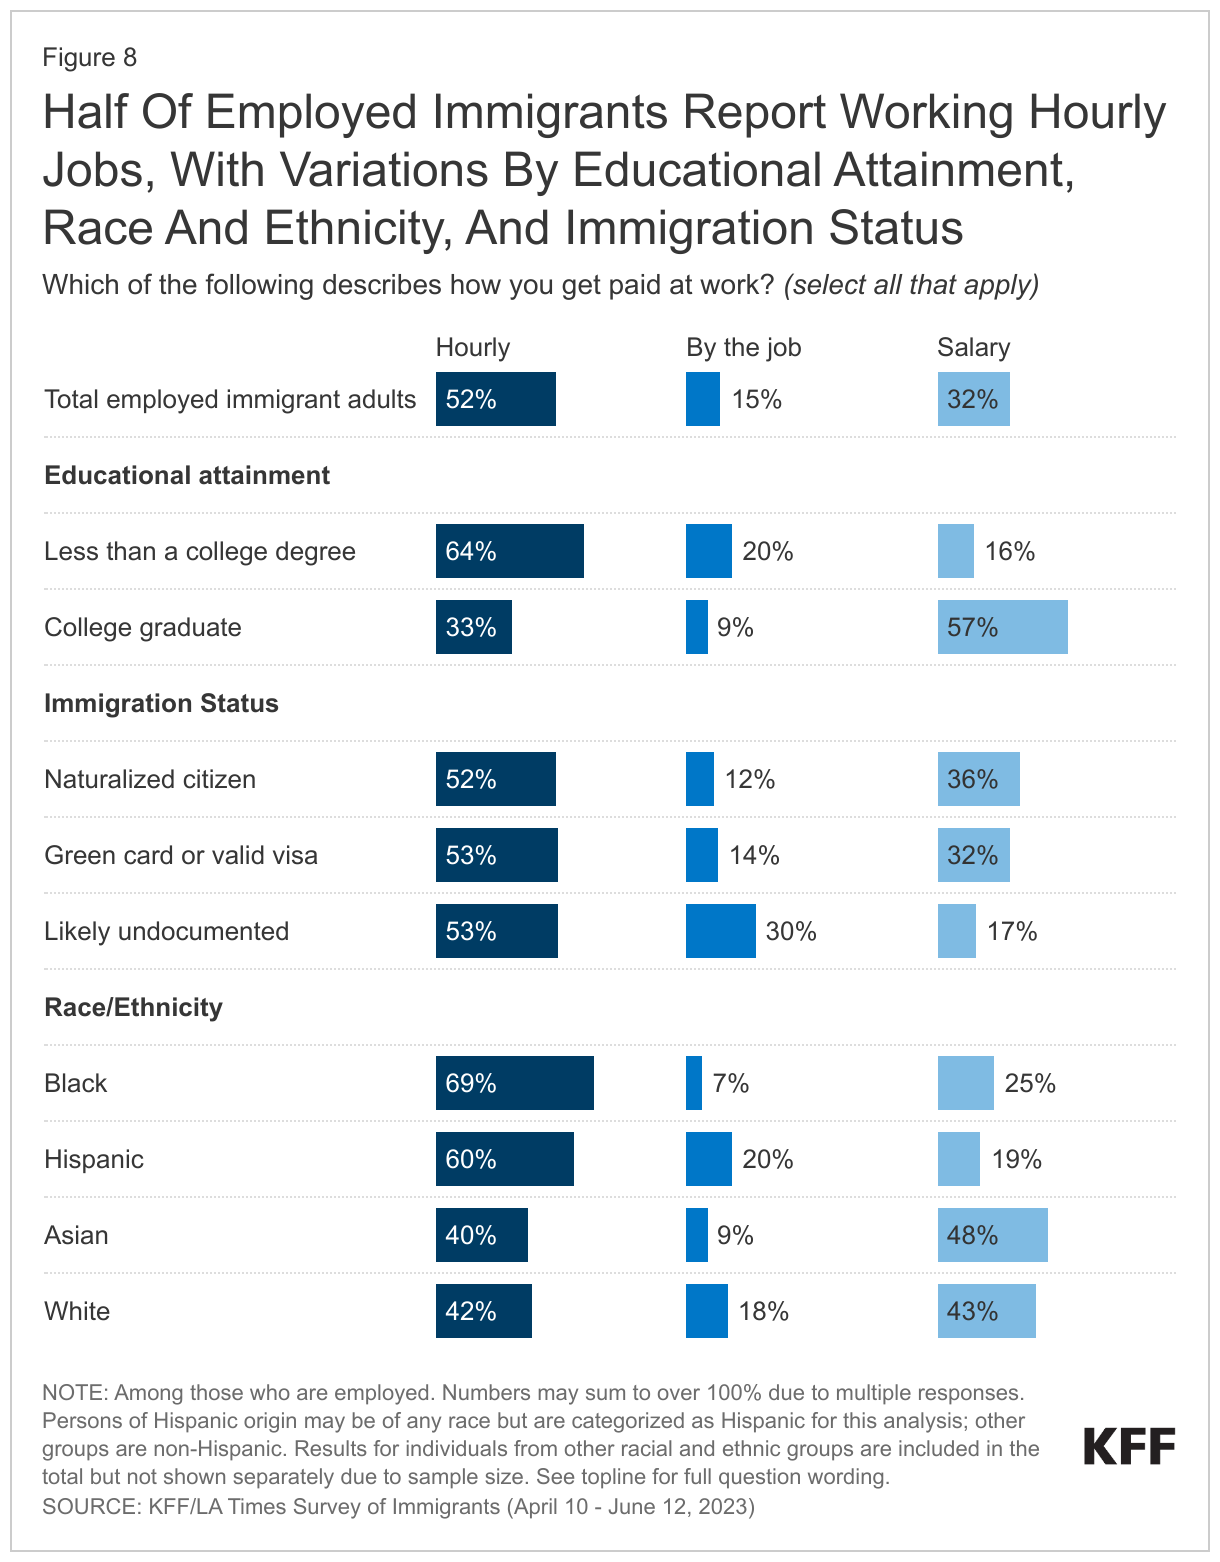
Overall, about half of employed immigrants report working jobs that pay them by the hour (52%), one third say they are paid by salary (32%), and 15% report being paid by the job. However, these shares vary by income, immigration status, educational attainment, and race and ethnicity. Compared to immigrants with higher incomes, immigrants with lower incomes are more likely to be paid by the hour (63% of immigrants with annual household incomes of less than $40,000) or by the job (24%) than receive a salary (13%). Immigrants who are likely undocumented (30%) are about twice as likely as those with a green card or visa (14%) or naturalized citizens (12%) to report being paid by the job, and about half as likely to report being paid by salary (17%, 32%, and 36%, respectively). Immigrants with a college degree are more than three times as likely as those without a college degree to hold salaried jobs, (57% vs. 16%). Black and Hispanic immigrants are more likely to report working hourly jobs (69% and 60% respectively) than their White (42%) and Asian (40%) counterparts. Conversely, among those who are employed, almost half of Asian immigrants and more than four in ten White immigrants report being paid by salary compared with a quarter or fewer Black and Hispanic immigrants.
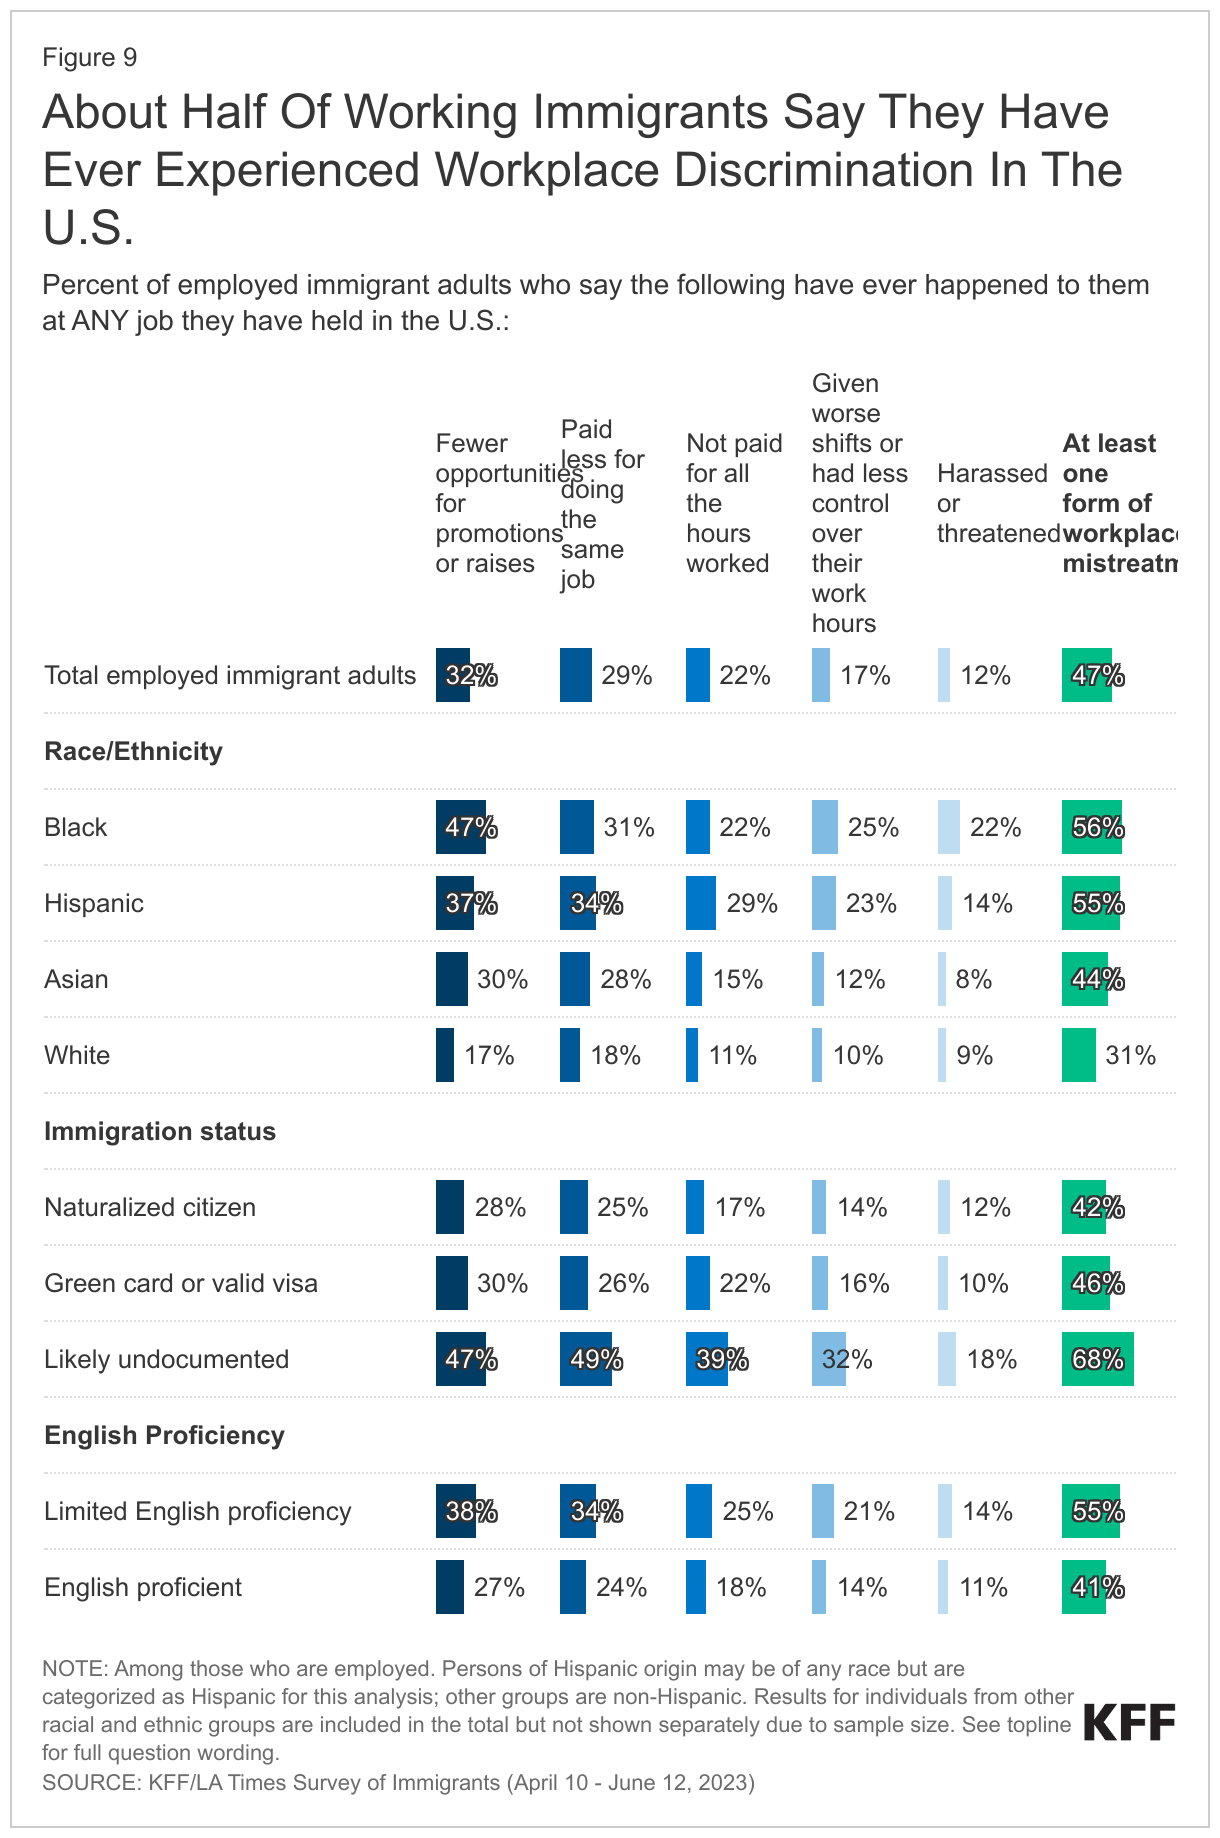
About half of working immigrants report experiencing discrimination at work. About half (47%) of all working immigrants say they have ever been treated differently or unfairly at work in at least one of five ways asked about on the survey, most commonly being given fewer opportunities for advancement (32%) and being paid less (29%) compared to people born in the U.S. About one in five working immigrants say they have not been paid for all their hours or overtime (22%) or have been given undesirable shifts or less control over their work hours than someone born in the U.S. doing the same job (17%). About one in ten (12%) say they have been harassed or threatened by someone in their workplace because they are an immigrant.
Highlighting the intersectional impacts of race, ethnicity, and immigration status, reports of workplace discrimination are higher among immigrant workers of color and likely undocumented immigrants. Majorities of Black (56%) and Hispanic (55%) immigrant workers report experiencing at least one form of workplace discrimination asked about. More than four in ten (44%) Asian immigrant workers also report experiencing workplace discrimination compared to three in ten (31%) White immigrant workers. About two-thirds (68%) of likely undocumented working immigrants report experiencing at least one form of unfair treatment in the workplace, with about half of this group saying they have been paid less or had fewer opportunities for advancement than people born in the U.S. for doing the same job. Undocumented immigrant workers often face even greater employment challenges due to lack of work authorization, which increases risk of potential workplace abuses, violations of wage and hour laws, and poor working as well as living conditions.
Limited English proficiency is also associated with higher levels of reported workplace discrimination. A majority (55%) of working immigrants who speak English less than very well (rising to 61% of Hispanic immigrants with limited English proficiency) report experiencing at least one form of workplace discrimination. In particular, immigrants with limited English proficiency are more likely than those who are English proficient to say they were given fewer opportunities for promotions or raises (38% vs. 27%) or were paid less than people born in the U.S. for doing the same job (34% vs. 24%).
Do Immigrants Feel Welcome In The U.S.?
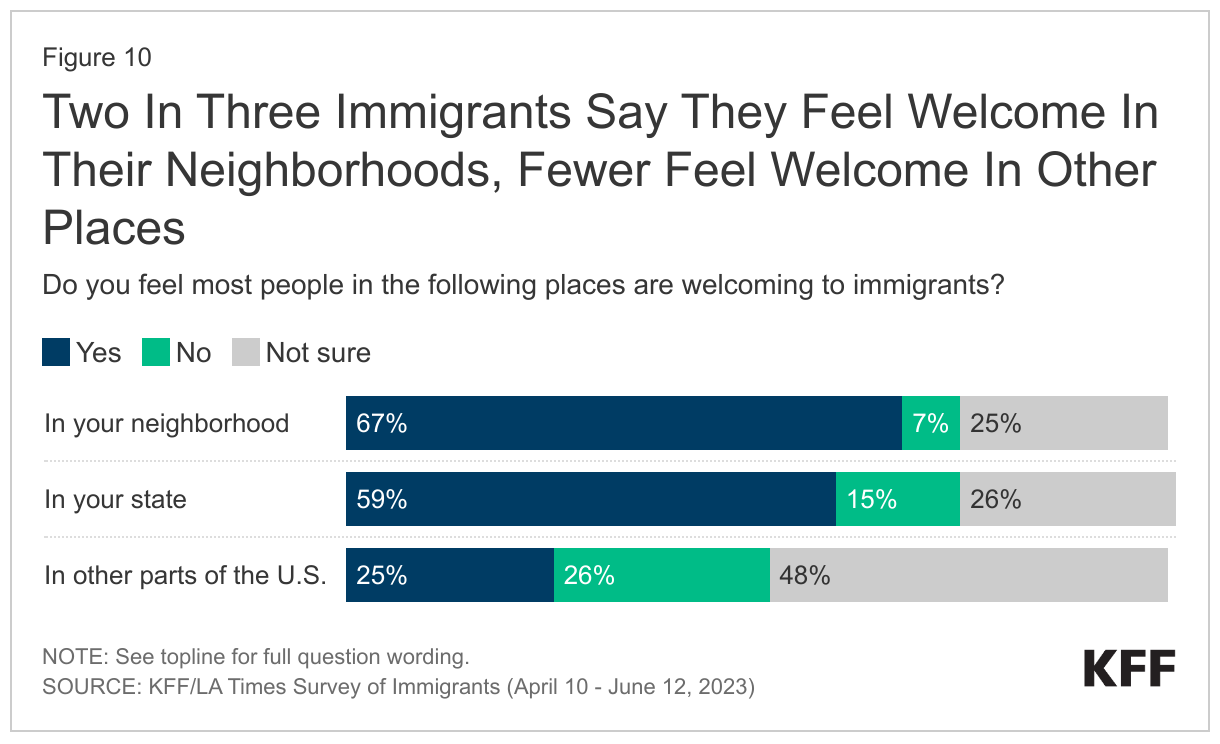
Most immigrants feel welcome in their neighborhoods. Overall, two-thirds of immigrants say most people in their neighborhoods are welcoming to immigrants. Just 7% say people in their neighborhood are not welcoming, while one in four say they are “not sure” whether immigrants are welcome in their neighborhood. When it comes to the treatment of immigrants in the state in which they live, about six in ten immigrants say they feel people in their state are welcoming to immigrants, but 15% say their state is not welcoming and another one in four say they are “not sure.” When asked about whether they think most people are welcoming to immigrants outside of the state in which they live, about half (48%) of immigrants say they are “not sure” about this, which could reflect lack of experiences in other places.
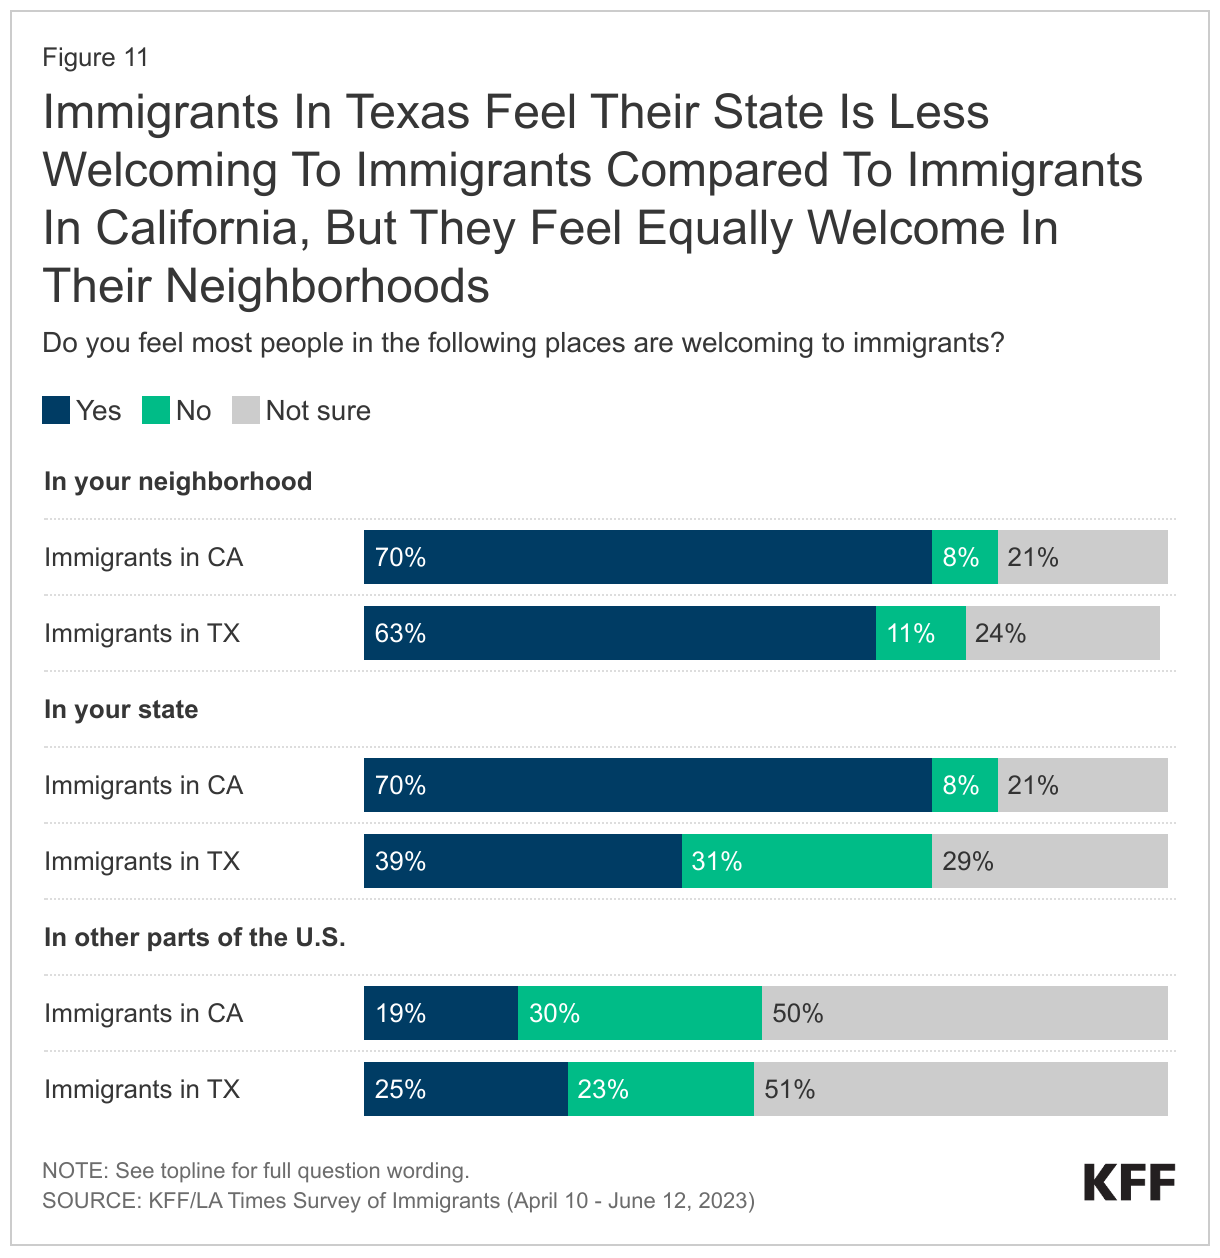
Immigrants in Texas are much less likely than those in California to feel their state is welcoming to immigrants. Immigrants living in California and Texas, the two most populous states for immigrants, are about equally likely to say immigrants are welcome in their neighborhood. However, immigrants living in California are about 30 percentage points more likely than are immigrants living in Texas to say they feel people in their state are welcoming to immigrants (70% vs. 39%). Further, immigrants in Texas are more than three times as likely as those in California to say they feel their state is not welcoming to immigrants (31% vs. 8%).
What Are Immigrants’ Experiences With Discrimination And Unfair Treatment In The Community?
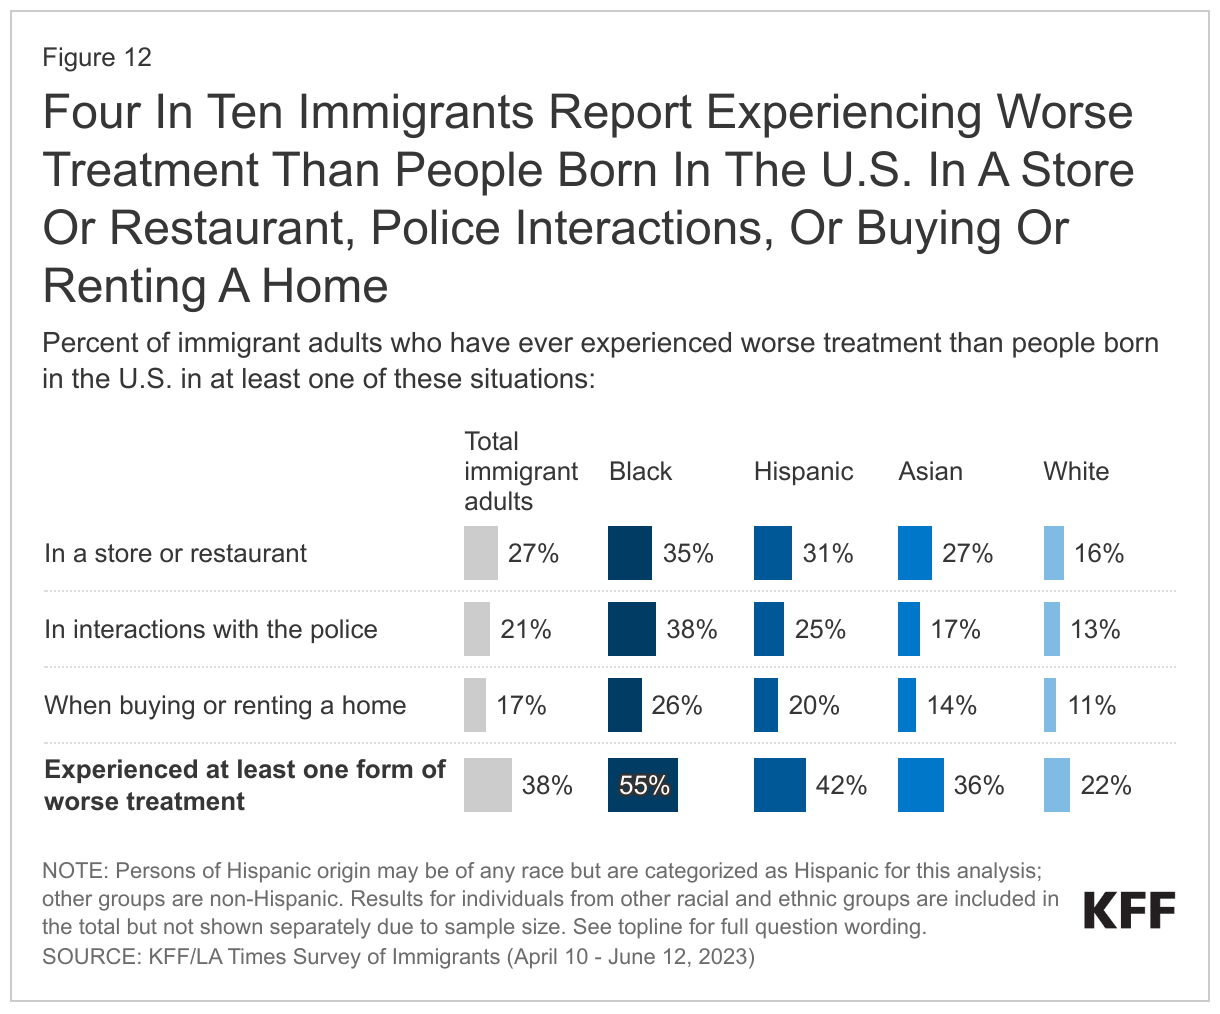
Despite feeling welcome in their neighborhoods, many immigrants report experiencing discrimination and unfair treatment in social and police interactions. About four in ten (38%) immigrants say they have ever received worse treatment than people born in the U.S. in at least one of the following places: in a store or restaurant (27%), in interactions with the police (21%), or when buying or renting a home (17%). In addition, about a third (34%) of immigrants say that since moving to the U.S., they have been criticized or insulted for speaking a language other than English, and a similar share (33%) say they have been told they should “go back to where you came from.”
Reports of discrimination and unfair treatment are more prevalent among people of color compared to White immigrants, illustrating the combined impacts of racism and anti-immigrant discrimination. For example, about one-third of immigrants who are Black (35%) or Hispanic (31%) and about a quarter (27%) of Asian immigrants say they have ever received worse treatment than people born in the U.S. in a store or restaurant, all higher than the share among White immigrants (16%). Notably, four in ten (38%) Black immigrants say they have ever received worse treatment than people born in the U.S. in interactions with the police, and almost half (45%) say they have been told they should “go back to where you came from.” Among Hispanic immigrants, about four in ten (42%) say they have been criticized or insulted for speaking a language other than English.
In Their Own Words: Experiences With Discrimination In The Community From Focus Group Participants
In focus groups, many immigrants shared their experiences with discrimination in the community.
“Sometimes, when you talk, the way some people will laugh. They’ll laugh at you, you say one word, they’ll be laughing, laughing, laughing. …I’m so very ashamed. I’m so ashamed, so you don’t want to talk.” – 46-year-old Ghanian immigrant woman in New Jersey
“I speak English, but obviously, I don’t speak it fluently. I have my accent, and you can tell that I’m Mexican. I’ve seen people make faces at me or whatnot.” – 37-year-old Mexican immigrant man in Texas
“We have our business around the corner. I left the house one day to go pick up my daughter, and my husband called me. There was a White guy yelling at my husband ‘Get out of my country.’ I said, ‘Tell him that it’s your country, too.’” – 36-year-old Mexican immigrant woman in California
“The guy was like…you guys should go back to your country. He used different words for us. Then he called the cops, and when the cops came, they didn’t listen to us. I was like, this is unfair. You could have listened to both sides.” – 38-year-old Nigerian immigrant woman in New Jersey
“But my son when he first came here, he did not know English. When he went to school, his classmates said, ‘You do not study well, you should go back to your country.’” – 54-year-old Vietnamese immigrant woman in California
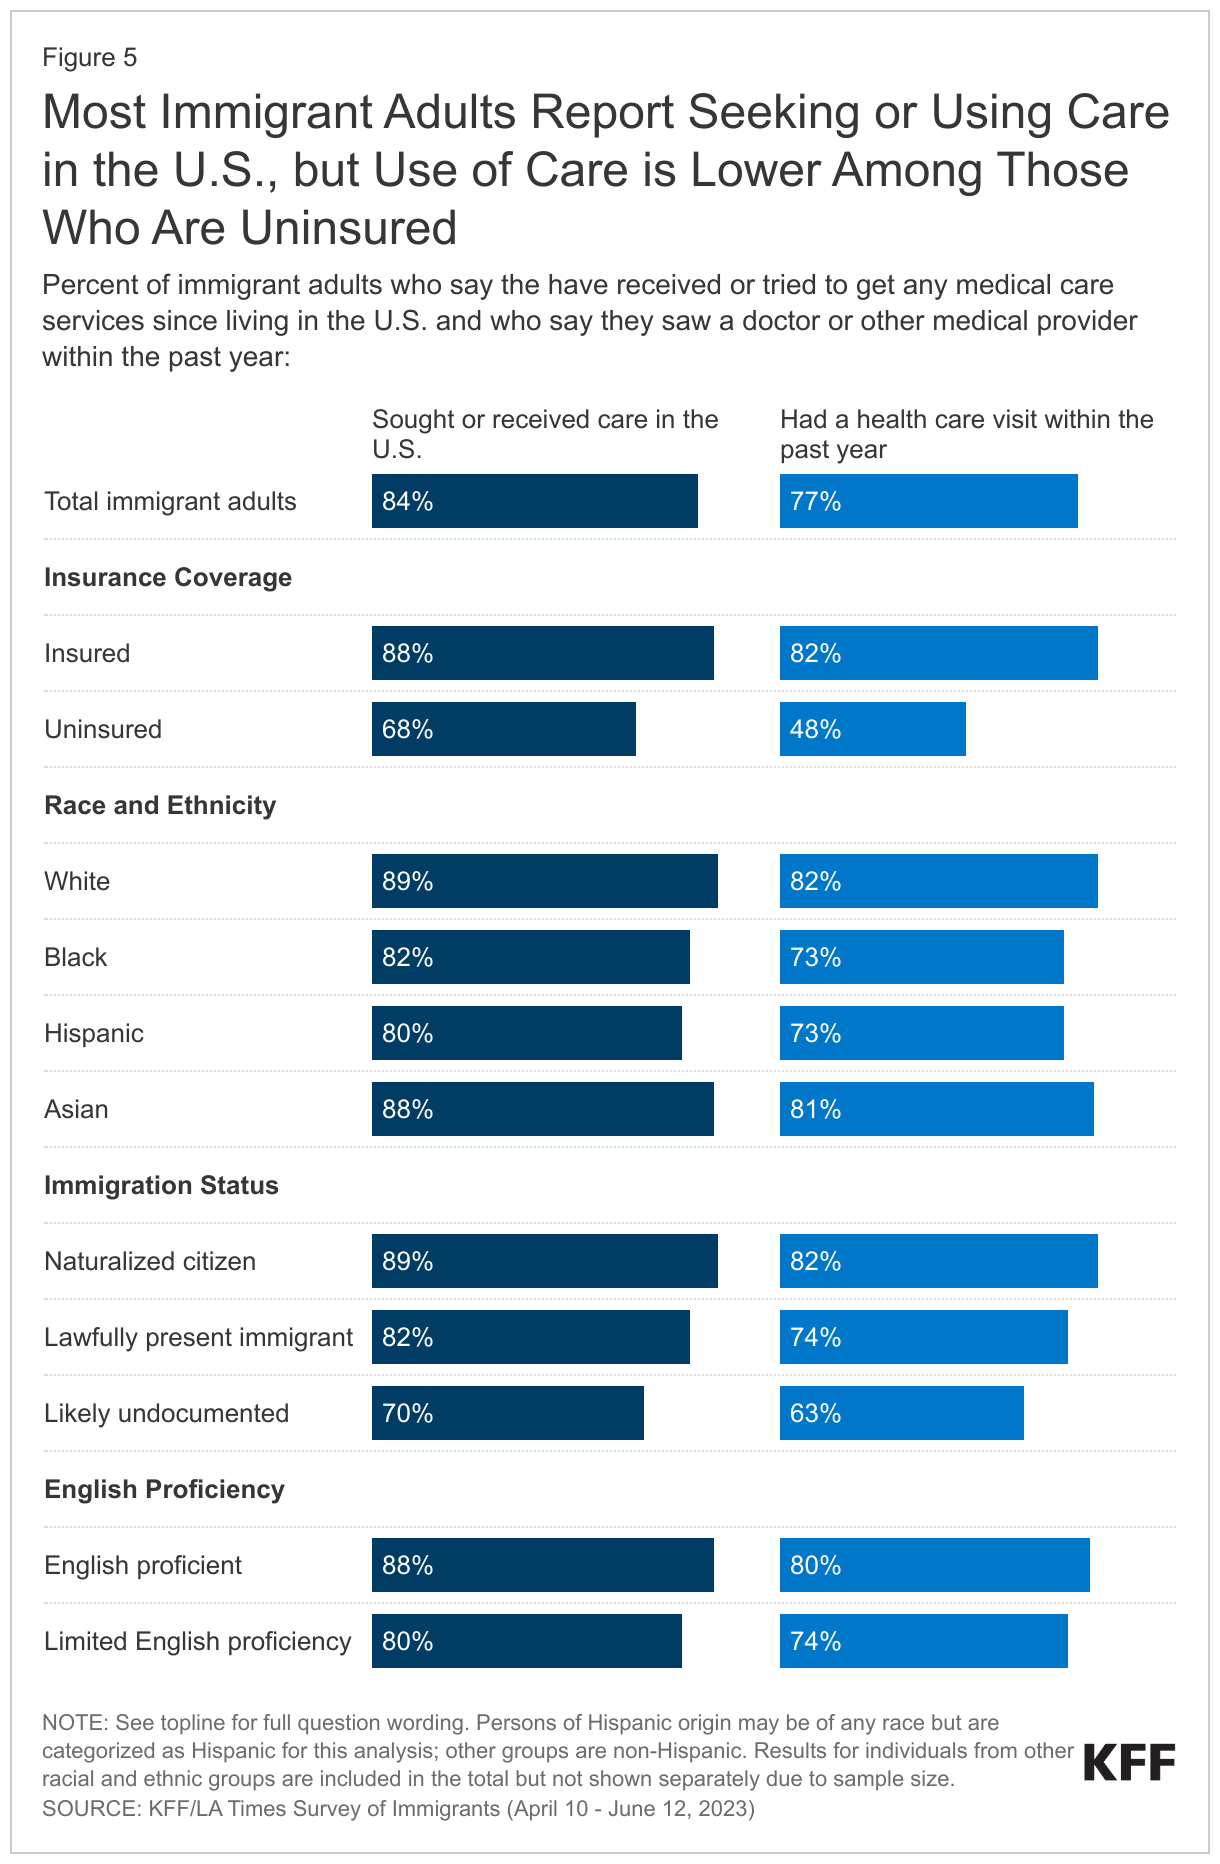
One in four immigrants report being treated unfairly by a health care provider. In addition to discrimination at work and in community settings, a sizeable share of immigrants say they have been treated unfairly by a doctor or health care provider since coming to the U.S. Overall, among immigrants who have received health care in the U.S., one in four (rising to nearly four in ten Black immigrants) say they have been treated differently or unfairly by a doctor or other health care provider because of their racial or ethnic background, their accent or how well they speak English, or their insurance status or ability to pay for care. For more details about immigrants’ health and health care experiences, read the companion report here.
What Language Barriers Do Immigrants With Limited English Proficiency Face?
Over half of immigrants with limited English proficiency report language barriers in a variety of settings and interactions. Overall, about half of all immigrants have limited English proficiency, meaning they speak English less than very well. Among this group, about half (53%) say that difficulty speaking or understanding English has ever made it hard for them to do at least one of the following: receive services in stores or restaurants (30%); get health care services (31%); get or keep a job (29%); apply for government assistance with food, housing, or health coverage (25%); or get help from the police (22%).
Language barriers are amplified among those with lower levels of educational attainment as well as those with lower incomes. Among immigrants with limited English proficiency, those who do not have a college degree are more likely to report experiencing at least one of these difficulties than those who have a college degree (57% vs. 39%). Similarly, lower income immigrants (household incomes less than $40,000) with limited English proficiency are more likely to report facing language barriers compared to their counterparts with incomes of $90,000 or more (61% vs. 38%).
Immigrant parents with limited English proficiency also face challenges communicating with their children’s school or teacher. Among immigrant parents with limited English proficiency (52% of all immigrant parents), about one in four (24%) say difficulty speaking or understanding English has made it hard for them to communicate with their child’s school or teacher.
How Do Confusion And Worries About Immigration Laws And Status Affect Immigrants’ Daily Lives?
About seven in ten (69%) immigrants who are likely undocumented worry they or a family member may be detained or deported. However, worries about detention or deportation are not limited to those who are likely undocumented. About one in three immigrants who have a green card or other valid visa say they worry about this, as do about one in ten (12%) immigrants who are naturalized U.S. citizens.
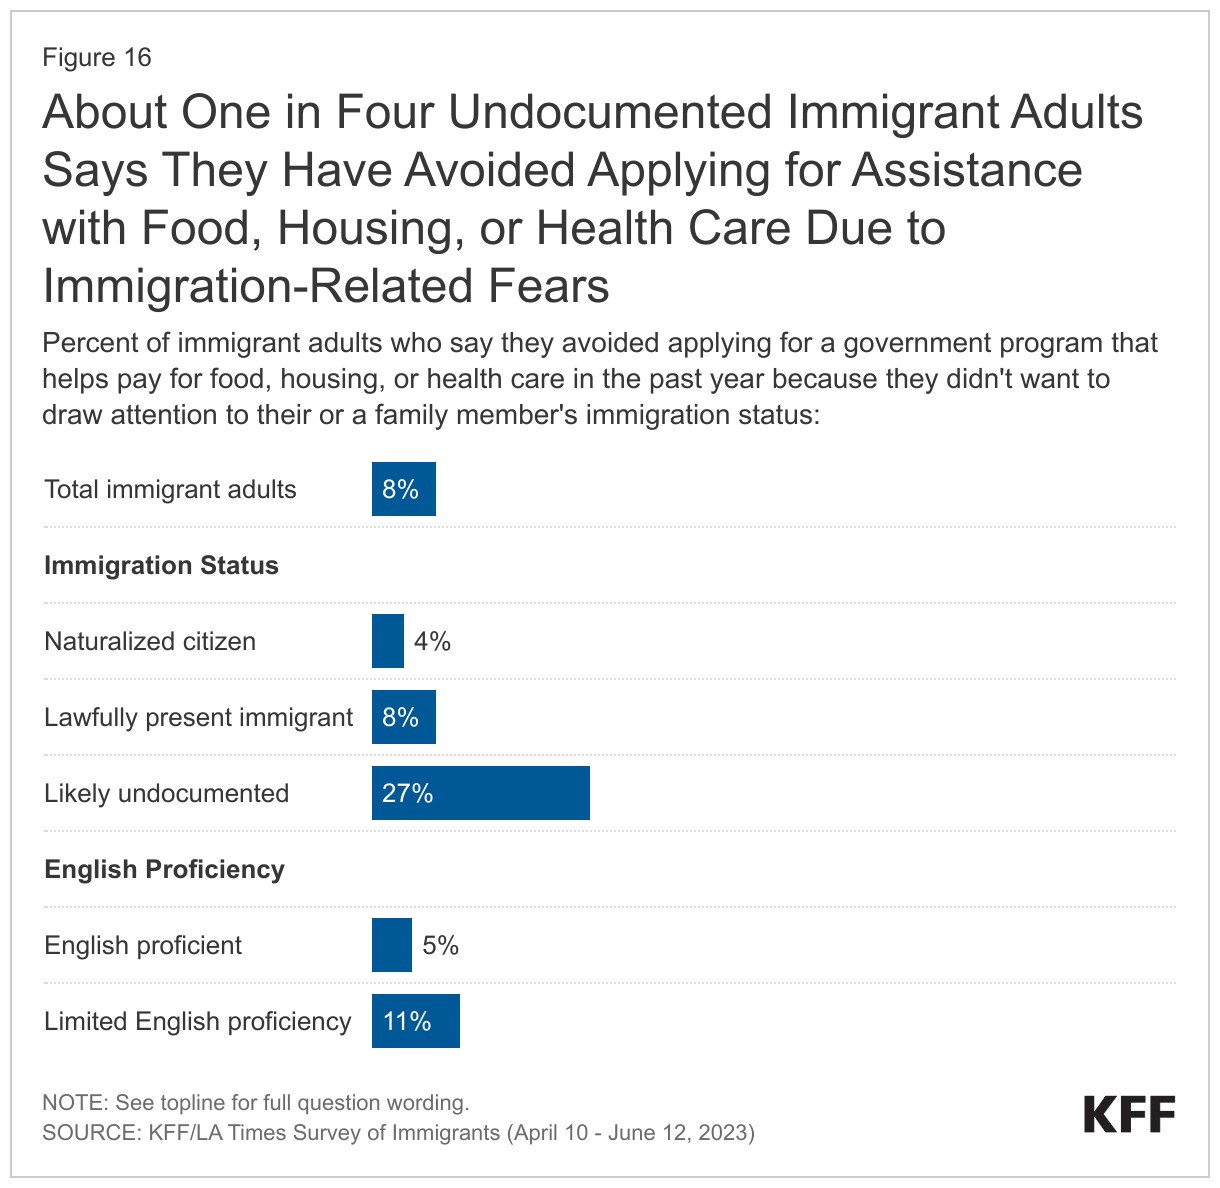
Some immigrants report avoiding certain activities due to concerns about immigration status. Fourteen percent of immigrants overall, rising to 42% of those who are likely undocumented, say they have avoided things such as talking to the police, applying for a job, or traveling because they didn’t want to draw attention to their or a family member’s immigration status. In addition, 8% of all immigrants say they have avoided applying for a government program that helps pay for food, housing, or health care because of concerns about immigration status, including 27% of those who are likely undocumented.
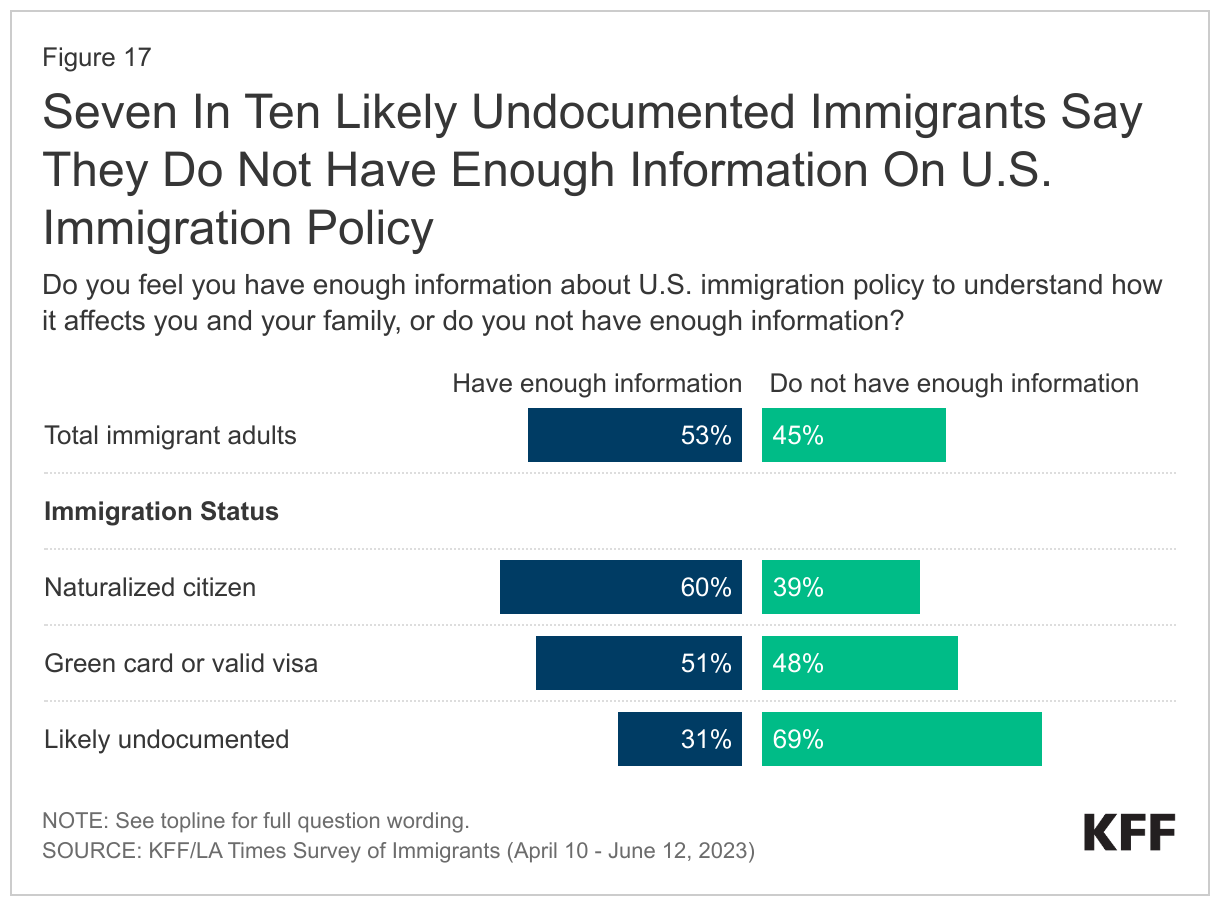
More than four in ten (45%) immigrants overall say they don’t have enough information about U.S. immigration policy to understand how it affects them and their family. Lack of immigration-related knowledge is strongly related to one’s immigration status. Nearly seven in ten (69%) immigrants who are likely undocumented say they don’t have enough information, while immigrants with a valid green card or visa are split, with one half saying they have enough information and the other half saying they do not. Being a naturalized U.S. citizen doesn’t completely diminish immigrants’ confusion about U.S. immigration policy, as nearly four in ten (39%) immigrants who are naturalized citizens also say they don’t have enough information. Beyond immigration status, the groups who are more likely to say they do not have enough information to understand how immigration policy affects them and their families include immigrants with limited English proficiency, those who have been in the U.S. for fewer than five years, have lower household incomes, and/or have lower levels of education.
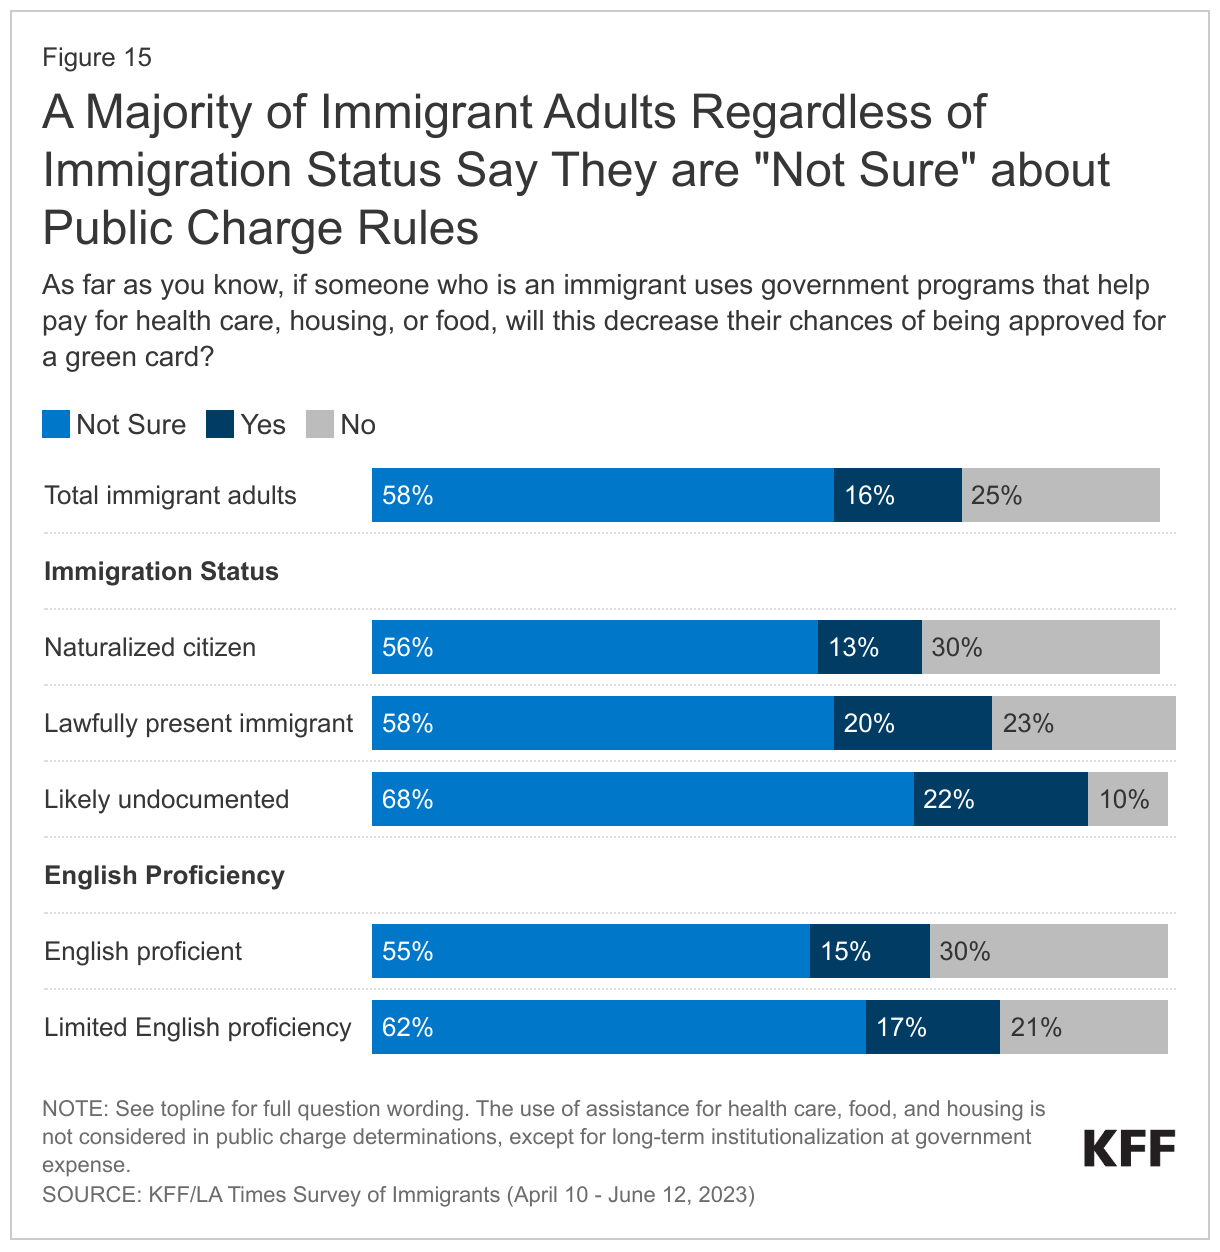
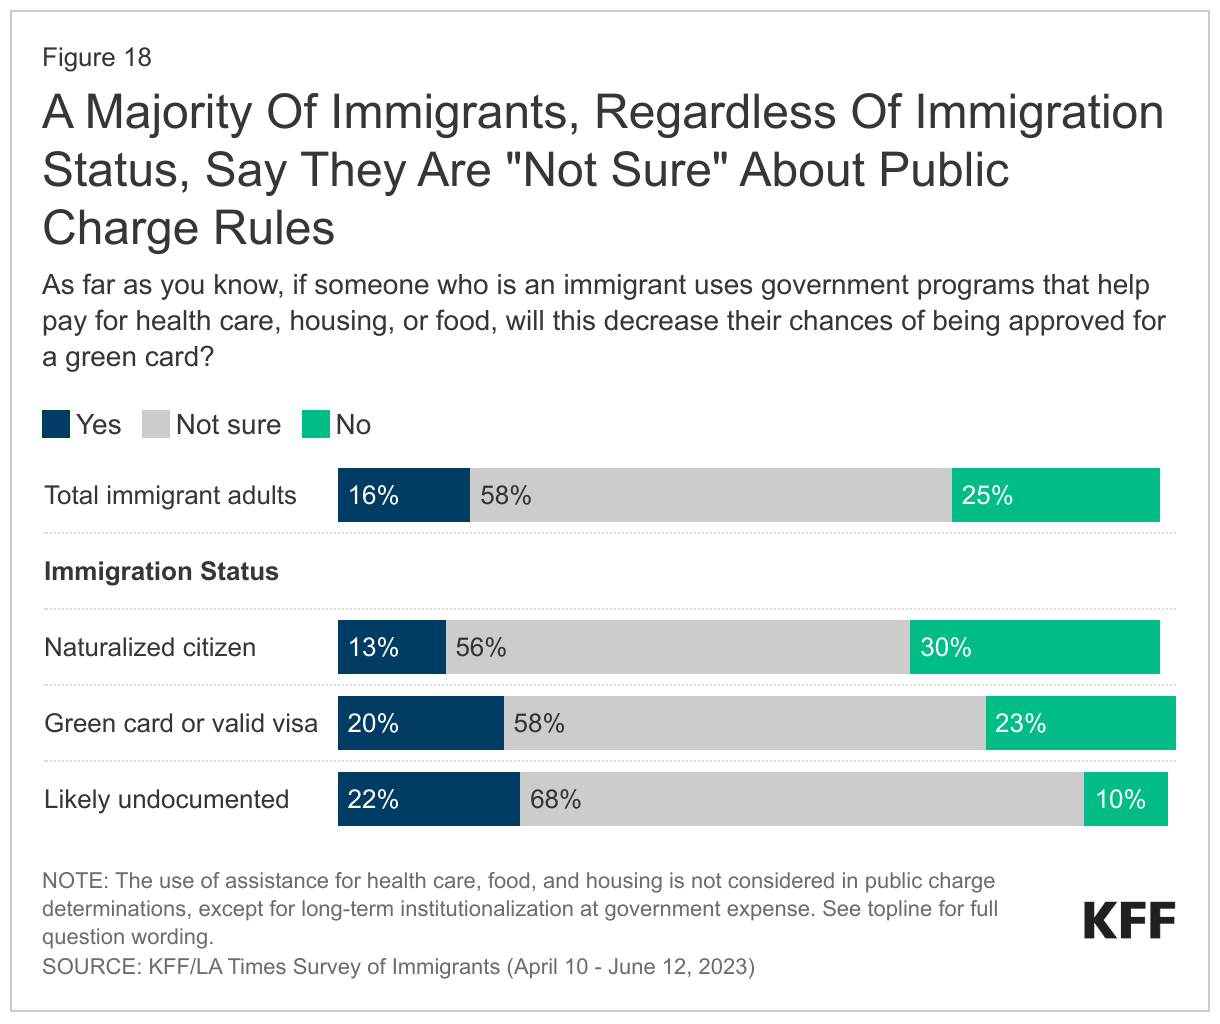
Across immigrants, there is a general lack of knowledge about public charge rules. Under longstanding U.S. policy, federal officials can deny an individual entry to the U.S. or adjustment to lawful permanent status (a green card) if they determine the individual is a “public charge” based on their likelihood of becoming primarily dependent on the government for subsistence. In 2019, the Trump Administration made changes to public charge policy that newly considered the use of previously excluded noncash assistance programs for health care, food, and housing in public charge determinations. This policy was rescinded by the Biden Administration in 2021, meaning that the use of noncash benefits, including assistance for health care, food, and housing, is not considered for public charge tests, except for long-term institutionalization at government expense. The survey suggests that many immigrants remain confused about public charge rules. Six in ten immigrants say they are “not sure” whether use of public programs that help pay for health care, housing or food can decrease one’s chances for green card approval and another 16% incorrectly believe this to be the case. Among immigrants who are likely undocumented, nine in ten are either unsure (68%) or incorrectly believe use of these types of public programs will decrease their chances for green card approval (22%).
What Are Immigrants Plans And Hopes For The Future?
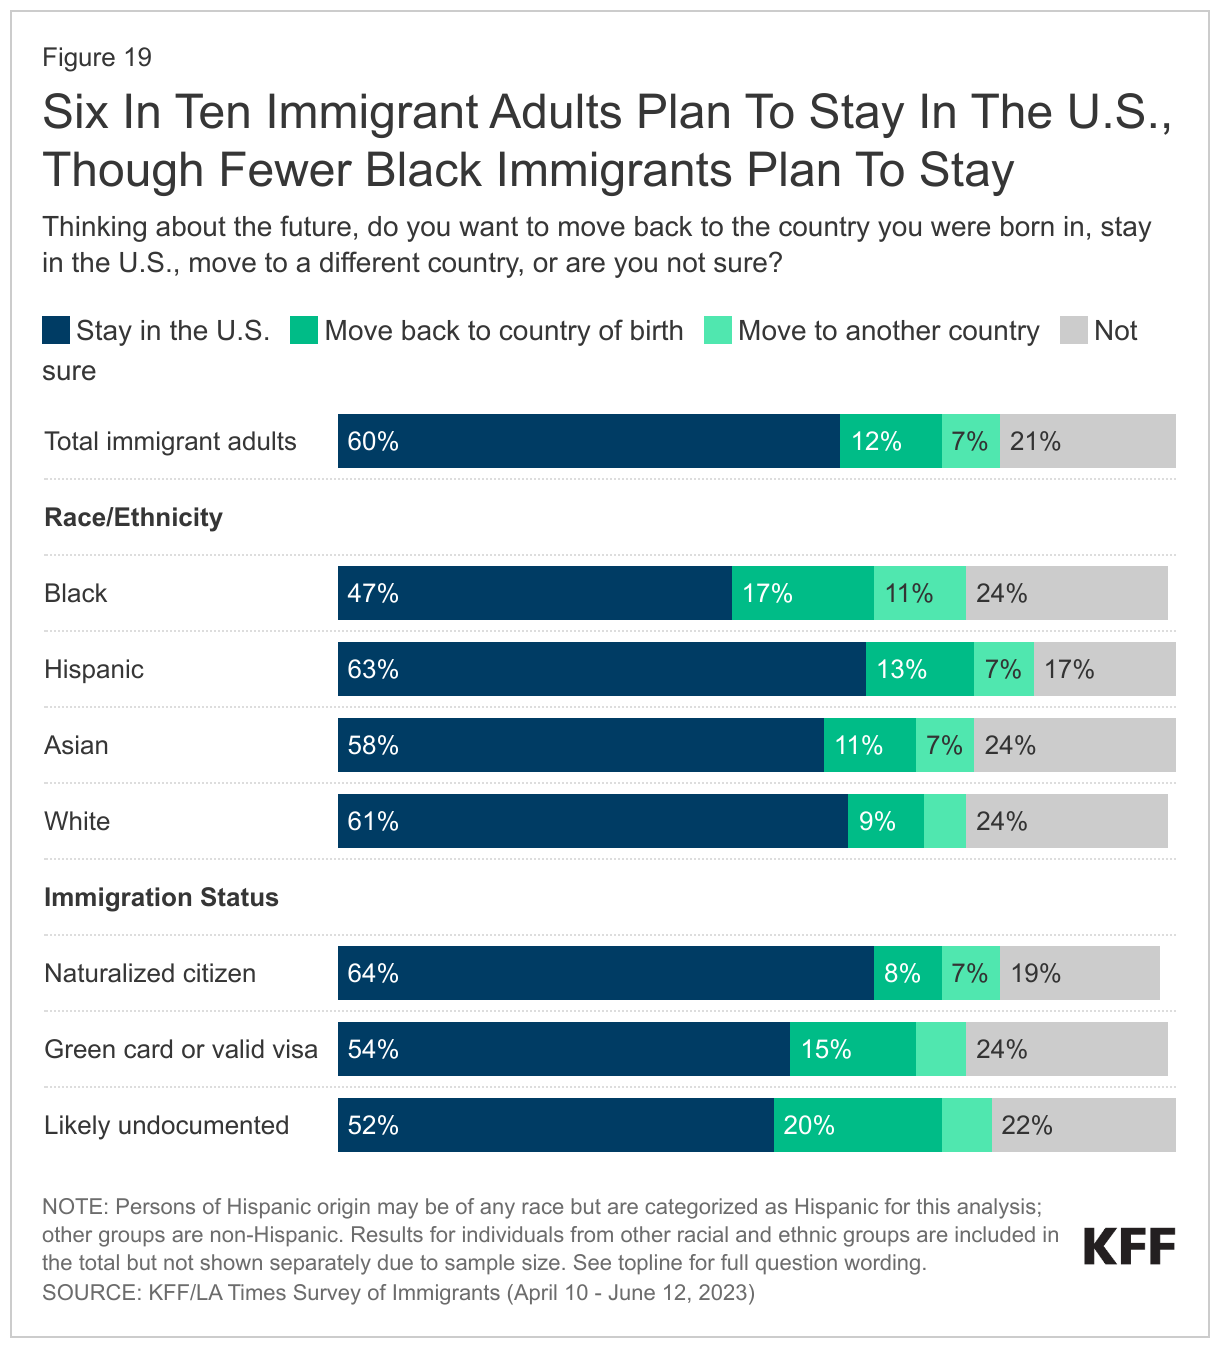
Six in ten immigrants say they plan to stay in the U.S. However, about one in five immigrants say they want to move back to the country they were born in (12%) or to another country (7%), and about one in five (21%) say they are not sure. The desire to stay in the U.S. varies by immigration status as well as by race and ethnicity. Nearly two in three immigrants who are naturalized citizens say they plan to stay in the country, compared to about half of immigrants who have a green card or valid visa (54%) or immigrants who are likely undocumented (52%). Black immigrants are somewhat more likely than immigrants from other racial or ethnic backgrounds to say they plan to leave the U.S. (28%). This includes 17% who say they want to move back to their country of birth and 11% who say they want to move to a different country.
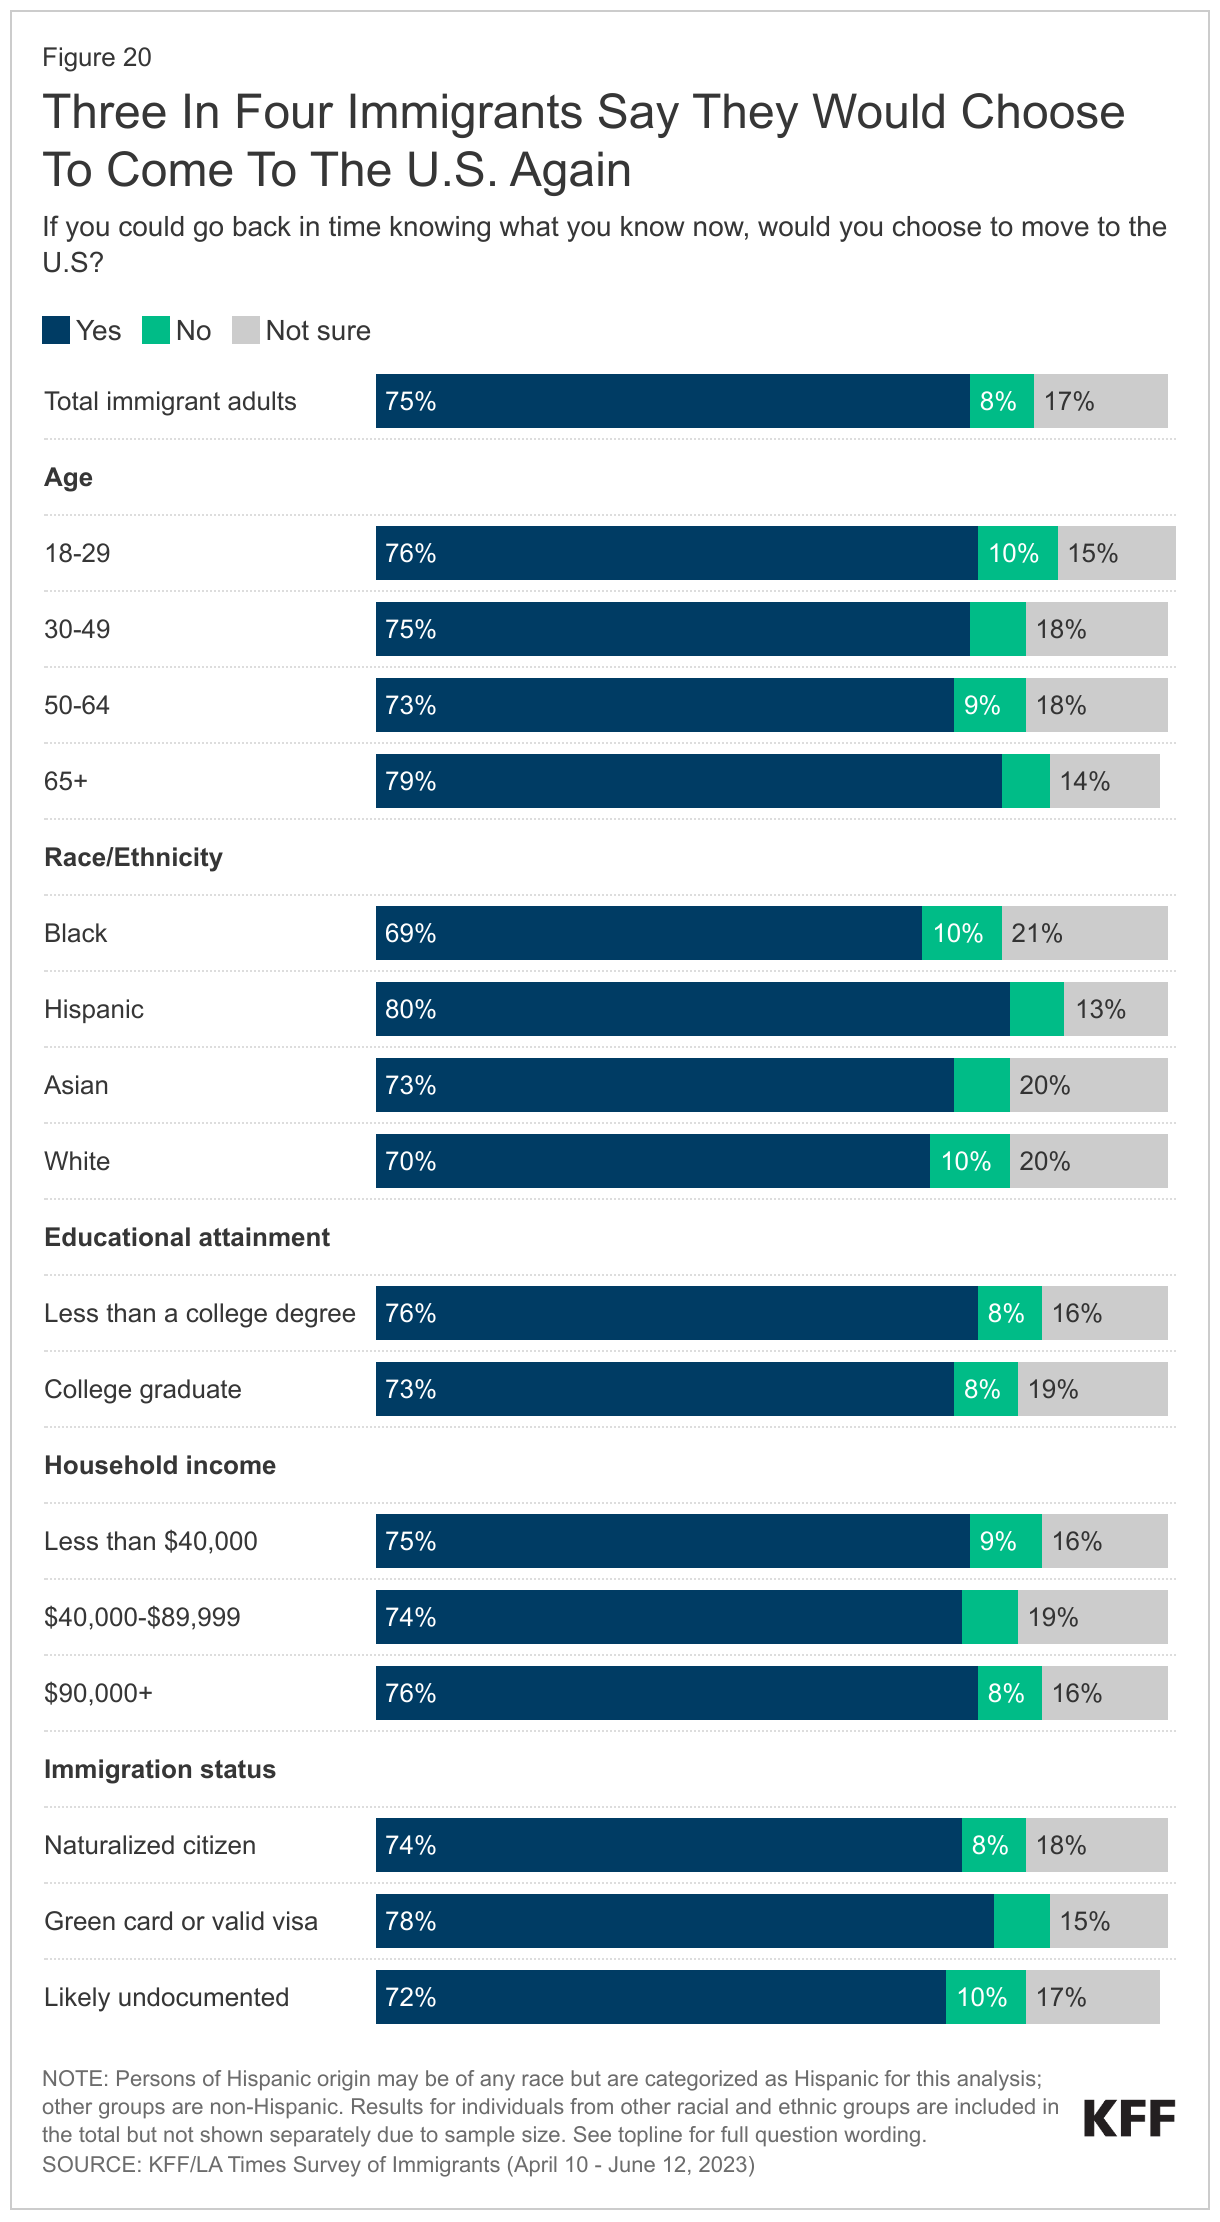
Three in four immigrants say they would choose to come to the U.S. again. Asked what they would do if given the chance to go back in time knowing what they know now, three in four immigrants (75%) say they would choose to come to the U.S. again, including large shares across ages, educational attainment, income, immigration status, and race and ethnicity. While most immigrants share this sentiment, overall, about one in ten (8%) immigrants say they would not choose to move to the U.S. and about one in five (17%) say they are not sure whether they would choose to move to the U.S.
In Their Own Words: Focus Group Participants Say They Would Choose To Come To The U.S. Again
In focus groups, many participants said that despite the challenges they face in the U.S., life is better here than in their country of birth. When asked whether they would choose to come again, many said yes and pointed to how they have more opportunities for themselves and their children to have a better standard of living.
“So I will not change anything for my kids or for myself. I think it didn’t work out like I expected to do but I don’t regret it because my kids have the better chance to have a better education system”-42-year-old Ghanian immigrant woman in California
“I can say from my experience, it was really hard. God made everything right now because I have my papers. But I agreed to stay here for my children, so that they have a better life tomorrow. Because home is worse.” – 48-year-old Haitian immigrant woman in Florida
“Of course, I would still come to America. When I compare my current state with that of my old neighbors, who are my age as well, this place is a far cry from it.” – 40-year-old Vietnamese immigrant man in Texas
“We’re happy because we have a better life, even though we always miss our homeland. But it’s better.” – 35-year-old Mexican immigrant man in California
“I can say that America gives me many options, many opportunities, so far I like it. The only thing I don’t like is how the bills are here, they come fast when you make a small amount of money many times it goes through the bill.” – 30-year-old Haitian immigrant man in Florida
Conclusion
Immigrants represent a significant and growing share of the U.S. population, contributing to their communities and to the nation’s culture and economy. Immigrants come to the U.S. largely seeking better opportunities and lives for themselves and their children, often leaving impoverished and sometimes dangerous conditions in their country of birth. For many, this dream has been realized despite ongoing challenges they face in the U.S.
Many immigrants recognize work as a key element to achieving their goals and are willing to fill physically demanding, lower paid jobs, for which some feel they are overqualified. Immigrants are disproportionately employed in agricultural, construction, and service jobs that are often essential for our nation’s infrastructure and operations.
Despite high rates of employment and, for many, an improved situation relative to their county of birth, many immigrants face serious challenges in the U.S. Finances are a top challenge and concern, with many having difficulty making ends meet and paying for basic needs. Moreover, although most immigrants feel welcome in their neighborhood, many face discrimination and unfair treatment on the job, in their communities, and while seeking health care. Fears of detention and deportation are a concern for immigrants across immigration statuses, sometimes affecting daily lives and interactions, particularly among those who are likely undocumented.
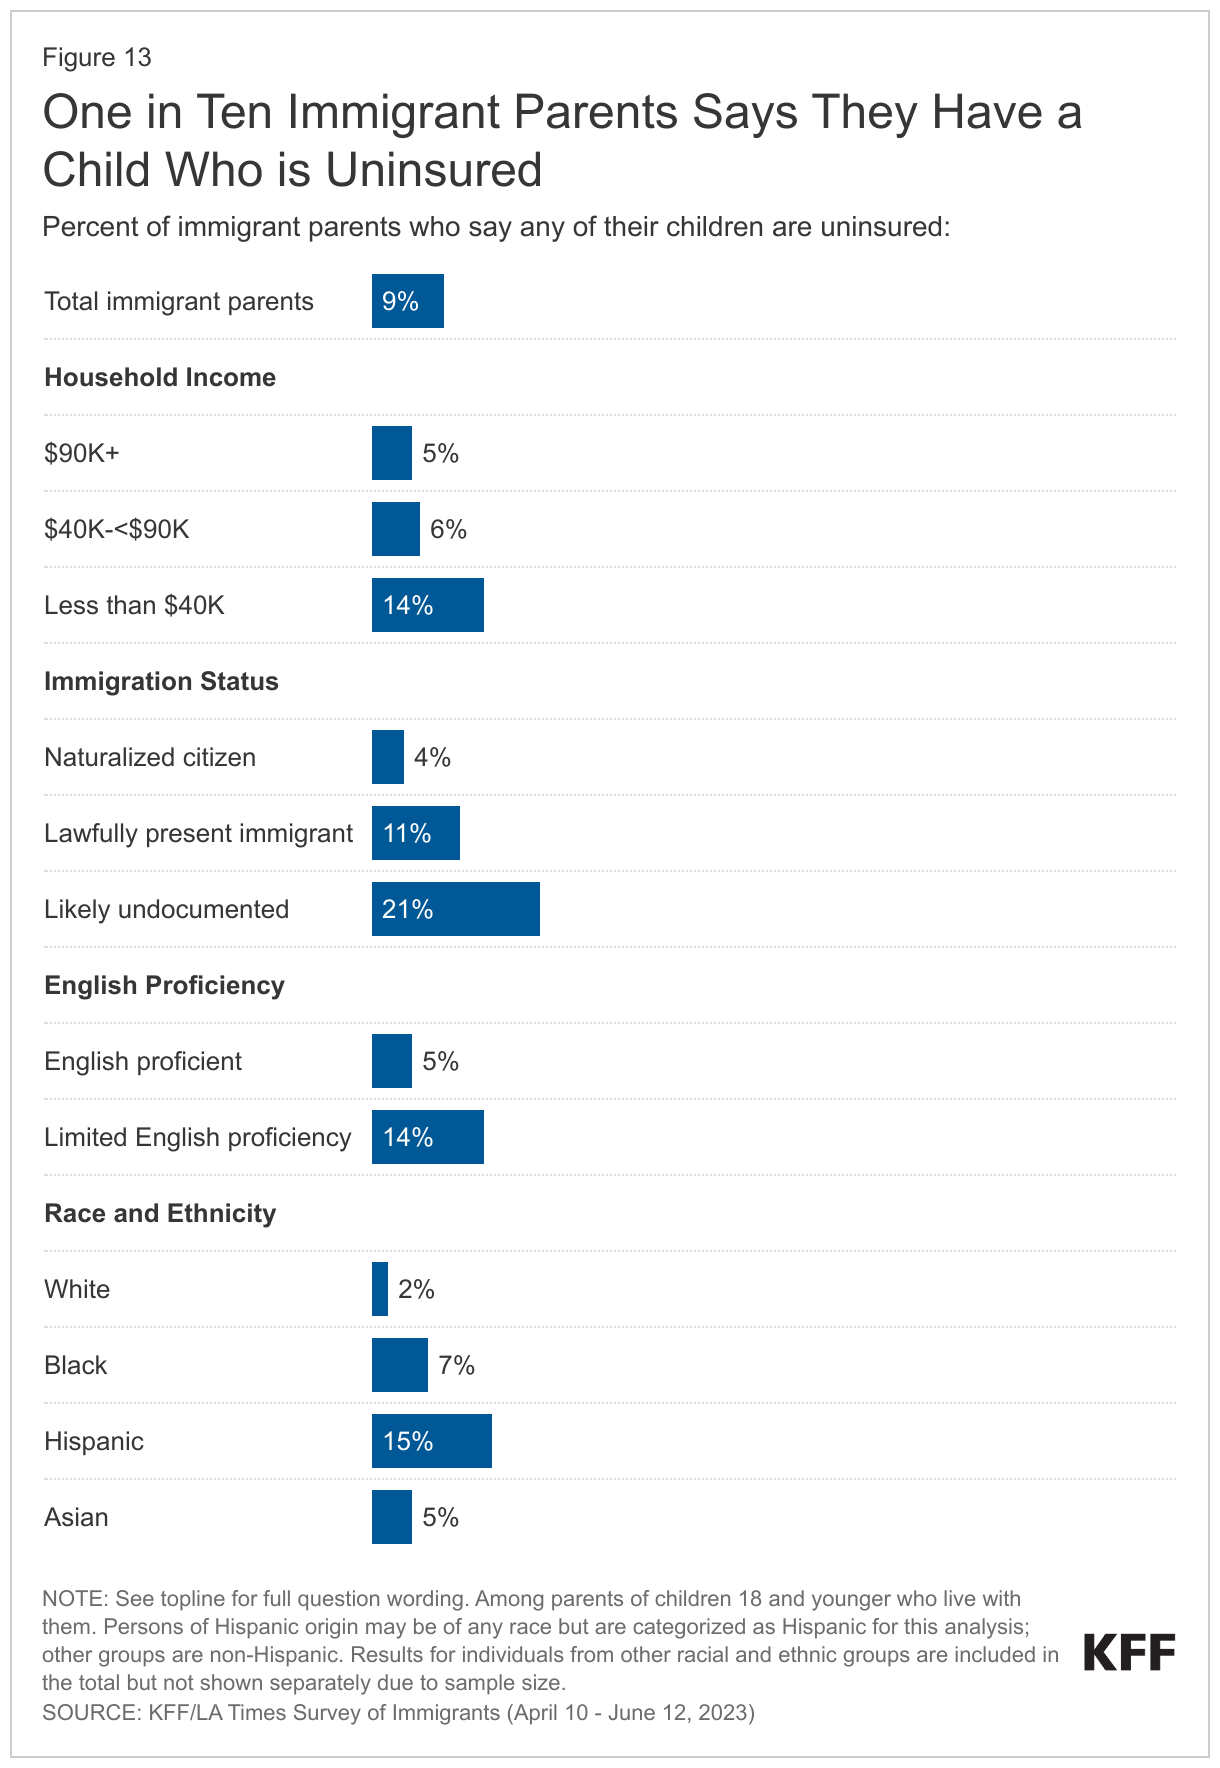
Some immigrants face more challenges than others, reflecting the diversity of the immigrant experience and the compounding impacts of intersectional factors such as immigration status, race and ethnicity, and income. Black and Hispanic immigrants, likely undocumented immigrants, immigrants with limited English proficiency, and lower income immigrants face disproportionate challenges given the impacts of racism, fears and uncertainties related to immigration status, language barriers, and financial challenges. Many immigrants lack sufficient information to understand how U.S. immigration laws and policies impact them and their families. This confusion and lack of certainty contributes to some immigrants avoiding accessing assistance programs that could ease financial challenges and facilitate access to health care for themselves and their children, who are often U.S.-born.
As the immigrant population in the U.S. continues to grow, recognizing their contributions and challenges of immigrants and addressing their diverse needs will be important for improving the nation’s overall health and economic prosperity.
Methodology
The KFF/LA Times Survey of Immigrants is a partnership survey conducted by KFF and the LA Times examining the U.S. immigrant experience.
The survey was conducted April 10-June 12, 2023, online, by telephone, and by mail among a nationally representative sample of 3,358 immigrants, defined as adults living in the U.S. who were born outside the U.S. and its territories. Respondents had the option to complete the survey in one of ten languages: English (n=2,435), Spanish (n=627), Chinese (n=171), Korean (n=52), Vietnamese (n=22), Portuguese (n=16), Haitian-Creole (n=13), Arabic (n=9), French (n=9), and Tagalog (n=4). These languages were chosen as they are most commonly spoken by immigrant adults from countries of focus for the survey with limited English proficiency (LEP), based on the 2021 American Community Survey (2021).
Teams from KFF and The Los Angeles Times worked together to develop the questionnaire and both organizations contributed financing for the survey. KFF researchers analyzed the data, and each organization bears the sole responsibility for the work that appears under its name. Sampling, data collection, weighting, and tabulation were managed by SSRS of Glenn Mills, Pennsylvania in collaboration with public opinion researchers at KFF.
Respondents were reached through one of three sampling modes: an address-based sample (ABS) (n=2,661); a random digit dial telephone (RDD) sample of prepaid (pay-as-you go) cell phone numbers (n=565); and callbacks to telephone numbers that that were previously randomly sampled for RDD surveys and were identified as speaking a language other than English or Spanish (n=132). Respondents from all three samples were asked to specify their country of birth and qualified for the survey if they were born outside of the U.S.
Project design was informed by a pilot study conducted from January 31-March 14, 2022 among a sample of 1,089 immigrants in collaboration with SSRS. Prior to fielding the pilot study, KFF and SSRS conducted interviews with experts who had previous experience surveying immigrants. These conversations informed decisions on sampling, modes of data collection, recruitment strategies, and languages of interviews. The pilot test measured incidence of immigrant households across four different sample types and offered a short survey in 8 different languages both online and on the telephone. Based on the results of the pilot test, the following recruitment and data collection protocol was implemented:
Sampling strategy and interview modes:The ABS was divided into areas (strata), defined by Census tract, based on the incidence of immigrants among the population overall and by countries of origin. Within each stratum, the sample was further divided into addresses that were flagged by Marketing Systems Group (MSG) as possibly occupied by foreign-born adults and unflagged addresses. To increase the likelihood of reaching immigrant adults, strata with higher incidence of immigrant households overall, and of immigrants from certain countries of origin were oversampled.
Households in the ABS were invited to participate through multiple mail invitations: 1) an initial letter in English with a short paragraph of instructions in each of the 10 survey languages on the back; 2) a reminder postcard in English plus up to two additional languages; 3) a follow-up letter accompanied by hardcopy questionnaires in English and one additional language; and 4) a final reminder including short messages in all 10 languages. For mailings 2 and 3, additional languages were chosen by using flags to identify the language other than English likely spoken at home. Invitation letters requested the household member ages 18 or older who was born outside of the U.S. with the most recent birthday to complete the survey in one of three ways: by going online, dialing into a toll-free number, or returning the completed paper questionnaire. In addition, interviewers attempted outbound calls to telephone numbers that were matched to sampled addresses. ABS respondents completed the survey online (n=2,087), over the phone (n=105), or by mail on paper (n=469). The random sample of addresses was provided by MSG.
The RDD sample of prepaid (pay-as-you-go) cell phone numbers was obtained through MSG. The prepaid cell phone component was disproportionately stratified to effectively reach immigrants from different countries based on county-level information. To increase the likelihood of reaching immigrant adults, counties with higher incidence of immigrants overall, and of certain countries of origin were oversampled.
The callback sample included 132 respondents who were reached by calling back telephone numbers that were previously randomly sampled for SSRS RDD surveys within two years and coded by interviewers as non-English or non-Spanish speaking. as having respondents speaking languages other than English or Spanish.
Incentives:Initial mailings to the ABS sample included $2 as part of the invitation package, and respondents received a $10 incentive if they completed the survey in the first two weeks after the initial mailing. In order to increase participation among under-represented groups, the incentive increased to $20 for those who did not respond within the first two weeks. ABS phone respondents received this incentive via a check received by mail, paper respondents received a Visa gift card by mail, and web respondents received an electronic gift card incentive. Respondents in both phone samples received a $25 incentive via a check received by mail.
Questionnaire design and translation:In addition to collaboration between KFF and the LA Times, input from organizations and individuals that directly serve or have expertise in issues facing immigrant populations helped shaped the questionnaire. These community representatives were offered a modest honorarium for their time and effort to review questionnaire drafts, provide input, attend meetings, and offer their expertise on dissemination of findings.
After the content of the questionnaire was largely finalized, SSRS conducted a telephone pretest in English and adjustments were made to the questionnaire. Following the English pretest, Research Support Services Inc. (RSS) translated the survey instrument from English into the nine languages outlined above and performed cognitive testing through qualitative interviews in all languages including English. The results of the cognitive testing were used to adjust questionnaire wording in all languages including English to ensure comprehension and cohesiveness across languages and modes of interview. As a final check on translation and its overlay into the web and CATI program, translators from Cetra Language Solution reviewed each question, as it appears in the program, and provided feedback. The questionnaire was revised and finalized based on this feedback.
Data quality checks:A series of data quality checks were run on the final data. The online questionnaire included two questions designed to establish that respondents were paying attention and cases were monitored for data quality. Fifteen cases were removed from the data because they failed two or more quality checks, failed both attention check questions, or skipped over 50% of survey questions. An additional 67 interviews were removed after deemed ineligible by SSRS researchers (they were not U.S. immigrants).
Weighting:The combined sample was weighted to adjust for the sampling design and to match the characteristics of the U.S. adult immigrant population, based on data from the Census Bureau’s 2021 American Community Survey (ACS). Weighting was done separately for each of 11 groups defined by country or region of origin (Mexico, China, Other East/Southeast Asia, South Asia, Europe, Central America, South America, Caribbean, Middle East/North Africa, Sub-Sahara Africa, all others). The samples were weighted by sex, age, education, race/ethnicity, census region, number of adults in the household, presence of children in the household, home ownership, time living in the U.S., English proficiency, and U.S. citizenship. The overall sample was also weighted to match the share of U.S. adult immigrants from each country/region of origin group. The weights take into account differences in the probability of selection for each of the three sample types. This includes adjustment for the sample design and geographic stratification, and within household probability of selection. Subgroup analysis includes data checks to ensure that the weighted demographics of subgroups are within reasonable range from benchmarks whenever possible.
The margin of sampling error including the design effect for the full sample is plus or minus 2 percentage points. Numbers of respondents and margins of sampling error for key subgroups are shown in the table below. For results based on other subgroups, the margin of sampling error may be higher. Sample sizes and margins of sampling error for other subgroups are available by request. Sampling error is only one of many potential sources of error and there may be other unmeasured error in this or any other public opinion poll. KFF public opinion and survey research is a charter member of the Transparency Initiative of the American Association for Public Opinion Research.
| Group | N (unweighted) | M.O.S.E. |
| Total | 3,358 | ± 2 percentage points |
| Race/Ethnicity | ||
| Black immigrants | 274 | ± 8 percentage points |
| Hispanic immigrants | 1,207 | ± 4 percentage points |
| Asian immigrants | 1,318 | ± 4 percentage points |
| White immigrants | 495 | ± 6 percentage points |
| Immigration Status | ||
| Naturalized citizen | 2,134 | ± 3 percentage points |
| Green card or valid visa holder | 819 | ± 5 percentage points |
| Likely undocumented | 372 | ± 6 percentage points |
| English Proficiency | ||
| Speaks English only or “very well” | 1,713 | ± 3 percentage points |
| Speaks English “less than very well” | 1,635 | ± 3 percentage points |
Focus group methodology:
As part of this project, KFF conducted 13 focus groups with immigrant adults across the country to help inform survey questionnaire development, provide deeper insights into the experiences of immigrant groups that had a smaller sample size in the survey, and to provide a richer understanding of some of the survey findings.
Two rounds of focus groups were completed. The first round of 6 groups was conducted between September-October 2022 virtually among participants living across the country who are Hispanic immigrants (conducted in Spanish), Asian (excluding Chinese) immigrants (conducted in English), or Chinese immigrants (conducted in Mandarin Chinese). The groups were separated by gender, lasted 90 minutes, and included 5-7 participants each.
The second round of groups were conducted in-person between May-June 2023 in Los Angeles, CA and Fresno, CA with Hispanic immigrants conducted in Spanish; and in Houston, TX and Irvine, CA with Vietnamese immigrants conducted in Vietnamese. In addition, virtual groups were conducted among participants living in the Texas border region (Hispanic immigrants), the Miami, FL region (Haitian immigrants), and nationally (Black immigrants from sub-Saharan Africa). Groups were mixed gender, lasted between 90 minutes and two hours, and were conducted in English, Spanish, Vietnamese, and Haitian-Creole with 5-8 participants each.
For each group, participants were chosen based on the following criteria: Must be at least 18 years of age and have been born outside of the U.S. and its territories; for groups conducted in languages other than English, must speak English “less than very well” and be able to speak conversationally in the group’s language (i.e., Spanish). In addition, groups were chosen to represent a mix of household composition, including at least some participants who are parents; a mix of household income levels, with a preference for recruiting lower income participants; a mix of health insurance types; and a mix of immigration statuses. Goodwin Simon Strategic Research (GSSR) recruited and hosted the first round of focus groups. PerryUndem recruited and hosted the second round of focus groups. The screener questionnaire and discussion guides were developed by researchers at KFF in consultation with the firms who recruited and hosted the groups. Groups were audio and video recorded with participants’ permission. Each participant was given $150-$175 after participating.
Appendix
Endnotes
- Supplemental to the Survey of Immigrants, KFF also conducted a representative survey of 1,049 U.S.-born adults. to compare the immigrant and native-born experience. KFF/LA Times Survey of Immigrants: U.S. Born Adult Comparison (June 29 – July 9, 2023). ↩︎
- The estimate of the total number of noncitizens in the US is based on the 2021 American Community Survey (ACS) 1-year Public Use Microdata Sample (PUMS). The ACS data do not directly indicate whether an immigrant is lawfully present or not. We draw on the methods underlying the 2013 analysis by the State Health Access Data Assistance Center (SHADAC) and the recommendations made by Van Hook et. al.1,2 This approach uses the Survey of Income and Program Participation (SIPP) to develop a model that predicts immigration status; it then applies the model to ACS, controlling to state-level estimates of total undocumented population from Pew Research Center. For more detail on the immigration imputation used in this analysis, see the Technical Appendix B. ↩︎