Introduction
In recent years, there has been increased attention to the ongoing impacts of racism and discrimination in U.S. society. In the wake of the killings of George Floyd and Breonna Taylor and the underlying inequities exposed by the COVID-19 pandemic, there have been calls for recognizing structural racism and bias and taking action to address them. In health care, specifically, there is a long history of policies and events that contributed to present-day disparities, and race continues to permeate clinical decision making and treatment in multiple ways.
This report examines U.S. adults’ views on racism in major aspects of U.S. society, including politics, the criminal justice system, policing, education, housing, employment, and health care and how they vary by race and ethnicity, other demographics, experiences with discrimination, and political identity. It also explores the level of trust in health care providers, the police and the courts and how levels of trust vary by race and ethnicity and other demographics, as well as experiences with discrimination and unfair treatment.
These findings come from KFF’s 2023 Racism, Discrimination, and Health Survey, which documents the extent and implications of racism and discrimination, particularly with respect to people’s interactions with the health care system. A previous report from the survey focused on individuals’ experiences with racism and discrimination in health care and more broadly, and the relationship of those experiences to health and well-being.
Key Takeaways
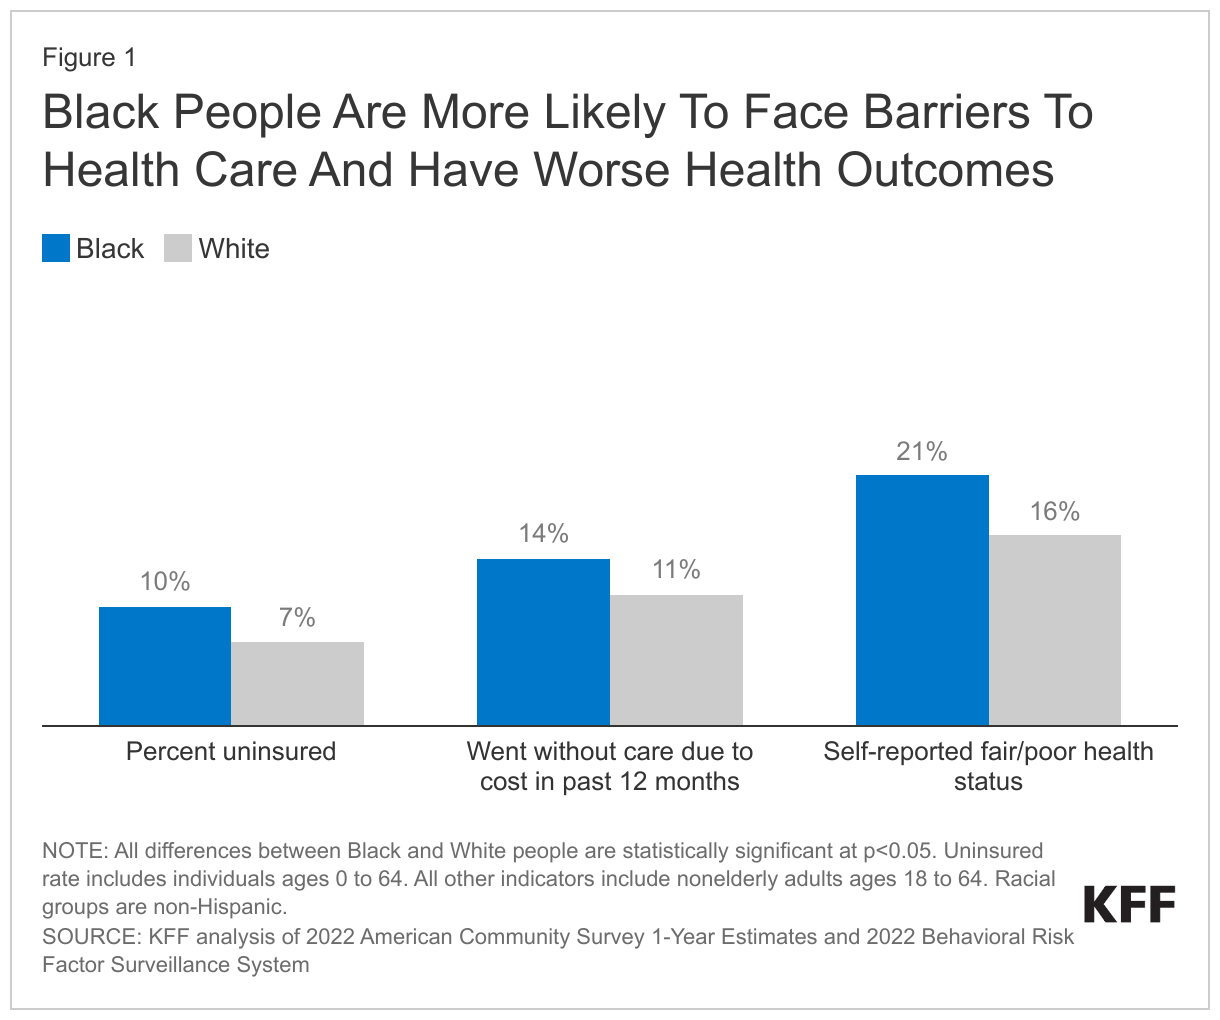
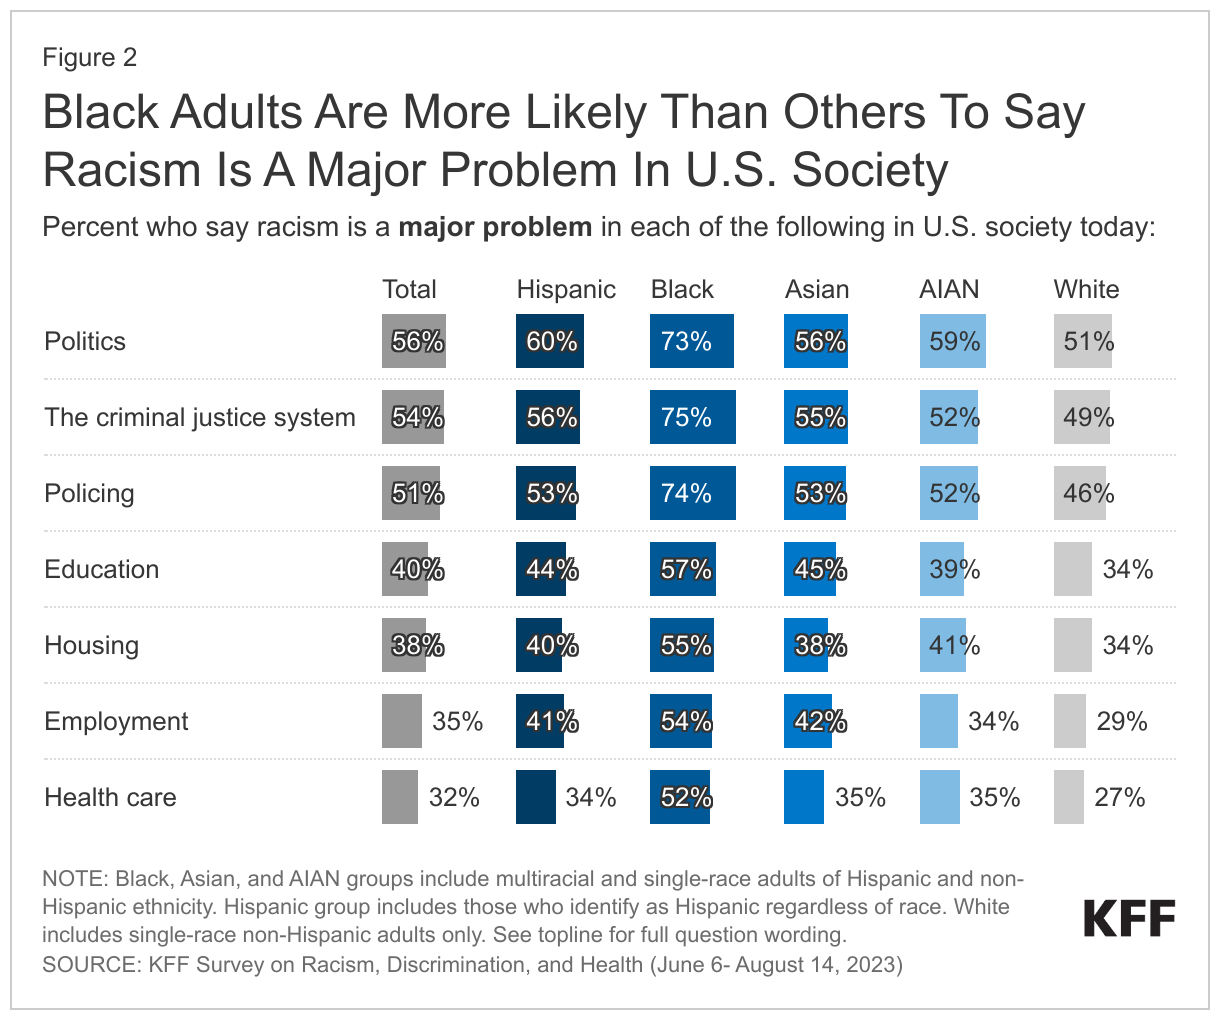
Large majorities of adults say racism is at least a minor problem in U.S. politics, criminal justice, policing, education, housing, employment, and health care, and Black adults are much more likely to view racism as a major problem in each area. Majorities of Black adults see racism as a major problem in each of these areas, and Black adults are at least 20 percentage point more likely than White adults to hold this view. Substantial shares of Hispanic, Asian, and American Indian and Alaska Native (AIAN) adults view racism as a problem in these areas, while White adults are generally less likely than other groups to see racism as a problem.
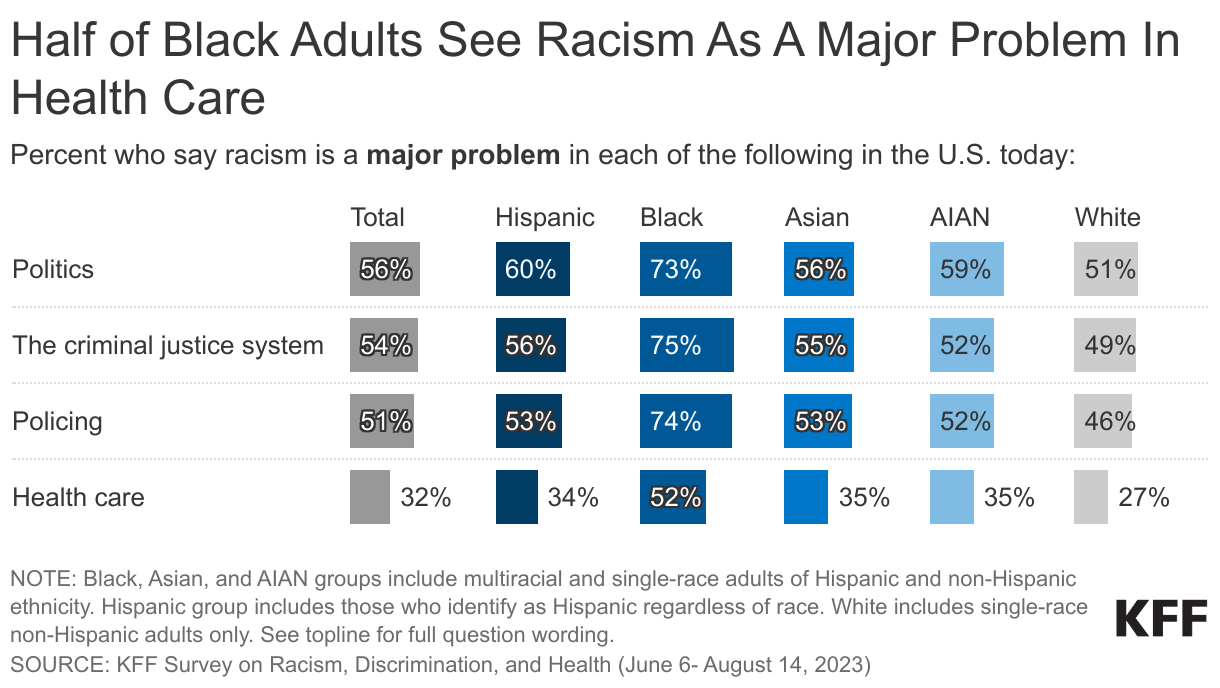
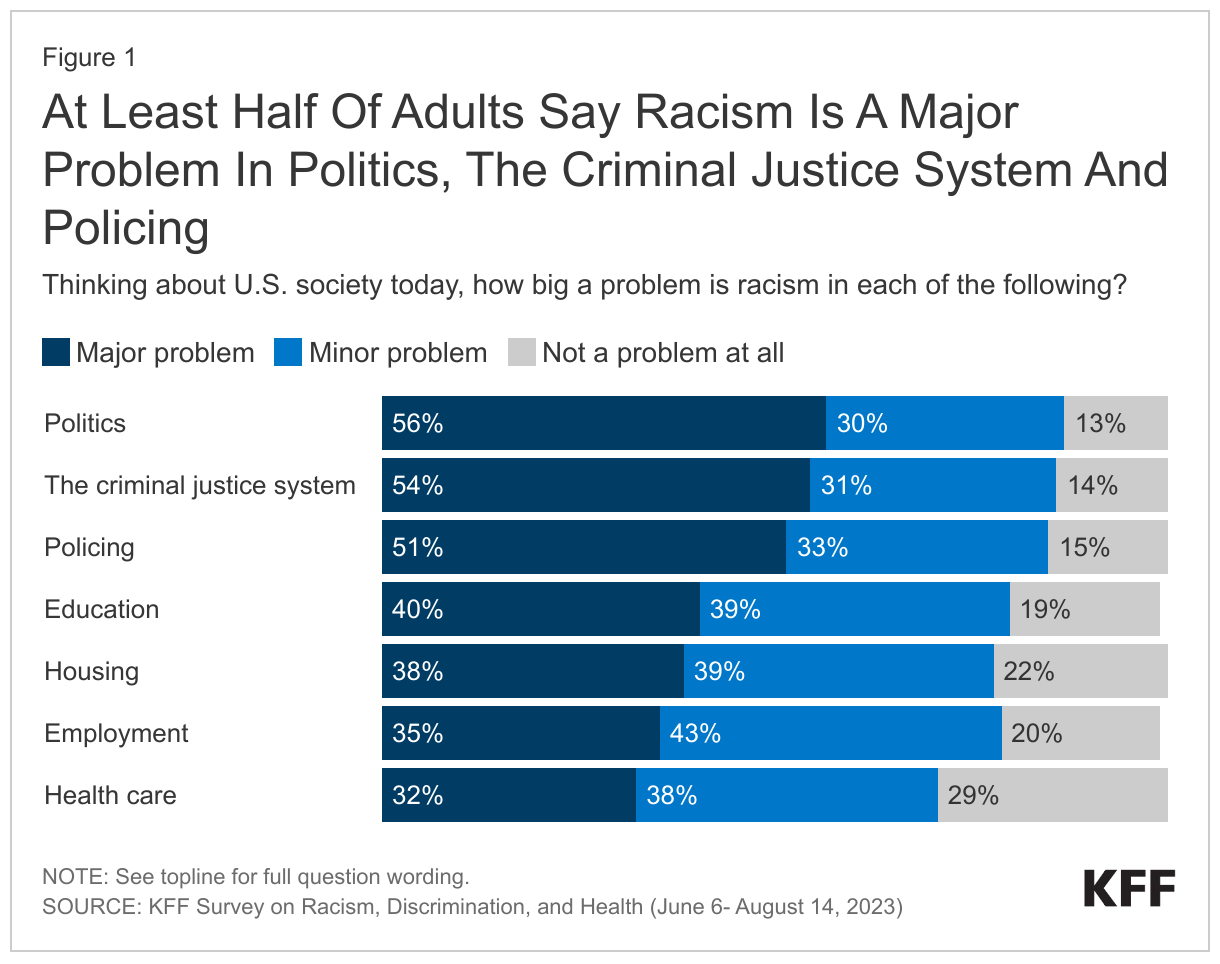
At least half of adults say racism is a major problem in U.S. politics (56%), criminal justice (54%), and policing (51%), while a smaller share (32%) see racism as a major problem in health care. More than seven in ten Black adults, majorities of Hispanic, Asian, and AIAN adults, and about half of White adults say racism is a major problem in politics, the criminal justice system, and policing. The smaller share seeing racism as a problem in health care relative to other areas may reflect higher levels of trust in health care providers, particularly compared to the police and the courts.
Partisanship is one of the strongest predictors of views of racism in U.S. society today, but among Republicans, these views differ by race and ethnicity. Across most aspects of society included in the survey, majorities of Democrats across racial and ethnic groups see racism as a major problem. Republicans overall are much less likely to view racism as a problem, but among Republicans, Black, Hispanic and Asian adults are more likely than White adults to say racism is a major problem across most of these areas. In addition to partisan differences, women, LGBT adults, and those with a college degree or higher are more likely to view racism as a major problem.
Adults who have experienced discrimination in their daily lives generally and in health care, policing, and employment specifically are more likely than those without these experiences to say racism is a major problem in these areas. For example, adults who say they were treated unfairly or with disrespect by a health care provider in the past three years are more likely than those who haven’t had this experience to say racism is a major problem in health care.
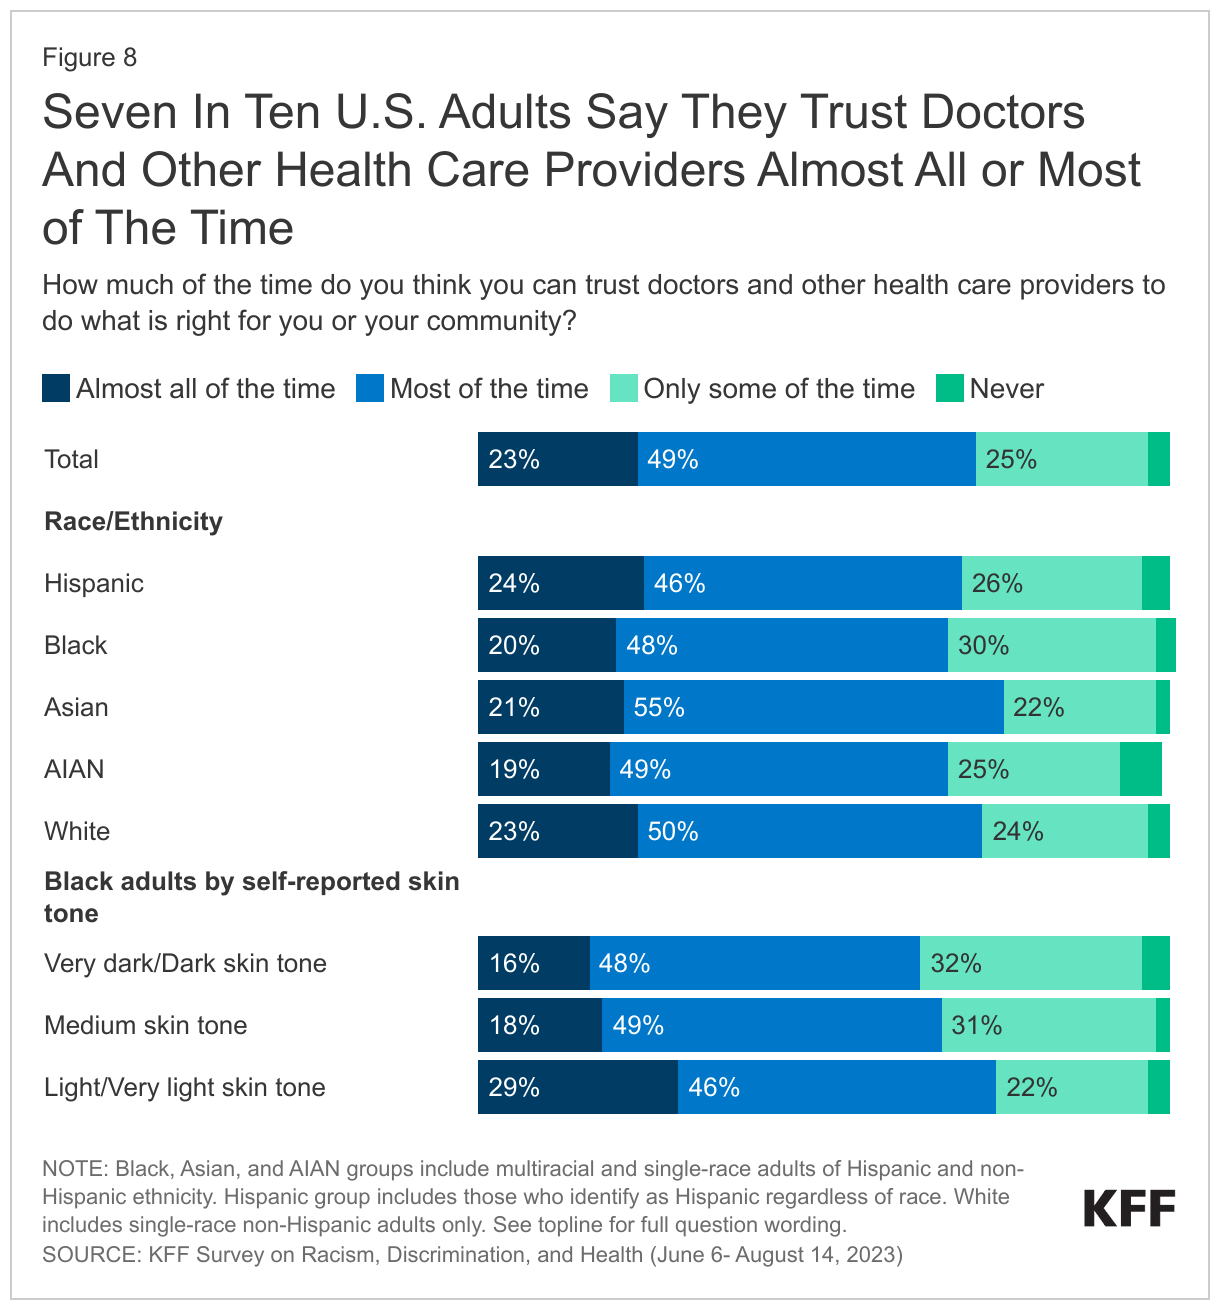
Majorities of adults across racial and ethnic groups say they trust doctors and health care providers to do what is right for them and their community all or most of the time. At least two-thirds of adults across racial and ethnic groups say they trust doctors and other health care providers almost all or most of the time. This relatively high level of trust in health care providers may be one reason that fewer adults see racism as a problem in health care compared to other areas of society.
Black adults, those with darker skin color and adults with experiences of discrimination are less likely than their counterparts to trust health care providers. Black adults are somewhat less likely than White adults to trust health care providers, and among Black and Hispanic adults, those with self-reported darker skin color are less likely than those with lighter skin color to say they trust providers. Past experiences with discrimination also are associated with lower trust in health care providers. Across groups, adults who say they were treated unfairly or with disrespect by a health care provider in the past three years are less likely than those who do not report a negative experience to say they trust providers to do what is right for their community all or most of the time.
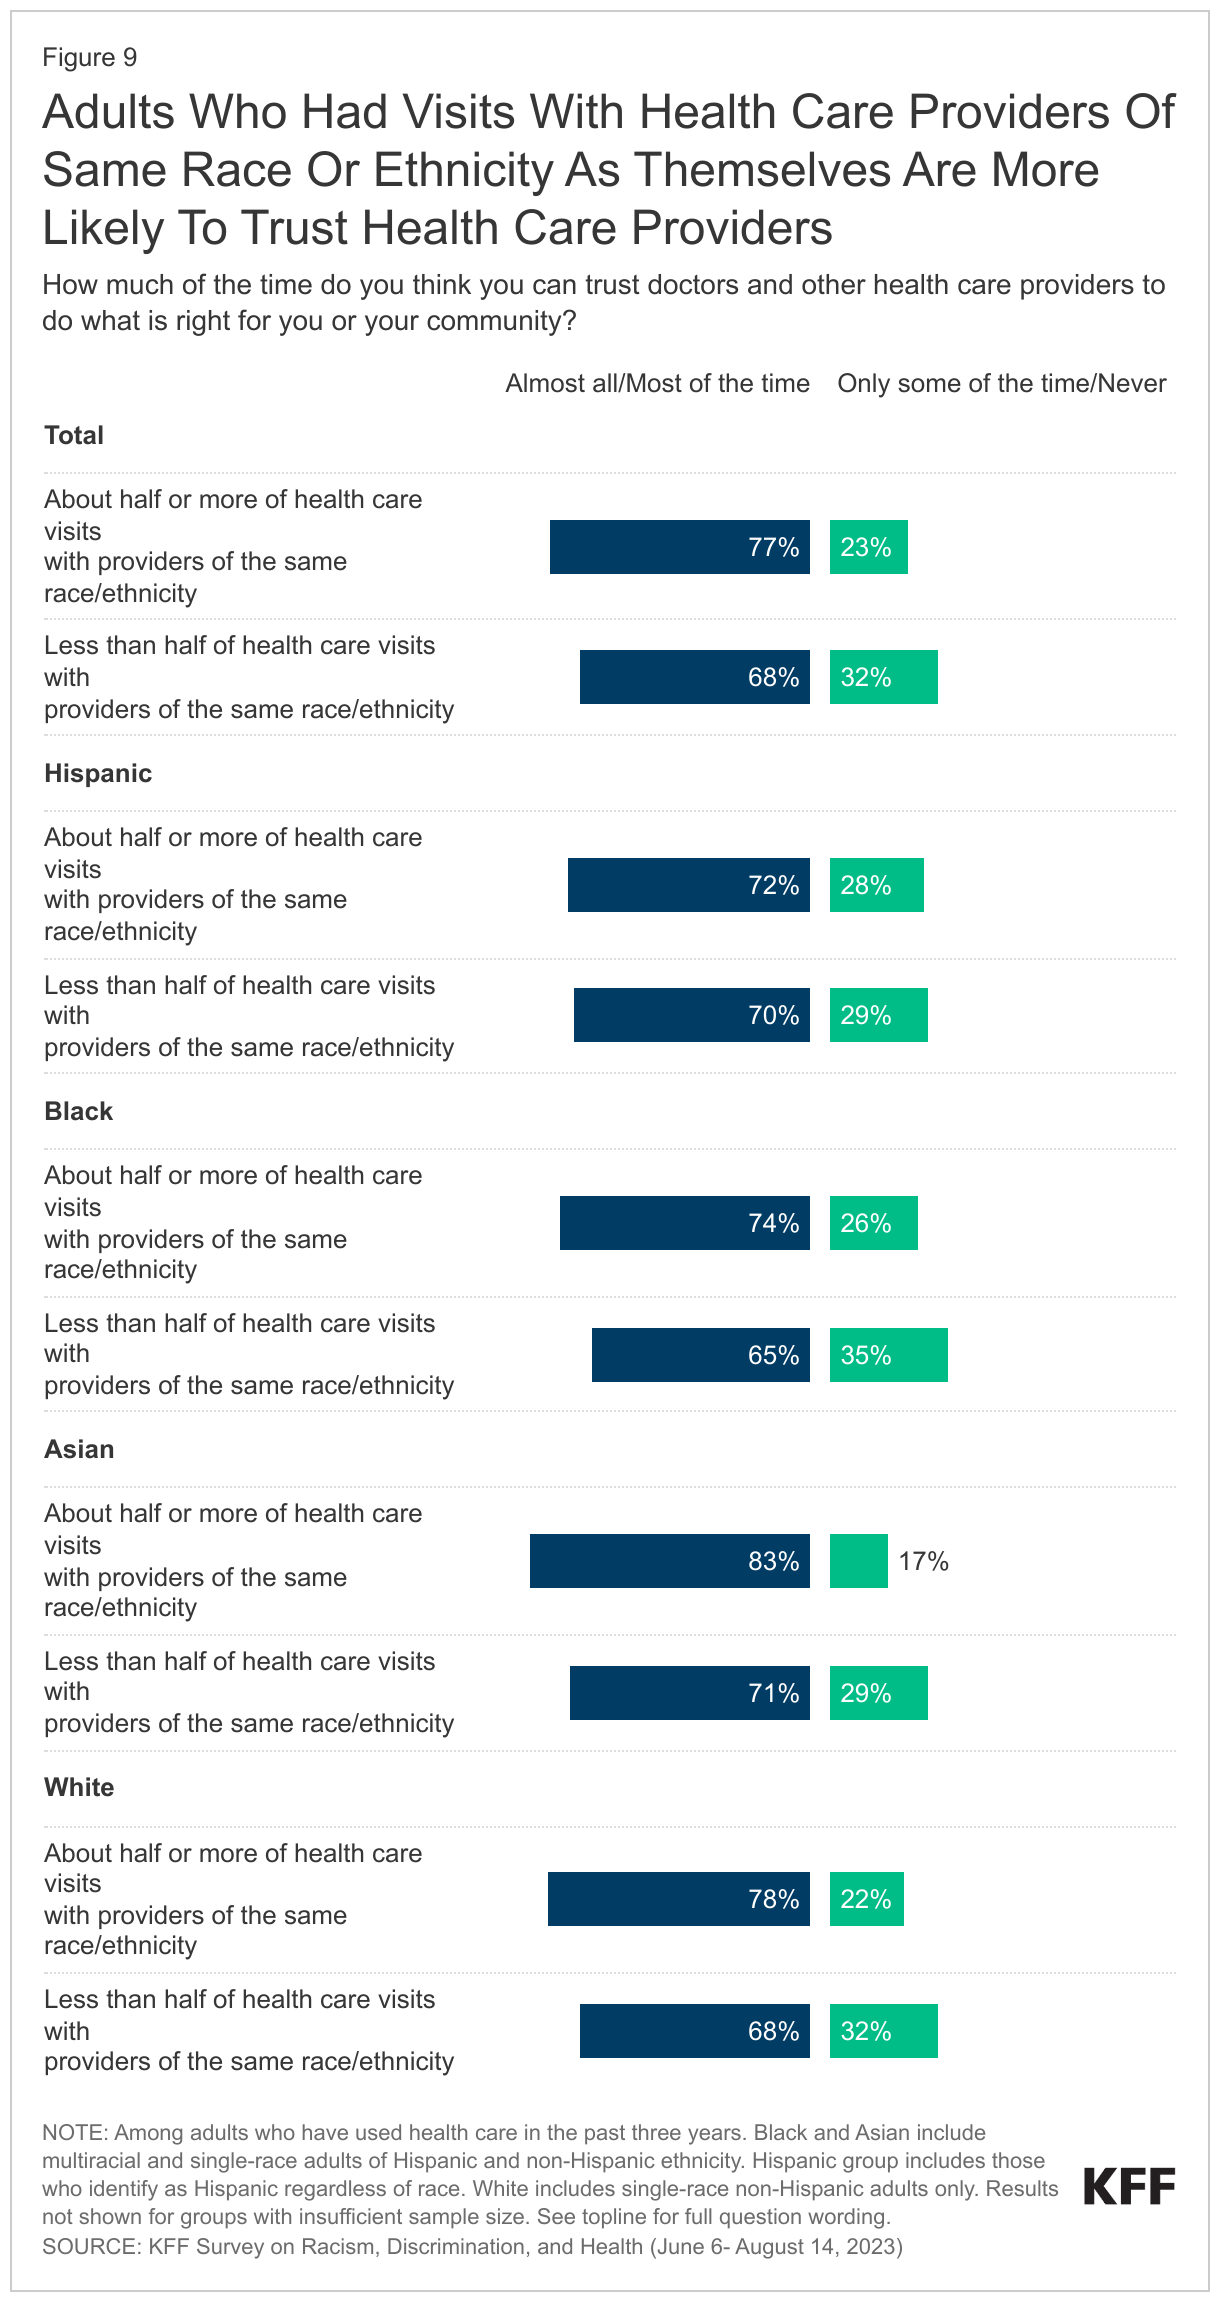
Having more visits with providers who have a shared racial background or language is associated with higher levels of trust in doctors and health care providers. Black and Asian adults who have more visits with providers who share their racial background, as well as Spanish-speaking Hispanic adults who have more visits with providers who speak their language, are more likely than their counterparts who have fewer visits with providers who share their racial background or language to say they trust doctors and other health care providers to do what is right for them and their community all or most of the time.
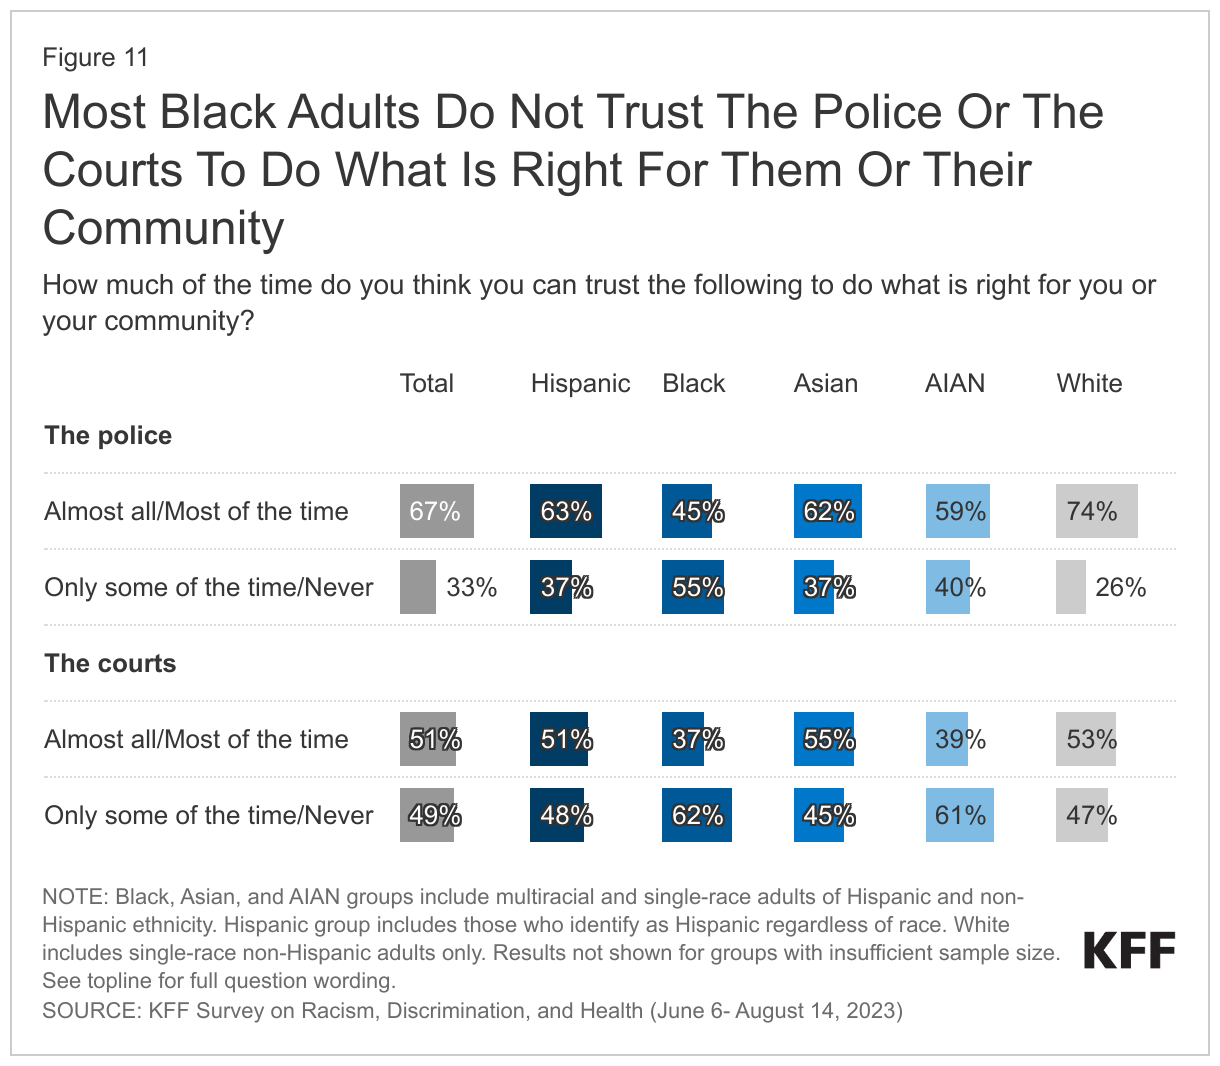
Levels of trust in the police and the courts are lower among U.S. adults overall and across racial and ethnic groups compared with trust in health care providers, which may reflect higher shares who view racism as a major problem in these institutions. Two-thirds of adults say they trust the police all or most of the time to do what is right for their community and about half say the same about the U.S. courts, with substantially lower shares among Black adults (45% and 37%, respectively). Among Black adults who say they or a family member was threatened or mistreated by police in the past year (11% of all Black adults), just one in five say they trust the police all or most of the time.
Implications
These findings illustrate that, despite increased calls to address racism in recent years, many adults continue to see racism as a problem across aspects of U.S. society. While adults who experience more racism in their lives are more likely to view it as a major problem, these views are shared across groups, with roughly half of White adults viewing racism as a major problem in in politics, the criminal justice system, and policing. There is a stark partisan divide in views on racism, but among Republicans, Black, Hispanic, and Asian adults are much more apt to identify racism as an institutional problem compared to their White counterparts.
These findings underscore the importance of continued efforts to address structural and systemic racism across multiple aspects of society and particularly in politics, policing, and the criminal justice system. Compared to these areas of society, fewer adults see racism as a major problem in health care and trust in health care providers is relatively high, particularly in contrast to trust in the police and the courts. Still, the survey suggests pathways for improvement on both these measures. Those who have had past experiences with unfair treatment in health care settings are more likely to view racism as a problem in health care, and earlier analysis identified that these experiences remain common and are associated with negative impacts on health and well-being. Having a provider with a shared racial background and language further increases levels of trust, highlighting the importance of continuing to diversify the health care workforce and enhancing the ability of all providers to provide culturally and linguistically appropriate care.
Notes on Racial and Ethnic Groups Included in This Report
Many surveys and data analyses classify individuals into non-overlapping racial and ethnic categories using single-race and Hispanic ethnicity categories and grouping those who identify as more than one race into a “multiracial” or “other” category. To allow for better representation of experiences of the growing shares of people who identify as multiracial, this report uses an “alone or in combination” approach for classifying individuals so that they are represented within each racial and ethnic group with which they identify, resulting in overlapping racial and ethnic categories. For example, responses from someone who identifies as both Black and Asian are included in the results for both Black adults and Asian adults, and responses from someone who identifies as American Indian and Hispanic are included in the results for both AIAN adults and Hispanic adults. The exception is reporting on White adults, who in this report are defined as those who identify as non-Hispanic and select White as their only race.
The sample sizes for Hispanic adults and Black adults (more than 1,750 each) allow for detailed subgroup reporting, including by age, gender, income, LGBT identity, and urbanicity. The sample of Asian adults (693) allows for a narrower set of demographic breaks within this group. Because of the smaller sample of AIAN adults (267), results are shown for this population as a whole and demographic breaks are not provided.
In addition, the sample of AIAN adults has some limitations and caution should be exercised when interpreting these results. Given ongoing concerns about data erasure and invisibility of smaller populations, including Indigenous people, KFF has decided to include results for the AIAN population in this report despite these limitations.
Views of Racism in U.S. Society
Large majorities of adults say racism is at least a minor problem in U.S. politics, criminal justice, policing, education, housing, employment, and health care. The shares viewing racism as a major problem in each of these areas varies, with fewer than three in ten saying racism is not a problem at all in each area.
At least half of adults say racism is a major problem in U.S. politics (56%), criminal justice (54%), and policing (51%), while a smaller share (32%) see racism as a major problem in health care. The smaller share seeing racism as a problem in health care relative to other areas may reflect higher levels of trust in health care providers, particularly compared to the police and the courts (see findings below).
Across racial and ethnic groups, substantial shares of adults view racism as a major problem in various aspects of U.S. society, with Black adults at least 20 percentage points more likely than White adults to view racism as a major problem in each area. Substantial shares of Hispanic, Asian, and American Indian and Alaska Native (AIAN) adults view racism as a problem in all aspects of society included in the survey, including more than half of each of these groups who say racism is a major problem in U.S. politics, the criminal justice system, and policing. While White adults are generally less likely than other groups to see racism as a problem, about half of White adults say it is a major problem in politics, the criminal justice system, and policing.
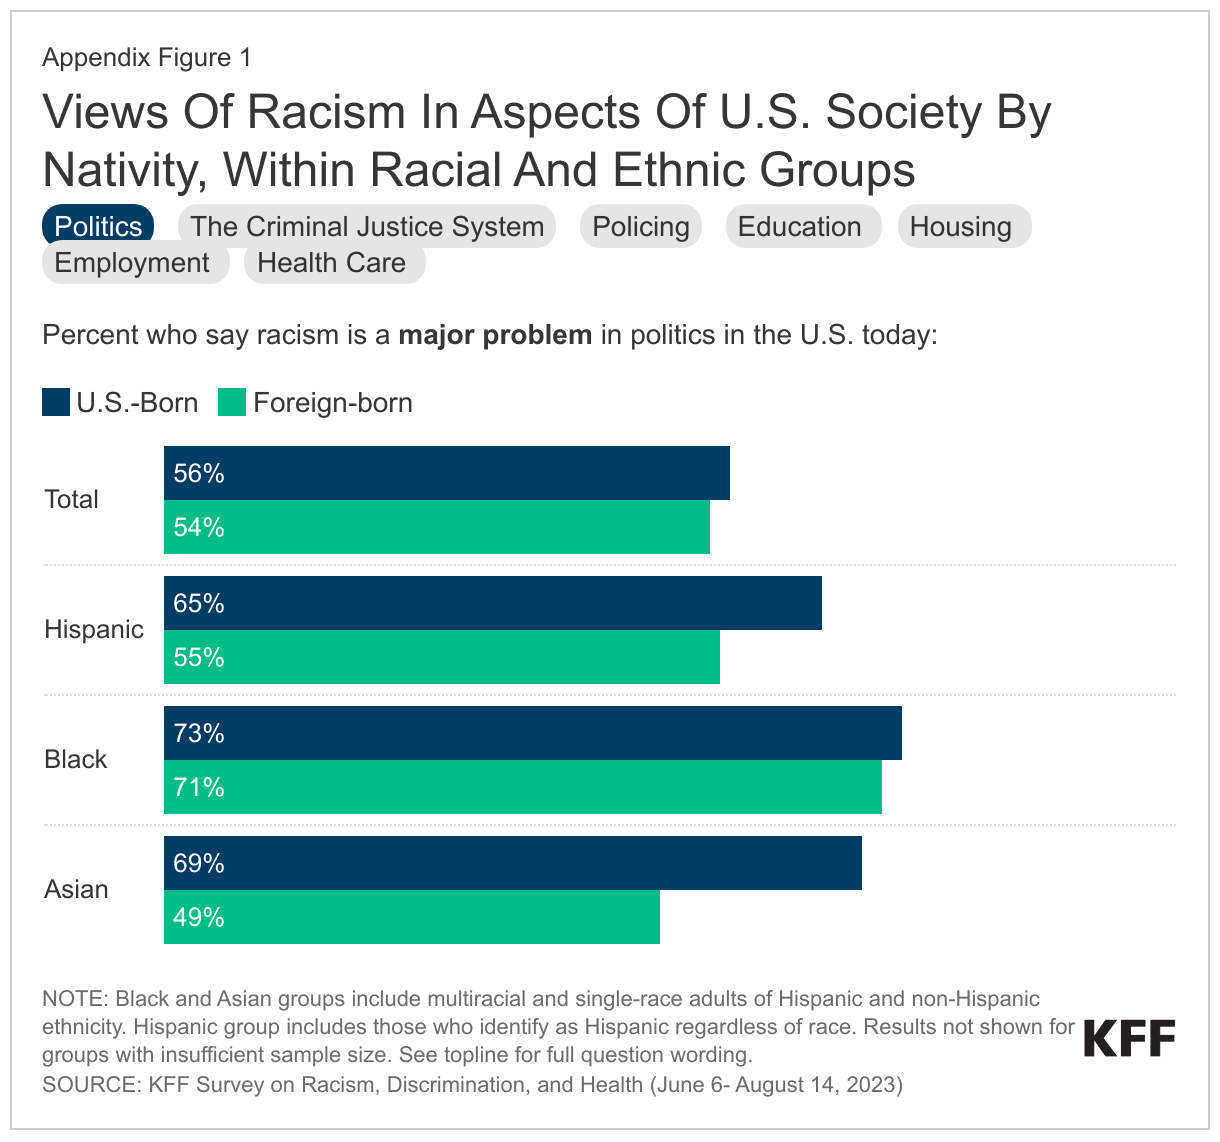
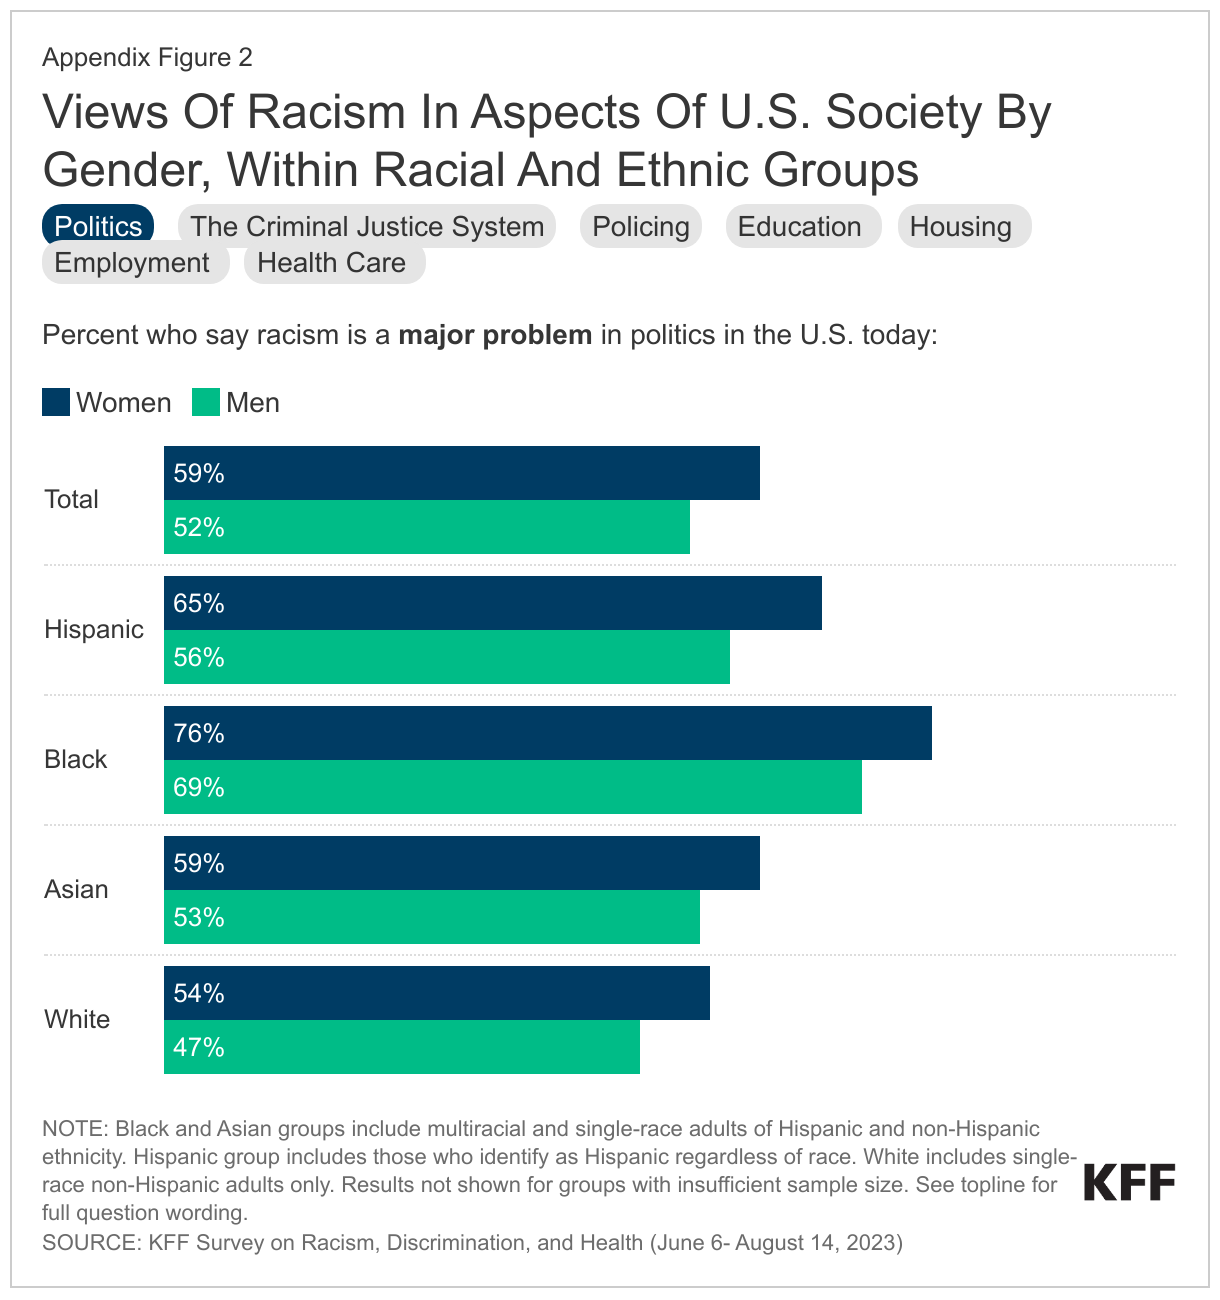
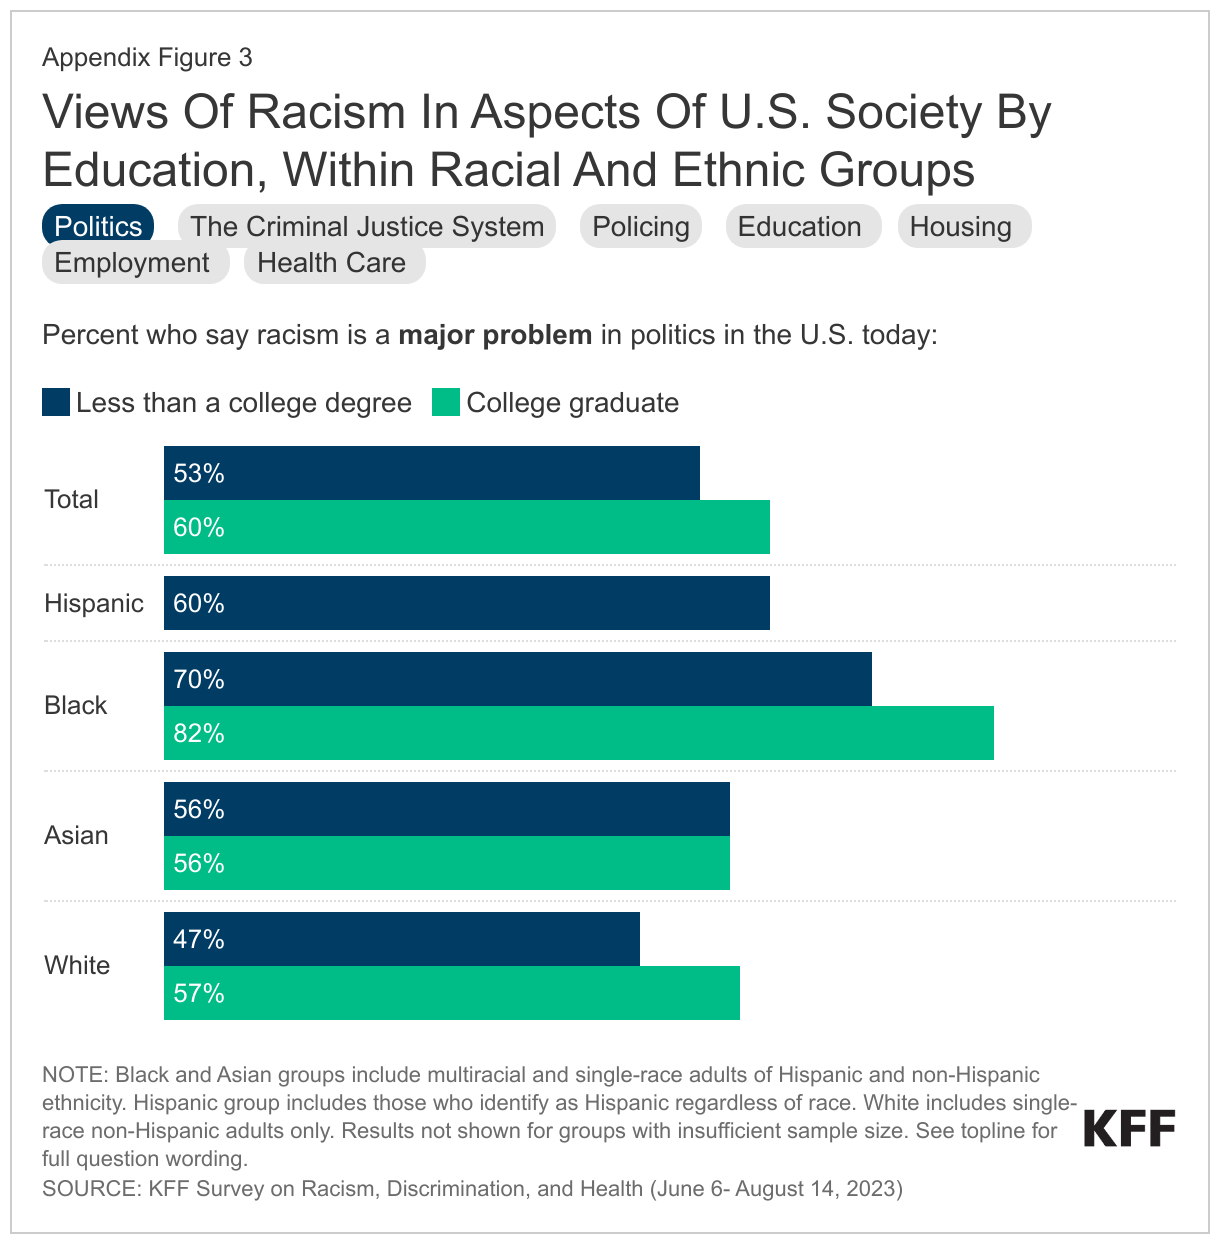
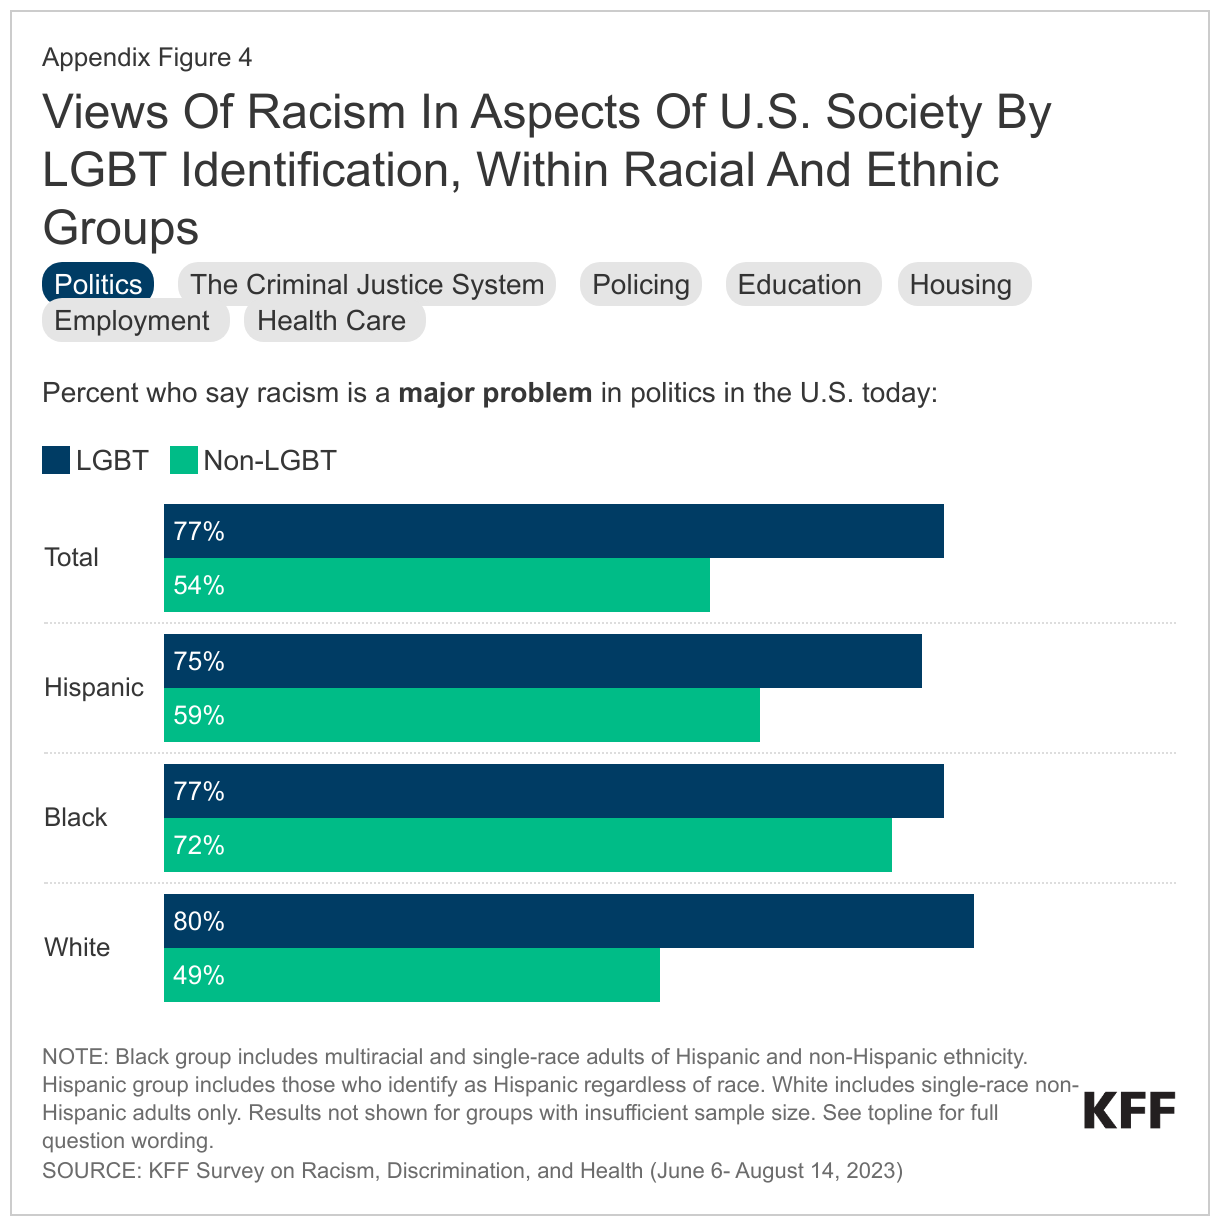
Women, LGBT adults, U.S.-born adults, and adults with a college degree or higher are more likely than their counterparts to say racism is a major problem in most aspects of U.S. society. Black women are particularly likely to view racism as a problem, including over three quarters who view it as a major problem in politics, criminal justice, and policing. LGBT adults are also more likely than non-LGBT adults to say racism is a major problem in various aspects of U.S. society, a pattern that is driven largely by Hispanic and White LGBT adults. For example, eight in ten White adults who identify as LGBT say racism is a major problem in the criminal justice system, politics and policing compared with half or less among White adults who do not identify as LGBT. U.S.-born Asian and Hispanic adults are more likely than their immigrant counterparts to say racism is a major problem in most aspects of society. Overall, adults with a college degree or higher are more likely to say that racism is a major problem in all areas included in the survey than those who have not obtained a college degree. This pattern generally holds across Black, Hispanic, and White adults but is not evident among Asian adults. (See Appendix 1 for more details)
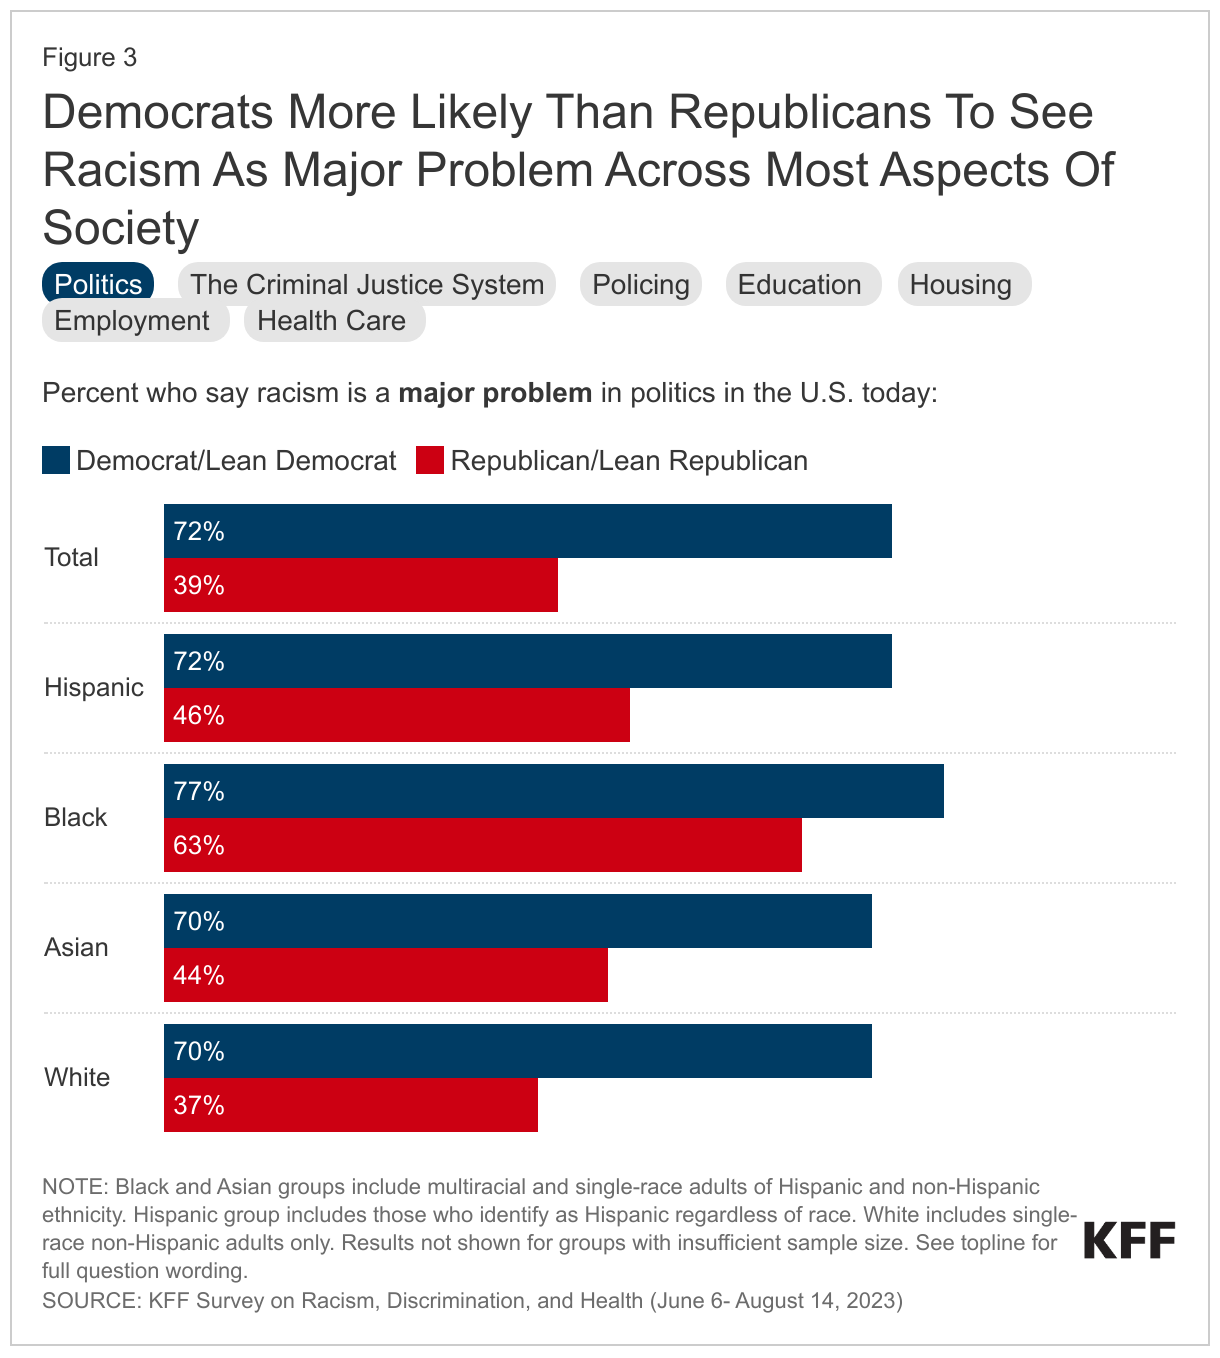
Majorities of Democrats across racial and ethnic groups see racism as a major problem across most areas asked about in the survey, while among Republicans, views on racism differ by racial and ethnic group with smaller shares of White Republicans saying racism is a major problem across most areas. For example, seven in ten Black Republicans (70%) say racism is a major problem in the criminal justice system, while 27% of White Republicans say this. Similarly, Asian adults who identify as Republican or lean Republican are twice as likely as White Republicans to say racism is a major problem in education (40% vs. 20%).
Put another way, across racial and ethnic groups, differences in views of racism between Democrats and Republicans are largest within White adults. For example, about three times as many White Democrats as White Republicans say racism is a major problem in policing (74% vs. 23%). Among Black Republicans the gap is much smaller (77% vs. 64%).
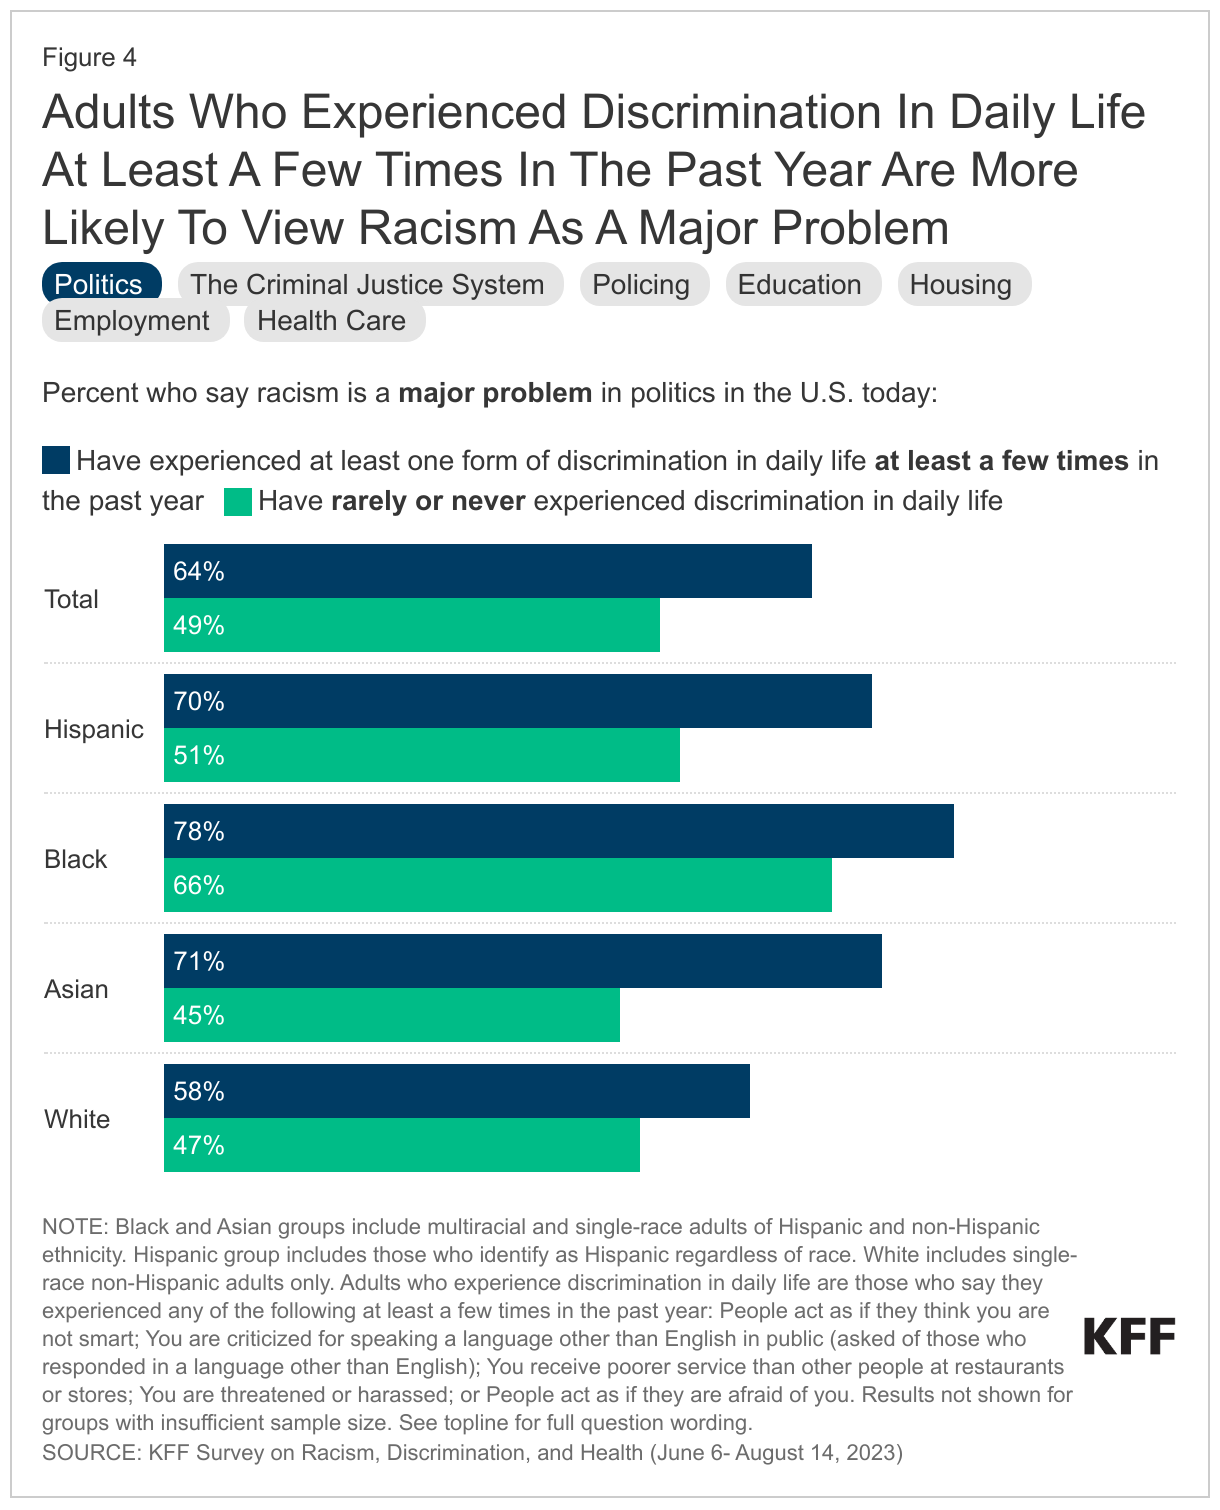
Adults who experience discrimination in their daily lives are more likely than those who rarely or never have these experiences to say racism is a major problem in all aspects of society included in the survey, a pattern that holds among Black, Hispanic, Asian and White adults. As previously reported, four in ten adults say they have experienced at least one type of discrimination in daily life at least a few times in the past year, including larger shares of Hispanic, Black, and AIAN adults compared to White adults. Such discrimination includes things like receiving poorer service at restaurants or stores, people acting as if they were afraid of them, or being threatened or harassed. This analysis finds a link between these experiences and people’s views of racism as a problem in U.S. society. For example, seven in ten Asian adults who have experienced at least one form of discrimination in their daily lives say racism is a major problem in politics, compared with less than half (45%) of Asian adults who have not had any of these experiences. Similarly, six in ten (61%) Black adults who report experiences of discrimination say racism is a major problem in housing, compared with about half (48%) of those who do not report any experiences of discrimination.
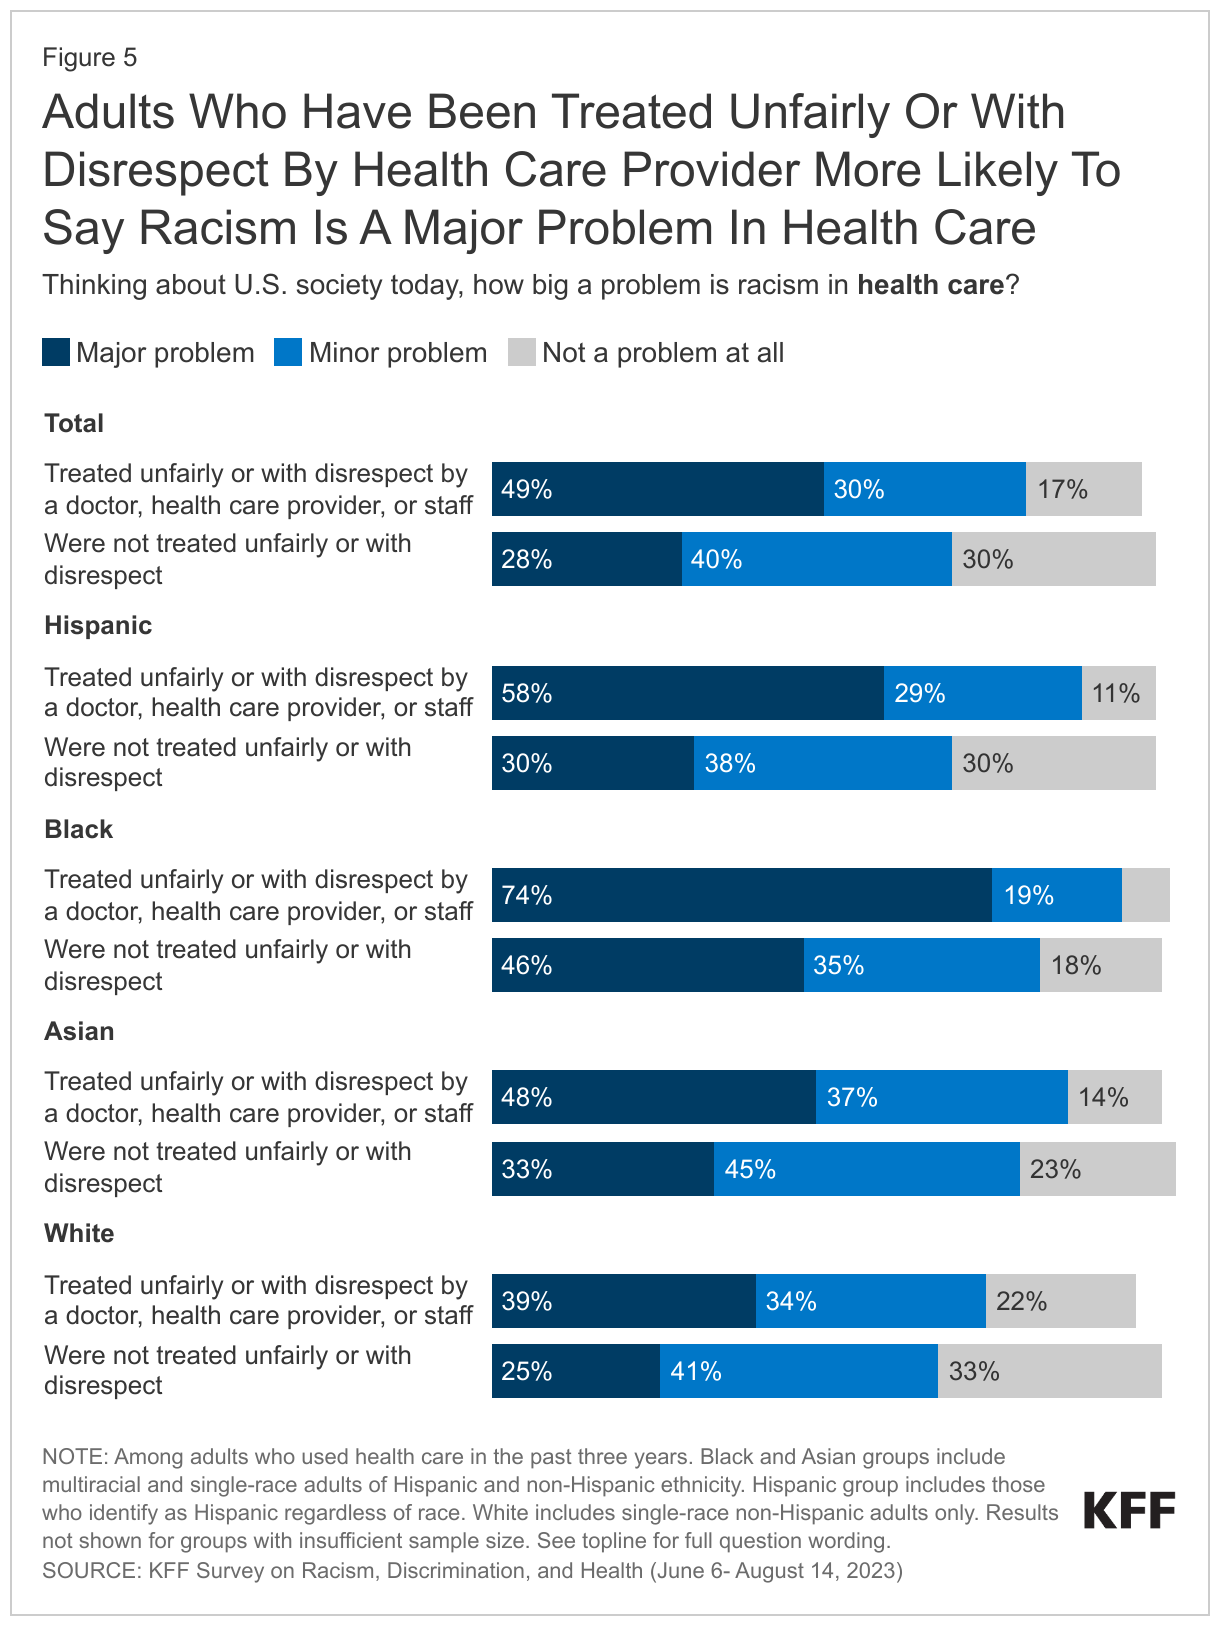
Adults who say they were treated unfairly or with disrespect by a health care provider in the past three years are more likely than those who haven’t had these experiences to say racism is a major problem in health care, particularly among Black and Hispanic adults. Among Black and Hispanic adults, those who have experienced unfair treatment in health care settings are about 30 percentage points more likely than those who have not had these experiences to say racism is a major problem in health care in the U.S. today (74% vs. 46% for Black adults and 58% vs. 30 for Hispanic adults). Similarly, Asian and White adults who have experienced unfair treatment are about 15 percentage points more likely to say racism is a big problem in health care than those who haven’t had these experiences. Notably, however, Black adults stand out as being most likely to view racism as a major problem in health care, regardless of whether they personally report experiencing unfair treatment in health care settings.
For example, even among those who do not report personal experiences of unfair treatment, about half of Black adults (46%) say racism is a major problem in U.S. health care compared to smaller shares of Hispanic (30%), Asian (33%), and White adults (25%) who have not experienced unfair treatment.
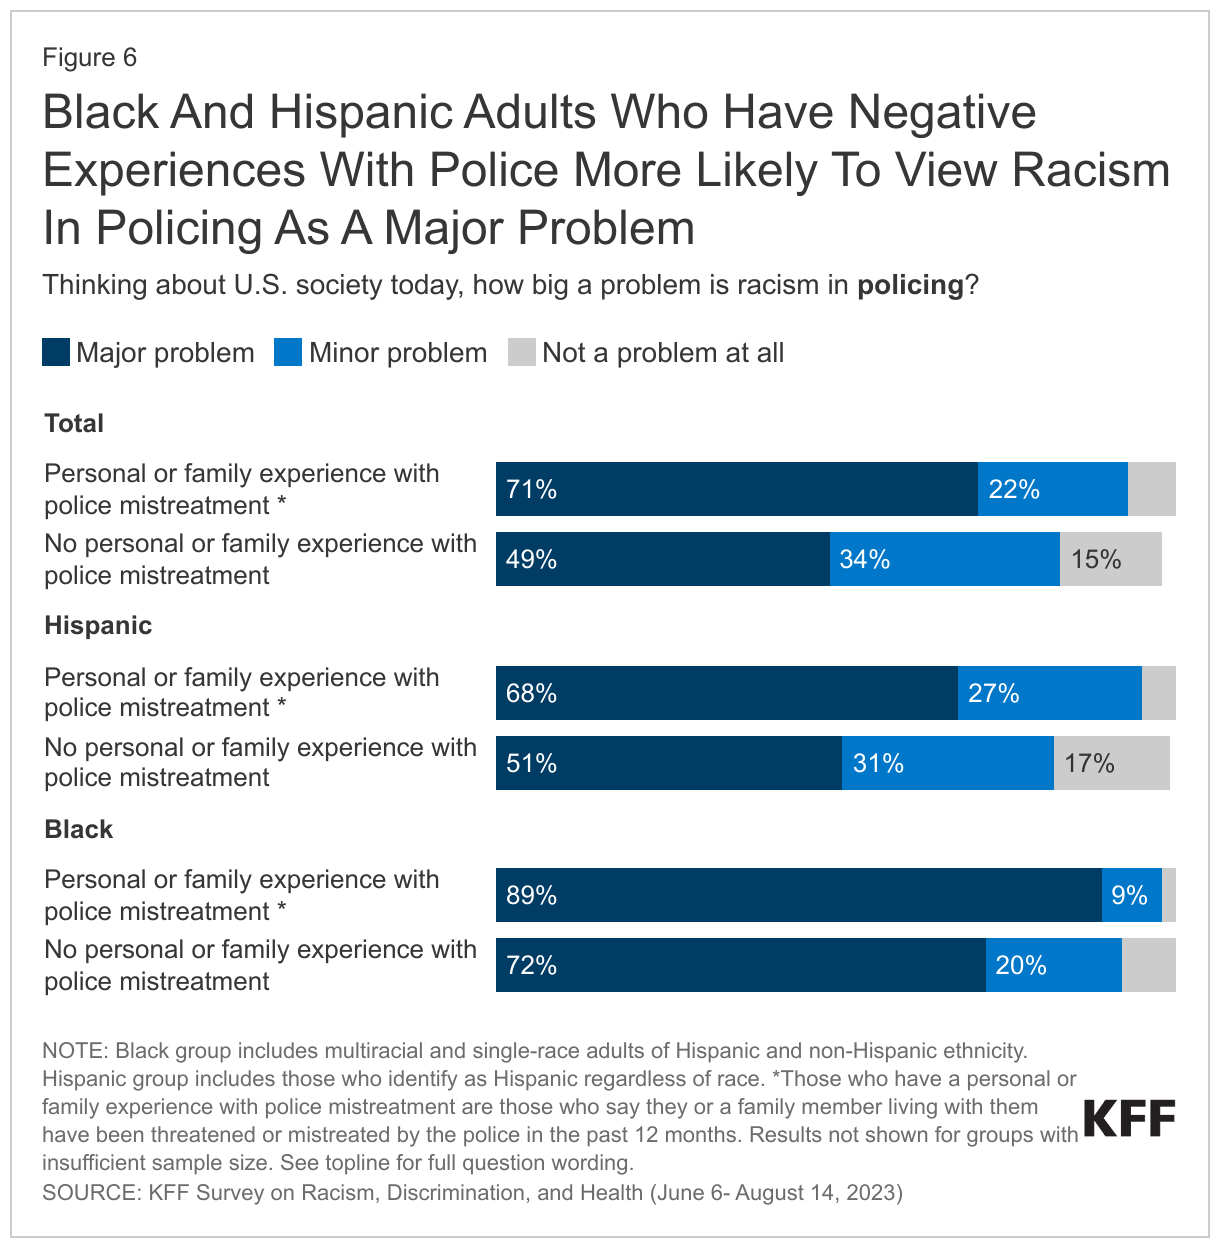
Overall and among Black and Hispanic adults, those who say they or a family member has been threatened or mistreated by the police in the last year are more likely than those who do not report these experiences to say racism is a major problem in policing. As previously reported, Black and Hispanic adults, and particularly those with self-reported darker skin tones, are more likely than White adults to report personal or family experiences with police mistreatment in the past year. While majorities of Black and Hispanic adults view racism as a major problem in policing, the shares are even higher among those who say they or a family member was threatened or mistreated by the police in the past year, rising to nine in ten (89%) among Black adults who have had this experience.
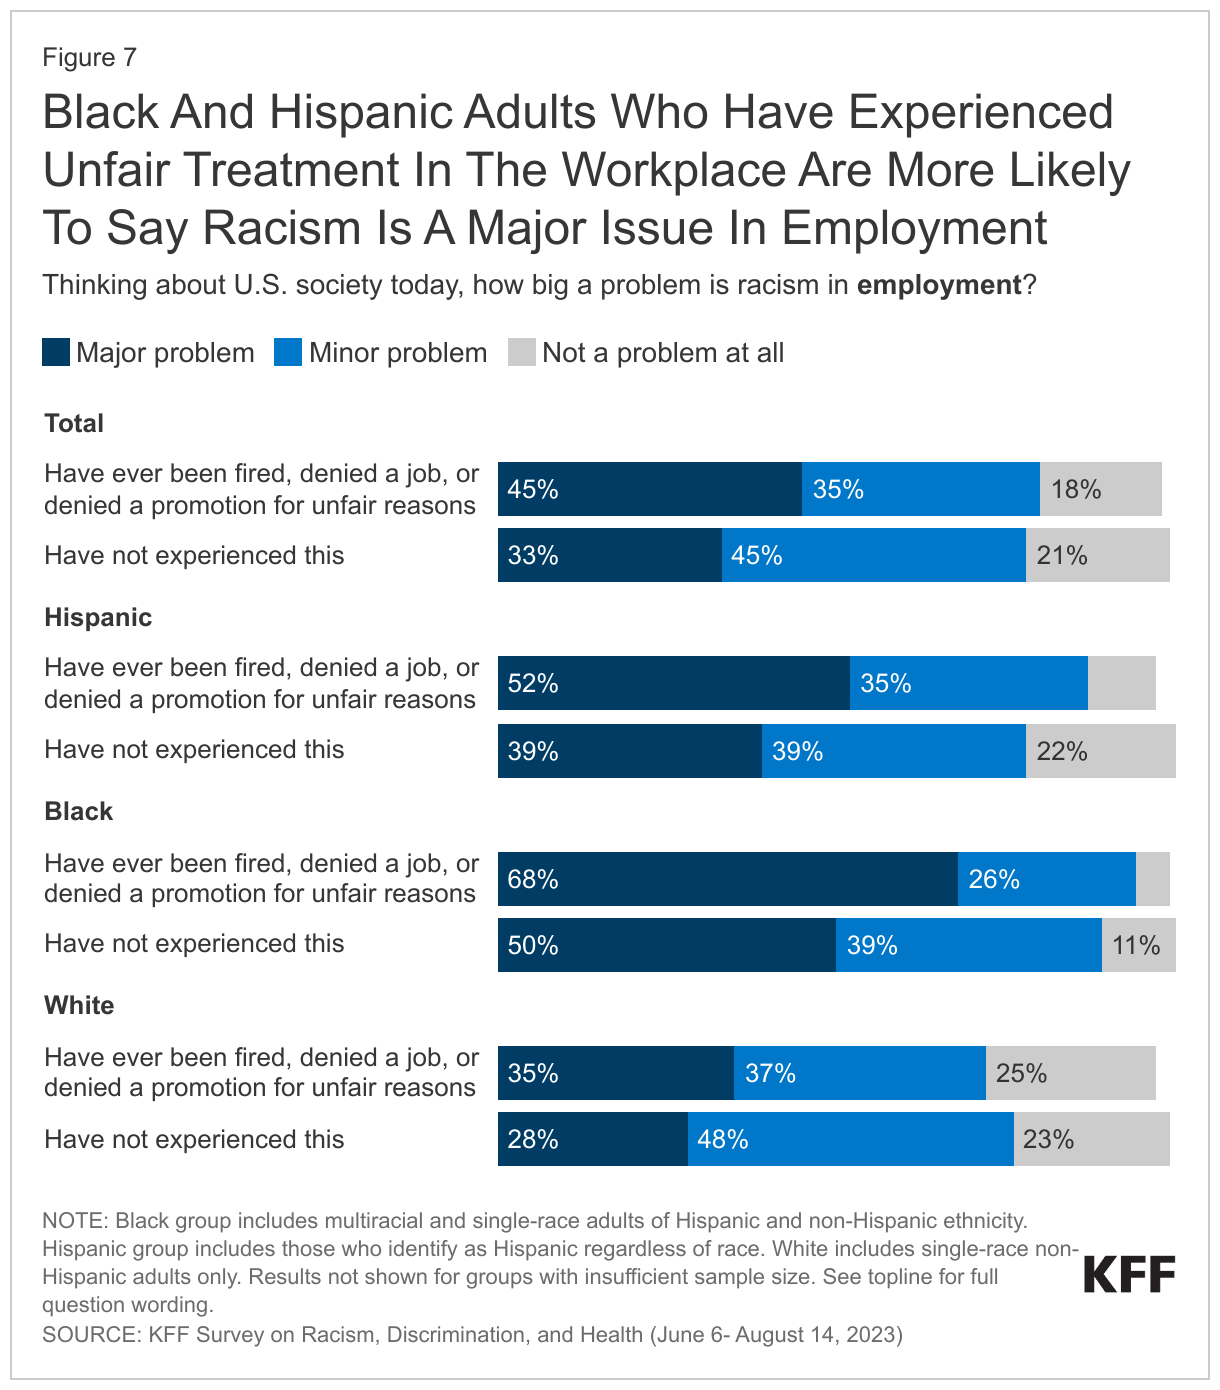
Experiences with unfair treatment on the job are also associated with views of racism as a problem in employment. While about a third (35%) of adults overall view racism as a major problem in employment in the U.S., the share rises to nearly half (45%) among those who say they were ever fired or denied a job or promotion for unfair reasons. Among Black adults, two-thirds (68%) of those who have experienced this type of unfair treatment say racism is a major problem in employment compared to half of those who have not had this experience. Similarly, Hispanic adults who have experienced unfair treatment in employment are about 15 percentage points more likely to say racism is a major problem in employment than those who haven’t experienced this.
Trust in Doctors and Other Health Care Providers
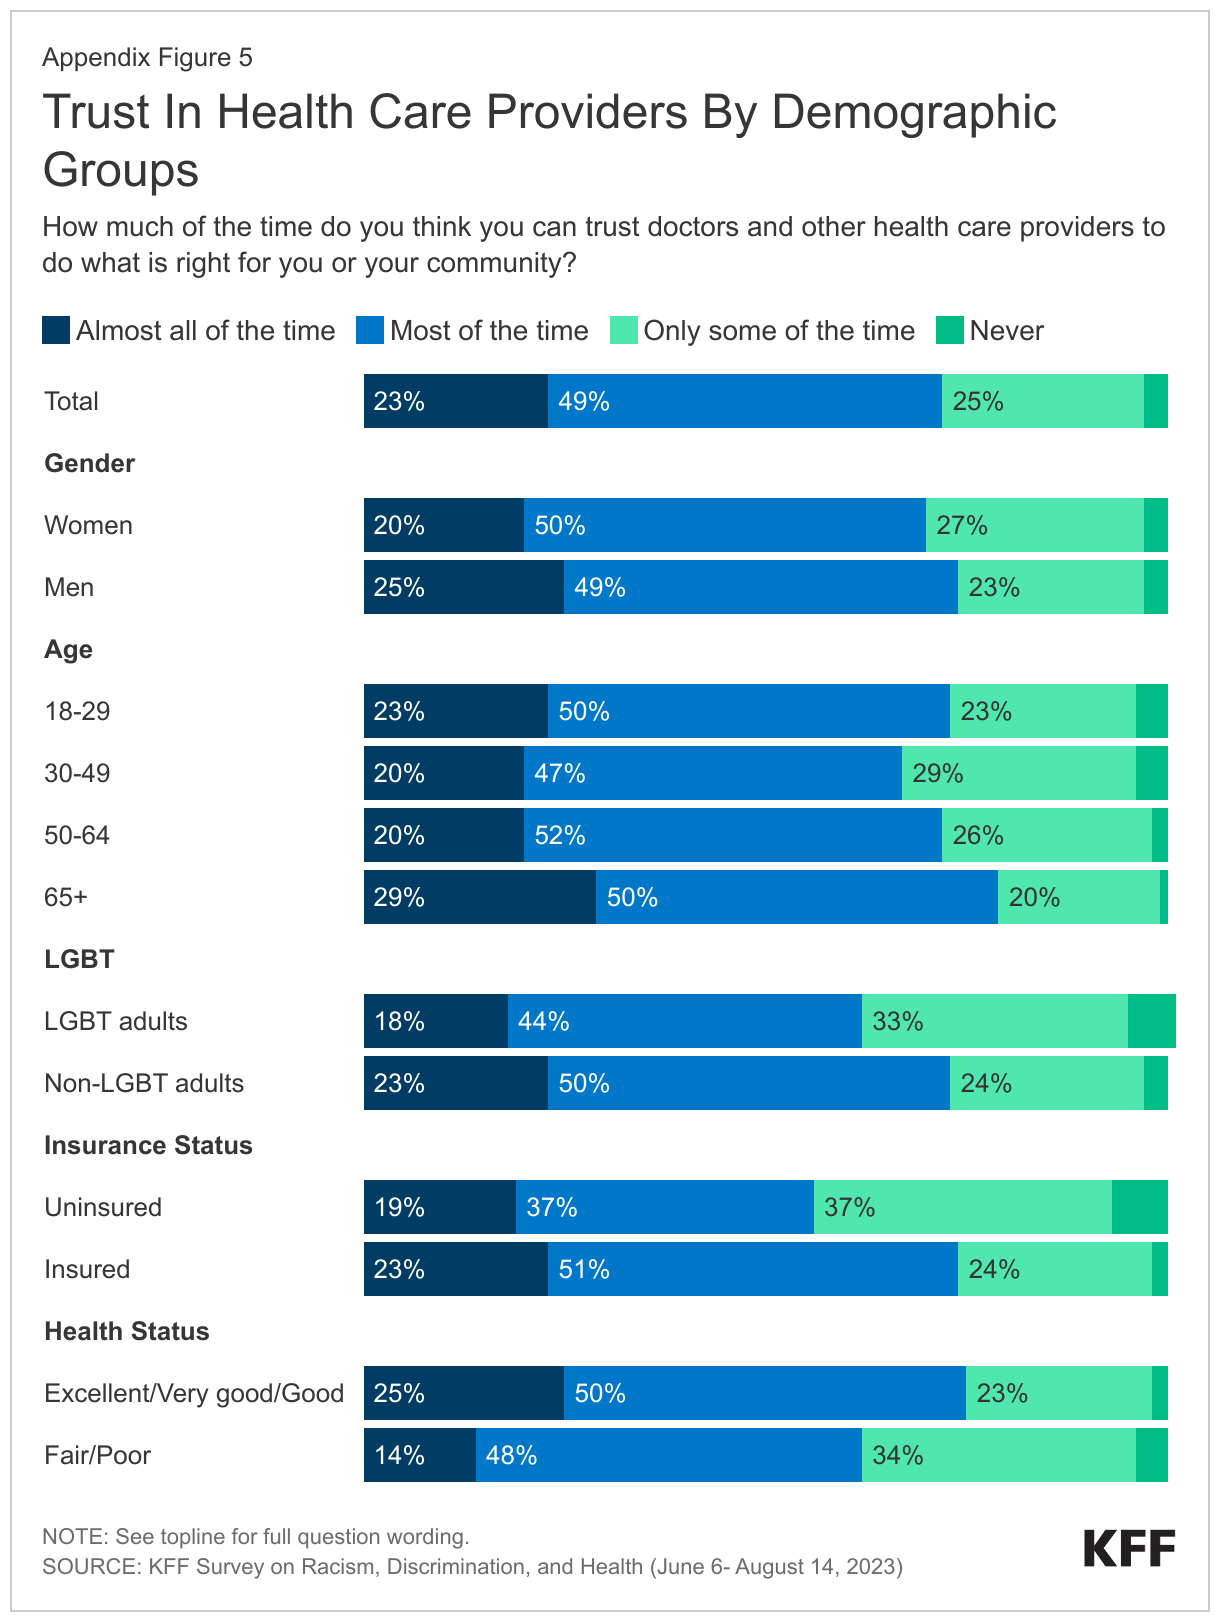
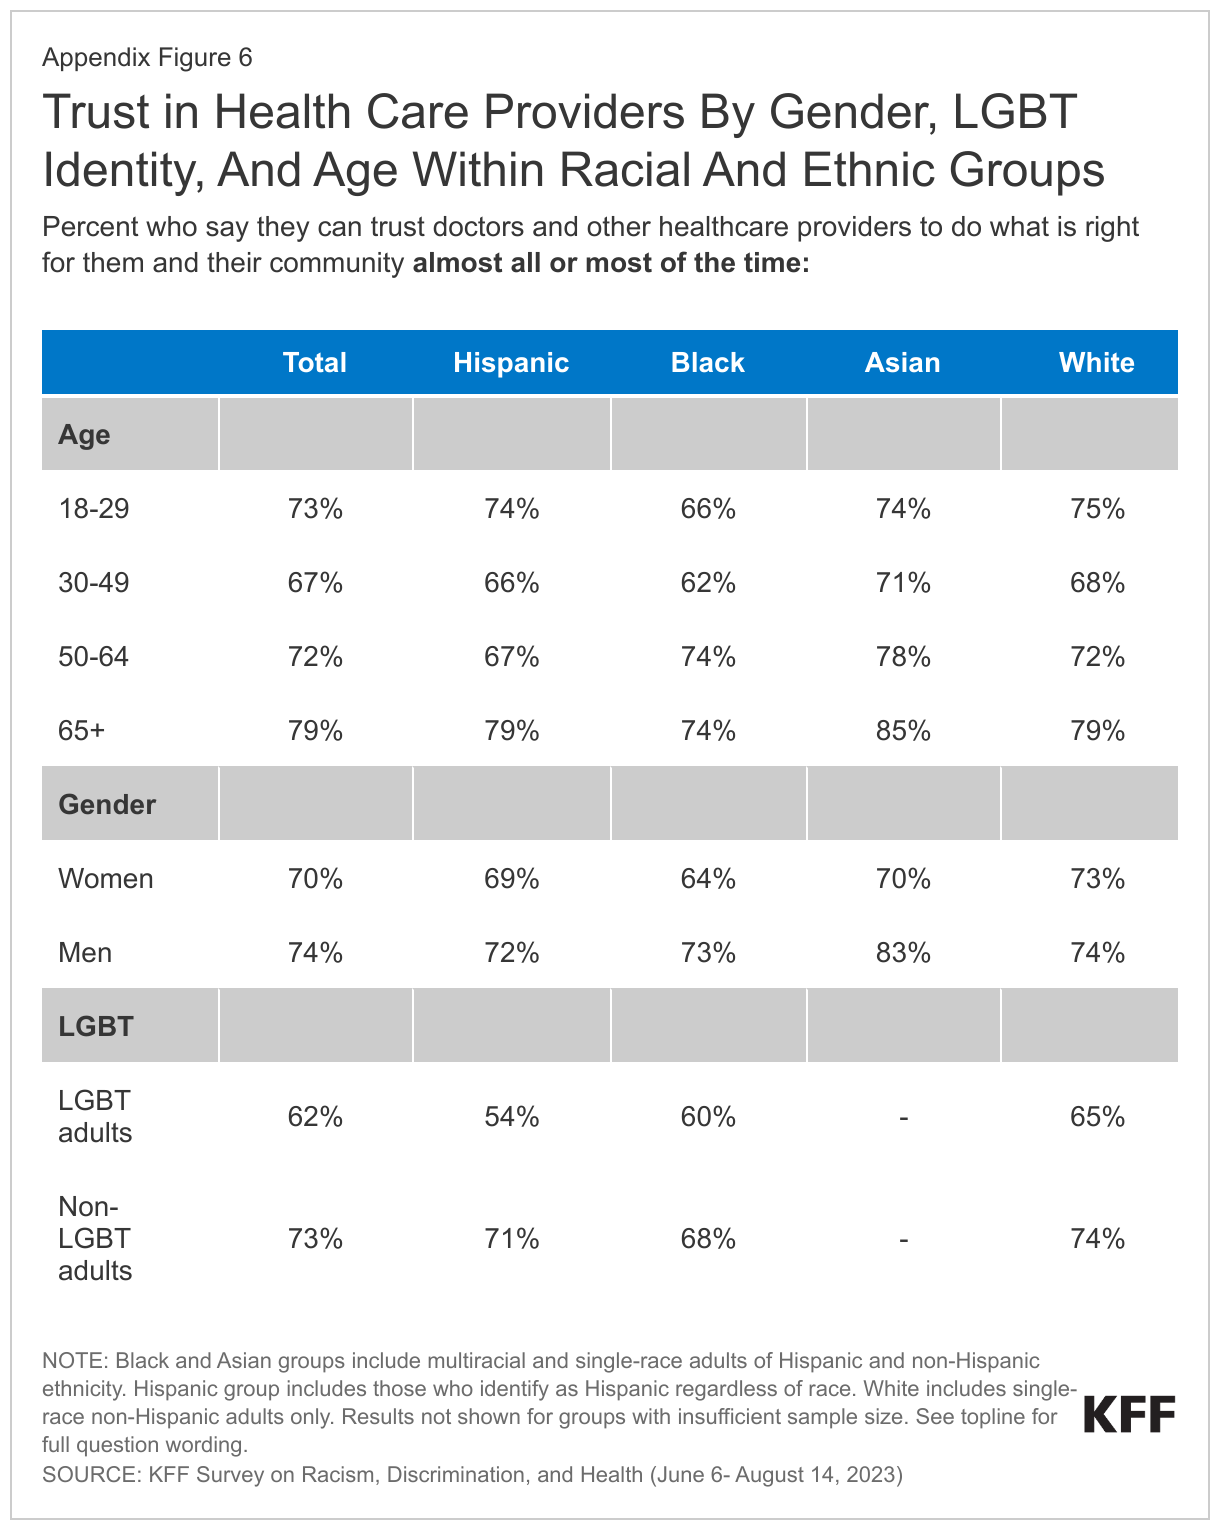
Despite differences in views of racism as a problem in health care, majorities of adults across racial and ethnic groups say they trust doctors and health care providers to do what is right for them and their community all or most of the time. About seven in ten adults across racial and ethnic groups say they trust doctors and other health care providers all or most of the time. This relatively high level of trust in health care providers may be one reason that fewer adults see racism as a problem in health care compared to other areas of society. Still, nearly three in ten adults overall say they trust health care providers only some of the time or never, including a somewhat larger share of Black adults (32%) compared to White (27%) adults. Notably, Black adults who say their skin color is very dark or dark are less likely to say they usually trust health care providers to do what is right for them and their community compared with those who describe their skin color as very light or light (64% vs. 75% respectively).
Overall, women, adults who identify as LGBT, those between the ages of 30-49, the uninsured, and those in fair or poor health are less likely than their counterparts to trust doctors and other health care providers to do what is right for them or their community. Notably, fewer than two-thirds of Black women (64%), Hispanic and Black LGBT adults (54% and 60%, respectively), and Black adults ages 30-49 (62%) say they trust providers almost all or most of the time. (See Appendix 2 for more details.)
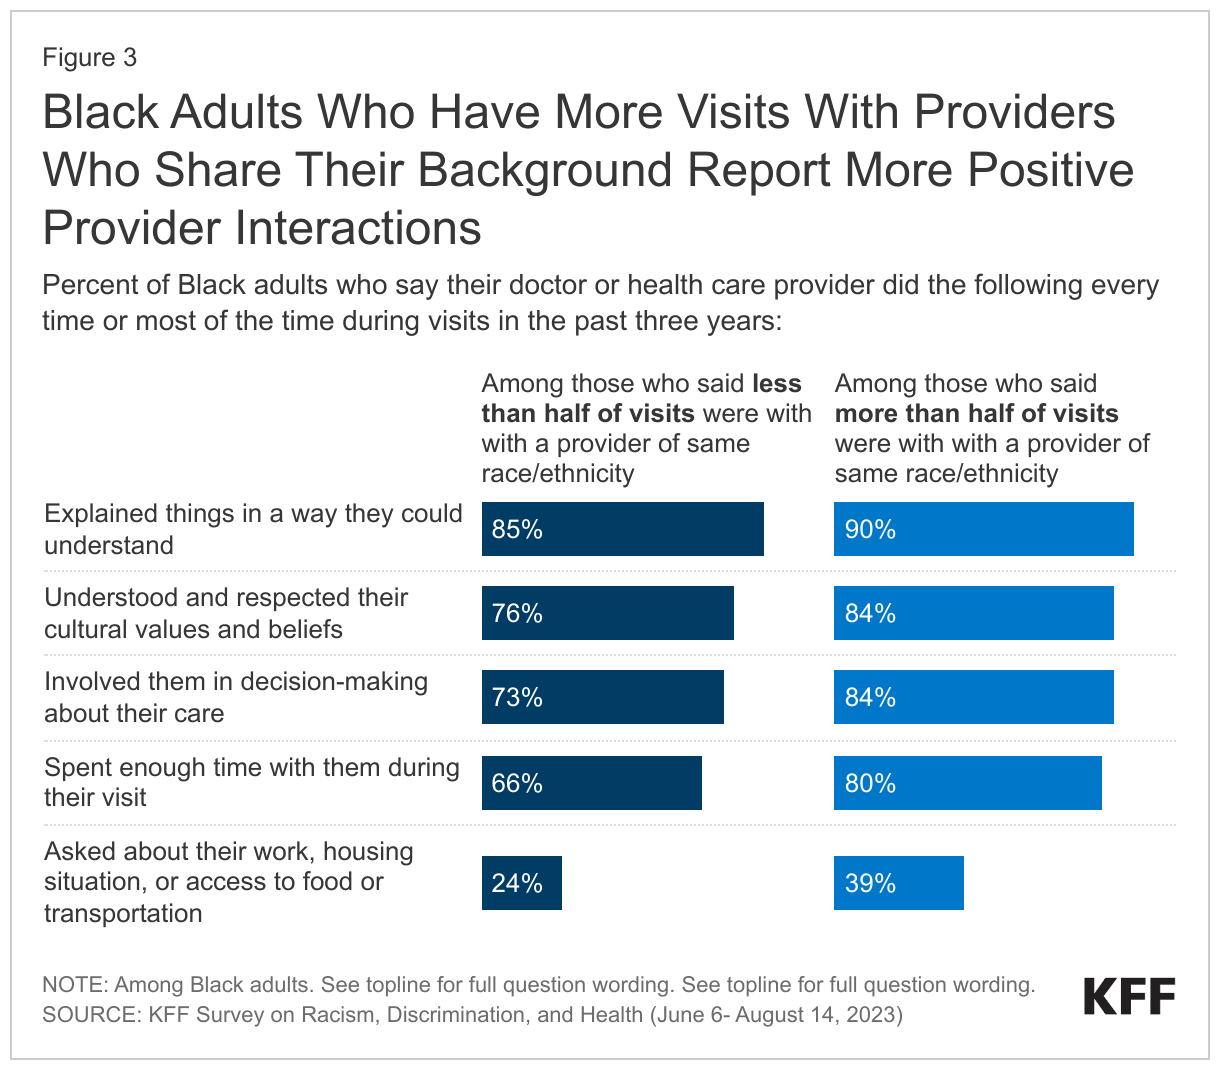
Overall, and among Black, Asian, and White adults, those who have more health care visits with providers who share their racial and ethnic background are more likely to say they trust doctors and other health care providers to do what is right for them and their community. For example, three-quarters (74%) of Black adults who say at least half of their recent health care visits were with a provider who shared their racial background say they trust health care providers to do what is right for their community almost all or most of the time, compared with two-thirds (65%) of Black adults who have fewer visits with racially concordant providers. Among Asian adults, those shares are 83% and 71%, respectively. Although no there are no significant differences for Hispanic adults whose providers shared their race and ethnicity, among Spanish-speaking Hispanic adults, having a health care provider who speaks one’s preferred language is associated with higher levels of trust. Hispanic adults who completed the survey in Spanish and report that at least half of their recent health care visits were with a provider who spoke their preferred language are more likely say they trust health care providers to do what is right for them and their community compared with those who have fewer visits with providers who speak their language (76% vs. 59%).
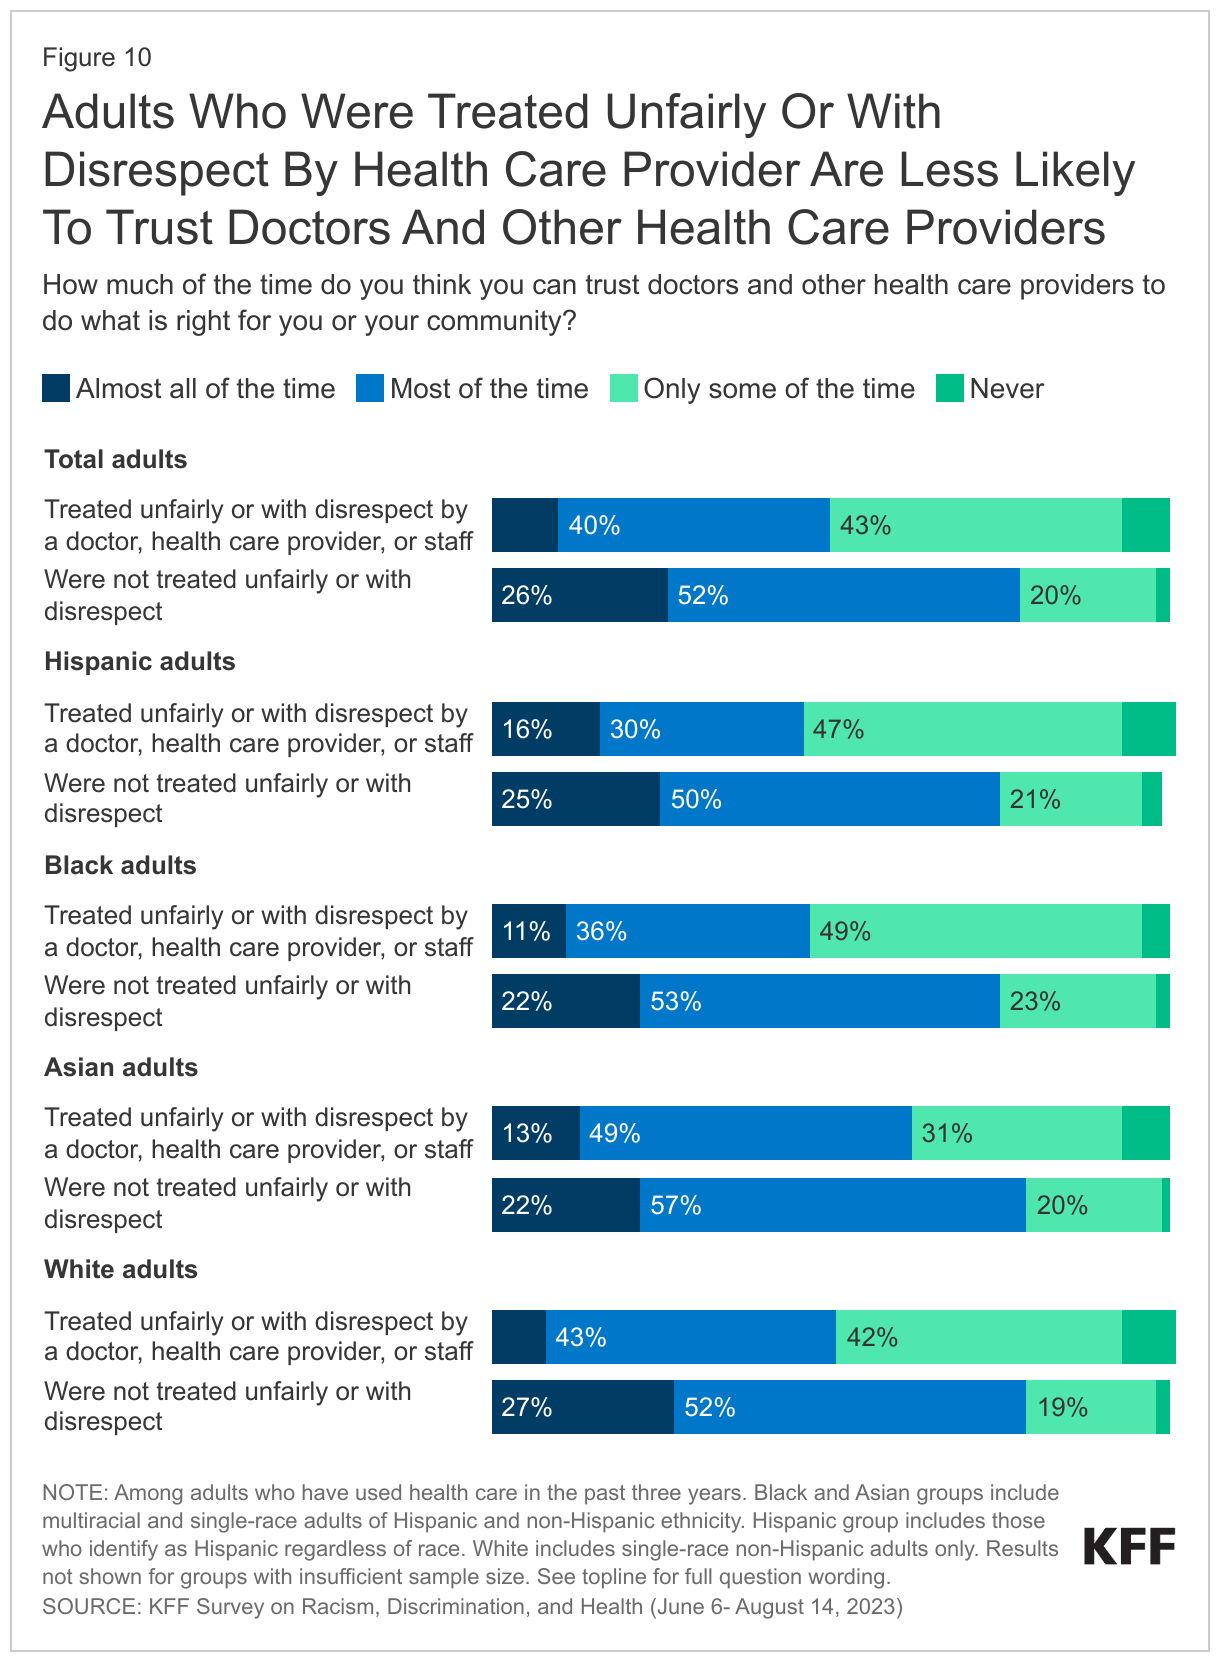
Across racial and ethnic groups, those who report being treated unfairly or with disrespect by a health care provider are less likely to say they trust health providers to do what is right for them and their community. Overall, about half of adults who report experiencing unfair treatment in the past three years say they trust health care providers all or most of the time, compared with about three-quarters of those who have not experienced such treatment. These shares are similar among Hispanic, Black, Asian, and White adults.
Trust in the Police and the Courts
In contrast with the relatively high levels of trust most U.S. adults have for doctors and other health care providers, levels of trust in the police and the courts are lower and differ more across racial and ethnic groups, perhaps reflecting larger shares viewing racism as a problem within these institutions and past negative experiences. Overall, about two thirds of adults say they trust the police to do what is right for them and their community almost all or most of the time, but this share drops to 45% among Black adults compared with roughly three quarters (74%) of White adults. Trust in the courts is split with about half of adults saying they trust the courts almost all or most of the time and the other half saying they trust them only some of the time or never. Again, the shares trusting the courts fall to 37% among Black adults and 39% among AIAN adults compared with over half (53%) of White adults.
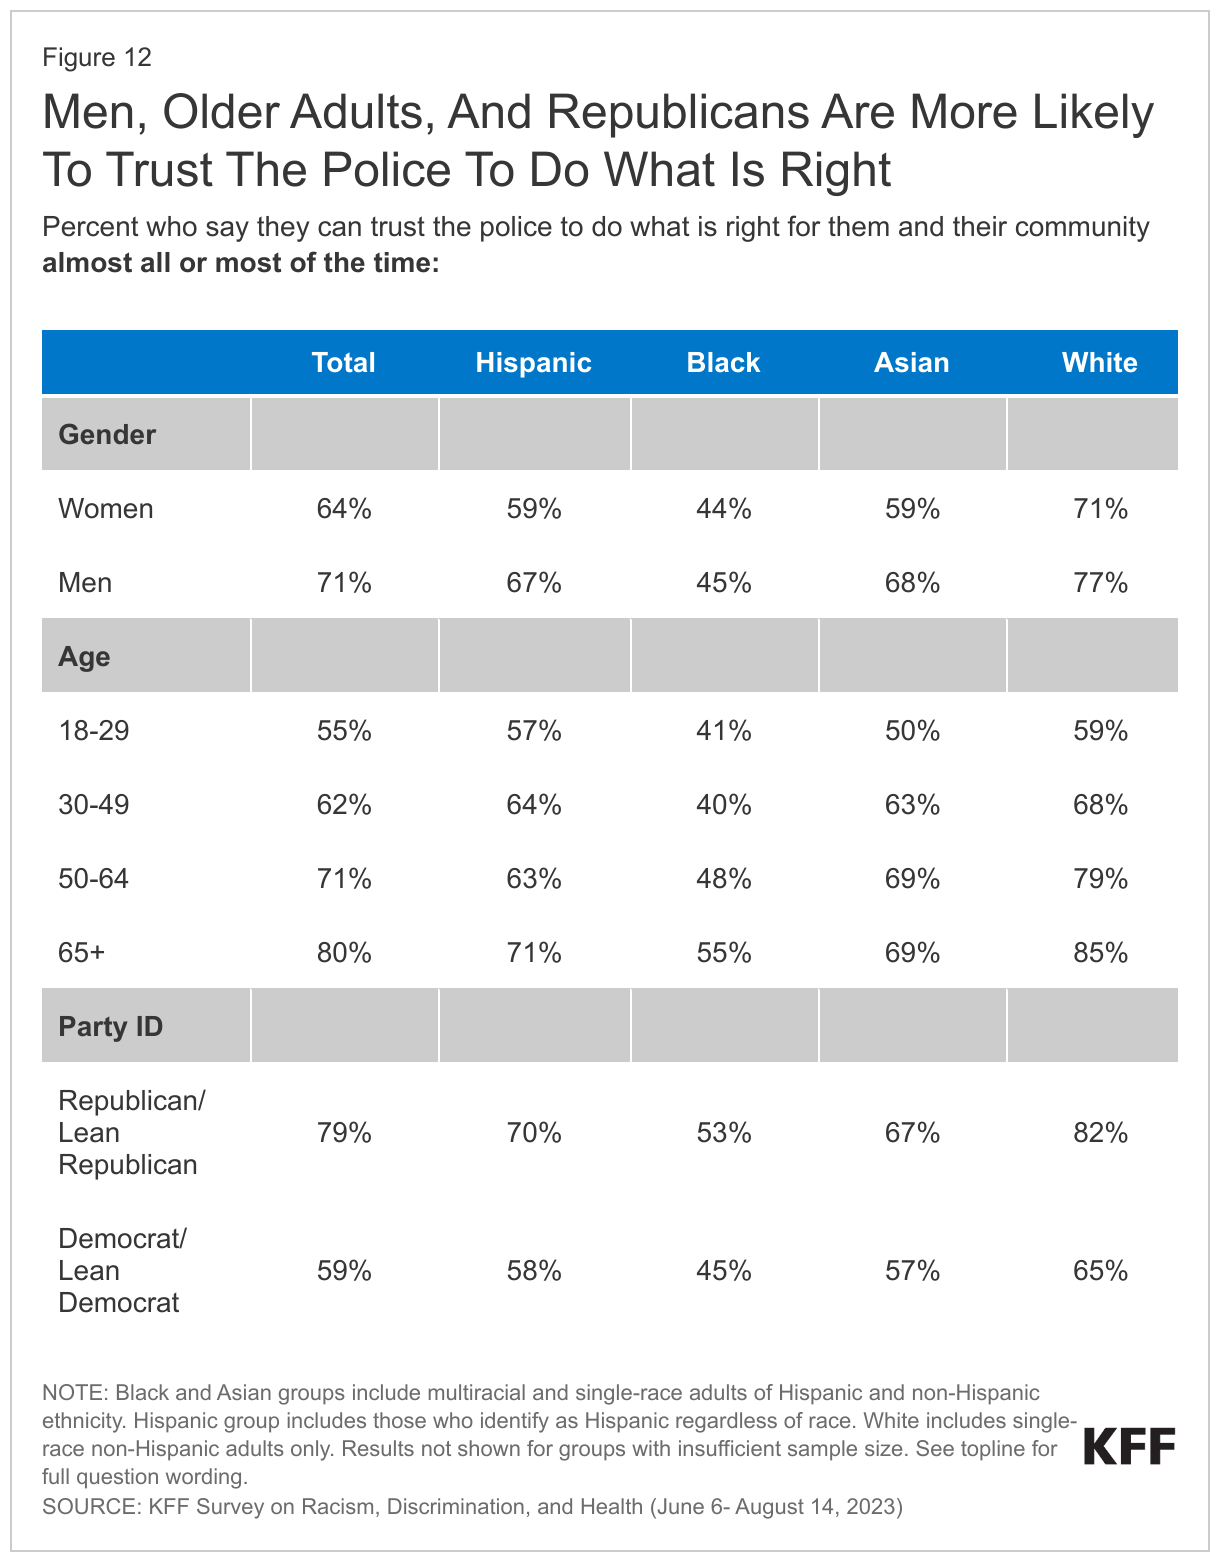
Men, older adults, and Republicans report higher levels of trust in the police compared with women, younger adults, and Democrats. However, these differences are generally less pronounced among Black adults, who report lower levels of trust in the police across demographics. Overall, 71% of men say they trust the police all or most of the time to do what is right for their community compared with 64% of women. Older adults are also more trusting of the police with eight in ten of those ages 65 and over saying they trust the police at least most of the time compared with just over half (55%) of 18–29-year-olds. Republicans are also more likely than Democrats to say they trust the police. Across all these demographics, Black adults stand out as less trusting than the other groups.
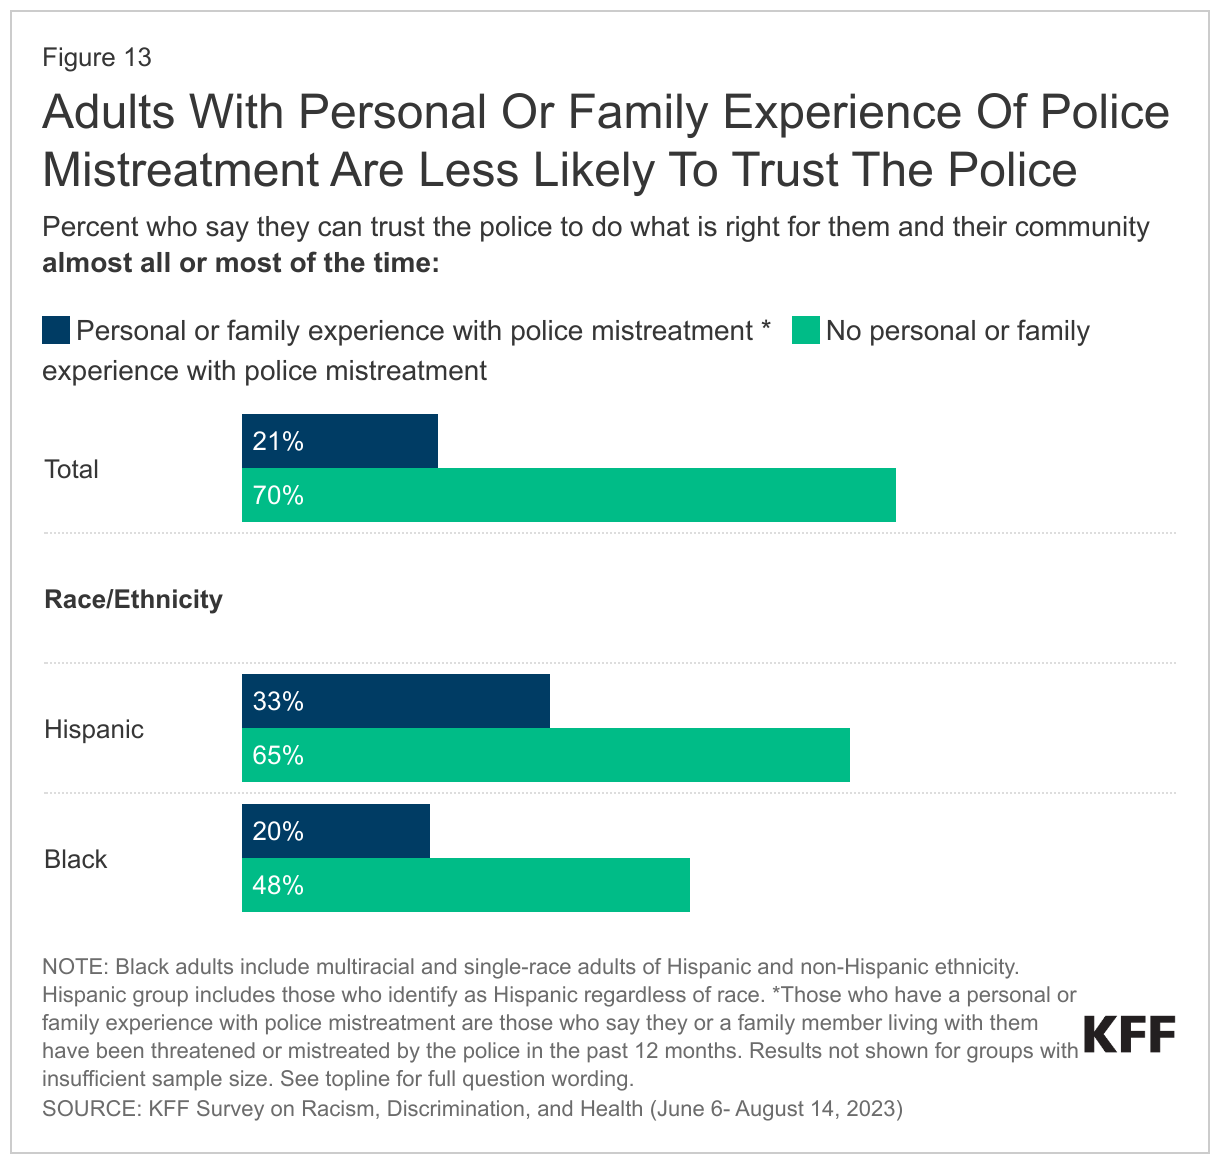
Overall and among Black and Hispanic adults, those who say they or a family member experienced police mistreatment are less likely to say they trust the police to do what is right for their communities. Among Black adults who say they or a family member was threatened or mistreated by police in the past 12 months (11% of all Black adults), just one in five say they trust the police to do what is right for their community all or most of the time. Among Hispanic adults who say they or a family member have experienced police mistreatment (8% of all Hispanic adults), trust is also relatively low with 33% saying they trust the police all or most of the time. These differences in levels of trust in the police mirror the differences found in views of racism as a major problem in U.S. policing.