Key Takeaways
- Since 1977, the Hyde Amendment has banned the use of any federal funds for abortion, only allowing exceptions to pay for terminating pregnancies that endanger the life of the pregnant person or that result from rape or incest.
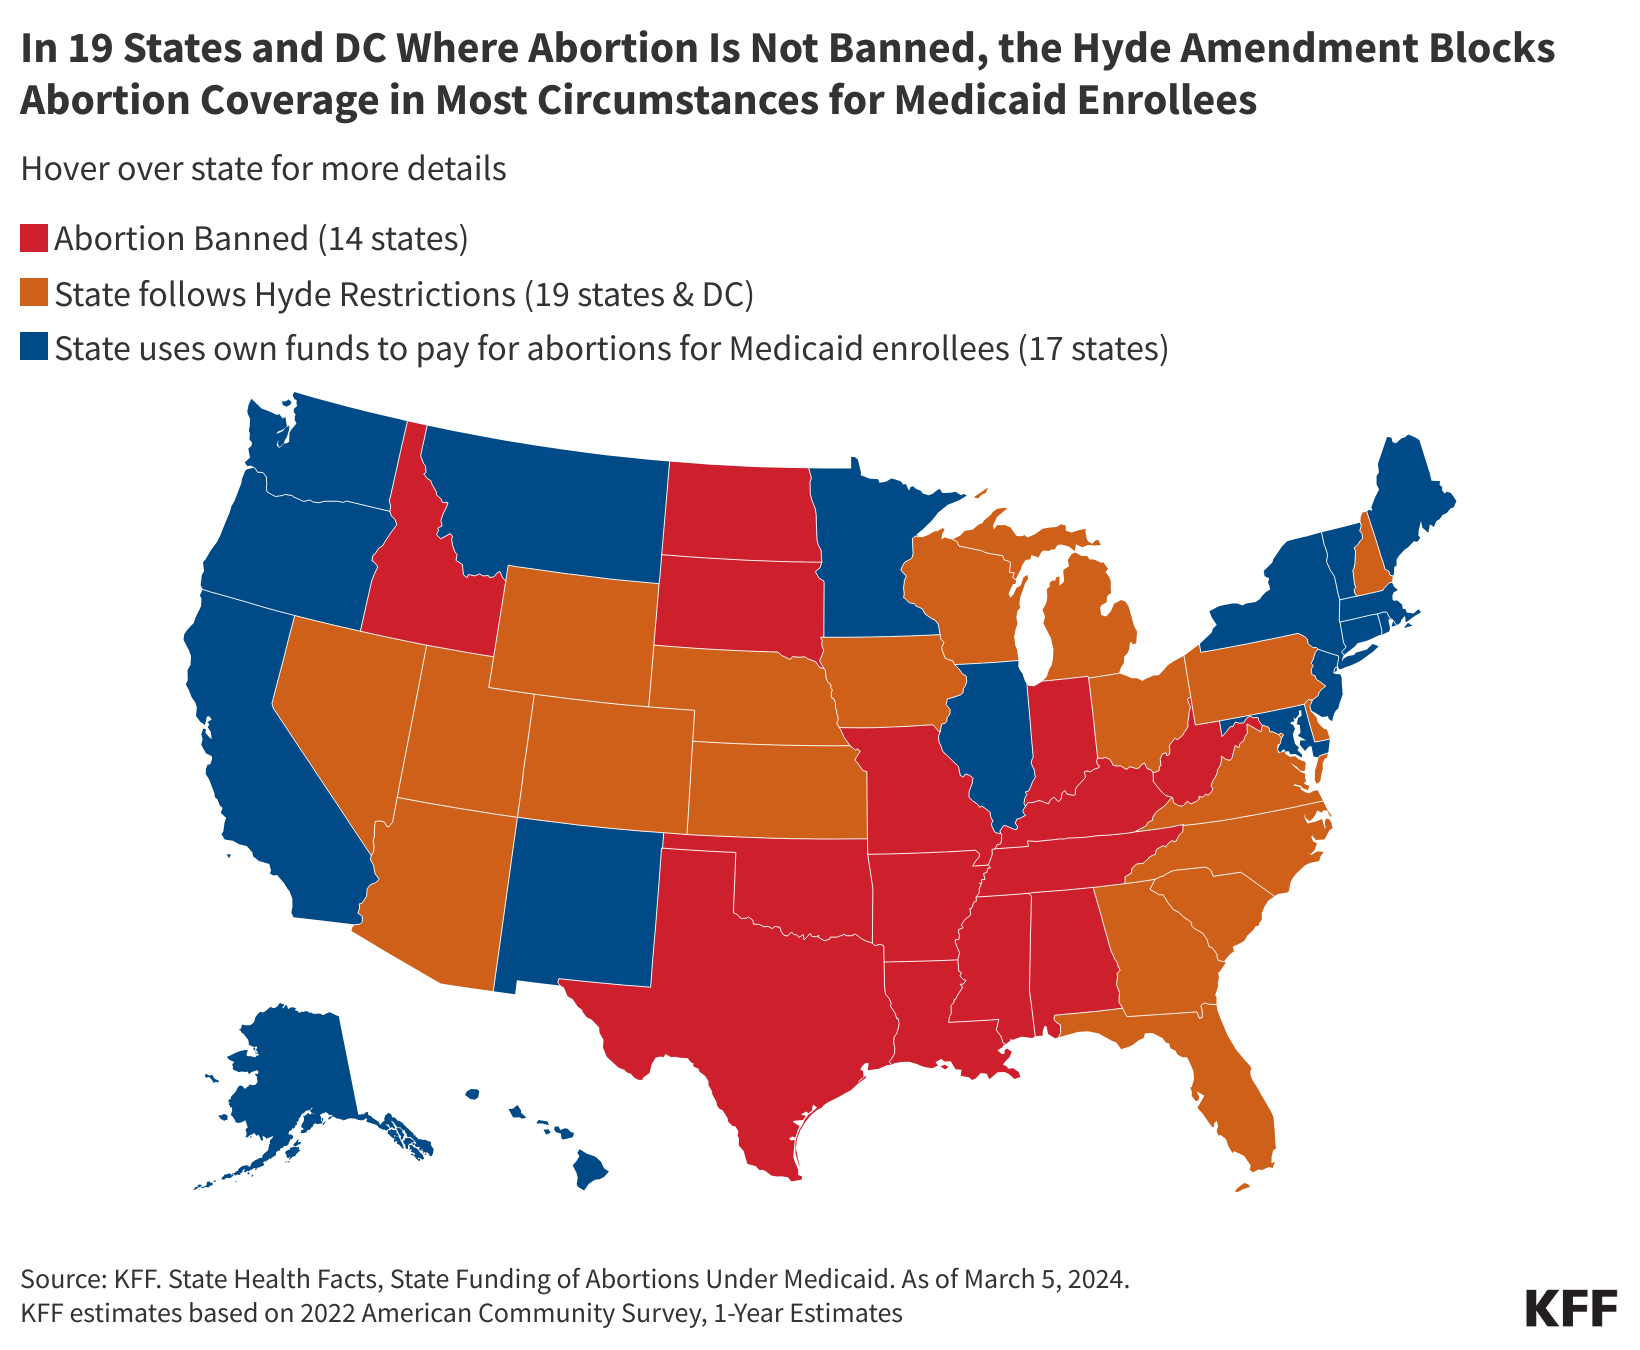
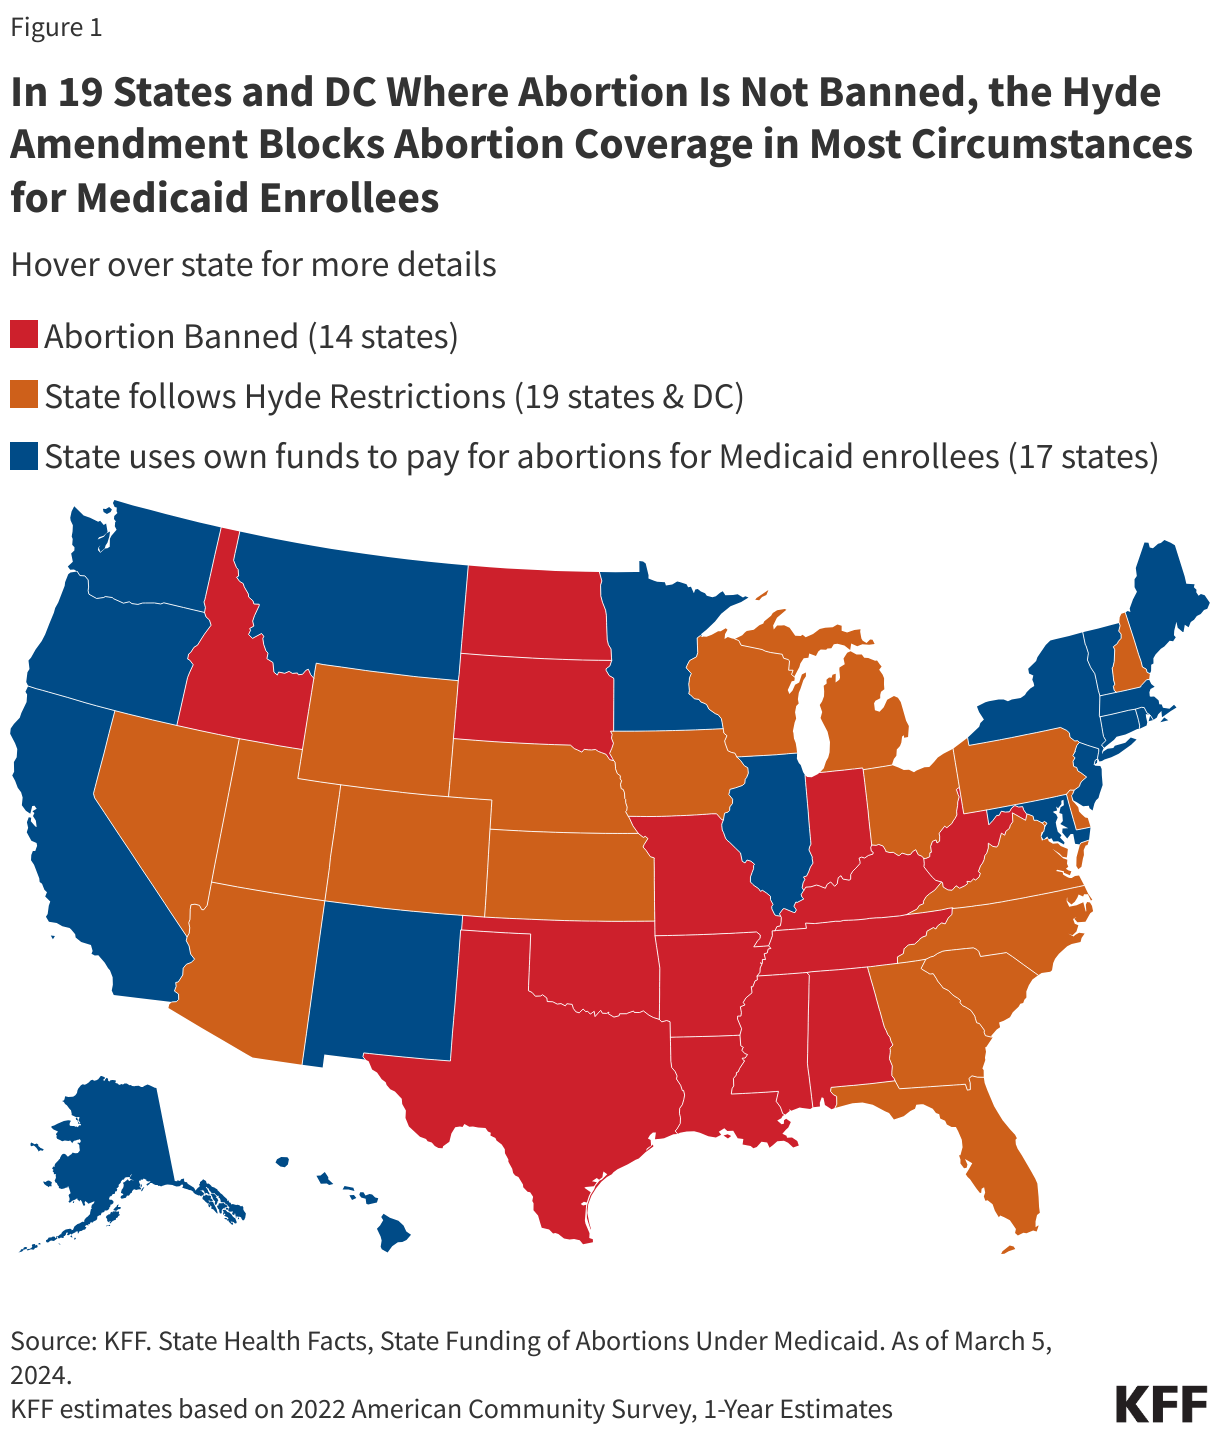
- Among the 36 states that do not ban abortion, 19 states and DC follow the Hyde Amendment and 17 states use state funds to pay for abortions for women with low incomes insured by Medicaid beyond the Hyde limitations.
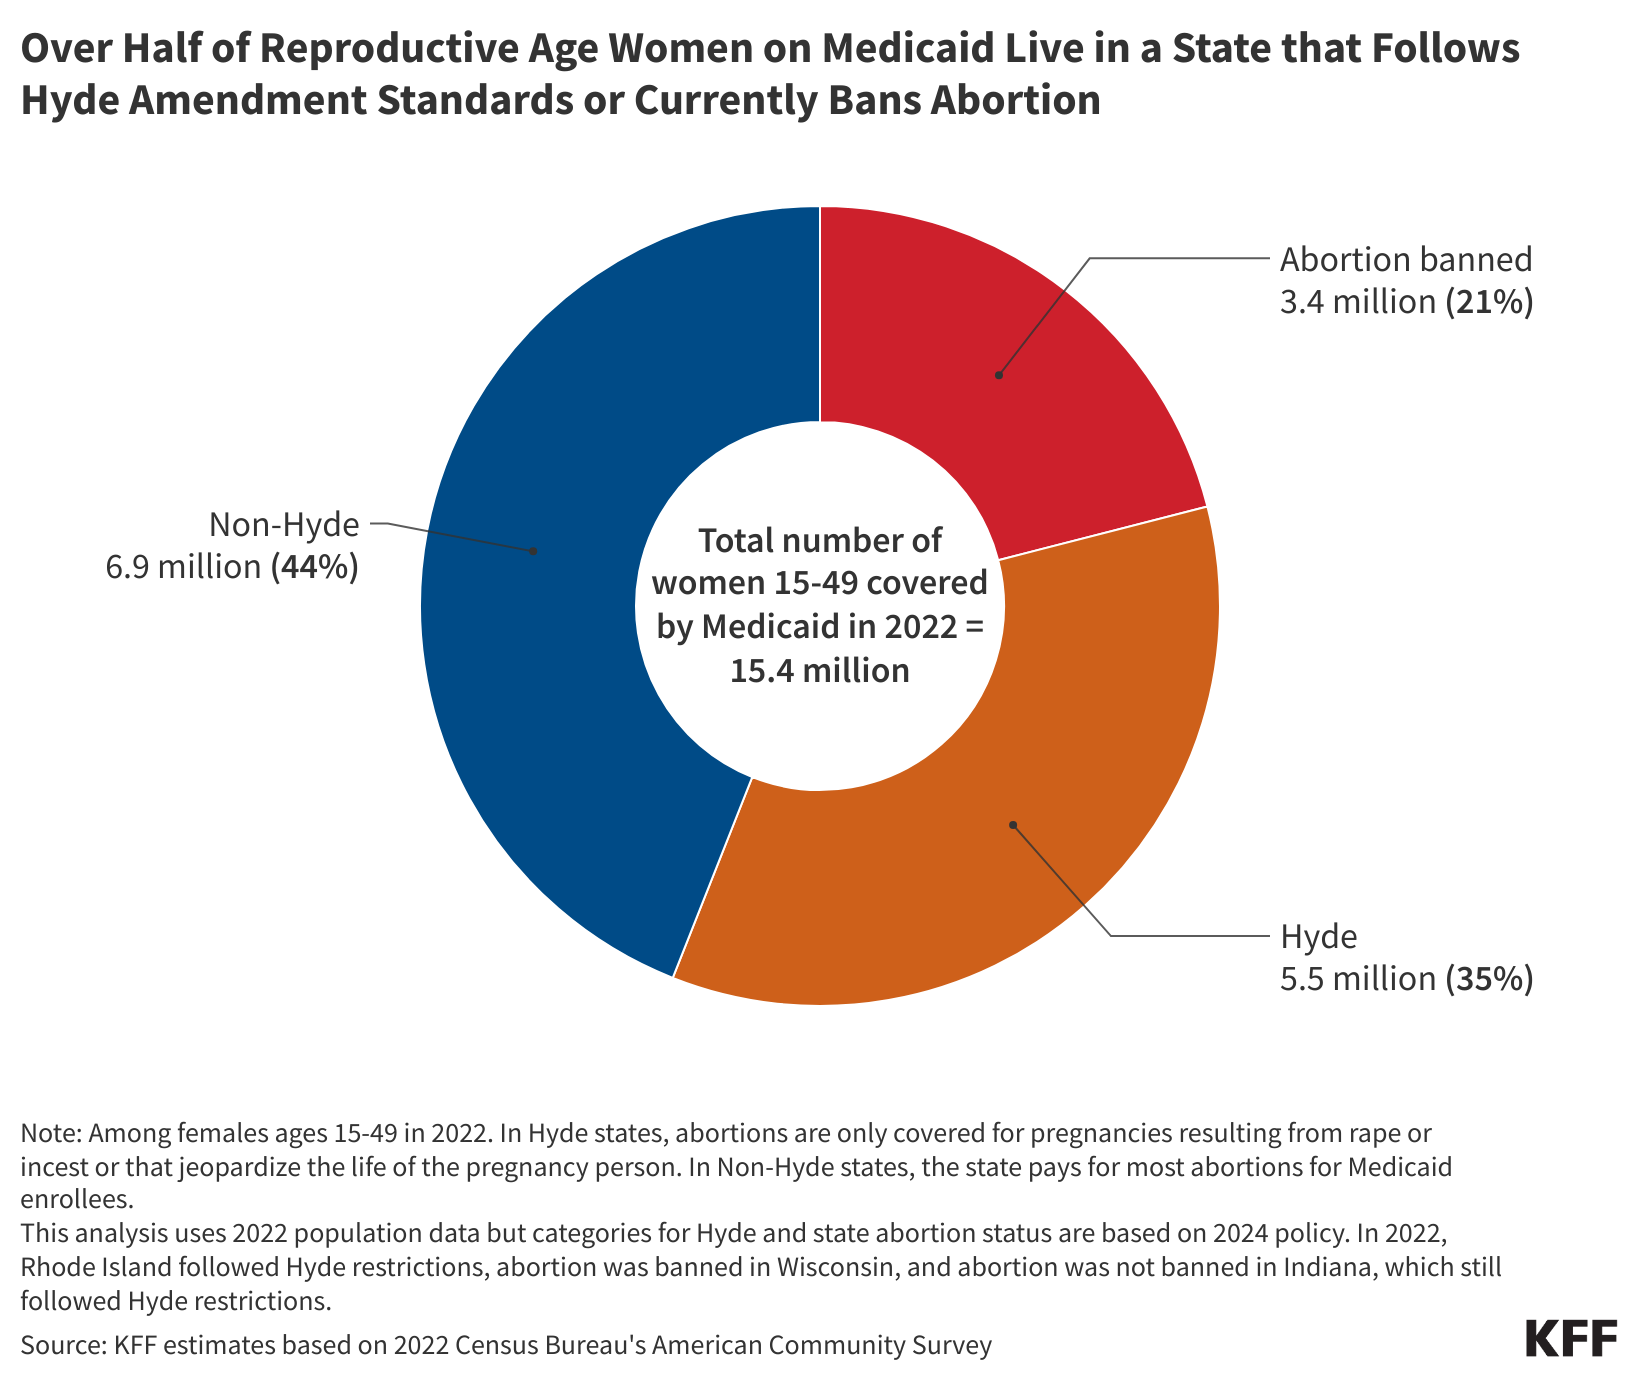
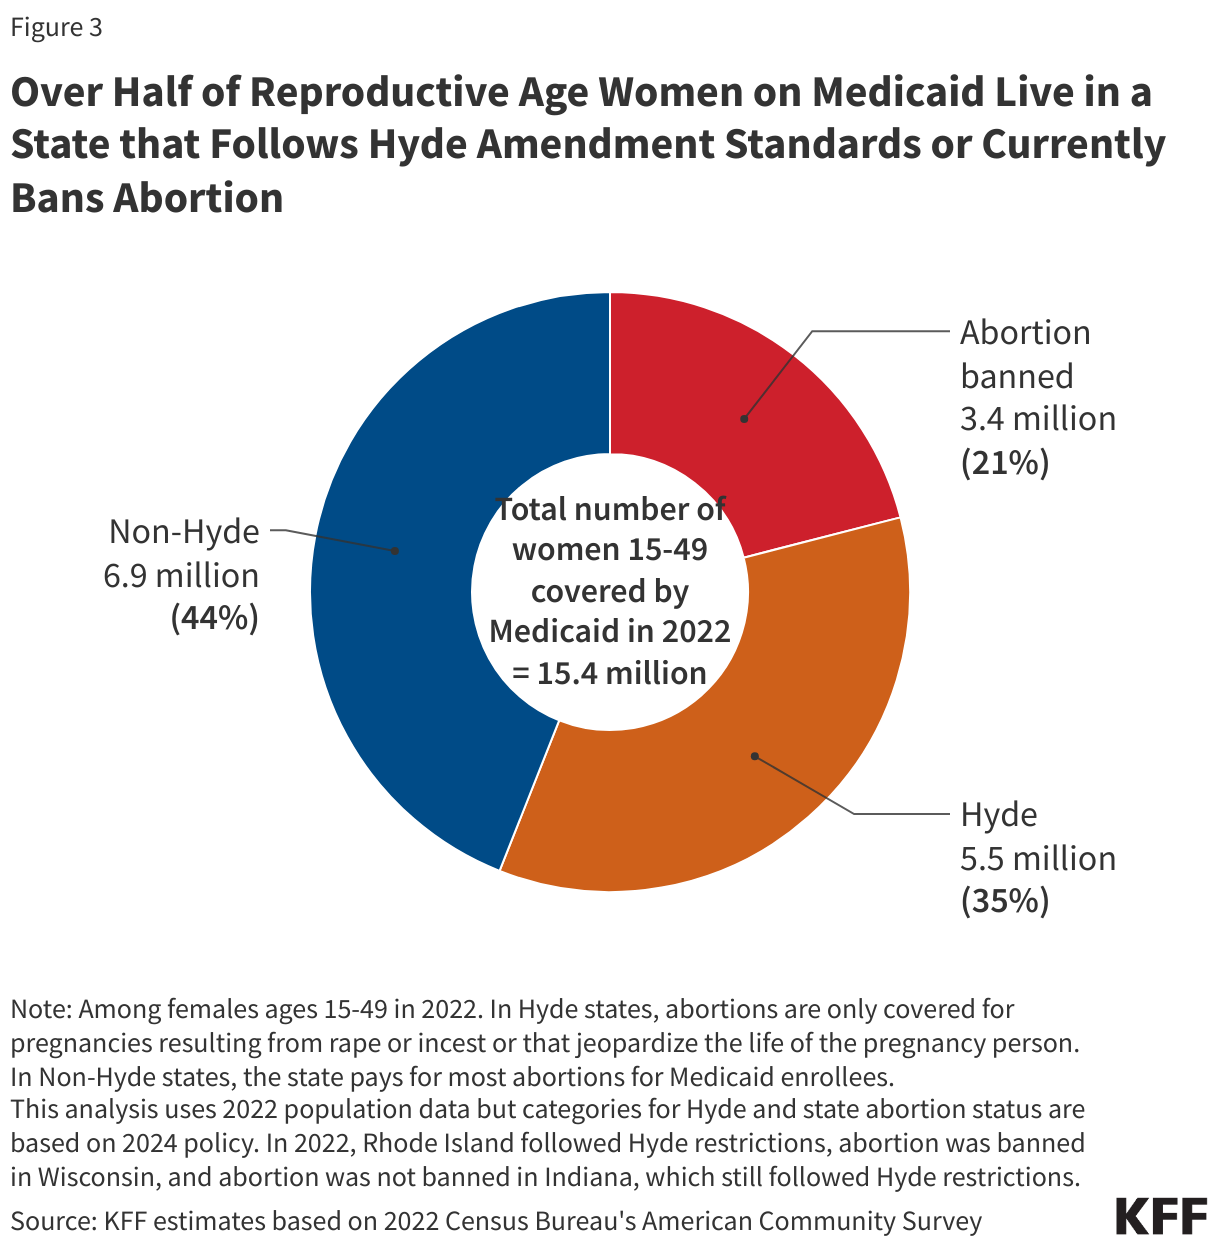
- Today, 35% (5.5 million) of women ages 15 to 49 covered by Medicaid live in states where abortion remains legal, but the program will not cover the service except for limited Hyde circumstances. Twenty-one percent live in a state where abortion is banned.
- Medicaid is a significant source of health coverage for women who have higher rates of abortion in the U.S. including women with low incomes, and women of color.
The overturning of Roe v. Wade has limited abortion access in large swaths of the United States, but for many individuals, especially those with Medicaid coverage, access to abortion services was limited prior to the Dobbs decision. Starting in 1977, the Hyde Amendment has banned the use of any federal funds for abortion, only allowing exceptions to pay for terminating pregnancies that endanger the life of the woman, or that result from rape or incest. Since it was first enacted over 40 years ago, the amendment has been sponsored and supported by legislators who oppose abortion and object to the federal government’s use of taxpayer money for abortion services. The policy is not a permanent law but rather has been attached as a temporary “rider” to the annual Congressional appropriations bill for the Department of Health and Human Services (HHS) and has been renewed annually by Congress.
This brief details the federal programs that are affected by the Hyde Amendment and laws and regulations that have a similar goal, provides estimates on the share of women insured by Medicaid affected by the law, reviews the impact of the law on their access to abortion services, and discusses the potential effect if the law were to be repealed.
What programs does the Hyde Amendment affect?
A backlash to the Roe v. Wade ruling, the Hyde Amendment initially only affected federal funding for abortions under Medicaid, a state and federal health program for individuals with low incomes. Because Congress reauthorizes the Hyde Amendment annually as an attachment to the appropriations bill for HHS, it also restricts federal abortion funding under the Indian Health Service, Medicare, and the Children’s Health Insurance Program. Over the years, language similar to that in the Hyde Amendment has been incorporated into a range of other federal programs that provide or pay for health services to people who could become pregnant, including the military’s TRICARE program, federal prisons, the Peace Corps, and the Federal Employees Health Benefits Program (Appendix Table 2). The Affordable Care Act (ACA) includes a provision that applies the Hyde restrictions to Marketplace plans, ensuring that federal funds are only used to subsidize coverage for pregnancy terminations that endanger the life of the woman or that are a result of rape or incest. Marketplace insurers can offer a plan the covers abortions beyond the federal limitations, but federal funds cannot be used towards this coverage. There are also federal rules on how insurers must segregate the funds used toward the premium for abortion coverage.
Because Medicaid is jointly funded by the federal and state governments, states can choose to pay for abortions for Medicaid enrollees in other instances but must use their own revenues, and not federal funds, to cover the service. Currently, abortion remains legal in 36 states and DC (although states vary in their gestational limits). Of these states, 17 have a policy directing the use of their own funds to pay for abortions for women with low incomes insured by Medicaid beyond the Hyde limitations, nine of which provide coverage as the result of a court order (Figure 1). Most recently, there has been litigation challenging Pennsylvania’s policy to restrict abortion coverage for Medicaid enrollees. In January 2024, the Pennsylvania Supreme Court ruled that the state constitution “secures the fundamental right to reproductive autonomy, which includes a right to have an abortion or carry a pregnancy to term.” The lower court will review the case in light of this ruling and depending on the ruling, Pennsylvania could become the 18th state to use its state funds to pay for abortion services for Medicaid enrollees. In the remaining states and the District of Columbia where abortion is not banned, almost all state programs do not pay for abortions for enrollees beyond the Hyde exceptions. In a few of these states, however, abortion coverage is still very restricted, but state programs use state funds to extend coverage to very limited situations where the pregnant person’s health is at risk or there is a fetal anomaly.
Intersection of state laws banning abortion and the Hyde Amendment
Federal courts have ruled that the Medicaid statute, as modified by the Hyde Amendment, requires states to pay for abortions that fall under the Hyde Exceptions and have blocked enforcement of state statutes that prohibit coverage for these exceptions. The federal government has stated that the Hyde Amendment requires coverage in cases of rape, incest, and life endangerment. In 1998, in a letter to all the state Medicaid directors explaining a change to the Hyde Amendment, Health and Human Services stated that: “All abortions covered by the Hyde Amendment, including those abortions related to rape or incest, are medically necessary services and are required to be provided by states participating in the Medicaid program.” However, a 2022 Congressional Research Service (CRS) overview of the Hyde Amendment, published after the Dobbs decision, lists open questions, such as whether payment for travel for abortion services also falls under the scope of the Hyde Amendment and conjectures that the interplay of state abortion bans and laws and the Amendment may be relitigated.
Despite this clear guidance, and court precedent, historically the Centers for Medicare & Medicaid Services (CMS) has not taken any enforcement action against states for failing to comply with covering abortion in all of the circumstances required by Hyde. A 2019 GAO study of state policies regarding Medicaid coverage of abortion found that South Dakota’s Medicaid program only covers abortions in the case of life endangerment, but no action was taken by CMS.
Since the Dobbs ruling, people living in many states cannot legally obtain an abortion in their state in all the Hyde circumstances including rape or incest. Fourteen states have banned abortion, and although all of these bans contain exceptions to safeguard the life of the pregnant person, most do not have exceptions for cases of rape or incest, and therefore, would not allow for the provision of those services to Medicaid enrollees in those states (Alabama, Arkansas, Kentucky, Louisiana, Mississippi, Missouri, Oklahoma, South Dakota, Tennessee and Texas). Rarely, some Medicaid enrollees may be able to travel out of state and have a clinic bill their home state Medicaid for an abortion in the Hyde circumstances. For example, a clinic in Minnesota, where abortion is legal, provides abortions to North Dakota Medicaid enrollees and bills North Dakota Medicaid when the abortion qualifies for a Hyde circumstance. However, most Medicaid enrollees living in states where abortion is banned will not be able to use their coverage for an abortion that qualifies as a Hyde circumstance. There are practically no abortion providers in states where abortion is banned, and people who can travel out of state will most likely not be able to find a provider able to bill their home state’s Medicaid program.
Additionally, some states have extensive reporting requirements for cases of rape and incest that may be acting in conflict with the agency’s guidance. In a 1993 letter to all Medicaid directors, Sally K. Richardson, the director of the Medicaid Bureau at CMS, wrote that state-established reporting requirements for rape or incest “may not serve as an additional coverage requirement to deny or impede payment for abortion where pregnancies result from rape or incest. The State must establish procedures which permit the reporting requirements to be waived and the procedure reimbursed if the treating physician certified that in his or her professional opinion, the patient was unable, for physical or psychological reasons to comply with the reporting requirements.” The 2019 GAO study found that states have a variety of invasive requirements for women claiming abortion coverage under Hyde including provider certification of rape, incest, or life endangerment; beneficiary certification of rape or incest; documentation (such as police report or report with a public health agency) of rape or incest; prior authorization; and prior certification of counseling for the abortion. For example, since 2013, Iowa has required formal approval from the Office of the Governor in order to secure reimbursement for any abortions covered by Medicaid.
Another requirement of the Medicaid program is that all drugs included in the Medicaid Drug Rebate Program must be covered. Mifeprex, the prescription drug most commonly used for medication abortions, is a drug included in the Medicaid Drug Rebate Program, and therefore must be covered by all state Medicaid programs. Most abortions occur in the first trimester when medication abortion is an option, and over half of abortions nationally are now medication abortions. However, the same 2019 GAO report found that 14 state Medicaid programs did not cover Mifeprex.
What is the Hyde Amendment’s impact on women on Medicaid?
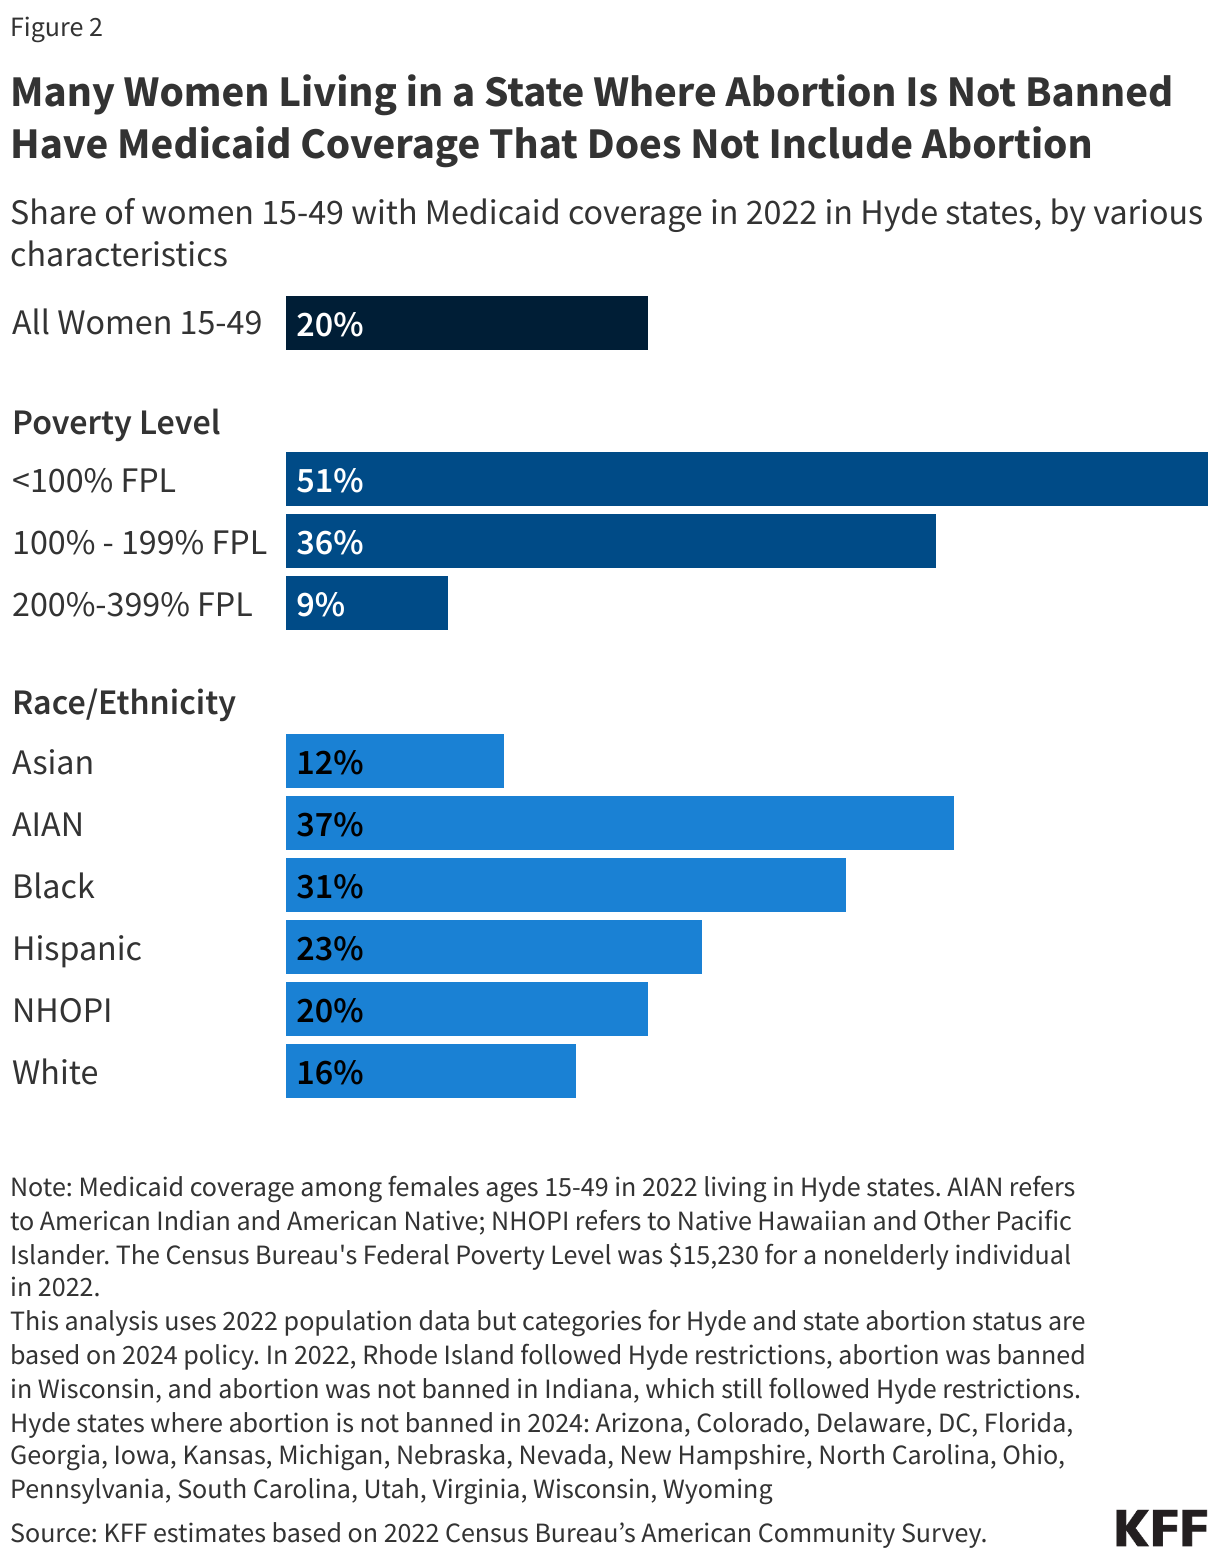
Medicaid is a significant source of health coverage for women who have higher rates of abortion in the U.S. including women with low incomes, and women of color. Today, Medicaid covers one in five women (20%) of reproductive age (15-49 years) living in Hyde states. In 2022, over half (51%) of women below the Federal Poverty Level (FPL) living in Hyde states were insured by Medicaid (Figure 2). This number is decreasing, though, with the unwinding of the Public Health Emergency (PHE) protections put in place in response to the COVID-19 pandemic that had allowed people to maintain their Medicaid coverage throughout the PHE. However, the program will continue to remain the main source of coverage for young women with low incomes.
Since the Dobbs ruling, the number of abortions nationally has risen compared to the pre-Dobbs period. However, there is large variation between states and regions. While there has been an increase in the number of abortions in states where it remains legal, there have been steep drops in states with bans (to nearly 0) and gestational limits. Some people in states with bans have been able to travel to other states to obtain abortions. However, there are significant financial and logistical obstacles to traveling for an out of state abortion, and many people with low incomes may not have the funds and resources to do so.
Without coverage for abortion under Medicaid, women must pay out-of-pocket for the procedure or rely on abortion funds or borrow money from friends or family to cover the costs. Costs vary by location, facility, and gestational age, but in 2021, the median out-of-pocket costs a first trimester abortion were $568 for a medication abortion and $625 for a procedural abortion. The costs of abortion are higher in the second trimester compared to the first, with median self-pay of $775. Abortion costs are higher in states with more restrictive policies and even more for people living in states with abortion bans (when you take into account the cost of travel, childcare lodging, lost wages, and abortion care itself). Though the vast majority (~90%) of abortions are performed in the first trimester of pregnancy, the costs are challenging for many people with low incomes. According to the Federal Reserve Board, 37% of U.S. adults do not have enough savings to pay for a $400 emergency expense. People covered by Medicaid in states that use state funds to pay for abortion have no out-of-pocket costs for abortion. State Medicaid programs only cover services provided in the state. So, people are not able to travel to another state and use their own state Medicaid coverage to pay for services.
The Turnaway Study found that many of those who received an abortion at any gestational period faced logistical barriers, including difficulty finding a provider and raising funds for the procedure and travel, but these barriers were more common and had greater consequences for those seeking an abortion at or after 20 weeks gestation. It is more difficult to find a provider for abortions later in pregnancy and the procedure is more expensive. Approximately 4% of abortions are performed at 16 weeks or later in the pregnancy. For people with medically complicated health situations or who need a second-trimester abortion, the costs can be prohibitive. In some cases, people find they have to delay their abortion while they take time to raise funds or in other cases, they were not able to obtain abortions because they cannot afford the costs of the procedure. Furthermore, people who first learn of a fetal anomaly in the second trimester when the costs are considerably higher can face significant costs if they seek to terminate a pregnancy that may not be viable.
What would be the impact on abortion coverage if the Hyde Restrictions were lifted?
For many people with low incomes, the lack of Medicaid coverage for abortion is a major barrier to abortion access that existed long before the Dobbs decision. One study from before the Dobbs decision estimated that 29% of pregnant Medicaid-eligible women in Louisiana would have had abortions instead of giving birth if Medicaid covered abortions. Not surprisingly, states that do not use state funds to cover abortions outside of the Hyde limitations pay for substantially fewer abortions. In 2014, 52% of abortion patients residing in states that use their own funds to pay for abortion had the procedure covered by Medicaid, compared to 1.5% of patients who lived in states adhering to Hyde restrictions. This stark differential strongly suggests that if abortion coverage were to be expanded under Medicaid, more people would qualify for abortion coverage, and the number of abortions paid for by the program would rise. Today, 5.5 million women are enrolled in Medicaid and live in states where abortion remains legal, but the program will not cover the service except for limited Hyde circumstances (Figure 3).
However, the extent of the change in Medicaid-funded abortions would likely vary considerably by state as it would be affected by a range of factors, including state laws, reimbursement rates, and the availability of providers. For example, some states already have (or could enact) laws that prohibit state dollars from being used for abortion in the same way that they now ban coverage through private plans and the ACA Marketplace plans. Advocates who support abortion rights are working to counteract these efforts through federal legislation such as the Abortion Justice Act and the EACH Woman Act, which would both seek to prohibit the federal and state governments from restricting insurance coverage for abortion in both public and private health insurance programs. Beyond Hyde, these advocates are working to expand and protect abortion access through court challenges to bans and efforts to pass state and federal laws. Advocates who oppose abortion are working to make Hyde permanent law and are endorsing the passage of federal legislation, such as amending Title I8 of the United States Code, to prohibit abortion in cases where a fetal heartbeat is detectable, and to pass the No Taxpayer Funding for Abortion and Abortion Insurance Full Disclosure Act that would make Hyde-type restrictions on abortion funding permanent and applicable government-wide, rather than as a temporary policy rider. In a divided Congress, none of these proposals are likely to be enacted.
Removing the Hyde amendment from the appropriations bill would not automatically grant abortion coverage to women covered under other programs with Hyde-like restrictions. In order for Peace Corps workers, federal employees, and others who are receiving federally funded health benefits (outside of the HHS Appropriations bill) to obtain abortion coverage, the Hyde-like provisions would need to be lifted from the Congressionally approved appropriations bills that fund those federal programs. For women covered by Indian Health Services, TRICARE, or Veteran Affairs to obtain abortion coverage, additional congressional action would be required to change the authorizing laws (Appendix Table 2).
Despite higher shares of people with private insurance and Medicaid resulting from the coverage expansions established by the ACA, coverage for abortion services remains limited. Pregnant people who qualify for Medicaid are by definition low-income and will likely struggle to find the resources to pay for their abortions. While the removal of the Hyde Amendment could broaden this abortion coverage for millions of women with low incomes who receive federally subsidized health coverage, the true impact of such a policy change would vary by program and state, especially given the context of the abortion bans. Forty years after the first time the Hyde Amendment was first applied to a federal appropriations bill, the law is still being debated, reflecting the persistently polarized nature of the abortion debate in the United States.