Editorial Note
This brief was updated on June 22, 2026 to correct insurer counts for Minnesota.
For the first time since the enhanced premium tax credits were introduced in 2021, insurer participation in the ACA Marketplaces has gone down. This drop follows the expiration of the enhanced premium tax credits at the end of 2025 and is primarily driven by the exit of Aetna CVS from 17 states as well as exits from other insurers. While the average number of insurers per state offering plans in the Marketplaces in 2026 is lower than in the years after the enhanced premium tax credits were established, more insurers are now offering plans than were before the enhanced tax credits.
Key Findings
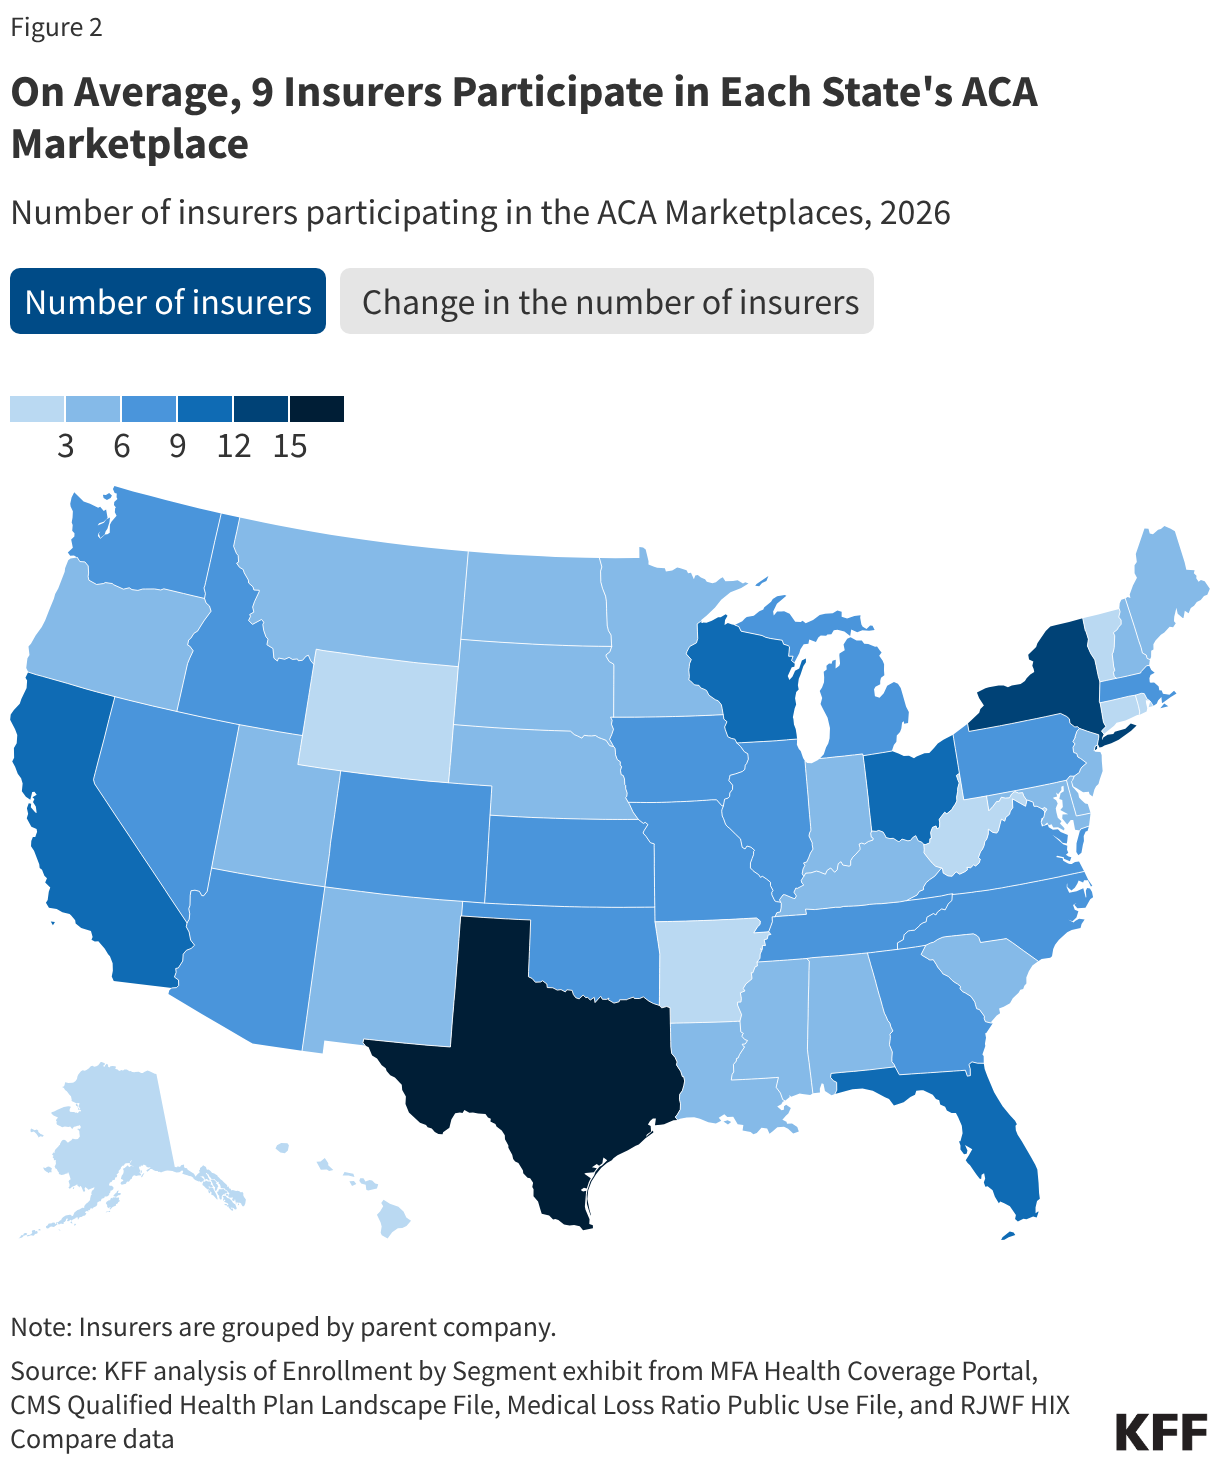
- The average number of issuers offering plans in the ACA Marketplaces has declined from a record high of 9.6 issuers per state in 2025 to 9.0 issuers per state in 2026.
- In total, 19 states experienced a net decrease in the number of issuers offering ACA Marketplace plans.
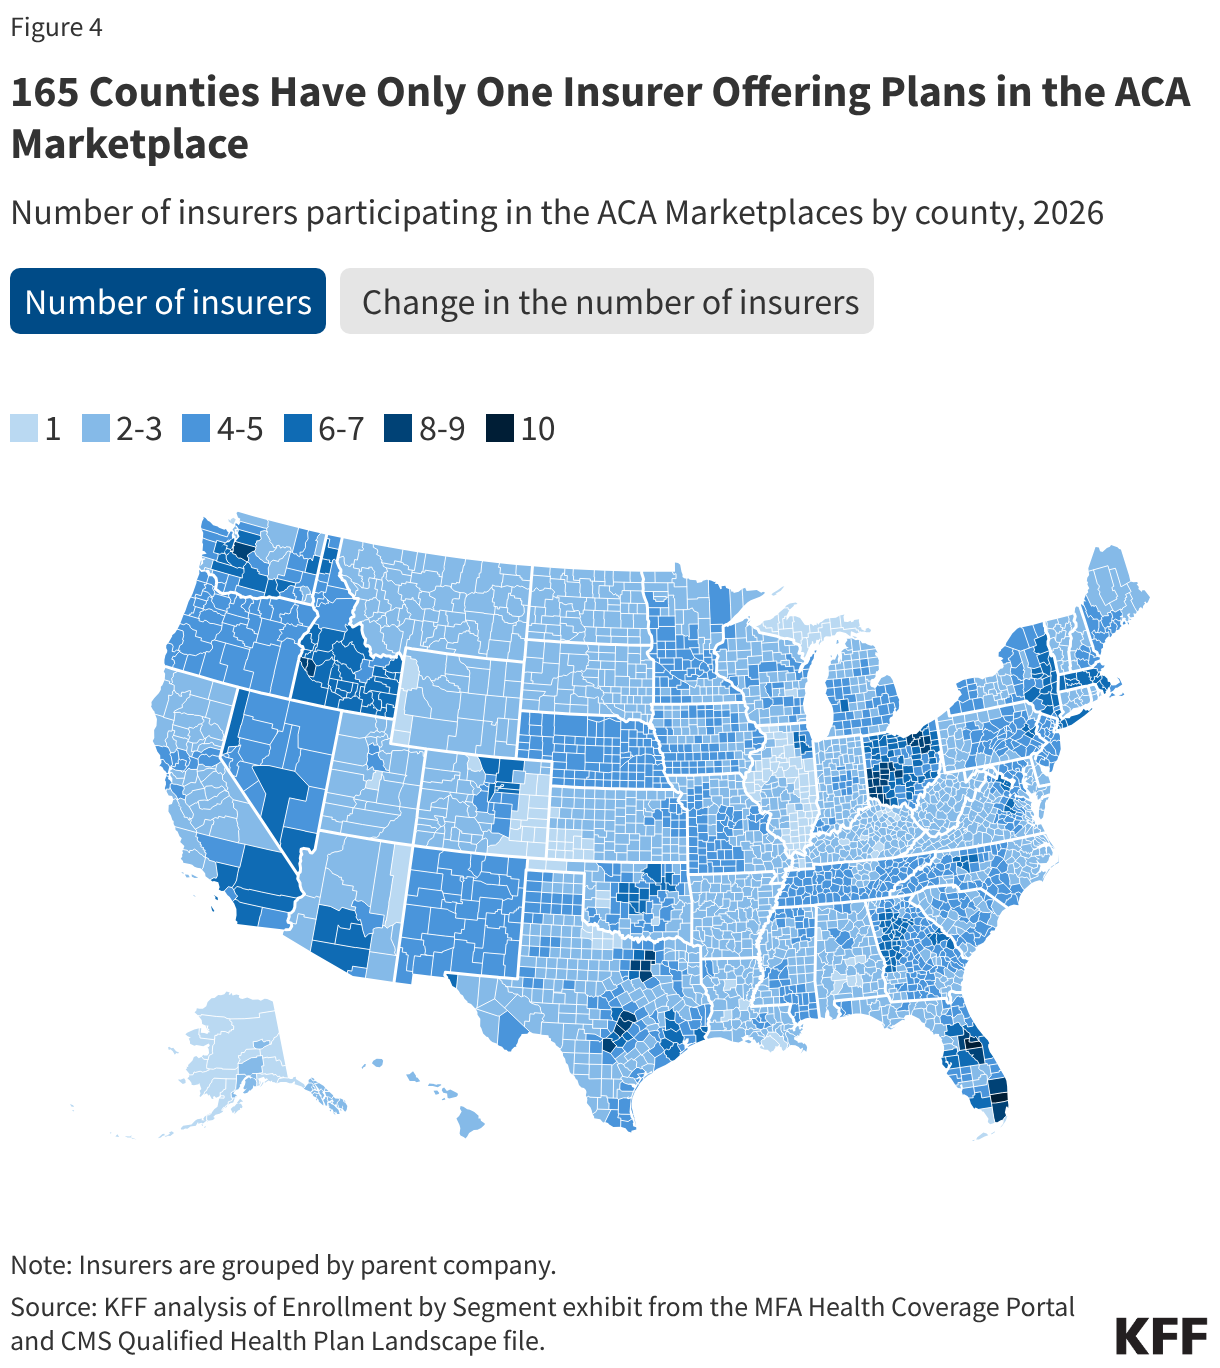
- 1 in 3 counties has fewer participating ACA insurers than last year. In 165 counties, only one issuer is offering plans on the ACA Marketplace, up from 93 counties in 2025.
Insurer Participation
National Level
Figure 1
Nationally, average insurer participation in the ACA Marketplaces has decreased from the record high of 9.6 insurers per state in 2025 to 9.0 insurers per state in 2026. This decrease follows the nationwide departure of CVS from the Exchanges and marks the first time since 2018 that the average number of insurers in the ACA Marketplaces has gone down. Insurer participation on the ACA Marketplaces fell in 2017 with the exit of UnitedHealthcare from most states. In 2018, following several attempts to repeal the ACA in Congress as well as changes to enforcement of the individual mandate and payments for cost-sharing reductions, many more insurers exited or scaled back their participation. As the Marketplace stabilized in the following years, participation in the ACA Marketplaces steadily grew with some insurers returning to the Marketplace and several others expanding their footprints.
One factor that contributes to the number of insurers participating in the Marketplaces is the number of people with coverage. After the introduction of the enhanced premium tax credits in 2021, enrollment in the Marketplaces reached new records. In line with this trend, the number of insurers offering plans in the ACA Marketplaces increased significantly in 2022. Data shows that after the expiration of the enhanced premium tax credits, 2026 Open Enrollment Period sign-ups declined by over one million people relative to last year; and the number of people who pay to maintain and “effectuate” their coverage will likely decline throughout the year. KFF estimates that average effectuated enrollment in the Marketplaces could decline by about five million people from 2025 to 2026.
ACA Marketplace enrollment declines affect the size of the potential market for insurers and, potentially, the risk pool—to the extent that healthier than average enrollees are more likely to drop coverage. As people leave the Marketplace, insurers may reassess the profitability of their Marketplace participation and more may decide to pull out in the future, either fully or in select states. Several insurers have already announced departures for the 2027 plan year. KFF’s Insurer Participation Tracker maps announced insurer exits and entries for 2027.
State Level
The five states with the most insurers offering plans in their ACA Marketplaces in 2026 are Texas (15), New York (12), California (11), Florida (11), and Wisconsin (11). Going into 2026, most states had the same number of issuers participating in their Marketplaces as in 2025.
In 19 states, the number of insurers offering ACA Marketplace plans in 2026 is lower than in 2025. Illinois and Michigan saw the greatest net decrease in the number of carriers, with three fewer insurers participating in their Marketplaces than in 2025. This decrease resulted from insurers exiting the Marketplace or being acquired by another insurer, reducing the overall number operating in a state. In Minnesota, Medica began administering UCare plans after the latter entered receivership.
Four states (Alabama, Iowa, Louisiana, and Washington) experienced a net increase of one insurer. For example, Oscar Health newly joined the Exchange in Alabama and Elevance Health (doing business as Wellpoint) began offering plans in Washington.
The most prominent insurer in the Marketplace is UnitedHealth, which offers Marketplace plans in 30 states. Some of the other major players currently in the Marketplace include Centene Corporation (29 states), Oscar Health (20 states), Elevance Health (18 states), Molina Healthcare (14 states), Cigna Health (11 states), and Kaiser (10 states). CVS, which ran Aetna plans in the ACA Marketplaces, was a significant insurer participating in the ACA Marketplaces in 2025. Before leaving the Marketplace for plan year 2026, CVS Aetna offered plans in 17 states.
Some of the aforementioned insurers are among those with the largest number of enrollees in the individual market (the vast majority of which was made up of people in the Marketplace in 2025). For example, in 2024, 18% of people in the individual market were enrolled in a plan offered by the Centene Corporation and 8% of individual market enrollees were in a plan offered by CVS.
County Level
Figure 3
Even if an insurer remains in a state, it may significantly change its footprint from year to year. Insurers adjust their footprints by expanding into some counties or withdrawing from others. For example, UnitedHealth scaled back its footprint in Kansas from 87% of counties in 2025 to 33% in 2026, and in South Carolina from 72% of counties in 2025 to 37% in 2026. However, it also expanded its service area in Oklahoma, offering plans in 74% of counties in 2026, up from 18% in 2025. Another major player in the ACA Marketplaces, Centene Corporation, went from offering plans in all counties in North Carolina in 2025 to 63% of counties in 2026. This decrease is driven by the exit of WellCare (a subsidiary of Centene) from the North Carolina Marketplace starting in 2026. In Iowa, Centene’s footprint increased from 33% to 59% of its counties going from 2025 to 2026.
In 2026, 1 in 3 counties saw a decrease in the number of insurers participating in the Marketplaces. The counties that experienced the greatest number of insurers leaving were in Wisconsin, which saw two insurers (Chorus Community Health Plan and Molina Healthcare) exiting the ACA Marketplace entirely as well as shrinking presence of others (namely, CareSource and University Health Care and Gundersen Lutheran). Some counties in North Carolina and Michigan also experienced significant declines in the number of participating insurers, with as many as three carriers leaving counties starting in 2026.
In total, 165 counties have only one insurer offering plans in the ACA Marketplaces in 2026. For 90 of these counties, this is a result of insurers not offering plans in that county anymore starting in 2026. For the remaining 75 one insurer counties, the number of carriers offering plans remains the same as in 2025.
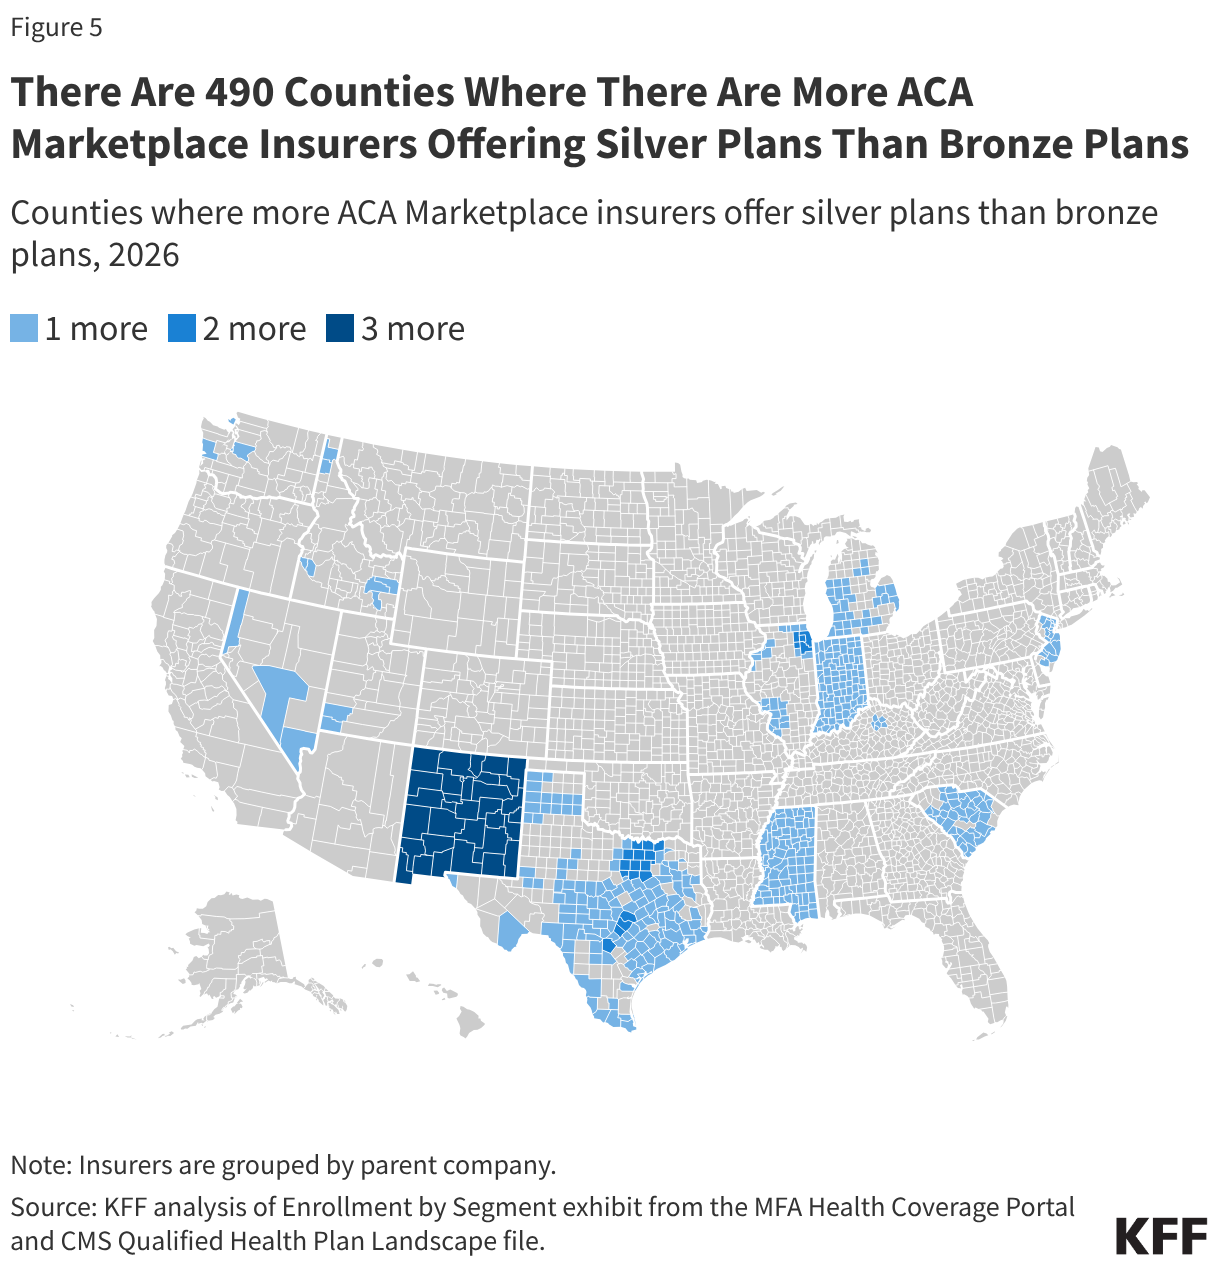
Issuers do not always offer bronze plans. By law, every ACA Marketplace insurer must offer at least one silver and gold plan wherever they sell coverage. In 2026, there were 490 counties (predominantly located in New Mexico, Indiana, Mississippi, New Jersey, Texas, and South Carolina) where some participating insurers decided not to offer bronze plans. In these places, the selection of plans for consumers who wish to decrease their premium payments by buying a lower coverage metal level may be reduced. However, for 433 of these 490 counties, at least two insurers offer bronze plans.
Methods
The Qualified Health Plan Individual Medical Landscape File and Robert Wood Johnson Foundation (RWJF) HIX Compare file were used to determine the number of insurers participating in states using the federal platform and state-based Exchanges, respectively. HIOS IDs from these files were mapped to the 2024 MR Submission Template Header to determine the NAIC Code for each insurer, which was then joined with 2025 data from Mark Farrah Associates’ Enrollment by Segment Exhibit (downloaded December 9, 2025) to identify the parent company associated with each insurer. In cases when a parent company is not successfully identified through the MR Submission Template Header and the Enrollment by Segment Exhibit, additional work was done to identify and manually assign either the NAIC code or parent company name for each plan. Insurer in this analysis refers to parent company, irrespective of the name under which it does business across states.
The following manual additions/changes were also made:
- Data for New York was adjusted to include Anthem Blue Cross and Blue Shield HP, Anthem Blue Cross HP, and Independent Health.
- Bronze plans identified to be in San Juan County, Washington after combining the RWJF datasets together were removed.
- The parent company for UCare Plans in Minnesota in 2026 was changed to Medica to reflect Medica's acquisition of UCare's individual market contracts.
HIX Compare insurer plan availability is reported by rating area—which may contain multiple counties—in conjunction with insurer participation reported by county. County-level insurer counts of plans in state-based Marketplaces may consequently be overstated when the insurer does not offer a given plan in a county but offers other plans in the same county, notably for plans of a given metal level. Although plan availability can vary within a county (such as by ZIP code), a plan is considered as available if offered anywhere in the county.
Appendix
Appendix Figure 1