Understanding the Role of Medicaid Fraud Control Units (MFCUs)

Published: Sep 28, 2026

Federal law requires every state to operate a Medicaid Fraud Control Unit (MFCU) that investigates and prosecutes provider fraud and patient abuse and neglect. MFCUs are typically housed within the state Attorney General’s office and are required to operate independently from the state Medicaid agency that runs the Medicaid program. MFCUs are one component in the Medicaid program integrity system, which includes many different state and federal agencies with shared and distinct responsibilities defined by state and federal law. Ensuring Medicaid program integrity (i.e., the appropriate use of federal and state Medicaid funds) involves a range of activities from fraud prevention to enforcement activities—the primary responsibility of MFCUs. While MFCUs are a key part of the program integrity system, it can be difficult to compare MFCU data across states or to put fraud recovery dollars into the context of overall Medicaid spending because recovery data only capture a portion of Medicaid program integrity efforts (e.g., leaving out the value of fraud prevention or stopped payments) and don’t capture fraud that goes undetected.

As the Trump Administration continues to focus on addressing fraud, waste, and abuse in federal programs, including Medicaid, MFCUs are facing increased federal scrutiny. In May 2026, CMS announced the HHS Office of the Inspector General (HHS-OIG) would be initiating a review of every state’s MFCU before its next annual recertification. In June 2026, the HHS-OIG denied recertification and suspended federal funding for Hawaii’s and New York’s Medicaid Fraud Control Units. Within this context, this brief provides an overview of the role of MFCUs, examines caseload and case outcome data, and current issues facing MFCUs.

What are MFCUs and how do they work?

MFCUs are law enforcement entities that investigate and prosecute provider fraud and patient abuse and neglect. MFCUs investigate and prosecute, or refer to prosecution, provider fraud (in all settings) and complaints of patient abuse in certain health care settings, such as nursing homes and hospitals receiving Medicaid funds.1 MFCUs do not investigate fraud or program abuse committed by beneficiaries (these cases are the responsibility of the state Medicaid agency), although evidence of beneficiary fraud is low.2 MFCUs must operate independently from the state Medicaid agency and are often part of the State Attorney General’s office, employing teams of investigators, attorneys, and auditors. The HHS-OIG oversees MFCUs, annually recertifying each MFCU, assessing performance and compliance with federal requirements, and administering federal grant awards (which cover 75% of MFCU operating costs).

MFCUs open investigations after receiving referrals of suspected provider fraud or complaints involving patient abuse or neglect. A MFCU case typically begins with a referral from the state Medicaid agency (including program integrity or auditing offices), managed care organization (MCO), or from a complaint filed by a patient or former employee. The state Medicaid agency or MCO may initially detect fraud through monitoring Medicaid data and using data mining or analytics to identify billing pattern anomalies (e.g., billing spikes, upcoding, double billing, or unusual hours). All state Medicaid agencies have authority to conduct data mining, but some MFCUs have also specifically been granted permission by HHS-OIG to mine Medicaid data directly for evidence of fraud as part of their regular activities. More MFCUs may begin to conduct data mining or analytics as HHS-OIG in August 2026 waived the requirement that MFCUs obtain prior approval for these activities to identify suspected Medicaid fraud. While patient abuse or neglect may fall under the jurisdiction of several different law enforcement agencies, MFCUs may investigate patient abuse or neglect in health care facilities receiving Medicaid funds.3

MFCU cases vary in duration and scope, but investigations generally follow a standard process starting with an investigation and ending with potential financial recoveries (Figure 1).

Investigation. When a case is opened, the investigative team researches the alleged fraud or abuse by analyzing the evidence. Investigations may take months or years before charges are filed against providers.

Criminal Indictments & Civil Cases. Fraud and abuse can violate state and/or federal criminal law, civil law, or both. If a MFCU’s investigation team determines there is sufficient evidence of wrongdoing, the MFCU can bring criminal charges and/or civil lawsuits against the provider.

Criminal Convictions & Civil Judgments. Criminal convictions can result in a criminal record, financial penalties, and/or incarceration. Civil judgments can establish liability and/or impose financial penalties and other court-ordered remedies. Providers who are convicted or liable for criminal fraud or patient abuse/neglect (along with other crimes) legally must be excluded from participating in federally funded health care programs. HHS-OIG or state Medicaid agencies may also decide to exclude providers beyond these minimum standards.

Recoveries. HHS-OIG defines recoveries as the amount of money that defendants are required to pay as a result of a settlement, judgment, or prefiling settlement in criminal and civil cases. Recoveries may not reflect the amounts actually collected from defendants (e.g., if the defendant is a company that dissolved before collections could be obtained). MFCUs work with state Medicaid agencies to return the state and federal share of any recovered Medicaid payments.

Note: Throughout the lifecycle of a case, MFCUs may collaborate with other state and federal program integrity and law enforcement partners. State entities include state inspectors general and state health departments and federal entities include the U.S. Department of Justice (DOJ) (including Federal Bureau of Investigation (FBI)) and the U.S. Department of Health and Human Services Office of Inspector General (HHS-OIG). Some investigations or cases may be transferred to (or handled by) federal law enforcement agencies.     

Box 1. Example Cases

Active MFCU investigations are typically confidential. When MFCUs secure criminal convictions and civil judgments or settlements, the case is described in an announcement published by the state or the DOJ. To illustrate the variety of cases that may be processed by a MFCU, this box describes examples from a range of states, types of wrongdoing, and recovery amounts.

Criminal Fraud: Between 2004 and 2019, the McKinsey consulting firm provided OxyContin sales and marketing advice to Purdue Pharmaceuticals. The Virginia MFCU participated in a lengthy and complex investigation into alleged criminal wrongdoing resulting in false or fraudulent OxyContin prescriptions paid by Medicaid and other health insurers. The December 2024 resolution of criminal charges against McKinsey resulted in $650 million in recoveries, which contribute to the high total MFCU recoveries reported in FY 2025 (as seen in Figure 4).  

Civil Fraud: As part of the 2018 National Health Care Fraud Takedown, the Georgia MFCU investigated false claims for non-emergency medical transportation (NEMT) and adult day health services. More than $1 million in Medicaid payments were implicated in the investigation. The case was decided in 2019, with state and federal civil judgments resulting in a $10.1 million settlement paid to Georgia and the federal government.

Patient Abuse and Neglect: In 2021, the Massachusetts MFCU received a referral into alleged patient abuse by a home health aide. In 2023 the MFCU obtained a criminal conviction of abuse, neglect, or mistreatment of an elder by a caretaker.


What data do MFCUs report?

Annually, MFCUs report investigation, enforcement, and financial recoveries data to HHS-OIG. Each year, HHS-OIG releases a summary report of MFCU activities that provides an annual snapshot of aggregated case outcomes from all MFCUs and certain case outcome trends. In addition to the summary report, HHS-OIG releases individual (state) MFCU case activity and outcomes data.

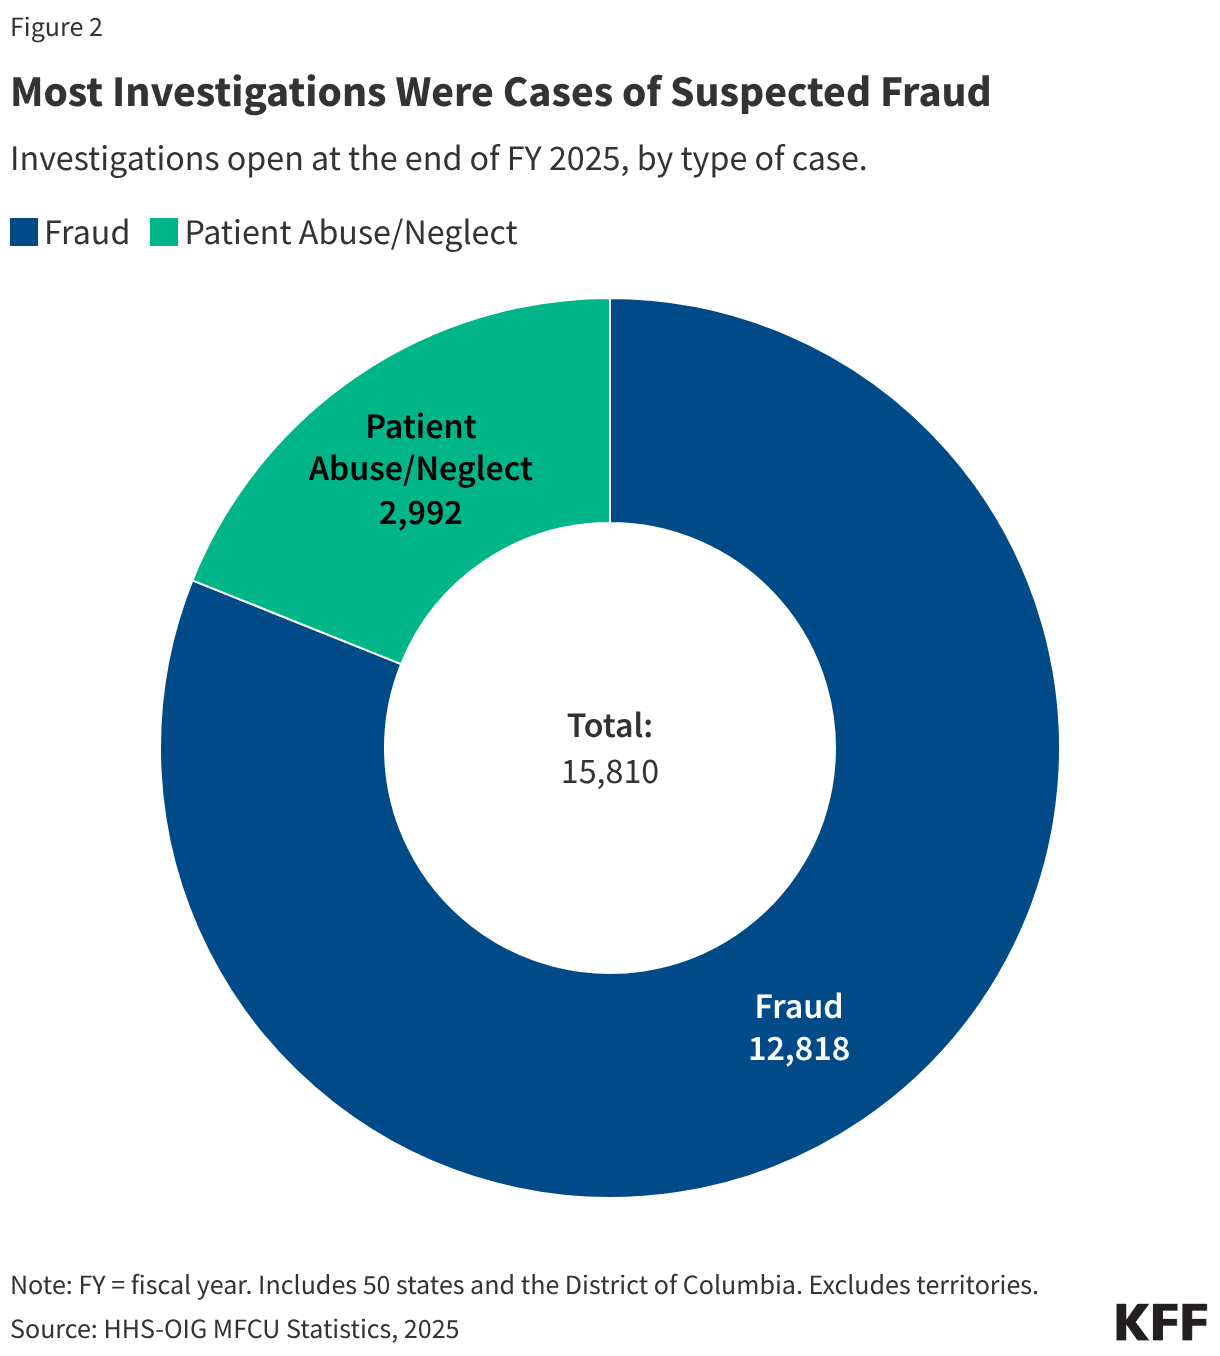
At the end of FY 2025, there were 15,810 open investigations across all state MFCUs. While MFCUs investigate both provider fraud and patient abuse and neglect, data show most MFCU investigations are related to provider fraud (Figure 2). A subset of investigations leads to criminal indictments or civil cases / complaints. MFCU investigations can take months to years, depending on various factors, including the types of allegations involved, volume of records, and agencies involved.

Most Investigations Were Cases of Suspected Fraud (Donut Chart)

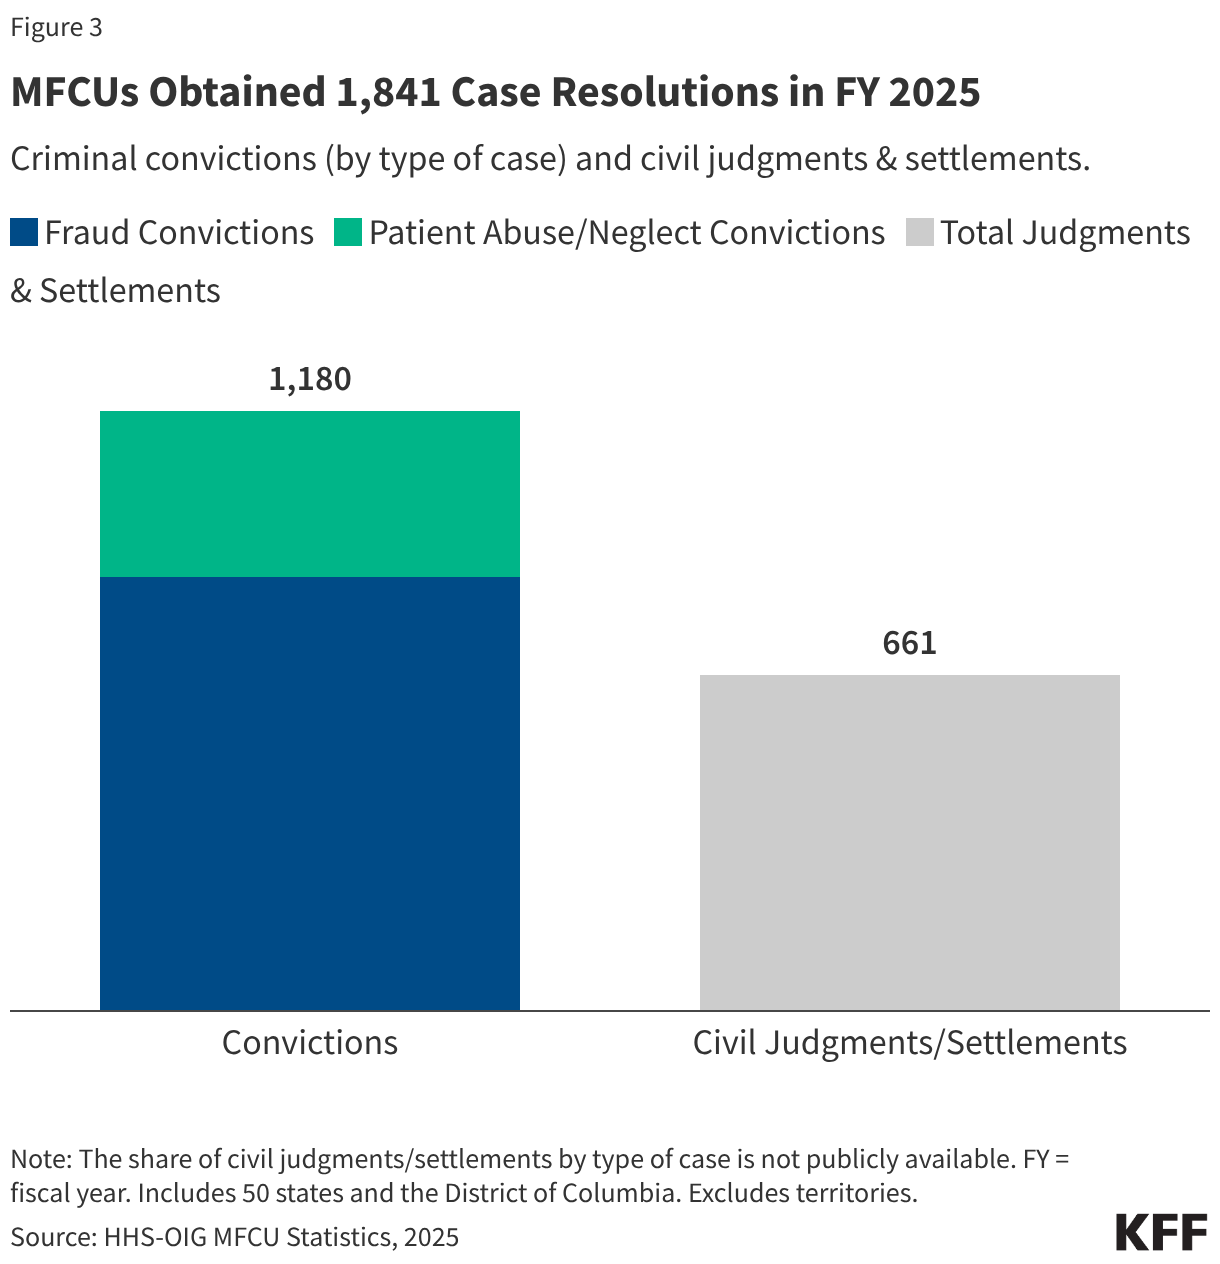
In FY 2025, MFCUs obtained 1,180 criminal convictions and reached 661 civil settlements and judgements (Figure 3). Most criminal convictions were for provider fraud. HHS-OIG uses information it receives from MFCUs to exclude individuals and entities from participating in federal health programs. In FY 2025, 900 individuals or entities were excluded because of criminal convictions obtained by MFCUs—accounting for nearly one-third (32%) of all OIG exclusions that year (data not shown).

MFCUs Obtained 1,841 Case Resolutions in FY 2025 (Stacked column chart)

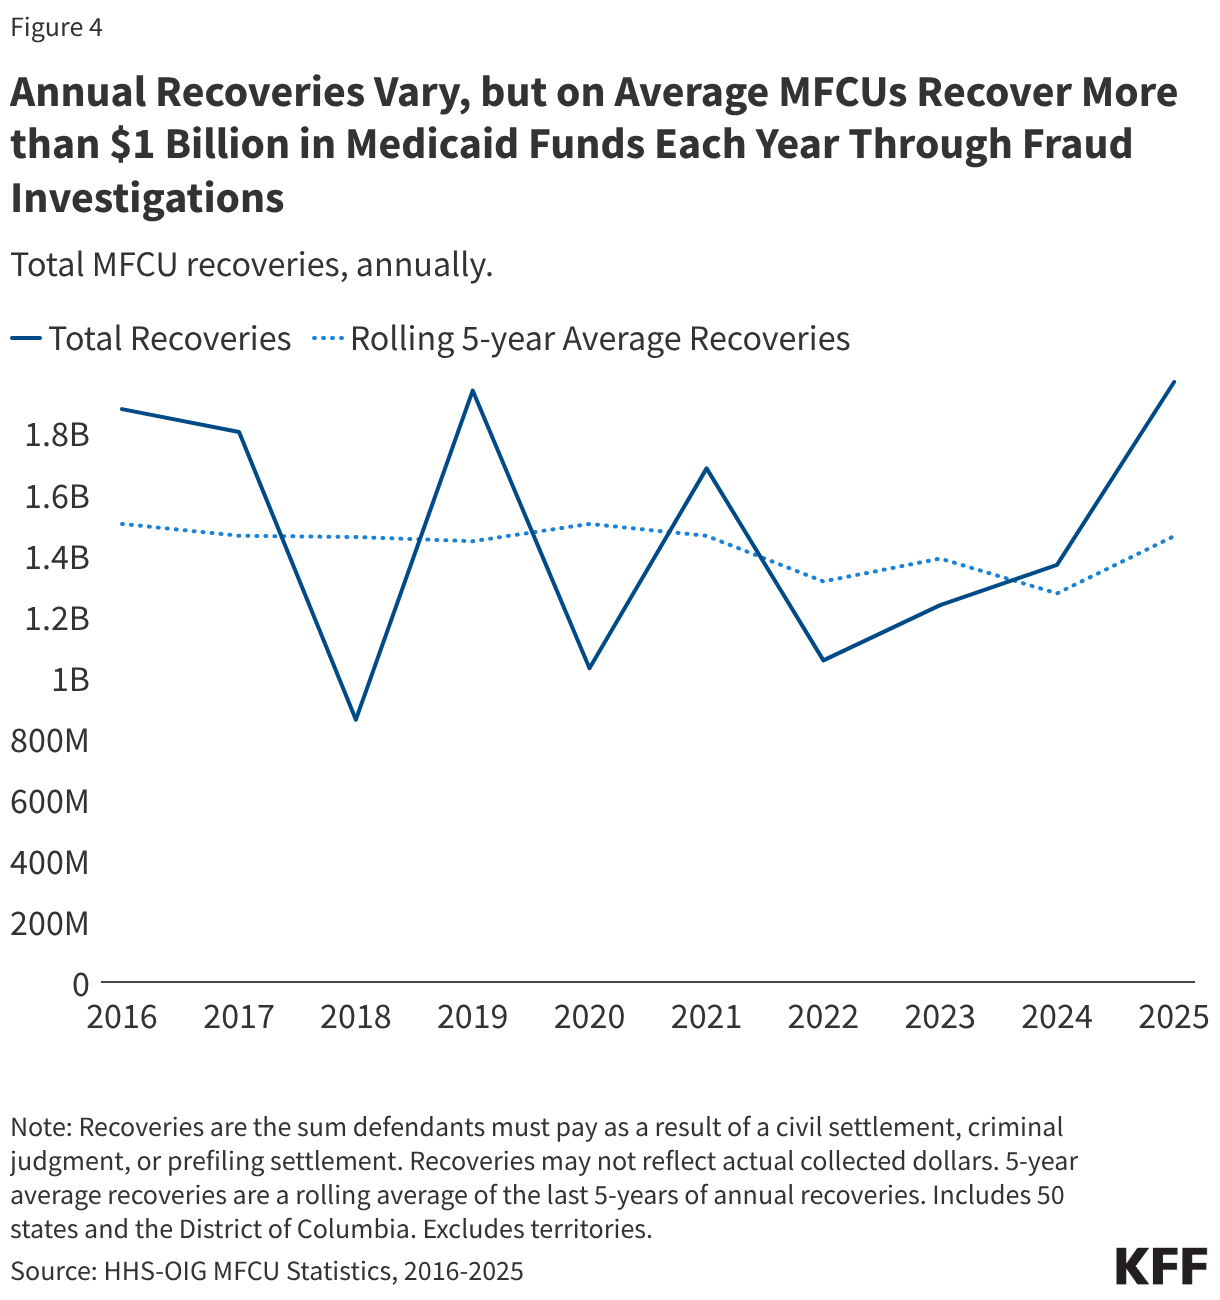
On average, MFCUs recover more than $1 billion each year from fraud investigations. Nationally, MFCUs recovered $1.97 billion in FY 2025. While recoveries include other financial penalties in addition to Medicaid funds recouped from providers due to MFCU investigations (and may not reflect amounts actually collected4), the total amount of recoveries is small compared to total Medicaid spending. Recoveries vary each year and can be skewed by factors, including timing of settlements and large multi-year cases. Recoveries typically vary substantially from year to year and have averaged $1.48 billion per year over the period 2016 to 2025. A 5-year rolling average accounts for periodic variation and shows that recoveries decreased during the COVID-19 Public Health Emergency and are returning to pre-COVID levels. Recoveries, after accounting for year-to-year variation, have remained generally steady over time while total Medicaid spending has increased. Recoveries are not a comprehensive measure of enforcement (because they may not include Medicaid-related enforcement actions that occurred outside of MFCU actions) and do not include the possible financial impacts of other program integrity efforts, such as preventing fraud before it occurs. Of the $1.97 billion in recoveries, two-thirds (64%) were due to criminal convictions and one-third (36%) were due to civil judgments or settlements (data not shown). This is proportionate to the share of criminal and civil case resolutions in FY 2025 (Figure 3).

Annual Recoveries Vary, but on Average MFCUs Recover More than  Billion in Medicaid Funds Each Year Through Fraud Investigations (Line chart)

Comparing data across states or considering recovery dollars in the context of overall Medicaid spending can be challenging. Comparing MFCU data across states or years can be difficult due to differences in state law (that impact the handling of cases) and varying duration, scope, or complexity of cases, among other factors. Comparing MFCU recoveries to overall Medicaid spending can also be challenging to interpret as a hypothetical indicator of MFCU performance because these data only capture a portion of Medicaid program integrity efforts and include amounts other than recouped Medicaid payments. States can also make policy decisions that might impact state spending and MFCU recoveries differently. For example, states that spend more on prevention or early detection may see fewer recoveries (if these activities are successful), while states that invest less in fraud prevention may see higher levels of enforcement action and recoveries. There are no estimates of fraud that may have been successfully prevented or fraud that went undetected/unrecovered; however, over time there has been a shift in focus from efforts to recover misspent funds (“pay and chase”) to prevention and early detection. A higher level of MFCU recoveries could indicate more fraud, more aggressive enforcement, or less effective prevention.

What are current issues involving MFCUs?

MFCUs continue to work with state and federal agencies to stop fraud and abuse but also face increased federal scrutiny. On May 13, 2026, HHS Investigator General Bell sent a letter to every state Attorney General communicating a stance of “insistence on rigid MFCU compliance” with requirements and performance standards that will be enforced through “robust review” by the HHS-OIG. MFCUs are recertified annually on a rolling schedule, based on each specific state or territory’s original certification date.5 As of September 17, 2026, HHS-OIG has followed release of the May 2026 letter by issuing standard recertifications to 3 states and “conditionally recertifying” 11 state MFCUs, a designation which accompanies a set of corrective actions recommended by HHS-OIG. It does not appear that HHS-OIG regularly issued conditional recertifications prior to 2026.

In June 2026, Hawaii’s and New York’s MFCUs were notified that HHS-OIG was denying their annual recertification in letters citing insufficient case outcomes in both states. HHS announced that it was denying Hawaii’s and New York’s annual MFCU recertifications, discontinuing federal funding for the fraud control units. In each state’s recertification denial letter, HHS cites insufficient case outcomes (particularly low production of criminal indictments and convictions) and recoveries that are disproportionately low relative to the staffing and budget of the state MFCU (New York) or relative to the growth in the state’s Medicaid spending (Hawaii). States that have their MFCU recertification denied can appeal the decision and request that HHS-OIG reconsider; Hawaii indicated they intended to seek reconsideration. Hawaii and New York have responded to their denied MFCU certifications by reiterating their states’ commitment to Medicaid program integrity and highlighting ongoing actions to prevent and detect suspected Medicaid fraud. It is unclear if HHS-OIG may deny the recertification of other state MFCUs, but the discontinuation of federal funding could hamper states' ability to continue ongoing operations or initiate new investigations.

  1. MFCUs can also elect to investigate and prosecute patient abuse and neglect in non-institutional settings (e.g., home and community-based settings). ↩︎
  2. While states may have their own laws defining responsibilities around investigating beneficiary fraud or program abuse, MFCUs cannot use federal funding to investigate alleged beneficiary fraud unless it is in relation to suspected provider fraud. ↩︎
  3. Ibid. ↩︎
  4. Recoveries may not reflect the amounts actually collected from defendants (e.g., if the defendant is a company that dissolved before collections could be obtained). MFCUs work with state Medicaid agencies to return the state and federal share of any recovered Medicaid payments. ↩︎
  5. Federal requirements and performance standards serve as the basis for MFCU annual recertification by HHS-OIG. When a MFCU applies for annual recertification, the MFCU submits performance and budget data, including staffing, costs, case numbers and outcomes, and other information requested by HHS-OIG. HHS-OIG may conduct an onsite review of the MFCU. ↩︎

Medicaid/CHIP Monthly Enrollment Tracker

Published: Sep 25, 2026

Note: The data presented below are updated monthly as new Medicaid/CHIP enrollment data become available.

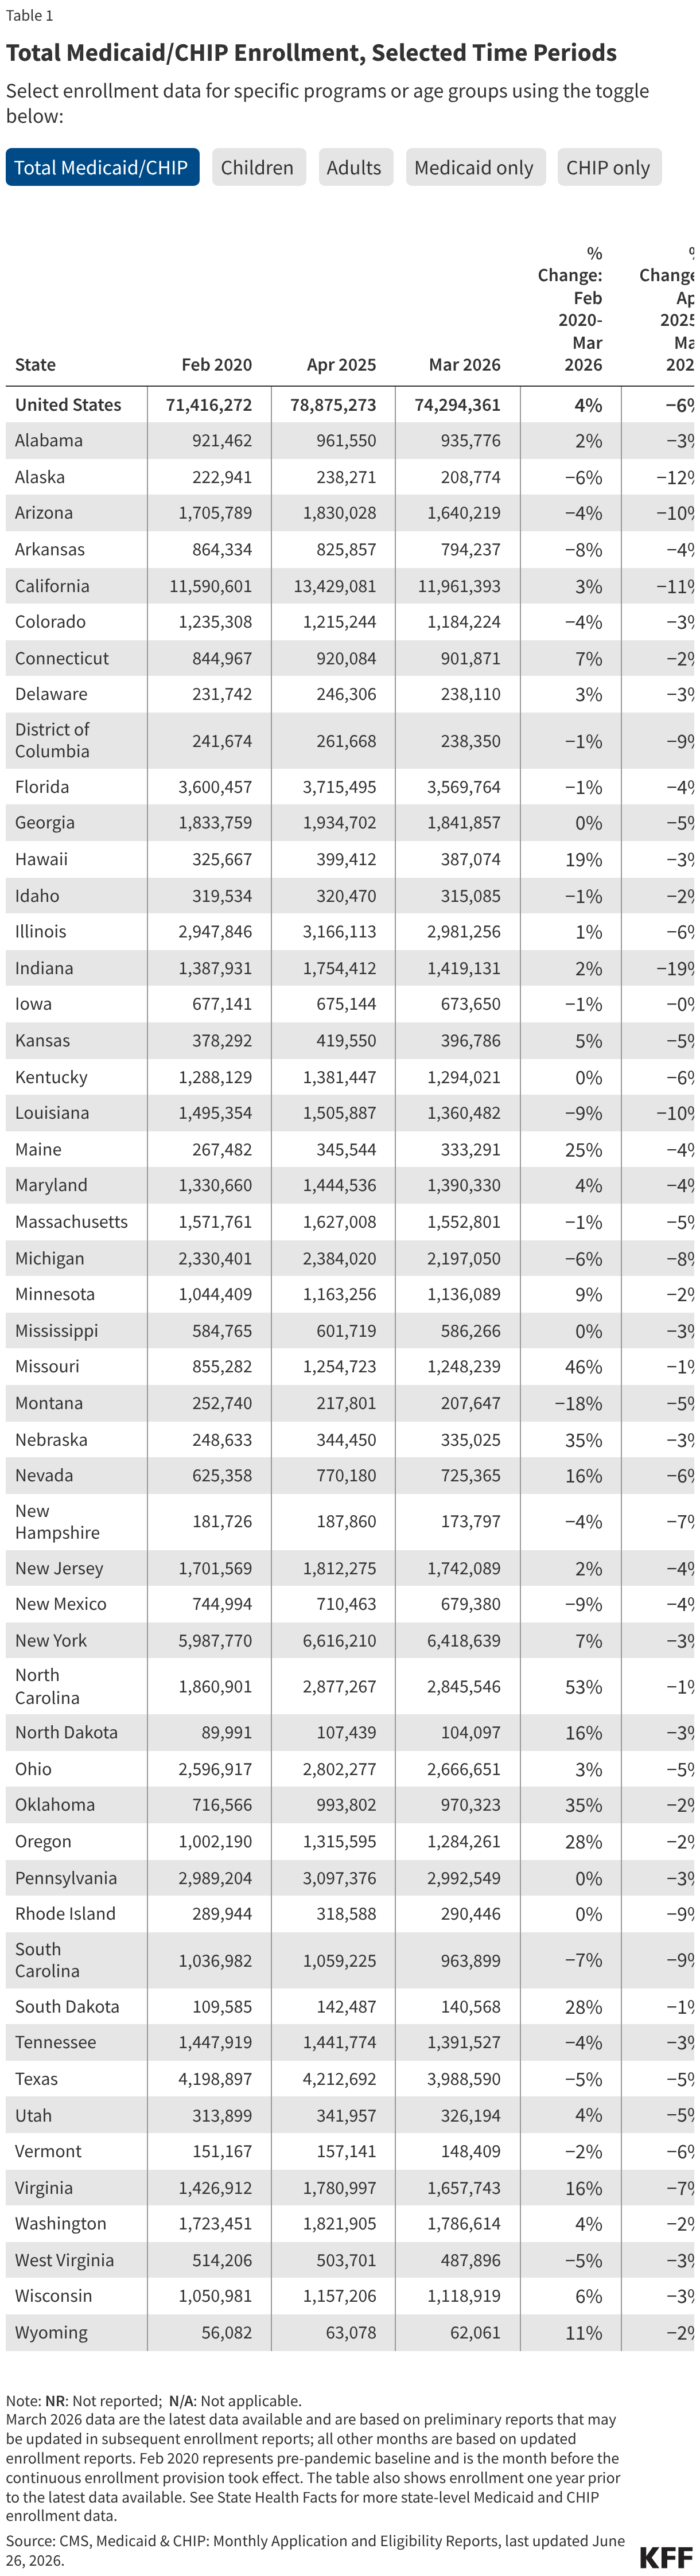
This tracker presents the most recent data on monthly Medicaid and Children’s Health Insurance Program (CHIP) enrollment reported by the Centers for Medicare & Medicaid Services (CMS) as part of the Performance Indicator Project. It includes data for Medicaid and CHIP and reports enrollment data for children and adults. The data are generally the most recent data available and are useful for reporting trends in Medicaid enrollment. However, the data only capture full-benefit enrollees, excluding those who receive limited benefits, such as those who receive family planning services only, and consequently, do not provide a full count of the total population enrolled in Medicaid. Additionally, these data cannot be used to monitor changes in enrollment by eligibility pathway, including for adults in the Medicaid expansion group.

The 2025 reconciliation law included significant changes to Medicaid, including requiring adults in the expansion group and in certain 1115 waiver programs to meet new work and reporting requirements starting January 2027. These changes are expected to reduce Medicaid enrollment over the next 10 years relative to what would have been expected under current law. Enrollment data for the full Medicaid population is available here, and for more information on how implementation of Medicaid work requirements is affecting Medicaid expansion enrollment, please see Tracking Implementation of the 2025 Reconciliation Law Medicaid Work Requirements.

The figures below show Medicaid and CHIP enrollment from February 2020 through the most current month of available data. Figures include enrollment for adults and children in Medicaid/CHIP and for Medicaid only and CHIP only. Key enrollment data and trends as of June 2026 include:

  • There were 73.2 million people enrolled in Medicaid/CHIP nationally (Figure 1). Medicaid enrollment declined by 5.1 million or 6% from June 2025 through June 2026 (Table 1).
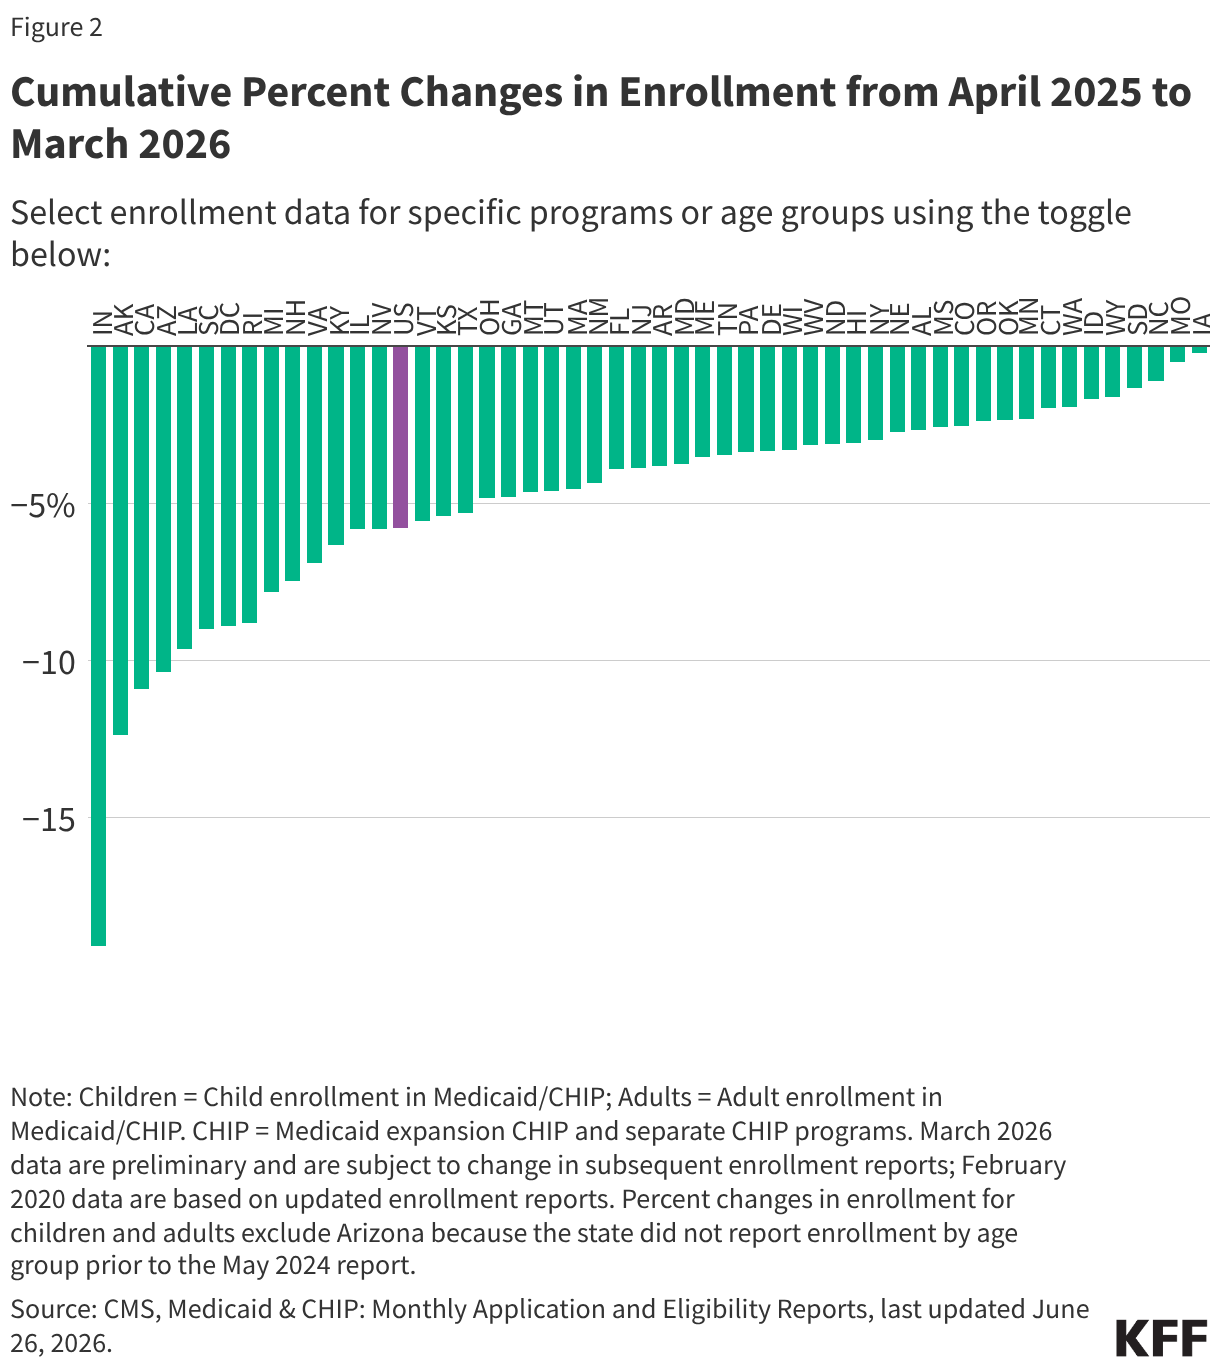
  • Total Medicaid/CHIP enrollment has decreased in 49 states and DC since June 2025. Enrollment changes since June 2025 vary from a less than 1% increase in Iowa to a 19% decrease in Indiana (Figure 2).
  • Child enrollment in Medicaid/CHIP has decreased in 49 states and DC from June 2025 through June 2026. Adult enrollment has decreased in all but five states (IA, MO, NC, OK, SD)(Figure 2).
  • There were 66 million people enrolled in Medicaid and 7.2 million people enrolled in CHIP (Figure 1). Since June 2025, Medicaid enrollment has decreased in 49 states and DC while CHIP enrollment has increased in twenty states (AL, CA, CT, DE, FL, HI, IL, MO, NE, NJ, NM, NC, ND, OK, RI, SC, TN, VT, WA, WY).
  • Total Medicaid/CHIP enrollment was 2% higher in June 2026 compared to enrollment in February 2020, prior to the pandemic. However, in the 49 states and DC with complete enrollment data by age, the number of children enrolled in Medicaid/CHIP declined by 960,000 or 3% from February 2020 to June 2026 (Figure 2 and Table 1).
Figure 1
Annual Percent Change in Medicaid/CHIP Enrollment (June 2025 to June 2026) (Column Chart)
Total Medicaid/CHIP Enrollment, Selected Time Periods (Table)

Note: The data on unwinding renewal outcomes presented below were last updated on September 12, 2024; since most states have now completed the Medicaid unwinding, the information will not be updated again.

As of September 12, 2024 and with nearly complete unwinding data for most states: 

  • Over 25 million people were disenrolled (31% of completed renewals) and over 56 million people had their coverage renewed (69% of completed renewals).  
  • Disenrollment rates varied across states from 57% in Montana to 12% in North Carolina, driven by a variety of factors including differences in renewal policies and procedures as well as eligibility expansions in some states.  
  • Among those who were disenrolled, nearly seven in ten (69%) were disenrolled for paperwork or procedural reasons while three in ten (31%) were determined ineligible.  
  • Among those whose coverage was renewed during the unwinding, 61% were renewed on an ex parte, or automated, basis, meaning the individual did not have to take any action to maintain coverage. 

State Data on Renewal Outcomes

The data on unwinding-related renewal outcomes presented in this section rely primarily on monthly reports that states were required to submit to the Centers for Medicare & Medicaid Services (CMS) during the unwinding period. The data also reflect updates to the monthly reports that states submit three months after the original report submission to account for the resolution of pending cases and any other changes in renewal metrics. For 13 states, data were pulled from dashboards or reports published on state websites that provide more complete information, and for a few additional states, updated monthly reports were pulled from state websites because they were more timely than what is reported on the CMS website. 

To view archived data for specific states, click on the State Data - Archived tab.


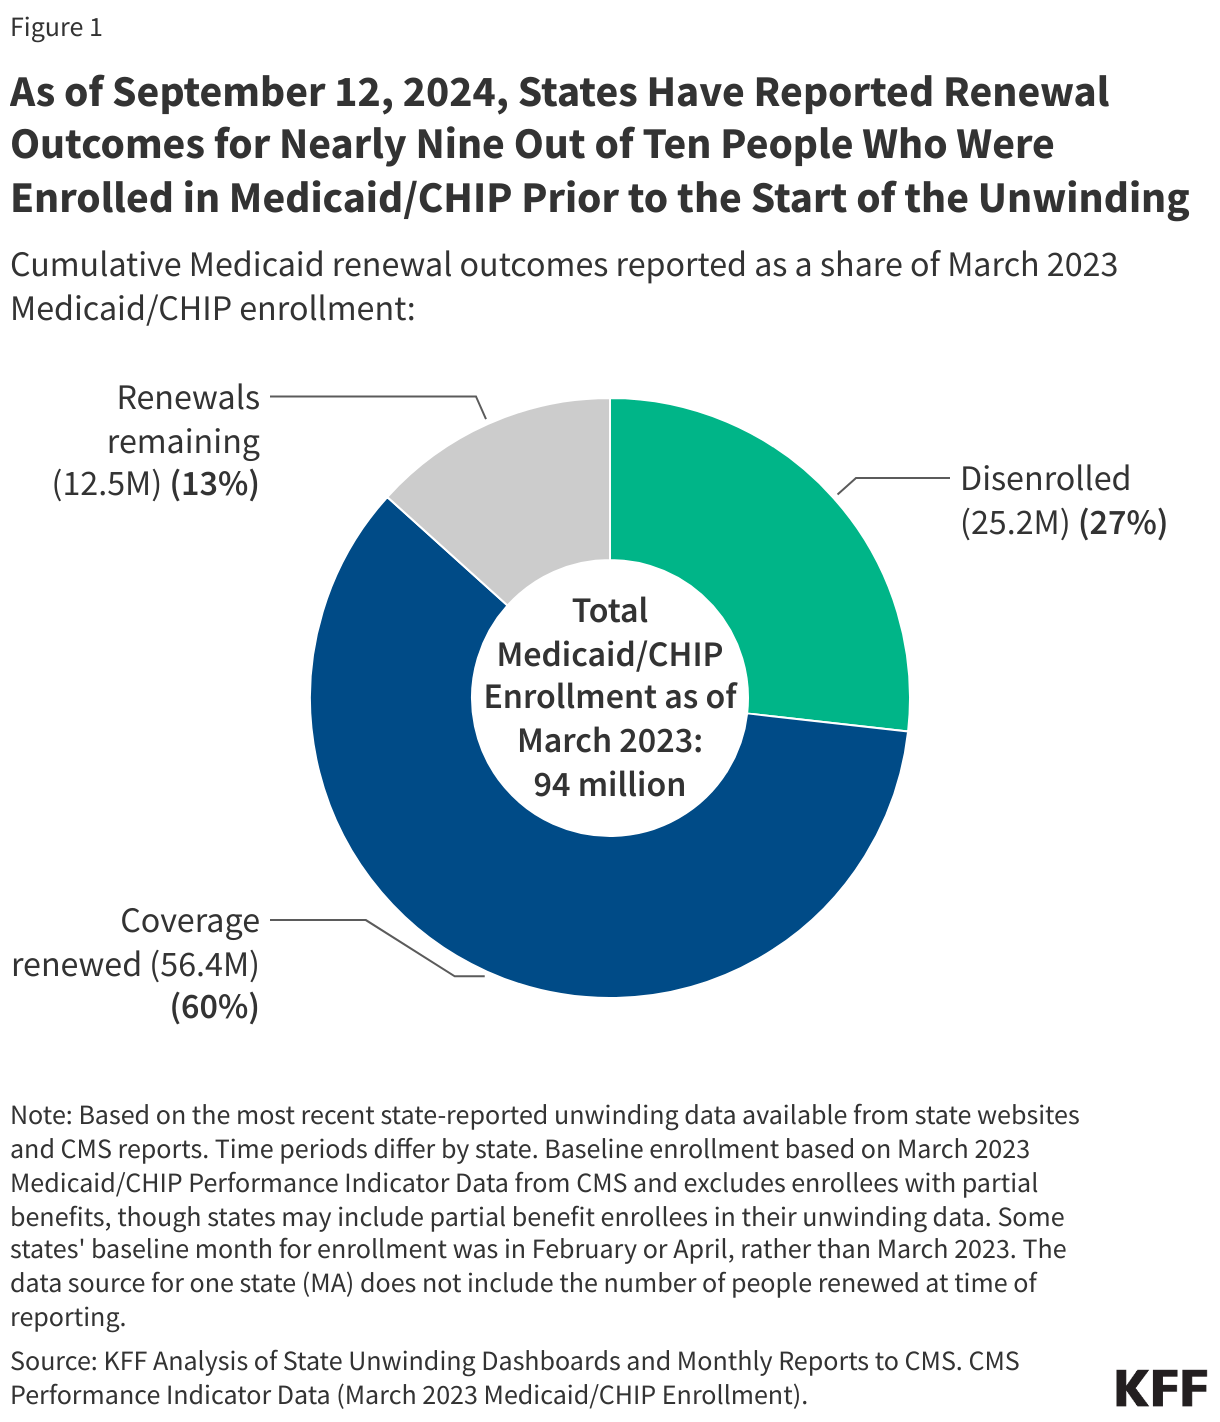
As of September 12, 2024, States Have Reported Renewal Outcomes for Nearly Nine Out of Ten People Who Were Enrolled in Medicaid/CHIP Prior to the Start of the Unwinding (Donut Chart)


Medicaid Disenrollments

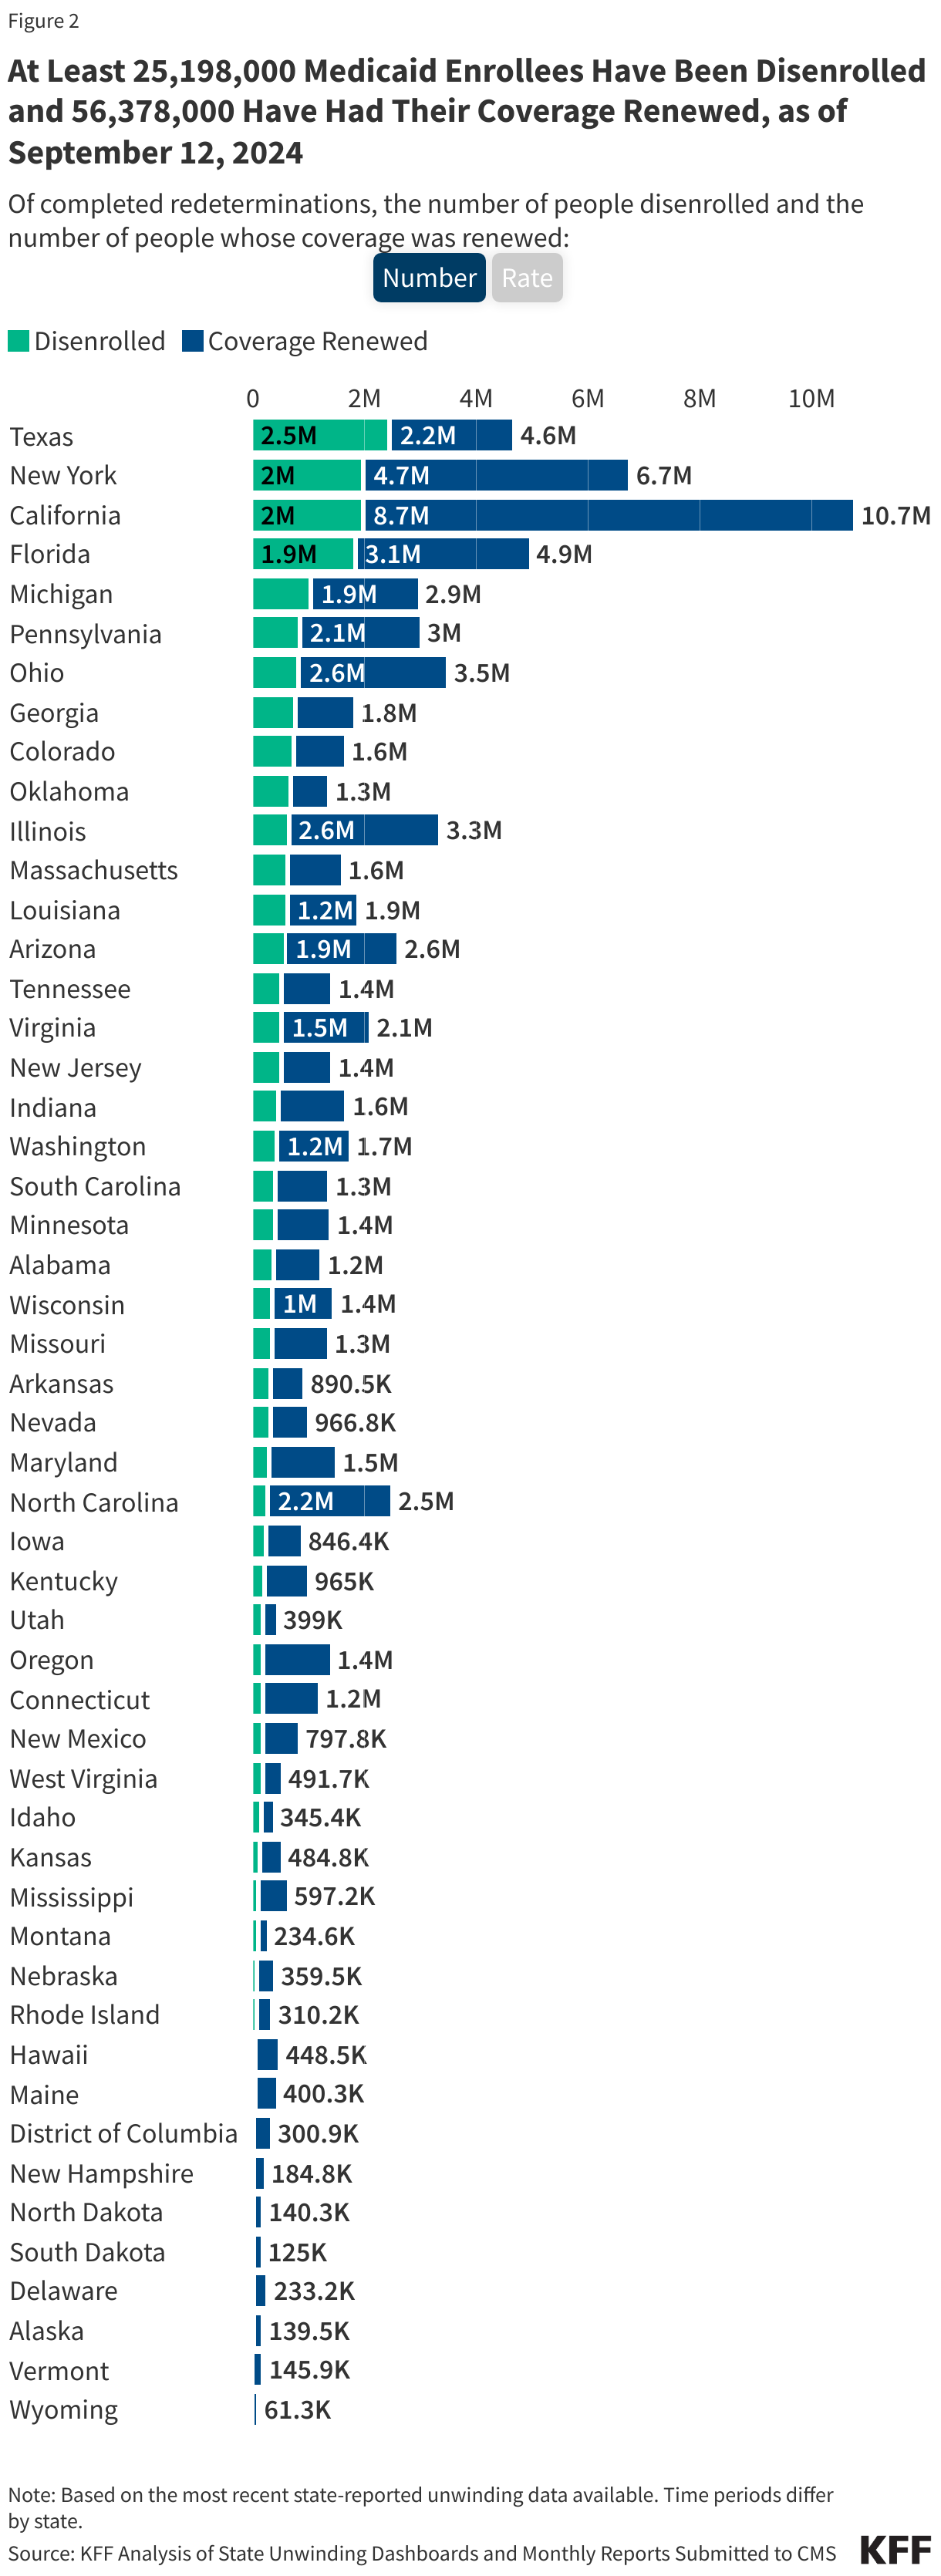
  • As of September 12, 2024, at least 25,198,000 Medicaid enrollees had been disenrolled during the unwinding of the continuous enrollment provision. Overall, 31% of people with a completed renewal were disenrolled in reporting states while 69%, or 56.4 million enrollees, had their coverage renewed.
  • There is wide variation in disenrollment rates across reporting states, ranging from 57% in Montana to 12% in North Carolina. A variety of factors contribute to these differences, including differences in renewal policies and system capacity. Some states adopted policies that promote continued coverage among those who remain eligible and/or have automated eligibility systems that can more easily and accurately process renewals while other states have adopted fewer of these policies and have more manually-driven systems. In addition, North Carolina and South Dakota adopted Medicaid expansion and other states increased eligibility levels for certain populations (e.g., children, parents, etc.) during the unwinding, which may have lowered disenrollment rates in these states.

At Least 25,198,000 Medicaid Enrollees Have Been Disenrolled and 56,378,000 Have Had Their Coverage Renewed, as of September 12, 2024 (Stacked Bars)


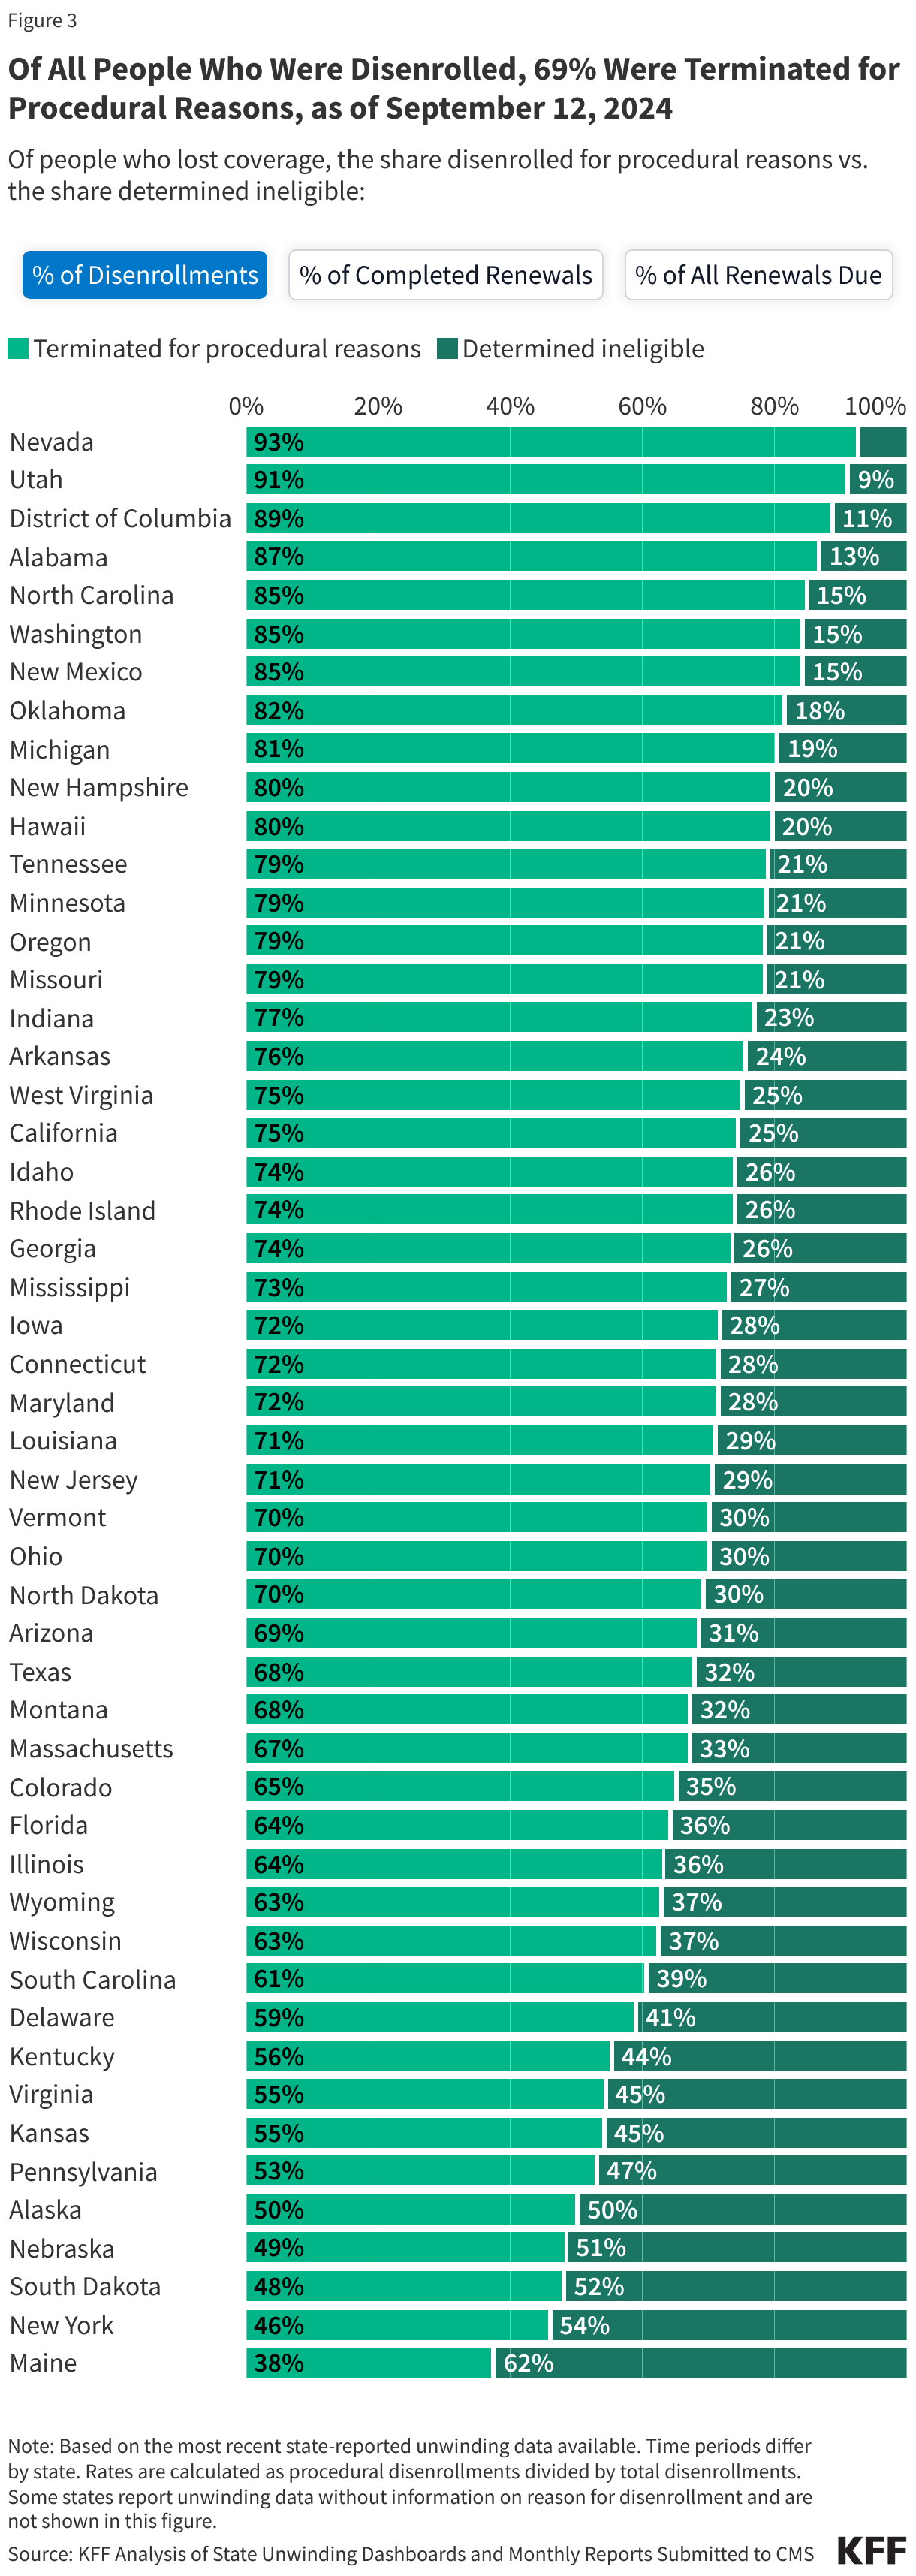
  • Across all states with available data, 69% of all people disenrolled had their coverage terminated for procedural reasons. However, these rates vary based on how they are calculated (see note below). Procedural disenrollments are cases where people are disenrolled because they did not complete the renewal process and can occur when the state has outdated contact information or because the enrollee does not understand or otherwise does not complete renewal packets within a specific timeframe. High procedural disenrollment rates are concerning because many people who are disenrolled for these paperwork reasons may still be eligible for Medicaid coverage. 

(Note: The first tab in the figure below calculates procedural disenrollment rates using total disenrollments as the denominator. The second tab shows these rates using total completed renewals, which include people whose coverage was terminated as well as those whose coverage was renewed, as the denominator. And finally, the third tab calculates the rates as a share of all renewals due, which include completed renewals and pending cases.)

Of All People Who Were Disenrolled, 69% Were Terminated for Procedural Reasons, as of September 12, 2024 (Stacked Bars)

Medicaid Renewals

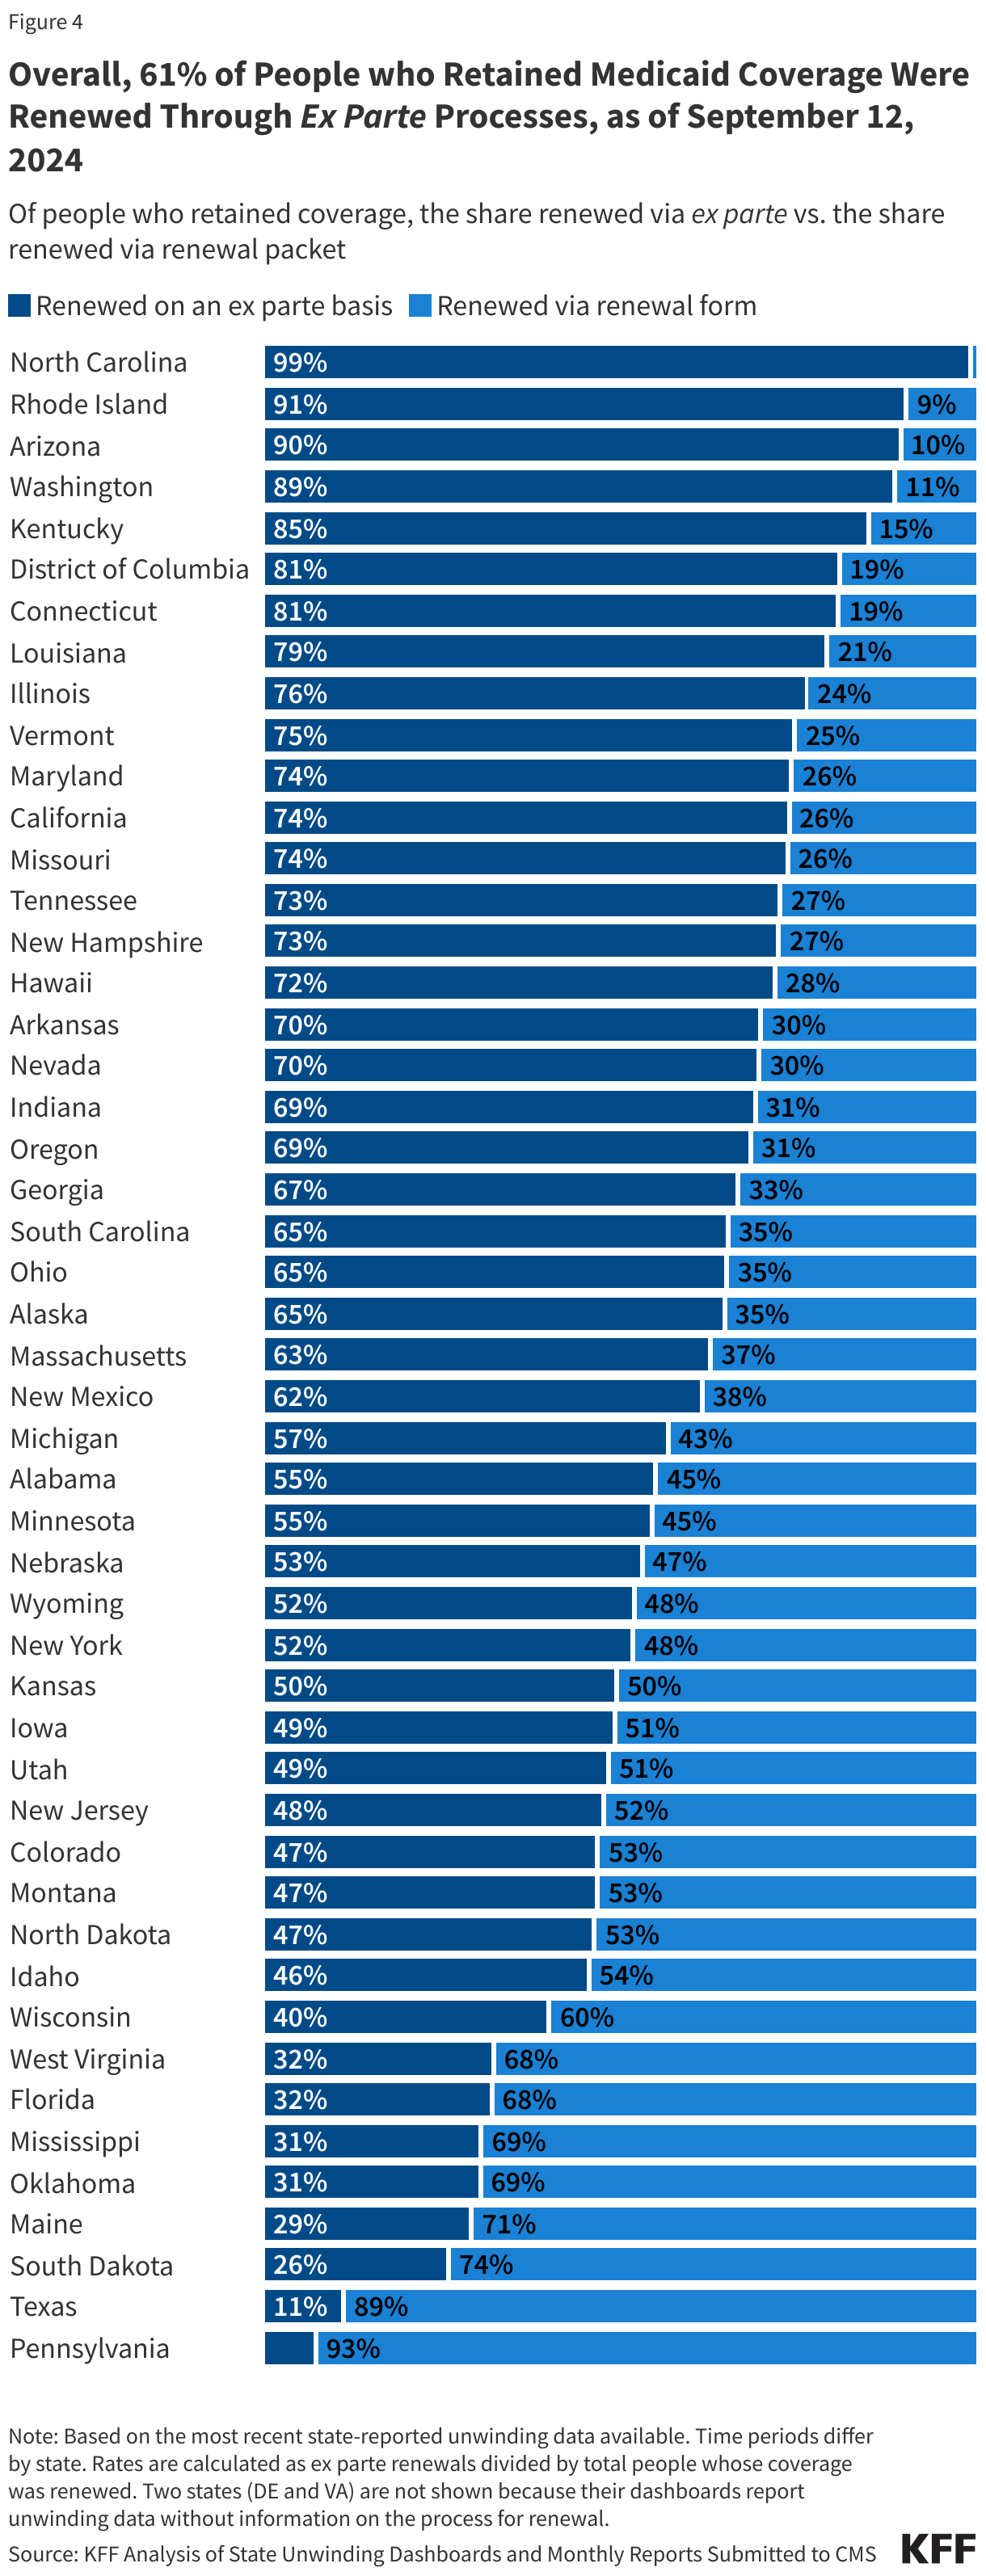
  • Of the people whose coverage has been renewed as of September 12, 2024, 61% were renewed on an ex parte basis while 39% were renewed through a renewal form, though rates vary across states. Under federal rules, states are required to first try to complete administrative (or “ex parte”) renewals by verifying ongoing eligibility through available data sources, such as state wage databases, before sending a renewal form or requesting documentation from an enrollee. Ex parte renewal rates varied across states from 90% or more in Arizona, North Carolina, and Rhode Island to less than 20% in Pennsylvania and Texas. 

Overall, 61% of People who Retained Medicaid Coverage Were Renewed Through Ex Parte Processes, as of September 12, 2024 (Stacked Bars)

Federal Data on Renewal Outcomes

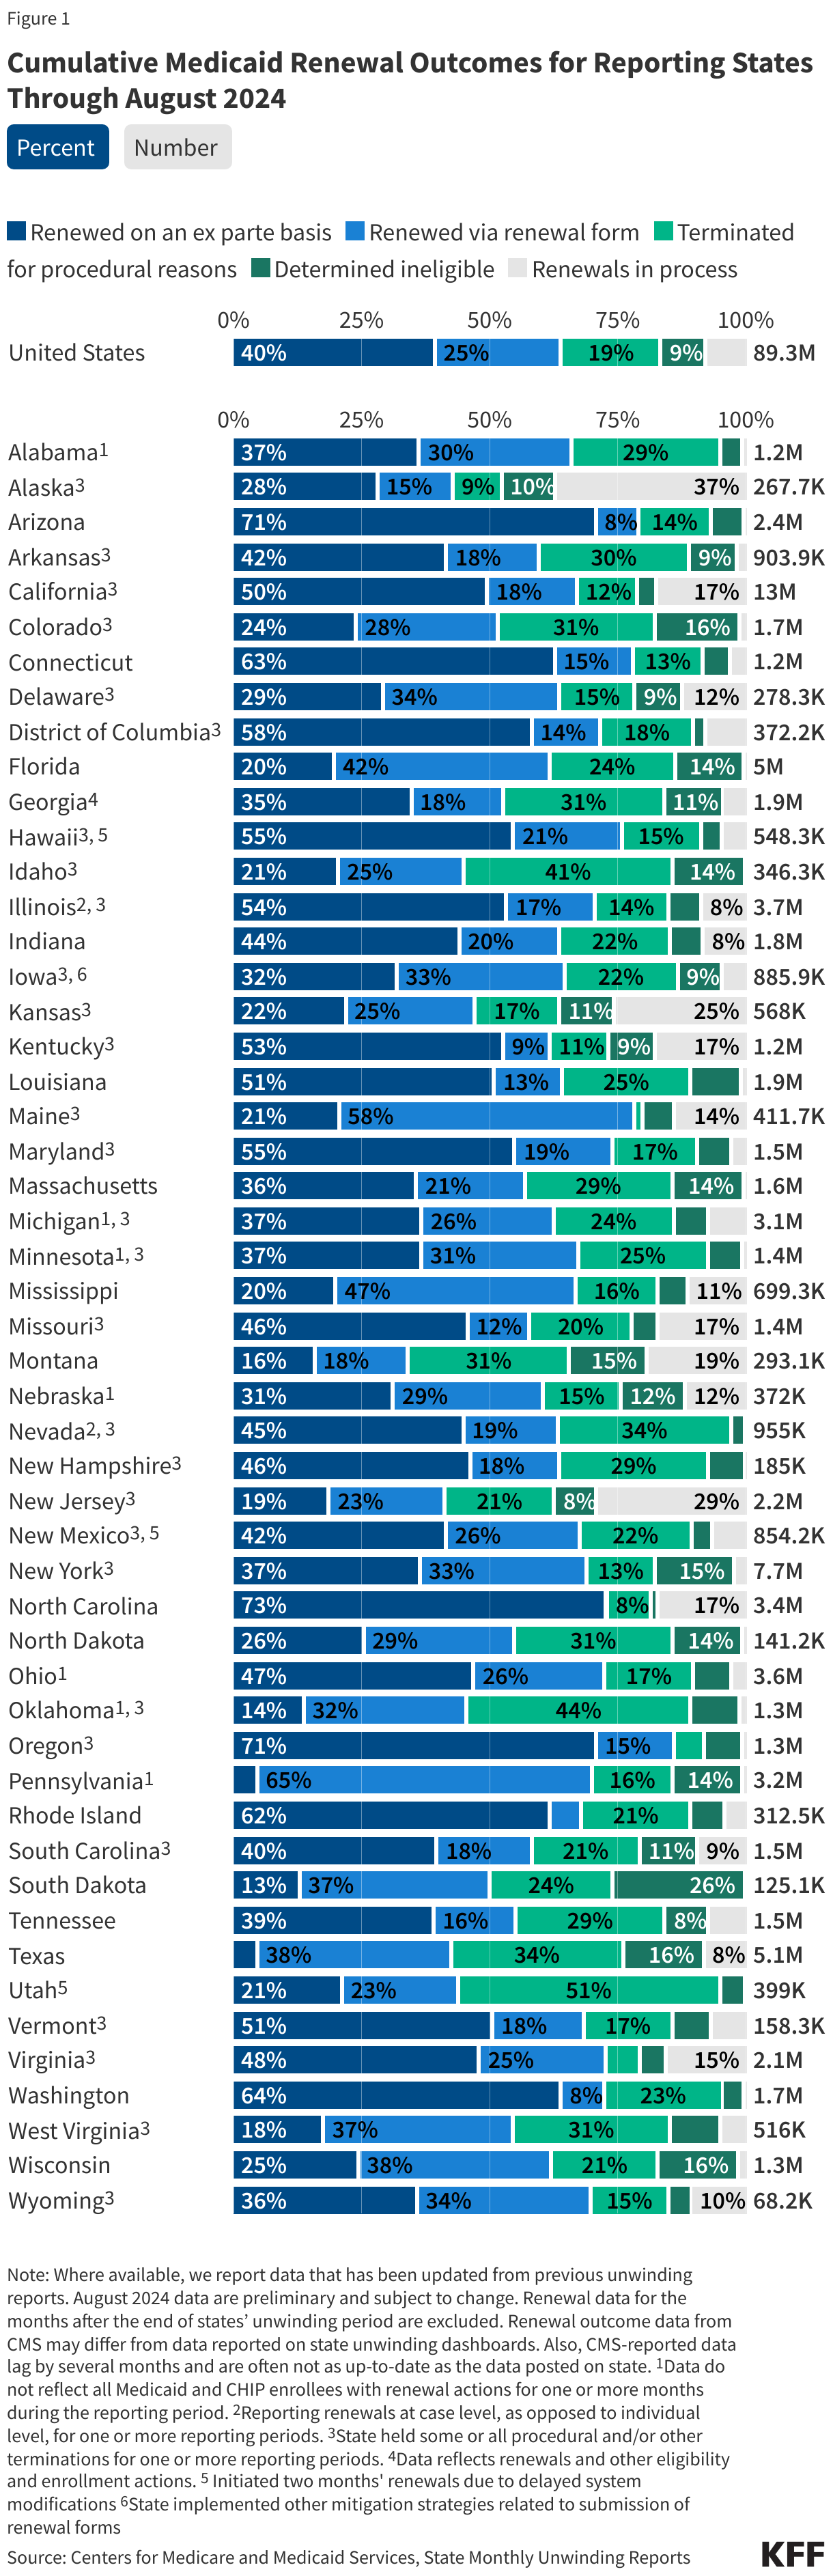
The data presented here are cumulative unwinding metrics published by CMS. These counts and percentages may differ from the above data, which present renewal metrics reported on state websites when state-reported data are more complete.  

Figure 1 below shows cumulative renewal data reported by CMS during states’ unwinding periods. Renewal data for the months after the end of states’ unwinding period are excluded. The data reflect updated unwinding data reported by states three months after the original monthly reports as they become available.   

Cumulative Medicaid Renewal Outcomes for Reporting States Through August 2024 (Stacked Bars)

For questions about this tracker, please contact KFFTracker@kff.org

State Unwinding Data - Archived

Note: The state data presented below were last updated on September 12, 2024; since most states have now completed the Medicaid unwinding, the information will not be updated again. 

The data presented here provide state-level data on enrollment trends and renewal outcomes during the unwinding period. Figure 1 shows total Medicaid enrollment by month starting in January 2023 and, once disenrollments resumed in a state, the cumulative percent change in Medicaid enrollment relative to the month before Medicaid disenrollments started (this baseline month will differ across states). Figure 2 shows renewal metrics for each month of a state’s unwinding period (or cumulative data for the unwinding period for some states). 

For total national Medicaid enrollment, click on the Enrollment Data tab.

Related Resources - Archived

Resources on unwinding data

Resources on state policies and preparations for the unwinding

Resources on pre-pandemic enrollment patterns and coverage transitions

KFF’s unwinding explainer

Proposed Changes to Demographic Data Collection in the Census Could Impact Efforts to Address Health and Health Care Disparities 

Published: Sep 25, 2026

Introduction

On September 10, 2026, the Census Bureau published a proposed rule adding two new parts to the regulations that govern the decennial census of population and housing. The proposed changes would prohibit the inclusion of questions on race and ethnicity (in addition to sexual orientation) and would narrow the definition of “usual residence” to exclude millions of noncitizen immigrants, including undocumented immigrants as well as lawfully present immigrants without lawful permanent resident status (i.e., LPR status or a green card) from the census’ apportionment count. This count is the official measurement used to proportionately divide the 435 seats in the U.S. House of Representatives across all 50 states. Further, under the proposed rule, the Census Bureau would consider tax records to determine “usual residence,” which could result in the exclusion of people who don’t file taxes from the census count. As outlined in the U.S. Constitution, the purpose of the decennial census is to count every person living in the U.S., with that information being used to determine “the number of seats each state has in the U.S. House of Representatives” as well as to distribute federal funds.

Since its inception in 1790, the census has always collected data on race and ethnicity and counted all persons living in the U.S., regardless of citizenship or immigration status. While President Trump attempted to exclude undocumented immigrants from the 2020 decennial census during his first term via executive action, legal challenges prevented the policy from being implemented. If finalized and implemented, the changes in the September 2026 proposed rule would mark the first time that race and ethnicity data are not collected in the decennial census and would also be the first time that millions of noncitizen immigrants, including those who are lawfully present but who lack LPR status, are excluded from U.S. population counts.

Public comments on the proposed rule are due by October 13, 2026, after which the Census Bureau is required to review and respond to comments before publishing a final rule. If finalized, the rule is likely to face legal challenges. A change in presidential administration prior to the 2030 decennial census could also impact implementation.

This issue brief provides an overview of the decennial census and discusses potential implications of the changes outlined in the proposed rule. Key takeaways include:

  • If finalized, the proposed changes to census data collection would signal the first time since its inception in 1790 that the U.S. decennial census does not collect data on race and/or ethnicity and excludes millions of noncitizen immigrants from apportionment counts.
  • The exclusion of millions of noncitizen immigrants from apportionment counts could lead to decreased federal funding and resources for states and localities with higher shares of immigrants. This includes funding for health programs such as Medicaid and the Children’s Health Insurance Program (CHIP).
  • Lack of race and ethnicity data could negatively impact research on health and health care disparities as well as data quality and representation since the decennial census is the only source of complete, block-level data on race and ethnicity as well as other key sociodemographic characteristics. Further, the exclusion of many noncitizens will also mean that the census will not accurately reflect who is residing in the U.S.
  • The proposed changes could impact the redistricting process and lead to shifts in political representation, including potentially reallocating congressional seats in ways that would reduce political representation for states with large immigrant populations.

The Decennial U.S. Census

The decennial census is constitutionally mandated to obtain a count of every person living in the U.S. to determine political representation and the allocation of federal funds. Beginning in 1790, the U.S. Census Bureau has conducted a census once every decade on April 1 in years ending in zero “to determine the number of people living in the United States.” The data collected by the decennial census are used to proportionately divide the 435 seats in the U.S. House of Representatives across all 50 states as well as to determine the allocation of hundreds of billions of dollars in federal funding annually.

The decennial census is the only source of complete, block-level (smallest geographic unit defined by the Census Bureau) data on race and ethnicity as well as other demographic characteristics. Researchers and organizations rely on census data to understand population distribution by key demographic characteristics, for drawing nationally representative survey samples and weighting surveys, and to do in-depth research in areas like the U.S. workforce, the economy, and housing stock, among others. The race and ethnicity data collected by the census are also used to evaluate the effectiveness of government programs and policies as well as to measure and ensure fairness, equity, and compliance with anti-discrimination laws and policies.

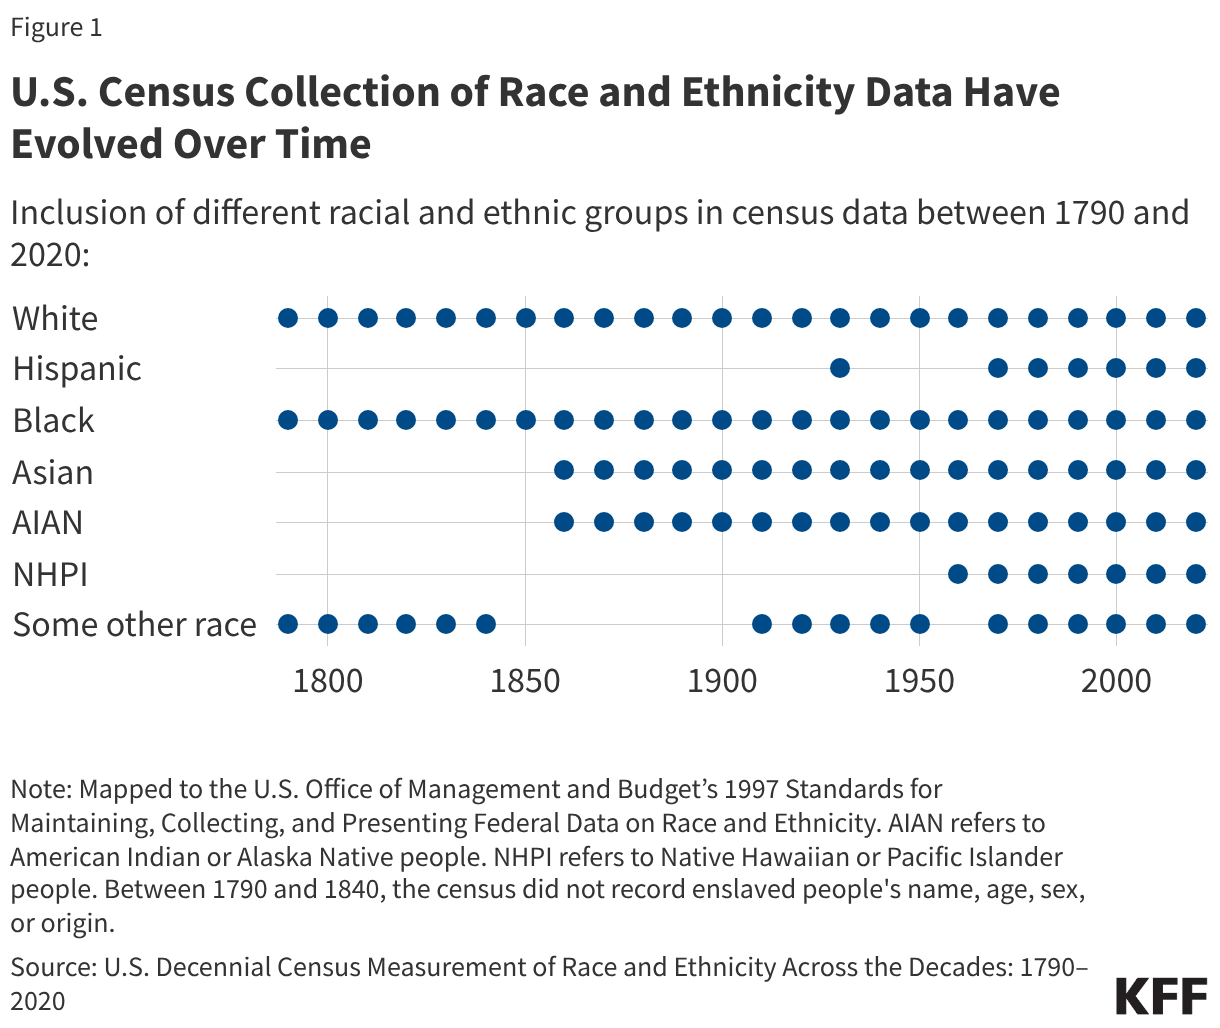
Since its inception in 1790, the U.S. census has collected information on race and ethnicity that has informed policy, the allocation of resources, and research on different groups within the country. How the census has collected and categorized information on race and ethnicity and the racial and ethnic groups for which data have been collected have evolved significantly over time, reflecting social and political shifts and the growing diversity of the U.S. population (Figure 1). In 1977, the Office of Management and Budget (OMB) established federal standards for collecting and reporting race and ethnicity data. The OMB standards guide not only the census but also other federal surveys, ensuring consistency across government data collection efforts. In March 2024, the OMB revised the racial and ethnic data collection and reporting standards to add Middle Eastern or North African as a category, clarify instructions for individuals to select multiple racial and ethnic categories, and require collection of more detailed data. The OMB indicated that these revisions were intended to result in more accurate and useful race and ethnicity data across the federal government. However, the Trump administration has extended the deadline for implementation of these changes twice and canceled plans to use the new standards in the 2027 American Community Survey.

U.S. Census Collection of Race and Ethnicity Data Have Evolved Over Time (Dot Plot)

Since its inception in 1790, the decennial census has included all people residing in the U.S. regardless of citizenship or immigration status, consistent with the Constitution's directive to enumerate "persons" rather than citizens. Article I, Section 2 of the U.S. Constitution requires an "actual Enumeration" of the population every ten years for purposes of proportionately dividing, or apportioning, seats in the U.S. House of Representatives, and Section 2 of the Fourteenth Amendment, which eliminated the Three-Fifths Compromise, specifies that representatives be apportioned "according to their respective numbers, counting the whole number of persons in each State…". Consistent with this description, the Census Bureau's longstanding practice has been to count every single “person,” regardless of citizenship or immigration status, who usually lives and sleeps in the U.S. in the decennial census. It has never excluded noncitizens from the apportionment base. During his first term, President Trump sought to exclude undocumented immigrants from the 2020 apportionment count through executive action, but legal challenges prevented the policy from taking effect.

Implications of Proposed Changes

The exclusion of millions of noncitizen immigrants from apportionment counts could lead to decreased federal funding and resources for states and localities with higher shares of immigrants. The proposed rule's exclusion of immigrants without LPR status from the U.S. resident population (in addition to the apportionment base) by redefining the term “usual residence” will impact the allocation of federal funds and resources across areas. The change will lead to areas with higher shares of noncitizen immigrants receiving less funding since the census will show them having fewer residents and the income and demographic profile of state residents may change without those noncitizens being counted. Prior research has found that, beyond total population counts, each state’s poverty rate and share of people living in rural areas are key factors that drive allocation of federal funds since they often are directed to low-income households and rural areas. According to analysis by the Project on Government Oversight, over 370 public programs relied on census data to allocate at least some portion of over $2.2 trillion in federal funds to states, counties, local communities, organizations, and households in fiscal year 2023. The largest share of this funding is for health programs, including Medicaid and CHIP. For example, the federal government’s share of most Medicaid and CHIP expenditures (or Federal Medical Assistance Percentage (FMAP)) is based on a state’s per capita income derived from decennial census data. Excluding many noncitizens--who are disproportionately likely to have lower incomes--from the resident count could result in a reduction in the FMAP for states with large immigrant populations, such as Florida and Texas. Other states that also have large immigrant populations, like California, would likely be affected less since their FMAP is already at the lowest level of 50%. The change could also affect the location of federally funded resources. For example, the Health Center Program uses census-derived data to determine medically underserved areas, which helps determine the location of Federally Qualified Health Centers (FQHCs). Decennial census data also indirectly shape where hospitals are located. For example, 36 states, including D.C., have certificate of need (CON) laws that help determine whether a new hospital or additional beds may be built using "bed need" methodologies that are benchmarked to census data.

Lack of race and ethnicity data and the exclusion of many noncitizen immigrants could negatively impact research on health and health care disparities as well as data quality and representation. Elimination of racial and ethnic data collection from the decennial census will have important implications for the measurement of disparities since the decennial census is the only source of complete, block-level data on race and ethnicity as well as other key sociodemographic characteristics. The exclusion of many noncitizens will also mean that the census will not accurately reflect who is residing in the U.S. Changes to the data beginning with the 2030 decennial census will eliminate a key source of data researchers use to understand population demographics and to ensure surveys are nationally representative and also limit the ability to examine trends over time, since the data will not be comparable to earlier versions. In the proposed rule, the Census Bureau indicates that they are not proposing restrictions on asking demographic questions on the American Community Survey or other surveys that are not used for enumeration of the population. While the administration is not currently proposing changes to such surveys, if similar changes are made to these surveys in the future, that would further limit the ability to understand the demographics of the U.S. population and the ability to measure and address health and health care disparities.

The proposed changes to stop collecting data on race and ethnicity are also likely to affect the redistricting process and lead to shifts in political representation. Decennial race and ethnicity data obtained from the census underpin the redistricting process and consequently, the voting power of communities of color. Under public law 94-171, enacted in 1975, the Census Bureau is required to provide states with block-level demographic data from the decennial census to redraw congressional and state legislative districts based on updated population counts. Section 2 of the Voting Rights Act (VRA) of 1965 prohibits voting practices that discriminate on the basis of race, among other factors. Block-level data on race and ethnicity cross-tabulated by voting age have long been used to establish the threshold required to bring a vote dilution claim under the law. In April 2026, the Supreme Court's decision in Louisiana v. Callais narrowed Section 2, holding that plaintiffs must show a strong inference that a state intentionally drew districts to afford minority voters less opportunity because of race as well as offer alternative maps meeting the state's legitimate goals. Eliminating block-level racial and ethnic data would compound these heightened evidentiary requirements by removing the underlying data to identify vote dilution, draw districts that provide communities of color an opportunity to elect candidates of their choice, and litigate VRA claims in the future.

The exclusion of millions of noncitizen immigrants from the decennial census could lead to the reallocation of congressional seats in ways that would reduce political representation for states with large immigrant populations. According to Pew Research Center, as of 2023, there were roughly 14 million undocumented immigrants and over 2 million lawfully present immigrants without LPR status in the U.S. Although these numbers have likely fallen since 2023, omitting these people from the count could impact representation for states with large numbers of immigrants. For example, a Pew Research Center analysis of President Trump’s earlier proposal to exclude undocumented immigrants from the 2020 decennial census found that, at that time, California, Florida, and Texas would each lose one congressional seat due to the change in population counts, while three other states would gain seats (Alabama, Minnesota, and Ohio).

Paid Family and Sick Leave in the U.S.

Published: Sep 25, 2026

Paid family and medical leave and sick leave can help workers meet their personal and family health care needs, while also fulfilling work responsibilities. Access to paid leave is a particularly salient concern for women, who comprise nearly half of the nation’s workforce and often take on the bulk of caregiving responsibilities. The federal Family and Medical Leave Act (FMLA) requires eligible employers to provide certain workers unpaid family leave; however, unlike nearly all other industrialized nations, the U.S. does not have a national requirement for paid family or sick leave, resulting in a patchwork of policies determined by state and local laws, employers, and/or labor contracts. While many have been advocating a national standard for paid leave for decades, there has been relatively little federal action.       

Though many states and localities have passed laws to expand access to paid leave within their jurisdictions, many workers still do not have access to these benefits. Employees not covered by these state and local laws must rely on voluntary employer policies, which can vary considerably in scope and compensation. This fact sheet summarizes federal, state, and local policies on paid family and medical leave and paid sick leave.

Paid Sick Leave: Paid sick leave can be used to recover from a short-term injury or illness such as a cold or for doctor’s appointments. It is often provided on an accrual basis up to a set number of hours or days per year, such as one hour of leave earned for every 30 hours worked up to seven days per year, and replaces 100% of the worker’s regular wages. On average, private sector workers are offered seven days of paid sick leave per year. Paid sick leave benefits are paid by the employer.

Paid Family and Medical Leave: Paid family and medical leave typically provides a set number of weeks or months to be used for a worker’s own serious, longer-term health condition, to care for a family member with a serious health condition, or to care for or bond with a new child, and for reasons related to a family’s member’s military service. On average, it provides six to twelve weeks of fully or partially paid leave per year, without the need for accrual. Paid family and medical leave may be insured and is often funded by contributions from the employer and/or the worker. 

Federal, State, and Local Policies on Sick, Family, and Medical Leave

Sick Leave

Paid sick leave allows workers to take short durations of time off if they are sick or need to care for a family member who is sick without losing pay. There is no federal requirement that employers offer paid leave benefits, but many states have requirements, and some employers do so voluntarily. According to the Bureau of Labor Statistics (BLS), eight in ten workers (82%) had access to paid sick leave through their employer in 2025. 

Proponents of a national paid sick leave mandate stress that workers should not be forced to choose between going to work while sick and losing pay or their job, pointing to numerous studies on the benefits of paid sick leave, such as preventing the spread of illnesses, increased use of preventive health care services, reduced on-the-job injuries, and fewer inappropriate emergency room visits. Opponents of a national paid sick leave mandate generally contend that it is not necessary because many employers already provide these benefits, or that it should be a voluntary benefit. They cite concerns about the financial implications for employers who would be required to provide this benefit, particularly for smaller businesses, and potential reductions in wages designed to offset those costs. 

At the federal level, the Healthy Families Act has been reintroduced annually and would require employers nationwide with 15 or more employees to provide at least 7 days annually, based on a 40-hour work week if it were to pass. Employees would be able to use sick leave for their own illness, to care for a sick family member, obtain medical care, or address needs resulting from domestic violence, sexual assault, or stalking, known as “safe time,” “safe days,” or “safe leave.” Federal government employees have generally had access to paid sick leave through employee benefits packages. 

There has been more traction on paid sick leave policies at the state and local level. Since the first law was passed by voter initiative in 2006 in San Francisco, 18 states plus D.C., and 18 other localities have passed laws requiring covered employers to provide eligible employees paid sick leave (Figure 1). Most of these policies permit the use of accrued sick leave for “safe time.” Three additional states and three localities have general paid time off laws that allow employees to use accrued leave for any reason, including illness. Ten states and 12 localities permit use of accrued paid sick leave for workplace closure or closure of the worker’s child’s school or childcare associated with a public health emergency.

Figure 1

The scope and generosity of paid sick leave laws vary. Most state and local laws have exemptions based on the size and type of employer and/or permit employers to impose certain worker eligibility requirements. Most laws also permit employers to impose a waiting period before new employees can use accrued leave, most often 90 days from the start of employment. Laws generally provide for accrual of 30-40 hours per year, though there is wide variation by policy, with lower accrual rates for smaller employers in many cases.

Family and Medical Leave 

FMLA and Unpaid Family and Medical Leave

It has been more than 30 years since the federal government passed the Family and Medical Leave Act (FMLA), giving eligible employees up to 12 weeks of unpaid, job-protected leave per year for their own serious health condition, to care for a seriously ill family member, for the arrival of a new child, and to address needs related to a family member’s military deployment. Eligible employees also receive up to 26 weeks of unpaid, job-protected leave per year to care for a seriously ill or injured family servicemember or veteran. The law applies to public agencies and local educational agencies of all sizes, as well as private employers with 50 or more employees. The FMLA has provided job security to millions of workers who need to take time off work for a qualifying reason; however, just over half (56%) of the workforce is eligible for FMLA protections because small employers are exempt, and even in covered worksites, not all employees meet FMLA eligibility requirements. Most states have opted to expand job-protected leave benefits beyond FMLA’s minimum standards by expanding eligibility, the duration of leave, the definition of family members, or qualified reasons for taking leave in the private and/or public sector in the private and/or public sector. 

Paid Family and Medical Leave

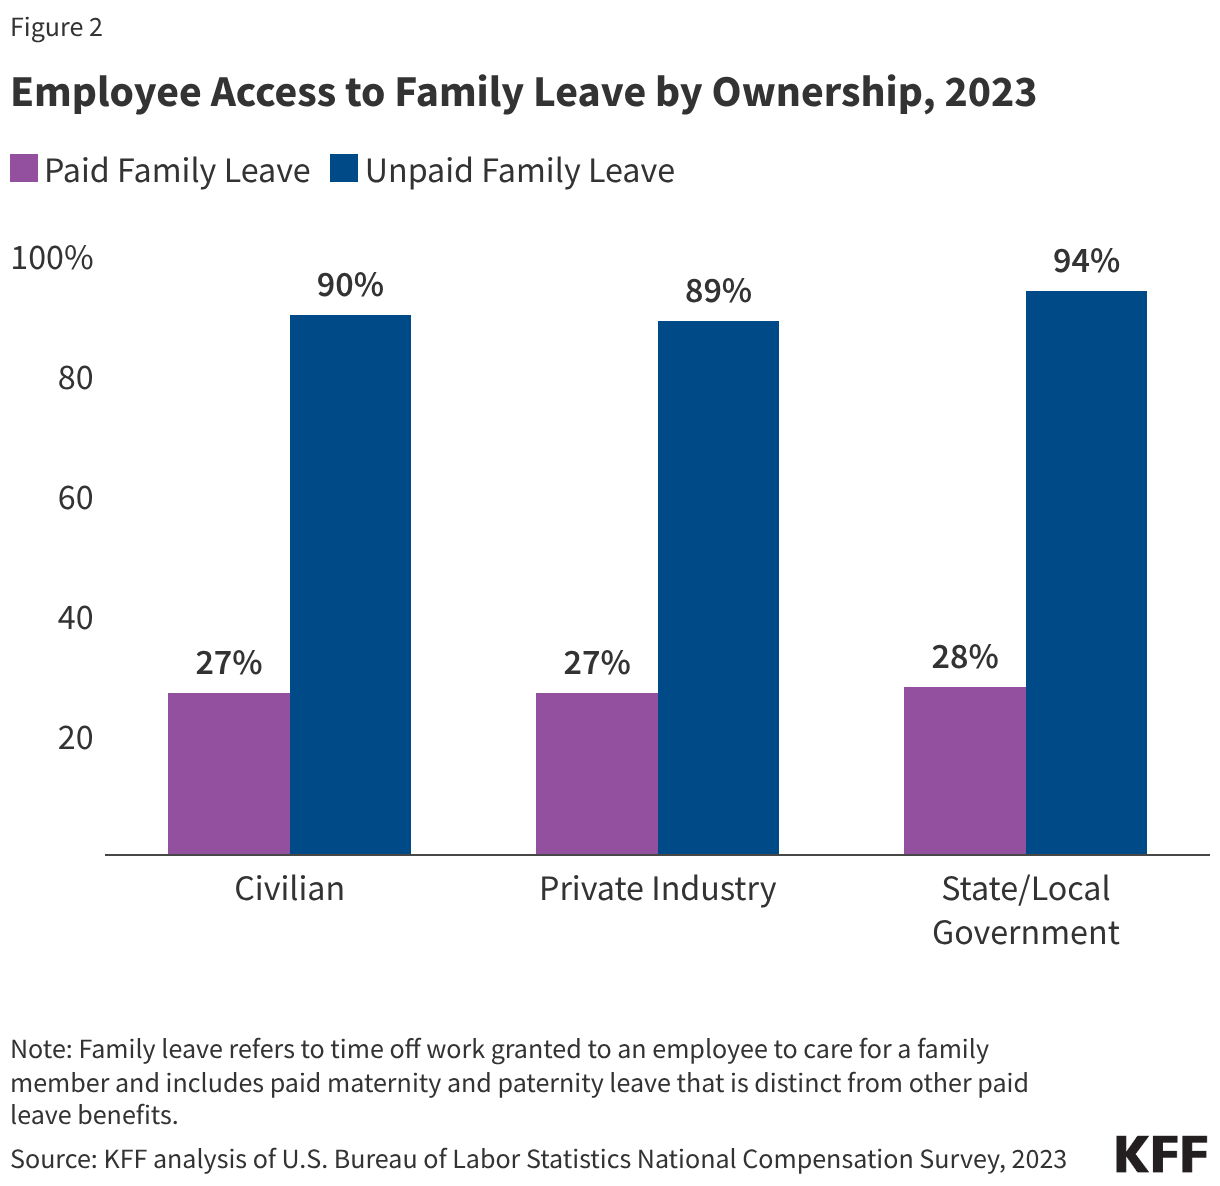
BLS data found that just over one in four (27%) workers had access to paid family leave in 2023, the most recent year for which there is data (Figure 2). Data on the share of workers with explicit access to paid medical leave for a longer, serious illness are limited, but BLS also estimates that 42% of workers had access to short-term disability insurance in 2025, which can be used to take paid time off for parental leave or medical leave.​ 

Bar chart showing the share of workers who had access to paid family leave compared to the share of workers who had access to unpaid family leave in 2023. It shows that while most workers have access to unpaid family leave, less than three in ten have access to paid family leave. This is the case among civilian-owned, privately-owned, and state/local government-owned establishments.

Proponents of a national paid family and medical leave program urge that it would provide employees with greater financial security when they must take extended leave for medical reasons or to care for an ailing family member or new child. Research indicates that access to paid family and medical leave is associated with improved physical and mental health for new parents, improved birth outcomes, financial security for caregivers in the short- and long-term, and improved connections to the workforce, particularly for women, who are more likely than men to be caregivers for children and older adults. Opponents often cite concerns about the impact of new federal requirements on businesses, government overreach into the free market, increased taxes for businesses (should that be the funding mechanism), as well as the financial implications a new benefit would have on wages and employment.  

Like sick leave, there have been many attempts to enact a national paid family and medical leave policy, but no permanent, broad-scale federal legislation has ever been passed. The Family and Medical Insurance Leave (FAMILY) Act, re-introduced in 119th Congress, if passed, would create a national insurance program to provide workers up to 12 weeks of their partial income for their own serious health condition or that of an immediate family member, and for the birth or placement of a child. The program would be funded by employee and employer payroll contributions. The program would be funded by employee and employer payroll contributions.

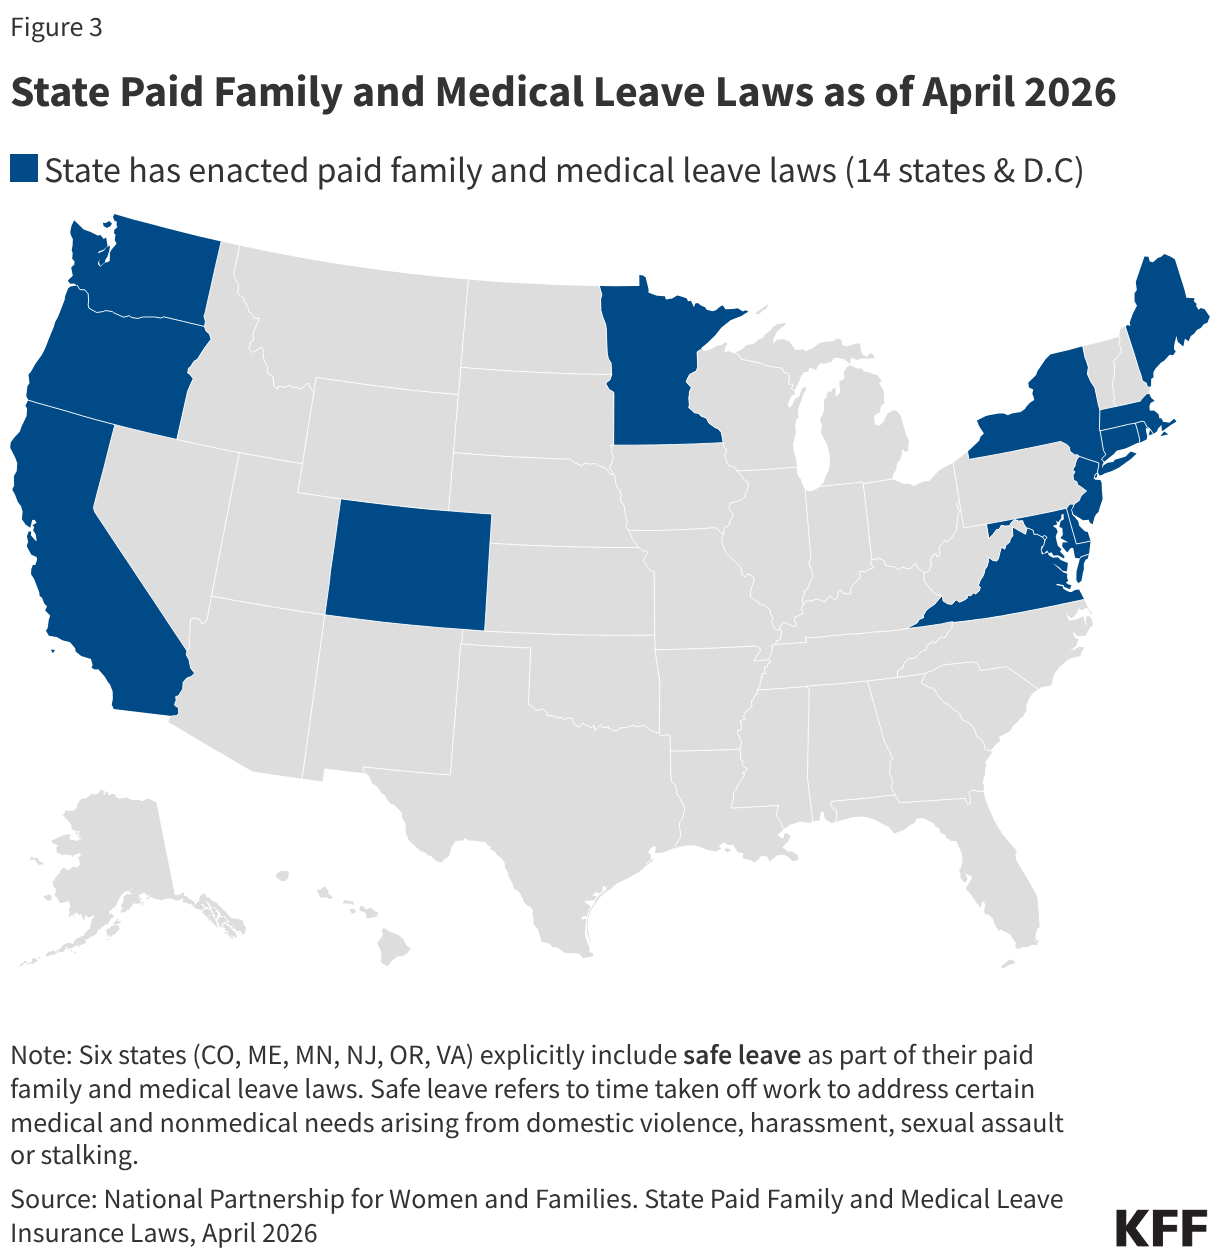
At the state level, 14 states and D.C. have enacted paid family and medical leave (Figure 3). In November 2020, Colorado became the first state to enact paid family and medical leave through a ballot measure. In 2026, Virginia became the first southern state to pass a statewide requirement for paid family and medical leave. Six states (Colorado, Maine, Minnesota, New Jersey, Oregon, and Virginia) also explicitly include safe leave as part of their paid family and medical leave laws. Oregon permits use of paid leave for reasons associated with a public health emergency. Paid leave durations for an employee’s own serious medical condition range from 6 to 52 weeks per year and 8-12 weeks for family leave. Four states (Colorado, Connecticut, Oregon, and Washington) plus D.C. provide a 2–4-week extension for a worker’s own pregnancy-related health issues. Wage replacement ranges from 50% to 100% of regular pay, up to certain caps, and requirements vary by state. Some states provide benefits on a sliding scale, with a higher percentage of wage replacement for lower-income workers. All states offering paid family and medical leave have minimum earnings or employment length requirements to qualify, and some have 7-day unpaid waiting periods. Paid leave benefits are administered by the state or by employers with qualifying programs and are funded through employer and/or employee contributions. 

This map shows that paid family and medical leave laws are limited across the U.S. Fourteen states and Washington D.C. have enacted paid family and medical leave laws ranging from 8 weeks to 52 weeks. Wage replacement rates vary by state and an individual's average weekly wages, with some states replacing up to 100% of an employee's wages while on leave.

Employer Provision of Paid Leave Benefits

The BLS’s National Compensation Survey (NCS) releases annual data related to employer benefit plans, including leave benefits. The share of employees with access to paid leave benefits varies by establishment characteristics, such as size, worker status, and wages. Nonetheless, access to paid leave benefits has increased overall in the last few years. The share of workers with access to paid family leave increased from 17% in 2018 to 27% in 2023; similarly, the share of workers with access to paid sick leave slightly increased from 78% in 2020 to 82% in 2025.  

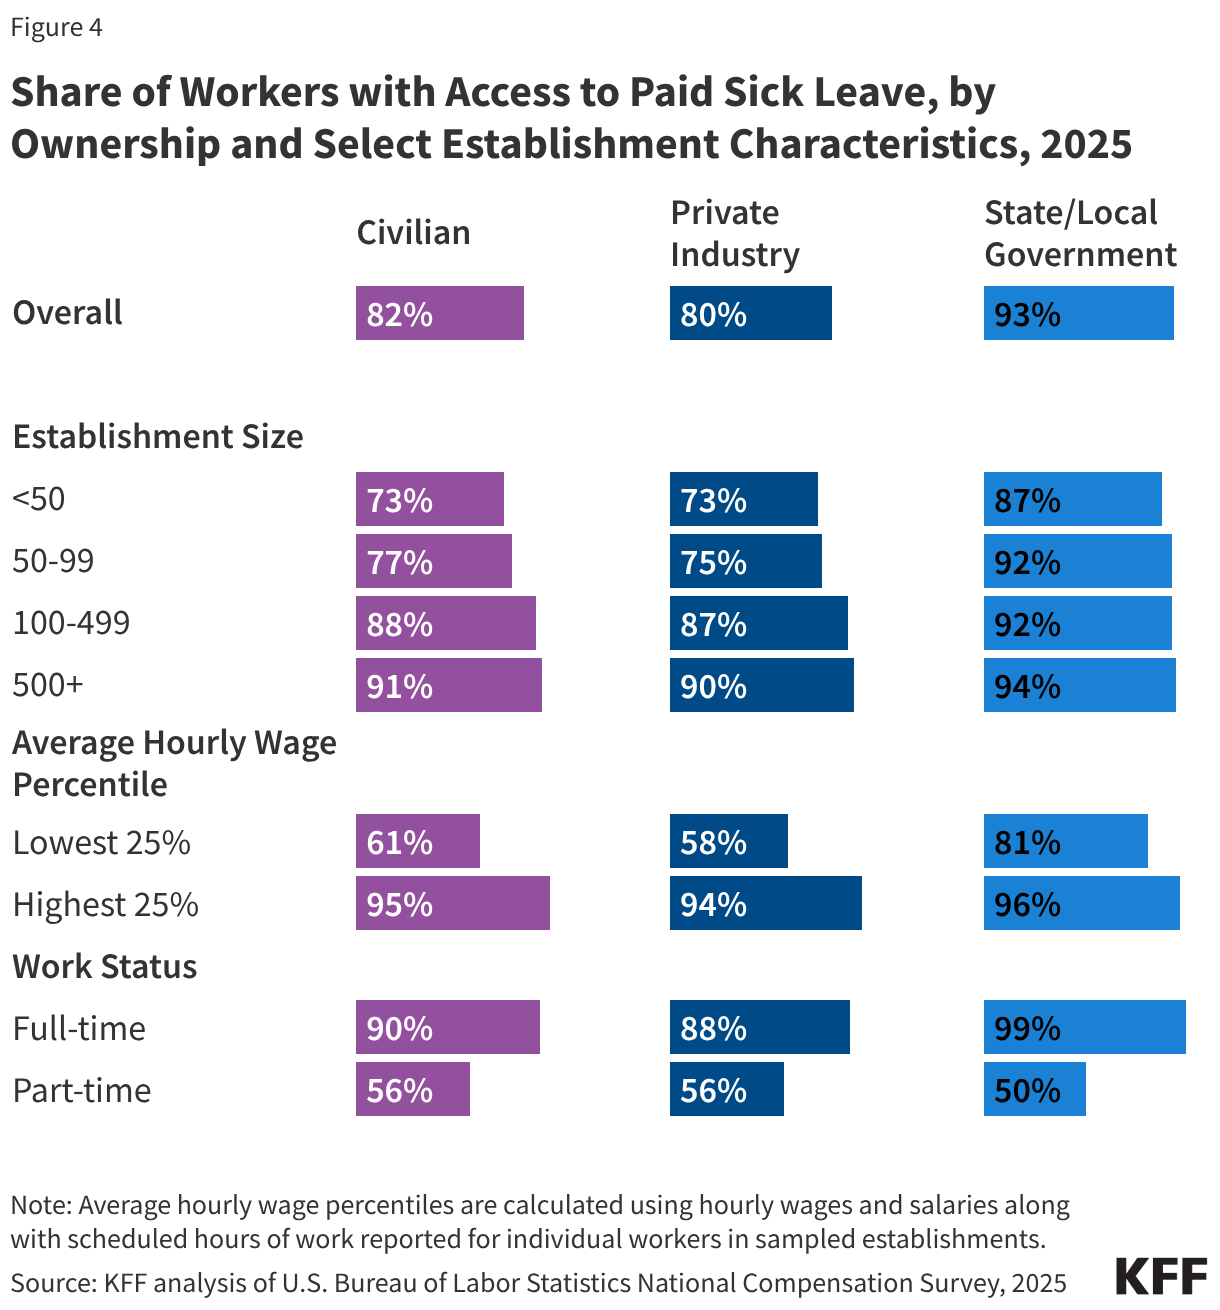
There are differences between different groups of workers in access to paid sick leave (Figure 4). Just over half (56%) of part-time workers had access, compared to nine in ten (90%) full-time workers. The lower likelihood of paid sick leave for part-time workers has a disproportionate impact on women, who are more likely than men to hold part-time jobs and more likely than men to care for sick children when they stay home from school. Among establishments with 500 workers or more, the share of workers with access to this benefit was 91%, compared to 73% of workers in establishments with less than 50 workers.

Split bar chart showing the share of workers who had access to paid sick leave in 2025. It shows that while access to paid sick leave is high overall among civilian-owned, privately-owned, and state/local government-owned establishments, there are differences in access between different groups of workers. Smaller shares of workers with lower incomes and part-time workers had access to paid sick leave compared to workers with higher incomes and full-time workers, respectively.

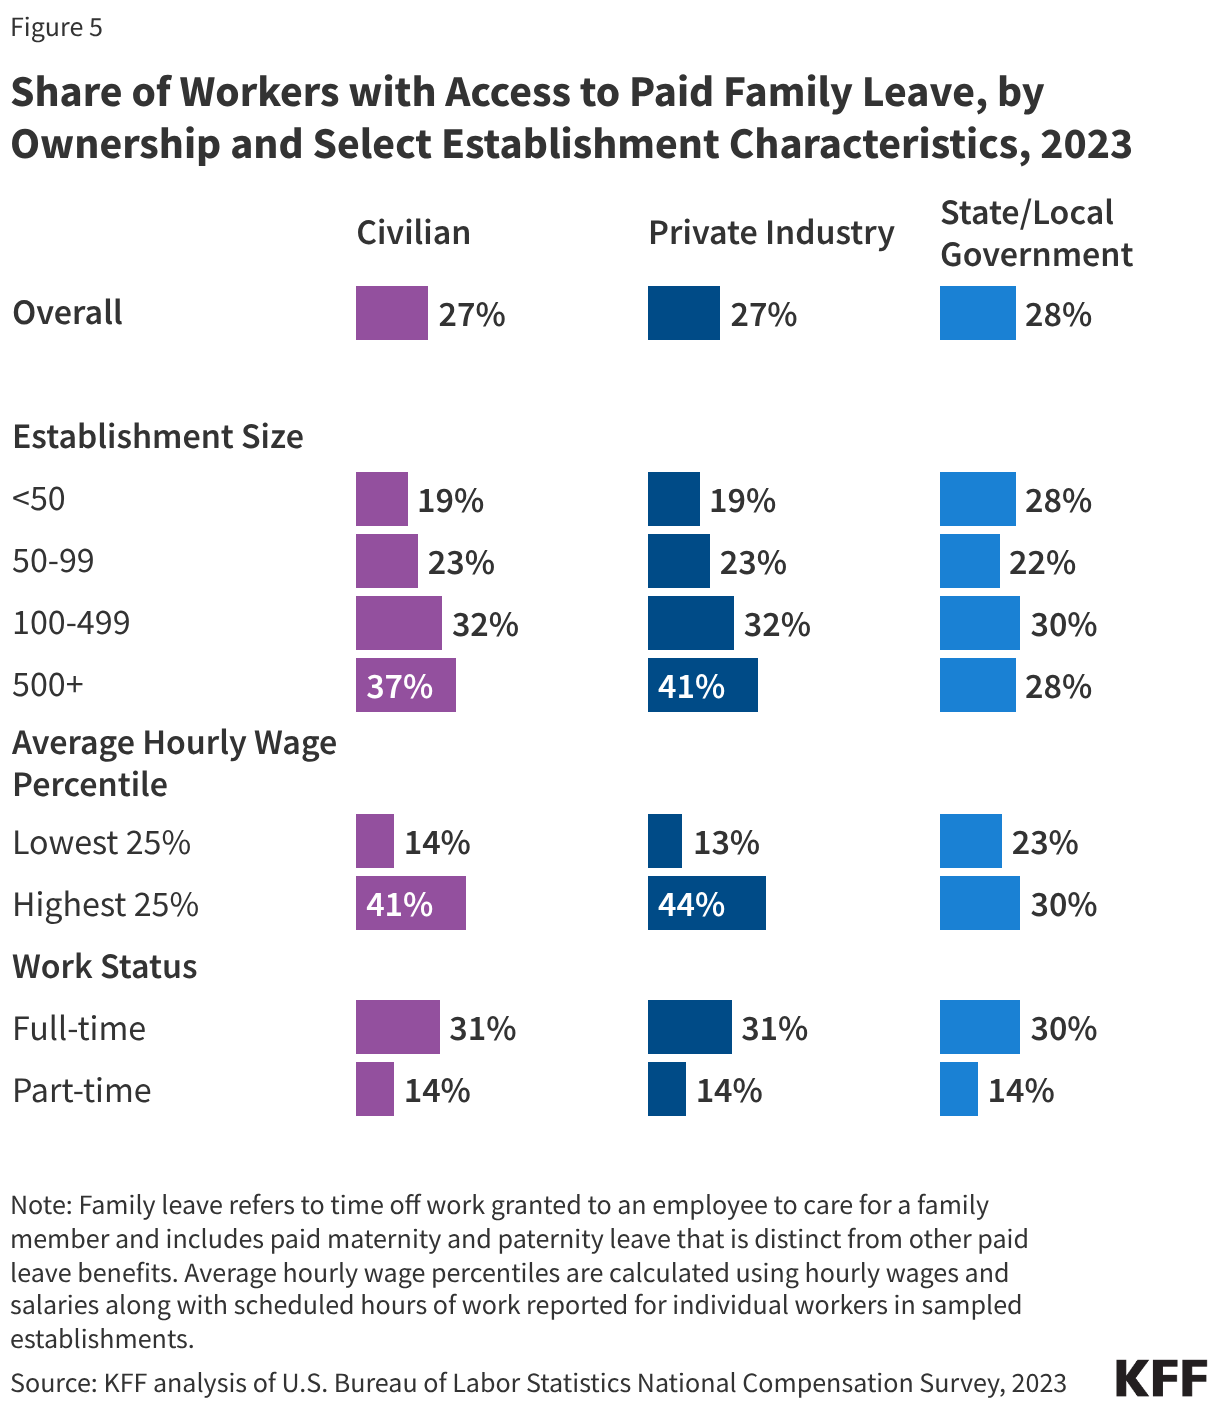
Similarly, in 2023, 31% of full-time workers had access to paid family leave benefits compared to 14% of part-time workers (Figure 5). Among establishments with less than 50 workers, the share of workers with access to this benefit was about one in five (19%). The share of workers with access nearly doubles (37%) in establishments with over 500 workers.  

Split bar chart showing the share of workers who had access to paid family leave in 2023. It shows that while access to paid family leave is similar overall among civilian-owned, privately-owned, and state/local government-owned establishments, there are differences in access between different groups of workers. Smaller shares of workers with lower incomes and part-time workers had access to paid family leave compared to workers with higher incomes and full-time workers, respectively.

Short of federal action, the movement for paid leave will likely continue to be centered on state and local policies or those voluntarily adopted by employers or negotiated through union contracts. Given that most people will need time off during their working lives to care for a personal or family illness, or for a new child, this issue will continue to be a salient concern for working families across the country in the years to come. 

Key Facts on Abortion in the United States

Published: Sep 25, 2026

Note: This brief was updated on September 25, 2026 to incorporate new data on abortion statistics.

The Supreme Court’s 2022 ruling in Dobbs v. Jackson Women’s Health Organization overturned the constitutional right to abortion that had been in place for nearly 50 years under Roe v. Wade. Prior to the Dobbs ruling, abortions were permitted up to fetal viability in all states. That federal standard was eliminated under Dobbs, allowing states to ban or restrict clinicians from providing abortion before viability. KFF is tracking and updating the status of abortion access and availability, with some states banning the provision of almost all abortions, and some states protecting abortion access. 

This issue brief answers some key questions about abortion in the United States and presents data collected before and since the Dobbs ruling.

Table of Contents

What is abortion?

Copy link to What is abortion?

Abortion is the medical termination of a pregnancy. It is a common medical service that many women obtain at some point in their life. There are different types of abortion methods, which the National Academy of Sciences, Engineering, and Medicine (NASEM) places in four categories: 

  • Medication Abortion – Medication abortion, also known as medical abortion or abortion with pills, terminates a pregnancy by oral medications. There are two widely accepted protocols for medication abortion. In the U.S., the most common protocol involves the drugs mifepristone and misoprostol. Typically, an individual takes mifepristone first, followed by misoprostol 24-48 hours later. The U.S. Food and Drug Administration (FDA) has approved this abortion protocol up to the first 70 days (10 weeks) of pregnancy. Another medication abortion protocol uses misoprostol alone, which is also recommended for up to 70 days (10 weeks) of pregnancy, but it is not currently approved by the FDA and is more commonly used in other countries. 

The Guttmacher Institute estimates that in 2023, medication was used for almost two thirds (65%) of all abortions. Many have confused emergency contraception (EC) pills with medication abortion pills, but EC does not terminate a pregnancy. EC is a contraceptive that prevents pregnancy by delaying or inhibiting ovulation and will not affect an established pregnancy.  

  • Aspiration, a minimally invasive and commonly used gynecological procedure, is the most common form of procedural abortion. It can be used to conduct abortions up to 14-16 weeks of gestation. Aspiration is also commonly used in cases of early pregnancy loss (miscarriage).  
  • Dilation and evacuation abortions (D&E) are usually performed after the 14th week of pregnancy. The cervix is dilated, and the pregnancy tissue is evacuated using forceps or suction.  
  • Induction abortions are rare and conducted later in pregnancy. They involve the use of medications to induce labor and delivery of the fetus.  

What does research show about the safety of abortions?

Copy link to What does research show about the safety of abortions?

Decades of research have shown that abortion is a very safe medical service.

Despite its strong safety profile, abortion is the most highly regulated medical service in the country and is now banned in several states. Additionally, many states impose other limitations on abortion that are not medically indicated, including waiting periods and parental notification and consent requirements that typically delay receipt of services. 

  • NASEM completed an exhaustive review on the safety and effectiveness of abortion care and concluded that complications from abortion are rare and occur far less frequently than during childbirth.  
  • NASEM also concluded that safety is enhanced when the abortion is performed earlier in the pregnancy. State level restrictions such as waiting periods, ultrasound requirements, and gestational limits that impede access and delay abortion provision likely make abortions less safe.  
  • Medication abortion successfully terminates the pregnancy 91.9% to 99.7% of the time, with a 0.4% risk of major complications, and an associated mortality rate of less than 0.001 percent (0.0005%). Between 2% to 4% of medication abortions may need a procedural intervention with this regimen.  
  • Studies on procedural abortions, which include aspiration and D&E, have also found that they are very safe, with the rate of major complications less than 1% for aspiration abortions. Abortion medications and procedures are also often used for people experiencing miscarriages and stillbirths and can improve safety by preventing delays when a loss is inevitable. 
  • Most OBGYN physicians say that the Dobbs decision has had a negative impact on maternal health and patient safety. In a national KFF survey of OBGYNs, more than six in ten say that racial and ethnic inequities in maternal health (70%), management of pregnancy-related medical emergencies (68%), and pregnancy-related mortality have all worsened (64%) since the Dobbs decision.

What is the status of abortion policy in the U.S.?

Copy link to What is the status of abortion policy in the U.S.?

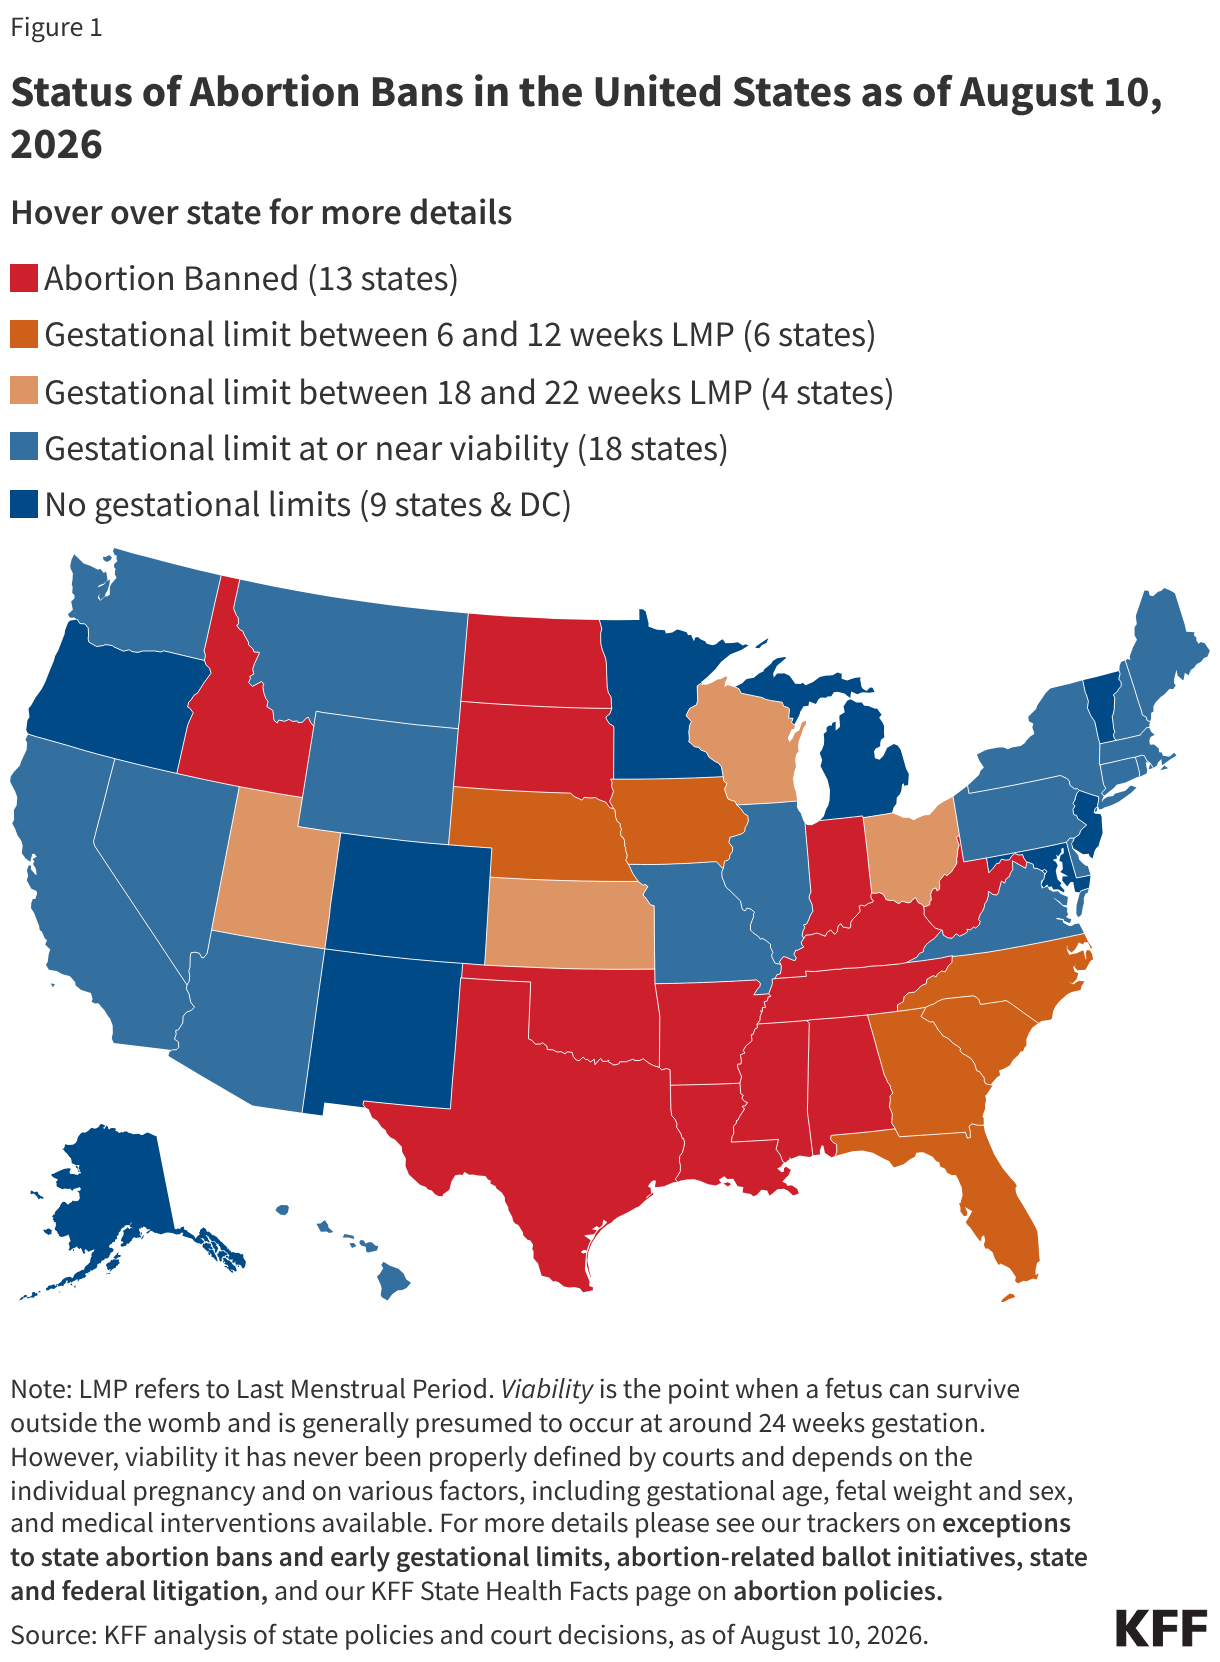
As of August 2026, the provision of abortion is banned in 13 states, and another 6 states have implemented early gestational limits between 6 and 12 weeks (Figure 1). Most other states allow abortion to the point of fetal viability, which is generally considered around 24 weeks gestation.

Map of the United States showing the status of abortion bans as of March 9, 2026. 

Abortion banned in 13 states: Alabama, Arkansas, Idaho, Indiana, Kentucky, Louisiana, Mississippi, North Dakota, Oklahoma, South Dakota, Tennessee, Texas, West Virginia

Gestational limit between 6 and 12 weeks LMP in effect in 7 states: Florida (6 weeks), Georgia (6 weeks), Iowa (6 weeks), Nebraska (12 weeks), North Carolina (12 weeks), South Carolina (6 weeks), Wyoming (6 weeks).

Gestational limit between 15 and 22 weeks LMP in effect in 4 states: Kansas, Ohio, Utah and Wisconsin

Gestational limits at or near viability in 18 states: Arizona, California, Connecticut, Delaware, Hawaii, Illinois, Maine, Massachusetts, Missouri, Montana, Nevada, New Hampshire, New York, Pennsylvania, Rhode Island, Virginia, Washington

No gestational limits in 9 states and DC: Alaska, Colorado, DC, Maryland, Michigan, Minnesota, New Jersey, New Mexico, Oregon, Vermont

All states that ban the provision of abortion have exceptions if an abortion is needed to prevent the death of the pregnant person. Additionally, some state bans make exceptions when the pregnancy is threatening the pregnant person’s health, when the pregnancy is the result of rape or incest, and when there is a lethal fetal anomaly. However, in practice, these exceptions have proven to be unworkable except in the most extreme circumstances.  

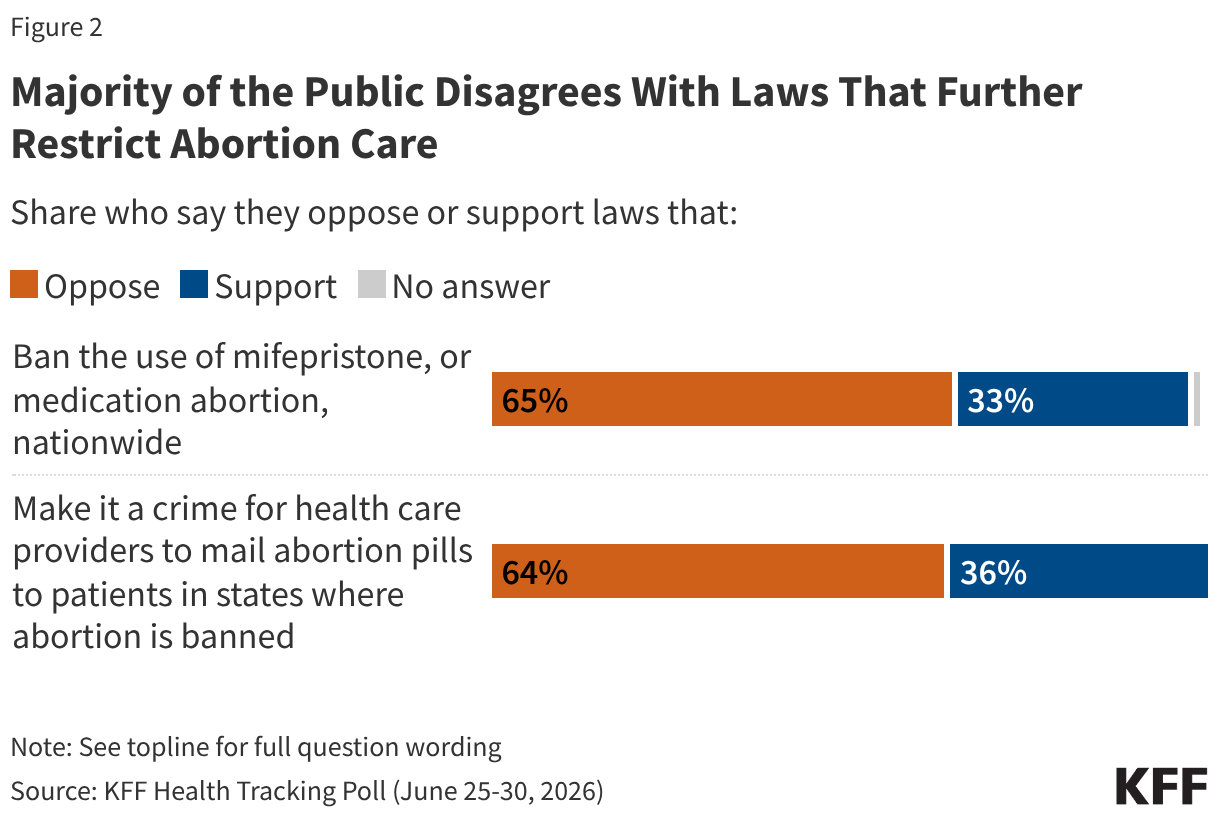
Abortion is one of the most highly restricted and regulated health care services. However, KFF research has found strong support for abortion access and opposition to criminalizing abortion care (Figure 2). 

Stacked bar chart showing that a majority of the public opposes laws restricting medication abortion. This includes laws that would ban mifepristone nationwide and laws that would make it a crime for health care providers to mail abortion pills to patients in states with abortion ban.

How common are abortions?

Copy link to How common are abortions?

The most recent data estimates that more than one million abortions (1,129,020) occurred in the U.S. in 2025. 

Three different organizations currently track abortion volume at the state and the federal levels: the federal Centers for Disease Control and Prevention (CDC), the Guttmacher Institute, and the Society for Family Planning (SFP). The CDC has been collecting abortion data for decades, but several states do not provide data to the federal government (reporting to the CDC is voluntary) and there is a two-to-three-year time lag until the data become publicly available. The most recent data from CDC is from 2022, the year the Dobbs decision was issued. For most of the decade prior to the Dobbs ruling, there was a steady decline in abortion rates nationally, but there was a slight increase in the years just before the ruling. Immediately following the Dobbs ruling, the number of abortions in the U.S. dropped as more states enforced bans and restrictions. 

Since the Dobbs ruling, the Guttmacher Institute’s Monthly Abortion Provision Study and the SFP's #WeCount have been tracking state level changes in abortion volume based on data provided by abortion clinics and providers. Both studies provide national and state-level estimates on procedural and medication abortions but differ in some methodologic details. For more details about data sources, see KFF’s issue brief on abortion trends. 

Paradoxically, the most recent data show that the abortion volume in the U.S. slightly increased overall in the three years following the Dobbs ruling.  

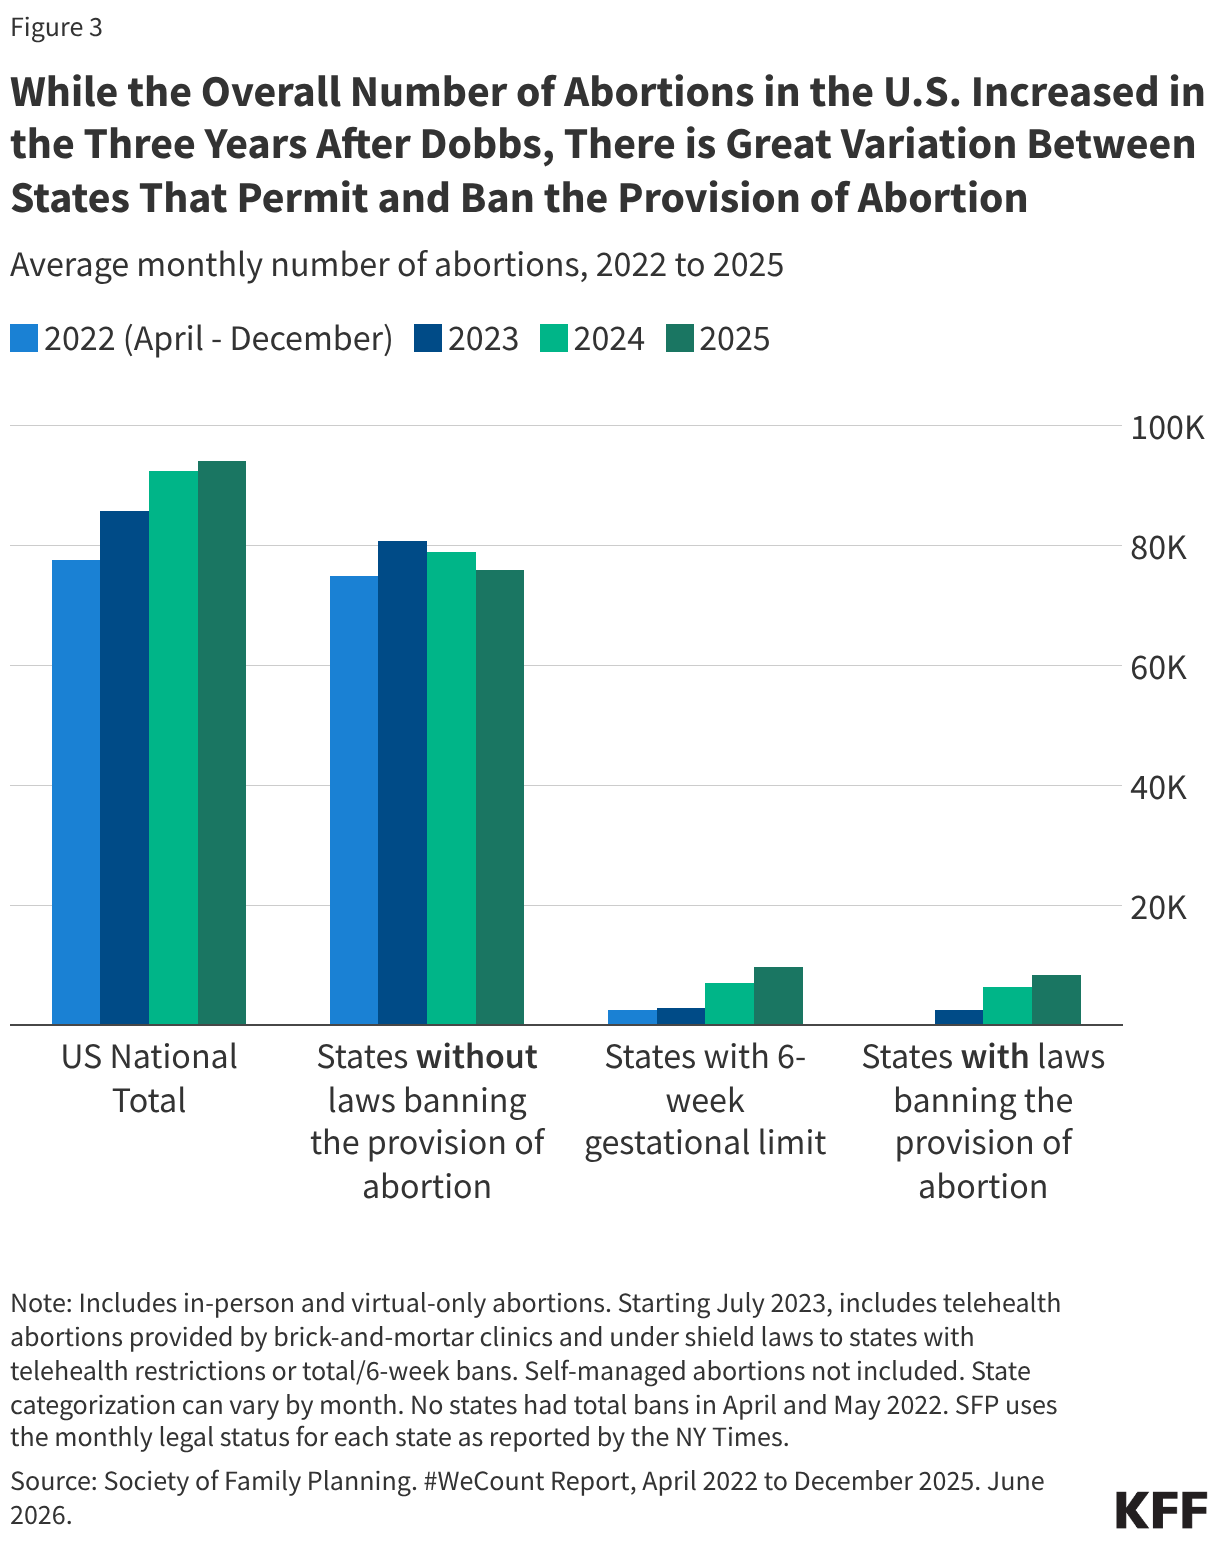
The monthly average number of abortions steadily increased from 77,560 monthly abortions in 2022 (April to December 2022), to 85,780 abortions in 2023 to 92,400 abortions in 2024 to 94,090 in 2025 (Figure 3). This overall increase nationally can be largely attributed to the growth of telehealth for medication abortion, increased availability of lower cost medication abortion pills through virtual clinics, growth in capacity in states without laws banning or restricting the provision of abortion, and in particular, shield law abortions where clinicians in legal states are mailing pills to individuals residing in states with bans and restrictions.  

There is large variation in the volume of abortions between states with different abortion policies. Most abortions occur in states without bans. In states with bans and six-week gestational limits, there have been major declines in the volume of in-person abortions, but an increase in abortions by telehealth since the Dobbs ruling.  There are month-to-month variations in all states. Additionally, in the years since Dobbs, some states have changed their abortion policies, with some becoming more restrictive and some less restrictive at different times, which affects abortion access and volume.  However, the overall pattern since the Dobbs ruling is an increase in the national number of abortions, particularly growth in the share of telehealth abortions. 

These grouped columns show that there is large variation in the volume of abortions between states with different abortion policies. Some states have changed their abortion policies since the 2022 Dobbs ruling, with some becoming more restrictive and some less restrictive at different times, which affects abortion access and volume. Most abortions occur in states without bans on abortion provision. In states with bans and six-week gestational limits, the number of abortions by telehealth have increased.

Who gets abortions?

Copy link to Who gets abortions?

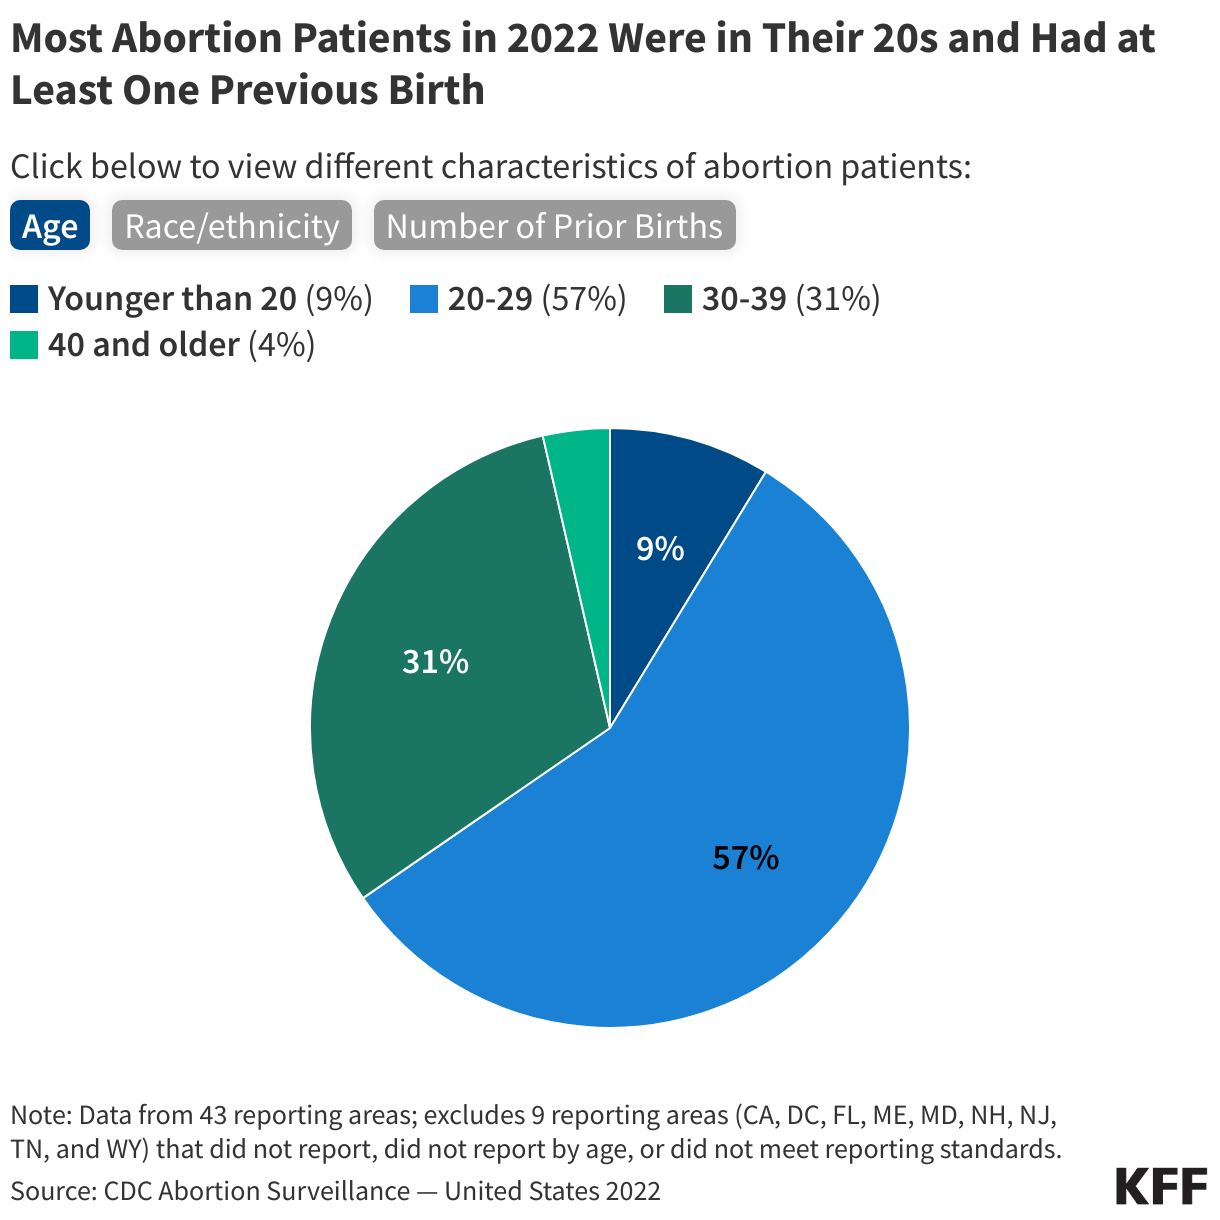
Most of the information about people who receive abortions comes from CDC data. In 2022, the most recent year CDC data are available, women across a range of age groups, socioeconomic status, and racial and ethnic backgrounds obtained abortions, but the majority were obtained by women who were in their twenties, low-income, and women of color. 

  • Women in their twenties accounted for more than half (57%) of abortions. Nearly one-third (31%) were among women in their thirties and a small share were among women in their 40s (4%) and teens (9%).  
  • Information on the race and ethnicity of people who obtain abortions is particularly limited, but based on available data, more than half of abortions were among women of color in 2022. Black women comprised 40% of abortion recipients, 32% were provided to White women, 21% to Hispanic women, and 7% were among women of other races/ethnicities. Additionally, White, Black, and American Indian and Alaska Native women are disproportionately represented among women ages 18-49 in states with laws banning or restricting the provision of abortion compared to states that provide broader access to abortion. Many women who sought abortions have children. Approximately six in 10 (59%) abortion patients in 2022 had at least one previous birth.
Pie chart showing the age breakdown of individuals who had abortions in 2022. Overall, women in their 20s made up over half of abortion patients.

The vast majority (93%) of abortions occur during the first trimester of pregnancy according to data available from before the Dobbs decision.  

Before the 2022 ruling in Dobbs, there was a federal constitutional right to abortion before the pregnancy is considered to be viable, that is, can survive outside of a pregnant person’s uterus. Viability is generally considered around 24 weeks of pregnancy. Most abortions, though, occur well before the point of fetal viability. When people have abortions later in pregnancy, it is often because the fetus is not viable and the pregnancy may endanger the pregnant person’s life. 

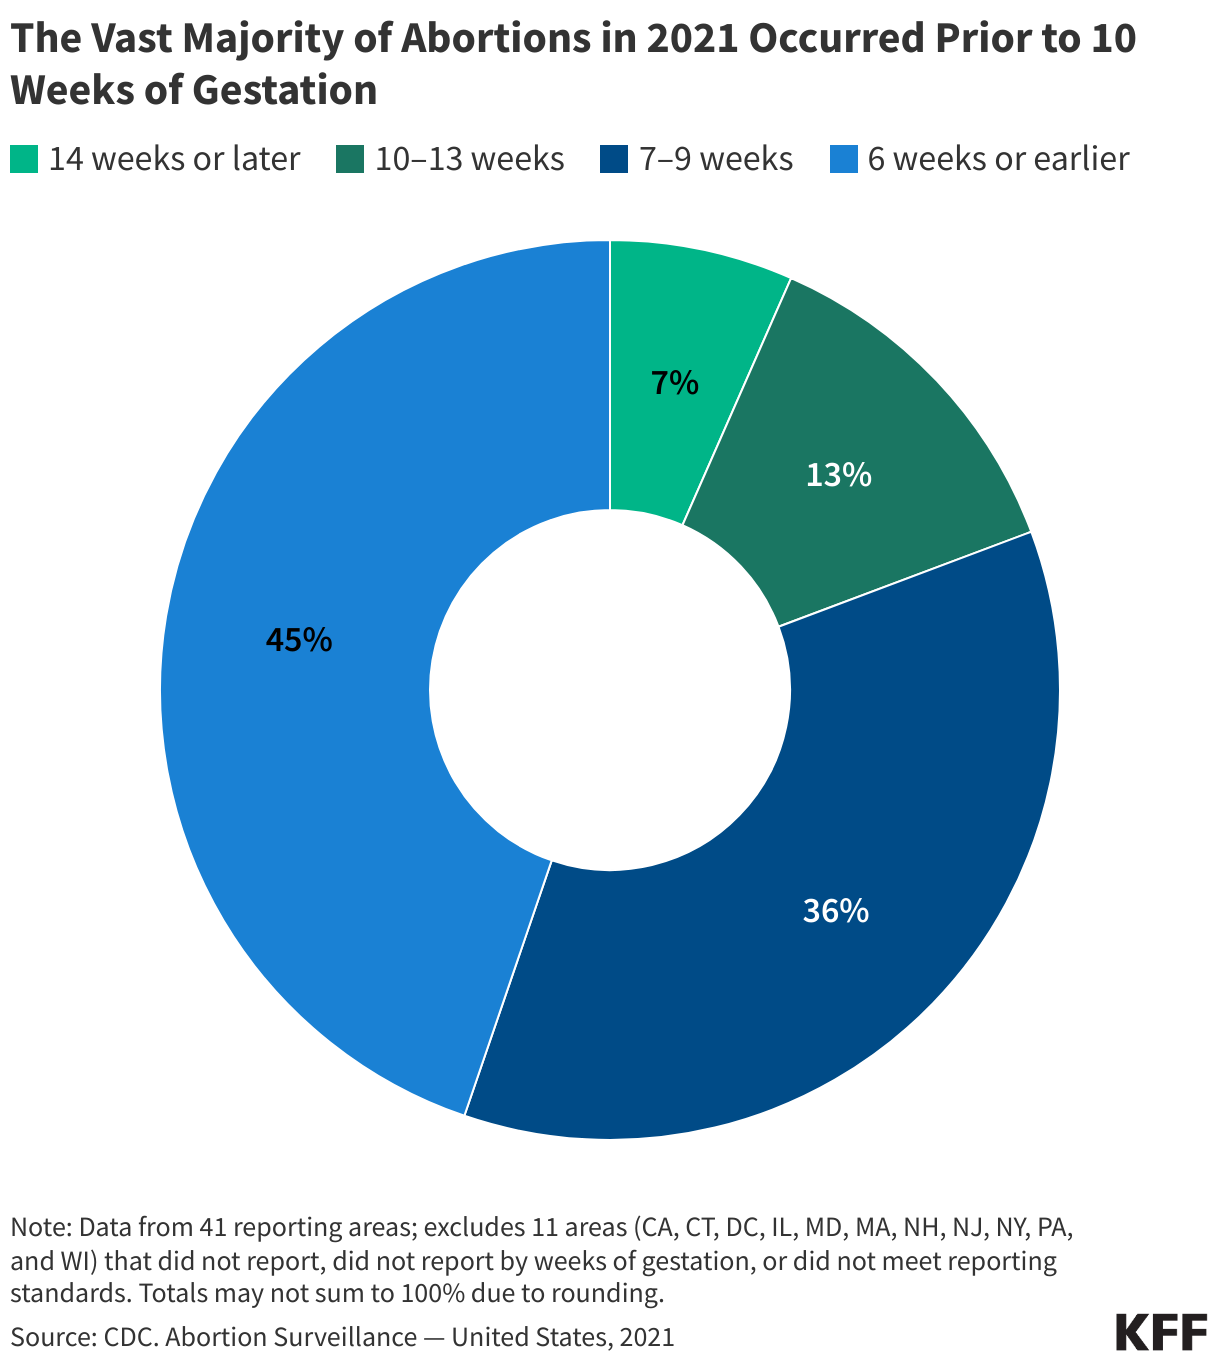
Data from 2022 found that four in ten (40%) abortions occurred by six weeks of gestation, another four in ten (39%) occurred between seven and nine weeks, and 14% at 10-13 weeks. Just 7% of abortions occurred after the first trimester (Figure 5).

Pie chart showing the breakdown of abortions that occurred in 2022 by weeks of gestation. Most abortions (79%) occurred before 10 weeks of gestation.

Where do people get abortion care?

Copy link to Where do people get abortion care?

Abortions can be provided in a variety of settings. Historically, the majority of abortions have been provided at brick-and-mortar clinics that specialize in provision of reproductive health care. Some private office-based physicians also offer abortion services, and in more recent years, there has been an emergence of virtual-only clinics that send medication abortion pills by mail. 

Brick-and-mortar clinics vary, but they can offer medication abortion, procedural abortions, and services for abortions later in pregnancy. Many clinics in states where abortion is restricted or banned stopped offering abortion services shortly after the Dobbs ruling and the overall number of brick-and-mortar independent clinics in the US has decreased over the years.  

The distribution of facilities that offer abortion care varies widely by state and geographic region, and the national increase in abortions appears to be largely driven by the expansion of virtual abortion clinics. While virtual clinics can remove geographic barriers for those seeking abortion care, their services are limited to medication abortion which is only available to those seeking abortions earlier in pregnancy. Even prior to the ruling in Dobbs, access to abortion services was very uneven across the country, and these geographic disparities have only widened.

Telehealth

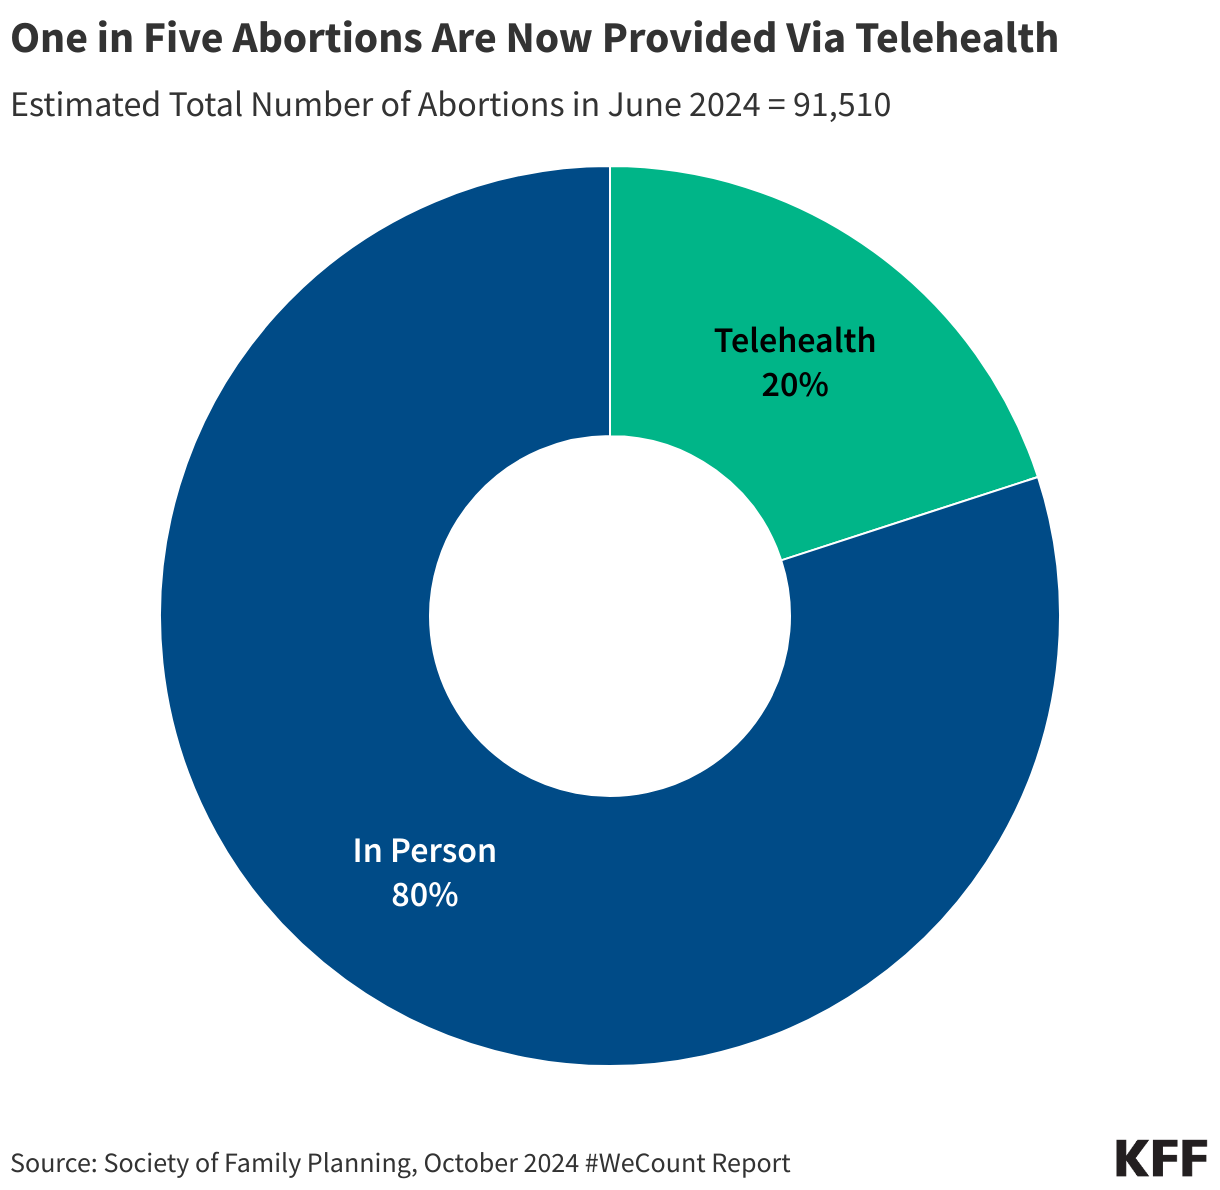
Telehealth has grown as a delivery mechanism for abortion services, accounting for 28% of abortions in 2025. While procedural abortions must be provided in person in a clinical setting, medication abortion can be provided in a clinical setting or via telehealth without an in person visit. 

Access to medication abortion via telehealth was limited for many years by an FDA policy that permitted only certified clinicians to dispense mifepristone within a health care setting. In December 2021, however, the FDA permanently revised this policy and no longer requires clinicians to dispense the drug in person. Additionally, in January 2023, the FDA finalized a policy change that allows retail pharmacies to dispense medication abortion pills to patients with a prescription. These policy changes opened the door to using telehealth for medication abortion.  

  • Telehealth can be administered by providers from traditional brick-and-mortar clinics or by virtual-only clinics. Virtual clinics began to proliferate after the FDA revised its in-person dispensing requirement in 2021, rising from no virtual clinics in 2020 to 226 clinics in 2023.  
  • In a telehealth abortion, the patient typically completes an online questionnaire to assess (1) confirmation of pregnancy, (2) gestational duration and (3) blood type. If determined eligible by a remote clinician, the patient is mailed the medications. This model does not require an ultrasound for pregnancy dating if the patient has regular periods and is sure of the date of their last menstrual period (in line with ACOG’s guidelines). If the patient has irregular periods or is unsure how long they have been pregnant, they may need to obtain an ultrasound to confirm the weeks of gestation and rule out an ectopic pregnancy and send in the images for review before receiving medications. The follow-up visit with a clinician can also happen via a telehealth visit.  
  • Research has found that the provision of medication abortion via telehealth is as safe and effective as the provision of the pills at an in person visit. Yet, in some states that have not banned the provision of abortion, telehealth may not be available because of state-level restrictions enacted prior to the Dobbs ruling that effectively ban telehealth for abortion care.  
  • Medication abortion has emerged as a major legal and legislative front in the battle over abortion access across the nation. Multiple cases have been filed in federal and state courts regarding aspects of the FDA’s regulation of medication abortion as well as the mailing of medications.  
  • Some states have passed shield laws that bar the clinicians’ resident state from extraditing them if a restrictive state attempts to prosecute the clinician for performing an abortion that is otherwise legal in their home state. Telehealth abortions include those provided by brick-and-mortar clinics, virtual clinicians, and clinicians in states with shield laws who prescribe medication abortion to patients in states with telehealth restrictions or laws banning or restricting the provision of abortion. 
Pie chart showing the breakdown of telehealth and in-person abortions in 2025. Nearly three in ten (28%) abortions now occur via telehealth.

Self Managed Abortions

Self-managed abortions typically involve obtaining medication abortion pills from an online pharmacy that will send the pills by mail or by purchasing the pills from a pharmacy in another country, usually without the involvement of a physician or advanced practice clinician. While this can involve asynchronous contact with non-US-based clinicians, it does not typically involve a direct consultation with a clinician either in person or via telehealth. 

It is difficult to track the volume of self-managed abortions since they are outside of the formal health care system, and it is unknown if all people who receive medication pills take them. One study estimated that at least 26,000 additional self-managed medication abortions took place in the six months following the Dobbs ruling.

Interstate Travel

The Guttmacher Institute Monthly Abortion Provision Study is the only data source so far to provide in-depth information on interstate travel pre- and post-Dobbs. Guttmacher estimates that prior to Dobbs, nearly one in ten people obtained an abortion by traveling across state lines in 2020. Even before Roe v Wade was overturned, abortion was highly restricted in many states. The latest data show that 155,000 patients traveled out of state for abortion care in 2024, a slight drop from 170,000 in 2023 but nearly double the number of travelers in 2020 (81,000). This has been offset by an increase in patients who are getting abortion pills via telehealth. 

The states with the highest number of people traveling inbound for abortion care border at least one state where the provision of abortion is banned, including Illinois, North Carolina, Kansas, and New Mexico. 

How much do abortions cost?

Copy link to How much do abortions cost?

The costs of abortion services vary widely depending on the method, facility, and gestational length; the costs can be as low as $40 through virtual clinics but typically exceed $1,000 for abortions later in pregnancy.  

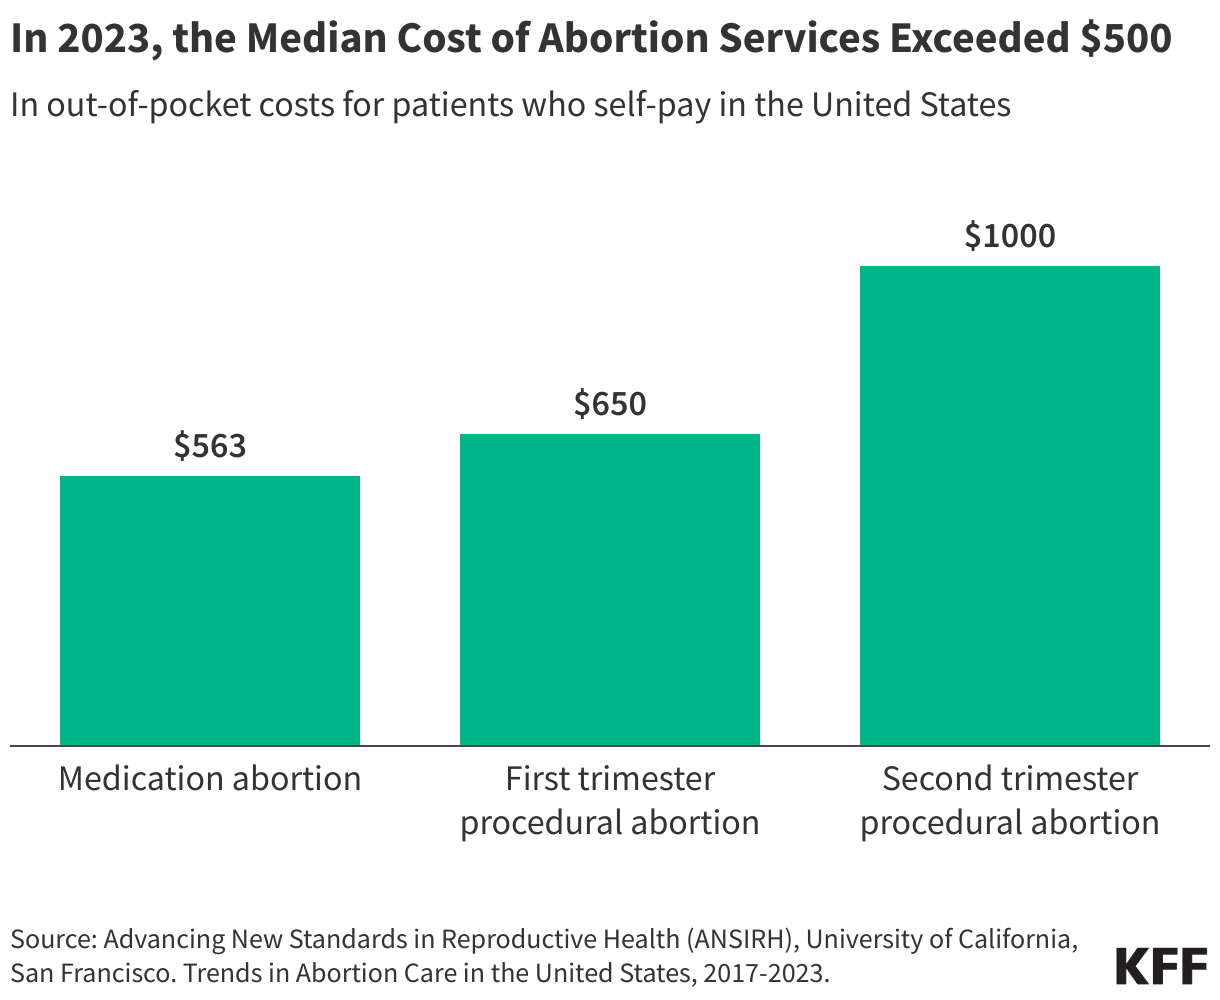
  • Obtaining an abortion can be costly. In 2023, the median costs for people paying out of pocket in the first trimester were $563 for a medication abortion and $650 for a procedural abortion (Figure 7). For people with low incomes, who are more likely to seek abortion care, these costs are often unaffordable.  
  • The costs for medication abortion services through virtual clinics, such as AidAccess and Abuzz, as well as self-managed sites, are typically lower than in person services. In 2023, the median cost of medication abortion from virtual clinics was $150. Costs at online pharmacies listed on Plan C range from a low of $40 for abortion pills by mail without clinician consultation, to upwards of $150 for abortion by mail with a clinical consultation. 
  • The costs of abortion are higher in the second trimester compared to the first, with median self-pay reaching or exceeding $1000. In the second trimester, more complex procedures may be needed and local options are more limited in many communities that have fewer facilities. The state bans and restrictions enacted since Dobbs can also result in additional nonmedical expenses for transportation, childcare, lodging, and lost wages.  
  • While some people use their insurance to pay for the costs of abortion care, most people pay out of pocket. Some people can obtain assistance from local abortion funds, which are independent organizations that help pay for some of the costs of abortion services, typically medical care, travel, and accommodations if needed. Most abortion funds are regional and have connections to clinics in their area, but they do not reach all people seeking services.
Columns chart summarizing the median out-of-pocket cost of medication abortion, first trimester procedural abortion, and second trimester procedural abortion in 2023. While each service exceeded 0, the median cost of second trimester procedural abortions was almost double the median cost of medication abortions.

Does private insurance or Medicaid cover abortions?

Copy link to Does private insurance or Medicaid cover abortions?

Insurance coverage for abortion services is heavily restricted in certain private insurance plans and public programs like Medicaid and Medicare.   

Among women of reproductive age, approximately six in ten are covered by private insurance, one in five are covered by Medicaid, and one in ten are uninsured.  

Prior to the Dobbs ruling, several states had enacted private plan restrictions and banned abortion coverage from ACA Marketplace plans. As of September 2026, there are 10 states that have policies restricting abortion coverage in private plans and 25 that ban coverage in any Marketplace plans. Since the Dobbs ruling, some of these states have also banned the provision of abortion services altogether. Conversely, 13 states require state-regulated private plans to cover abortion, ten of which require no cost-sharing for abortion.

For decades, the Hyde Amendment has banned the use of federal funds for abortion in Medicaid, Medicare and other public programs unless the pregnancy is a result of rape, incest, or if it endangers the pregnant person’s life. States have the option to use state-only funds to cover abortions under other circumstances for those on Medicaid, which 21 states do currently.  

Data from 2021, prior to Dobbs, estimated that a quarter (26%) of abortion patients used Medicaid to pay for abortion services, 11% used private insurance, and 60% paid out of pocket. People in states with more restrictive abortion policies were more likely to pay out of pocket compared to people living in less restrictive states. 

A map of the United States highlighting health insurance coverage restrictions for abortion services. This includes Medicaid, private, and marketplace limitations; Medicaid and marketplace limitations; Medicaid limitations only; and, marketplace limitations only. Most states have at least one restriction.13 states require abortion coverage in all of these plans, while 6 states have no coverage limitations or requirements.

Abortion on the 2026 Ballot: The Evolving Landscape of State Abortion Initiatives 

Published: Sep 24, 2026

This brief was updated on September 24, 2026, to reflect the status of four abortion-related ballot initiatives on the 2026 ballot. Nebraska’s initiative did not qualify for the 2026 ballot. This update also describes recent changes to the ballot language in Idaho and ongoing litigation in Virginia.

Since the Supreme Court’s 2022 Dobbs ruling, state ballot initiatives have become a powerful tool used by advocates on both sides hoping to either protect or limit abortion access in their state. Successful ballot initiatives that enact state constitutional amendments provide stronger legal authority to either protect or restrict abortion than laws enacted by the legislature or state Supreme Court rulings. Since 2022, twelve states have passed ballot initiatives, usually, but not exclusively, to protect abortion rights in their state. Once again, this November, four states (Table 1) will have abortion-related measures for their voters to consider. Abortion rights advocates in Nevada and Virginia have placed a constitutional amendment protecting the right to abortion on the November ballot. The Missouri legislature has placed an initiative on the ballot to repeal a state constitutional amendment protecting the right to abortion approved by voters in 2024. In addition, voters in Idaho will decide on a state statute that would guarantee a right to abortion until fetal viability or after fetal viability when the patient experiences a medical emergency. This issue brief reviews the abortion-related initiatives on the ballot in November 2026 and examines how these measures may impact abortion access in the state. 
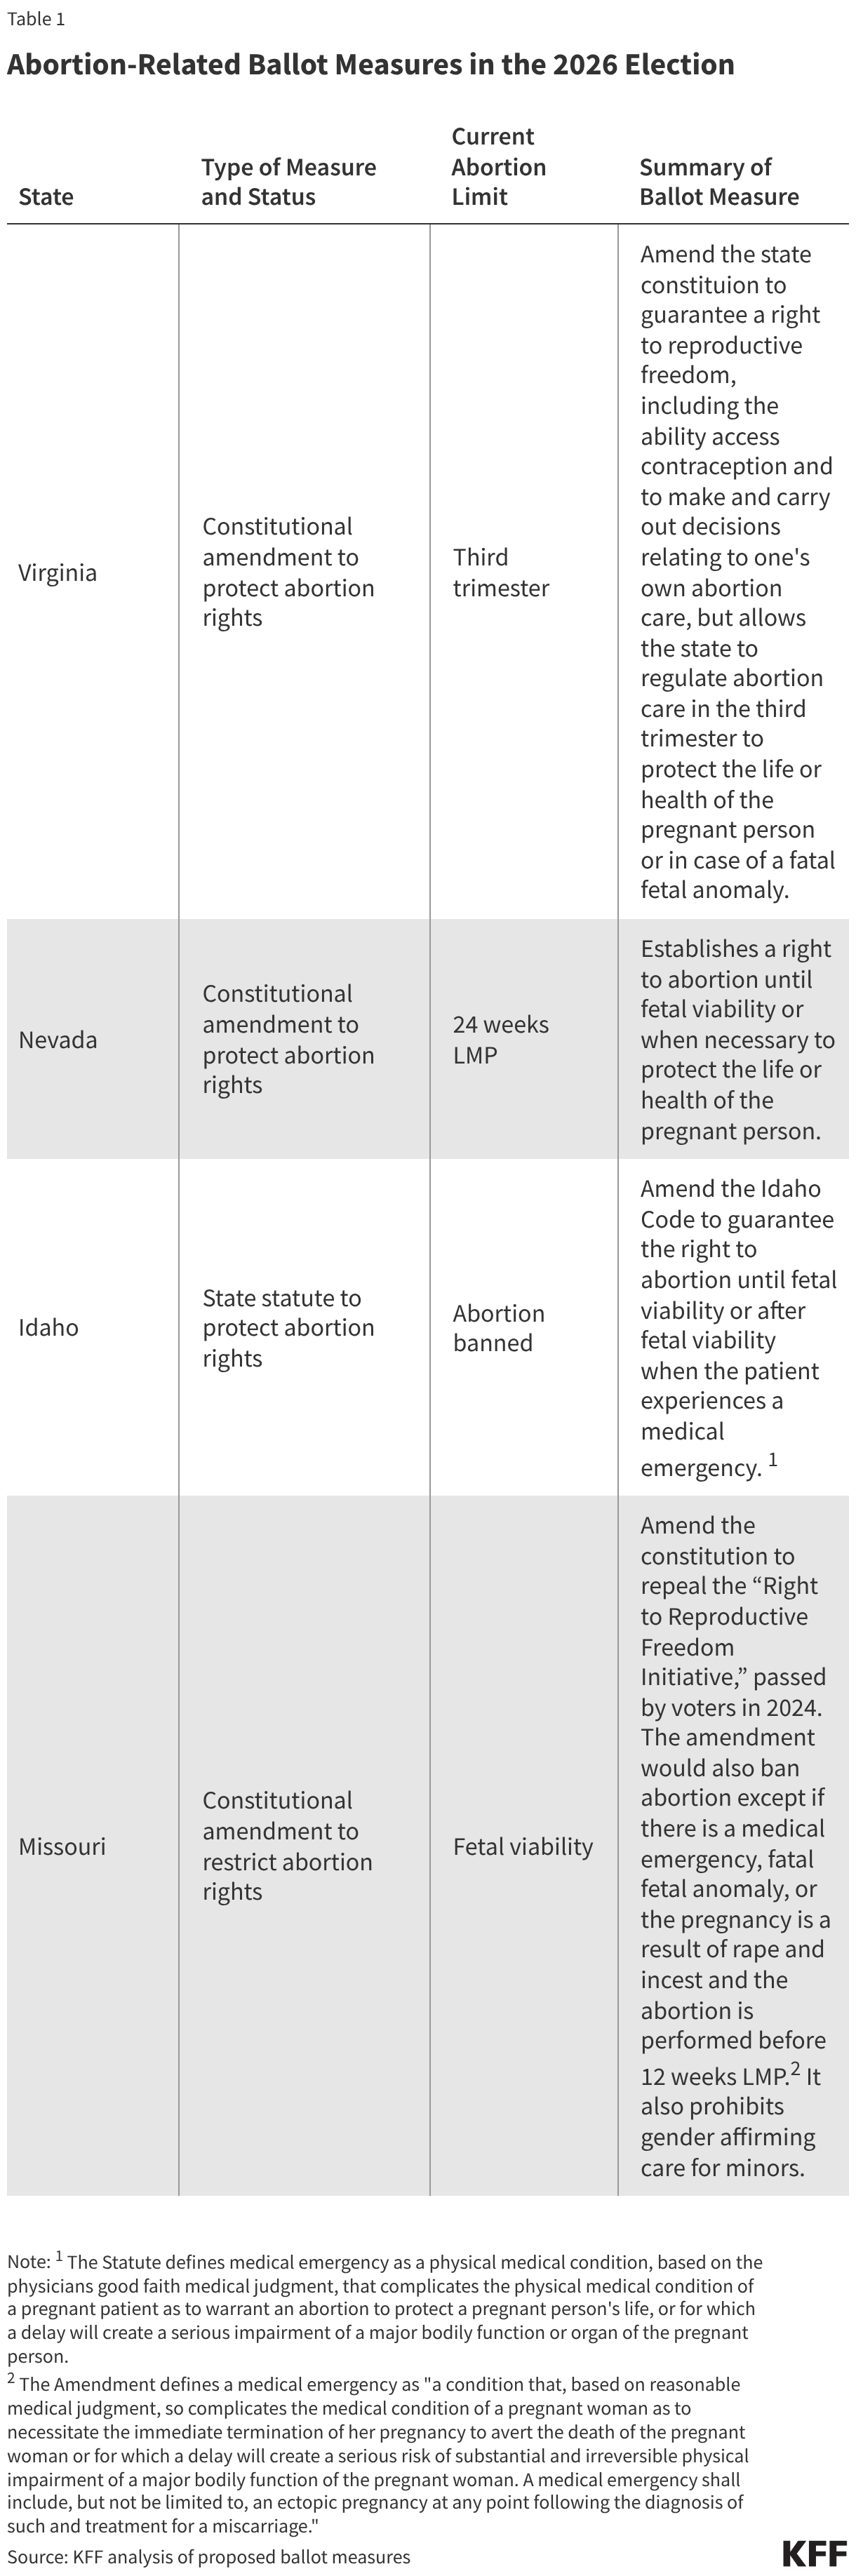
Abortion-Related Ballot Measures in the 2026 Election (Table)

Ballot Initiatives Seeking to Protect Abortion Rights

Virginia

Virginia is currently the only state in the South that does not ban the provision of abortion or impose an early gestational limit, currently allowing abortion until the third trimester. Unless the litigation, described below, challenging the placement of the ballot measure succeeds, voters in Virginia will decide whether to enshrine these abortion protections into the state constitution in November. On February 6, 2026, Governor Spanberger signed a bill, placing the Right to Reproductive Freedom Amendment on the ballot, after the legislature passed it in two successive sessions, as is required by state law. However, on March 3, 2026, Charla Bansley, the District 3 Supervisor for the Bedford County Board of Supervisors, filed a lawsuit seeking to block the placement of the measure on the November ballot. Ms. Bansley alleges state election officials failed to distribute the constitutional amendment to circuit clerks in all counties, as required by state law, before certifying the abortion measure for the ballot.

On July 24, 2026, a district court judge issued an order dismissing Bansley’s lawsuit with prejudice because she failed to establish that she had standing to bring the lawsuit, and the operative law that Bansley attempted to rely on to challenge the ballot language had been repealed. On September 12, 2026, the Virginia Court of Appeals heard an appeal to Bansley’s lawsuit, challenging the ballot initiative placement on the November 2026 ballot. The Virginia Court of Appeals denied Bansley’s petition to bypass appellate review and go directly to the Virginia Supreme Court. Bansley’s opening brief is due October 19, 2026.

A separate lawsuit challenging the Right to Reproductive Freedom Amendment was filed on April 30, 2026, by two medical advocacy groups and by Meagan Kade, a member of the Bluefield town council. The Plaintiffs argue that the language of the ballot initiative does not accurately convey the legal impact of the new constitutional amendment to voters. Additionally, they make the same argument as Bansley that the amendment was not properly circulated. A hearing was held in June 2026. The case is still unresolved, and early voting for Virginia began on September 18, 2026.

The Right to Reproductive Freedom Amendment would amend the state constitution to guarantee a fundamental right to abortion until the third trimester, as well as contraception and fertility care. The Amendment would allow the Commonwealth of Virginia to regulate abortion in the third trimester; however, abortion cannot be prohibited if the pregnant person’s life or physical or mental health is at risk, or if the fetus is not viable. If passed, the Amendment will provide durable protection for abortion rights in the state’s constitution by ensuring that changes in the composition of the legislature or the courts in the Commonwealth do not impede access to abortion care.

Nevada

Nevada law requires citizen-initiated ballot initiatives amending the state’s constitution to pass in two successive general elections. Therefore, Nevadans will vote for the second time on the Reproductive Rights Amendment initially approved by voters in 2024. If passed, the Reproductive Rights Amendment will, “guarantee a right to all individuals to abortion performed or administered by a qualified health care practitioner until fetal viability or when needed to protect the life or health of the pregnant patient, without interference from the state or its political subdivisions.” 

Abortion is currently legal in Nevada until 24 weeks gestation. In 1990, voters passed as a “statute affirmation” which upheld the existing law, NRS 442.250, which legalized abortion until 24 weeks, and prohibited the state legislature from amending or repealing the law unless it was placed on the ballot. In 2019, Nevada enacted the Trust Nevada Women Act, which decriminalized medication abortion and removed informed consent laws. The Reproductive Rights Amendment would protect the individuals’ right to abortion beyond the existing law by limiting state interference. While passage of the Reproductive Rights Amendment would provide the strongest protection against efforts to limit reproductive rights by the legislature or courts, any effort to change the gestational limit for abortion in Nevada would have to be approved by a direct vote of state residents, not by the legislature. 

If the Reproductive Rights Amendment passes, abortion rights advocates are likely to bring a new challenge to Nevada’s parental notification for minors law, contending it is not permissible under the new constitutional amendment. If successful, this challenge would allow minors to consent for their own abortions. Last year, a lower court lifted a 1985 injunction blocking the notification law and reinstated the parental notification requirement. Planned Parenthood Mar Monte, the affiliate that operates the Nevada Planned Parenthood clinics, challenged the lower court's order, and the Nevada Supreme Court preliminarily enjoined the law.

Idaho

Idaho has among the most restrictive abortion laws in the nation. Abortion rights advocates are seeking to reverse these restrictions by trying to get a new law approved, the Reproductive Freedom and Privacy Act, which will change the legality of abortion in the state. Idaho is currently enforcing a total ban on the provision of abortion, with exceptions only to prevent the death of the pregnant person or in the first trimester for reported cases of rape or incest. The Reproductive Freedom and Privacy Act would create a state law giving people the right to make decisions about their own reproductive health care, including abortion up to fetal viability, and after fetal viability if the patient is experiencing a medical emergency, miscarriage care, prenatal, pregnancy, and postpartum care, contraception, and fertility treatment. However, the initiative faced considerable barriers to getting on the ballot. In Idaho, a citizen-initiated ballot initiative can only be placed on the ballot if the petitioner gathers signatures from 6% of the registered voters in the last election in 18 of the state’s 35 legislative districts and submits these signatures by May 1 of the election year. The signatures must then be verified by the county clerks and submitted to the secretary of state for certification. Idahoans United for Women and Families, a nonprofit group that advocates for comprehensive reproductive health care in the state, is organizing the 2026 ballot initiative. On July 13, 2026, the Idaho Secretary of State announced that Idahoans United for Women and Families had collected enough valid signatures for the initiative to qualify for the November 2026 ballot.

In addition to facing barriers to collecting signatures, Idahoans United has also filed multiple lawsuits against the attorney general’s office regarding the ballot language. In January 2025, the group sued the attorney general’s office, arguing that the financial impact statement and the short title of the ballot initiative contained biased language. On June 16, 2025, the Idaho Supreme Court agreed and ordered the attorney general to draft a new financial statement and short title. 

On August 27, 2026, Idahoans United for Women and Families filed another lawsuit against the Secretary of State and the Attorney General of Idaho, alleging that the drafted ballot language did not contain a clear and concise statement on the effect of a “YES” or “NO” vote. The original “NO” statement, as written by the Secretary of State and Attorney General, provided: "A NO vote would make no change to Idaho’s current law, which protects the life of the unborn while allowing abortion in reported cases of rape or incest, or when necessary to protect the life of the mother. Idahoans United alleged that the “NO” statement, as written, mischaracterized Idaho’s current abortion law, leading voters to believe that Idaho law “allow[s] abortion . . . when necessary to protect the life of the mother,” when the current law only allows abortions to prevent the death of a pregnant person, and used inaccurate and argumentative language such as “protects the life of the unborn.”

Additionally, Idahoans United argued that the “YES” statement similarly violated Idaho law because it was not a clear and concise statement that describes the legal effect of a “YES” vote. The original “YES” statement provided: “A YES vote would establish reproductive rights, including a right to abortion before a fetus's ability to survive and after a fetus's ability to survive in cases of a medical emergency, and provide liability protections for healthcare providers.” Idahoans United argued that the “YES” statement description of fetal viability could confuse voters because if the statement continued on the ballot as written, it would describe the same point in pregnancy (viability) four different ways: in the initiative text, in the short title, in the long title, and in the “YES” statement.

On September 4, 2026, the Idaho Supreme Court ordered the Secretary of State and the Attorney General to rewrite the ballot language after finding the original version failed to comply with state law by not clearly and concisely stating the effects of “YES” and “NO” votes.

Box 1: Updated Idaho Proposition One Ballot Initiative Language

On September 6, 2026, the Idaho Supreme Court approved new ballot initiative language for Proposition One, which provides that:

  • A “YES vote would support creating a right to abortion before fetal viability—defined as a fetus’ ability to survive without extraordinary medical measures—and after fetal viability in cases of medical emergency; providing protections against professional discipline and civil and criminal liability for healthcare providers; and codifying a statutory reproductive right to freedom and privacy.”
  • A “NO vote would support making no change to Idaho’s current law, which preserves the life of preborn children by prohibiting abortion, except when necessary to prevent the death of the pregnant woman, and during the first trimester in documented cases of rape or incest reported to law enforcement.”

If passed, the Reproductive Freedom and Privacy Act could expand access to abortion in Idaho. However, the Act would still face challenges after the election because Idaho allows its legislature to amend or repeal a citizen-initiated statute without restrictions. There are numerous examples where the legislature has reversed or amended the will of the electorate. In 2002, the Idaho legislature repealed citizen-initiated statutes that sought to place term-limits on elected officials. In 2019, the Idaho legislature amended a citizen-initiated statute that expanded Medicaid eligibility.

Ballot Initiatives Seeking to Curtail Abortion Rights 

Missouri 

In 2026, voters in Missouri will again be asked to decide the legal status of abortion in their state, but this time to reverse a recently approved constitutional amendment. In 2024, Missouri voters approved Amendment 3, the Right to Reproductive Freedom Amendment, which amended the state’s constitution to guarantee a right to abortion until fetal viability. Before Amendment 3 was passed, Missouri banned the provision of abortion with exceptions only to avert the death of the pregnant person or to avert a serious risk of substantial and irreversible physical impairment of a major bodily function of the pregnant person. After Amendment 3 passed, Planned Parenthood, one of the abortion providers in the state, filed a lawsuit challenging not only the state’s total abortion restriction, but also a series of regulations on facilities and clinicians providing abortions. These restrictions included a 72-hour waiting period between an initial appointment and when an abortion could be performed, and abortion specific informed consent requirements. The court struck down the abortion restriction, allowing abortion to be legal in the state, but did not block regulations on facilities and clinicians providing abortions while the litigation continues. 

State legislators who oppose abortion rights have drafted a new ballot initiative that seeks to repeal Amendment 3. The 2026 ballot initiative, also known as Amendment 3, would ban the provision of abortion except in cases of medical emergencies, fatal fetal anomalies, or pregnancies 12 weeks or less gestation that are a result of rape or incest. The initiative includes a parental or guardian consent requirement for minors except in medical emergencies and prohibits state funding of abortions in most circumstances. The ballot initiative explicitly allows the legislature to regulate abortion provision, facilities, and providers including, “requiring physicians providing abortion care to have admitting privileges at a nearby hospital; laws requiring facilities where abortions are performed or induced to be licensed and inspected for clean and safe conditions and adequate instruments to treat any emergencies arising from an abortion procedure; laws requiring physicians to perform a sufficient examination of the woman to determine the unborn child's gestational age and any preexisting medical conditions that may influence the procedure; and laws requiring ultrasounds to be performed only by physicians or licensed medical technicians.” In addition, the initiative includes a ban on gender affirming care for minors. 

The 2026 ballot initiative has faced legal scrutiny. On July 2, 2025, the ACLU of Missouri filed a lawsuit against the secretary of state, alleging that the language for the 2026 ballot initiative was intentionally misleading, contained an inaccurate summary, and is unconstitutional because it included more than one subject. The ACLU argued that the language of the ballot initiative failed to properly inform voters that a “yes” vote would lead to a repeal of reproductive rights protections that passed in 2024. The ACLU also contended that the subject of the ballot initiative is related to “reproductive health care,” but includes topics unrelated to reproductive health, including a ban on gender-affirming care for minors. On July 4, 2025, the Missouri Western District Court of Appeals ruled that the language of the 2026 ballot initiative failed to inform voters that the initiative would repeal and replace the 2024 Right to Reproductive Freedom Amendment, and certified new ballot language for the 2026 ballot initiative. The language certified by the court will appear on the November 3, 2026, ballot. This is the first time voters could decide to repeal a state constitutional amendment protecting abortion. Passage of the 2026 ballot initiative would ban the provision of abortion in Missouri and prevent minors from accessing gender affirming care. 

Some Abortion Restrictions Remain in Place After Voters Pass Constitutional Amendments

Voters in Arizona, Ohio, and Missouri passed state constitutional amendments establishing the right to abortion in recent elections. After abortion advocates challenged existing state restrictions on the provision of abortion under the new constitutional amendments, courts have blocked the pre-existing state abortion restrictions. However, legal challenges to existing abortion restrictions such as waiting periods and telemedicine restrictions, have taken longer as courts have not uniformly blocked these provisions. 

On November 5, 2024, Arizona voters passed Proposition 139, a ballot initiative that amended the state constitution to guarantee a right to abortion until fetal viability. The amendment also allows abortions after fetal viability if the physician providing the abortion determines that the abortion is necessary to protect the life or physical or mental health of the pregnant person. After this constitutional amendment became effective in December 2024, advocates filed legal challenges to block Arizona’s 15-week ban on the provision of abortion and other abortion restrictions. In March 2025, a court ruled Arizona’s 15-week ban was unconstitutional under the new amendment. In February 2026, an Arizona state court ruling blocked several abortion restrictions, including: (1) a ban on abortion based on fetal diagnoses; (2) a 24-hour waiting period and (3) a prohibition on telemedicine for abortion care due to new protections granted in the state’s constitutional amendment. However, Republican state legislators who have intervened in the lawsuit may appeal this decision. The Democratic Arizona Attorney General declined to defend the laws on behalf of the state, and therefore it is unlikely the state will appeal. 

There are, however, still abortion restrictions in effect in Arizona, including a ban on state funds for abortion (which affects Medicaid), a parental consent requirement for minors seeking abortions, and a law that bars medical professionals other than doctors from providing abortions. In February 2026, the ACLU of Arizona filed a lawsuit on behalf of advanced practice clinicians, contending the physician-only law violates the constitutional amendment protecting abortion. 

On November 7, 2023, Ohio voters passed Issue 1, a ballot initiative that amended the state constitution to guarantee every individual has the right to make their own reproductive decisions, including contraception, fertility treatment, continuing a pregnancy, miscarriage care, and abortion care. The amendment also allows the state to prohibit abortion after fetal viability; however, an abortion cannot be prohibited after viability if it is necessary to protect the life or health of the pregnant person. After the passage of Issue 1, advocates cited the new amendment in legal challenges to the state’s 6-week ban on the provision of abortion as well as the many other abortion restrictions. In October 2024, the Hamilton County Court of Common Pleas issued a permanent injunction blocking Ohio’s 6-week abortion ban from taking effect, marking the first permanent injunction based on Ohio’s Reproductive Freedom Amendment. Courts have blocked many of the other abortion restrictions as well. One provision that was challenged, but is still in effect, is a requirement for providers to document the reason for an abortion, but this provision does not impact patients’ access to abortion care. Ohio law still requires parental consent for minors seeking abortions and blocks public funding for abortions. 

As was discussed earlier, Missouri voters approved Amendment 3, the Right to Reproductive Freedom Amendment, in 2024, which guarantees a right to make and carry out decisions about all matters relating to reproductive health care, including: prenatal care, childbirth, postpartum care, birth control, abortion care, miscarriage care, and respectful birthing conditions. The amendment also allows the government to regulate abortion after fetal viability; however, it prevents the government from restricting abortion after fetal viability if the abortion is necessary to protect the life, physical or mental health of the pregnant person. After the passage of Amendment 3, a court blocked the state’s ban on the provision of abortion, but many restrictions on abortion (72-hour waiting period and abortion specific informed consent requirements) remain in place and are the subject of ongoing litigation.

Options for Future Citizen-Referred Ballot Measures Are Limited

Citizens are allowed to propose a constitutional amendment for the ballot in 17 states. There are only two states, Arkansas and Oklahoma, with current bans on the provision of abortion which allow for citizen-initiated constitutional amendments and have yet to vote on an abortion measure (Figure 1). There were efforts in Arkansas (where there is a near-total ban on the provision of abortion) to get an initiative on the ballot, but the Arkansas Secretary of State rejected the petition for the initiative because the signatures were not properly gathered, and thus the initiative did not make it to the ballot. The Arkansas Supreme Court upheld this decision. 

Oklahoma has a total ban on the provision of abortion, with an exception only to save the life of the pregnant person, and classifies performing an abortion as a felony. A citizen-led effort to put a state constitutional amendment that would have added an “individual right to reproductive freedom” on the ballot was withdrawn in December 2022, before signature gathering began.

In 2024, in Florida, Nebraska, and South Dakota, abortion rights amendments failed to garner sufficient votes for passage. In Nebraska, voters approved a competing measure to ban the provision of abortion after the first trimester. In South Dakota, the measure failed to pass, only garnering 41% of the votes. In Florida, the initiative received 57% approval. However, state law requires 60% approval for a constitutional amendment. As the popular vote fell just 3 percentage points short of approval, abortion rights supporters in Florida may try again in a future election to reverse the 6-week ban on the provision of abortion. 

Conversely, in states with current abortion protections without a constitutional amendment protecting abortion, only three states (Illinois, Massachusetts, Oregon) have a process for citizen-initiated constitutional amendments. However, in today’s political climate, it is unlikely that new citizen initiatives will be brought to the electorate to weaken existing abortion protections.

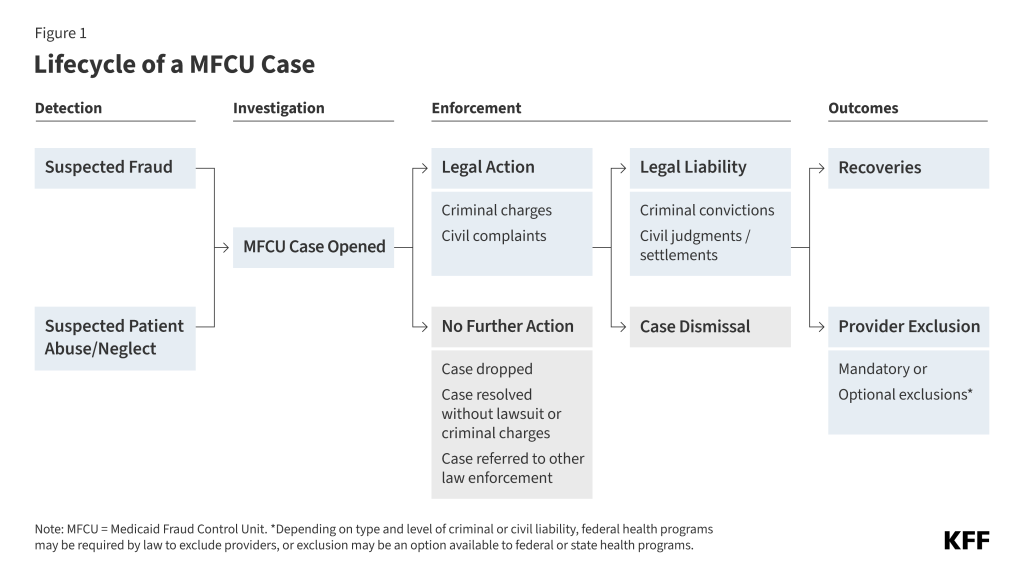
How TrumpRx Brand-Name Drug Prices Compare to Other Countries

Published: Sep 24, 2026

TrumpRx prices for brand-name drugs are about as likely to be higher as lower compared to average prices in other wealthy countries, according to an analysis that compares 32 brand-name drugs (without generics or biosimilars) on the TrumpRx website with publicly available prices in one or more of 11 OECD member countries: Australia, Austria, Belgium, Canada, France, Germany, Japan, the Netherlands, Sweden, Switzerland, and the United Kingdom.

For 17 of the 32 drugs, the TrumpRx price is lower than the average price in comparable countries. This includes five drugs for which the TrumpRx price is lower than the prices available in any of the other countries. Eight drugs have a price that is $100 less than the average in other countries. For the other 15 drugs, the TrumpRx price is higher than the average price in comparable countries. This includes 13 drugs for which the TrumpRx price is higher than prices available in any of the other countries.

The full analysis and other data on health costs are available on the Peterson-KFF Health System Tracker, an online information hub dedicated to monitoring and assessing the performance of the U.S. health system.

News Release

Analysis: Prices for Many Brand-Name TrumpRx Drugs Are Cheaper than the Average Price in Other Wealthy Countries, But Are Almost as Likely To Be More Expensive

Published: Sep 24, 2026

Consumers who buy brand-name prescription drugs without an available generic or biosimilar at the prices available through the new TrumpRx website are about as likely to pay more as pay less for those drugs relative to the publicly listed prices available in other comparatively wealthy countries, a new KFF analysis finds.

The Trump administration has promoted the TrumpRx website as a way for consumers to get the lowest prices for prescription medications in the world, drawing on voluntary pricing agreements with drug manufacturers aimed at securing “Most Favored Nation” prices for American consumers. For many brand-name drugs listed on the website, TrumpRx directs consumers to manufacturers’ discount coupons to get the drugs at a pharmacy without using insurance.

The analysis compares the prices of 32 brand-name drugs listed on the TrumpRx website with those in other countries. Key findings include:

  • For 17 of the 32 drugs, the TrumpRx price is lower than the average price in comparable countries. This includes five drugs for which the TrumpRx price is lower than the prices available in any of the other countries. Eight drugs have a price that is $100 less than the average in other countries.
  • For the other 15 drugs, the TrumpRx price is higher than the average price in comparable countries. This includes 13 drugs for which the TrumpRx price is higher than prices available in any of the other countries.
  • There are wide variations in the price differences between TrumpRx and other countries. For nine of the drugs, the prices on TrumpRx are at least double the average across other countries. This includes Enbrel, a drug used to treat rheumatoid arthritis; the TrumpRx price is $2,725 higher than the average across other countries ($3,354 versus $641).

This analysis compares the TrumpRx drug prices with available prices in Australia, Austria, Belgium, Canada, France, Germany, Japan, the Netherlands, Sweden, Switzerland, and the United Kingdom for the brand-name drugs listed on the TrumpRx site (as of August 25, 2026) that do not have generics or biosimilars available in the U.S. and that had publicly available prices in at least one of the other nations. It does not compare the prices available on TrumpRx now to the prices that may have been available to consumers in the U.S. prior to its launch.

There is no one source of data for drug prices in other countries. In many cases, the publicly listed prices used in the analysis represent the price paid by the government’s national health system, or similar entity, and not necessarily what a consumer living in the country and covered by its health system would pay.

The analysis also examines some of the factors that contribute to differences in prices across countries and through TrumpRx, including the role of government in setting drug prices. The analysis is available through the Peterson-KFF Health System Tracker, an online hub monitoring how well the U.S. health system is operating through cost and quality measures.

VOLUME 55

KFF Women’s Health Survey Explores How Women Navigate Contraceptive Information


Highlights

The 2026 KFF Women’s Health Survey finds that health care providers remain the most trusted source of reliable health information for reproductive-age women. Large shares, though, also report using online sources and social media, and many report being exposed to false or misleading information that can lead to changes in contraceptive use, like starting, changing, or stopping a birth control method.

And as AI tools become more embedded in health care and government, some institutions are developing new AI governance policies around their use, but most government AI policies do not address health, and those that do are largely not public. One Ohio health department’s new AI policy offers a rare look at a health-specific policy, explicitly addressing accuracy and public trust.


KFF Women’s Health Survey Explores Trusted Sources of Information and Exposure to Contraceptive Misinformation

Health care providers remain the most trusted source for reliable health information among reproductive-age women ages 18 to 49. According to the 2026 KFF Women’s Health Survey, more than eight in ten (86%) reproductive-age women said they trust health care providers “a great deal” or “a fair amount” for reliable information, compared with a quarter (25%) who said the same about AI tools and chatbots and fewer (15%) about social media and social media influencers. These findings largely mirror KFF polling among the general public, which has found similarly high trust in doctors and relatively lower trust in AI chatbots for health information.

Figure 3 is a stacked horizontal bar chart titled "Reproductive Age Women Trust Health Care Providers the Most to Provide Reliable Health Care Information" with "A great deal" colored dark blue, "A fair amount" colored blue, "A little" colored green, and "Not at all" colored dark green. The majority of women ages 18 to 49 trust their health care provider and state and local health departments a great deal or fair amount to provide reliable health care information. Women trust social media and AI tools or chatbots the least to provide reliable health care information, with majorities of women also having little trust in federal health agencies and Robert F. Kennedy Jr.

Still, use of online sources for health information is widespread despite this limited trust. A majority (87%) report looking for health information or advice online through internet search engines, social media, or AI tools. Many reproductive-age women report seeing information about contraception on social media, regardless of whether they were looking for it. About a third (35%) say they’d seen or heard something about contraception on social media in the past year, rising to four in ten (42%) among younger women ages 18 to 25.

Many reproductive-age women also report being exposed to false and misleading statements about contraception on social media and elsewhere. About half (53%) of reproductive-age women say they’ve heard the false claim that hormonal contraceptives are harmful to your health, and four in ten (43%) have encountered the incorrect claim that they limit your ability to get pregnant in the future. Both of these claims are contradicted by current evidence. Roughly a third (32%) have seen false claims that natural family planning is as effective as hormonal contraception at preventing pregnancy and that emergency contraceptive pills, such as Plan B, cause abortions, neither of which is accurate.

False or Misleading Statements About Contraception Are Widespread (Split Bars)

Among women who saw contraception-related content on social media, more than a third (36%) went on to search for more information online, one in five (19%) talked to a doctor about what they’d seen, and about one in ten either started or changed to a new birth control method (9%) or stopped using their hormonal birth control (8%) because of what they’d seen, with higher shares of young women ages 18 to 25 doing each of these.

A grouped vertical bar chart titled "One in Ten Younger Women Who Have Seen Something About Contraception On Social Media Have Made a Change to Their Contraceptive Use" and shows women overall ages 18 to 49 in gray, women ages 18 to 25 in green, women ages 26 to 35 in blue, and women ages 36 to 49 in dark blue. Among women who have seen or heard something on social media about contraception, one in three (36%) have sought more information through an online search or AI, one in five (19%) have talked talked to a doctor or health care provider about what they saw or heard, and one in ten (12%) have stopped using hormonal birth control or started or changed to a new birth control method. Higher shares of younger women ages 18 to 25 have done all of these things compared to women ages 36 to 49.

AI & Emerging Technology

Most State AI Policies Overlook Health-Specific Guidance, but One New Example Focuses on Accuracy and Trust

Questions about how generative AI tools could affect public trust and the accuracy of AI-generated information are among factors contributing to new governmental policies around AI use. According to an analysis of publicly available AI policies published last month by the Association of State and Territorial Health Officials (ASTHO), most of these plans focus on government-wide issues, such as data privacy and security, procurement, and vendor requirements. Some provisions, like requirements for human review and disclosure of AI use, may apply to health agencies within those jurisdictions. The analysis found, though, that few of the policies addressed health-specific applications directly, such as evaluating AI tools for disease surveillance or outbreak detection, and most health-specific policies that do exist are not public. 
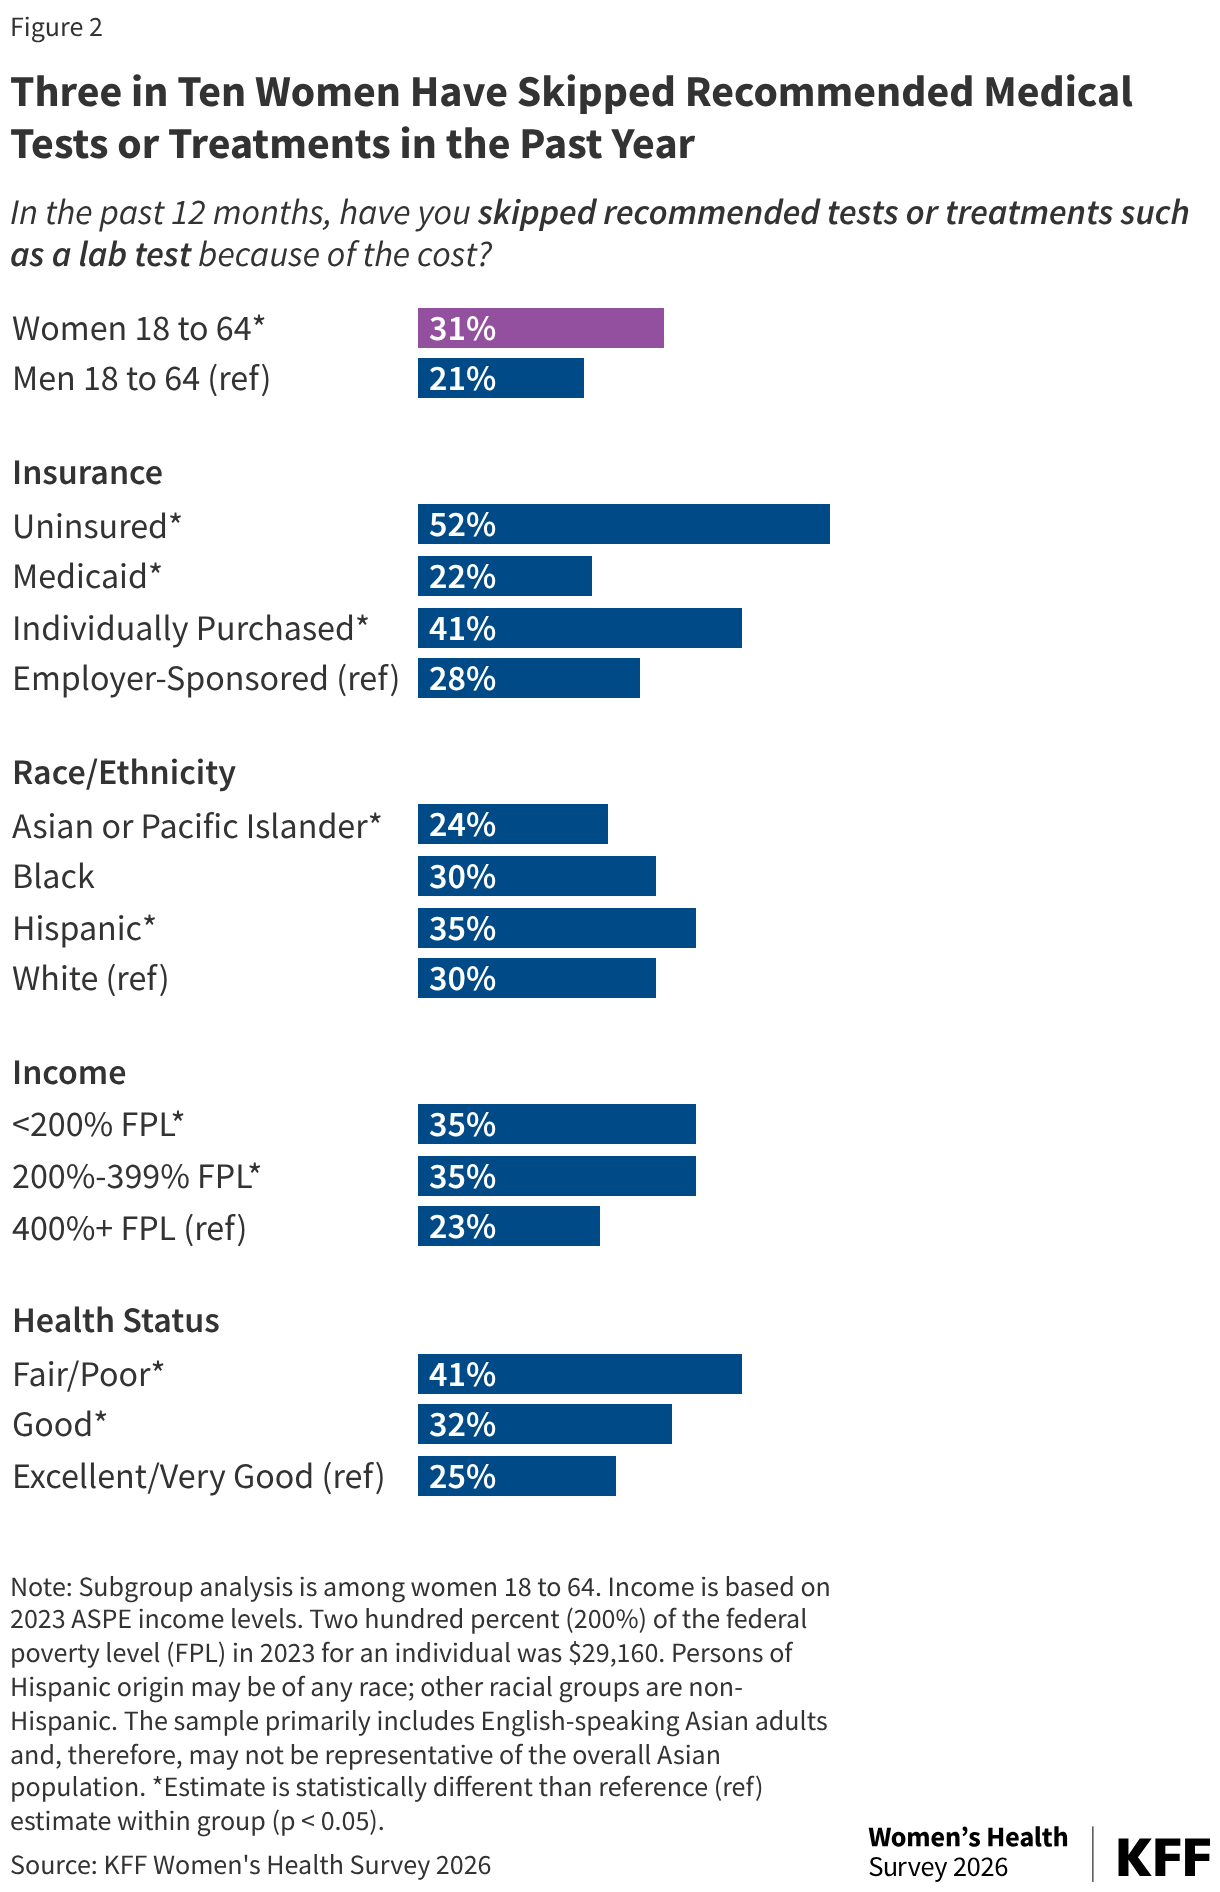
One publicly available example from a health agency comes from the public health department of Ashland County, Ohio, which unanimously approved and released its own AI governance policy last month. The policy provides a look at how one health agency is approaching AI use, explicitly identifying public trust and the accuracy of AI-generated information as core considerations for the responsible use of AI in health care. The policy states that AI should be used in ways that “promote transparency, accountability, and community confidence.” Among other rules, staff are required to verify factual claims, citations, and statistics generated by AI before relying on them, and human review is required for most non-minor uses of AI to ensure accuracy. The policy also establishes an incident reporting framework for when AI-assisted work might include false information, treating errors where hallucinations enter published materials as incidents to be tracked and addressed. Beyond these general rules, the policy lays out health-specific approved AI use cases, including de-identified data analysis in epidemiology, health promotion content in nursing, and inspection communication templates in environmental health. It also states that no AI system may independently make clinical, regulatory, or public health decisions on behalf of the agency.

Because the Ashland County policy is publicly available, it offers the public, other health organizations, and researchers a look at how one health agency is trying to maintain accuracy and protect trust in its use of the technology, which has relatively low trust among the public overall for health information. KFF’s March 2026 Tracking Poll on Health Information and Trust found that a third of adults (33%) said they had a “great deal” or “fair amount” of trust in AI tools or chatbots to provide reliable information about health.

What to Watch Out For

As health agencies continue incorporating AI tools into their work and developing their own more tailored guidelines, could transparently communicating about their approaches to governing AI use impact public trust? More research on what the public expects from agencies using AI could help clarify how these policies might affect confidence in health agencies (which has declined since the COVID-19 pandemic) and the information they provide.

Some Medical Journals Are Responding to a Rise in AI-Generated Citations

Researchers have documented a rise in fabricated references across medical research, with some citations referencing studies that do not exist or do not support the claims attributed to them. One correspondence published earlier this year identified thousands of fake citations across millions of papers, with the rates climbing sharply after generative AI tools became widely available. Many of the references were difficult to distinguish from legitimate studies, pairing real authors and plausible titles with studies that were never published.

Some medical journals have begun to respond to the challenge of AI-fabricated citations, including by requiring disclosure when AI is used, but an analysis of 5,114 journals and over 5.2 million papers found that AI use without disclosure continues despite these policies. JAMA updated its guidance for authors last month in response to the journal’s own experience receiving manuscripts with inaccurate or nonexistent references and research showing that rates of author disclosure of AI use in submissions to their journal have remained low. Rather than requiring disclosure when AI contributes to references, JAMA’s approach advises against using AI to generate, format, or manage citations, and directs authors to standard reference managers instead.

Why This Matters

Fabricated citations carry the appearance of legitimate sourcing, making them difficult to catch without deliberate verification. Disclosure policies alone have not solved the problem, leading one major journal to move toward restricting AI’s use for generating references rather than asking authors to report it.


What We're Watching

As Trust in Federal Health Information Declines, Poll Suggests That Transparency and Data Can Make Information Seem Trustworthy

Public trust in information from the federal government has declined since 2024, according to a new survey from the AP-NORC Center for Public Affairs Research and USAFacts. The share of adults expressing “a great deal” or “quite a bit” of trust in federal information about health care has fallen ten points in the past two years, from 26% to 16%, with similar declines for federal information about the environment (21% to 12%), jobs and unemployment (25% to 15%), and elections and politics (22% to 13%). The findings mirror trends in KFF’s own polling on Health Information and Trust.

The NORC survey also points to what factors shape whether people consider information credible. When asked to rate the importance of various factors when considering whether information was factual, explaining how the information was gathered ranked highest, with seven in ten (71%) saying this was “extremely” or “very” important. Information presenting more than one viewpoint was also important to most adults (63%), as was not including opinions (56%).

A separate question asked how likely people would be to consider information factual given specific characteristics. Being based in data ranked highest, with six in ten (60%) saying that would be “extremely” or “very” likely to consider such information factual. Verification mattered too, though importance differed by source. About half (49%) said they would consider information factual if it was verified by scientists, while fewer said the same about academic institutions (39%) or the federal government (19%). The smallest shares said they would consider information factual if it was verified by AI chatbots (9%).

Why This Matters

As trust in federal health agencies continues to decline, health communicators may need to consider what factors could make their communication appear more credible. The NORC survey indicates that explaining how information was gathered or offering data-based verification may be effective in building credibility.

About The Health Information and Trust Initiative: the Health Information and Trust Initiative is a KFF program aimed at tracking health misinformation in the U.S., analyzing its impact on the American people, and mobilizing media to address the problem. Our goal is to be of service to everyone working on health misinformation, strengthen efforts to counter misinformation, and build trust. 


View all KFF Monitors

The Monitor is a report from KFF’s Health Information and Trust initiative that focuses on recent developments in health information. It’s free and published twice a month.

Sign up to receive KFF Monitor
email updates


Support for the Health Information and Trust initiative is provided by the Robert Wood Johnson Foundation (RWJF). The views expressed do not necessarily reflect the views of RWJF and KFF maintains full editorial control over all of its policy analysis, polling, and journalism activities. The data shared in the Monitor is sourced through media monitoring research conducted by KFF.

Women’s Health Care Affordability Challenges

Findings from the 2026 KFF Women's Health Survey

Published: Sep 23, 2026

Affordability has dominated national conversations. High inflation rates, increased gas and grocery prices, and the constant rise in health care costs and insurance premiums have emerged as major political issues. Historically, national surveys find that many Americans report difficulties affording health care and have problems paying for health care services, particularly women, who have lower incomes, fewer financial resources, and use the health care system more than men. In recent years, people with health coverage have increasingly experienced difficulties affording care. The 2026 KFF Women’s Health Survey was fielded between March 11, 2026 to April 14, 2026 to better understand women’s experiences accessing and using health care services including barriers to care. The survey is a nationally representative survey of 4,688 women, ages 18 to 64, and 1,148 men, ages 18 to 64. This brief provides new information about the affordability challenges women report experiencing in the past 12 months and their impact on access and utilization of health care services.1
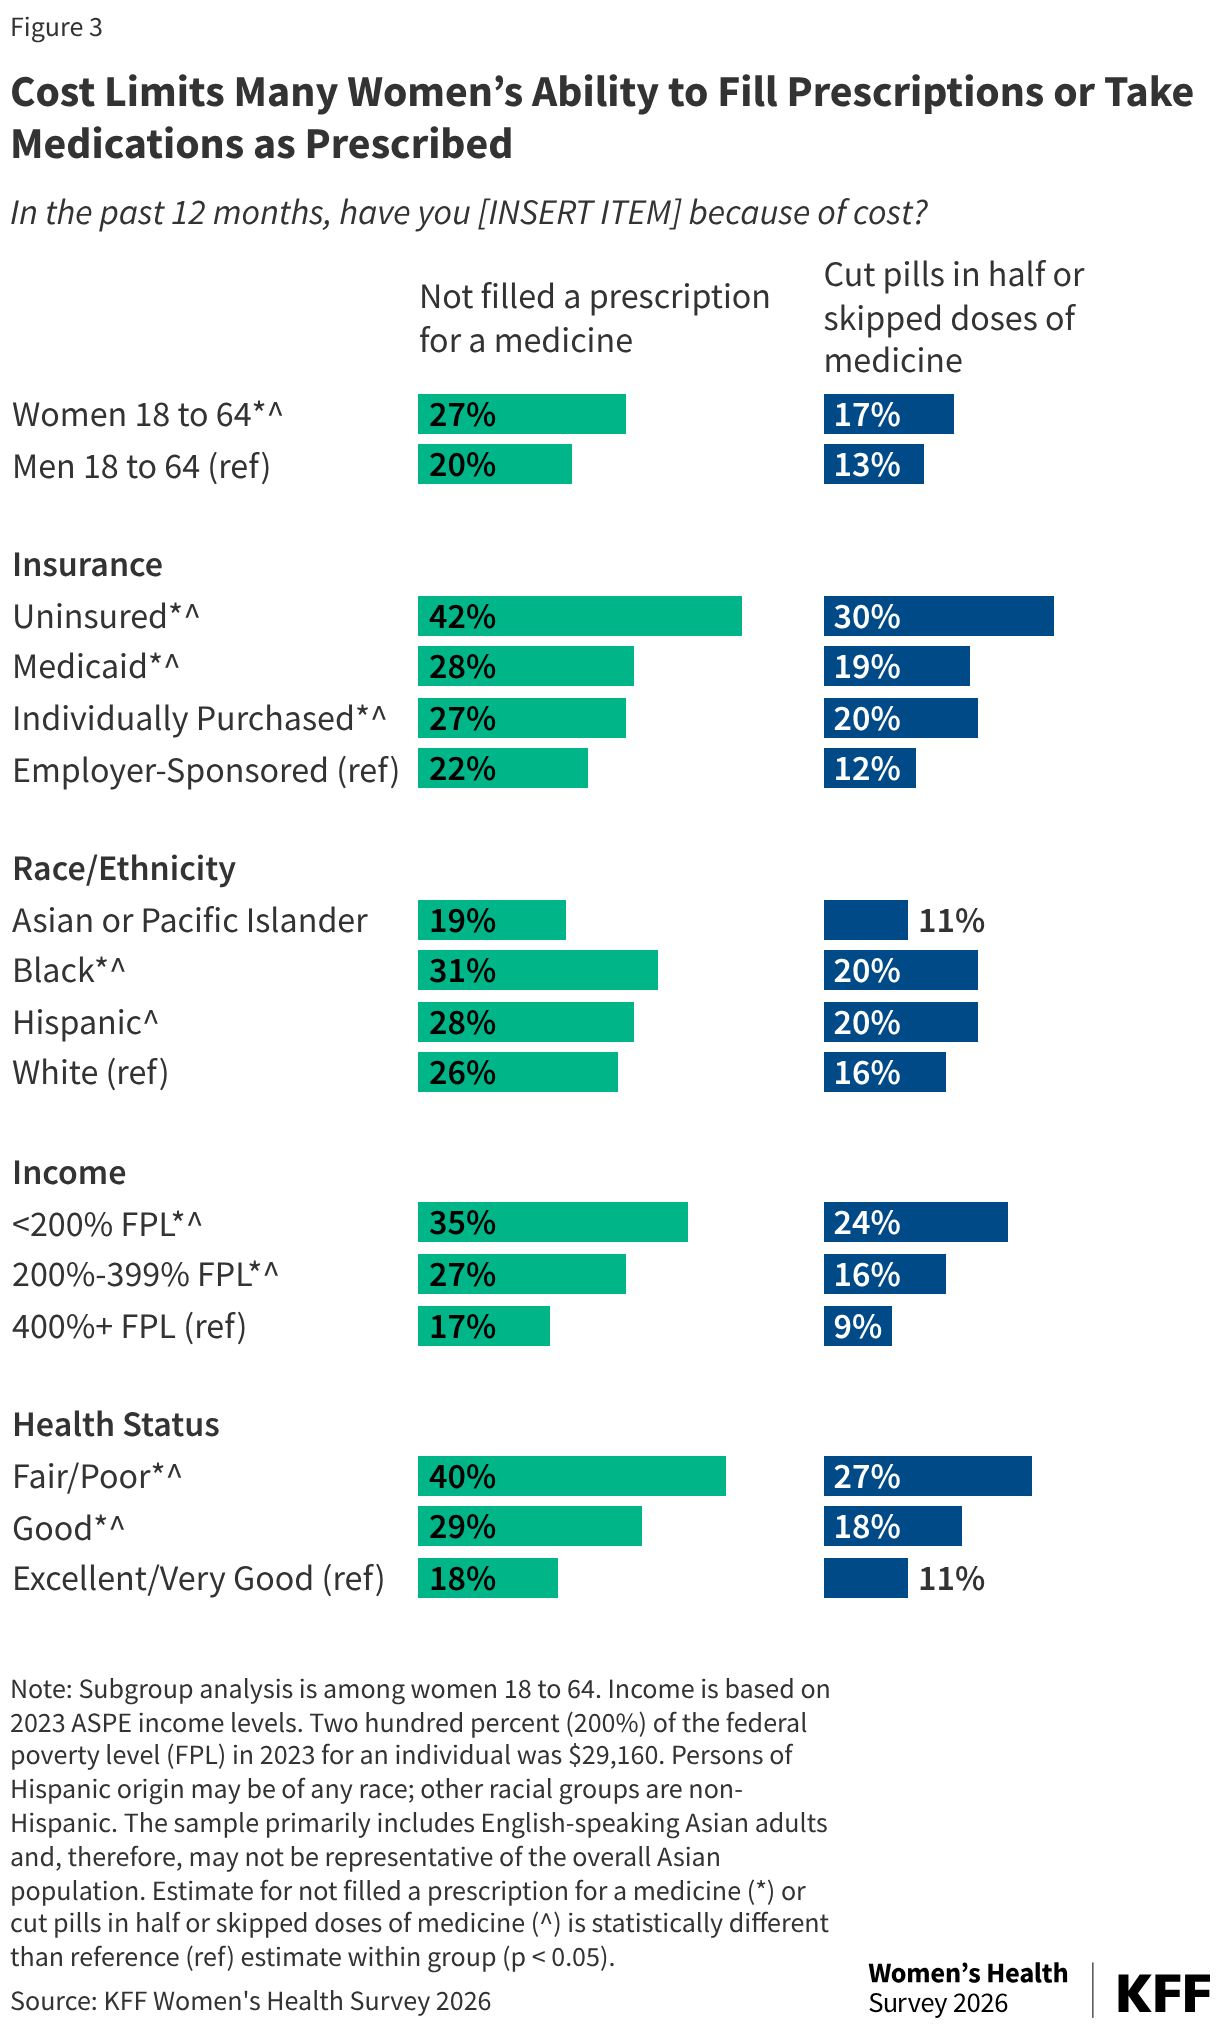
Key Findings

  • Many women, even those with insurance coverage, have delayed or postponed care they thought they needed in the past 12 months because of cost. Four in ten (42%) women, ages 18-64, and 35% of men, ages 18-64, report they have delayed or postponed care they thought they needed in the past year. While about two-thirds (68%) of uninsured women report putting off needed care due to costs, those with insurance are not immune from this problem. Half of women with individually purchased plans and a third of women with Medicaid (34%) and employer sponsored coverage (38%) report delaying or postponing needed care because of cost. 
  • The cost of care is a barrier to a sizable minority of women in getting specific recommended tests and treatments. Three in ten (31%) women ages 18 to 64 report they have skipped or postponed recommended medical tests or treatments in the past year because of costs. Higher shares of uninsured women, women with low or modest incomes, and those with self-reported fair or poor health report skipping or postponing tests or treatments due to the costs of care.
  • The cost of prescription drugs leads some women to alter their prescription drug use by not filling prescriptions, skipping doses, or cutting pills in half. A quarter (27%) of women ages 18 to 64 report they didn’t fill a prescription in the last year because of cost and almost a fifth (17%) report they cut pills in half or skipped doses of medicine because of cost. Four in ten women in fair or poor health didn’t fill prescriptions and one quarter cut pills or skipped doses because of costs.
  • Health care costs can force some women to make tradeoffs in paying for other basic needs. One in four (25%) women ages 18 to 64 report that in the past 12 months they have spent less money on their basic needs, such as food, clothes and electricity so they could have enough money for health care. Among uninsured women, the share was 42%. Approximately three in ten women on Medicaid or with individually purchased insurance, who were Black or Hispanic, low-income or in fair or poor health report making health-related financial tradeoffs.

Affordability Challenges

Four in ten (42%) women report that they delayed or postponed care they thought they needed because of the cost in the last 12 months. While women and men both can feel the impact of health costs, such as insurance premiums, co-payments, and deductibles, they can be particularly burdensome for women who on average earn lower wages, have fewer financial assets, accumulate less wealth, and have higher rates of poverty than men. Four in ten (42%) women and 35% of men ages 18 to 64 report they have delayed or postponed care they thought they needed. One in three women (31%) report they have skipped recommended tests or treatments, over a quarter (27%) report they haven’t filled a prescription for a medicine, and 17% report they have cut pills in half or skipped recommended doses of medicine, all because of cost. Half of women and four in ten (42%) men report one of these cost delays or gaps in the past 12 months.

Many women, even those with insurance coverage, report having delayed or postponed care because of cost. Nearly seven in 10 (68%) uninsured women say theydelayed or postponed care in the past 12 months because of the cost. While younger adults, those with lower incomes, poor health and people of color have higher uninsured rates, even after controlling for these characteristics in a regression model, the association between being uninsured and delaying or postponing care remains. Even women with insurance are susceptible to cost barriers (Figure 1). Half of women ages 18 to 64 with individually purchased plans, which often have higher deductibles and premiums as well as narrower networks, report cost was a reason for delaying or postponing care in the past 12 months, as do 38% of women with employer sponsored plans. Medicaid, the national health coverage program for people with low incomes, is supposed to have only nominal out of pocket costs, but a third (34%) of women with Medicaid coverage also say they had to delay or postpone care due to costs. While Medicaid copayments are modest, they could still be a financial burden for low-income people. Women could also face challenges paying for uncovered services or services during a period when they were uninsured. Women with lower incomes, Hispanic women, and women with fair/poor and good health are also more likely to report having delayed or postponed care in the past year.
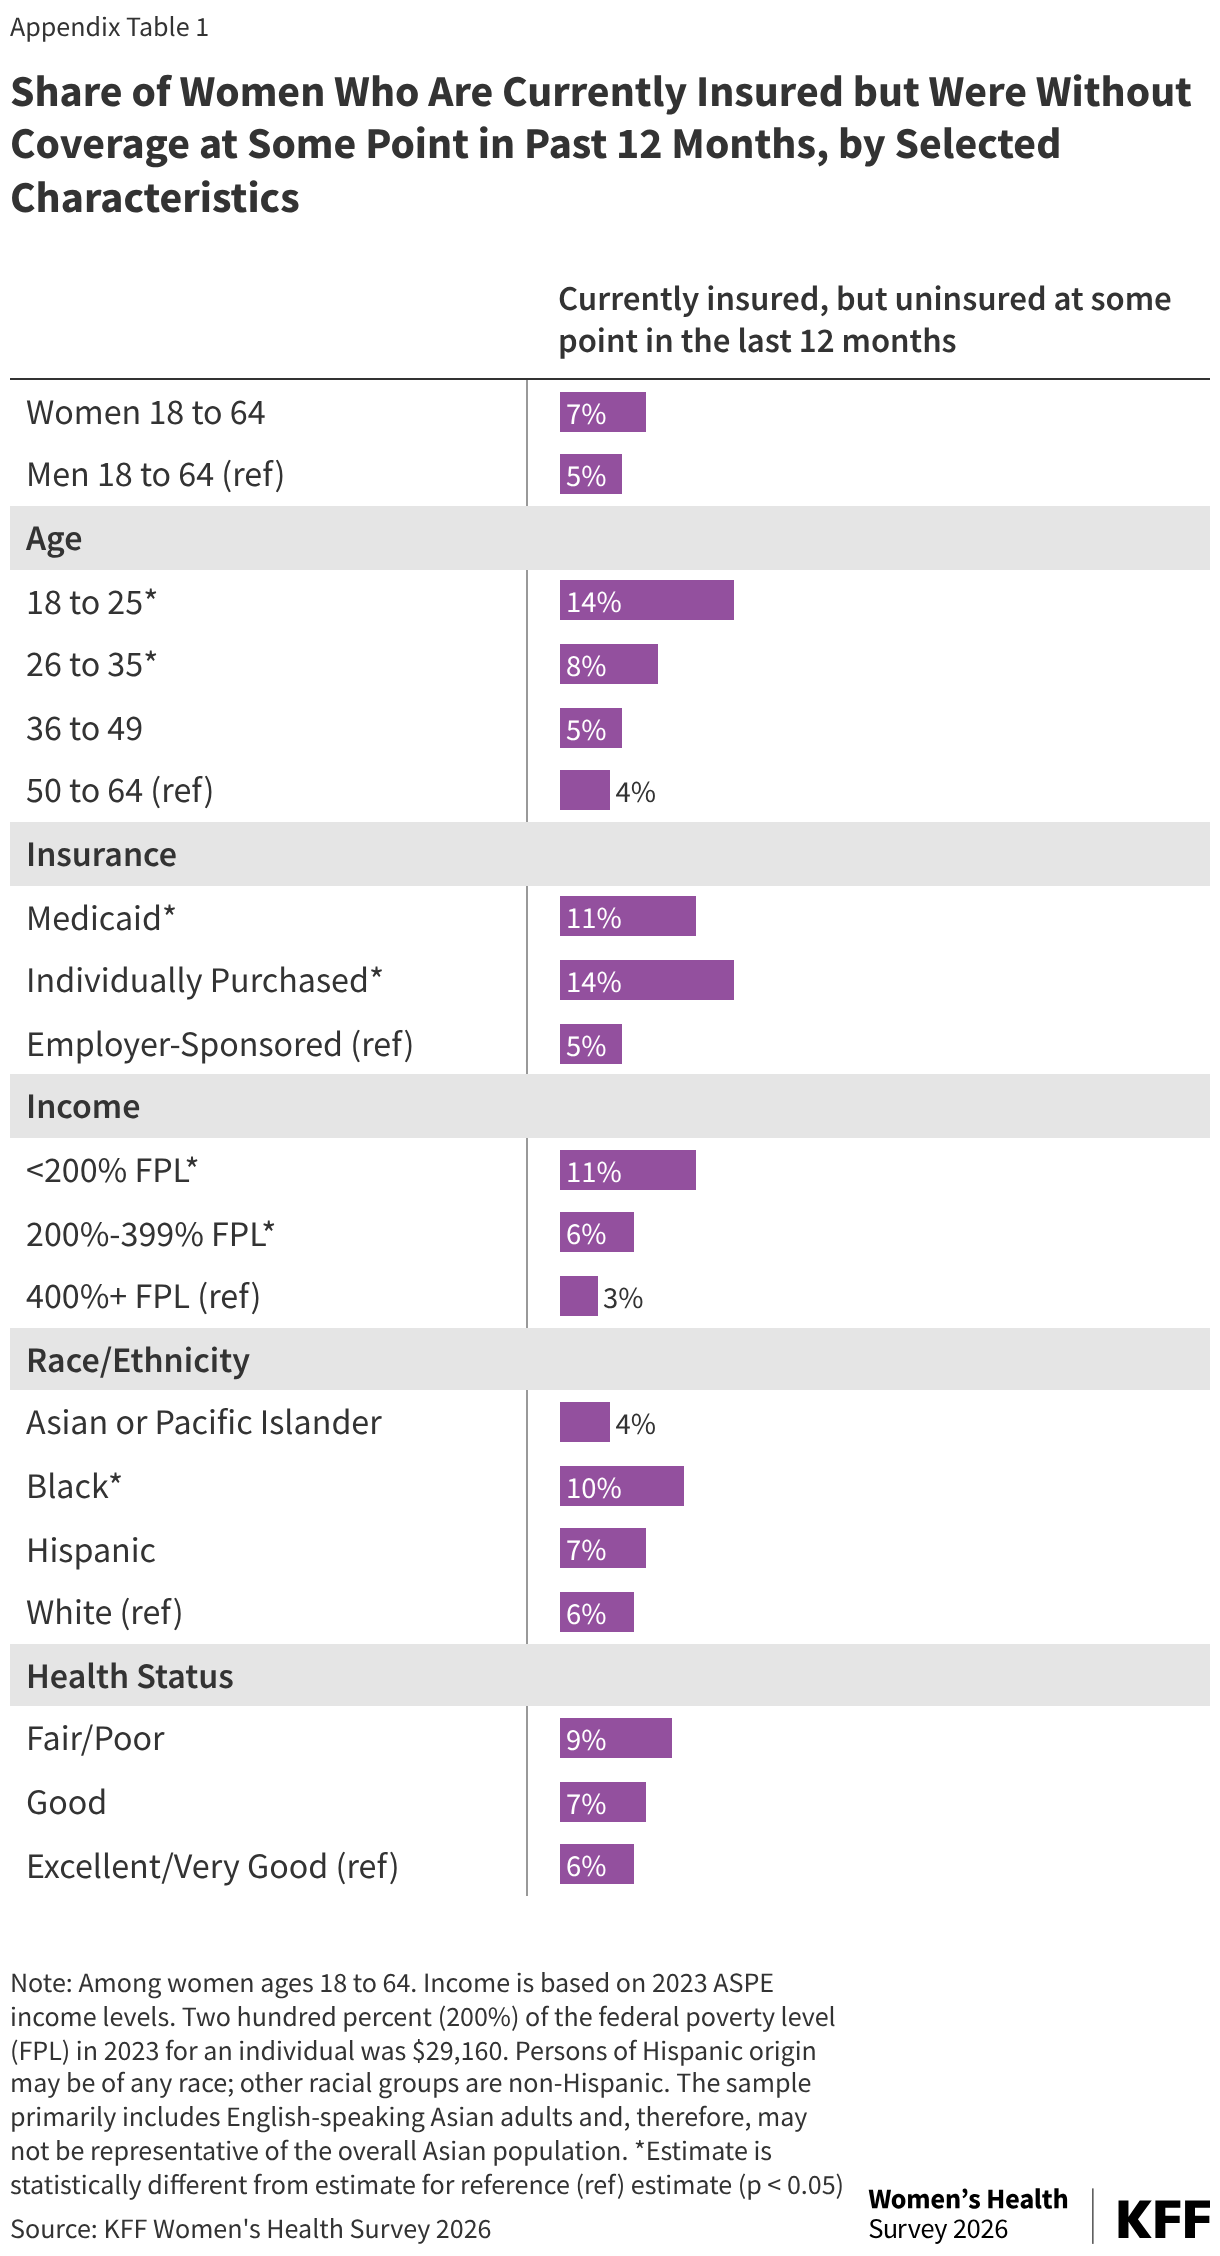
Bar chart showing the share of women ages 18–64 who delayed or postponed needed care in the past 12 months because of cost, overall and by insurance, race/ethnicity, income, and health status. Forty-two percent of women delayed care, compared with 32% of men. Delayed care was highest among uninsured women (68%), women with fair or poor health (56%), and women with incomes below 200% of the federal poverty level (48%).

High costs can cause many women to skip specific recommended tests and treatments, even women with health coverage. Half (52%) of uninsured women ages 18 to 64 report skipping recommended tests or treatments due to cost, as do four in ten (41%) of women with individually purchased health plans, three in 10 (28%) women with employer sponsored plans, and one in five (22%) of women with Medicaid coverage (Figure 2). Higher shares of women with self-reported fair/poor health (40%) or good health (32%) report skipping recommended tests or treatments in the past year compared to a quarter of women (23%) who rate their health as excellent/ very good. Hispanic women and women with low or modest incomes (up to 399% FPL) are also more likely to report skipping recommended services compared to their White and higher income counterparts.

Bar chart showing the share of women who skipped recommended medical tests or treatments because of cost. Overall, 31% skipped care, with higher rates among uninsured women (52%), women with individually purchased coverage (41%), Hispanic women (35%), women with incomes below 400% of the FPL (35%), and women in fair or poor health (41%).

Cost limits women’s ability to fill their prescriptions or take their medications as prescribed. The majority of women ages 18 to 64 (62%) report they take at least one prescription medication on a regular basis, yet many women report issues affording prescription drugs. A quarter (27%) of all women ages 18-64, report they didn’t fill a prescription in the last year and almost a fifth (17%) report they cut pills in half or skipped doses of medicine because of cost. Among the share who report currently taking a prescription medication, the share who say they have not filled a prescription increases to 32% and one in five say they have cut pills in half or skipped doses in the past year because of cost.

Women with self-reported fair/poor and good health and women with lower incomes are more likely to report they have either not filled a prescription or taken medications as prescribed. A higher share of uninsured women report not filling a prescription (42%) or taking medication as prescribed (17%), but substantial shares of insured women also report having trouble with their prescriptions because of cost in the past 12 months (Figure 3).

Bar chart showing the share of women ages 18 to 64 who skipped filling a prescription or cut pills/skipped doses in the past 12 months because of cost, broken down by insurance, race/ethnicity, income, and health status. Cost-related barriers are highest among uninsured women, those with lower incomes, and those in fair or poor health, while women with employer-sponsored insurance, higher incomes, and better health report the lowest rates.

Health care costs can force women to make tradeoffs in paying for other basic needs. One in four (25%) women ages 18 to 64 report that in the past 12 months they have spent less money on their basic needs, such as food, clothes and electricity so they could have enough money for health care (Figure 4). Four in ten (39%) women without insurance and three in ten women with Medicaid (31%) coverage and individually purchased coverage (30%) report spending less in their basic needs to have enough money for health care compared to one in five (18%) women with employer-sponsored plans. This is more common amongwomen with lower incomes, Black and Hispanic women, as well as women with poorer self-reported health status.

Bar chart showing the share of women ages 18 to 64 who spent less on basic needs like food, clothes, or electricity in the past 12 months so they'd have enough money for health care, broken down by insurance, race/ethnicity, income, and health status. About one in four women overall report doing this, with the share notably higher among uninsured women, Black and Hispanic women, those with lower incomes, and those in fair or poor health.

The majority of women 18 to 64 report they are insured, but almost one in five women 18 to 64 (18%) report they are either currently uninsured or were uninsured at some point in the past 12 months. Health insurance coverage is an important factor in making health care affordable and accessible to women.Seven percent of women say they are currently insured but were uninsured at some point during the past 12 months. Women can be uninsured for periods of time because of job loss or change, premium prices becoming unaffordable, or in the case of dependent coverage, a spouse’s job loss, divorce, or widowhood. Younger women, women with lower incomes and women with poor/fair health are uninsured at higher rates and larger shares report being currently insured but having been uninsured at some point during the year (Appendix Table 1).

Women with Medicaid coverage (11%) and those with individually purchased private plans (14%) are more likely to report having been uninsured at some point in the past 12 months compared to women covered by an employer-sponsored plan (5%) (Figure 5). In the coming years, the number of uninsured is expected to increase significantly due to recent federal policy changes in Medicaid and the expiration of the ACA enhanced tax credits. Many women with Medicaid coverage and ACA marketplace plans will be directly impacted by these policy changes and will likely see more periods without insurance coverage.

Three pie charts showing the share of women ages 18 to 64 who are currently insured but were uninsured at some point in the past 12 months, broken out by current insurance type. Women with Medicaid or individually purchased plans are notably more likely to have had a coverage gap during the year than those with employer-sponsored insurance.
Bar chart showing the share of currently insured women ages 18 to 64 who were without coverage at some point in the past 12 months, broken down by age, insurance type, income, race/ethnicity, and health status. Younger women and those with Medicaid, individually purchased plans, or lower incomes report the highest rates of a coverage gap during the year.

The 2026 KFF Women’s Health Survey was designed and analyzed by women’s health researchers at KFF. The survey was conducted from March 11 – April 14, 2026, online and by telephone among a nationally representative sample of 5,854 adults ages 18 to 64, including 3,538 women ages 18 to 49. Women include anyone who selected woman as their gender. Sampling, data collection, weighting, tabulation, and IRB approval by the University of Southern Maine’s Collaborative Institutional Review Board were managed by SSRS of Glenn Mills, Pennsylvania in collaboration with women’s health researchers at KFF.

Throughout the reports of findings, we refer to “women.” This includes respondents who said their gender is “woman,” and includes those who selected “woman” in addition to another gender, such as “transgender,” or “non-binary,” or another gender. We followed this approach to try to include as many people as possible but recognize that some people who need and seek abortion and other reproductive health care services may not be represented in the findings or identify as women. Some questions about sexual and reproductive health were only asked among those with a specific sex assigned at birth (i.e. male or female).

The national sample was drawn from two nationally representative probability-based panels: the SSRS Opinion Panel and the Ipsos Knowledge-Panel. The SSRS Opinion Panel is a nationally representative probability-based panel where panel members are recruited randomly in one of two ways: (a) Through invitations mailed to respondents randomly sampled from an Address-Based Sample (ABS) provided by Marketing Systems Groups (MSG) through the U.S. Postal Service’s Computerized Delivery Sequence (CDS); (b) from a dual-frame random digit dial (RDD) sample provided by MSG. For the online panel component, invitations were sent to panel members by email followed by up to five reminder emails. 5,660 panel members completed the survey online and panel members who do not use the internet were reached by phone (n=194). Another 514 respondents were reached online through the Ipsos Knowledge Panel to help reach adequate sample sizes among subgroups of interest, specifically women ages 18 to 49. This panel is recruited using ABS, based on a stratified sample from the CDS. The questionnaire was translated into Spanish, so respondents were able to complete the survey in English or Spanish. 

The national sample was weighted by splitting the sample into three groups: [1] Women 18-49, [2] Women 50-64, and [3] Men 18-64 and each group was separately weighted to match known population parameters (see table below for weighting variables and sources). Weights within the three groups were then trimmed at the 4th and 96th percentiles, to ensure that individual respondents do not have too much influence on survey-derived estimates. After the weights were trimmed, the samples were combined, and the weights adjusted, so that the groups were represented in their proper proportions for a final combined, gender by age-adjusted weight.

DimensionsSource
CPS 2024 Voting and Registration SupplementCurrent Population Survey 2025
Education
Age by Education
Age by Gender
Census Region
Race/Ethnicity by Nativity
Home Tenure
Civic Engagement2023 CPS Volunteering and Civic Life Supplement
Internet FrequencyPew Research Center’s National Public Opinion Reference Survey (NPORS 2025)
Population DensityClaritas Pop-Facts Premier 2026
Voter RegistrationCPS 2024 Voting and Registration Supplement

The margins of sampling error for the national sample of women ages 18 to 64 and reproductive age women ages 18 to 49 are plus or minus 2 percentage points. Numbers of respondents and margins of sampling error for key subgroups are shown in the table below. For results based on other subgroups, the margin of sampling error may be higher. Sampling error is only one of many potential sources of error and there may be other unmeasured error in this survey.

GroupN (unweighted)M.O.S.E.
National Women Ages 18-644,688± 2 percentage points
White, non-Hispanic2,262± 2 percentage points
Black, non-Hispanic767± 4 percentage points
Hispanic1,135± 4 percentage points
Asian or Pacific Islander347± 6 percentage points
18-25508± 5 percentage points
26-351,313± 3 percentage points
36-491,715± 3 percentage points
50-641,152± 3 percentage points
<200% FPL1,641± 3 percentage points
200%-399% FPL1,232± 3 percentage points
400%+ FPL1,475± 3 percentage points
Employer-Sponsored2,490± 2 percentage points
Individually Purchased386±6 percentage points
Medicaid977± 4 percentage points
Uninsured537± 5 percentage points

General Notes:

The sample primarily includes English-speaking Asian adults and, therefore, may not be representative of the overall Asian adult population. Despite this limitation, it is important to report the views of Asian adults on the topics in this study. As always, Asian adults’ responses are incorporated into the general population figures throughout this report.

Income is based on 2023 ASPE income levels. Two hundred percent (200%) of the federal poverty level (FPL) in 2023 for an individual was $29,160.

Endnote

  1. The data in this brief report affordability challenges for adults ages 18 to 64. Other KFF polling data includes estimates for all adult women and men, including those 65 and older. ↩︎