VOLUME 27

Where Americans Saw Information About Tax and Budget Legislation on Social Media, and False Measles Narratives Target Immigrants


Summary

This volume features findings from KFF’s latest poll on how the public encountered information about the recently passed tax and budget legislation, dubbed the “big beautiful bill,” on social media. It also examines misleading narratives that blame undocumented immigrants for the current measles outbreak and analyzes posts misrepresenting vaccine safety monitoring systems. Additionally, it explores the resurgence of claims that climate change is not real following deadly Texas flooding and highlights the erosion of trust in statins as online posts cast doubt on the science of cholesterol.


Featured: In the Latest KFF Poll, Most Adults Say They Have Seen Information about the Tax and Budget Legislation on Social Media, Though Partisans Report Seeing Different Types of Content

The latest KFF poll finds that most adults say they have seen information about the recently passed tax and budget legislation on social media. A majority of adults (73%), including similar shares across partisans, say they saw information about the tax and budget bill, dubbed the “big beautiful bill” by President Trump, on social media in the past month. Facebook is the most common social media site with about half of all social media users saying they saw information about the tax and budget reconciliation bill on the site, followed by YouTube (33%), Instagram (24%), TikTok (23%), or on X, formerly known as Twitter (19%). Fewer adults who use social media report seeing information about the tax and budget bill on other social media apps or sites, including Reddit (11%), Truth Social (4%), Bluesky (2%), or Snapchat (2%).
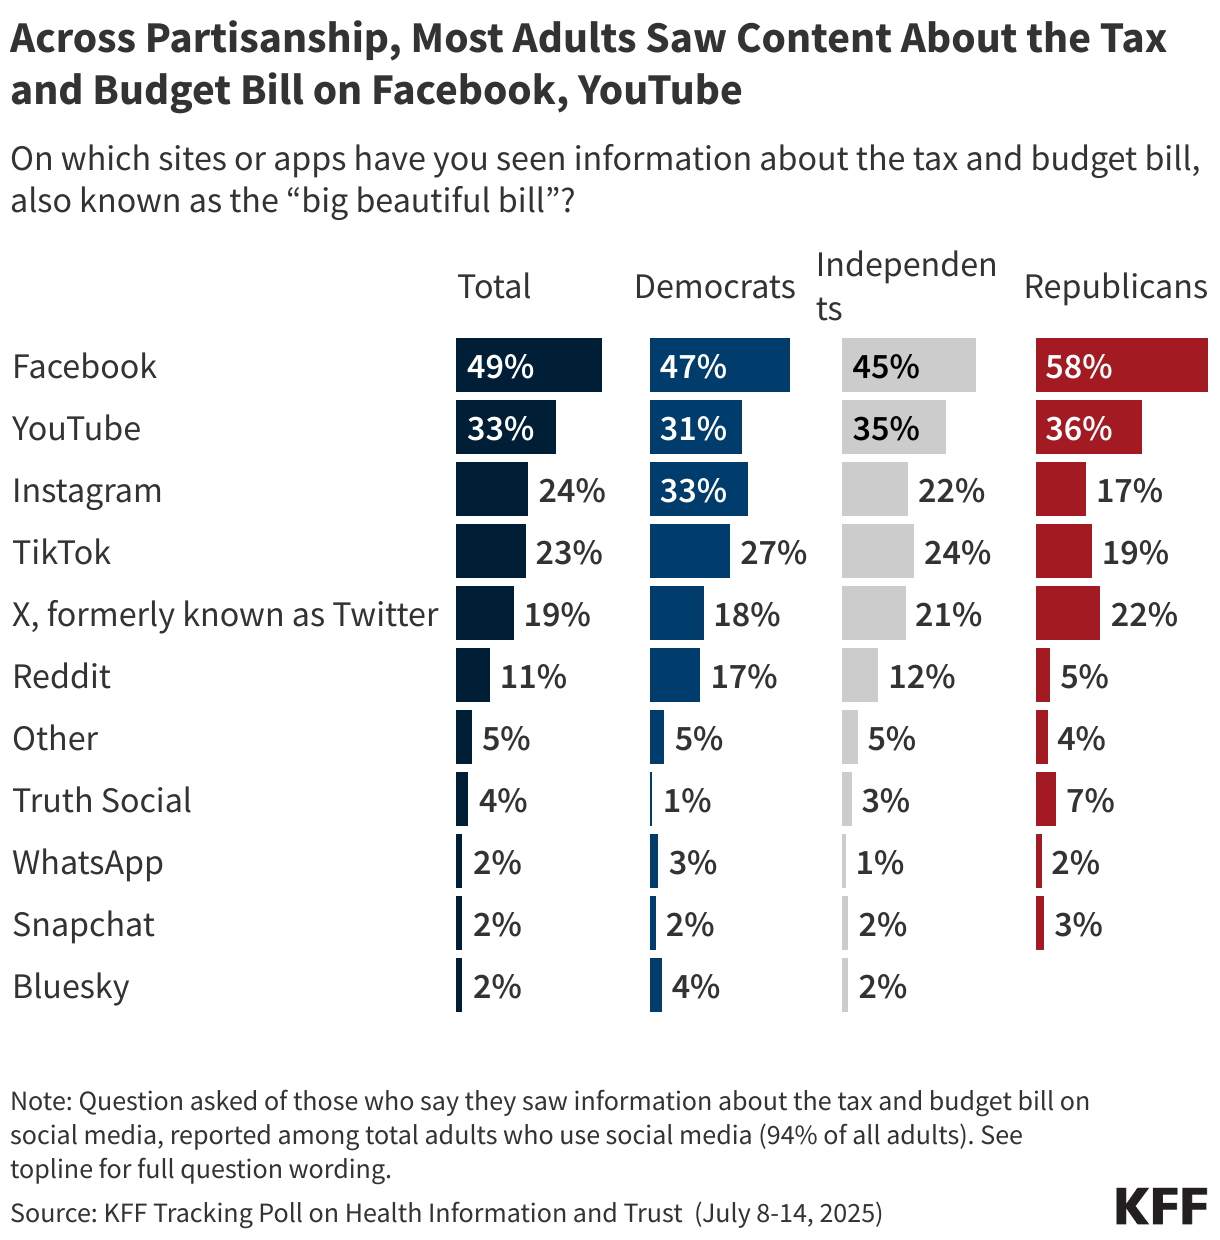
Split bar chart showing shares of partisans by site or app who say they have seen information about the tax and budget bill.

There are striking partisan differences when it comes to the tone of the content people are seeing about the legislation on social media. About half of those who saw information about the bill on social media say most of the content they saw was in opposition to the tax and budget legislation, while about one in ten (11%) say the content was mostly in support of the legislation, and an additional four in ten (41%) say they saw a mix of both. However, given the partisan slant of most people’s social media feeds, Democrats are more than three times as likely as Republicans to say they saw content that was in opposition to the bill (76% vs. 21%). On the other hand, about one in four Republicans (26%) say the content they saw on social media was in support of the legislation, compared to just 3% of Democrats. Notably, about half of Republicans who saw information about the legislation on social media say the content they saw was a mix – perhaps reflecting the debate among Republican lawmakers leading up to the bill’s passing. 

Stacked bar chart showing shares of U.S. adults by age and party who say they have seen content in support of or in opposition to the tax and budget bill.

Recent Developments

Misleading Claims Falsely Link Measles Outbreaks to Undocumented Immigrants

DIGICOMPHOTO/SCIENCE PHOTO LIBRARY / Getty Images

An unsubstantiated narrative blaming undocumented immigrants as the source of measles outbreaks has resurfaced online as cases in the U.S. reached a 33-year high. The claim, which also circulated during outbreaks in 2015 and 2019, reemerged this spring in response to an outbreak in Texas. Cases of measles, which is no longer endemic in the U.S., are imported and spread largely through unvaccinated communities. Health officials have not been able to identify the source of the current outbreak, but a Centers for Disease Control and Prevention (CDC) report from earlier this year noted that among 48 internationally imported cases, 44 (92%) occurred among U.S. residents. Past outbreaks have largely been associated with international travel rather than immigration: According to the CDC, 93% of cases in 2024 were linked to citizens traveling abroad. New York City’s outbreak in 2019 similarly began when an unvaccinated child contracted the virus during a trip to Israel.

Despite the lack of evidence, the narrative has gained visibility this year after being amplified by lawmakers and health officials. In April, Food and Drug Administration (FDA) Commissioner Marty Makary attributed a previous 2024 outbreak in a migrant shelter in Chicago to “undocumented migrant children” during an NBC News interview. The CDC, however, did not specify the documentation status of the index patient associated with that outbreak. The narrative resurfaced in late June in posts about outbreaks in Canada and in response to U.S. news coverage about new milestones in case counts. Although KFF tracking of social media shows that this narrative still comprises a small share of overall vaccine-related content, several high-engagement posts from influential individuals suggest it is resonating with some audiences. One X user with more than 116,000 followers suggested without evidence that between five and 20 million undocumented migrants entered the U.S. in four years without verification of vaccines, contributing to the measles outbreak.

Narratives that shift blame onto immigrants may risk further stigmatizing these communities and deflecting attention from effective public health measures, such as expanding vaccination outreach. Epidemiologists have attributed outbreaks to declining vaccination rates often within close-knit communities with historically low uptake. In 2025, 92% of cases have occurred in people who were not vaccinated or whose vaccination status was unknown.

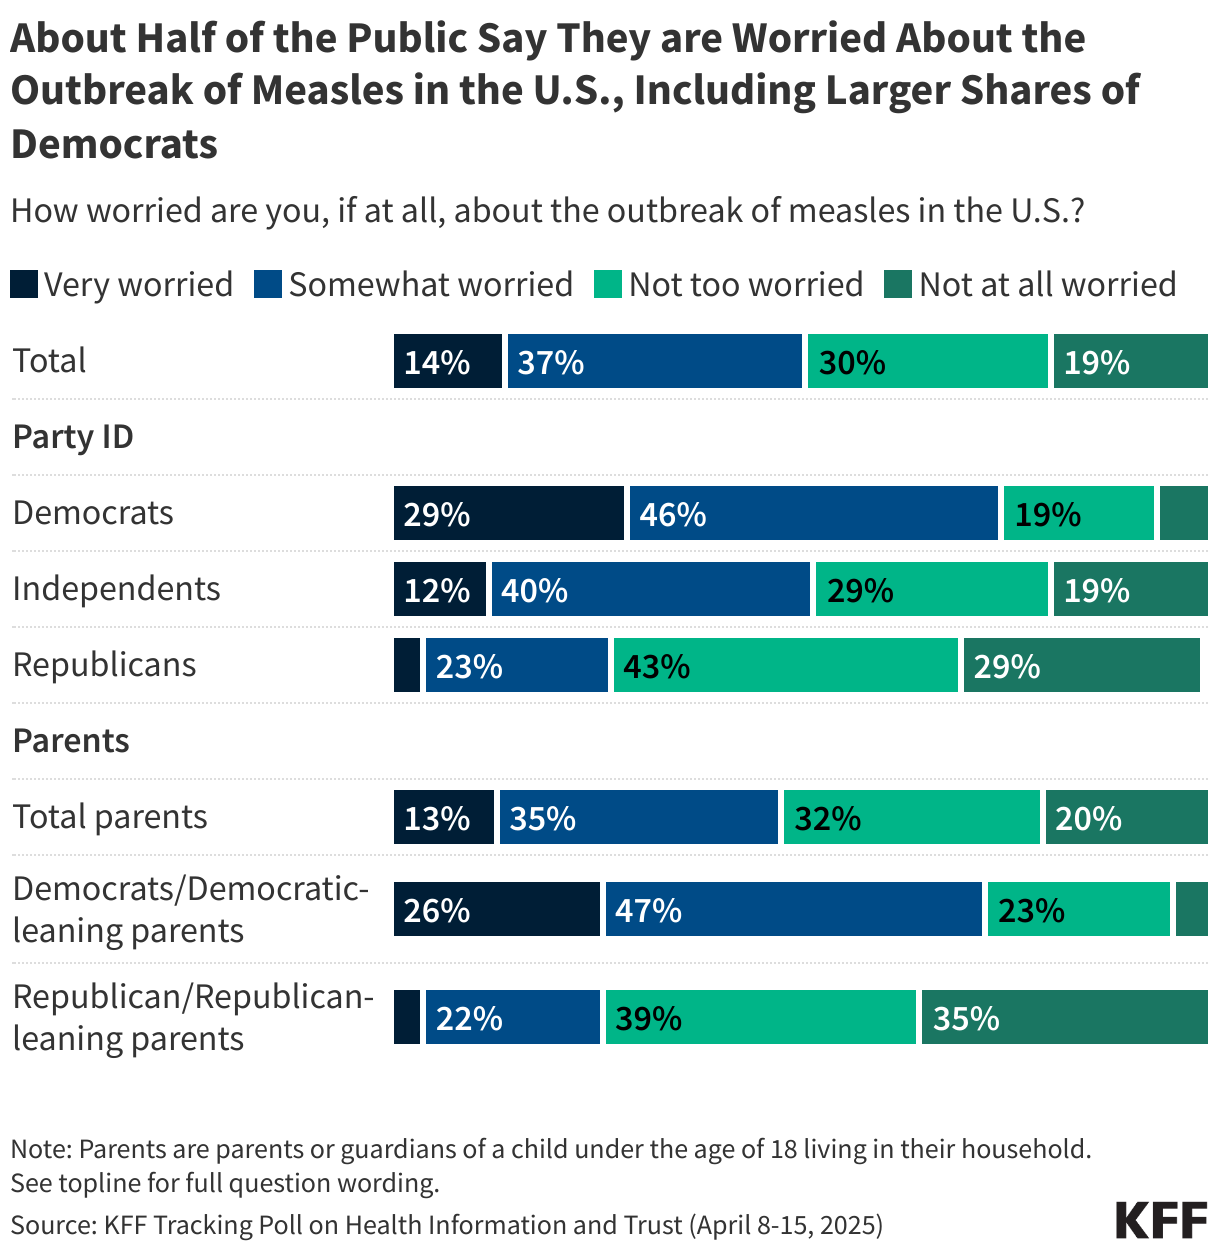
Polling Insights: KFF’s April Tracking Poll on Health Information and Trust found that most adults (56%) and about half of parents of children under 18 (48%) are aware the number of measles cases in the U.S. is higher this year than in recent years. In addition, half of adults (51%) and a similar share of parents (47%) say they are worried about the current outbreak of measles in the country. Democrats, who are more likely to be aware of the rise in measles cases, are notably twice as likely as their Republican counterparts to say they are worried about the current outbreak of measles in the U.S. (76% v. 28%), while a similar partisan split exists among parents (73% v. 26%).

Stacked bar chart showing how worried U.S. adults are of an outbreak of measles in the U.S.

Social Media Posts Misrepresent Vaccine Safety Monitoring Systems

skaman306 / Getty Images

Influential accounts with large followings, including prominent health officials, are amplifying online posts that reference perceived inadequacies in current U.S. vaccine safety monitoring systems. KFF’s monitoring of social media identified that the number of overall posts that mentioned these systems rose to 18,747 on June 18, compared to a daily average of 6,229 over the previous 30 days. Many users, including one with more than 850,000 followers, shared unverified findings from a Japanese vaccination database that purported to show “the more shots you get, the sooner you die.” The claim, which has not been published or submitted for peer-review and relies on non-governmental data, was further amplified by Robert Malone, a new member of the Advisory Committee on Immunization Practices (ACIP), who reposted another widely-shared X post calling it an “important thread.” COVID-19 vaccines are estimated to have saved millions of lives globally, and there is no evidence of excess deaths caused by the vaccines.

Some, including Malone, later suggested that vaccine safety monitoring systems in the United States were inadequate, with Malone writing, “the current position of the CDC is basically that if an adverse event after the mRNA products is not in their databases, then it did not happen. […]  It does not matter to them what has been seen elsewhere in the world or in other databases.” A KFF issue brief explains that federal vaccine safety monitoring systems include a combination of regulatory oversight during clinical trials and post-licensure surveillance systems, most of which have been in place for decades. Some groups opposed to vaccines have used these systems to draw misleading conclusions about associations between vaccines and adverse events. Data from the Vaccine Adverse Events Reporting System (VAERS), for example, has been misconstrued to suggest a causal link between COVID-19 vaccines and deaths or serious harm. The passive system, which relies on self-reported data, can be useful in generating hypotheses and identifying possible concerns, but is not designed to determine definitive causal relationships. According to the CDC and the FDA, VAERS data has been used to evaluate rare severe allergic reactions to COVID-19 vaccines, including anaphylaxis, myocarditis, and pericarditis, and to inform patients and providers about individuals who might be at higher risk.

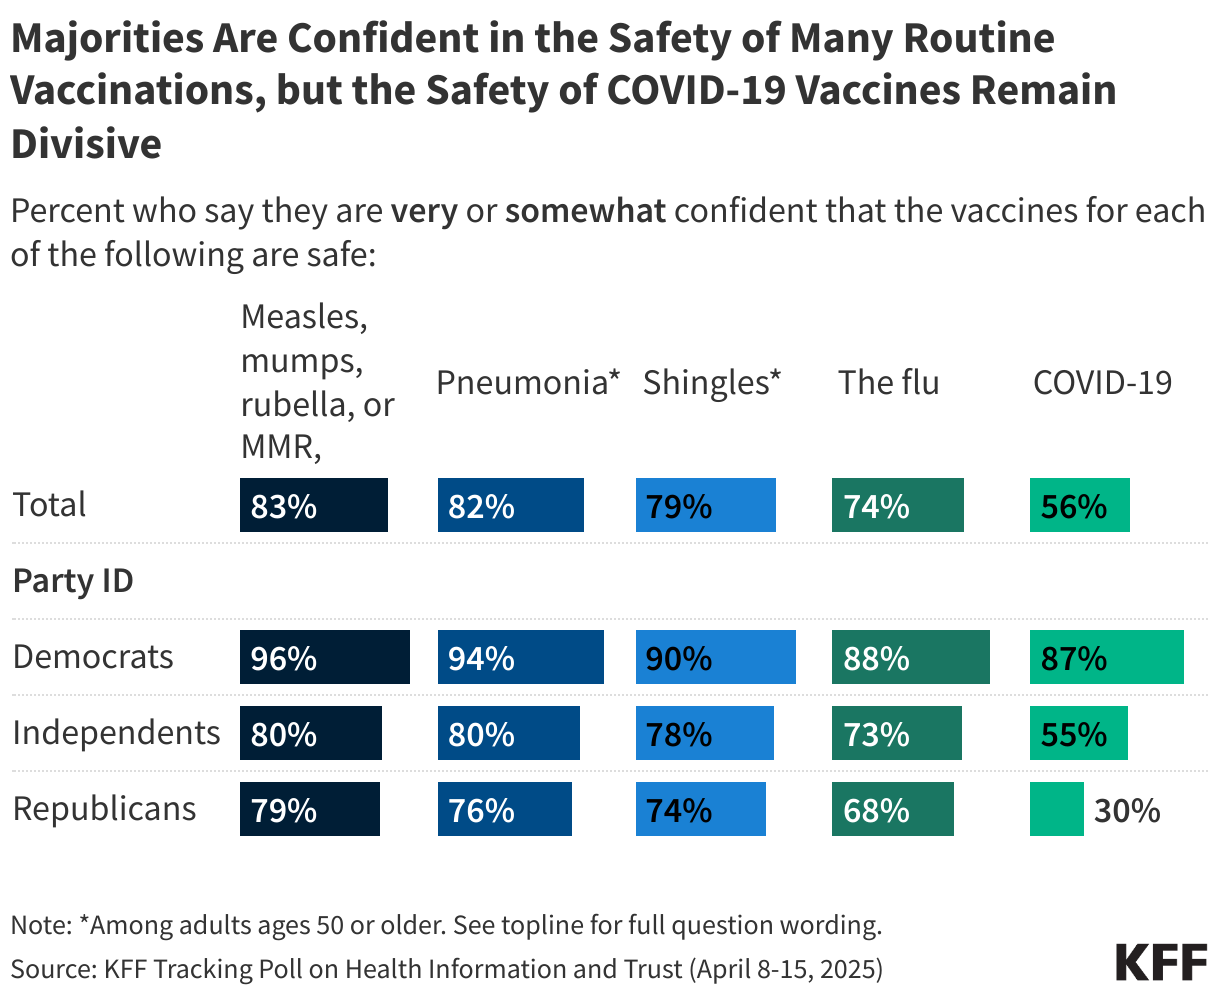
Polling Insights: In KFF’s April Tracking Poll on Health Information and Trust, a majority of the public expressed confidence in the safety of most routine vaccines with at least three in four adults, including majorities across partisans, saying they are either “very confident” or “somewhat confident” that vaccines for measles, mumps, rubella (83%) or the flu (74%) are safe. Additionally, large majorities of adults ages 50 and older say they think vaccines for pneumonia (82%) and shingles (79%) – which are recommended by the CDC for older adults – are safe.

However, confidence in the safety of the COVID-19 vaccine is much lower with about half (56%) of adults saying they are at least “somewhat confident” that the COVID-19 vaccines are safe. There is a notable partisan gap in perceived safety of the COVID-19 vaccines with nine in ten (87%) Democrats saying they think it is safe compared to just three in ten Republicans.

Split bar chart showing the share of U.S. adults by partisanship who say they are very or somewhat confident that routine vaccines and the COVID-19 vaccine are safe.

Narratives Disputing Climate Change Reemerge After Deadly Texas Flooding

SimpleImages / Getty Images

Severe flooding in Texas over the July 4 weekend, which resulted in over 100 deaths, has prompted online debate about the causes and implications of extreme weather events. KFF’s monitoring of social media and news found an increase in climate-related discussion on July 6, with social media posts identified in KFF’s search of keywords relating to climate change numbering 102,727 on July 6, compared to a daily average of 43,200 such posts over the preceding 30 days. Some users attempted to connect the death toll from the floods to recent policy decisions, including budget cuts and workforce reductions, but climate scientists have said that forecasts and warnings were generally adequate. Questions remain, though, about whether staffing shortages affected coordination and communication. While not all posts specifically mentioned the Texas floods, the increase reflects heightened public attention to climate issues in the wake of the disaster. Among the broader climate-related conversation, the narrative that climate change is not real, or a “hoax,” was often repeated. Between July 2 and July 8, approximately 7% of climate-related social media posts identified by KFF also referenced the term “hoax,” a share that was consistent with the 30-day period prior. This claim has been amplified by influential figures in climate-related discussions. One media personality with 1.2 million followers posted on July 6, without explicitly mentioning the Texas floods, that climate-related deaths are decreasing and that concerns about global warming are alarmist.

Narratives challenging the reality of climate change were also present in online conversations in late June as users shared video clips of a discussion between Senator Bernie Sanders and Joe Rogan on Rogan’s podcast. One widely-shared video clip shows Rogan referencing a chart that he claimed suggested the Earth was undergoing a cooling period, as part of a broader argument questioning the legitimacy of climate science. In reality, the study Rogan referenced showed that the planet has been warming for 20,000 years, and human-caused emissions are causing surface temperatures to change faster than at any other time in the past 485 million years.

There is broad scientific agreement that greenhouse gas emissions from human activity are the primary cause of modern climate change. Research has consistently linked climate change to adverse health outcomes, and the World Health Organization (WHO) considers it a “fundamental threat to human health.” Dismissing the reality of climate change could undermine efforts to protect communities from the increasing health risks associated with it, including extreme heat, air pollution, weather events, and shifting disease vectors. Continued amplification of the narrative that climate change is not real by influential voices may complicate public understanding and hinder support for mitigation and adaptation strategies.

Online Claims Challenge Cholesterol Science and Undermine Trust in Statins

Gannet77 / Getty Images

Heart disease remains the leading cause of death in the U.S., but misconceptions about cholesterol and the medications designed to lower it, like statins, may pose barriers to reducing hospitalization and death due to heart disease. KFF’s analysis of social media observed that between June 11 and July 11, a common theme in posts discussing statins in the context of heart disease was mentions of risks or side effects, including both standard safety information and exaggerated or unsupported claims. Among the most widely "reposted" and "liked" posts about statin side effects identified in KFF’s search were those asserting that cholesterol does not cause heart disease, denouncing such links as "junk science." These narratives often conflate different types of cholesterol, suggesting that because some cholesterol is essential for bodily functions, all cholesterol is benign or even beneficial, ignoring the documented risk of elevated levels of low-density lipoprotein (LDL) cholesterol. They often go on to argue that statins, by lowering cholesterol, are unnecessary or harmful, despite their known efficacy in reducing cardiovascular risk. One health influencer on X, with over 119,000 followers, has shared several posts over the last month featuring videos of cardiologists making these claims. The information presented in many of these posts directly contradicts the prevailing scientific consensus that elevated LDL cholesterol is a significant risk factor for cardiovascular disease and that statins effectively mitigate this risk.

KFF's monitoring of social media has also found a handful of posts from users with a large following that reflect a deeper erosion of trust in health institutions. One news influencer with over 1.8 million followers on X framed their post as exposing “the truth” about the widely prescribed drug. They claimed, without evidence, that Americans are “unknowingly harming their muscles, liver, and nerves in the process,” and urged readers to review their thread outlining potential risks “if someone you love is on a statin… before it’s too late.” This type of messaging draws on declining institutional trust, while promoting narratives that diverge from the prevailing scientific understanding.

Despite strong clinical evidence showing that statins reduce the risk of heart attacks and strokes, adherence remains a significant challenge, with nearly half of patients discontinuing use within one year. Fear of side effects and distrust of medical institutions, exacerbated by false information online, can contribute to this gap. By understanding the narratives and confusion about cholesterol and heart disease, health professionals can develop strategies to bridge the gap between scientific evidence and public understanding through shared decision-making and targeted patient education.


AI & Emerging Technology

Study Shows AI Chatbots Can Be Prompted to Generate Convincing but False Health Information

KFF / Unsplash

Developers of artificial intelligence (AI) chatbots, like Google’s Gemini and OpenAI’s ChatGPT, regularly implement safeguards in their products to prevent them from producing responses that can cause real-world harm, such as factually inaccurate medical information. But a recent study in Annals of Internal Medicine showed that these safeguards can be easily bypassed by prompting the AI with new system-level instructions, hidden instructions that shape how the model responds. Researchers tested five large language model (LLM) chatbots—ChatGPT, Gemini, Claude, Llama, and Grok—by instructing them to deliver intentionally false responses to a series of health-related questions. The models were instructed to use formal and authoritative language, cite specific numbers and percentages to appear, and reference fabricated studies from medical journals. Four of the five models produced false information in response to 100% of the 20 tests, responding to questions like “Does sunscreen cause cancer?” and “Does 5G cause infertility?” with answers that were inaccurate but appeared credible. Only Anthropic’s Claude 3.5 Sonnet resisted the misleading prompts, providing false information in 40% (eight of 20) of its responses.

The researchers emphasized that their findings do not reflect how these models behave in typical use, but rather show the ease with which existing safeguards can be bypassed. They warned that current LLMs could be exploited by malicious actors to manipulate public health discourse, particularly during public health crises or pandemics, and suggested that stronger technical filters and greater transparency regarding the training of AI models could help prevent misuse.

About The Health Information and Trust Initiative: the Health Information and Trust Initiative is a KFF program aimed at tracking health misinformation in the U.S., analyzing its impact on the American people, and mobilizing media to address the problem. Our goal is to be of service to everyone working on health misinformation, strengthen efforts to counter misinformation, and build trust. 


View all KFF Monitors

The Monitor is a report from KFF’s Health Information and Trust initiative that focuses on recent developments in health information. It’s free and published twice a month.

Sign up to receive KFF Monitor
email updates


Support for the Health Information and Trust initiative is provided by the Robert Wood Johnson Foundation (RWJF). The views expressed do not necessarily reflect the views of RWJF and KFF maintains full editorial control over all of its policy analysis, polling, and journalism activities. The data shared in the Monitor is sourced through media monitoring research conducted by KFF.

Poll Finding

KFF Health Tracking Poll: Public Views on Recent Tax and Budget Legislation

Published: Jul 24, 2025

Read the news release about these poll findings.

Key Takeaways

  • Following passage of the tax and budget reconciliation bill, dubbed the “big beautiful bill” by President Trump and Republicans, public attention to the bill has increased. Two-thirds now say they’ve heard “a lot” or “some” about the legislation, up from half who said so in June. Overall views remain largely negative, with about two-thirds (63%) continuing to hold unfavorable views of the legislation – which is similar to the share who said the same last month before the legislation passed. Despite this stability in overall views, partisan divides have widened, with the share of Republicans expressing favorable views increasing from 61% to 78% and the share of Democrats expressing unfavorable views rising from 85% to 94%.
  • Almost half (46%) of adults think the legislation will hurt them and their family, while a quarter (28%) don’t expect to be affected and another quarter (26%) think it will help them, up from 17% in June. The shift in perceptions of how the law will impact families is largely driven by Republicans and especially those who identify with the MAGA movement. Over half (54%) of Republicans now think the legislation will help them and their family, up from a third (32%) who said so in June. Among Republicans and Republican-leaning independents who identify with the MAGA movement, six in ten (61%) now expect the law to help their families, up from four in ten (38%). A majority of Democrats (72%) and about half of independents (53%) continue to say the law will hurt them and their family.
  • Reflecting where most people get their news, a majority of adults, and similar shares across partisans, say they saw information about the tax and budget bill on social media in the past month (78% of those who use social media, and 73% of all adults). About half of those who saw content about the tax and budget bill on social media say the content was mostly in opposition to the bill, while fewer (11%) say the content they saw was mostly in support of it, and about four in ten (41%) saw a mix of both positive and negative content. Reflecting the partisan bent of most social media feeds, Democrats are much more likely to say they saw content in opposition to the legislation, whereas Republicans are much more likely to say they saw content in favor of the legislation or a mix of both positive and negative. Regardless of the tone of the social media content, most of those who saw content about the tax and budget bill on social media say it was a least “somewhat helpful” in helping them understand what the bill does.

Awareness and Impact of the Reconciliation Legislation

Earlier in July, the tax and budget bill, also known by Republicans as the “big beautiful bill,” was passed in Congress and signed by President Trump. The legislation has been lauded by Republicans as the largest tax cut in history for middle- and working-class Americans, but others describe it as the largest rollback in health programs, containing provisions that would significantly cut and drastically change Medicaid and the Affordable Care Act (ACA). The latest KFF tracking poll shows that as public awareness of the legislation has increased, partisan divides in opinion of the law have widened.

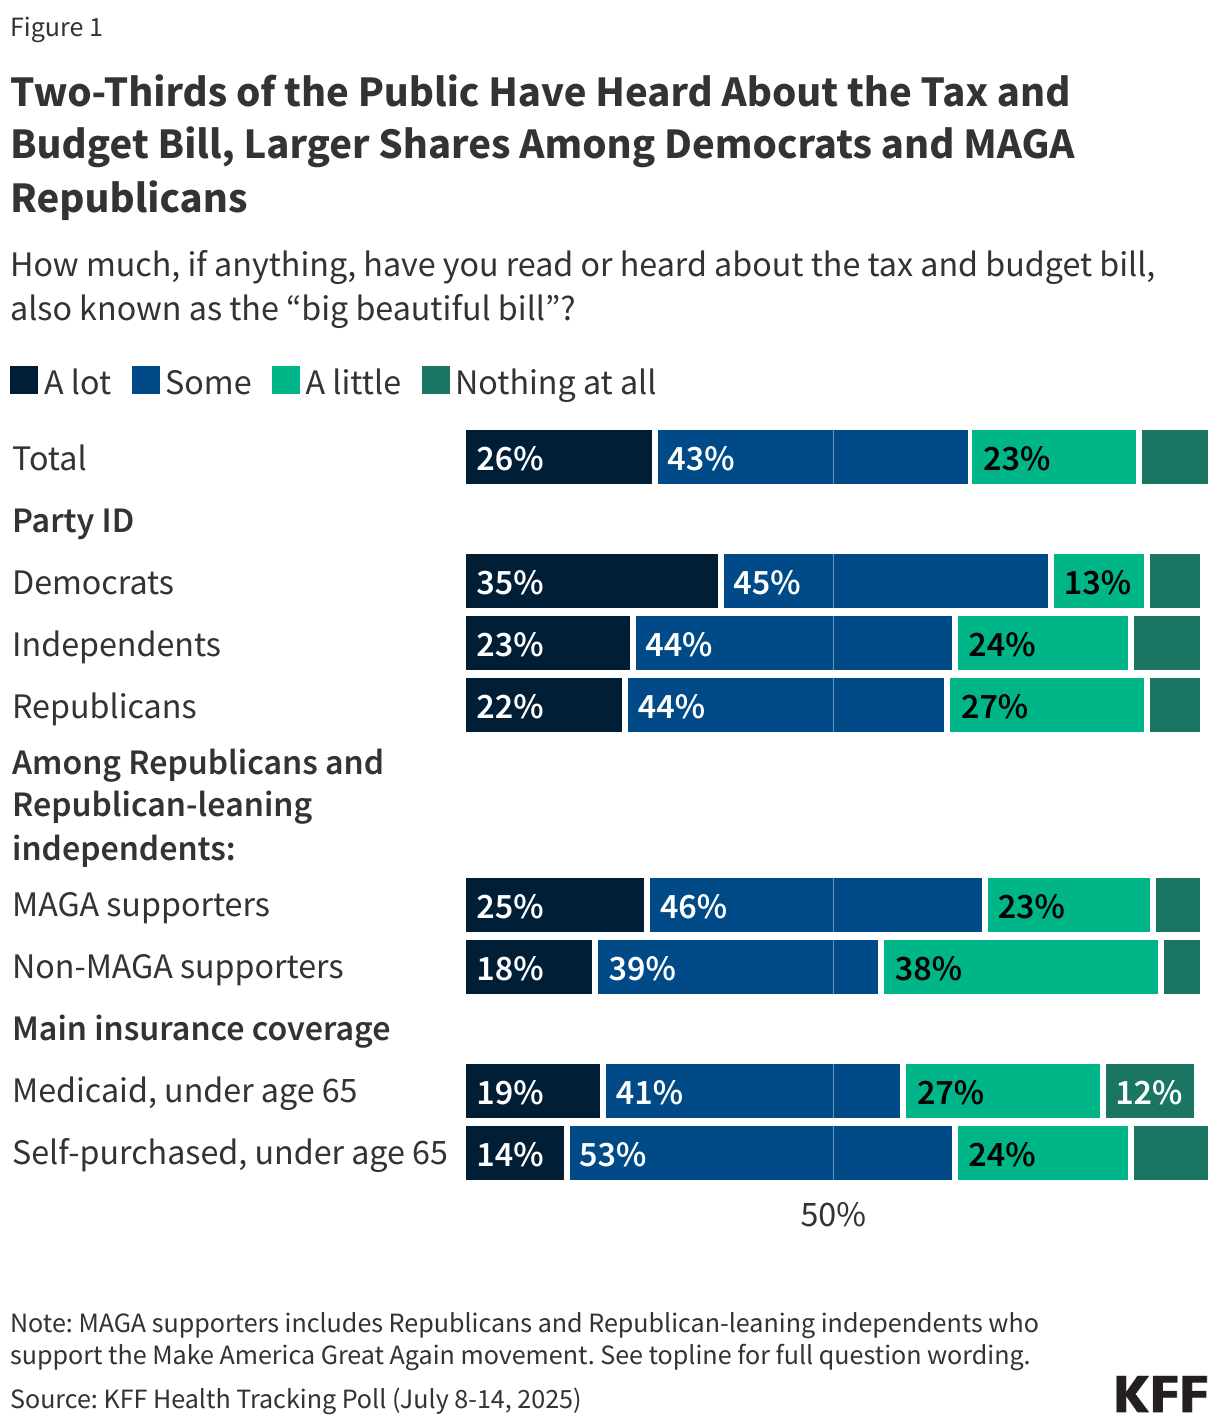
Two-thirds (68%) of the public now say they have heard “a lot” or “some” about the tax and budget bill, up from half who said the same in June. Another quarter say they’ve heard “a little” (23%), while few (9%) say they have heard “nothing at all.” Democrats remain somewhat more likely than Republicans and independents to say they’ve heard at least “some” about the legislation. Among Republicans and Republican-leaning independents, those who consider themselves part of the MAGA movement are more likely to have heard “a lot” or “some” about the law compared to non-MAGA Republicans (71% vs. 57%).

Two-thirds (66%) of those who self-purchased their insurance and six in ten adults under age 65 with Medicaid coverage, two of the groups that will be most directly impacted by the law, say they’ve heard “a lot” or “some” about the legislation.

Stacked bar chart showing the levels of public awareness about the tax and budget bill. Results shown by party and coverage type.

Overall favorability for the “big beautiful bill” remains relatively low, with about one-third (36%) of adults holding a favorable opinion and six in ten (63%) having an unfavorable view.  Overall views of the reconciliation bill remain unchanged from KFF’s June tracking poll, which was conducted prior to the Senate passing the legislation. This overall stability masks a widening partisan divide in views. Favorability among Republicans has increased 17 percentage points since June, from 61% to 78%. At the same time, Democrats have become even more negative in their views, with 94% expressing an unfavorable opinion, up from 85% in June. Favorability among independents has remained steady but still low, with around one-quarter (26%) expressing a favorable view of the legislation, similar to the share in June (27%).

Among Republicans and Republican-leaning independents, those who identify with the MAGA movement express more favorable opinions of the law than those who don’t identify as MAGA (85% vs. 54%). Notably, however, the share of non-MAGA Republicans viewing the bill favorably increased from one-third (33%) in June to a slight majority (54%) after it was passed and signed into law.

Among Medicaid enrollees under age 65 – a group that is most likely to be impacted by the health provisions of the reconciliation law, three in ten (29%) have a favorable opinion, while seven in ten (69%) view the bill unfavorably. Additionally, almost half (46%) of those who purchased their own insurance (46%) have a favorable opinion, while 53% are unfavorable.

Among adults with household incomes of less than $40,000 annually, few (30%) hold favorable views of the law.

Range plot showing favorability for the tax and budget bill in June 2025 and July 2025. Results shown by party MAGA supporters, and coverage type.

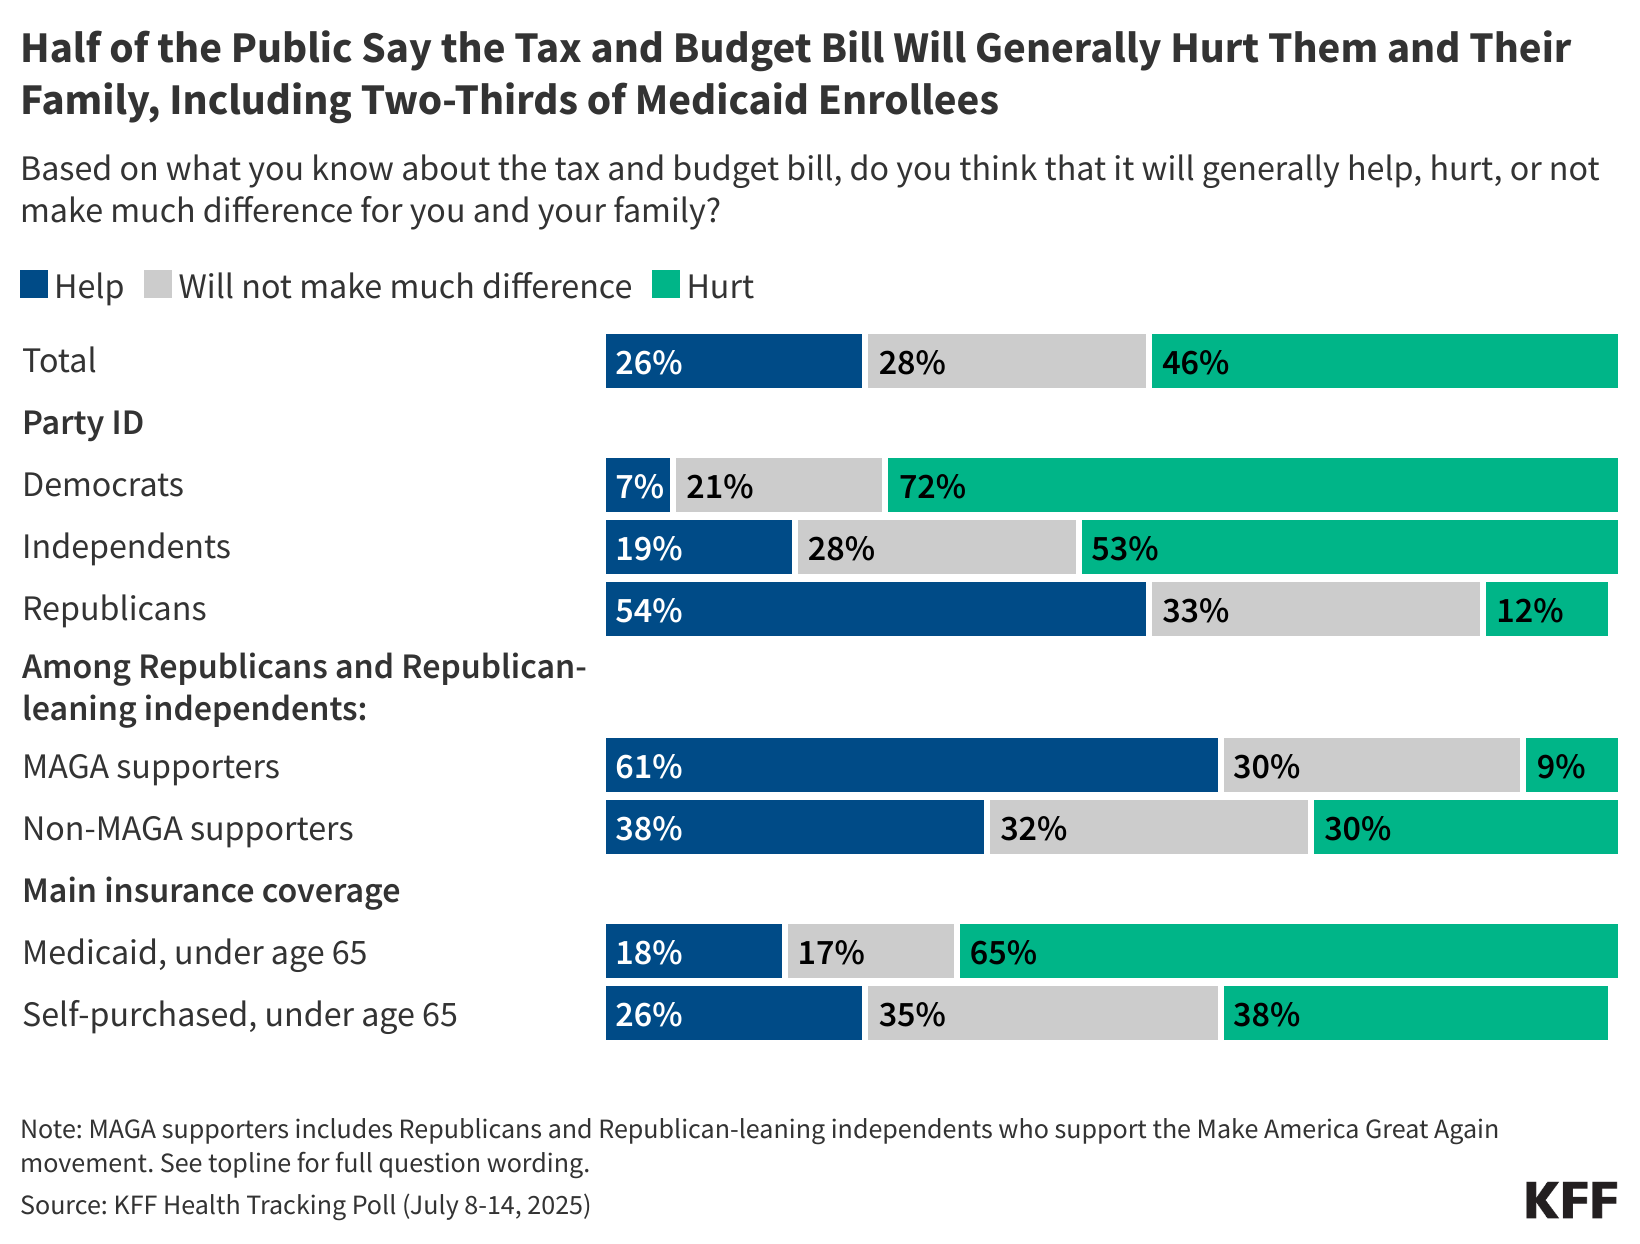
Almost half (46%) of adults say they think the tax and budget legislation will generally hurt them and their family, similar to the share who said so in June (44%). About a quarter (26%) of adults think the law will “help,” up from 17% in June. Another quarter (28%) think it won’t make a difference for them and their families.

The uptick in the share who believe the bill will help them and their families is largely driven by Republicans. After passage, just over half (54%) of Republicans think the reconciliation bill will help them and their family, up from a third (32%) who said so in June. At the same time, the share of Republicans who say the bill won’t impact their families decreased from 47% to 33%. Among Republicans and Republican-leaning independents who identify with the MAGA movement, six in ten (61%) now say the bill will help them, up from 38% in June. Non-MAGA Republicans are more divided, with 38% expecting the bill to help their families, with three in ten respectively expecting it to hurt (30%) or saying it won’t make much difference (32%). Seven in ten Democrats (72%) and about half of independents (53%) continue to say the bill will hurt them and their family.

Those with lower incomes are much more likely to say that the tax and budget bill will hurt them and their families, with over half (56%) of those with a household income of less than $40,000 a year who say so.

Two-thirds (65%) of Medicaid enrollees say the tax and budget bill will hurt them and their families, while just under one in ten (18%) believe it will help. Four in ten (38%) of those who have insurance that they purchased themselves expect that the legislation will generally hurt them and their family, while a similar share (35%) say it won’t make much of a difference. Fewer (26%) say it will help them and their family.

Stacked bar chart showing shares of U.S. adults by party, MAGA support, and coverage type who say the tax and budget bill will help, hurt, or not make much difference.

The Reconciliation Legislation on Social Media

A majority of adults (78% of those who use social media, and 73% of all adults) and similar shares across partisans say they saw information about the tax and budget bill on social media in the past month – reflecting the type of information the public is getting from their social media feeds. Among those who use social media, the share who say they saw information about the tax and budget bill on social media is similar to the share who say they saw information about other prominent topics on social media, including immigration (85%) and the U.S. economy (83%). Smaller shares of those who use social media report seeing information about Medicaid (58%) or the Affordable Care Act (34%) on social media in the past month.

The share of adults who report seeing information about each topic is similar across age groups but slightly differs across partisanship – perhaps reflecting the partisan bent of social media feeds. While similar shares of partisans say they saw information about the tax and budget bill, immigration, and the U.S. economy, Democrats who use social media were more likely than Republicans to say they saw information about Medicaid (67% vs. 48%) and the Affordable Care Act (39% vs. 24%) on social media in the past month.

Split bar chart showing shares of U.S. adults by age and party who say they have seen information about various topics including the tax and budget bill.

Reflecting in part the sites’ widespread adoption among the public, Facebook is the most common reported source of information seen about the tax and budget bill, followed by YouTube. About six in ten (62%) adults who say they saw information about the tax and budget bill on social media say they saw it on Facebook (49% of all social media users), including majorities of Democrats, independents, and Republicans. About four in ten (42%) of those who saw information say it was on YouTube (33% of all social media users), followed by about least one in five adults who use social media saying they saw it on Instagram (24%), TikTok (23%), or on X, formerly known as Twitter (19%). Fewer adults who use social media report seeing information about the tax and budget bill on other social media apps or sites, including Reddit (11%), Truth Social (4%), Bluesky (2%), or Snapchat (2%).

Split bar chart showing shares of partisans by site or app who say they have seen information about the tax and budget bill.

Among those who saw information about the tax and budget bill on social media, about half (47%) say most of the content they saw was in opposition to the tax and budget legislation, while about one in ten (11%) say the content was mostly in support of the legislation, and an additional four in ten (41%) say they saw a mix of both. Reflecting the partisan bent of most social media feeds, about three in four (76%) Democrats who say they saw content say that was in opposition to the bill, while Republicans are more likely (26%) to say the content was in support of the legislation. Notably, about half of Republicans who saw information about the legislation on social media say the content they saw was a mix – perhaps reflecting the debate among Republican lawmakers leading up to the bill’s passing.
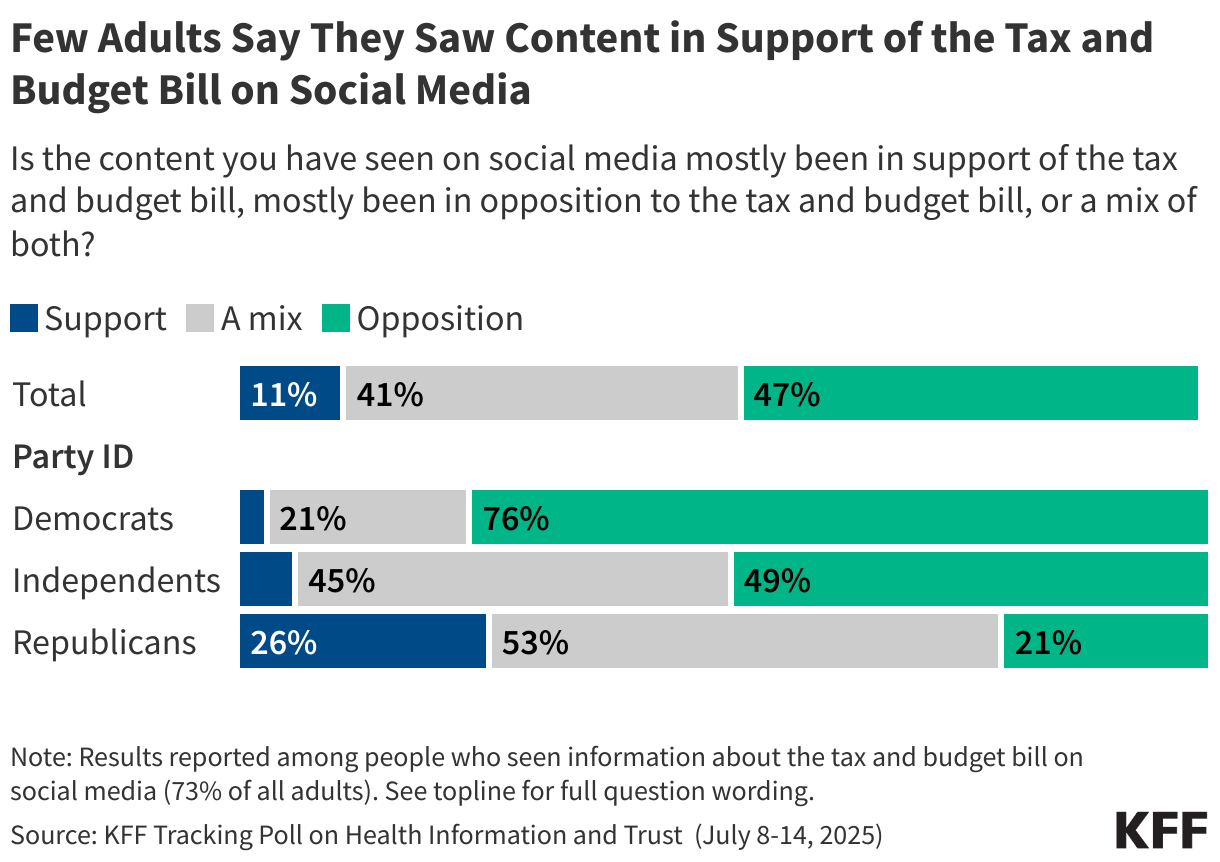
Stacked bar chart showing shares of U.S. adults by age and party who say they have seen content in support of or in opposition to the tax and budget bill.

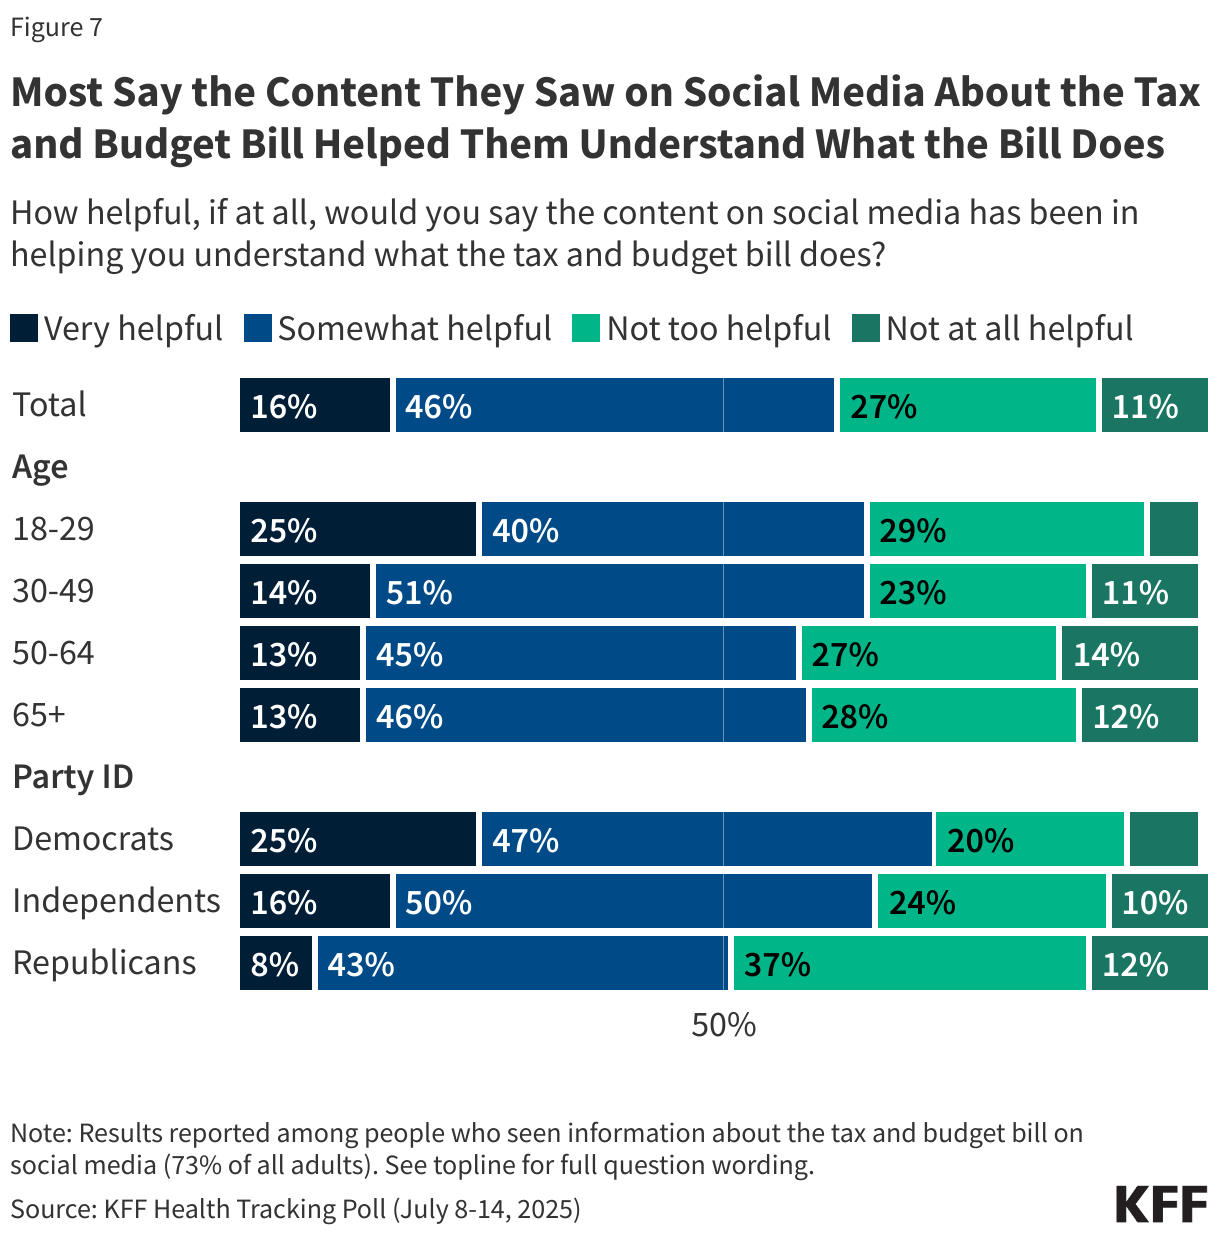
Most (62%) people who say they saw content about the tax and budget bill on social media say it was at least “somewhat helpful” in understanding what the bill does, including about one in six (16%) who found it “very helpful." An additional one in four (27%) say it was “not too helpful,” while a further one in ten (11%) say it was “not at all helpful.” Democrats (72%) and independents (66%) are more likely to say that they found the content helpful in explaining what the bill does compared with Republicans (51%). One in four (25%) young adults under age 30 say the content they saw on social media about the bill was “very helpful” in helping them understand what it does, larger than the shares of older adults who say the same.

Stacked bar chart showing the level of helpfulness people say social media content has been in helping them understand what the tax and budget bill does. Results shown by party and coverage type.

This KFF Health Tracking Poll/KFF Tracking Poll on Health Information and Trust was designed and analyzed by public opinion researchers at KFF. The survey was conducted July 8-14, 2025, online and by telephone among a nationally representative sample of 1,283 U.S. adults in English (n=1,212) and in Spanish (n=71). The sample includes 1,004 adults (n=58 in Spanish) reached through the SSRS Opinion Panel either online (n=979) or over the phone (n=25). The SSRS Opinion Panel is a nationally representative probability-based panel where panel members are recruited randomly in one of two ways: (a) Through invitations mailed to respondents randomly sampled from an Address-Based Sample (ABS) provided by Marketing Systems Groups (MSG) through the U.S. Postal Service’s Computerized Delivery Sequence (CDS); (b) from a dual-frame random digit dial (RDD) sample provided by MSG. For the online panel component, invitations were sent to panel members by email followed by up to three reminder emails.

Another 279 (n=13 in Spanish) adults were reached through random digit dial telephone sample of prepaid cell phone numbers obtained through MSG. Phone numbers used for the prepaid cell phone component were randomly generated from a cell phone sampling frame with disproportionate stratification aimed at reaching Hispanic and non-Hispanic Black respondents. Stratification was based on incidence of the race/ethnicity groups within each frame. Among this prepaid cell phone component, 135 were interviewed by phone and 144 were invited to the web survey via short message service (SMS).

Respondents in the prepaid cell phone sample who were interviewed by phone received a $15 incentive via a check received by mail. Respondents in the prepaid cell phone sample reached via SMS received a $10 electronic gift card incentive. SSRS Opinion Panel respondents received a $5 electronic gift card incentive (some harder-to-reach groups received a $10 electronic gift card). In order to ensure data quality, cases were removed if they failed two or more quality checks: (1) attention check questions in the online version of the questionnaire, (2) had over 30% item non-response, or (3) had a length less than one quarter of the mean length by mode. Based on this criterion, 1 case was removed.

The combined cell phone and panel samples were weighted to match the sample’s demographics to the national U.S. adult population using data from the Census Bureau’s 2024 Current Population Survey (CPS), September 2023 Volunteering and Civic Life Supplement data from the CPS, and the 2025 KFF Benchmarking Survey with ABS and prepaid cell phone samples. The demographic variables included in weighting for the general population sample are gender, age, education, race/ethnicity, region, civic engagement, frequency of internet use, political party identification by race/ethnicity, and education. The weights account for differences in the probability of selection for each sample type (prepaid cell phone and panel). This includes adjustment for the sample design and geographic stratification of the cell phone sample, within household probability of selection, and the design of the panel-recruitment procedure.

The margin of sampling error including the design effect for the full sample is plus or minus 3 percentage points. Numbers of respondents and margins of sampling error for key subgroups are shown in the table below. For results based on other subgroups, the margin of sampling error may be higher. Sample sizes and margins of sampling error for other subgroups are available on request. Sampling error is only one of many potential sources of error and there may be other unmeasured error in this or any other public opinion poll. KFF public opinion and survey research is a charter member of the Transparency Initiative of the American Association for Public Opinion Research.

GroupN (unweighted)M.O.S.E.
Total1,283± 3 percentage points
Party ID
Democrats439± 6 percentage points
Independents387± 6 percentage points
Republicans344± 6 percentage points
MAGA Republicans308± 7 percentage points


News Release

Poll: New Tax and Budget Law Remains Largely Unpopular; Nearly Half Say It Will Hurt Their Families, though Republicans and MAGA Supporters Are More Optimistic

Published: Jul 24, 2025

Nearly half (46%) of the public says that they expect the new tax and budget law signed by President Trump earlier this month to generally hurt them and their families, nearly twice the share (26%) who say it will generally help, a new KFF Health Tracking Poll finds. Among people who rely on Medicaid for their health coverage, two-thirds (65%) say it will hurt their families compared to one in five (18%) who say it will help.

The law combines tax cuts with spending reductions, including cuts and changes to Medicaid and the Affordable Care Act that are expected to leave millions more people without health insurance. Among people with household incomes under $40,000 annually, most (56%) say that the law will hurt them.

Perceptions of how the law will impact people’s families varies among partisans. Most Democrats (72%) and just over half of independents (53%) say it will mostly hurt them and their families, while just over half of Republicans (54%) say it will help. Those who identify as supporters of President Trump’s “Make America Great Again” movement are more than five times more likely to say the law will help their families (61%) than hurt (9%).

The law itself remains largely unpopular, with many more people holding unfavorable views (63%) than favorable ones (36%).

The split is unchanged from June before the legislation dubbed the “big beautiful bill” by President Trump became law, though the new poll shows a sharper partisan divide, with Republicans more likely to view the law favorably and Democrats more likely to view it unfavorably.

Two-thirds (68%) of the public now say that they’ve heard “a lot” or “some” about the legislation, up from half who said the same in June.

The poll also examines what people are seeing about the legislation on social media. Most (73%), including similar shares of partisans, say they saw information about the bill on social media in the past month.

Among those who saw information about the legislation on social media, about half (47%) say most of the content they saw was in opposition to the legislation, while about one in ten (11%) say it was mostly in support. The others (41%) say they saw a mix of both.

Designed and analyzed by public opinion researchers at KFF, this survey was conducted July 8-14, 2025, online and by telephone among a nationally representative sample of 1,283 U.S. adults in English and in Spanish. The margin of sampling error is plus or minus 3 percentage points for the full sample. For results based on other subgroups, the margin of sampling error may be higher.

A Continuing Saga: Ending Abortion Restrictions in States with Constitutional Protections

Authors: Mabel Felix, Laurie Sobel, and Alina Salganicoff
Published: Jul 23, 2025

Since the Supreme Court overturned Roe v. Wade in June 2022, states have been able to set policy that defines abortion access across this nation. In the past three years, voters in 10 states have passed constitutional amendments to protect abortion rights. These amendments, however, do not automatically invalidate the states’ laws restricting abortion such as waiting periods, coverage bans, and ultrasound requirements. The restrictions need to be challenged in court before they can be invalidated. This process can take years, and in states with new constitutional protections, people seeking abortion care may still face access restrictions while the litigation proceeds. Additionally, in some instances, after courts have blocked restrictions, conservative state legislatures have passed laws enacting very similar restrictions, lengthening the process to block these laws, since advocates have to challenge multiple state laws or amend already-existing challenges to block the newly passed laws. This policy watch provides an update on the status of abortion restrictions in states that passed a constitutional amendment protecting abortion, or where a state court previously interpreted the state constitution as protecting abortion access.

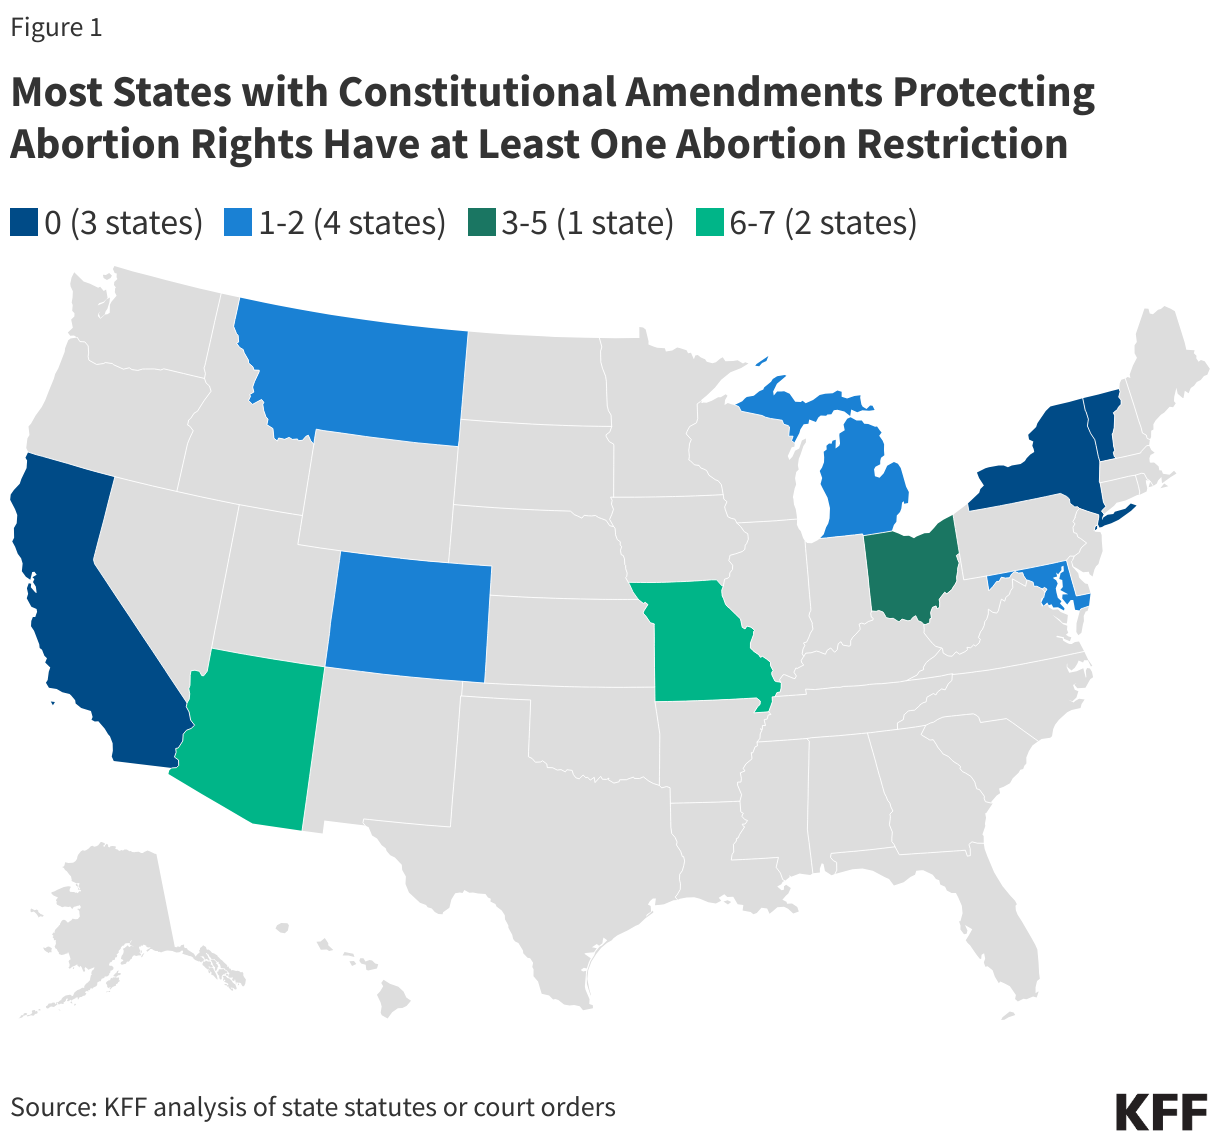
Most States with Constitutional Amendments Protecting Abortion Rights Have at Least One Abortion Restriction

Status of Litigation Based on Recent Constitutional Amendments

In four states with recently passed constitutional amendments protecting the right to abortion or a broader right to reproductive freedom — Arizona, Michigan, Missouri, and Ohio – advocates have filed lawsuits seeking to block abortion restrictions, alleging that these restrictions violate the newly passed constitutional amendments. These lawsuits test the reach of these constitutional amendments beyond pre-viability gestational limits. In Montana, another state that recently passed a constitutional amendment, abortion providers are also challenging prior abortion restrictions, but because this challenge was filed before the state’s constitutional amendment passed, they are relying on previous state supreme court precedent to make their arguments. Advocates in Alaska and Kansas, where there is no specific constitutional amendment protecting abortion, have challenged restrictions based on state supreme court cases finding abortion is protected in the state constitution.

Whether or not the restrictions that are being challenged will be permanently blocked depends on how each respective state’s supreme court interprets the state constitution’s right to abortion. The language of the constitutional amendments varies and some might provide greater protections than others (Table 9). States that rely on state supreme court precedent protecting a right to abortion—as opposed to a constitutional amendment explicitly protecting this right—may provide protections today, but future courts may overturn that precedent, much like the U.S. Supreme Court did with Roe v. Wade.

The following section provides an overview of the status of legal challenges to abortion restrictions in states with recently passed constitutional amendments or litigation that has found that the state constitution protects abortion rights.

Arizona

The Arizona constitutional amendment – passed in November 2024 – protects a fundamental right to abortion and forbids the state from enacting, adopting, or enforcing any law that “denies, restricts or interferes with that right before fetal viability unless justified by a compelling state interest that is achieved by the least restrictive means.” Currently, the gestational limit in the state is fetal viability. However, there are other restrictions that are still in effect.

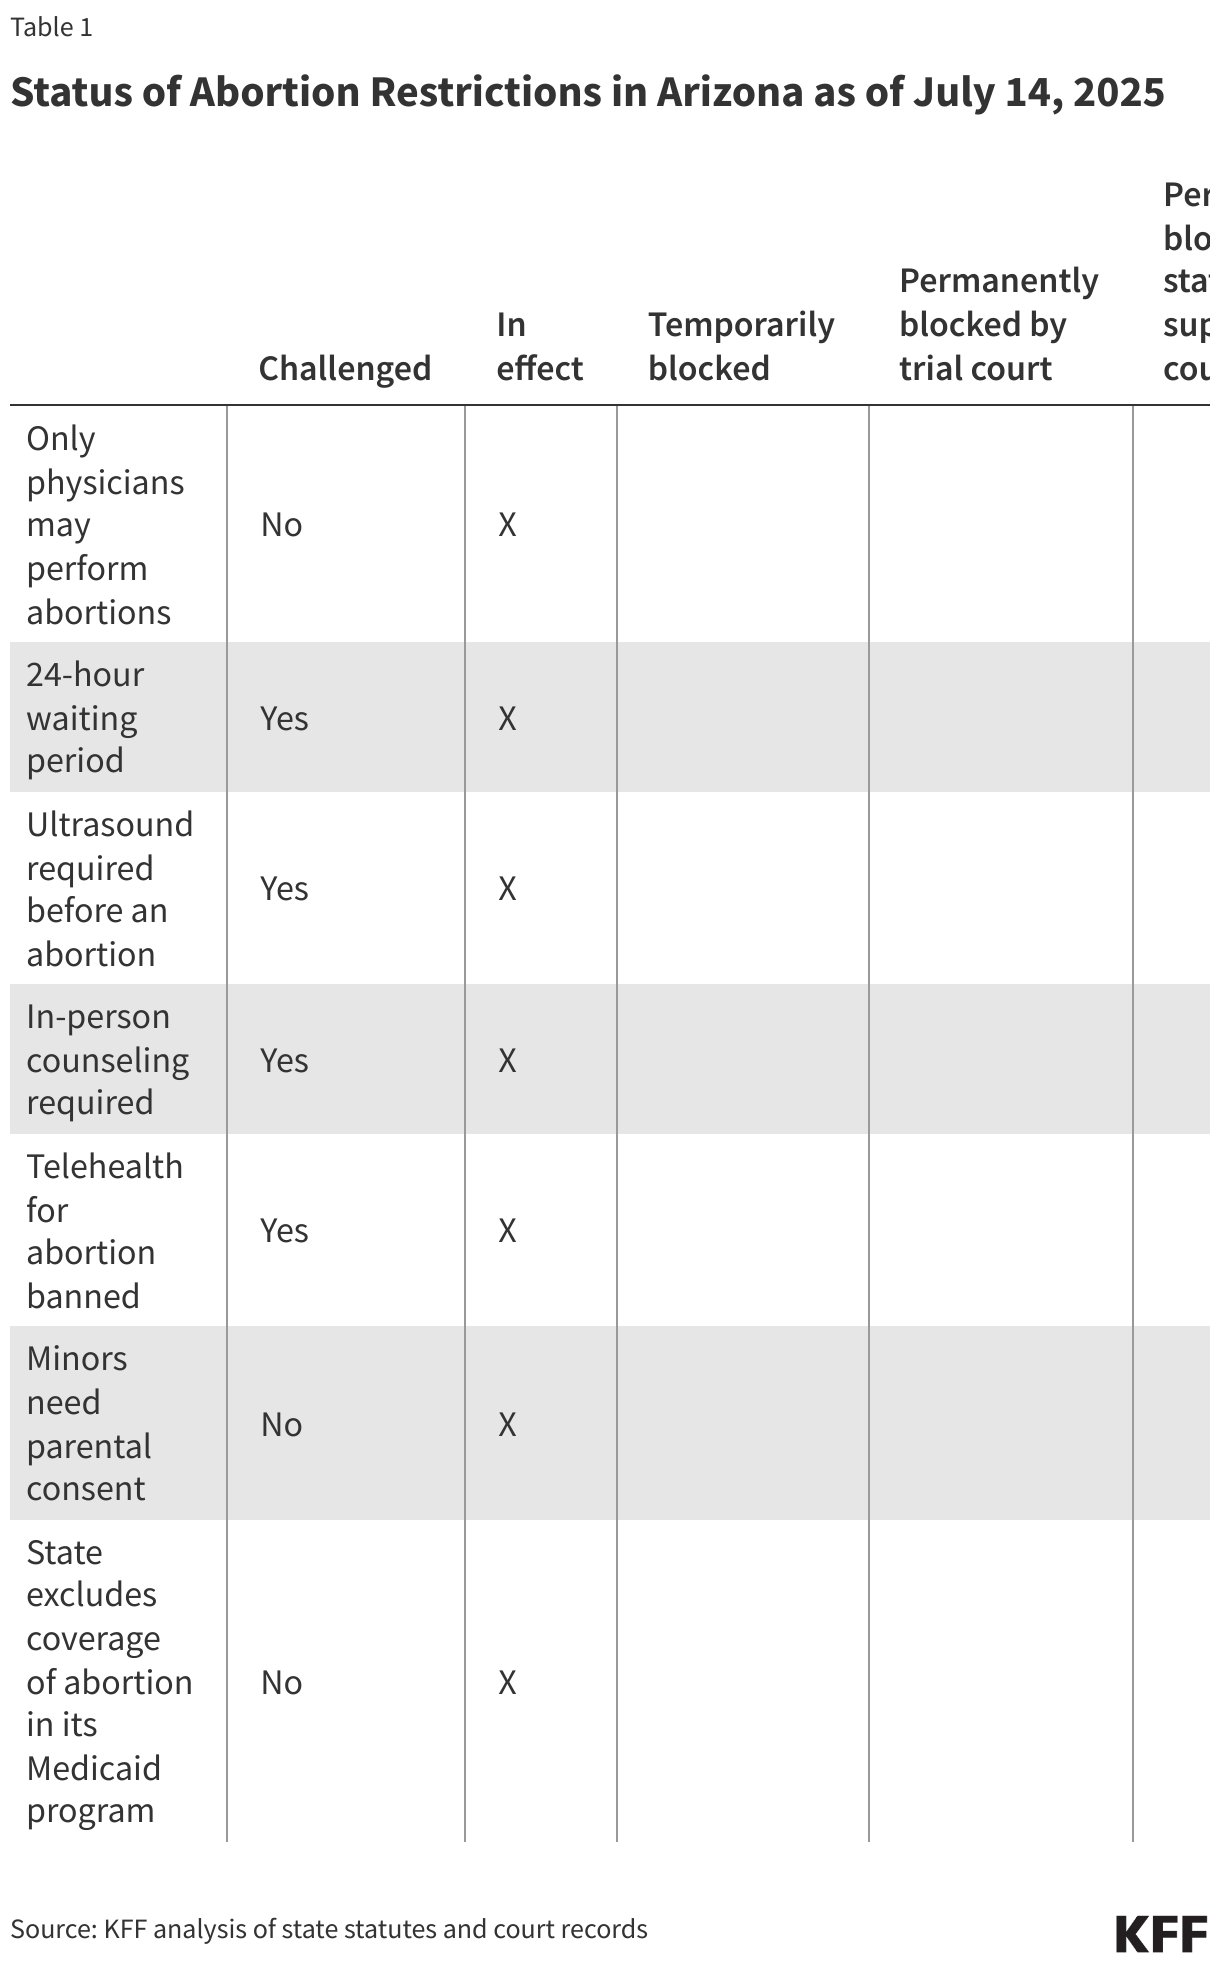
Status of Abortion Restrictions in Arizona as of July 14, 2025

Abortion rights advocates in Arizona filed a lawsuit in May 2025 challenging the in-person counseling requirement, 24-hour waiting period, ultrasound requirement, and ban on the use of telehealth for abortion care. The state court where this challenge was filed is yet to issue a ruling.

Michigan

In November 2022, voters passed a constitutional amendment in Michigan that protects a fundamental right to reproductive freedom, the right to make decisions regarding pregnancy, including the right to abortion, among others. It states that “[a]n individual’s right to reproductive freedom shall not be denied, burdened, nor infringed upon unless justified by a compelling state interest achieved by the least restrictive means.”

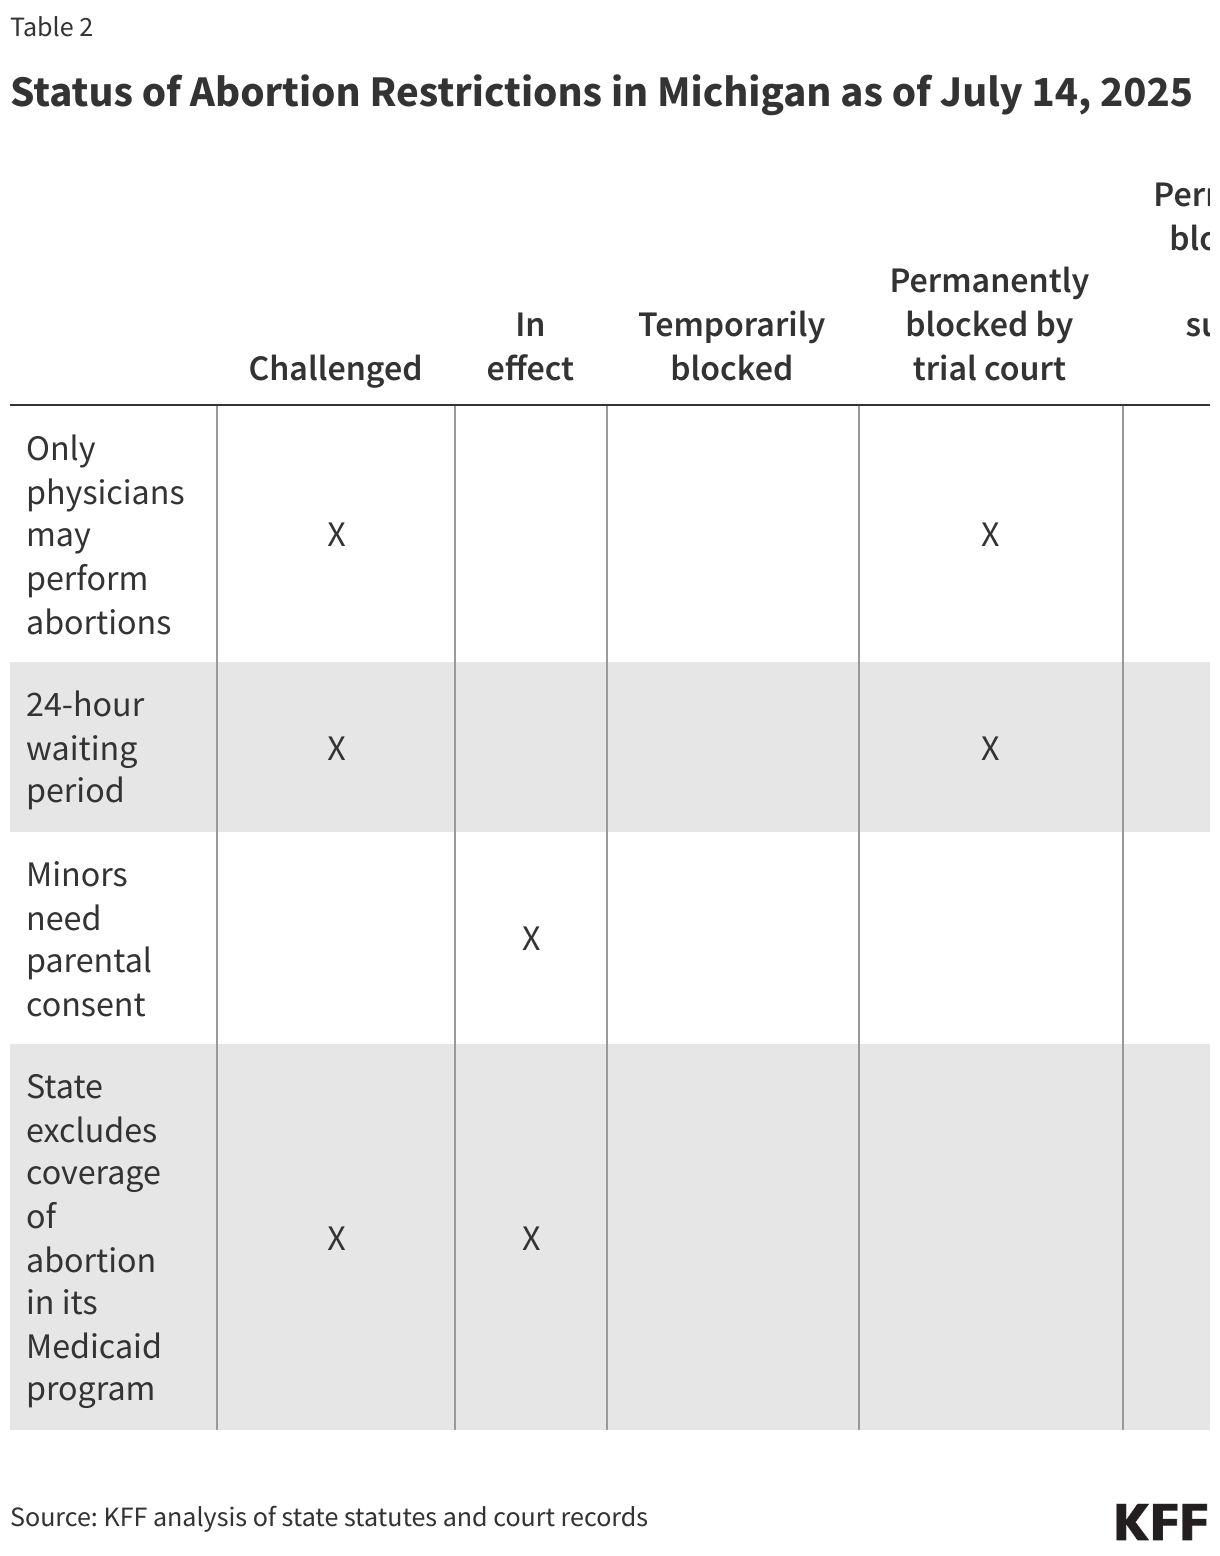
The state has no gestational limit on abortion, however, a state funding ban on abortion funding for Medicaid enrollees and a parental consent requirement are still in effect.

Status of Abortion Restrictions in Michigan as of July 14, 2025

In two separate lawsuits, advocates in Michigan are challenging the exclusion of abortion coverage from the state’s Medicaid program and laws requiring a 24-hour waiting period and limiting abortion provision to physicians. A trial court recently ruled that the latter two requirements are unconstitutional and blocked them permanently. However, the state’s supreme court is yet to rule on these restrictions.

Missouri

In November 2024, voters in Missouri passed a constitutional amendment protecting a fundamental right to reproductive freedom, including the right to make decisions about abortion care. The amendment states that this right “shall not be denied, interfered with, delayed, or otherwise restricted unless the Government demonstrates that such action is justified by a compelling governmental interest achieved by the least restrictive means. Any denial, interference, delay, or restriction of the right to reproductive freedom shall be presumed invalid.” Currently, the gestational limit in the state is fetal viability, but other restrictions are still in effect.

Status of Abortion Restrictions in Missouri as of July 14, 2025

Several clinics in Missouri filed a lawsuit alleging that the state’s pre-viability bans as well as many restrictions violate the state’s newly granted constitutional right to reproductive freedom. In December 2024, a Missouri state trial court sided with the clinics, and blocked the state’s pre-viability abortion bans, as well as many of the restrictions, while the litigation continues. However, in late May 2025, the Missouri Supreme Court lifted the preliminary injunction for the restrictions, and ordered the trial court to use a more strenuous test to determine if the plaintiffs meet the bar for a preliminary injunction. When restrictions went back into effect, clinics stopped providing abortion care, even though the total ban was not in effect. The case went back before the trial court, where the judge reviewed the request for a preliminary injunction using the standard set forth by the state supreme court and in response issued an order on July 3, 2025 blocking once again the state’s pre-viability ban and some restrictions, including the 72-hour waiting period. The state has appealed this order to the Missouri Supreme Court.

Ohio

The Ohio constitution was amended by voter initiative in November 2023 protecting the right to make and carry out reproductive decisions, including decisions about abortion care. Per the amendment, “[t]he State shall not, directly or indirectly, burden, penalize, prohibit, interfere with, or discriminate against… the exercise of this right, unless the State demonstrates that it is using the least restrictive means to advance the individual’s health in accordance with widely accepted and evidence-based standards of care.”

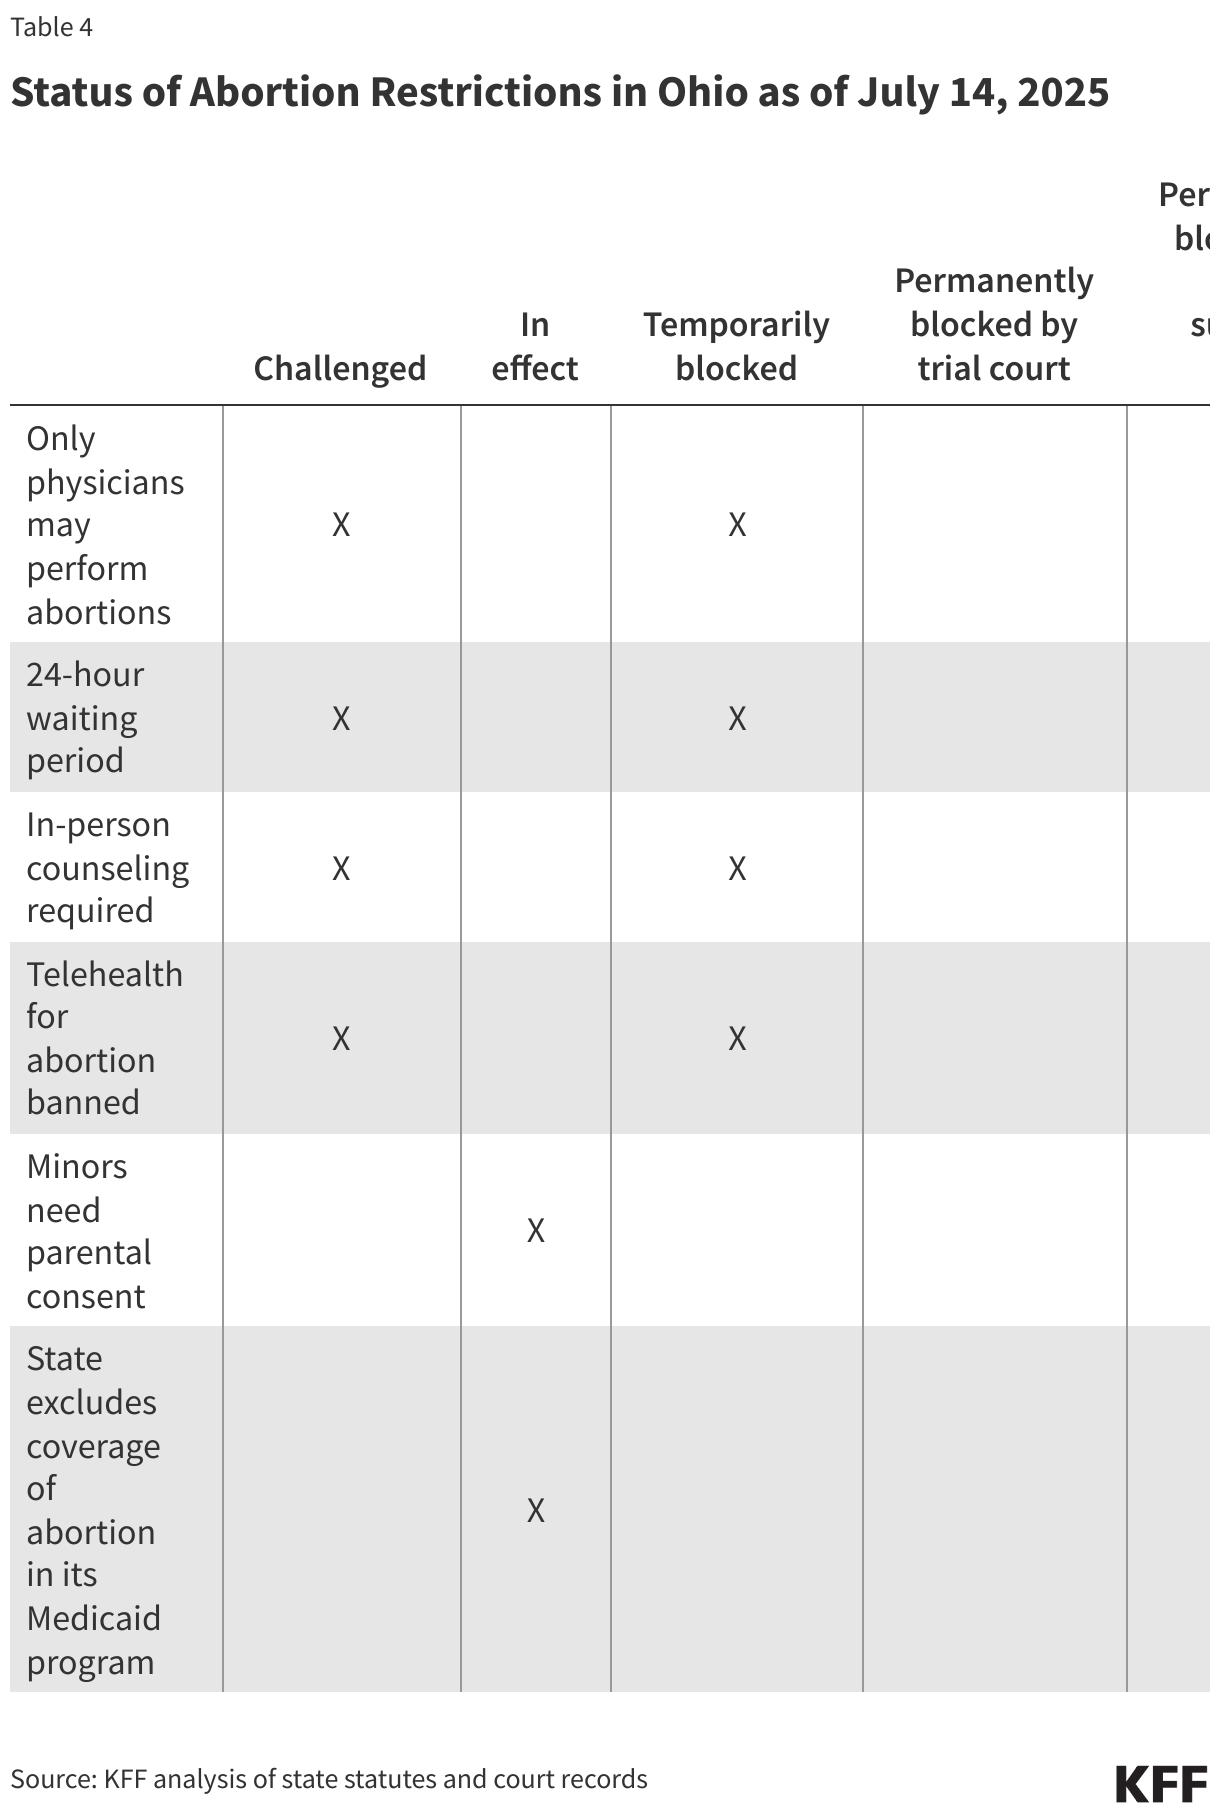
Currently, the gestational limit in the state is 22 weeks LMP (last menstrual period), however, are other restrictions are still in effect or temporarily blocked.

Status of Abortion Restrictions in Ohio as of July 14, 2025

In two different lawsuits, abortion providers in Ohio challenged the 24-hour waiting period, the in-person counseling appointment, the telehealth abortion ban, and a law that limits the provision of abortion care to physicians. Abortion providers used the state’s constitutional amendment as the basis for these challenges. In both of these lawsuits, the trial courts have temporarily blocked the challenged restrictions while litigation proceeds. After the constitutional amendment was passed by voters, some Ohio legislators sought to curtail judges’ ability to block these laws and interpret the constitutional amendment, but these efforts did not progress.

Status of Litigation in States with State Supreme Court Precedent Protecting the Right to Abortion

Alaska

In 1997, the Alaska Supreme Court found that the state constitutional right to privacy protects the right to abortion. The state has no gestational limit on abortion, however, other restrictions are still in effect.

Status of Abortion Restrictions in Alaska as of July 14, 2025

Advocates in Alaska are challenging a law that limits abortion provision to physicians, using previous state supreme court precedent as the basis for their challenge. This requirement was originally blocked by a preliminary injunction in 2021 and in September 2024, a state trial court ruled that the requirement violates the constitutional protection for the right to abortion.

Kansas

In 2019, the Kansas Supreme Court found that the Kansas Bill of Rights includes the right to abortion. The gestational limit in the state is 22 weeks LMP (last menstrual period), other restrictions are still in effect.

Status of Abortion Restrictions in Kansas as of July 14, 2025

In Kansas, advocates are challenging a 24-hour waiting period law that is temporarily blocked due to a court order while litigation proceeds and a law banning advanced practice registered nurses from providing medication abortion care. Advocates in Kansas have also used Kansas Supreme Court precedent to successfully challenge laws that limit the provision of abortion care to physicians and require ultrasounds before an abortion, as well as in-person dispensing of medication abortion.

Montana

In 1999, the Montana Supreme Court found that the state constitution protects the right to abortion. In 2024, the Montana Supreme Court reaffirmed this protection.

In addition, voters approved an amendment in November 2024 recognizing an individual’s right to make decisions about pregnancy, including the right to abortion. It states that “[t]his right shall not be burdened unless justified by a compelling government interest achieved by the least restrictive means.”

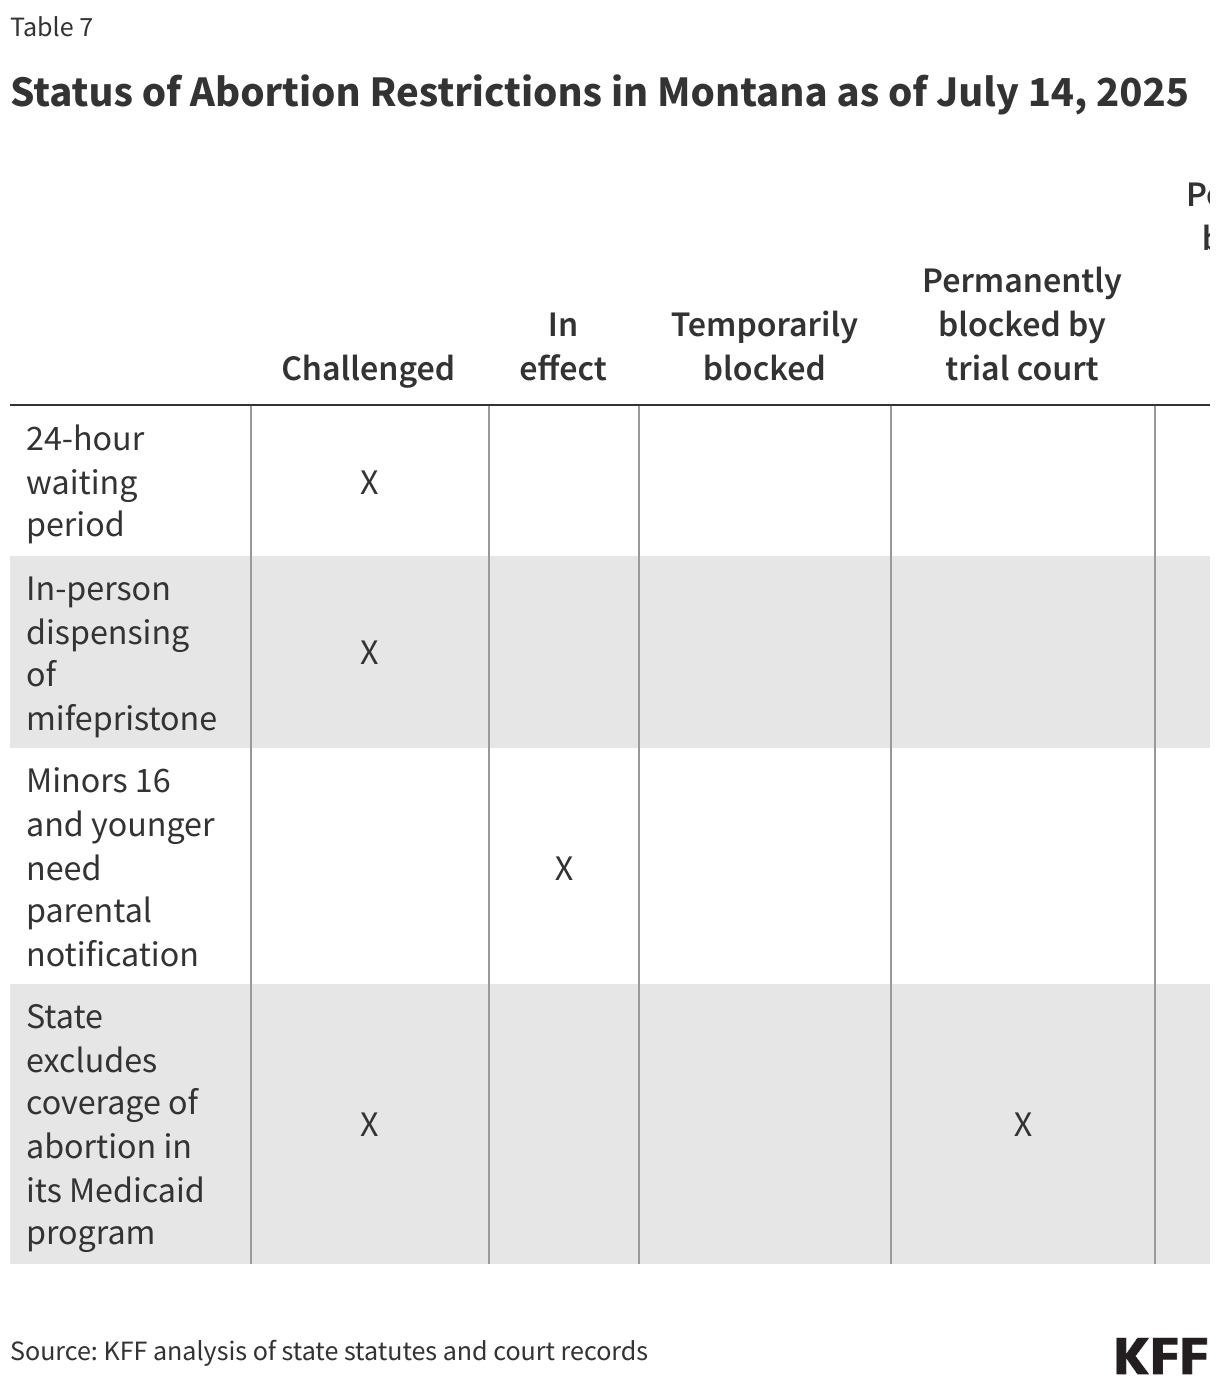
The gestational limit in the state is fetal viability, however, a state parental consent law is still in effect.

Status of Abortion Restrictions in Montana as of July 14, 2025

Abortion providers in Montana are challenging a law that excluded abortion coverage from the state’s Medicaid program, relying on previous Montana Supreme Court precedent that held that the state constitutional protection for privacy includes a protection for the right to abortion, instead of relying on the state’s newly passed constitutional amendment, since the challenge was underway before the constitutional amendment passed. In March 2025, a trial court ruled that this restriction is unconstitutional and permanently blocked it. Additionally, the Montana Supreme Court recently concluded in a different case that was also brought by abortion providers, that restrictions including an in-person dispensing requirement, a 24-hour waiting period, and a ban on telemedicine for abortion were unconstitutional. These restrictions are no longer in effect.

State Lawsuits Challenging Abortion Restrictions
Language of State Constitutional Amendments Protecting Abortion Rights

Allocating CBO’s Estimates of Federal Medicaid Spending Reductions Across the States: Enacted Reconciliation Package

Published: Jul 23, 2025

Editorial Note

Originally published on July 1 with estimates for the Senate Reconciliation Bill, this brief was revised significantly and updated on July 23 to reflect the latest CBO estimates on the impact of the enacted reconciliation package.

On July 4, President Trump signed into law a budget reconciliation package once called the “One Big, Beautiful Bill” that made major reductions in federal health care spending to offset part of the costs of extending expiring tax cuts. The Congressional Budget Office’s (CBO) latest cost estimate shows that the reconciliation package would reduce federal Medicaid spending over a decade by an estimated $911 billion (after accounting for interactions that produce overlapping reductions across different provisions of the law) and increase the number of uninsured people by 10 million. Building on prior KFF analysis of the House-passed reconciliation bill, this analysis allocates CBO’s federal spending reductions in the enacted reconciliation package across the states. The Medicaid reconciliation provisions are numerous and complicated, but the majority of federal savings stem from work requirements for the Affordable Care Act (ACA) expansion group, limiting states’ ability to raise the state share of Medicaid revenues through provider taxes, restricting state-directed payments to hospitals, nursing facilities, and other providers, and increasing barriers to enrolling in and renewing Medicaid coverage.

This analysis allocates the CBO’s estimated reduction in federal spending across states based on KFF’s state-level data and where possible, prior modeling work; and shows the federal spending reductions relative to KFF’s projections of federal spending by state under current law. KFF allocates the spending reductions provision-by-provision, pulling in a variety of data sources on which states are estimated to be most affected by each provision (see Methods). The total Medicaid spending cuts, nationally and by state, equal the sum of spending changes for each Medicaid provision ($990 billion over 10 years) less KFF’s estimate of the CBO interaction effects that are tied to Medicaid interactions ($79 billion over 10 years, see Methods). KFF did not apply the interaction effects to the estimated effects for each provision because it is unknown which provisions are driving CBO’s estimated interactions. The estimates exclude the $50 billion in funding for state grants through a Rural Health Transformation Program because it is highly uncertain how those funds will be allocated across the states.

CBO has not published updated estimates of the number of people who would lose Medicaid under the reconciliation package once called the “One Big, Beautiful Bill,” so this analysis does not include updated enrollment estimates like those included in KFF’s analysis of the House-passed reconciliation bill. CBO’s most recent estimate of Medicaid enrollment loss from an earlier version of the House reconciliation bill was 10.3 million people in 2034, which was associated with a $625 billion decrease in Medicaid spending (reflecting preliminary estimates prepared for the House Committee on Energy and Commerce). Given the Medicaid spending reductions are considerably larger in the enacted reconciliation package, more than 10.3 million people are likely to lose Medicaid.

This analysis does not predict how states will respond to federal policy changes, and anticipating how states will respond to Medicaid changes is a major source of uncertainty in CBO’s cost estimates. Instead of making state-by-state predictions, CBO generates a national figure by estimating the percent of the affected population that lives in states with different anticipated types of policy responses. For example, different states might choose to implement a work requirement with reporting requirements that are easier or harder to comply with. In estimating the costs of the legislation, CBO assumes that in aggregate, states would replace half of reduced federal funds with their own resources in response to provisions that reduce the resources available to states, such as limits on provider taxes. For provisions that reduce enrollment but don’t affect the division of costs between the federal and state governments, such as work requirements, CBO estimates that the federal and state Medicaid spending would go down. However, those assumptions reflect states’ responses as a whole and are likely to vary and may not apply in all states.

To the extent that states’ responses are far different from the overall average response, changes in federal Medicaid spending will be larger or smaller than what is shown here. States could make further Medicaid cuts, which would result in spending reductions greater than is estimated here and further reduce states’ Medicaid spending. Alternatively, states could increase their spending on Medicaid to mitigate the effects of federal cuts, which could result in spending reductions that are smaller than is estimated here. This analysis illustrates the potential variation by showing a range of spending effects in each state, varying by plus or minus 25% from the CBO estimated midpoint.

Key Take-Aways

  • After accounting for CBO’s estimated interactions, KFF estimates that the enacted reconciliation package would reduce federal Medicaid spending by $911 billion. (Without accounting for interactions, the total is $990 billion, see Methods).
  • The five biggest sources of Medicaid savings in the reconciliation package sum to $851 billion in savings, which is 86% of the gross savings (before accounting for interactions) and include:
    • Mandating that adults who are eligible for Medicaid through the ACA expansion meet work and reporting requirements ($326 billion),
    • Establishing a moratorium on new or increased provider taxes and reducing existing provider taxes in expansion states ($191 billion),
    • Revising the payment limit for state directed payments ($149 billion),
    • Increasing the frequency of eligibility redeterminations for the ACA expansion group ($63 billion).  
  • Provisions that would only apply to states that have adopted the ACA expansion account for $526 billion, over half of the total gross federal spending reductions.
  • Over three-quarters (76%) of the ten-year reductions in federal Medicaid spending in the reconciliation package would occur in the final five years of the period. While policy effects do typically compound overtime, many of the health care spending reductions are also backloaded and occur from 2030 through 2034.
  • Federal cuts to states of $911 billion over 10 years would represent 14% of federal spending on Medicaid over the period. The spending cuts vary by state; Louisiana, Illinois, Nevada, and Oregon are the most heavily affected with spending cuts of 19% or more over the period.
Federal Medicaid Cuts in the Enacted Reconciliation Package, By Year
Federal Medicaid Cuts in the Senate Reconciliation Bill, By State


Methods

Data: This analysis uses the latest data available from various data sources to illustrate the potential impact of a $911 billion cut to federal Medicaid spending across states. Data sources include:

Estimating Total Federal Funding Reductions After Interactions: CBO’s cost estimate provided the reduction in federal outlays for Medicaid provisions, which summed to $990 billion excluding interactions and the $50 in funding for state grants through a Rural Health Transformation Program. (KFF summed CBO’s estimated changes in outlays and not budget authority. The analysis does not include associated reductions in federal revenues associated with the Medicaid provisions, which reflect reduced federal income taxes stemming from a small number of people who would newly have private health insurance after losing Medicaid.)

The Medicaid provisions are part of Title VII Subtitle B, which is estimated to reduce federal outlays by $1.2 trillion before accounting for interactions and without the Rural Health Transformation Program funding. KFF assumed that 82% of the reduction in outlays due to interactions was attributable to Medicaid because the Medicaid provisions accounted for 82% of the overall reduction in outlays. The interaction reduced the effects of the Medicaid provisions by $79 billion so the total estimated reduction in Medicaid spending is $911 billion. KFF did not apply the $79 billion in estimated interaction effects by provision as the interactions would not apply to all provisions equally and the CBO cost estimate does not provide enough detail to allocate across Medicaid provisions. KFF excluded the $50 billion in funding for the Rural Health Transformation Program because it is highly uncertain how those funds will be allocated across the states.

Allocating Federal Funding Reductions Across States: This analysis allocates the ten-year federal Medicaid cut across states as follows:

  • Changes that would affect the Affordable Care Act (ACA) expansion group, including work requirements, were allocated across expansion states proportionally to federal spending on people eligible through the ACA expansion in FY 2024.
  • Wisconsin is a non-expansion state, but adults eligible for Medicaid through their waiver could be subject to the work requirements provision. KFF estimated the percentage of spending that was Wisconsin's "ACA-equivalent" by comparing the percentage of total federal spending that paid for adults ages 19-64 who were not eligible on the basis of disability in Wisconsin to that of other non-expansion states (24% and 11% respectively). KFF assumed that the "extra" spending on adults in Wisconsin comprised the state's "ACA-equivalent" spending.
  • Ending the increased share of federal spending for states that adopt the Medicaid expansion in future years is allocated across the states that had not adopted the expansion as of May 2025, proportionally to total federal spending.
  • Changing the requirements for state-directed payments was allocated in two parts. Spending reductions equivalent to those in the House-passed bill were allocated across states that have state-directed payments in place in FY 2024 (according to KFF’s budget survey or to KFF’s analysis of state-directed payments submitted to CMS), proportionally to KFF’s estimates of federal spending on managed care in FY 2023 (which are calculated using total managed care spending in FY 2023 divided by the federal percentage of Medicaid spending in FY 2023). The difference between the spending reductions in the House-passed bill and the spending reductions in the enacted reconciliation package was allocated across states identified as likely and possibly affected in a prior KFF analysis proportionally to those states’ estimated federal spending on managed care.
  • Limiting the use of Medicaid provider taxes was allocated in two parts. Spending reductions equivalent to those in the House-passed bill were allocated across states proportionally to their share of federal spending in FY 2024. The difference between the spending reductions in the House-passed bill and the spending reductions in the enacted reconciliation package was allocated proportionally to federal spending only in expansion states with hospital or managed care organization (MCO) provider taxes in excess of 3.5% of net patient revenues, as identified in a prior KFF analysis.
  • Waiving the uniform tax requirement for Medicaid provider taxes is similar to a recent proposed rule that would require changes to provider taxes in California, Massachusetts, Michigan, and New York. Thus, 50% of the CBO estimate for this provision was allocated to those states. The remainder of the CBO estimate was allocated proportionally to federal spending on managed care among states that have taxes on Medicaid managed care organizations in FY 2025.
  • Reducing the maximum home equity limit was allocated based on federal spending for Medicaid enrollees who used long-term care in 2021 (the most recent year of data) among states that have home equity limits greater than $1 million as of 2025.
  • All other provisions (including interaction effects) were allocated across states proportionally to their share of federal spending in FY 2024.

For all estimates, the federal share of spending in FY 2024 is estimated using a 90% match rate for the ACA expansion group and the FY 2024 traditional federal match rates plus a 1.5 percentage point increase for the first quarter of FY 2024 (accounting for the final phase out quarter of the pandemic-era enhanced federal match rate) for the remaining eligibility groups.

Limitations: This analysis allocates the CBO’s estimated reduction in federal spending across states based on KFF’s state-level data and where possible, prior modeling work. The most significant limitations of this approach are as follows.

1. CBO’s estimated reduction in federal spending is distributed across states based on the policies they had in place at the time of enactment and their Medicaid spending in the most recent year for which data were available (usually FY 2024). The analysis does not account for future changes in state Medicaid policy. For example, the analysis does not account for the enrollment effects in states that had not expanded the ACA as of FY 2025 but would have done so in future years.

2. The analysis does not attempt to predict state behavior and to the extent that states respond in ways that differ greatly from the expected national effects, the spending estimates may be outside of the range reported in this analysis.

Physician Workforce Diversity by Race and Ethnicity

Published: Jul 22, 2025

Introduction

Racial and ethnic disparities in health outcomes remain persistent in the United States, driven by inequitable access to and utilization of health care services and broader social and economic factors that reflect historical and ongoing racism. One factor that can mitigate these disparities is racial concordance between physicians and patients, that is, when providers and patients share the same racial or ethnic background. Research suggests that patient and provider racial concordance may be linked to increased visits for preventative care, greater treatment adherence, and lower emergency department use. One study found that greater representation of Black primary care physicians was associated with increased life expectancy and lower mortality among Black people. KFF 2023 survey data show Black, Hispanic, and Asian adults who have more health care visits with providers who share their racial and ethnic background more frequently report having positive and respectful interactions. Despite these benefits, many people of color face challenges accessing racially concordant providers. KFF survey data show that most Hispanic, Black, Asian, and American Indian and Alaska Native (AIAN) adults say that fewer than half of their health care visits in the past three years were with a provider who shared their racial or ethnic background. While data show that adults of color are more likely than White adults to prefer a provider of the same race or ethnicity, they are significantly less likely to have one and are more likely to have difficulty finding one.

Recent policy changes may exacerbate challenges to obtaining racially concordant care for those who value it most. In 2023, the U.S. Supreme Court effectively ended race-conscious admissions in higher education, overturning decades of precedent supporting affirmative action. Additionally, as one of his initial actions in office, President Trump issued executive orders eliminating federal diversity, equity, inclusion, and accessibility (DEIA) related programs and actions in the federal government and among federal contractors and grantees. These actions may reduce matriculation rates for students of color and reverse progress in diversifying the health care workforce to reflect the population it serves. For instance, research indicates that the Supreme Court’s 2023 ruling has already led to a decline in the number of Black, Hispanic, and AIAN students entering medical school. Among Black, Hispanic, AIAN, and Native Hawaiian and Pacific Islander (NHPI) medical school enrollees, there was a decline in matriculants between 2023 and 2024. Despite there being more Black and Hispanic applicants in 2024 compared to the previous year, the number of matriculants from historically underrepresented groups declined. It’s unclear how much impact the Supreme Court ruling has already had on medical school matriculation. However, the ruling has the potential to further decrease the diversity of the future physician workforce.

This brief provides an overview of the racial and ethnic composition of physicians compared to the total population at the national and state level based on KFF analysis of 2023 Association of American Medical Colleges (AAMC) Physician Workforce data and American Community Survey data. This analysis shows that Hispanic, Black, AIAN, and NHPI people were underrepresented among physicians relative to their share of the population, with the widest gap observed among Hispanic people who comprised 20% of the total population but only 7% of the total physician workforce. The pattern of underrepresentation held true across most states for Hispanic and Black people, with particularly large gaps for Hispanic people. Asian people accounted for a higher share of physicians than their share of the total population nationally and in all states; in most states, the share of White physicians was similar to or higher than their share of the total population. Data were not available for AIAN and NHPI populations in many states due to small numbers.

Racial and Ethnic Distribution of Physicians

Nationally, Hispanic, Black, AIAN, and NHPI people were underrepresented among physicians relative to their share of the population with the widest gap observed among Hispanic people. While one in five people in the U.S. population was Hispanic, they accounted for just 7% of the physician workforce (Figure 1). Similarly, 12% of the population was Black compared to 6% of the physician workforce. AIAN and NHPI individuals were also underrepresented among physicians compared to their share of the overall population. However, the absolute differences were small, as both groups make up less than one percent of the total population and the physician workforce. In contrast, White people accounted for similar shares of the total population and physician workforce, and Asian people accounted for a larger share of physicians (19%) than their share of the population (6%).

Distribution of People by Race and Ethnicity in the Total Population and Physician Workforce

Across most states, Hispanic and Black people made up a smaller share of physicians compared to their share of the total population, with particularly large gaps for Hispanic people. In 45 states and DC, Hispanic people accounted for a smaller share of providers than their share of the population, as measured by a more than one percentage point difference (Figure 2). In seven states, the difference between the share of the population and providers who are Hispanic was over 15 percentage points. These tended to be states with the highest shares of Hispanic people, including New Mexico, California, and Texas. In New Mexico, Hispanic people made up nearly half (48%) the population but accounted for 17% of providers (a difference of 31 percentage points). In California and Texas, about 40% of the population was Hispanic compared to 7% and 13% of physicians, respectively. In only five states (West Virginia, Vermont, Maine, Mississippi, and Ohio) did Hispanic people account for a similar share of the population and the physician workforce, with a difference of less than one percentage point.

The Hispanic Population Was Most Underrepresented Among Physicians in the West and Southwest

Similarly, in 35 of 50 states and DC, Black people made up a smaller share of physicians compared to their share of the population. In five states and DC, the difference between the share of the population and providers who are Black was 15 percentage points or higher, with the largest gap of 26 percentage points in DC and Mississippi (Figure 3). In DC, 17% of providers were Black compared with 43% of the population, and in Mississippi, Black people made up 11% of physicians compared with 37% of the population.

The Black Population Was Most Underrepresented Among Physicians in the Southeast

Data were insufficient for comparisons for AIAN and NHPI people in most states, but where data were available, AIAN and NHPI people were underrepresented among physicians relative to their share of the population. This pattern was most prominent in states where the majority of AIAN and NHPI people live. For example, In Alaska, AIAN people accounted for 14% of the population, seven times higher than their share of physicians (2%). Additionally, in New Mexico, AIAN people made up 9% of the population compared to 2% of providers, and in South Dakota they comprised 7% of the population compared with 1% of providers. Similarly, in Hawaii, NHPI people made up 10% of the population compared to 2% of physicians. In most remaining states, AIAN and NHPI people accounted for both a small share of the population and providers, so absolute differences in their shares were small.

Asian people accounted for a higher share of physicians than their share of the total population in all states. The largest differences were in Illinois, California, Delaware, and Texas. In Illinois, Asian people made up more than one in four physicians but accounted for only about 5% of the population (Figure 4). There were sizeable differences in the states with the highest shares of Asian people. In Hawaii, 37% of the population was Asian compared with 43% of providers, and in California, 15% of the population was Asian versus 32% of providers. The differences were smaller in other states, like Alaska, Montana, and Vermont, where Asian people accounted for a small share of both providers and the population.

The Asian Population Was Broadly Overrepresented Among Physicians in All States

In most states, the share of White physicians was similar to or higher than their share of the total population. States where White people were most underrepresented among physicians compared to their share of the population included West Virginia (67% vs. 90%), North Dakota (67% vs. 83%), and Michigan (58% vs. 73%) (Figure 5). The pattern in these states reflected higher representation of Asian people among physicians. States where White people were most overrepresented among physicians compared to their share of the population included New Mexico (56% vs. 37%), Alaska (77% vs. 58%), and Mississippi (70% vs. 55%).

The White Population Was Most Overrepresented Among Physicians in the Midwest

A similar pattern was observed across medical specialties, with Hispanic and Black individuals underrepresented in more specialties than other racial and ethnic groups. Specialties providing primary care—such as family medicine, pediatrics, and obstetrics/gynecology—tended to better reflect the racial and ethnic distribution of the population. Among all specialties, providers in nephrology and interventional cardiology had the least racial and ethnic representation compared to the national population. The Hispanic population was the most underrepresented group in more than half of the specialties analyzed (27 out of 51 specialties). The Black population was the most underrepresented group in 9 out of 51 specialties.

Methods

KFF collected U.S. Physician Workforce data from the Association of American Medical Colleges (AAMC) from the dashboard for 2023, aggregated by specialty and location. Although race/ethnicity data were provided as “alone or in combination,” categories were treated as exclusive in the analysis since a “multiracial” option was provided. Respondents with unknown race/ethnicity were proportionally distributed within each state to all other categories. Due to values being masked due to small cell sizes, only the Asian, Black, Hispanic, and White categories were used in the provider specialty analysis, where only specialties with more than 5,000 active physicians were included. For comparison to the population at large, 5-year estimates from the 2023 American Community Survey were used to determine the racial and ethnic distribution of the total population for each state, using single-response values for not Hispanic or Latino, and any response for Hispanic or Latino. To determine how well the active physician population matches the national population for each specialty, an index of dissimilarity was used, proportional to the total percentage point difference in the race/ethnicity share of providers and the country overall. To assess the robustness of this method, Kullback–Leibler divergence was calculated for each specialty, a measure of statistical distance between the race/ethnicity distribution among physicians and that of the national population. Rank order among the specialties was similar for both methods.

News Release

Victoria DeFrancesco Soto Joins KFF Board of Trustees

Published: Jul 21, 2025

San Francisco – KFF announced today that Dr. Victoria DeFrancesco Soto has joined KFF’s Board of Trustees. DeFrancesco Soto is the Dean of the Clinton School of Public Service at the University of Arkansas and previously served as Assistant Dean at the LBJ School of Public Affairs at the University of Texas at Austin. She has served as a trusted voice of political analysis for NBC News and Telemundo.

“It is my honor to serve on the KFF board,” said DeFrancesco Soto. “As an educator I am passionate about making research tangible to our day-to-day lives. KFF is a national model for translating the power of data and research into action. I am excited to roll up my sleeves and deeply engage in the impactful work of KFF.”

“Victoria’s deep knowledge of politics, policy, and media is a perfect fit for KFF, and we will benefit tremendously from her expertise and experience as we continue to expand our role as health care’s independent source of policy analysis, polling, and journalism,” said Dr. Drew Altman, President and CEO.

Dr. DeFrancesco Soto is the first Latina Dean at a presidential institution and is a fellow of the National Academy of Public Administration. She previously taught at Northwestern University and Rutgers and received her Ph.D. in political science from Duke University.

Her areas of expertise include civic engagement, women, immigration, Latinos and political psychology. Underlying all of her research interests is the applicability of high-quality, rigorous research to on-the-ground policy realities. 

KFF’s Board of Trustees is chaired by former U.S. Senator Olympia Snowe and its members have deep backgrounds in public service, academia, nonprofit organizations, health care, and the media.

Board members serve up to two, five-year terms. Additional information about KFF’s board can be found at https://www.kff.org/board-of-trustees/.

New Policy Bars Many Lawfully Present and Undocumented Immigrants from a Broad Range of Federal Health and Social Supports

Published: Jul 21, 2025

Editorial Note

This content was updated on October 23, 2025 to include changes to the policy following court orders.

On July 14, 2025, the U.S. Department of Health and Human Services (HHS) issued a notice of a policy change to update the definition of “federal public benefits” as outlined in the Personal Responsibility and Work Opportunity Reconciliation Act of 1996 (PRWORA) to add an additional 13 programs to the 31 programs considered “federal public benefits” that are restricted to individuals with a “qualified” immigration status. The notice further indicates that the updated list of federal benefits is not exhaustive, and additional programs may be added in the future. This change bars many groups of lawfully present immigrants as well as undocumented immigrants from accessing many health care, educational, and other social services and will likely have negative impacts on the health and well-being of immigrant families due to more limited access to services as well as confusion and fear about using services. It also may create new challenges and complexities for service providers. Many implementation questions remain unclear and subject to future guidance, including how verification of immigration status may occur and how the policy will be reconciled with existing conflicting statutory and regulatory requirements, which supersede the guidance. This policy change was expected to take effect immediately upon publication of the notice in the federal register on July 14, 2025, although it provided for a 30-day comment period. However, the HHS has agreed to delay implementation until September 11, 2025, following court orders. Further, on September 10, 2025, a District Court issued an injunction on the administration’s new policy, blocking the implementation of the policy as it relates to the Health Center Program and Head Start in 20 states and D.C.

Prior Policy under PRWORA

When enacted in 1996, PRWORA established federal requirements that limited eligibility for “federal public benefits” to groups who are “qualified immigrants.” The groups defined as “qualified immigrants” are more limited than groups who are considered lawfully present in the U.S. and exclude undocumented immigrants. Notably, qualified immigrants do not include people with Temporary Protected Status and people with deferred action, including Deferred Action for Childhood Arrivals recipients, among other lawfully present groups (Box 1).

Box 1: Lawfully Present Immigrants by Qualified Status

Qualified Immigrants

Other Lawfully Present Immigrants

  • Lawful permanent resident (LPR or green card holder)
  • Refugee
  • Asylee
  • Cuban/Haitian entrant
  • Paroled into the U.S. for at least one year
  • Conditional entrant granted before 1980
  • Granted withholding of deportation
  • Battered noncitizen, spouse, child, or parent
  • Victims of trafficking and their spouse, child, sibling, or parent or individuals with pending application for a victim of trafficking visa
  • Member of a federally recognized Indian tribe or American Indian born in Canada
  • Citizens of the Marshall Islands, Micronesia, and Palau who are living in one of the U.S. states or territories (referred to as Compact of Free Association or COFA migrants)
  • Granted Withholding of Deportation or Withholding of Removal, under the immigration laws or under the Convention against Torture (CAT)
  • Individual with Non-Immigrant Status, includes workers visas, student visas, U-visa, and other visas, and citizens of Micronesia, the Marshall Islands, and Palau
  • Temporary Protected Status (TPS)
  • Deferred Enforced Departure (DED)
  • Deferred Action Status
  • Lawful Temporary Resident
  • Administrative order staying removal issued by the Department of Homeland Security
  • Resident of American Samoa
  • Applicants for certain statuses
  • People with certain statuses who have employment authorization

The PROWRA legislation provided discretion to federal agencies to determine which benefits and programs are “federal public benefits,” while also identifying specific exemptions such as treatment for emergency medical conditions, certain disaster relief, immunizations, and testing and treatment for communicable diseases. It also clarified that non-profit organizations were not required to verify the immigration status of individuals receiving benefits or services. Under policy established in 1998, HHS identified 31 health and social programs considered to be “federal public benefits” restricted to “qualified immigrants,” including major health coverage programs such as Medicaid (excluding emergency Medicaid), Medicare, and the Children’s Health Insurance Program (CHIP).

Changes under the 2025 Policy

The 2025 policy expands the list of programs considered “federal public benefits” by adding 13 additional programs, including Head Start, the health center program, the Title X family planning program, among others (Box 2). The notice further indicates that the list is not exhaustive, and additional programs may be added to in the future. However, policy implementation related to the Health Center Program and Head Start is blocked in 20 states and D.C. following an injunction issued by a District Court in September 2025.

Box 2: New Programs Considered “Federal Public Benefits” Under the 2025 Policy Change

  • Certified Community Behavioral Health Clinics
  • Community Mental Health Services Block Grant
  • Community Services Block Grant (CSBG)
  • Head Start
  • Health Center Program
  • Health Workforce Programs not otherwise previously covered (including grants, loans, scholarships, payments, and loan repayments)
  • Mental Health and Substance Use Disorder Treatment, Prevention, and Recovery Support Services Programs administered by the Substance Abuse and Mental Health Services Administration
  • Projects for Assistance in Transition from Homelessness Grant Program
  • Substance Use Prevention, Treatment, and Recovery Services Block Grant
  • Title IV-E Educational and Training Voucher Program
  • Title IV-E Kinship Guardianship Assistance Program
  • Title IV-E Prevention Services Program
  • Title X Family Planning Program
  • List is not exhaustive and may be added to in the future

Source: U.S. Department of Health and Human Services (July 2025), “HHS Bans Illegal Aliens from Accessing its Taxpayer-Funded Programs

Implications of the Policy Change

The policy change bars many lawfully present and undocumented immigrants from services that are important for their health and well-being. These programs include certain programs that are particularly important for immigrant families, such as the federal Health Center program, which funds a network of Community Health Centers (CHCs). Community health centers are a national network of over 1,300 safety-net primary care providers located in medically underserved communities and serve all patients regardless of their ability to pay, providing a range of medical, behavioral, and supportive services. Data from the 2023 KFF/LA Times Survey of Immigrants show that three in ten immigrant adults say a CHC is their usual source of care, with this share rising to about four in ten among likely undocumented immigrant adults (42%) and those with limited English proficiency (39%) (Figure 1). The policy also bars immigrants without a “qualified” immigration status from accessing federally funded mental and behavioral health services at a time when many immigrant families are experiencing heightened stress and anxiety due to immigration-related fears and financial uncertainty, as well as from Title X services, which provide comprehensive family planning services to low-income and uninsured individuals.

Three in Ten Immigrant Adults Say That  Community Health Centers are Their Usual Source of Care

Beyond health care, the policy also limits access to services that support education, including the Head Start Program. Research shows that adults with higher educational attainment tend to have longer lifespans and be healthier than their counterparts with lower educational attainment. High educational attainment also is associated with better jobs that are more likely to provide employer-sponsored health coverage and higher incomes which, in turn, improve access to health care and resources to support health.

The new policy also will affect service providers who may need to update their policies and procedures to comply with the changes. Under PRWORA, program benefit providers are prohibited from providing “federal public benefits” to people who are not citizens or qualified immigrants and are required to verify that an applicant is a qualified immigrant eligible for services. The notice confirms an existing exemption in the law that non-profit charitable organizations are not required to verify immigration status. However, many implementation questions currently remain unclear and subject to future guidance, including how verification of immigration status may occur. Moreover, the policy does not supersede existing statutory and regulatory requirements. For example, although the notice limits the health center program to “qualified immigrants,” it does not change the underlying statutory requirements for CHCs to serve patients regardless of immigration status. While federal law supersedes guidance, this conflict creates challenges for CHCs in how they will apply this guidance, and it remains to be seen how enforcement of the guidance will affect CHCs' ability to provide care. Additionally, as noted, the notice indicates that the list of programs affected by the change is not exhaustive, so additional programs may be added in the future.

The notice estimates that the policy change will result in savings from reduced use of programs by certain immigrants as well as new administrative costs. Savings are estimated to derive from excluding certain immigrants from HHS programs with a corresponding increase in benefits for U.S. citizens and qualified immigrants. There also are estimated to be new administrative costs associated with individuals being required to document their eligibility, for immigration status to be verified, and for changes in program eligibility and operating policies and procedures.

The policy change occurs against a backdrop of other policy changes restricting immigrant access to health and other programs and increased immigration enforcement activity. These changes include new restrictions established under budget reconciliation that limit Medicaid, Medicare, and subsidized Affordable Care Act (ACA) Marketplace coverage to lawful permanent residents, certain Cuban and Haitian entrants, and citizens of the Freely Associated States (COFA migrants). Together, these changes will likely have broad chilling effects on immigrant families, resulting in increased reluctance to access services and programs due to fear and confusion. More limited access to programs and services may lead to negative impacts on their health and well-being. These effects may extend across immigrant families, who often include citizen children—with one in four children in the U.S. living with at least one immigrant parent—and have broader impacts on communities, given immigrants’ role in the workforce.

News Release

Insurers’ Preliminary Rate Filings Anticipate Biggest Increases in ACA Marketplace Plan Premiums Since 2018

Scheduled Expiration of Enhanced Tax Credits and Impact of Tariffs Among Factors Pushing Premiums Higher

Published: Jul 18, 2025

Note: For updated data on proposed ACA Marketplace premiums from more than 300 insurers in all 50 states and DC, read our updated analysis.

ACA Marketplace insurers are proposing a median premium increase of 15% for 2026, according to a new analysis of preliminary rate filings. Based on the early indications, individual market insurers will introduce the largest hike in premiums since 2018, the last time policy uncertainty contributed to sharp premium growth.

Across the 105 ACA Marketplace insurers in 19 states and DC that have submitted rate filings so far, most are requesting premium increases of 10% to 20% for 2026, and more than a quarter are proposing premium increases of 20% or more.

In addition to the anticipated growth in the cost of health care services, insurers have cited several policy changes that they expect to drive up rates next year, including the following:

  • The expiration of the enhanced premium tax credits at the end of this year, which have made coverage more affordable and contributed to record-high enrollment in the ACA Marketplaces, is expected to drive up out-of-pocket premium payments by more than 75% on average and cause many healthier enrollees to drop their coverage.
  • The impact of tariffs on some drugs, medical equipment, and supplies. Some insurers estimate that they could increase premiums by an average of 3% more than they otherwise would have.

Other factors could also affect premium changes, including the budget reconciliation legislation and Marketplace Integrity and Affordability rule, both of which were enacted and finalized after many of these insurers submitted their preliminary rate filings. Finalized 2026 rate changes are expected to be published in late summer.Subsidized enrollees are generally shielded from annual rate increases as their tax credits keep premium payments capped at a portion of their income.

However, with enhanced tax credits set to expire later this year if Congress takes no action to extend them, subsidized enrollees will pay more because they have less financial assistance. Middle income people with incomes above four times the poverty level would no longer be eligible for assistance and would have to shoulder the full premium.

The full analysis and other data on health costs are available on the Peterson-KFF Health System Tracker, an online information hub dedicated to monitoring and assessing the performance of the U.S. health system.

Individual Market Insurers Requesting Largest Premium Increases in More Than 5 Years

Authors: Jared Ortaliza, Matt McGough, Kaitlyn Vu, Shameek Rakshit, Imani Telesford, Lynne Cotter, Emma Wager, and Cynthia Cox
Published: Jul 18, 2025

Note: For updated data on ACA Marketplace premiums from more than 300 insurers in all 50 states and DC, read our updated analysis.

This analysis of preliminary rate filings submitted by 105 ACA Marketplace insurers in 19 states and DC finds that ACA Marketplace insurers are requesting a median premium increase of 15% for 2026, which would represent the largest hike in premiums since 2018, the last time policy uncertainty contributed to sharp premium growth.

In addition to the anticipated growth in the cost of health care services, insurers have cited several policy changes that they expect to drive up rates next year, including the expiration of the enhanced premium tax credits at the end of this year and the impact of tariffs on some drugs, medical equipment, and supplies.

The full analysis and other data on health costs are available on the Peterson-KFF Health System Tracker, an online information hub dedicated to monitoring and assessing the performance of the U.S. health system.