Rural and Urban Health Center Patients and Financing

Published: Oct 5, 2026

Community health centers are a national network of safety-net primary care providers located in medically underserved rural and urban communities. They provide comprehensive primary care services to patients regardless of their ability to pay, offering a range of medical, mental health, and supportive services. The Health Resources and Services Administration (HRSA) designates health centers as rural if they serve non-metropolitan areas with specific population density and geographic characteristics. Rural health centers served one in five rural residents in 2025.

Rural area health care provider shortages and limited access to health care services, including as a result of hospital closures, may increase rural residents’ reliance on health centers for services. Research on hospital closures between 2006 and 2018 found that areas with rural hospital closures were more likely to have new health center sites in the years that followed, suggesting that the rural health centers may help offset reduced access to primary and preventive care services in these areas.

Changes to Medicaid and the Affordable Care Act (ACA) Marketplace included in the 2025 reconciliation law and the expiration of ACA Marketplace enhanced premium tax credits at the end of 2025 may increase the number of uninsured rural health center patients and place additional financial burdens on rural health centers, hampering their ability to serve as a safety net. KFF estimated that the reductions in federal spending due to Medicaid changes included in the law alone could be $137 billion over 10 years in rural areas. To address the impacts on rural areas, Congress added $50 billion in funding over a five-year period for a Rural Health Transformation Program to the 2025 reconciliation law, but it is unclear the extent to which the funds will offset health center revenue losses due to federal policy changes and spending cuts.

This brief reports on rural and urban health center patients and financing in 2025 using national data from the Uniform Data System (UDS), to which all health centers are required to report annually.

Key takeaways include the following:

  • Rural health center organizations made up four in ten health centers nationwide, serving three in ten (31%, or 10.2 million) health center patients at over 6,900 delivery sites.
  • White patients represented the majority of patients at rural health centers while patients of color made up a majority at urban health centers. Compared with urban health centers, rural health centers served a higher share of patients ages 65 and older, and an outsized share of rural health center patients were veterans, worked in agriculture, or were patients at school-based health centers.
  • Medicaid was the primary source of health coverage among both rural and urban health center patients, with nearly four in ten (37%) rural health center patients covered by Medicaid.
  • Medicaid was the primary source of revenue for both rural and urban health centers, accounting for about one-third (32%) of revenue among rural health centers.

Rural and Urban Health Centers and Patients

Rural health centers made up four in ten (42%) health center organizations and served three in ten (31%, or 10.2 million) health center patients in 2025 (Figure 1). Nearly 600 rural health center organizations operated over 6,900 health center sites in 2025. Meanwhile, urban health centers made up nearly six in ten (58%, or about 800) health center organizations and served seven in ten (69%, or about 22.6 million) health center patients across over 9,700 health center sites. Rural health center organizations generally served fewer patients and had an average annual patient volume that was 38% lower than that of urban health centers.
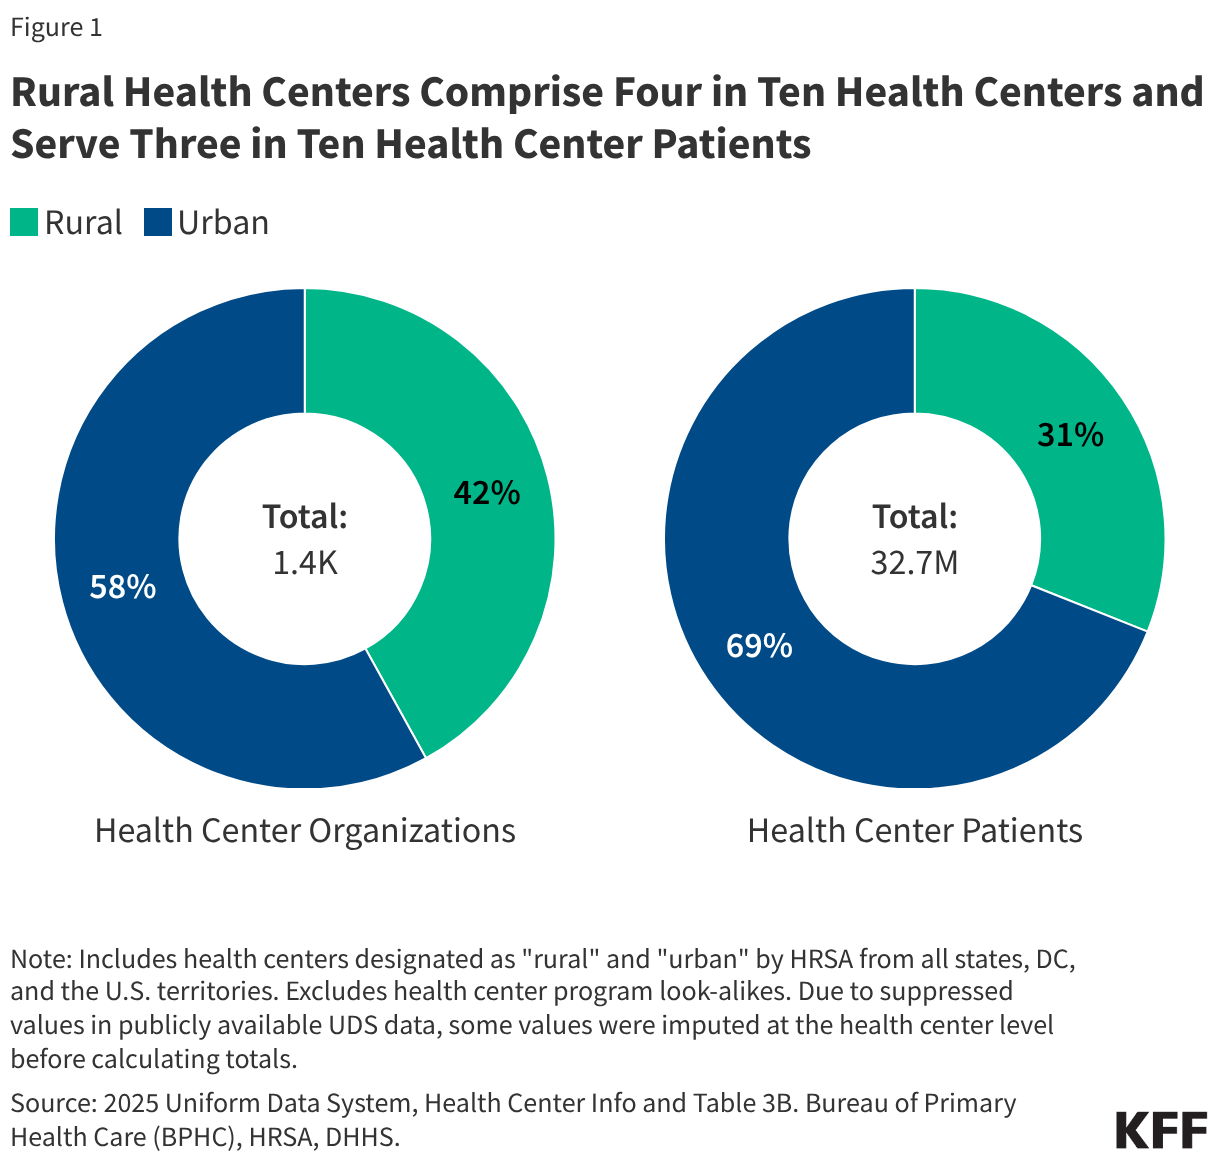
Rural Health Centers Make Up Four in Ten Health Centers and Serve Three in Ten Health Center Patients (Small multiple donut chart)

The share of health center organizations designated as rural varied widely by state in 2025. States with relatively high shares of their population living in rural areas had higher shares of health centers designated as rural, with over 90% of health center organizations designated as rural in Montana (100%), Alaska (96%), Maine (94%), and Vermont (91%) (Figure 2). In contrast, shares of health centers designated as urban were higher in states with small shares of their population living in rural areas, with at least 80% of health center organizations designated urban in Connecticut (88%), Rhode Island (88%), Massachusetts (86%), Florida (85%), New York (83%), and California (82%). All health center organizations were designated as urban in DC, New Jersey, and Nevada. However, a rural health center organization based in Arizona operated one rural clinic in Nevada in 2025.
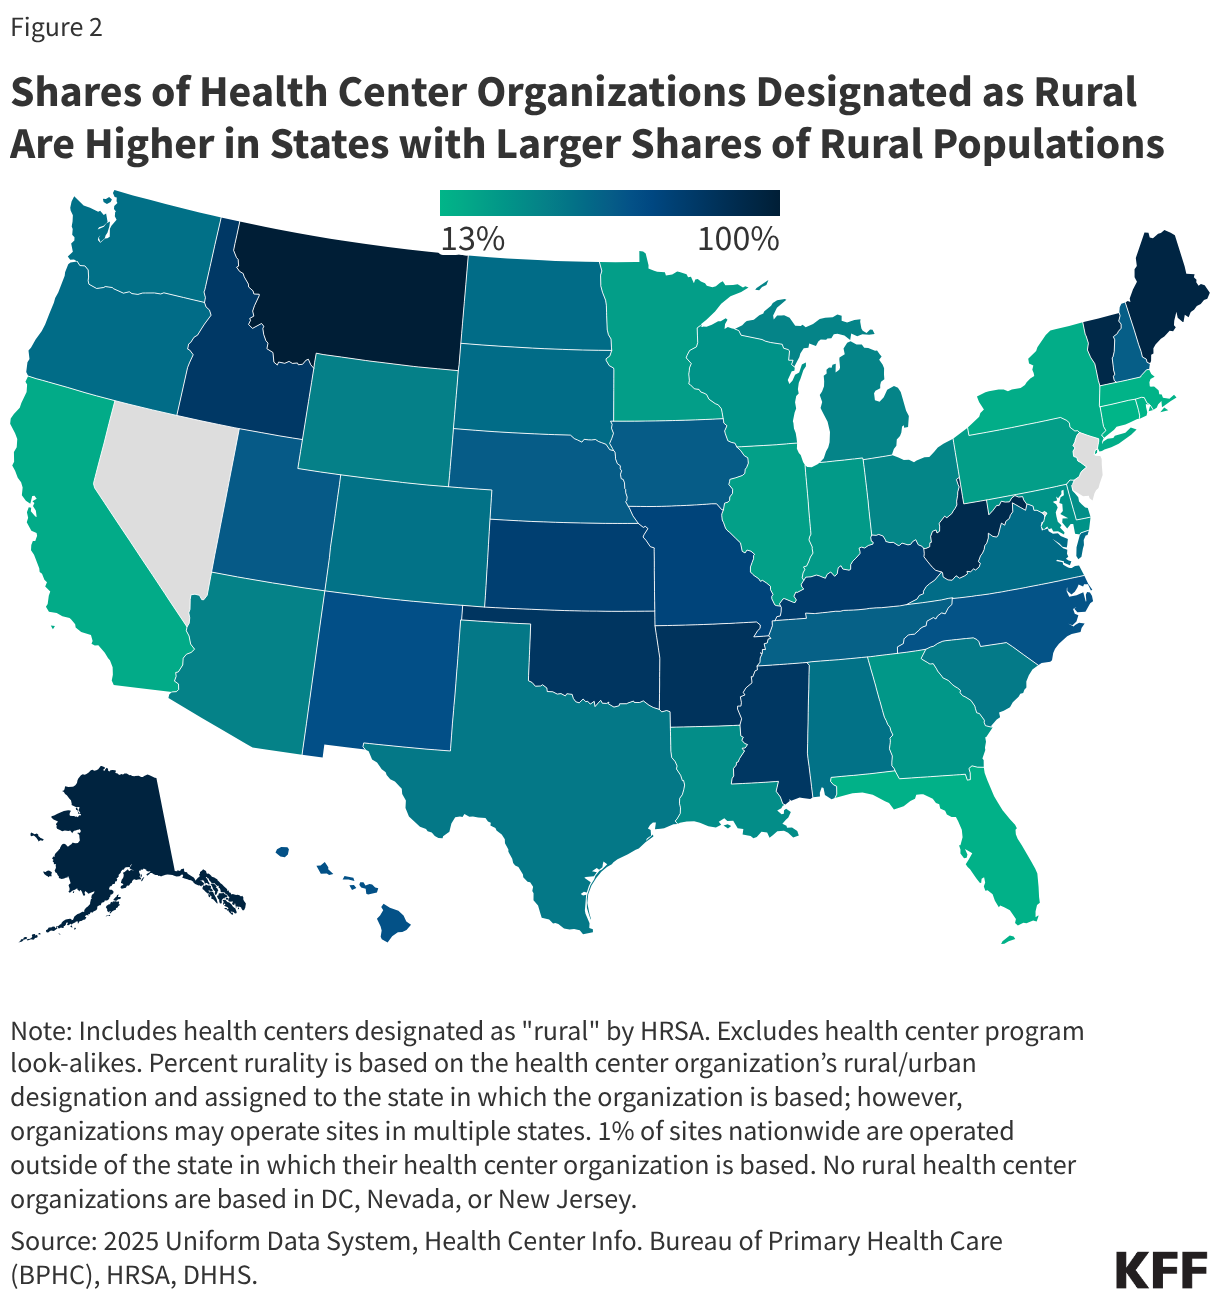
Shares of Health Center Organizations Designated as Rural Are Higher in States with Larger Shares of Rural Populations (Choropleth map)

Rural health centers served higher shares of adult patients ages 65 and older than urban health centers in 2025. Rural health centers had higher shares of adult patients ages 65 and older (18%) compared with urban health centers (11%), reflecting national trends of disproportionately higher shares of older adults in rural areas (Figure 3). Rural health centers also had slightly smaller shares of adult patients ages 18–64 (57% vs. 60%) and children ages 0–17 (26% vs. 30%) compared with urban health centers.
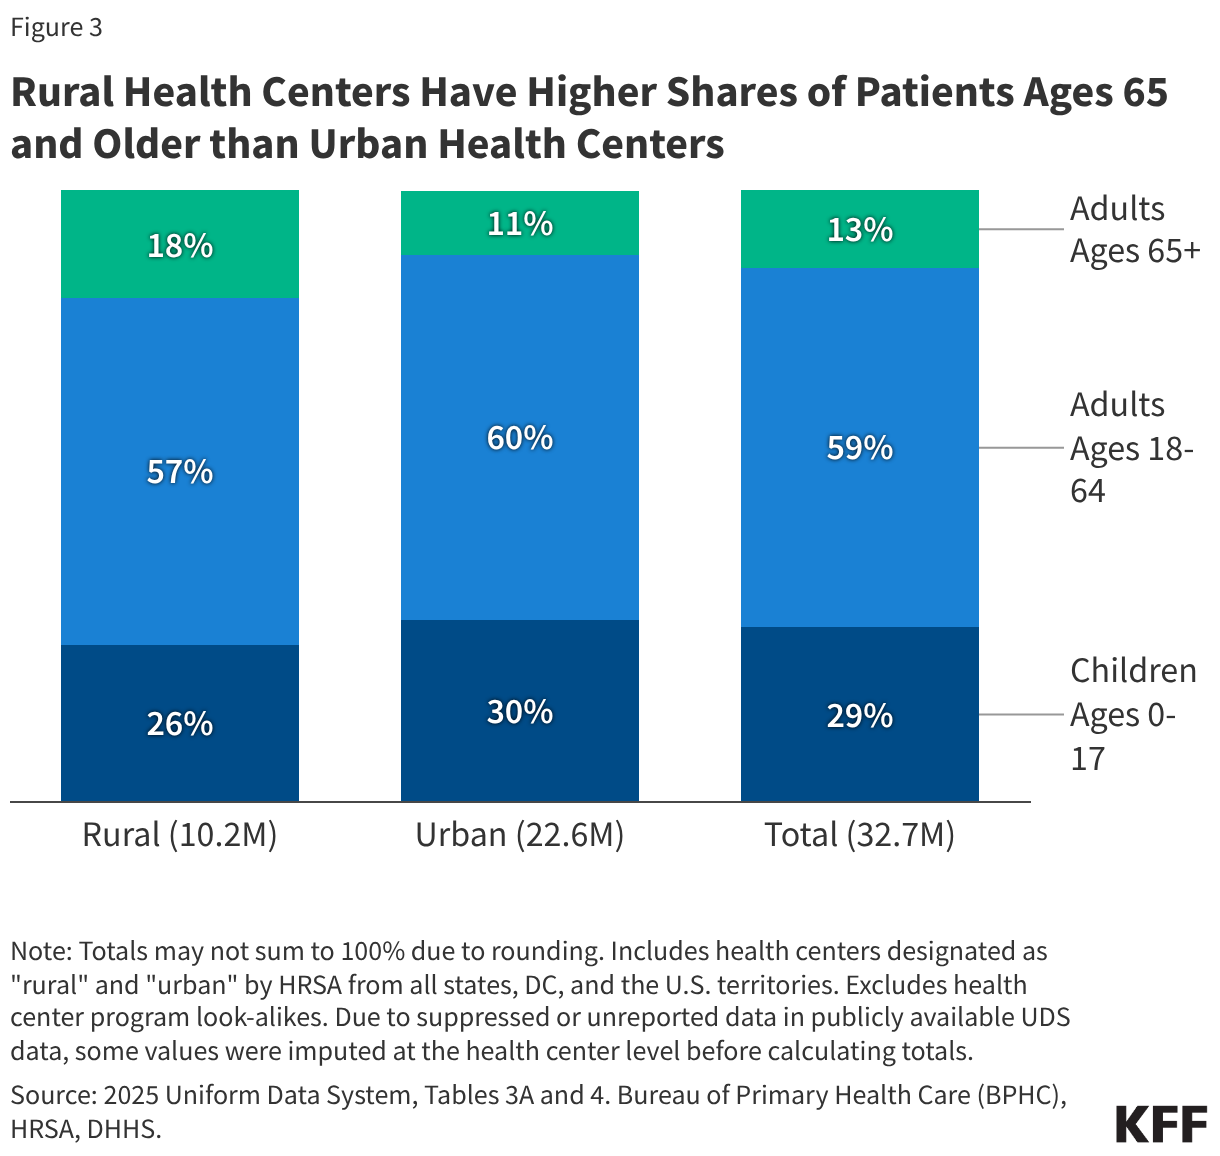
Rural Health Centers Have Higher Shares of Patients Ages 65 and Older than Urban Health Centers (Stacked column chart)

Over half (57%) of rural health center patients had income under 100% of the federal poverty level (FPL) in 2025, lower than among urban health center patients (72%) (Figure 4). Most health center patients at both rural and urban health centers had income under 200% FPL; however, 16% of patients at rural health centers had income above 200% FPL, double the share at urban health centers (8%). While rural areas have higher poverty rates than urban areas, rural health centers are more likely to serve entire rural communities and serve smaller shares of patients facing substantial economic hardship, such as patients experiencing homelessness, compared with urban health centers. These factors may partly explain the differences in the income distribution of patients across rural and urban health centers.
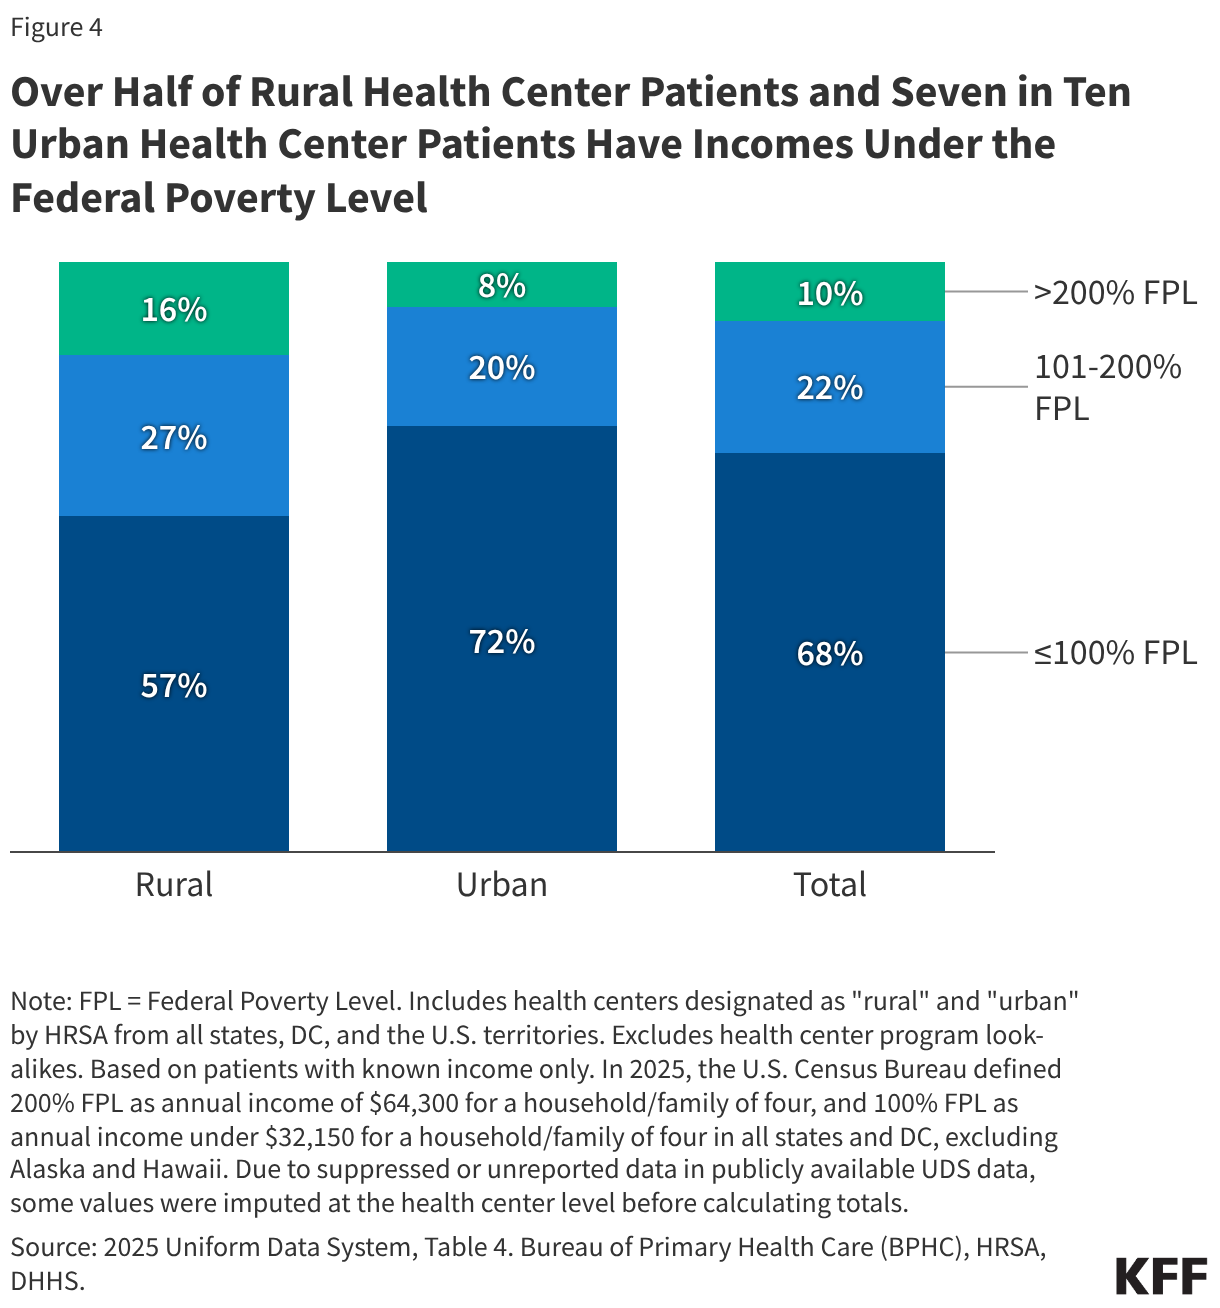
Over Half of Rural Health Center Patients and Seven in Ten Urban Health Center Patients Have Incomes Under the Federal Poverty Level (Stacked column chart)

White patients represented the majority (58%) of patients at rural health centers while patients of color made up a majority (78%) of patients at urban health centers in 2025 (Figure 5). These differences in patient race and ethnicity reflect broader demographic differences between low-income populations in rural and urban areas. Rural health centers serve a higher share of people of color than are represented in the overall rural population, where about one in four residents are people of color.
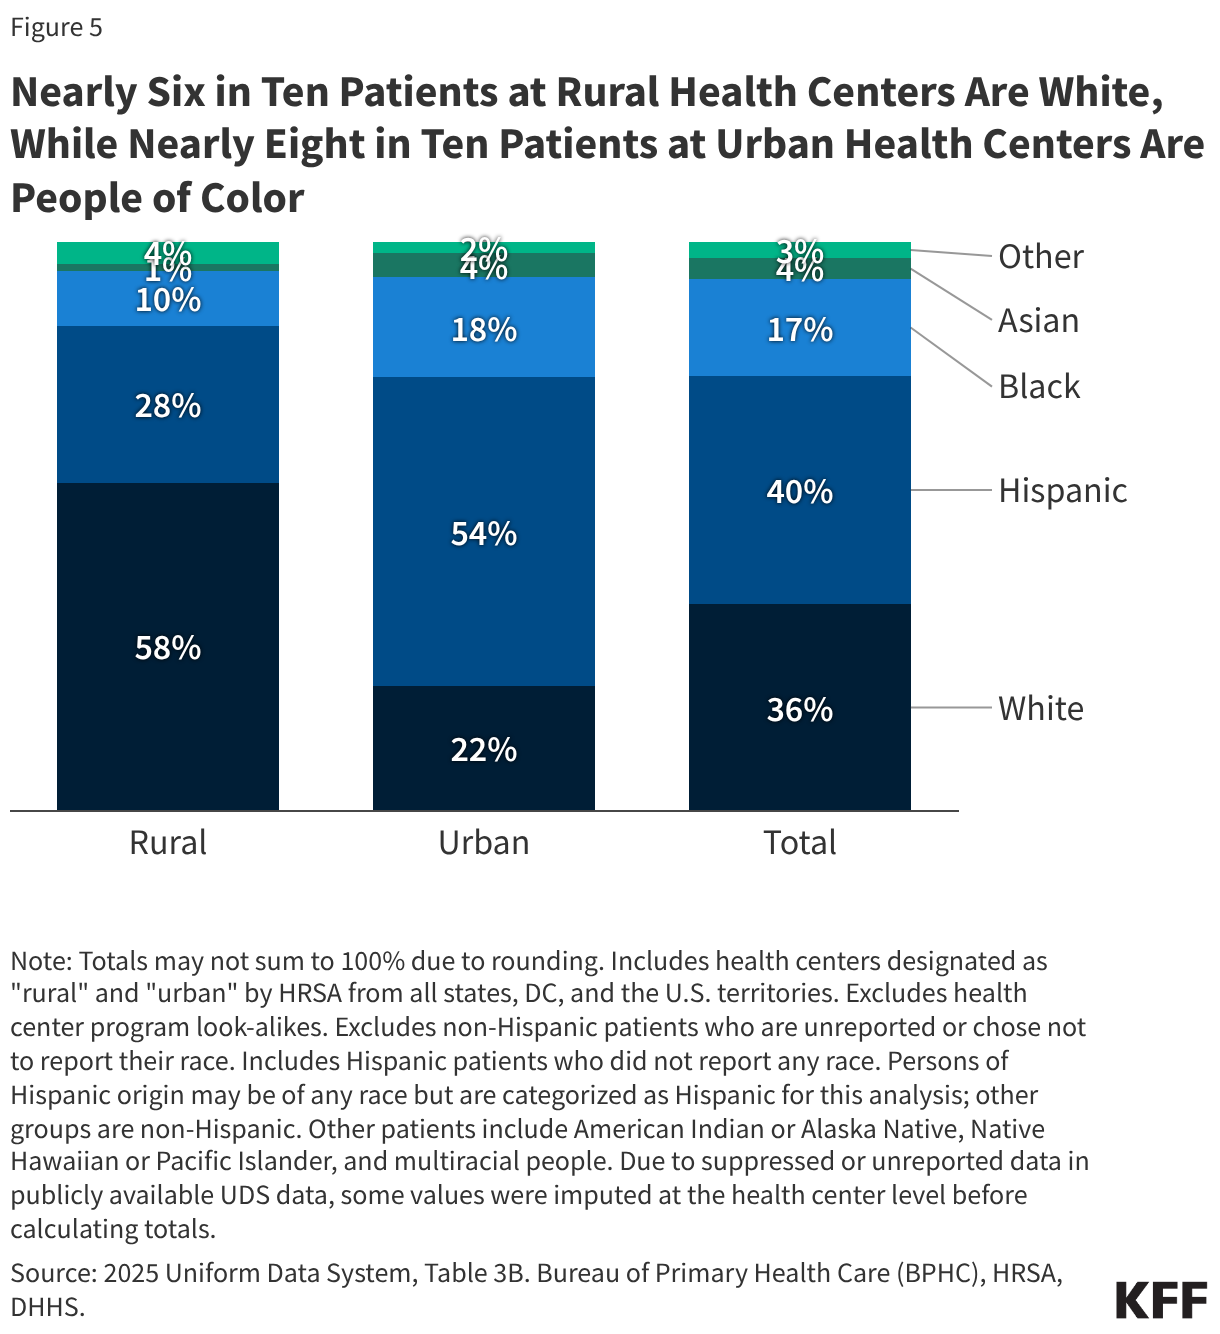
Nearly Six in Ten Patients at Rural Health Centers Are White, While Nearly Eight in Ten Patients at Urban Health Centers Are People of Color (Stacked column chart)

Rural health centers served an outsized share of veterans, agricultural workers, and patients at school-based clinics relative to their share of the total health center patient population in 2025. While rural health centers served 31% of all health center patients, they served 53% of health center patients who were veterans, 41% of health center patients and their family members who worked in agriculture, and 36% of patients served at school-based clinics (Figure 6). Rural health centers served a relatively lower share of all health center patients experiencing homelessness (17%) and patients best served in a language other than English (15%). These patterns reflect national trends where rural areas have a higher concentration of agricultural jobs and veterans compared with urban areas, while urban areas have higher concentrations of people experiencing homelessness and with limited English proficiency.
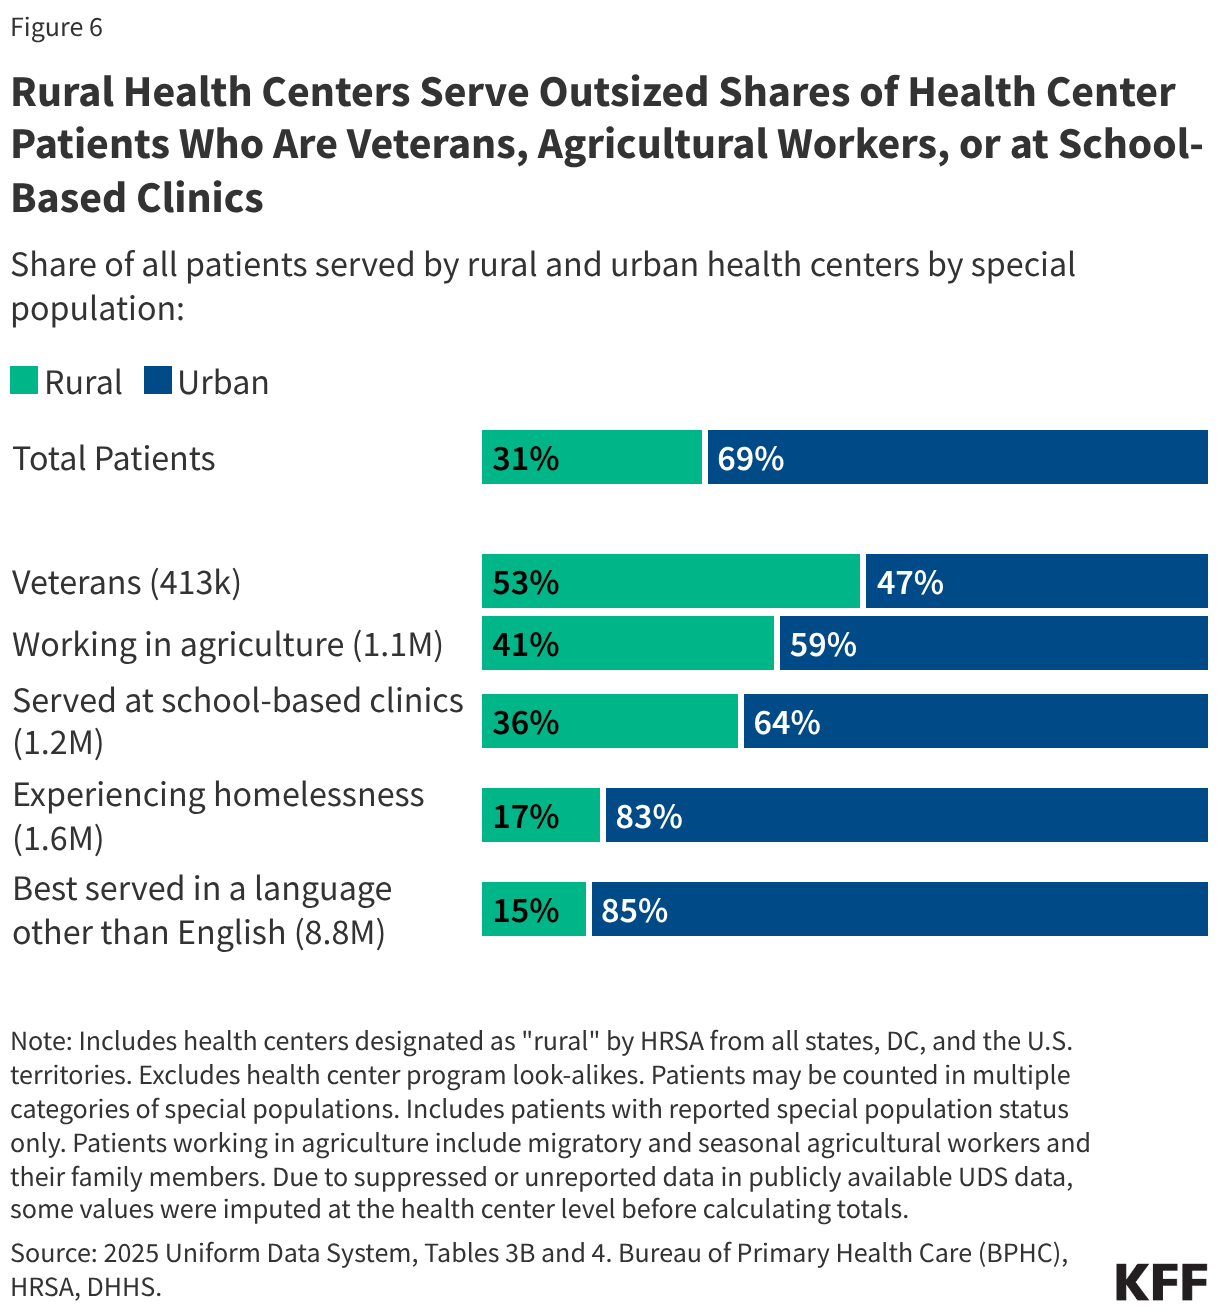
Rural Health Centers Serve Outsized Shares of Health Center Patients Who Are Veterans, Agricultural Workers, or at School-Based Clinics (Stacked Bars)

Health Coverage of Rural and Urban Health Center Patients

Medicaid was the primary source of health coverage among both rural and urban health center patients, with nearly four in ten (37%) rural health center patients covered by Medicaid in 2025, compared with over half (53%) of urban health center patients (Figure 7). Compared with urban health centers, rural health centers had higher shares of patients covered by Medicare (12% vs. 5%) and private coverage (31% vs. 19%). Patients with ACA Marketplace coverage are enrolled in private health insurance plans and are, therefore, categorized as private coverage. The share of patients who were uninsured was also lower among rural health centers compared with urban health centers (15% vs. 18%). Health coverage patterns reflect the composition of rural health center patients, particularly the smaller share of patients living in poverty and higher share of patients ages 65 and older compared with urban health center patients. The higher share of uninsured urban health center patients may also reflect the more limited availability of health care providers for those who are uninsured in rural areas.
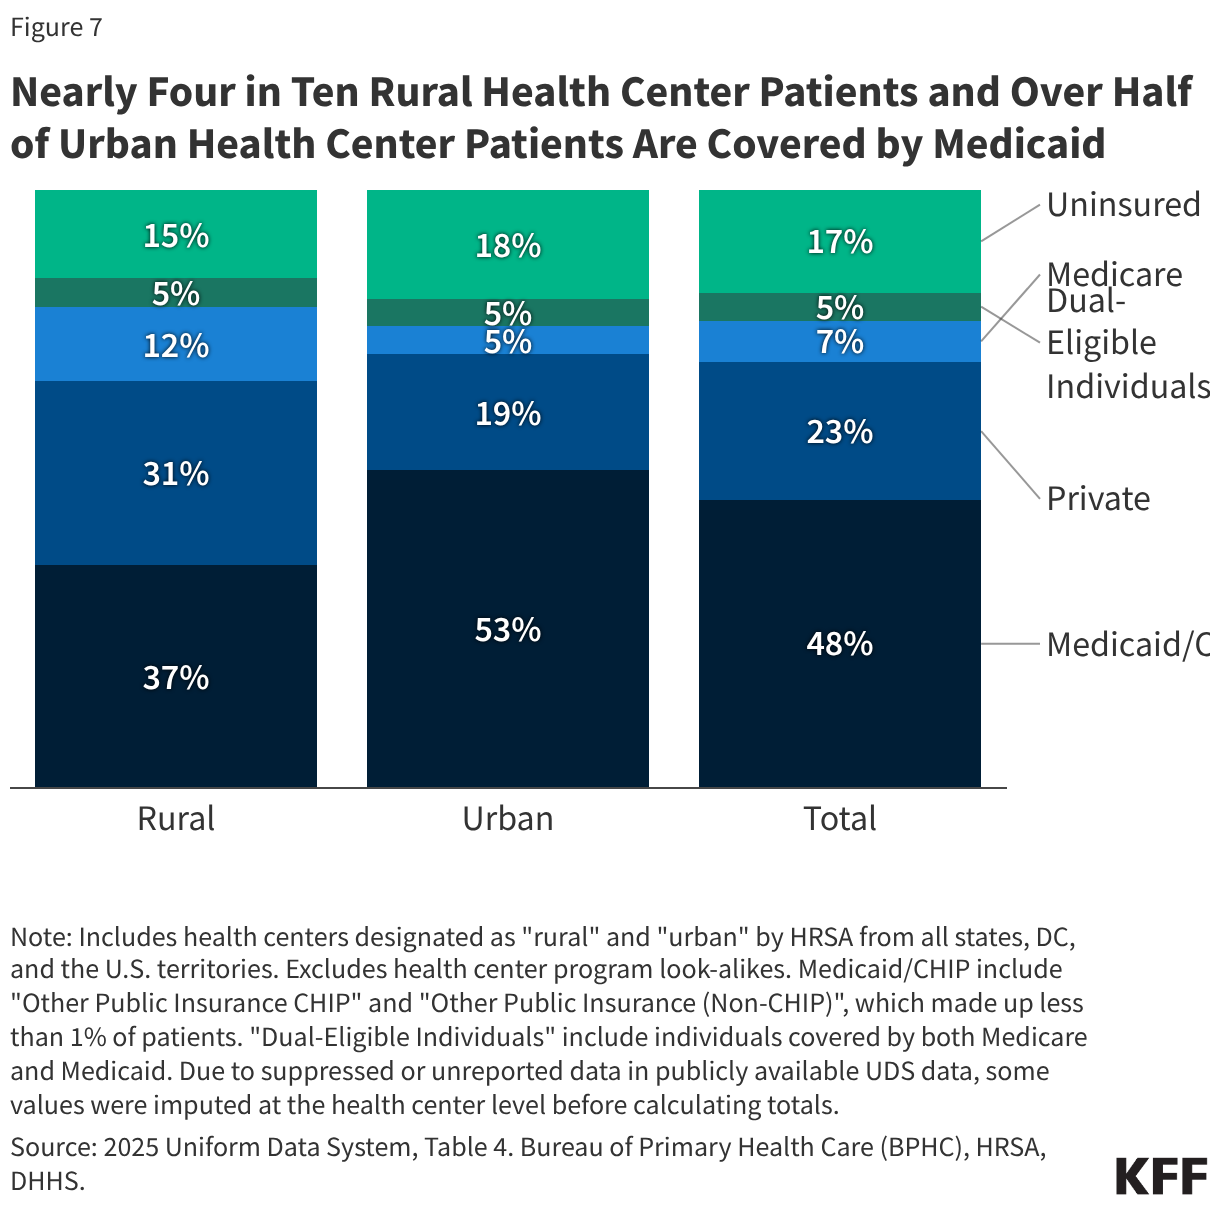
Nearly Four in Ten Rural Health Center Patients and Over Half of Urban Health Center Patients Are Covered by Medicaid (Stacked column chart)

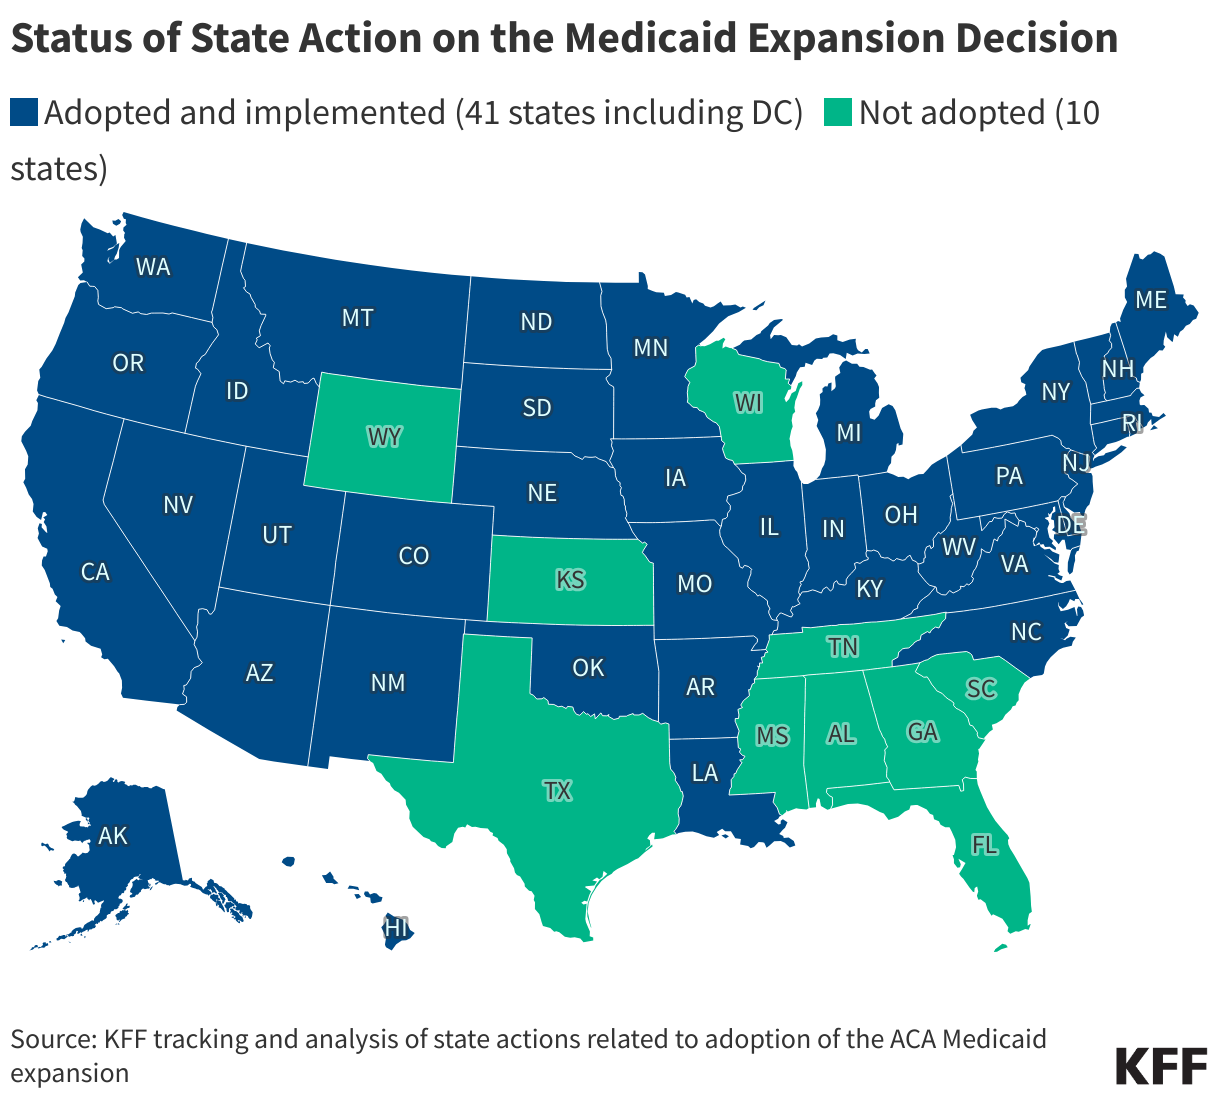
Both rural and urban health centers in Medicaid expansion states had higher shares of patients covered by Medicaid and lower shares of patients who were uninsured than those in non-expansion states in 2025. Rural health centers in Medicaid expansion states had higher shares of patients covered by Medicaid (39% vs. 27%) and about half the share of uninsured patients (12% vs. 23%) compared with those in non-expansion states (Figure 8). The same trend occurred among urban health center patients, though the differences were starker. Urban health centers in expansion states had higher shares of patients covered by Medicaid (57% vs. 36%) and lower shares of patients who were uninsured (16% vs. 29%) compared with urban health centers in non-expansion states. Medicaid expansion is linked to reduced rates of uninsurance, increased health care affordability, improvements in access to care and health outcomes, and economic benefits for states and providers.
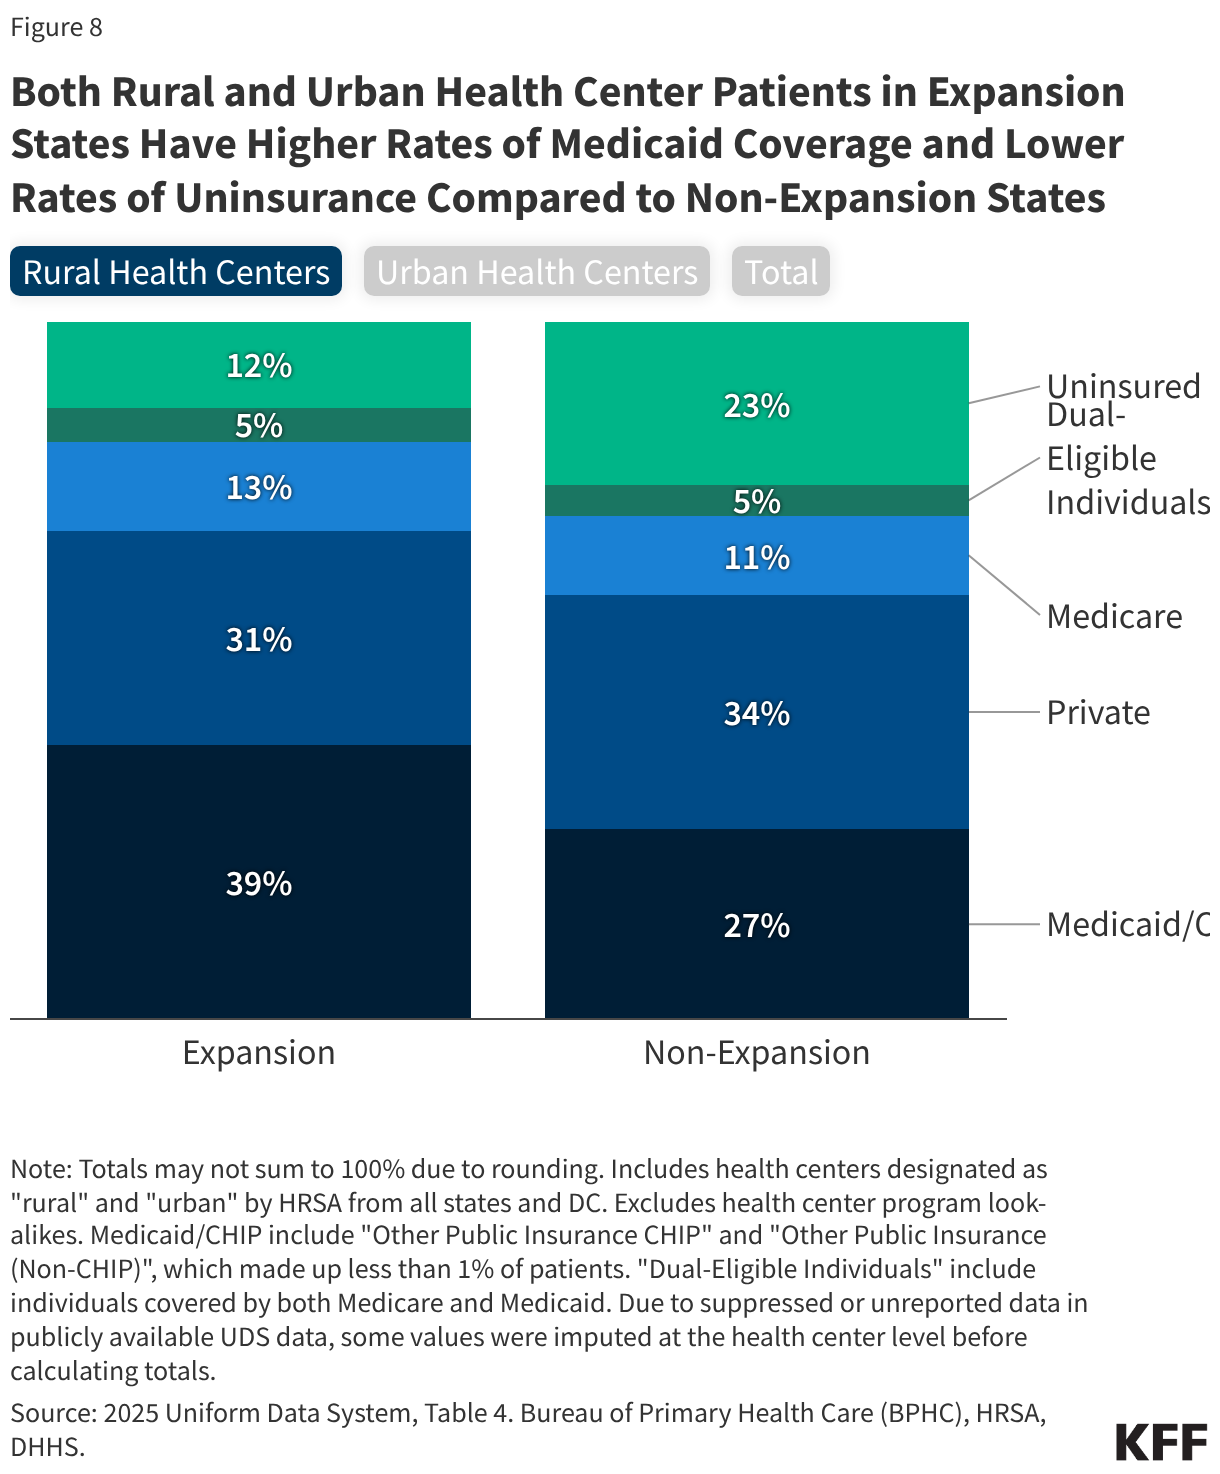
Both Rural and Urban Health Center Patients in Expansion States Have Higher Rates of Medicaid Coverage and Lower Rates of Uninsurance Compared to Non-Expansion States (Stacked column chart)

While Medicaid is an important source of coverage for rural health center patients, the share of child and adult rural health center patients covered by Medicaid varied widely by state in 2025 (Figure 9). Nationwide, about 1.7 million (66%) child rural health center patients ages 0–17 and 2.4 million (33%) adult rural health center patients ages 18 and older were covered by Medicaid and the Children's Health Insurance Program (CHIP), including dual-eligible health center patients who had both Medicare and Medicaid coverage. The share of child rural health center patients covered by Medicaid ranged from less than 50% in three states to more than 75% in five states. The share of adult rural health center patients covered by Medicaid ranged from less than 20% in eight states to more than 50% in five states.
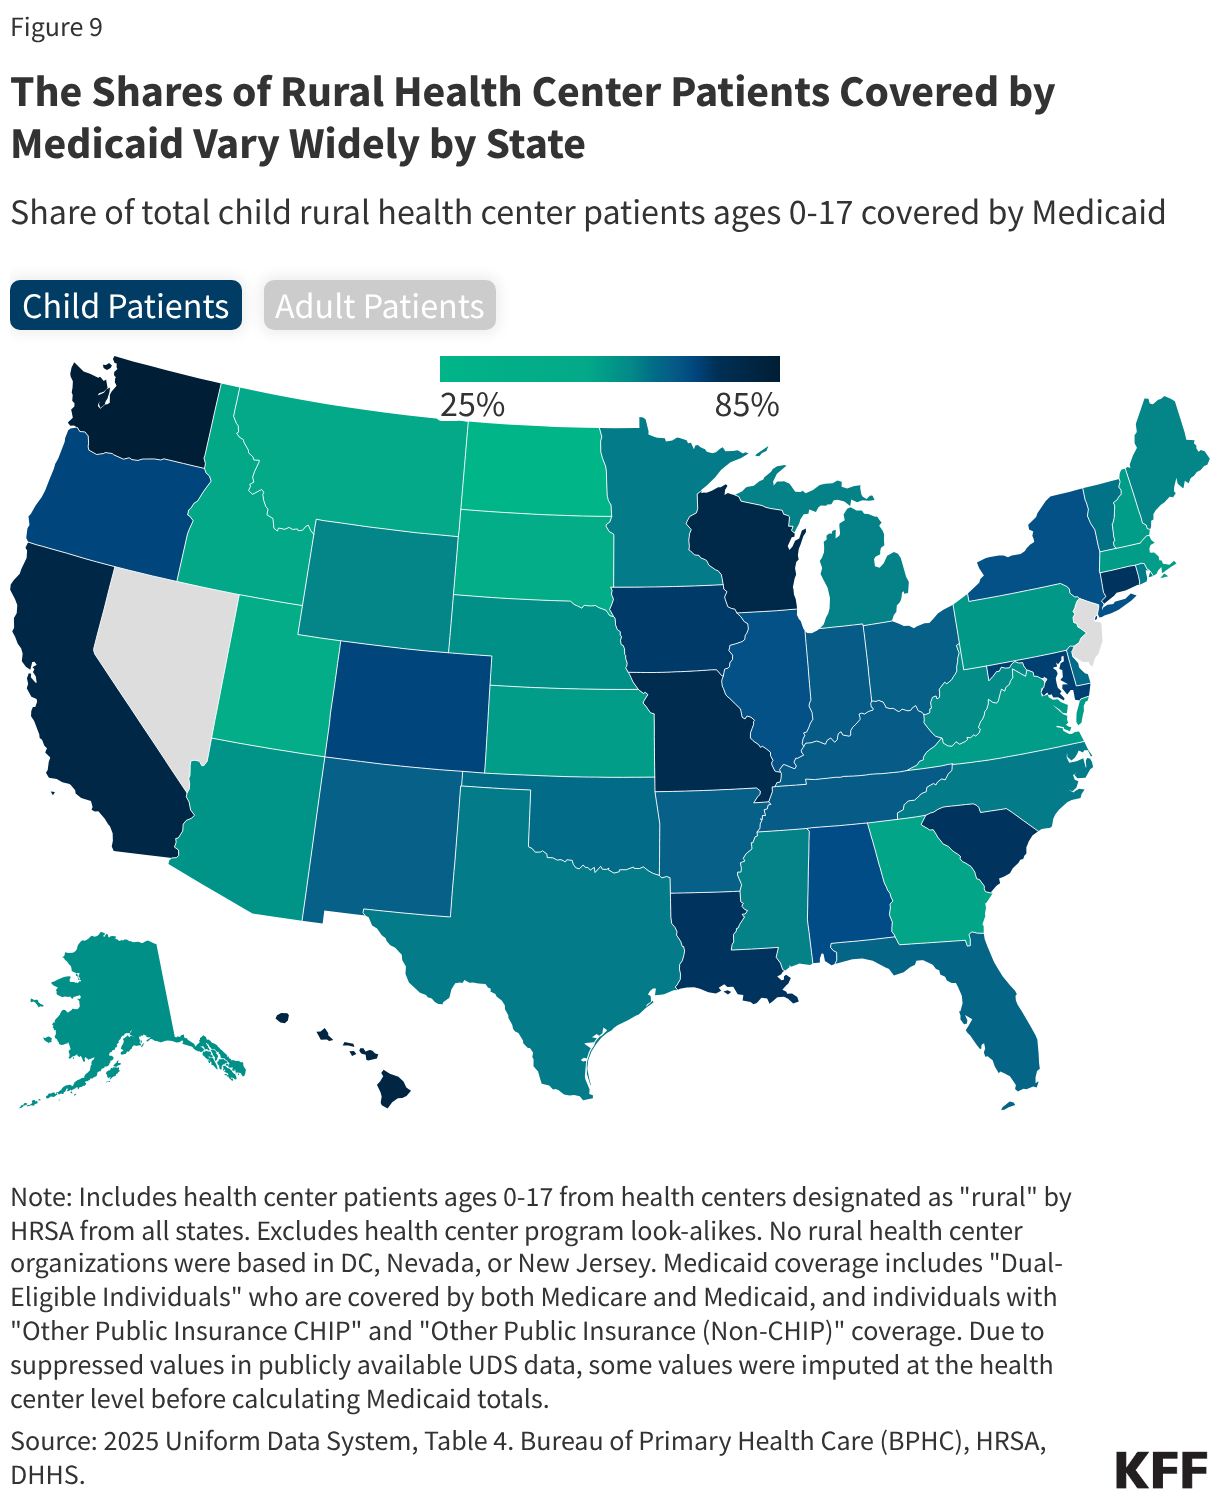
The Shares of Rural Health Center Patients Covered by Medicaid Vary Widely by State (Choropleth map)

Rural and Urban Health Center Financing

Medicaid was the primary source of revenue for both rural and urban health centers, accounting for about one-third (32%) of revenue among rural health centers compared with about half (49%) among urban health centers in 2025 (Figure 10). A greater share of revenue at rural health centers came from private insurance (21% vs. 14%) and Medicare (19% vs. 9%) compared with urban health centers. Differences in shares of revenue by payer source between rural and urban health centers reflect patterns of health coverage among health center patients in rural and urban areas. Federal Section 330 grant funding, which supports health centers’ role as safety-net providers, made up 12% of total revenue among rural health centers, a slightly higher share than the 9% for urban health centers. 
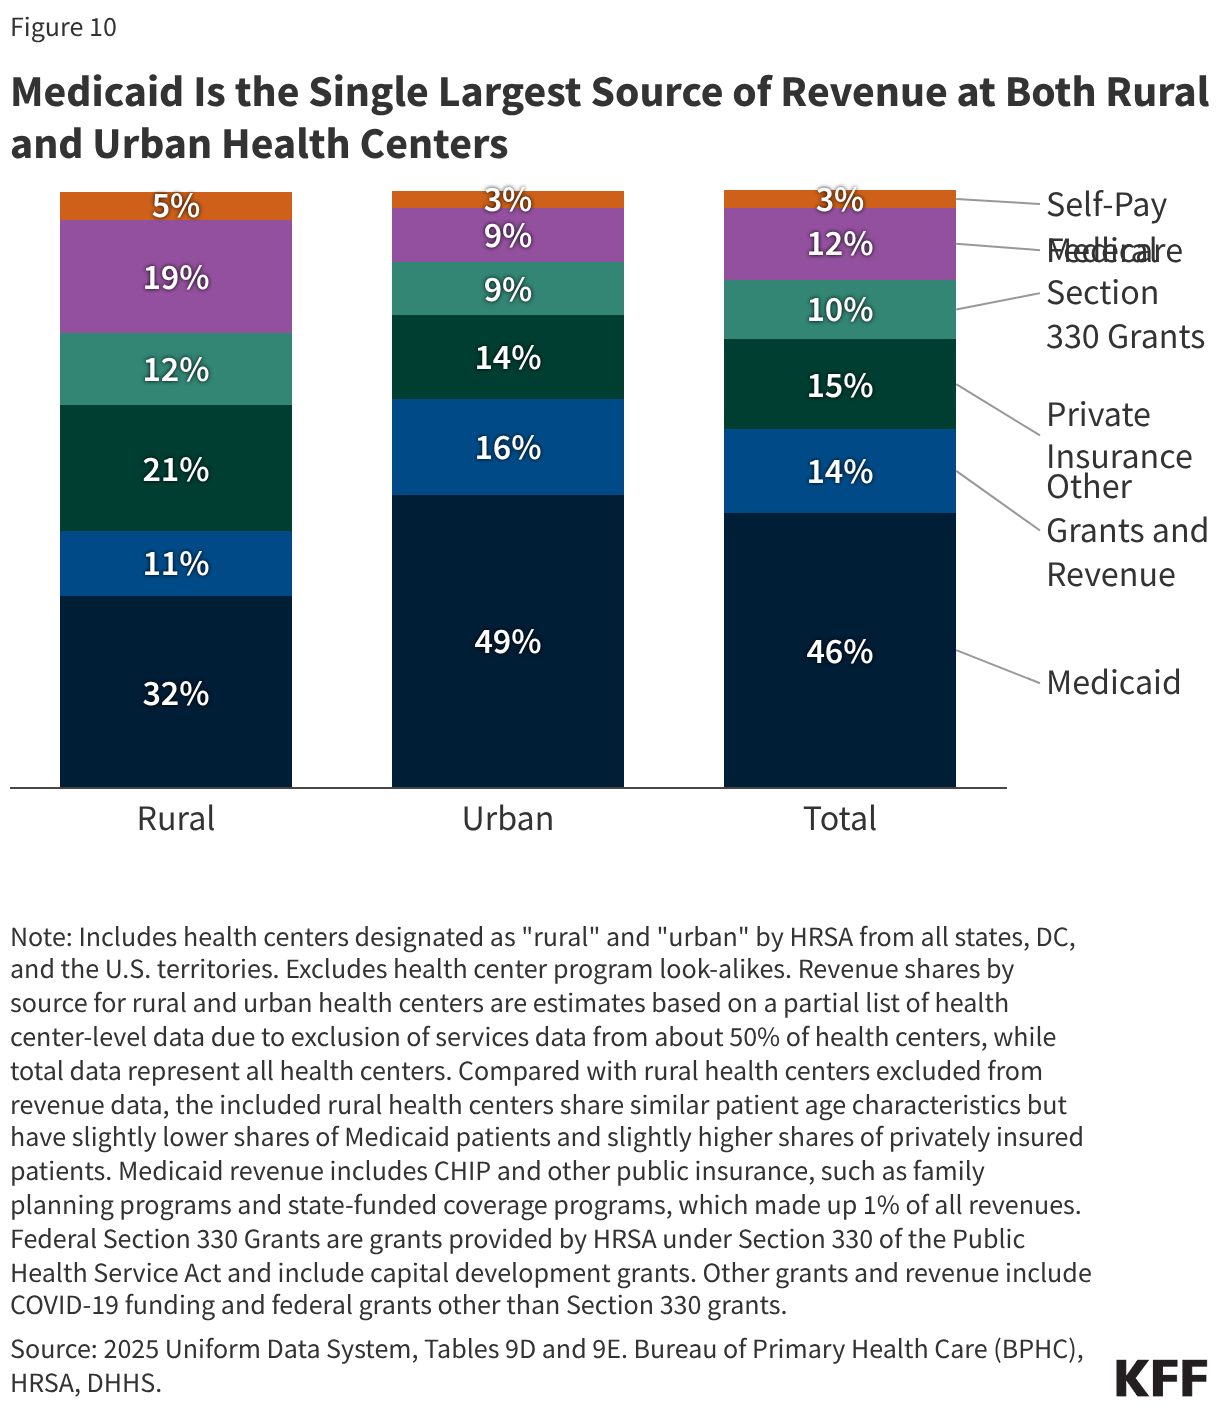
Medicaid Is the Single Largest Source of Revenue at Both Rural and Urban Health Centers (Stacked column chart)

Impact of Federal Policy Changes and Rural Health Transformation Grants

Changes to Medicaid included in the 2025 reconciliation law, including Medicaid work requirements and immigrant eligibility restrictions for federally-funded health coverage, along with expiration of ACA Marketplace enhanced premium tax credits will likely increase the number of uninsured rural health center patients. New Medicaid policies like mandatory work requirements and the requirement for states to conduct eligibility redeterminations every six months rather than annually for the ACA adult expansion population as well as Marketplace changes are expected to lead to some health center patients losing coverage. KFF estimated that the federal Medicaid spending reductions to Medicaid alone could be $137 billion over 10 years in rural areas, with the largest reductions occurring in states that have expanded Medicaid and have large rural populations. KFF analysis of federal data also showed that ACA Marketplace enrollment declined 12% as of May 2026 while premium payments rose sharply for many enrollees following the expiration of enhanced premium tax credits at the end of 2025. Premium payment increases and lapses in coverage due to rising ACA Marketplace premiums may disproportionately affect rural health center patients as they are more likely to have private health coverage compared with those at urban health centers. Increases in the share of uninsured patients at rural health centers are likely to exacerbate existing financial pressures and could lead to service cuts or limit service expansions.

While states may award funds from the Rural Health Transformation Program to select rural health organizations, it is unclear the extent to which these funds will offset revenue losses due to federal policy changes and spending cuts. Congress included $50 billion in the rural health fund for the Centers for Medicare & Medicaid Services (CMS) to distribute through state grants over a five-year period to help offset the impact of the law on rural areas and to address a wide range of priorities. Some states have allocated funding in their first-year approved budgets to address primary care access, workforce development, technology infrastructure, and other initiatives at rural health centers. However, it is unclear how much funding from the program will benefit rural health centers either directly or indirectly and the extent to which any funding rural health centers receive will offset revenue losses under the 2025 reconciliation law. More broadly, according to KFF analysis, it is unlikely that any state will receive more money from the rural health fund than it will lose from the historic cuts to federal funding for health care in the 2025 reconciliation law and from other federal policy changes since coverage impacts will grow over time and the grant funding ends after five years.
Community Health Center Patients, Financing, and Services

Published: Oct 5, 2026

Community health centers are a national network of nearly 1,400 safety-net primary care providers that served more than 32.7 million patients in 2025. They are located in medically underserved urban and rural communities and provide comprehensive primary care, mental health, and supportive services to patients regardless of their ability to pay. This brief reports on health center patients, services, and financing in 2025 and analyzes changes over time using national data from the Uniform Data System (UDS), to which all health centers are required to report annually, though indicators vary across states.

Introduction

Key Takeaways

Copy link to Key Takeaways
  • Health centers served about 32.7 million patients in 2025, a slight increase from 32.4 million patients in 2024. Nine in ten health center patients lived in low-income households, over six in ten were people of color, and three in ten lived in rural areas.
  • About half of health center patients were covered by Medicaid while 23% had private insurance (including Affordable Care Act (ACA) Marketplace coverage) and 17% were uninsured. The number of health center patients covered by Medicaid decreased slightly in 2025, reflecting the decline in national Medicaid enrollment in 2025. At the same time, the number of privately insured and Medicare patients increased.  
  • Medicaid was the largest revenue source for health centers, accounting for 46% of the $55.4 billion in total health center revenue in 2025. Health center revenue increased in 2025 due to growing patient volume and revenue from payers.
  • Of the more than 144 million patient visits in 2025, 64% were for medical services, 15% were for mental health and substance use disorder (SUD) services, and 12% were for dental care. The share of health center visits (13%) conducted via telehealth remained steady from 2024, with nearly 19 million telehealth visits in 2025.
  • Health centers face a number of challenges amid significant federal policy changes and funding uncertainty. Changes to Medicaid and the ACA Marketplace included in the 2025 reconciliation law and the expiration of ACA Marketplace enhanced premium tax credits at the end of 2025 are expected to increase the number of uninsured patients, placing new financial burdens on health centers. At the same time, health centers face ongoing financial uncertainty. Congress recently passed a continuing resolution funding the government through December 11, 2026, which will also delay passing annual discretionary health center funding until after the midterm elections.

Health Center Patients

Health Center Organizations

Copy link to Health Center Organizations

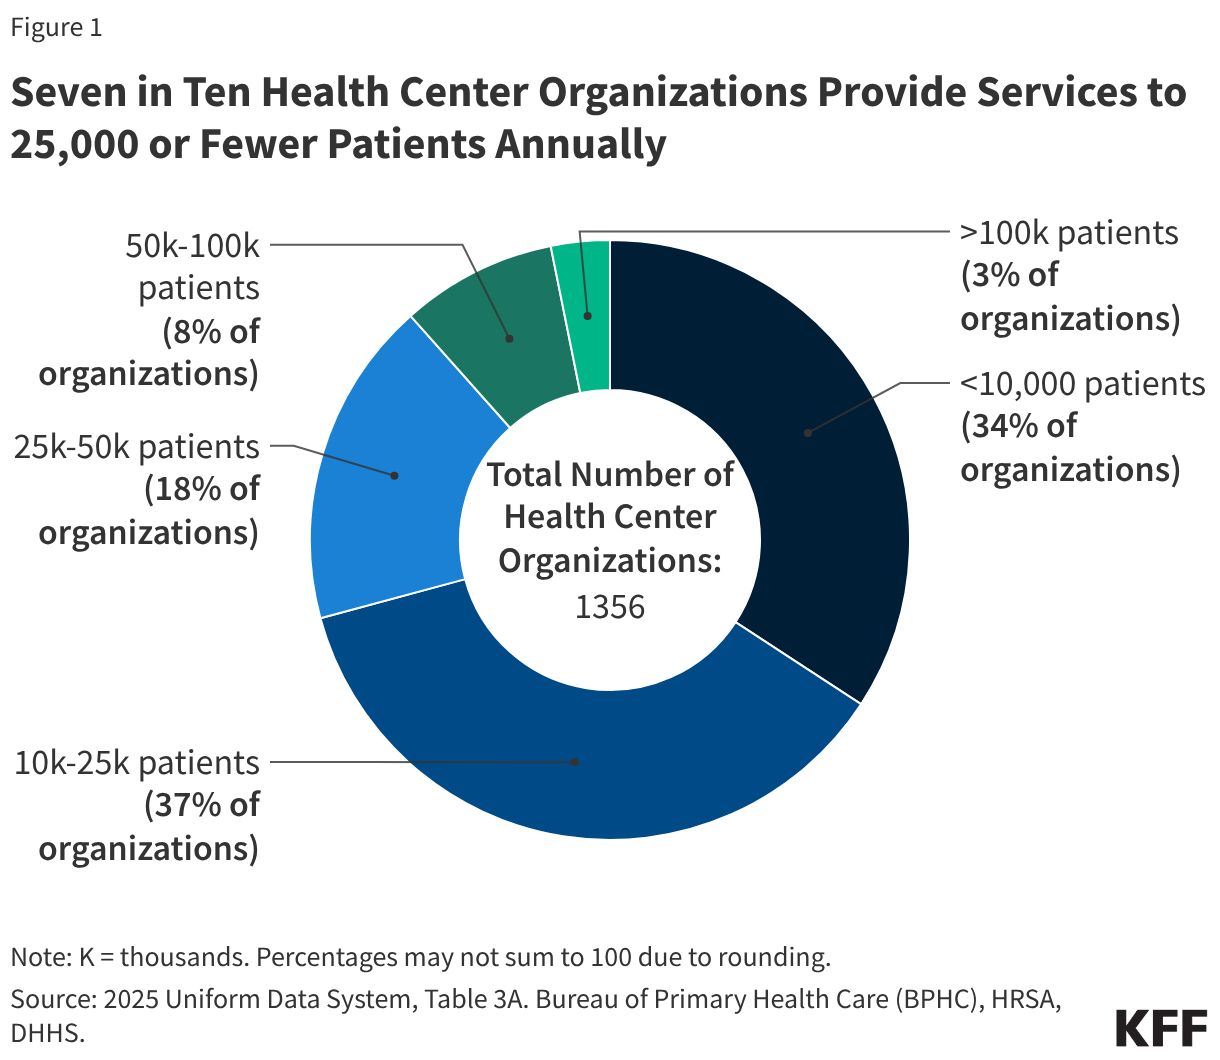
In 2025, 1,356 health center organizations provided care at over 16,600 service delivery sites (Figure 1). Roughly six in ten health centers served patients in medically underserved urban areas, while four in ten served rural communities. Seven in ten (71%) health centers provided services to 25,000 or fewer patients while 3% of health centers served 100,000 or more patients in 2025. Generally, smaller health centers are located in rural areas or focus services on certain neighborhoods or populations, while larger health centers tend to serve urban areas and operate multiple clinic locations. In addition to traditional clinic locations, health center sites included those in locations such as schools, homeless shelters, mobile sites, and other seasonal sites.

Seven in Ten Health Center Organizations Provide Services to 25,000 or Fewer Patients Annually (Donut Chart)

Patient Demographics

Copy link to Patient Demographics

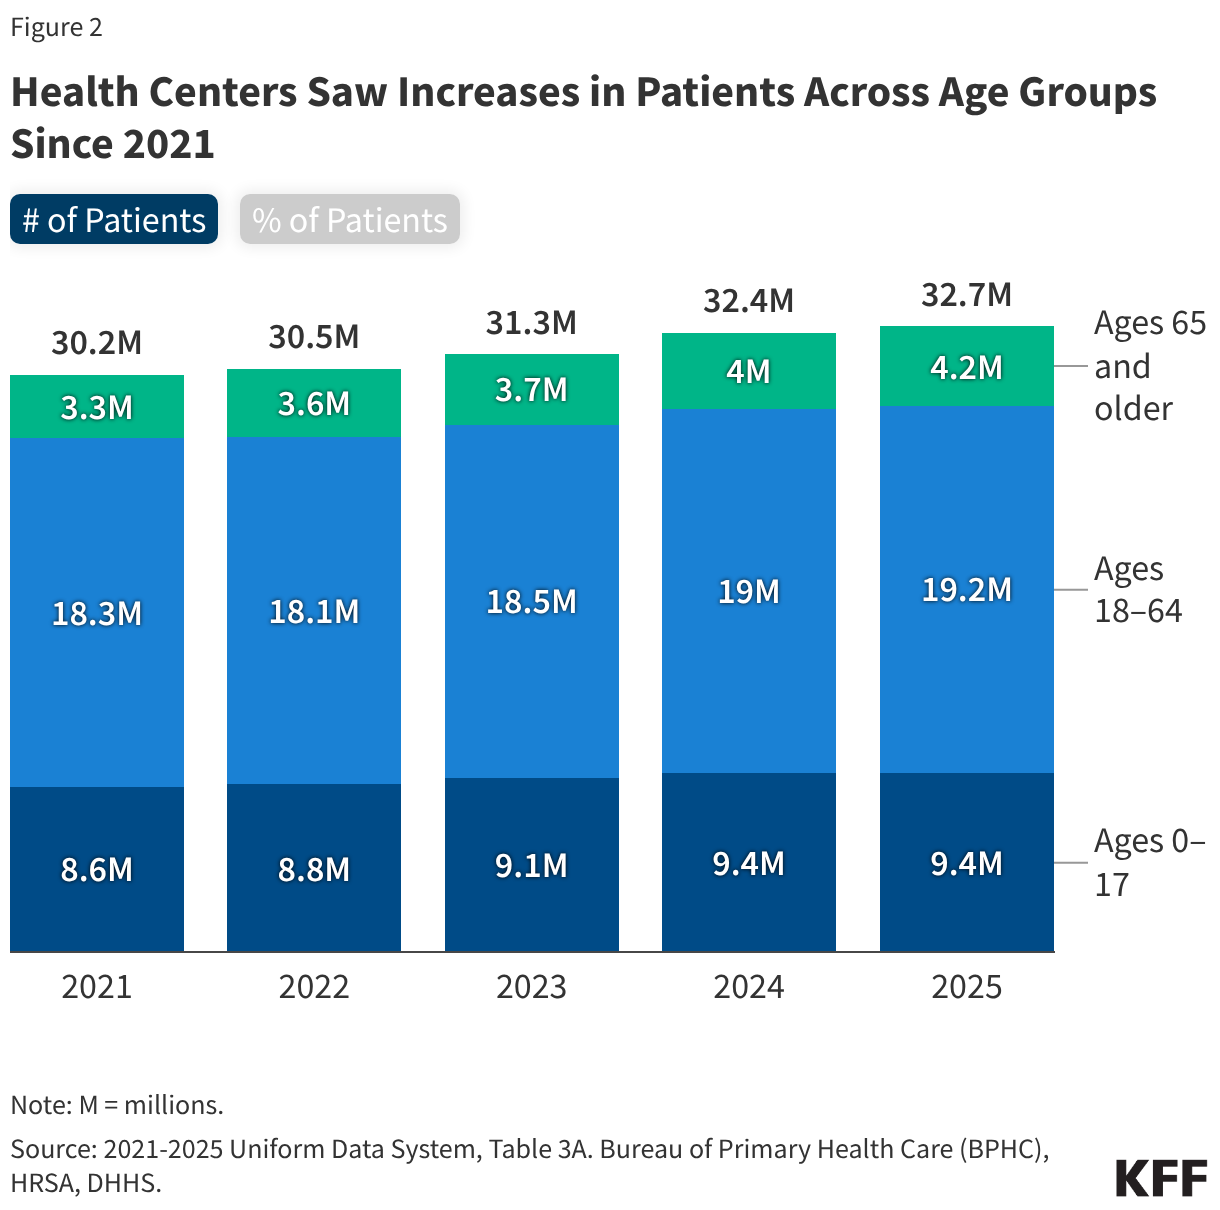
Over 32.7 million patients received services at health centers in 2025, an increase of about 1% from 2024 and 8% from 2021 (Figure 2). Health centers served 9.4 million children in 2025, about the same as in 2024, and children accounted for 29% of health center patients. Adults ages 18–64 accounted for 59% of health center patients, while adults ages 65 and older accounted for 13%. Although still a small share of the total health center patient population, the number of adult patients ages 65 and older served at health centers grew by 27%, or nearly 900,000, between 2021 and 2025, compared with growth of 8% among children and 5% among adults ages 18–64 during the same period.

Health Centers Saw Increases in Patients Across Age Groups Since 2021 (Stacked column chart)

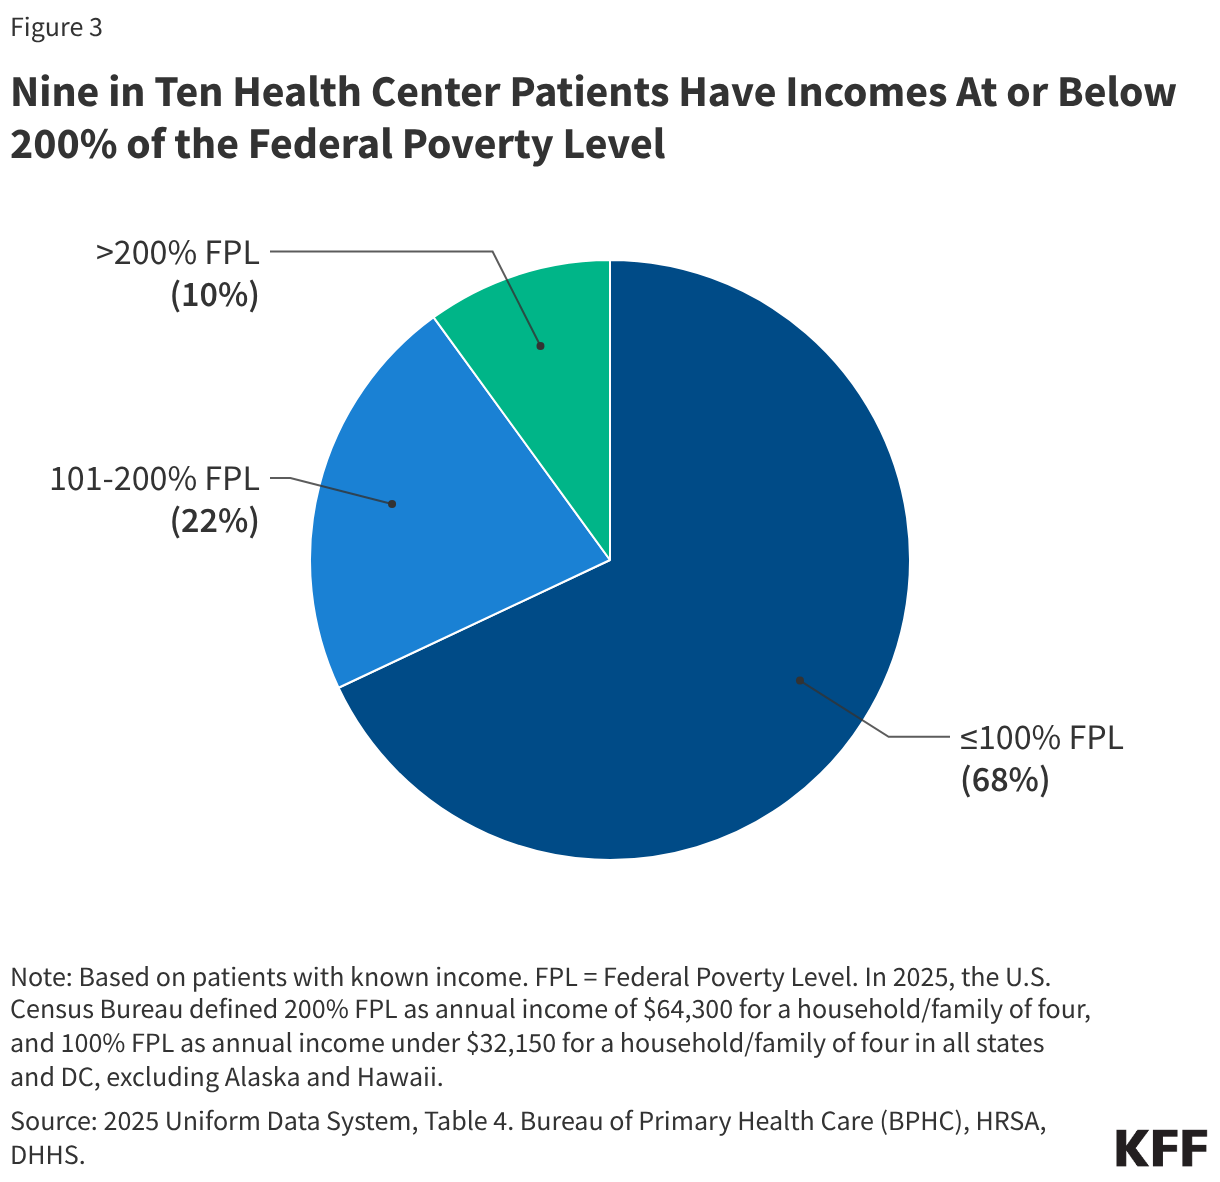
A majority of health center patients lived in low-income households in 2025 (Figure 3). Reflecting the mission of health centers to serve anyone regardless of ability to pay, nine in ten (90%) patients served at health centers had incomes that were at or below 200% of the federal poverty level (FPL) and two-thirds of patients (68%) had incomes at or below the poverty level (the poverty level was $32,150 for a family of four in 2025). The share of health center patients with incomes at or below 200% FPL was over three times the corresponding share of the U.S. population, 27% of whom had household incomes under 200% FPL in 2024.

Nine in Ten Health Center Patients Have Incomes At or Below 200% of the Federal Poverty Level (Pie Chart)

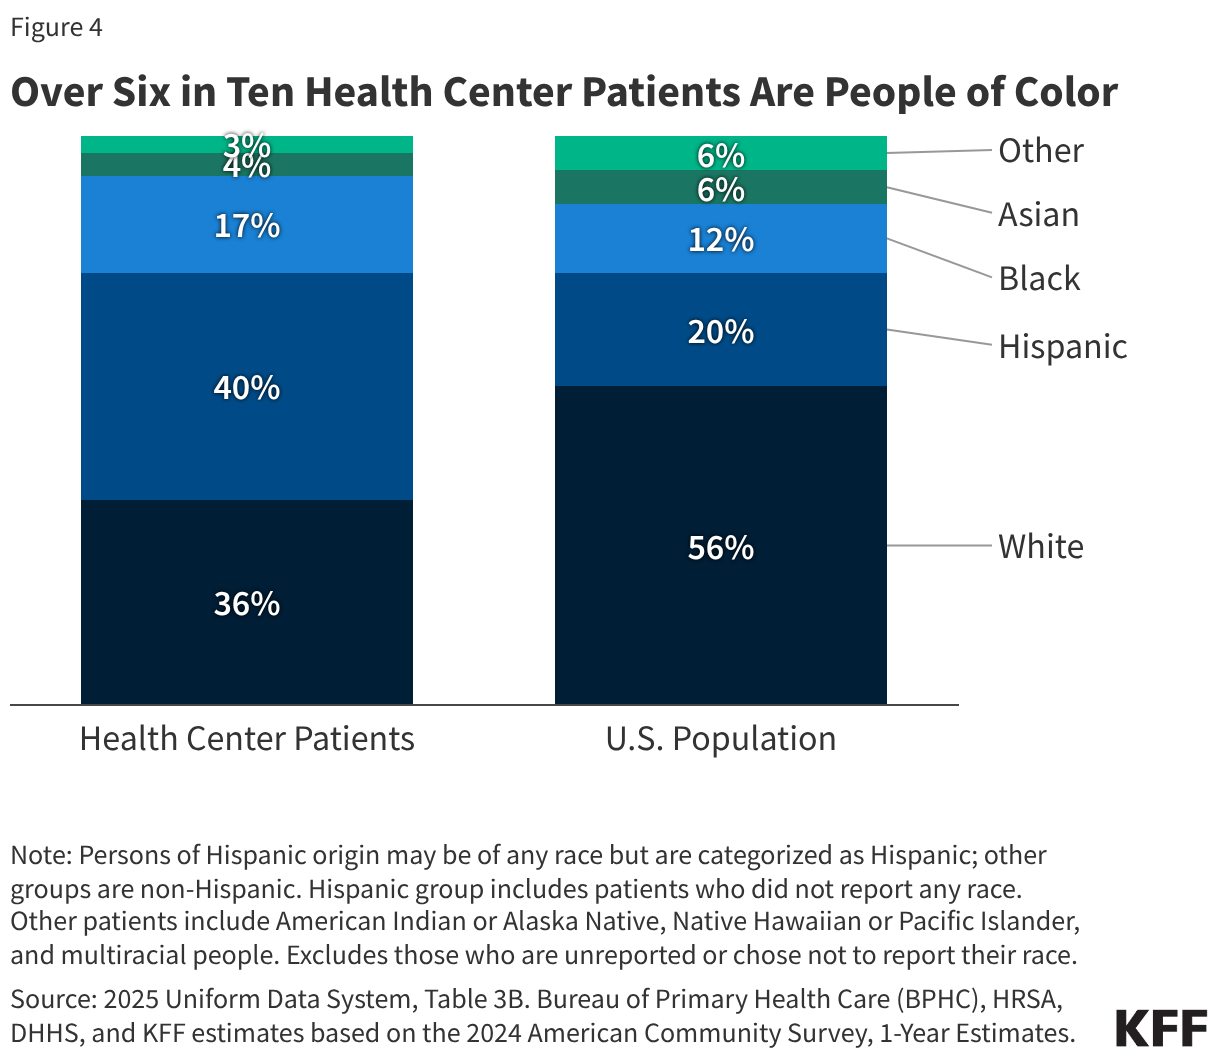
In 2025, most health center patients (64%) were people of color, greater than their share of the total U.S. population (Figure 4). Across all health centers, Hispanic patients made up the largest share of patients at 40%, followed by White patients (36%), Black patients (17%), Asian patients (4%), and all other patients (3%). Compared with their share of the total U.S. population, health centers served larger shares of Black and Hispanic patients, and smaller shares of White patients.

Over Six in Ten Health Center Patients Are People of Color (Stacked column chart)

Special Patient Populations

Copy link to Special Patient Populations

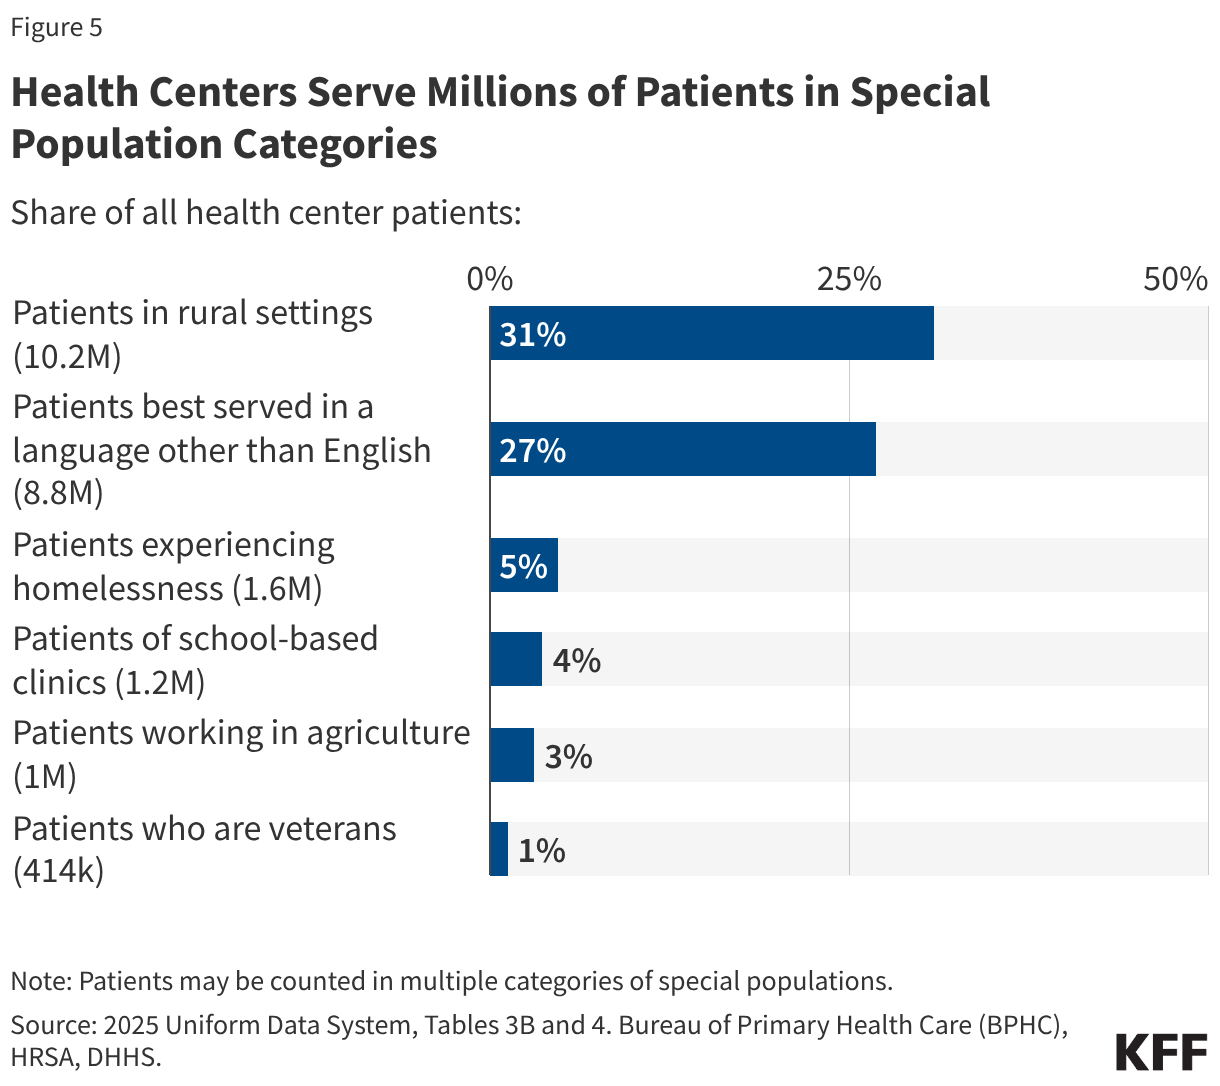
Health centers served millions of patients who were part of special populations with distinct health needs in 2025 (Figure 5). The Health Resources and Services Administration (HRSA), which administers the health center program, provides targeted funding for health centers that serve certain populations identified as underserved by the federal government, including people experiencing homelessness and migratory agricultural workers. In 2025, health centers served 1.6 million patients experiencing homelessness (5% of all patients), 1.2 million patients in school-based health centers (4% of all patients), 1 million agricultural workers (3% of all patients), and 414,000 veterans (1% of all patients). In addition, health centers are required to report data on other populations with known challenges accessing primary care. For example, three in ten patients (31% or 10.2 million) were rural residents, which is higher than the 20% of the U.S. population living in rural areas, and nearly three in ten patients (27% or 8.8 million) were best served in a language other than English.

Health Centers Serve Millions of Patients in Special Population Categories (Bar Chart)

Health Coverage of Health Center Patients

Trends in Health Coverage

Copy link to Trends in Health Coverage

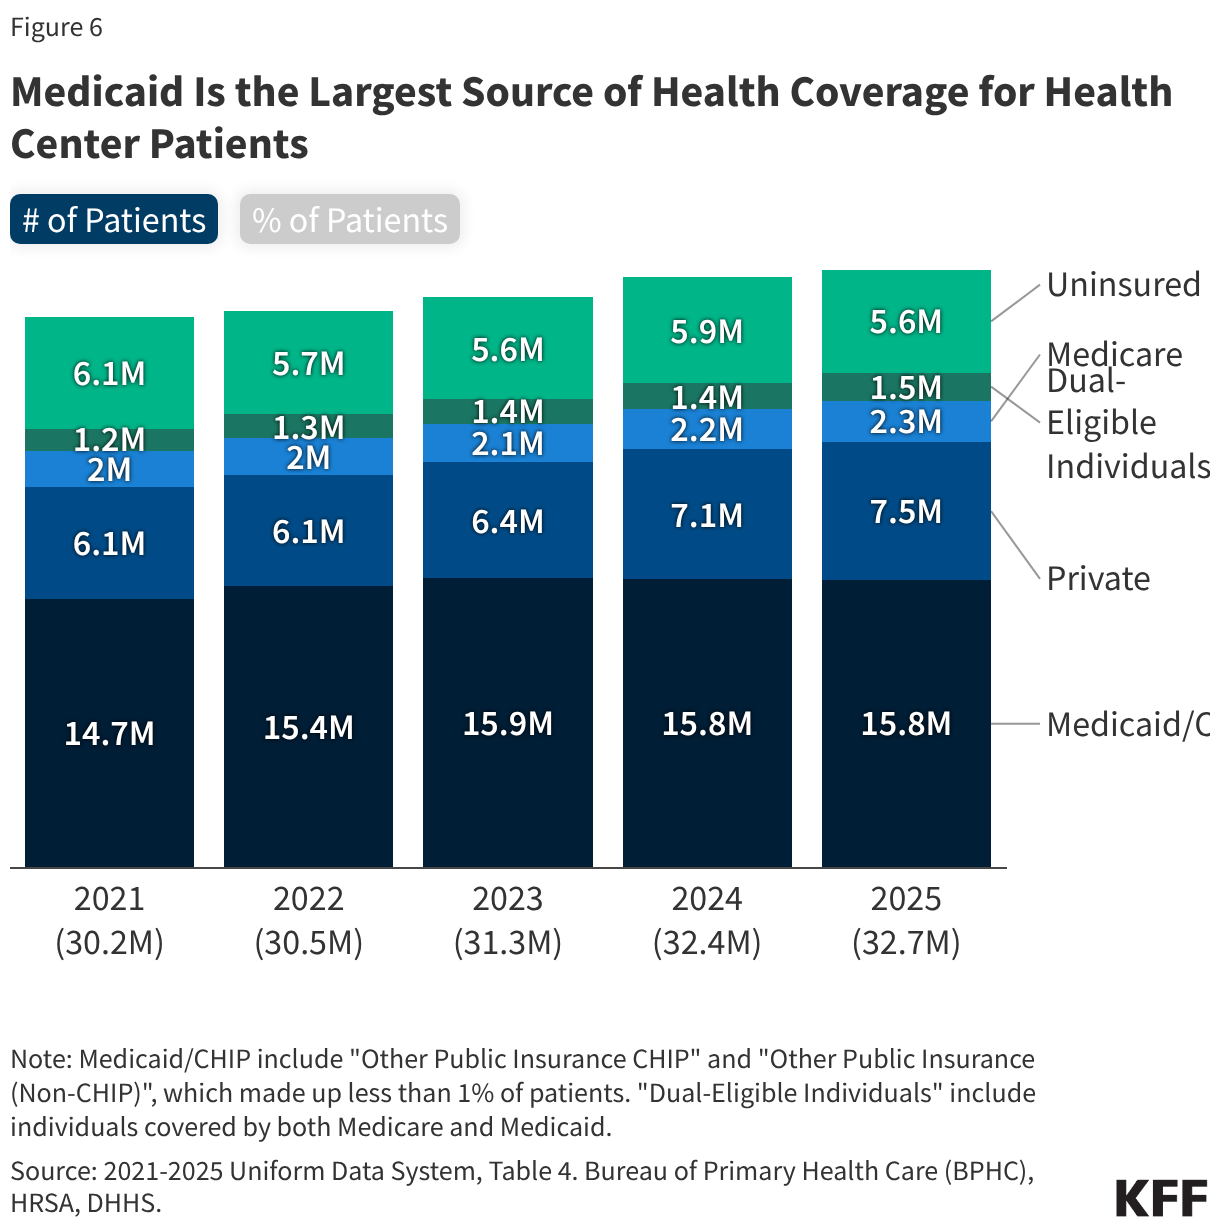
Medicaid remained the largest source of health coverage among health center patients in 2025 (Figure 6). Over eight in ten (83%) health center patients had health insurance coverage in 2025. Nearly half (48%) of health center patients were covered by Medicaid while 23% of patients had private insurance (including ACA Marketplace coverage), 7% had Medicare coverage, and 5% were dual-eligible patients who had both Medicare and Medicaid coverage. Medicare is likely the primary payer for health center services among dual-eligible patients, but Medicaid may cover the costs for dental services and some mental health or substance use disorder services. Nearly one in five (17%) health center patients were uninsured. From 2024 to 2025, the number of patients with private coverage increased by over 6% (437,000), driven by a record increase in Marketplace enrollment because of the continued availability of temporary enhanced premium tax credits that were extended through December 2025. At the same time, the number of Medicaid patients dropped by 49,000 or less than 1%, declining for the second straight year and reflecting continued declines in national Medicaid enrollment following the unwinding of the Medicaid continuous enrollment provision that was put in place during the COVID-19 pandemic.

Medicaid Is the Largest Source of Health Coverage for Health Center Patients (Stacked column chart)

Medicaid Coverage of Health Center Patients by State

Copy link to Medicaid Coverage of Health Center Patients by State

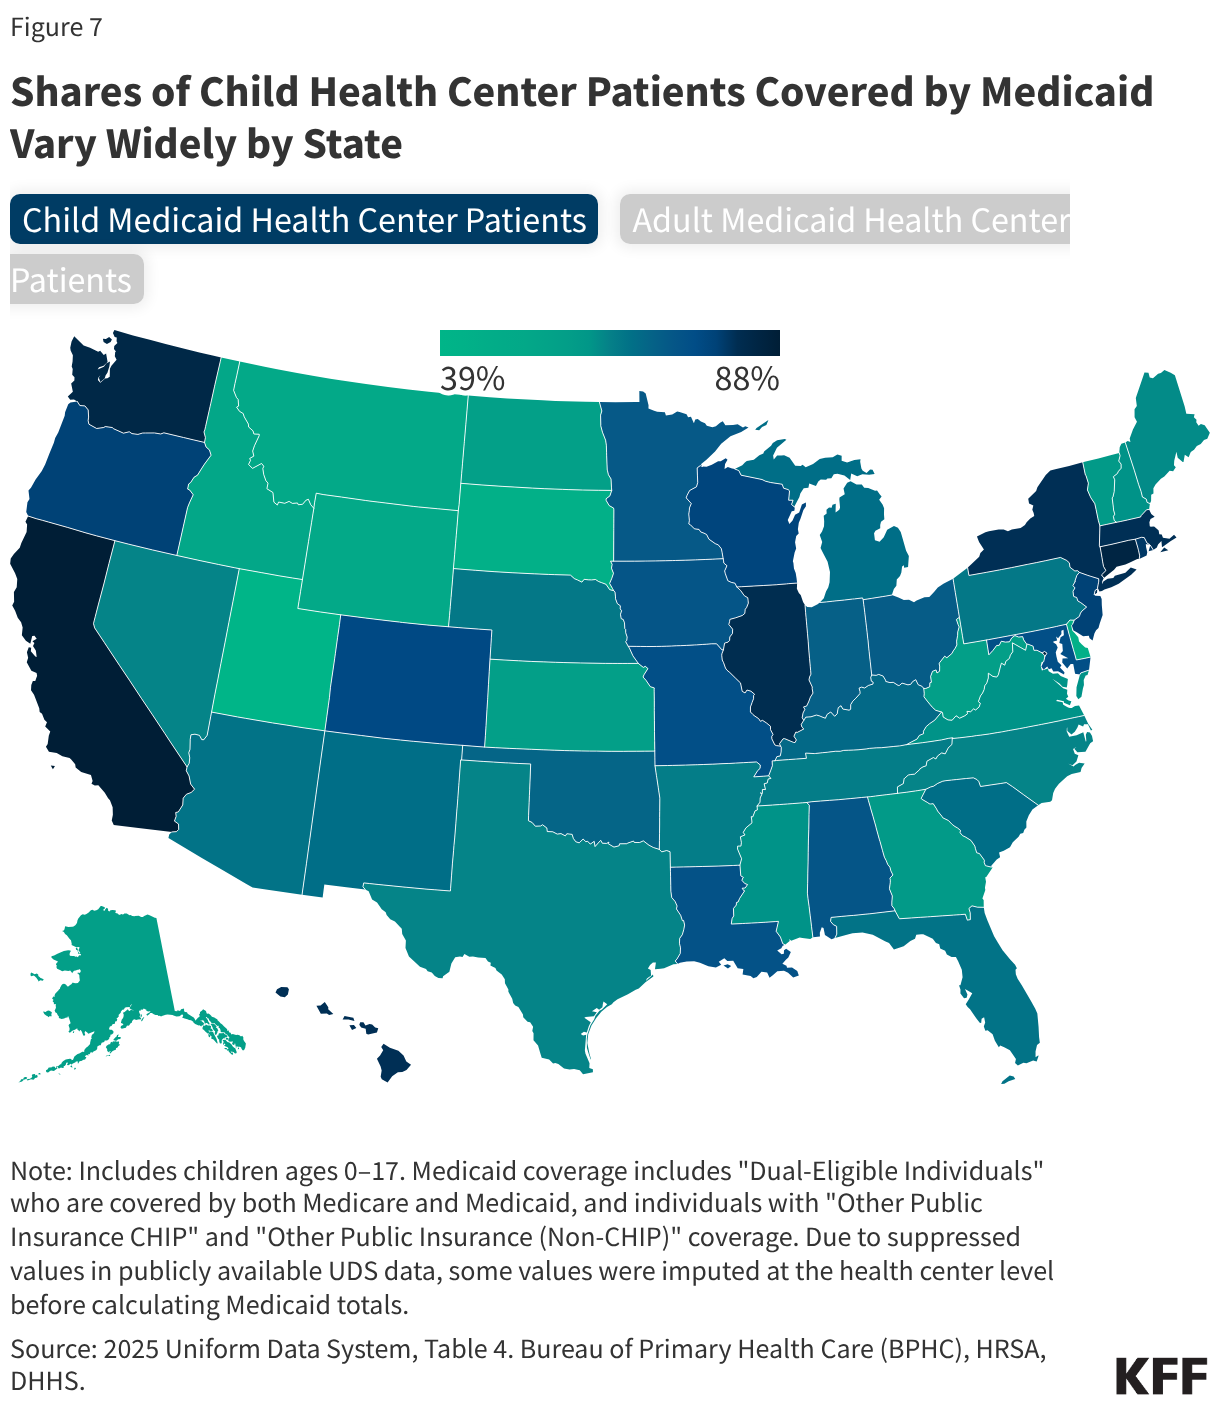
While Medicaid is an important source of coverage for health center patients, the share of child and adult health center patients covered by Medicaid varied widely by state in 2025 (Figure 7). Nationwide, about 6.9 million (74%) child health center patients ages 0–17 and 10.4 million (44%) adult health center patients ages 18 and older were covered by Medicaid and the Children’s Health Insurance Program (CHIP), including dual-eligible health center patients who had both Medicare and Medicaid coverage. The share of child health center patients covered by Medicaid ranged from less than 50% in three states to 80% or more in nine states, including DC, while the share of adult health center patients covered by Medicaid was less than 20% in six states and more than half in eight states, including DC. This variation likely reflects a mix of factors such as the types of health centers in the state, characteristics of the health center patient populations, and state Medicaid expansion status.

Shares of Child Health Center Patients Covered by Medicaid Vary Widely by State (Choropleth map)

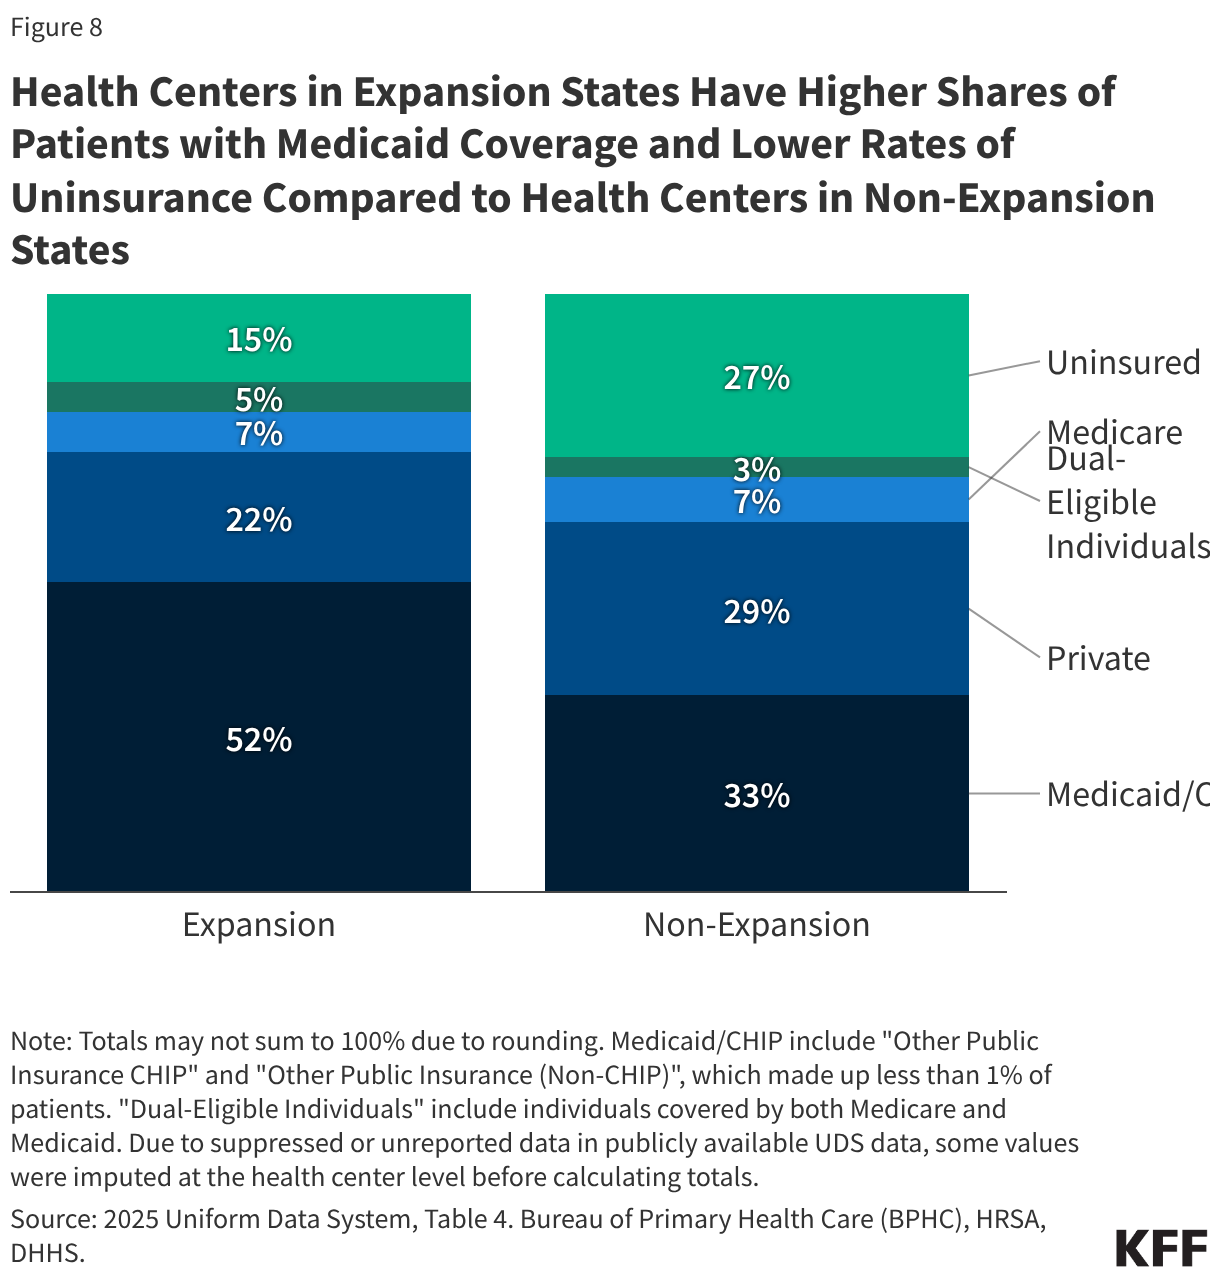
Health centers in Medicaid expansion states had higher shares of patients covered by Medicaid and lower shares of patients who were uninsured than those in non-expansion states in 2025. Health centers in expansion states had higher shares of patients covered by Medicaid (52% vs. 33%) and lower shares of patients who were uninsured (15% vs. 27%) compared with health centers in non-expansion states (Figure 8). Medicaid expansion is linked to reduced rates of uninsurance, increased health care affordability, improvements in access and health outcomes, and economic benefits for states and providers.

Health Centers in Expansion States Have Higher Shares of Patients with Medicaid Coverage and Lower Rates of Uninsurance Compared to Health Centers in Non-Expansion States (Stacked column chart)

Health Center Financing and Costs

Health Center Revenue

Copy link to Health Center Revenue

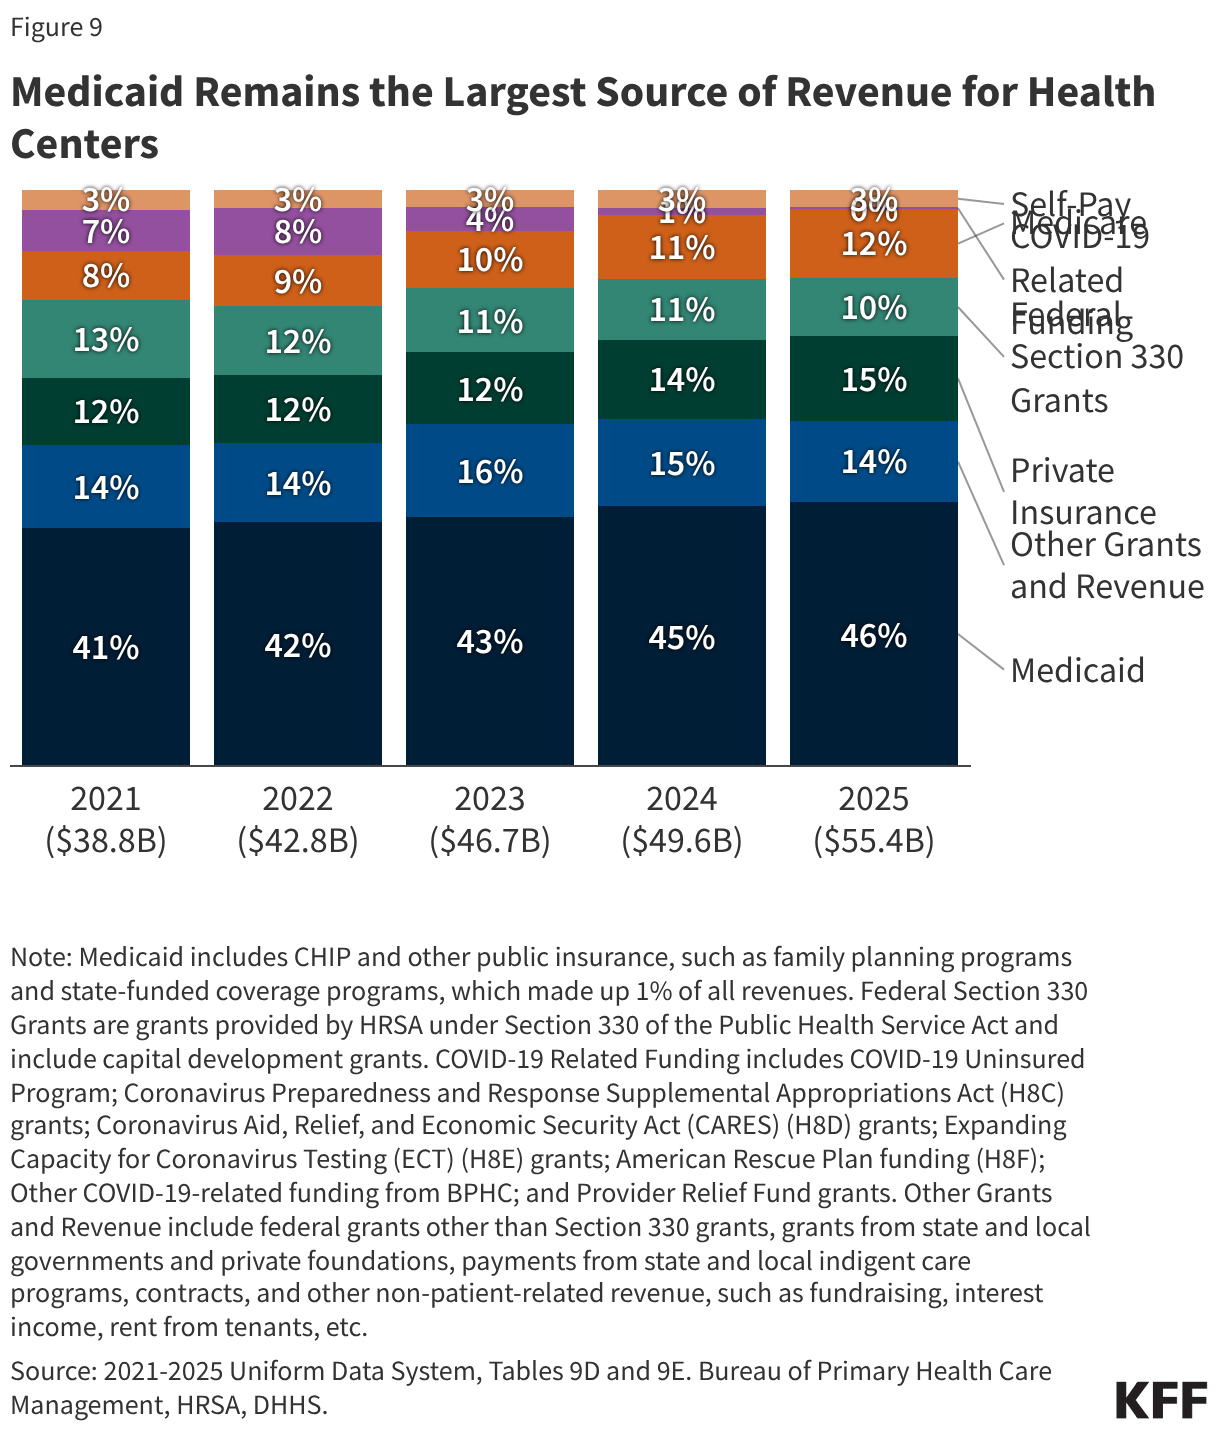
Health center revenue continued to increase in 2025 due to growing patient volume and revenue from payers. In 2025, total health center revenue was $55.4 billion, an increase of 12% from $49.6 billion in 2024 (Figure 9). Over three quarters (76%) of health center revenue came from payments from Medicaid, private insurance, Medicare, and self-pay patients, with Medicaid accounting for over 60% of patient care revenue and 46% of total revenue. Federal Section 330 grant funding, which supports health centers’ role as safety net providers, made up 10% of total revenue while other grants and contracts accounted for 14%. From 2021 to 2025, patient care revenue increased as a share of total revenue from 65% to 76%. At the same time, federal Section 330 grants decreased as a share of total revenue from 13% in 2021 to 10% in 2025.

Medicaid Remains the Largest Source of Revenue for Health Centers (Stacked column chart)

Per-Patient Revenue

Copy link to Per-Patient Revenue

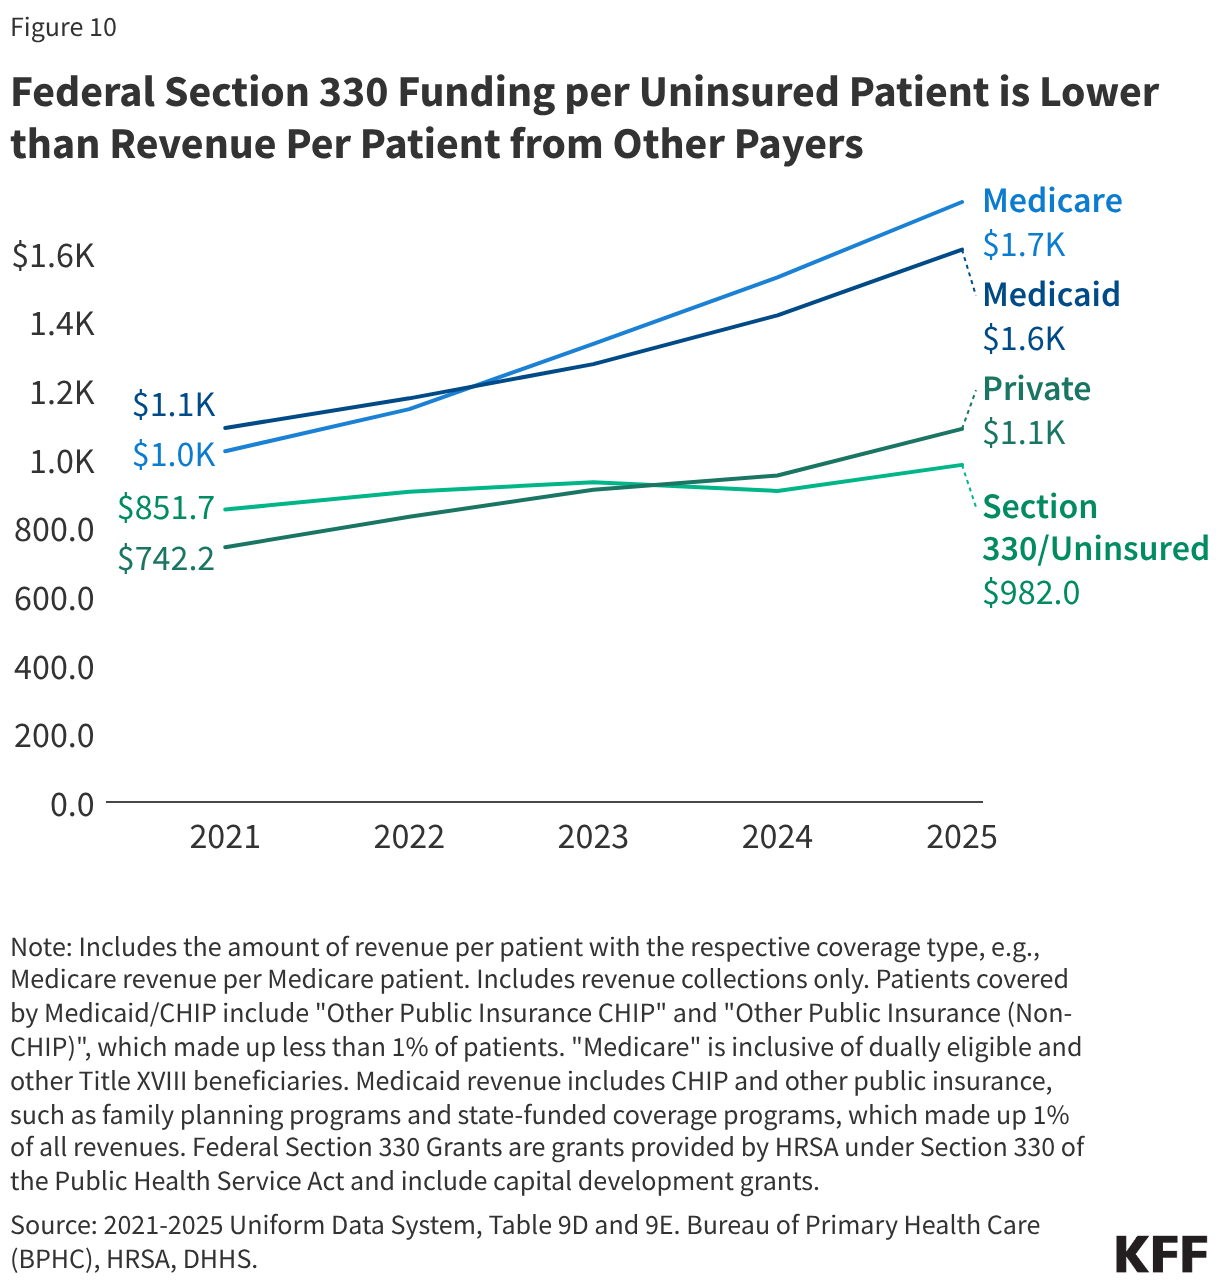
Federal Section 330 funding per uninsured patient remained lower than per-patient revenue from other payers in 2025 (Figure 10). Federal Section 330 grants support ongoing care to the uninsured, although Section 330 grants are not tied directly to the number of uninsured patients health centers serve and may vary widely between health centers. In 2025, Federal Section 330 funding per uninsured patient ($982) was lower than per-patient revenue from Medicare ($1,748), Medicaid ($1,609), and private insurance ($1,087). From 2021 to 2025, growth in Section 330 funding per uninsured patient (15%) was lower than the growth in per-patient revenue from Medicare (71%), Medicaid (48%), and private insurance (46%).

Federal Section 330 Funding per Uninsured Patient is Lower than Revenue Per Patient from Other Payers (Line chart)

Health Center Costs

Copy link to Health Center Costs

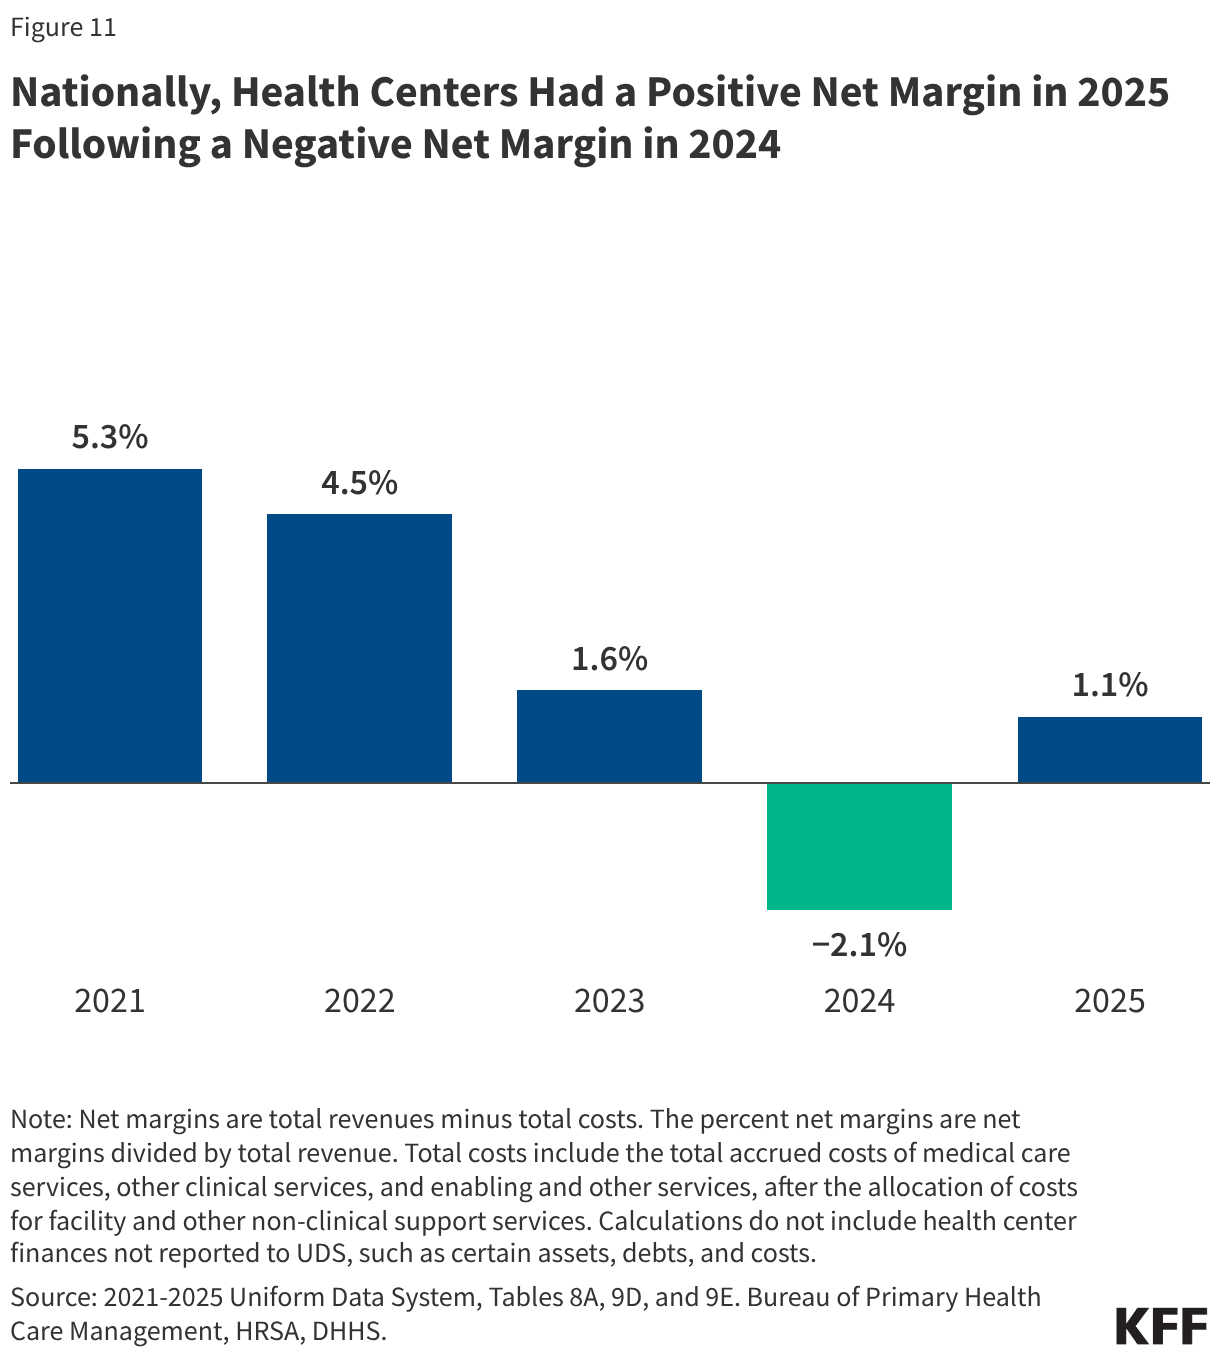
National health center net margins were 1.1% in 2025, following a negative net margin in 2024 (Figure 11). Net margins account for both costs and revenue and are reported as a percentage of revenue. Increased COVID-related and other supplemental funding during the pandemic drove the strong positive net margins seen among health centers from 2021 through 2022. The negative net margin in 2024 reflected higher costs, an increase in the number of uninsured patients, and the expiration of COVID-19 funding. Net margins will vary by health center depending on factors such as their share of uninsured patients, operating costs, the amount of competitive federal grant funding they are awarded, and other sources of revenue.

Nationally, Health Centers Had a Positive Net Margin in 2025 Following a Negative Net Margin in 2024 (Column Chart)

Health Center Services and Workforce

Health Center Visits

Copy link to Health Center Visits

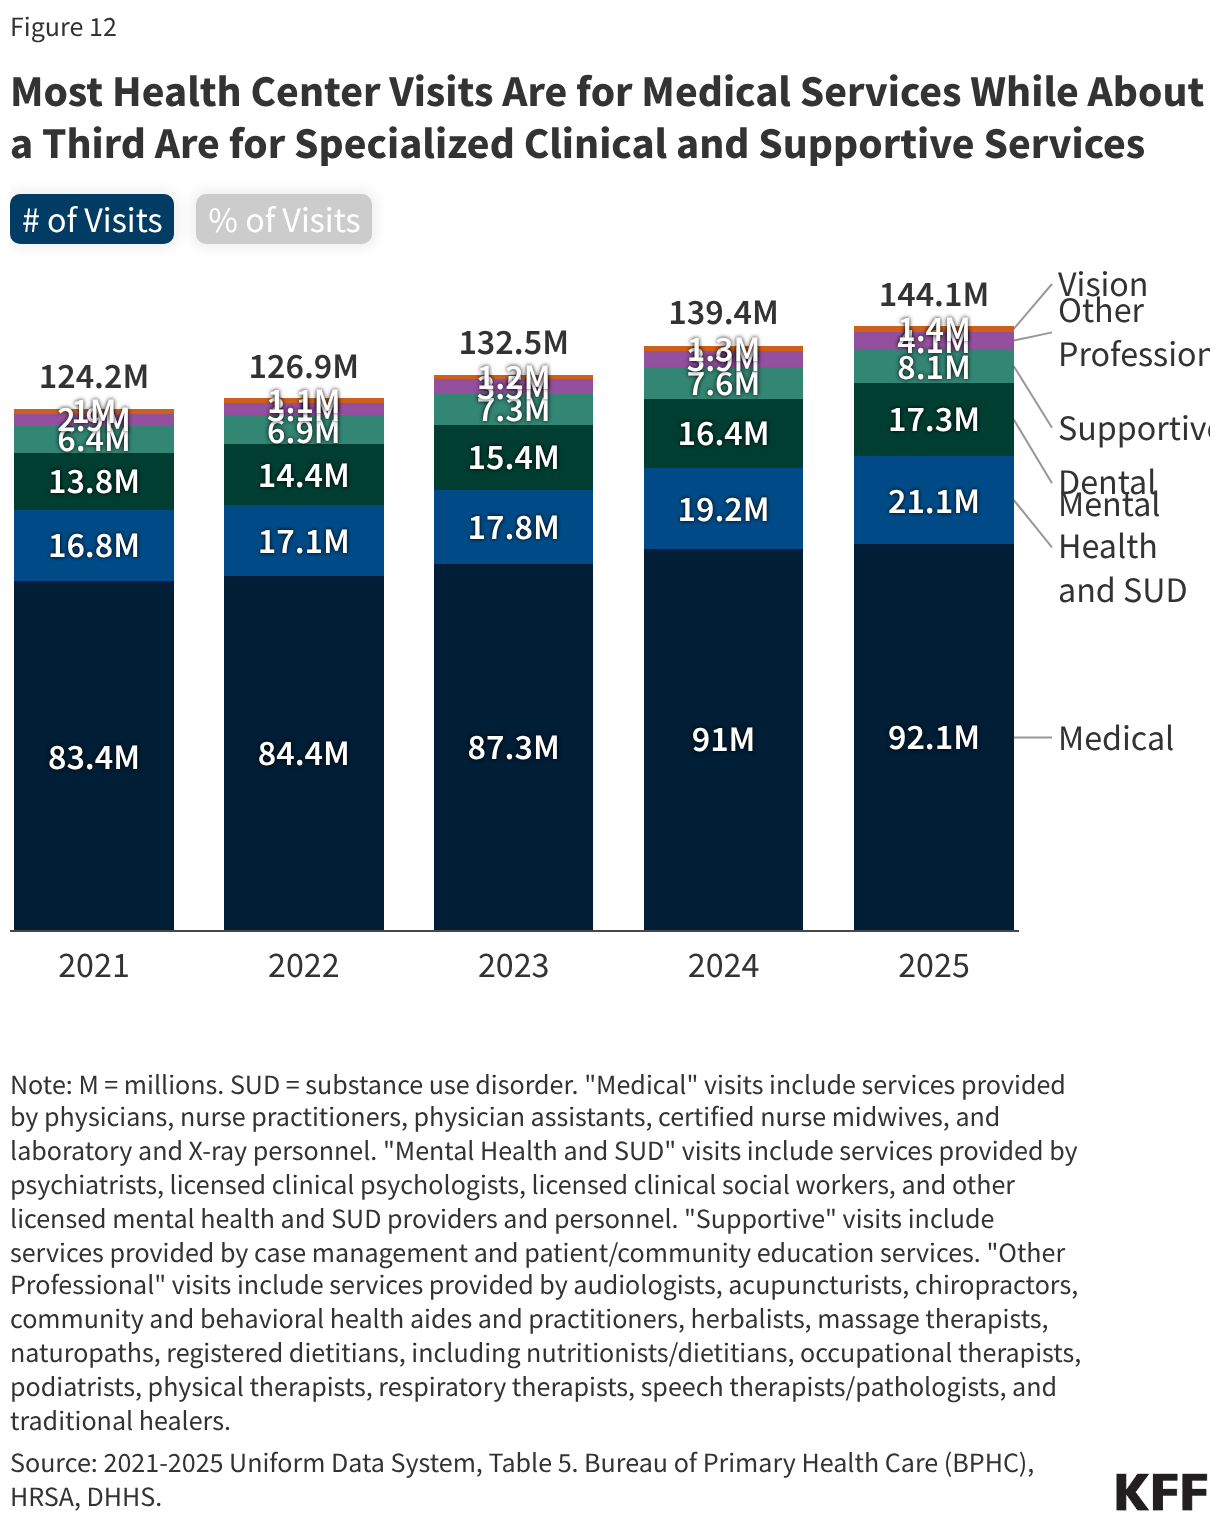
Health centers provided more than 144 million visits in 2025, an increase of 3% from 2024 and 16% from 2021, reflecting growth in visits across service areas (Figure 12). Most visits (64%) were for medical services, though health centers also provided a wide range of other clinical and supportive services, including mental health and SUD (15%), dental (12%), vision (1%), and other professional services (3%), which include services such as nutrition counseling, physical therapy, and traditional healing. Enabling or supportive services, which are non-clinical services like case management, transportation, and health education that facilitate access to care, represented 6% of all visits. Health centers are required by federal law to provide primary care and supportive services, and they may offer dental, vision, or other services depending on patient need and organizational capacity. Since 2021, the share of visits for medical services fell slightly from 67% to 64% as the number of visits for other types of services grew more rapidly. Visits for supportive, dental, and mental health and SUD services grew by 27%, 26%, and 25%, respectively, while visits for medical services grew 10%.

Most Health Center Visits Are for Medical Services While About a Third Are for Specialized Clinical and Supportive Services (Stacked column chart)

Telehealth

Copy link to Telehealth

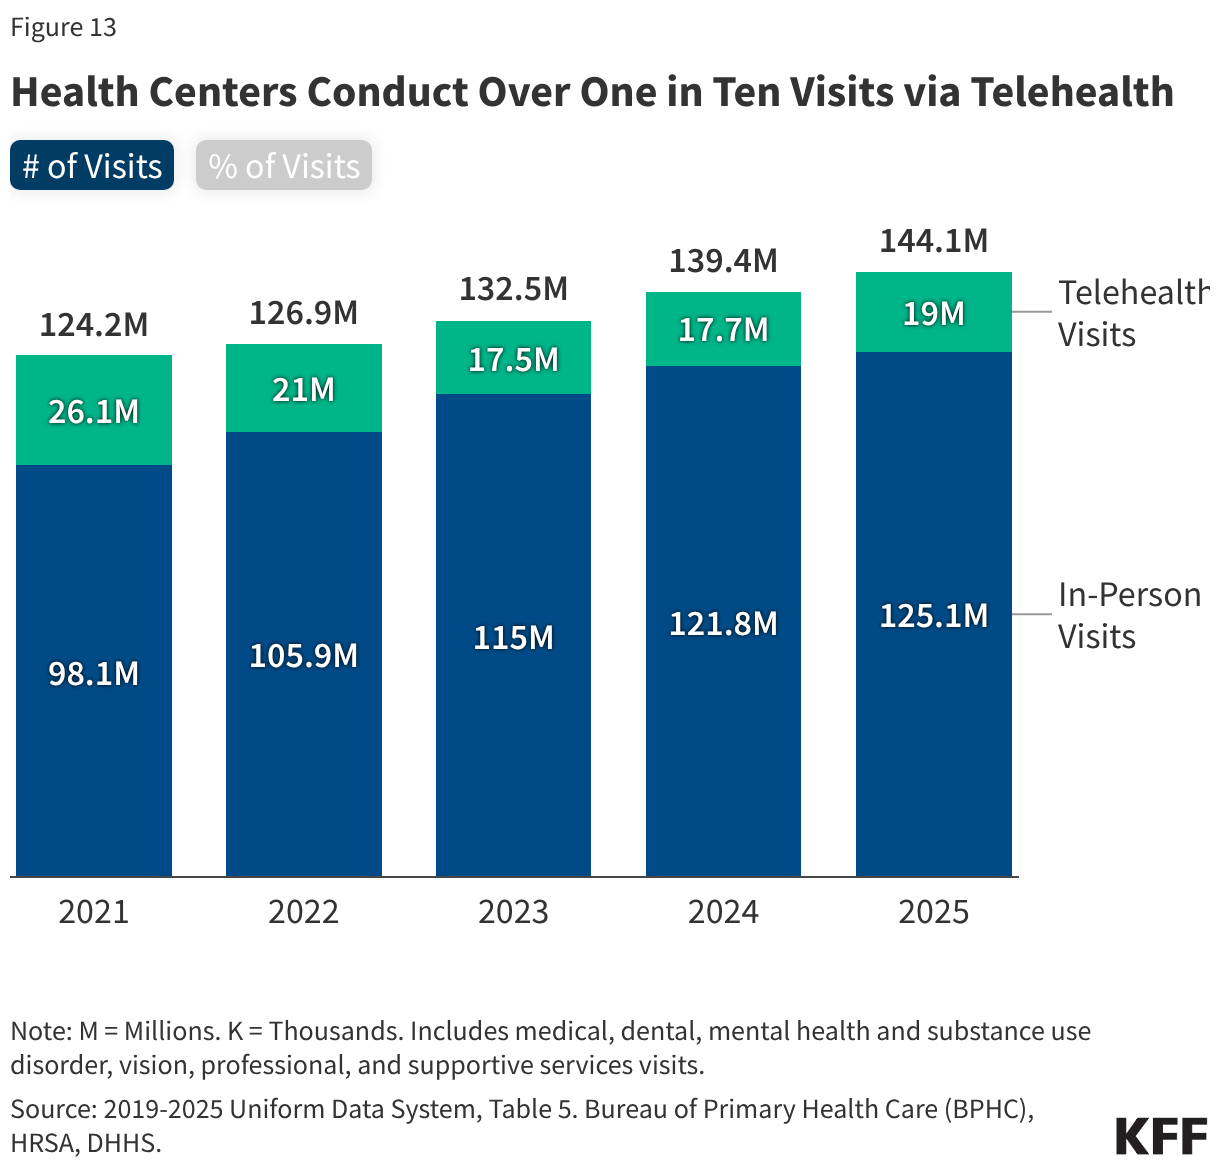
The share of health center visits conducted via telehealth (13%) has remained steady since 2023 after several years of decline (Figure 13). In 2025, health centers provided nearly 19 million telehealth visits, which represented 13% of all visits and an 8% increase from 2024. The number of telehealth visits peaked in 2020 at the start of the COVID-19 pandemic when 28.5 million visits (25%) were conducted via telehealth but declined from 2021 through 2023 before increasing slightly in 2024. Telehealth represents an important way for patients to access health center services, particularly since some patients face geographic and transportation barriers that can make it more difficult for them to attend in-person visits.

Health Centers Conduct Over One in Ten Visits via Telehealth (Stacked column chart)

Health Center Workforce

Copy link to Health Center Workforce

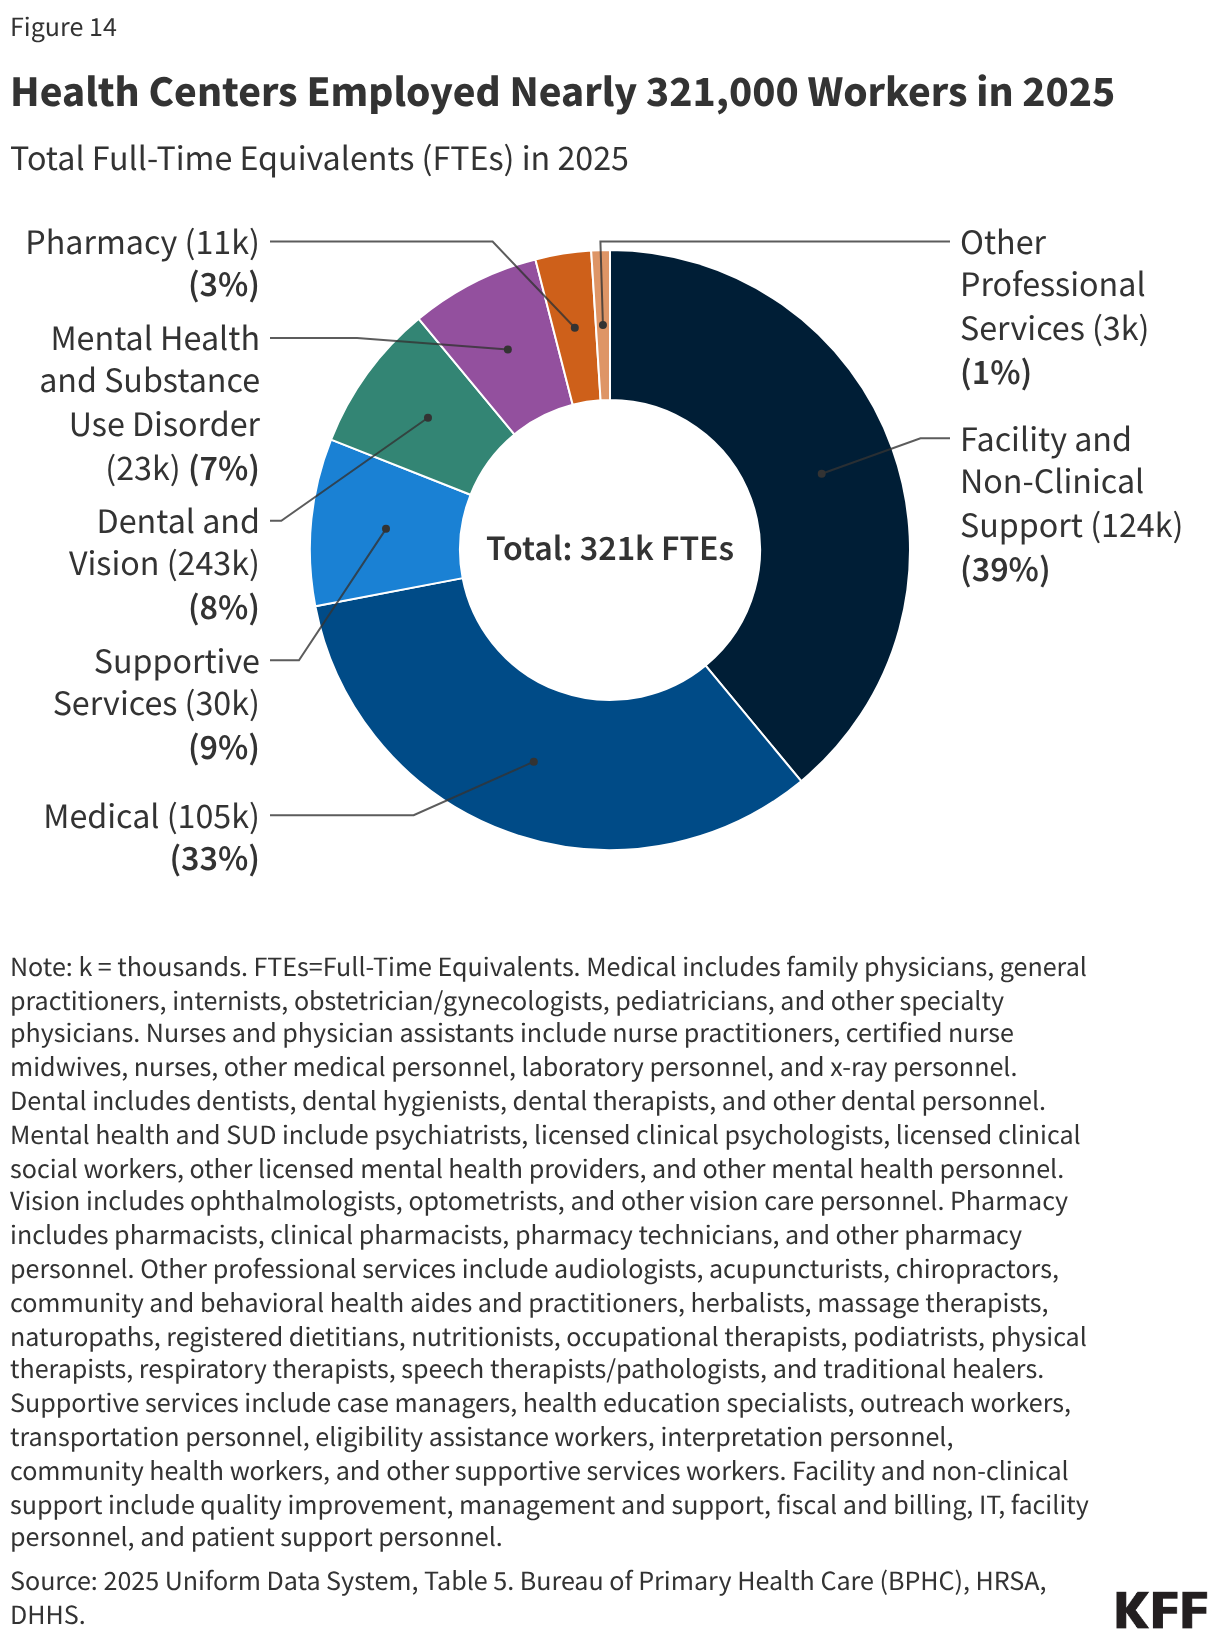
Health centers employed nearly 321,000 full-time equivalent (FTE) workers in 2025 (Figure 14). Most health center staff (61%) provided patient care or supportive services, including medical (33%), supportive (9%), dental and vision (8%), mental health and substance use disorder (7%), pharmacy (3%), and other professional services (1%). The remaining 39% of health center staff worked in facility and non-clinical support roles. Health centers are important employers in their communities; however, they consistently report workforce shortages as one of their main challenges. Research indicates that health center workforce shortages have worsened over time. Ongoing funding challenges and delays may further exacerbate these challenges.

Health Centers Employed Nearly 321,000 Workers in 2025 (Donut Chart)

Impact of Federal Policy Changes

2025 Reconciliation Law and Expiration of Enhanced Marketplace Tax Credits

Copy link to 2025 Reconciliation Law and Expiration of Enhanced Marketplace Tax Credits

Changes to Medicaid included in the 2025 reconciliation law, along with the expiration of ACA Marketplace enhanced premium tax credits, are expected to increase the number of uninsured health center patients. When the new law was enacted, the Congressional Budget Office (CBO) estimated that changes from health provisions would increase the number of people without health insurance in 2034 by 10 million, rising to more than 14 million when accounting for the expiration of the ACA enhanced premium tax credits. While many eligibility provisions in the new law, including Medicaid work requirements, do not take effect until 2027, immigrant eligibility restrictions for Medicaid and Marketplace coverage and expiration of ACA enhanced premium tax credits can impact health center finances earlier. Even before most of these changes take effect, enrollment has already begun to fall, with Medicaid enrollment declining 6% from May 2025 to May 2026 and Marketplace enrollment declining 12% year-over-year as of May 2026 following the expiration of the enhanced premium tax credits at the end of 2025. Increases in uninsured health center patients may contribute to financial uncertainty for health centers. A recent study estimates that health centers could experience over $3 billion in revenue reductions due to an increase in the number of uninsured patients from the 2025 reconciliation law’s health provisions. 

Health Center Funding

Copy link to Health Center Funding

Federal funding for health centers expires in December 2026. While Congress previously protected health centers from funding lapses by authorizing the Community Health Center Fund for five years, Congress only extended mandatory health center funding from February through December 2026 in the 2026 Consolidated Appropriations Act. Future annual discretionary health center funding will be delayed until after the midterm elections as Congress recently passed a continuing resolution funding the government through December 11, 2026. Future funding delays may create significant challenges for health centers and lead to health center closures as they rely on federal funding to maintain operations and provide care to uninsured patients.

States’ Use of Program Integrity Tools in Medicaid Home Care

Authors: Abby Wolk, Alice Burns, and Molly O'Malley Watts
Published: Oct 5, 2026

The federal government continues to focus on addressing fraud, waste, and abuse in Medicaid, with much of the attention focused on home care services. KFF estimates that over 5 million people use Medicaid home care, which provides help with self-care activities such as bathing, dressing, and eating for older adults and people with disabilities. Home care has been an area of emphasis in new fraud initiatives because spending on home care is growing, and the services are provided in people’s homes and the community where fewer institutional processes and procedures exist. However, spending growth often reflects states’ efforts to increase the availability of home care, and there are additional safeguards against fraud in home care compared with other types of Medicaid services. While additional scrutiny and oversight may limit fraudulent or inappropriate Medicaid spending, additional efforts to combat fraud can create new administrative burdens and limit provider participation, potentially reducing access to care. Aside from waiting lists (an imperfect measure of unmet need), there are generally no metrics to examine how many people who need Medicaid home care are not receiving benefits. States are engaged in many activities aimed at addressing fraud, waste, and abuse in their Medicaid home care programs; in KFF’s 2026 survey of states’ home care programs, the majority of responding states reported that program integrity was one of the top three priorities they were concerned with.

The data come from the 24th annual KFF survey of officials administering Medicaid home care programs in all 50 states and the District of Columbia (hereafter referred to as a state). States completed the survey between April and August 2026. The survey was sent to each state official responsible for overseeing home care benefits (including home health, personal care, and waiver services for specific populations such as people with physical disabilities). All states except Florida and South Carolina responded to the 2026 survey, but response rates for certain questions were lower.

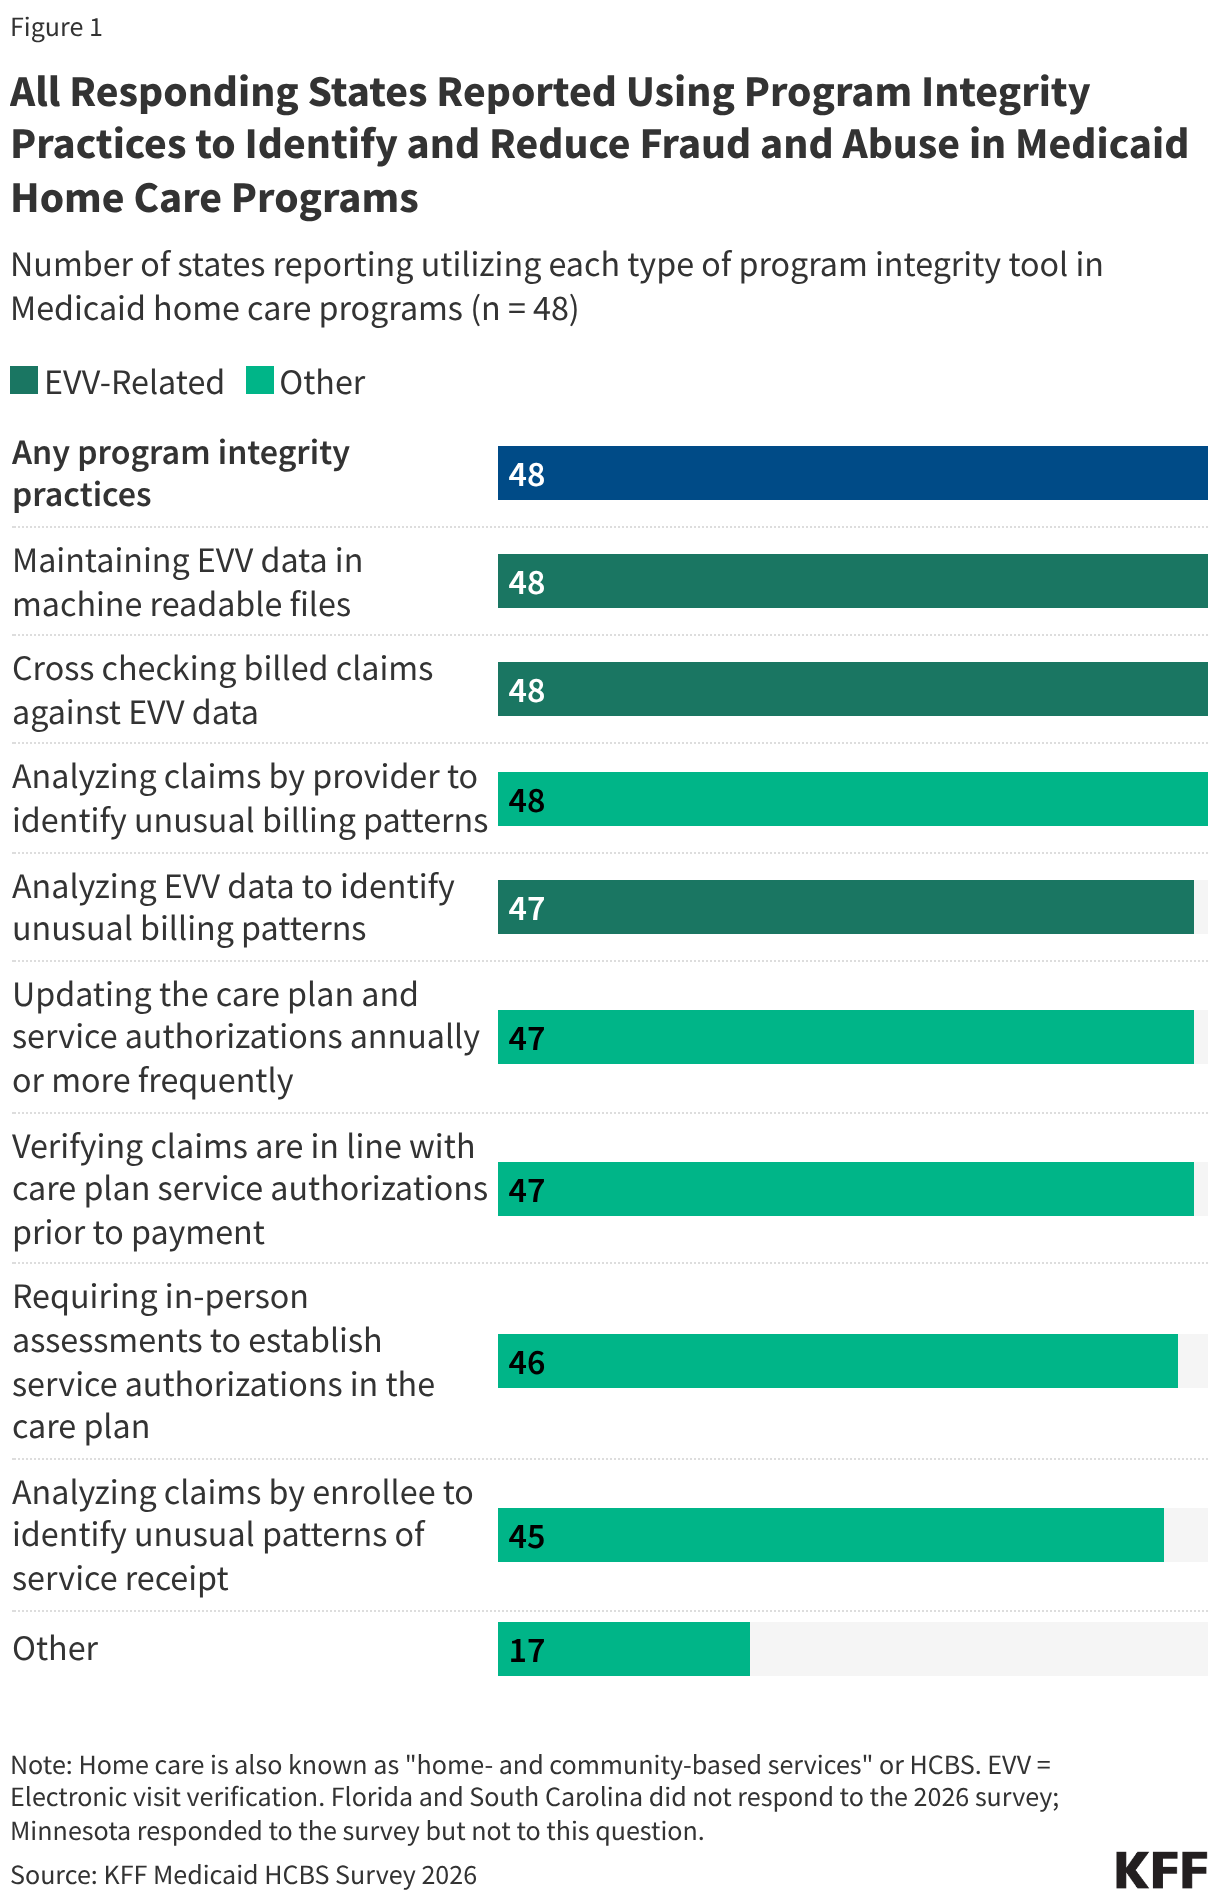
KFF’s survey finds that all responding states report using multiple program integrity practices beyond federal minimum requirements to prevent and detect fraud, with nearly all states employing a multifaceted approach. The federal government has requirements for states to identify and detect fraud in Medicaid home care; however, all responding states report using strategies that go beyond the federal requirements. KFF asked states whether they used any of eight strategies to “help identify and reduce fraud and abuse in the provision of waiver services,” and 42 states reported using all eight of the strategies that KFF asked about.

Federal law relies on electronic visit verification (EVV) as a core tool to prevent fraud in Medicaid home care, but all responding states reported using EVV practices that go beyond federal requirements (Figure 1). In 2016, Congress passed the 21st Century Cures Act, which requires states to implement electronic visit verification (EVV) for all Medicaid personal care and home health services if a visit is made to a person in the home. EVV is a computer/mobile system that tracks and records details of services. States’ EVV systems must include six data elements: the enrollee receiving the service, caregiver providing the service, type of service, location of the service delivery, date of the service, and time the service begins and ends. EVV was established to help promote fiscal integrity for Medicaid home care, and states had until 2023 to fully implement the requirements.

While the 21st Century Cures Act mandates that states implement EVV and collect six specific data elements for each visit, it does not specify how states must store EVV data or use it as part of their payment processes. States may choose to apply EVV data in additional ways to support program integrity.

All Responding States Reported Using Program Integrity Practices to Identify and Reduce Fraud and Abuse in Medicaid Home Care Programs (Bar Chart)

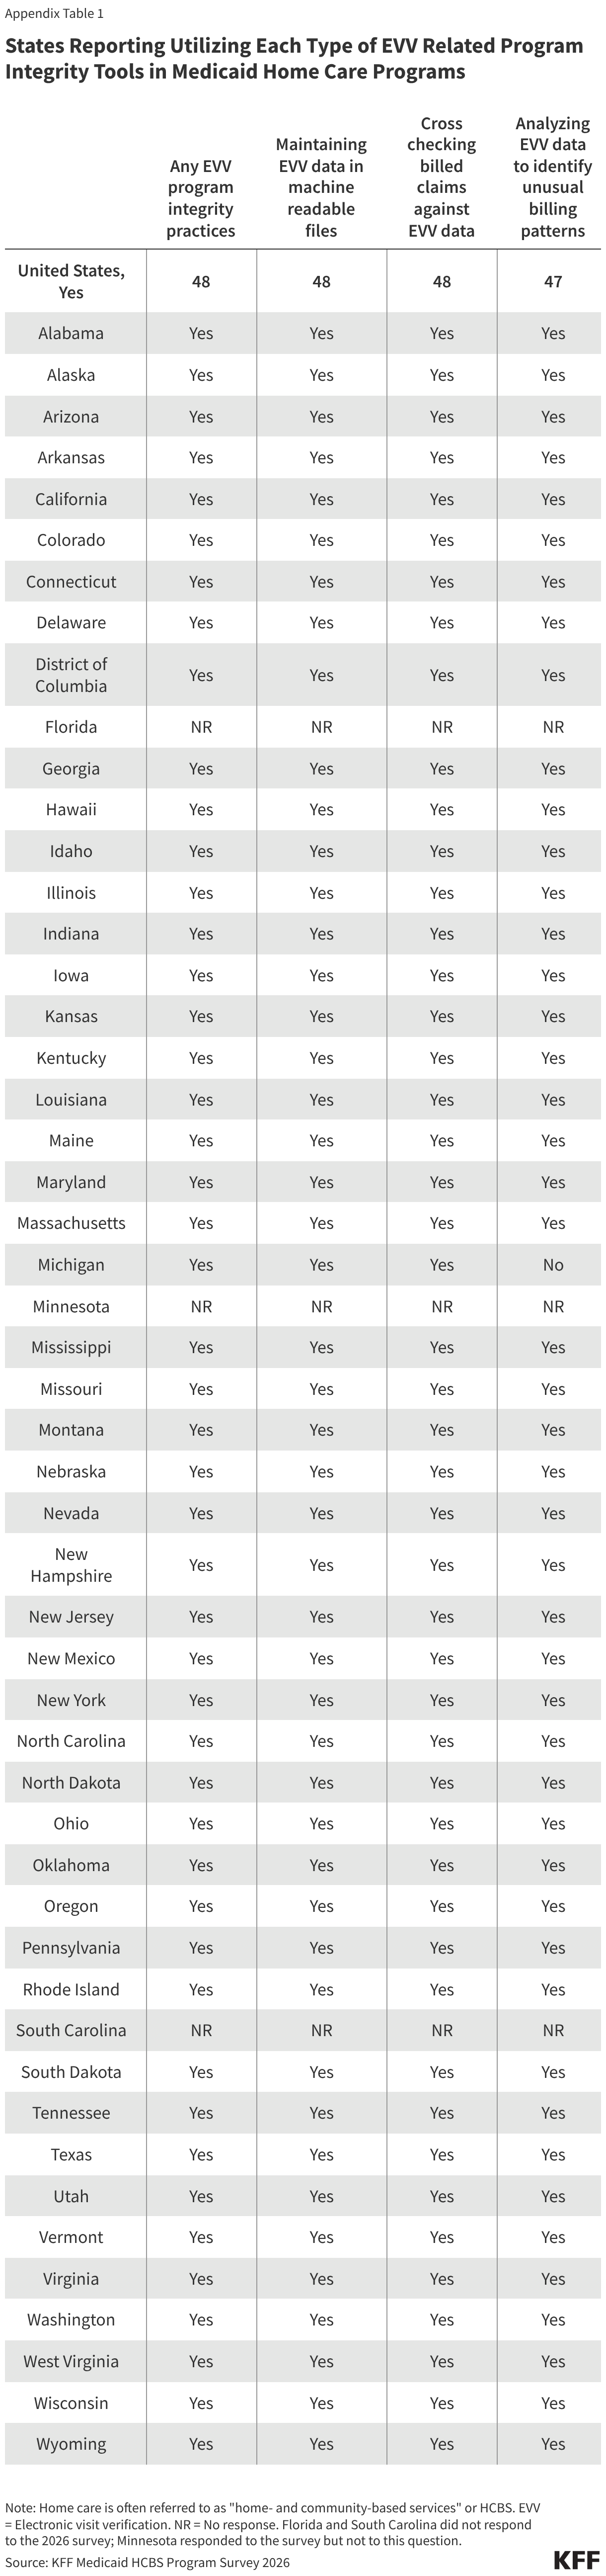
KFF asked states about three potential EVV strategies that go beyond minimum federal requirements and found they were widely used:

  • Maintaining EVV data in machine-readable files (48 states),
  • Cross-checking billed claims against EVV data (48 states), and
  • Analyzing EVV data to identify unusual billing patterns (47 states).

Some states reported adopting strategies that precondition payment on EVV submissions, such as Ohio, which requires valid EVV data as a condition of payment in its waivers for people with intellectual and developmental disabilities (I/DD) and for adults ages 65 and older and those with physical disabilities. Claims that do not have a matching EVV record will be denied, rather than paid and later audited to track down mismatched claims.

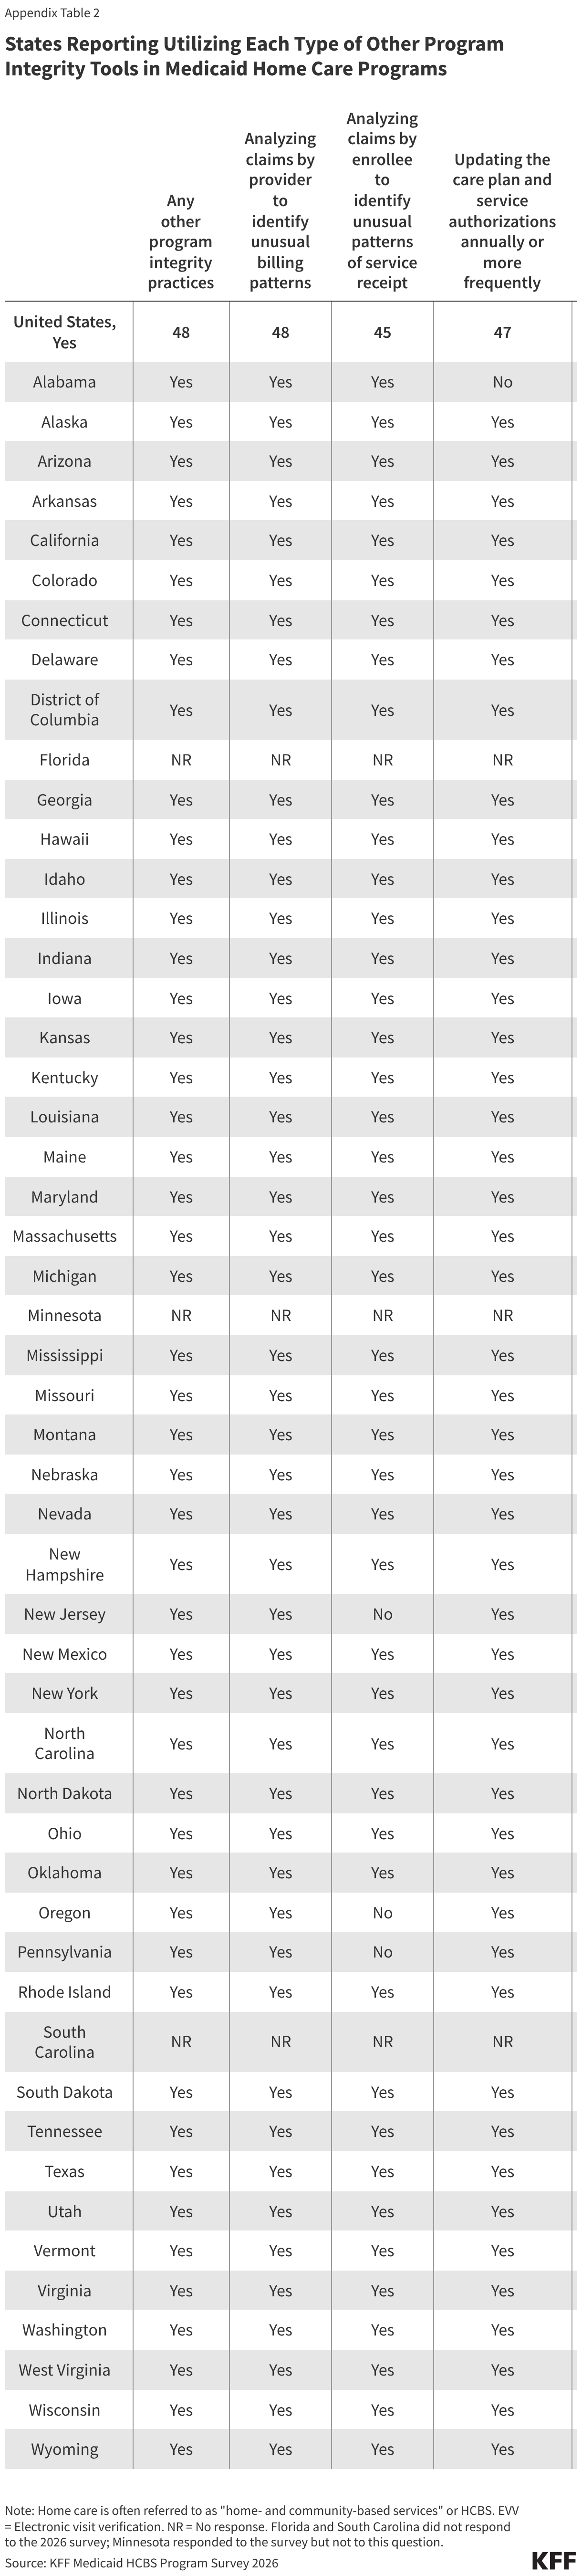
In addition to EVV, all responding states reported using at least one other type of program integrity strategy beyond what is federally required. KFF asked states whether they were using any of the following non-EVV related strategies:

  • Analyzing claims by provider to identify unusual billing patterns (48 states),
  • Analyzing claims by enrollee to identify unusual patterns of service receipt (45 states),
  • Updating the care plan and service authorizations annually or more frequently (47 states),
  • Requiring in-person assessments to establish service authorizations in the care plan (46 states), and
  • Verifying claims are in line with care plan service authorizations prior to payment (47 states).

Seventeen states also reported using other program integrity strategies outside of the options KFF included, although most states did not describe those options in much detail. Some strategies mentioned focused on provider certification and enrollment requirements whereas others were focused on identifying claims that required additional review before or after payment.

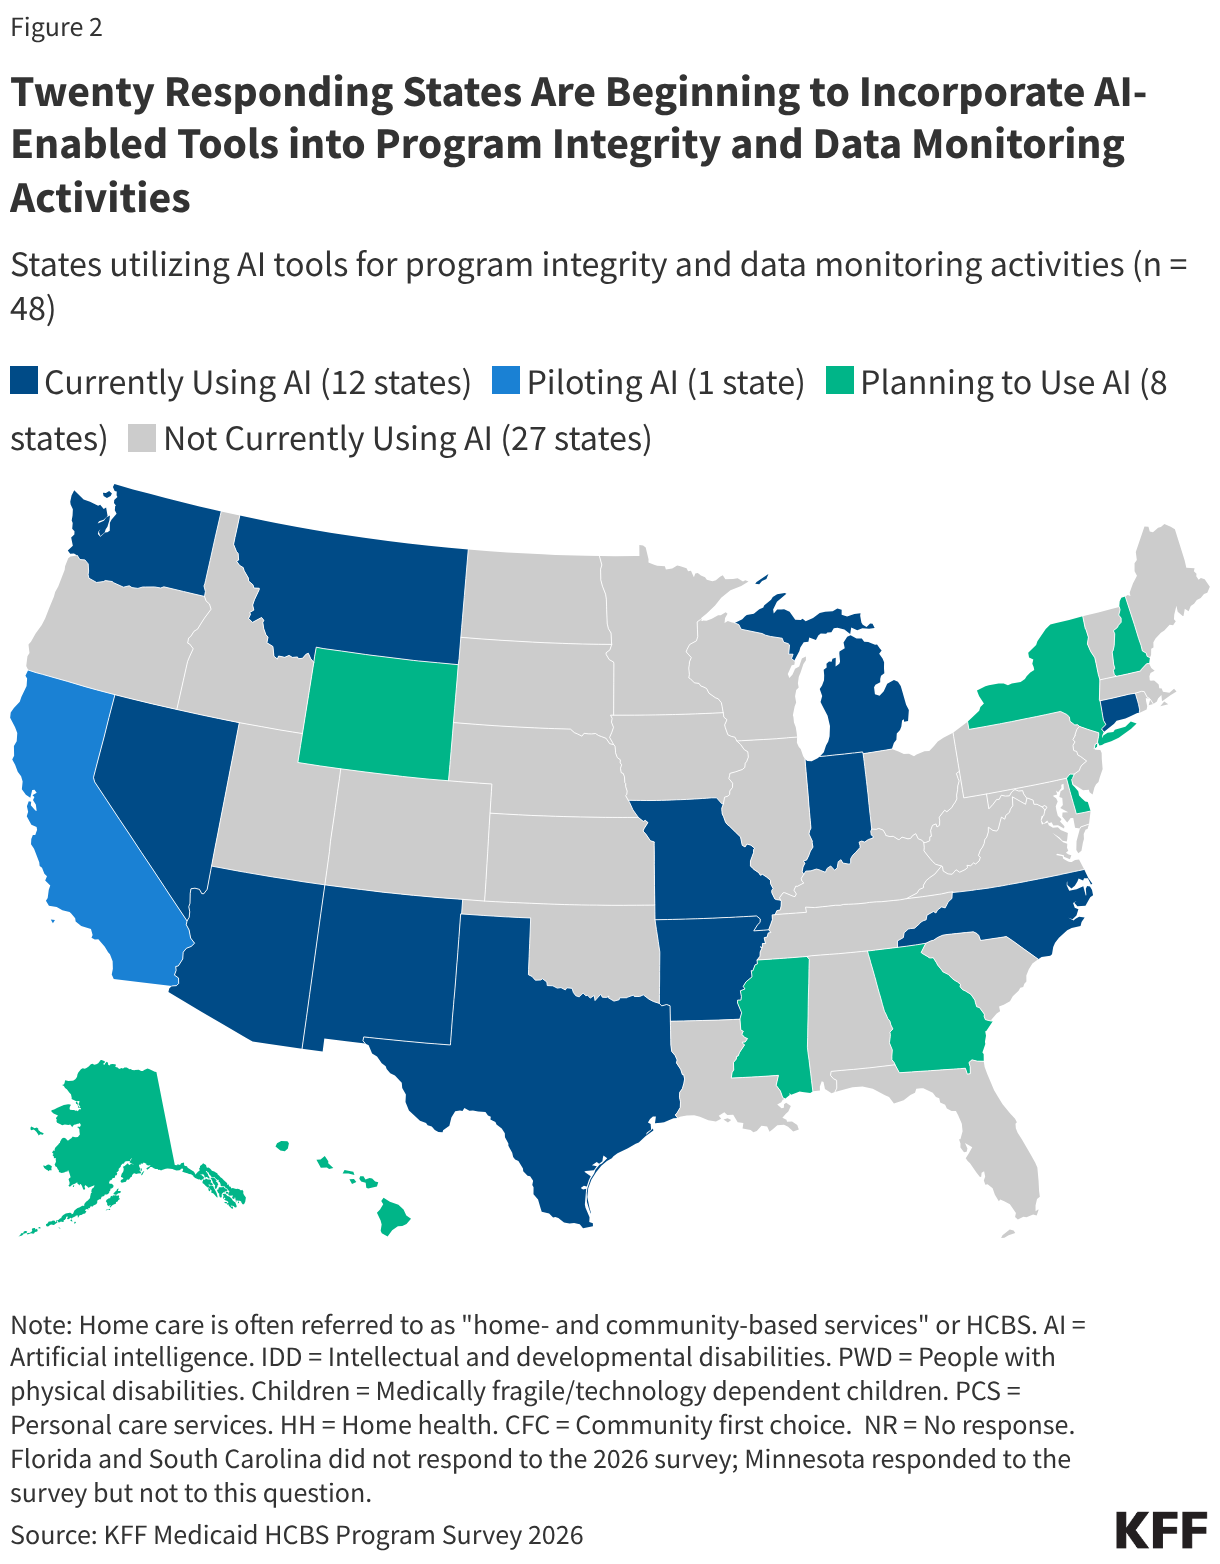
Nearly half of states are currently using or planning to incorporate artificial intelligence (AI) into program integrity and data monitoring activities (Figure 2). KFF asked states to report their current phase of AI tool use for “program integrity and data monitoring (to identify potential fraud, waste, and abuse).” States could report one of five options: currently using, piloting, planning to use, not using, or unknown. Twelve states reported currently using AI-enabled tools for program integrity and data monitoring purposes under at least one program (Arizona, Arkansas, Connecticut, Indiana, Michigan, Missouri, Montana, Nevada, New Mexico, North Carolina, Texas, and Washington). For example, North Carolina reported using AI to create algorithms that would detect fraud, waste, and abuse in its waiver for adults ages 65 and older or with physical disabilities, and Missouri reported using AI to aggregate information about critical incidents and grievances. Of the 12 states currently using AI tools, five states (Arkansas, Connecticut, Michigan, Montana, and North Carolina) also reported they are planning to incorporate AI tools under at least one additional program. One state (California) reported piloting AI-enabled tools for program integrity purposes. Eight states (Alaska, Delaware, Georgia, Hawaii, Mississippi, New Hampshire, New York, and Wyoming) reported that they are not currently using AI tools for program integrity, but that they are planning to incorporate them in the future.

The adoption of AI-enabled tools is most commonly reported under waivers for people with I/DD and adults ages 65 and older and those with physical disabilities. Over one in four states with waivers for people with I/DD and waivers for adults ages 65 and older and those with physical disabilities are currently using or are planning to incorporate AI-enabled tools for their program integrity and data monitoring activities. Seven states with waivers for adults ages 65 and older or those with physical disabilities and five states with waivers for people with I/DD are currently using AI tools for their program integrity and data monitoring activities, more than any other waiver type.

Twenty-One Responding States Are Beginning to Incorporate AI-Enabled Tools into Program Integrity and Data Monitoring Activities (Choropleth map)

This work was supported in part by Arnold Ventures. KFF maintains full editorial control over all of its policy analysis, polling, and journalism activities.

Appendix

States Reporting Utilizing Each Type of EVV Related Program Integrity Tools in Medicaid Home Care Programs (Table)
States Reporting Utilizing Each Type of Other Program Integrity Tools in Medicaid Home Care Programs (Table)

A Look at Waiting Lists for Medicaid Home- and Community-Based Services from 2016 to 2026

Authors: Alice Burns, Abby Wolk, and Molly O'Malley Watts
Published: Oct 5, 2026

Medicaid is the primary payer for long-term care (LTC) in the U.S. and pays for more than two-thirds of the LTC delivered in home- and community-based settings. Most home care (also known as “home- and community-based services” or HCBS) is optional for states to provide and is frequently offered through “waivers,” which allow states to cover a wide range of benefits and to choose—and limit—the number of people who receive services. KFF estimates that more than 5 million Medicaid enrollees use home care, and that about half of people are using home care through waivers. States’ ability to cap the number of people enrolled in home care waivers can result in waiting lists when the number of people seeking services exceeds the number of waiver slots available.

Passed last year, the 2025 reconciliation law made substantial changes to Medicaid that are expected to significantly reduce federal funding for Medicaid and lead to coverage loss for many current enrollees, placing new financial pressures on states, providers, and enrollees. Given the substantial share of Medicaid spending that pays for home care, and the optional nature of most home care programs, cuts to home care programs could occur as states respond to reduced federal spending. If states cut home care by reducing the number of people who can receive waiver services, waiting lists could increase. Proposals to cut home care may face challenges because people who rely on such services have complex health care needs and because elections may make it more difficult to restrict coverage. Recent tracking of programmatic changes to Medicaid home care highlights that some states have cut their programs, but in many cases, proposed cuts were not enacted, and other states continue to make enhancements.

Waiting lists could also increase because of changes to immigration policy in states that use waiting lists to manage shortages of home care workers. Three in 10 direct care workers are immigrants, and recent federal policy changes could further exacerbate the challenge of retaining and growing the workforce.

This data note provides new information about waiting lists in Medicaid home care before many of the provisions in the reconciliation law go into effect. Waiting lists are an incomplete measure of unmet need (Box 1) and are not necessarily comparable across states or over time. The data come from the 24th KFF survey of officials administering Medicaid home care programs in all 50 states and the District of Columbia (hereafter referred to as a state), which states completed between April and August 2026. The survey was sent to each state official responsible for overseeing home care benefits (including home health, personal care, and waiver services for specific populations such as people with physical disabilities). All states except Florida and South Carolina responded to the 2026 survey. To facilitate comparisons over time, Florida’s responses to the 2022 survey and South Carolina’s responses to the 2025 survey were included with their permission. Survey findings are reported by state and waiver target population, although states often offer multiple waivers for a given target population. Key takeaways include:

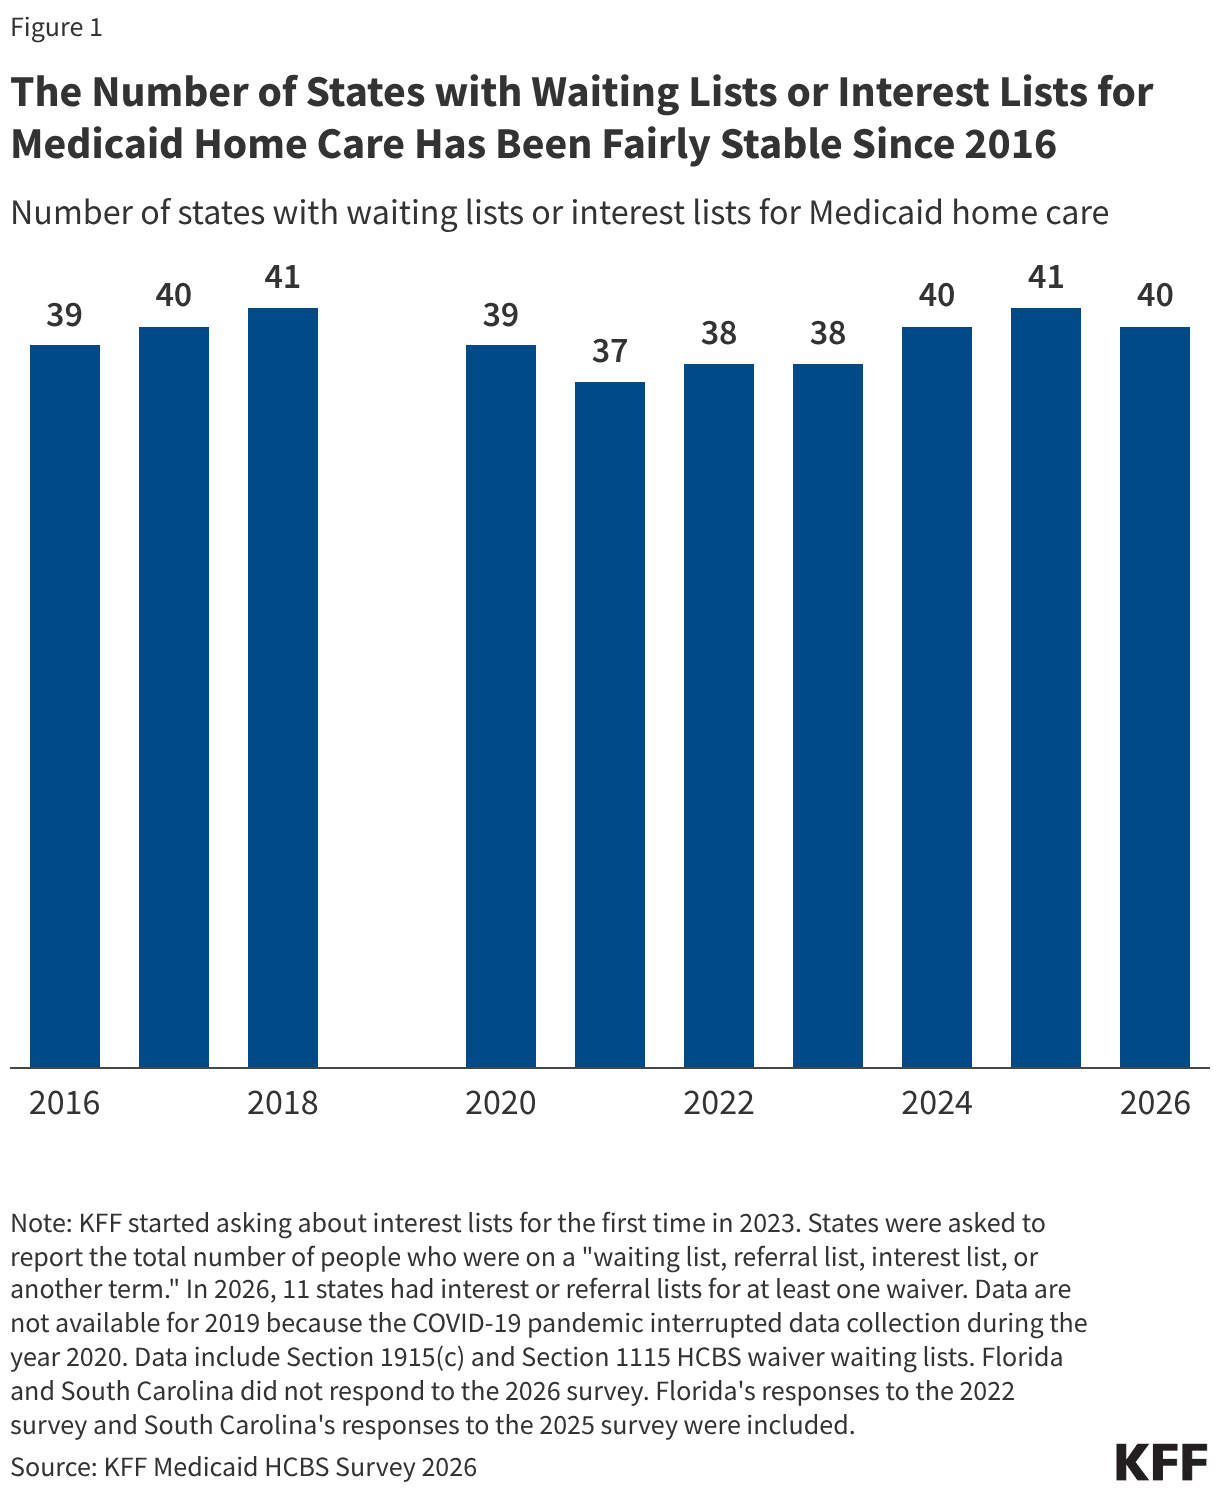
  • Forty states maintain waiting lists or interest lists for people who would like to receive home care, a number that fluctuated little between 2016 and 2026.
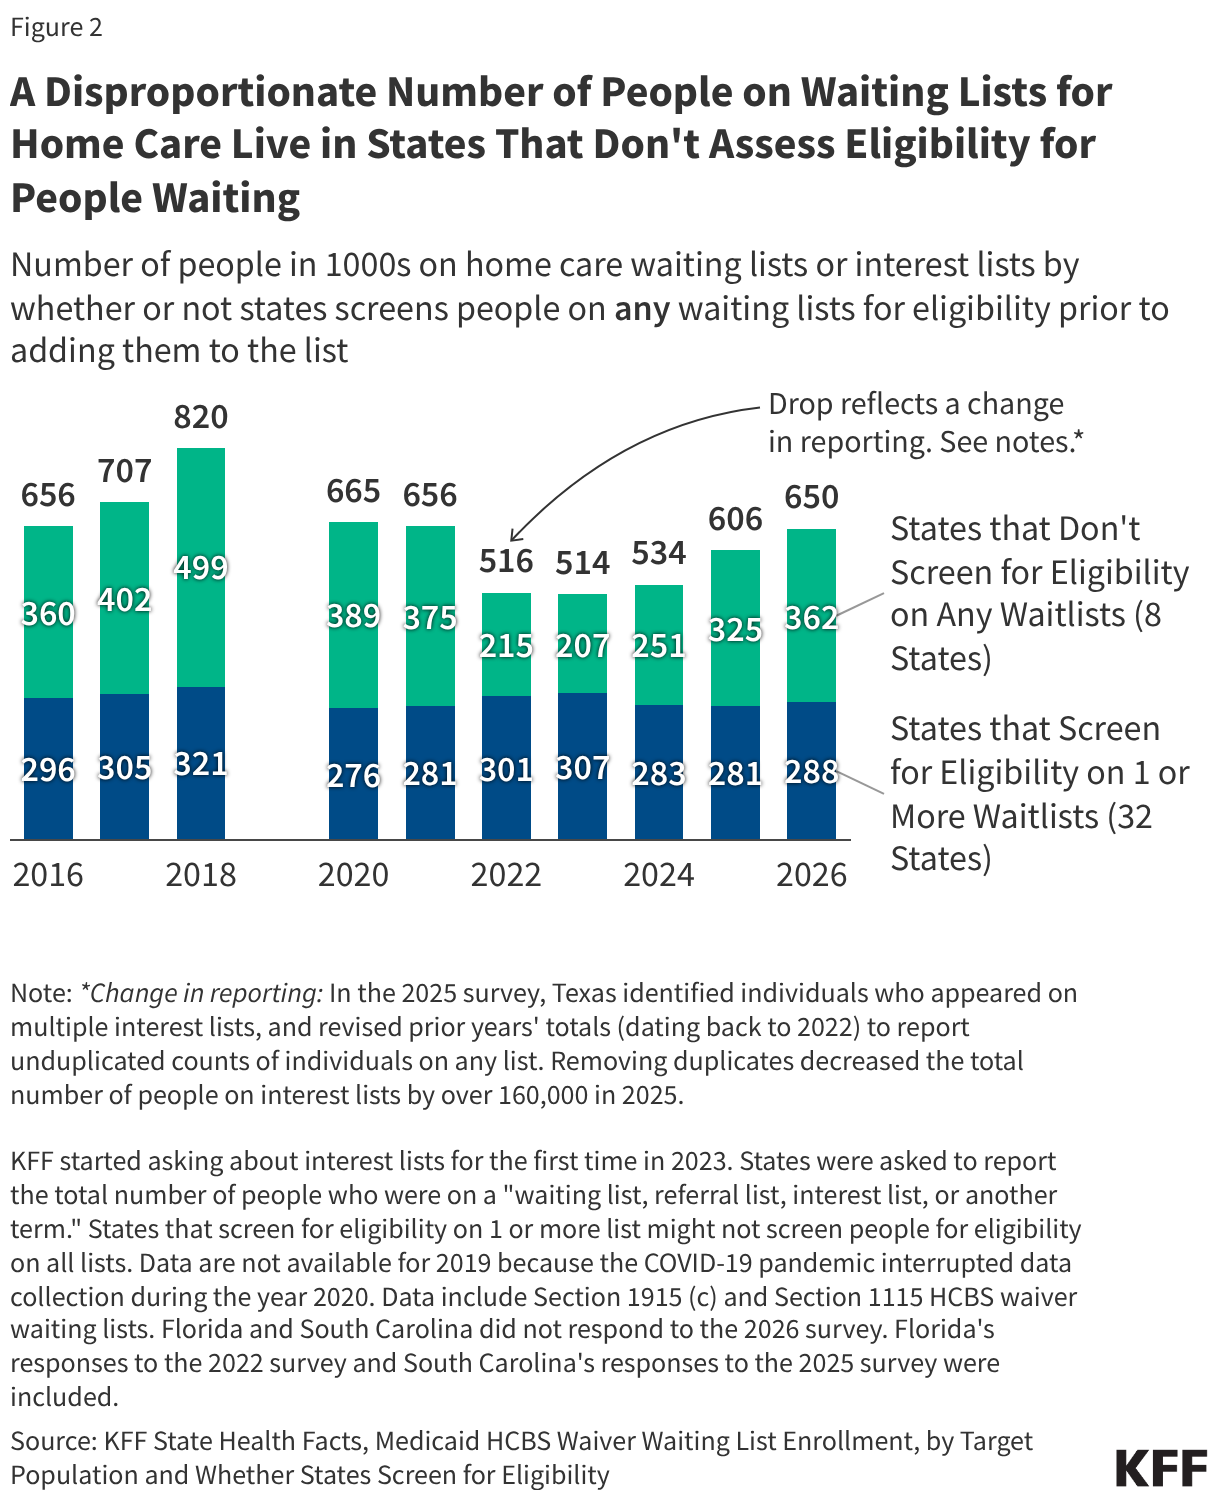
  • In all years since 2016, there have been at least 0.5 million people on waiting lists or interest lists, with a total of almost 650,000 in 2026.
  • In 2026, two states reported having at least one new waiting list (across three waivers), and 32 states reported an increase in the number of people on waiting lists or interest lists compared with only 7 states reporting a decrease.
  • Most people on waiting lists or interest lists have intellectual or developmental disabilities (I/DD), and most live in states that do not screen any people for eligibility prior to adding them to waiting lists.
  • Most people on waiting lists or interest lists are eligible for personal care provided through states’ regular Medicaid programs or for services provided through specialized state plan home care benefits.

KFF also recently updated the waiting list indicators on State Health Facts, which show data by state and target population.

Box 1: Why do waiting lists provide an incomplete measure of unmet need and why is it difficult to compare waiting lists across states?

Waiting lists provide an indication of people who may need services they are not receiving, but they are an incomplete measure of unmet need for several reasons. Waiting lists reflect the populations a state chooses to serve, the services it decides to provide, the resources it commits, and the availability of workers to provide services. Waiting lists do not include people with unmet needs in the following types of circumstances:

  • States do not cover the applicable services (and therefore have no waiting list),
  • States allow all eligible people to enroll but restrict service provision to manage total spending in the waiver, and
  • Eligible people are enrolled but providers have no excess capacity (and in some cases, the home care providers maintain their own waiting lists).

It is difficult to compare waiting lists across states because states’ approaches to managing waiting lists differ in how they prioritize and screen for eligibility. Some waiting lists include only eligible individuals while others include people for whom eligibility has not been determined. The availability of non-waiver services for people on waiting lists also varies. Although people may wait a long time to receive waiver services—34 months on average in 2026—most people are eligible for other types of home care while they wait.

Starting in 2027, states will be required to report the number of people on waiting lists as required under a final rule on access to Medicaid services, but it is unclear whether such reporting will address these data limitations on waiting lists. The data will include the number of people who are waiting to enroll in a waiver program, information on whether the people on the list have been screened for eligibility, the average amount of time people newly enrolled in the waiver over the past 12 months spent waiting to enroll, the average length of time between approval for services and service start dates, and the percent of authorized hours of care that were provided. Although the regulation does not mention interest lists, referral lists, or registries, the preamble to the rule indicates the Centers for Medicare & Medicaid Services’ (CMS) intent for states to report all types of lists.

Despite the enhanced data states will be required to report, waiting list and waiver information will remain imperfect measures of unmet need. None of the new data will reflect how long it takes for people to receive home care provided through the Medicaid state plan, or how comprehensive services are. The new data also do not capture the number of people whose authorized services are below needed levels because of hourly or dollar caps on the amount of home care they can receive.

How Many States Have Waiting Lists for Home Care?

Between 2016 and 2026, the number of states with waiting lists has fluctuated between 37 and 41 and is currently at 40 states (Figure 1). While some Affordable Care Act (ACA) opponents have cited waiver waiting lists to argue that expanding Medicaid diverts funds from adults ages 65+ and those with physical disabilities, research shows that ACA Medicaid expansion has led to gains in coverage for people with disabilities and chronic illnesses. Waiting lists for home care predate the ACA Medicaid expansion, which became effective in most states in 2014, and both expansion and non-expansion states have waiting lists. Waiver enrollment caps have existed since home care waiver authority was added to federal Medicaid law in the early 1980s.

The Number of States with Waiting Lists or Interest Lists for Medicaid Home Care Has Been Fairly Stable Since 2016 (Stacked column chart)

While the overall number of states with waiting lists did not change much from 2025 to 2026, there were more changes in waiting lists for specific states and for specific types of waivers. Seven states (across eight waivers) removed waiting lists, including Nebraska, which no longer reported any waiting lists, and Oregon, which eliminated a waiting list of 1,000 people from its Section 1115 waiver for adults ages 65+ and those with physical disabilities. Two states (across three waivers) reported new waiting lists. Washington reported new waiting lists for people with I/DD (275 people) and adults ages 65+ and those with physical disabilities (waiting list size unknown), and Kentucky reported a new waiting list for individuals with traumatic brain or spinal cord injuries (5 people).

How Many People Are on Waiting Lists for Home Care?

Between 2025 and 2026, total enrollment in waiting lists and interest lists increased by about 7% and is almost 650,000 in 2026 (Figure 2). Overall, there was an increase in the number of people on waiting or interest lists in 32 states and a decrease in 7 states. One factor that contributes to changes over time is changes in states’ policies for managing their waiting lists. In 2026, several states changed their policies, but those changes did not result in any major increases or decreases in waiting lists. However, that has not been true in past years. For example, between 2018 and 2020, the total number of people on waiting lists decreased by 155,000, or 19%. Nearly half of that change came from Ohio’s implementation of a waiting list assessment of waiver eligibility, which reduced the size of the state’s waiting list by nearly 70,000 people. In 2026, most states (32) with waiting lists screen individuals for waiver eligibility for at least one waiver, but even among those states, four (California, Maryland, Mississippi, and Washington) do not screen for all waivers. The eight states that do not screen for eligibility among any waivers (Alaska, Florida, Iowa, New Mexico, Oklahoma, Oregon, South Carolina, and Texas) account for over half (56%) of all people on waiting lists.

A Disproportionate Number of People on Waiting Lists for Home Care Live in States That Don't Assess Eligibility for People Waiting (Stacked column chart)

In 2026 and earlier years, a disproportionate number of people on home care waiting lists or interest lists lived in states that did not screen people on waiting lists for eligibility. One reason waiting lists provide an incomplete picture of need is that not all people on waiting lists will be eligible for services. The number of states that do not screen for eligibility on any waiting lists ranged from six to eight states between 2022 and 2026, yet the share of individuals on waiting lists in these states ranged from 40% to 56%. Interviews about home care waiting lists found that when waiver services are provided on a first-come, first-served basis, people enroll in waiting lists in anticipation of future need. That study found that in some states, families would add their children to waiting lists for people with I/DD at a young age, assuming that by the time they reached the top of the waiting list, their children would have developed the immediate need for services. Many of those waivers offer comprehensive home care packages that include supported employment, supportive housing, or round-the-clock services. Among the eight states that do not screen people for eligibility on any lists, seven have only waiting lists and one has only interest lists.

Who Is on Waiting Lists for Home Care?

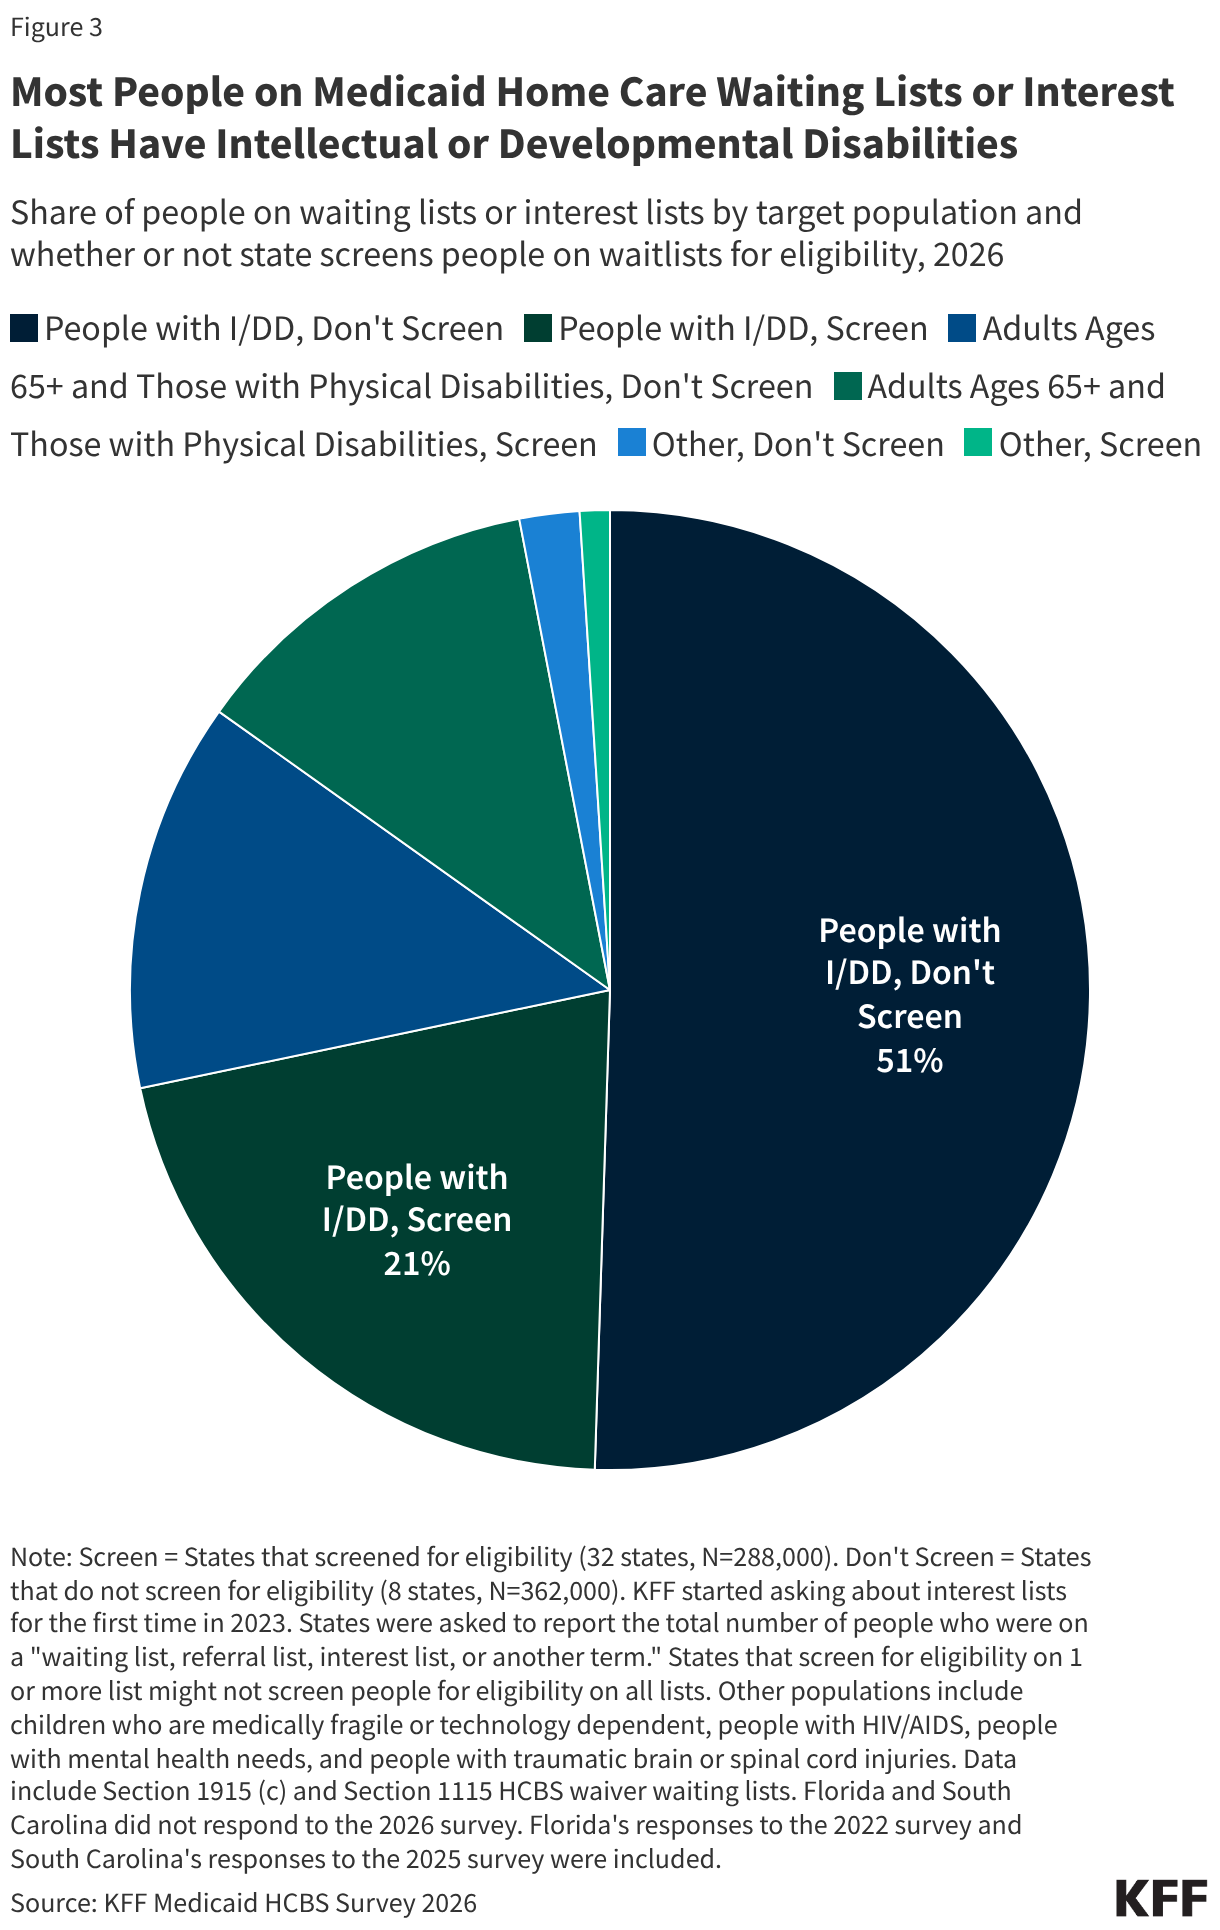
Most people on waiting lists have I/DD, particularly in states that do not screen for waiver eligibility before placing someone on a waiting list. People on waiting lists for waivers serving people with I/DD (which include waivers specific to people who have autism) make up 78% of waiting lists in states that do not screen for waiver eligibility, compared with 61% in states that do determine waiver eligibility before placing someone on a waiting list. People with I/DD make up almost three-quarters (72%) of the total waiver waiting list population (Figure 3). Adults ages 65+ and those with physical disabilities account for one-quarter (25%), while the remaining share (3%) includes children who are medically fragile or technology dependent, people with traumatic brain or spinal cord injuries, people with mental illness, and people with HIV/AIDS. People who are on home care waiting lists are generally not representative of the Medicaid population or the population that uses home care. Most people on waiting lists have I/DD, but KFF analysis shows that people with I/DD make up fewer than half of the people served through 1915(c) waivers (the largest source of Medicaid home care spending).

Most People on Medicaid Home Care Waiting Lists or Interest Lists Have Intellectual or Developmental Disabilities (Pie Chart)

How Long Are People on Waiting Lists for Home Care?

In 2026, people on waiting or interest lists accessed services after an average of 34 months (35 of 40 states responding), up from 32 months in 2025. People with I/DD wait 38 months on average. The average waiting period for other waiver populations ranged from 8 months for waivers targeting medically fragile and technology-dependent children to 65 months for waivers that serve people with autism.

Most people on waiting or interest lists for whom living arrangements are known live in community settings while they wait. Among the 649,900 people on lists for waiver services in 2026, living arrangements are unknown for more than 425,000. Among the people whose living arrangements are known, 95% (213,800) live in the community and 5% (10,900) live in institutional settings. Although most people on waiting lists live in the community, that may not be true for all waivers. In one California waiver for adults ages 65+ and those with physical disabilities, nearly half of the 16,100 people on the waiting list are living in institutions.

While waiting for waiver services, people living in the community are likely to be eligible for other home care through Medicaid state plans. Of the more than 5 million people who use home care, KFF estimates that roughly half use services provided through the Medicaid state plan, such as personal care to help with bathing or preparing meals, therapies to help people regain or acquire independent living skills, and assistive technology. States may not use waiting lists to restrict the number of people eligible to use such services, and over 80% of people on home care waiting lists are eligible for personal care or other state plan services. They would not, however, have access to more specialized services such as supported employment or adult day care. People on waiting lists who receive state plan services may also have fewer hours of personal care than they would in a waiver program, or they may not have assistance with some of the activities they need help with, such as bathing, dressing, preparing meals, or managing medication.

Many Medicare Part D Stand-Alone Drug Plan Enrollees Will See Modest Premium Increases for 2027, But Others Could Pay Much More If They Don’t Switch Plans

Published: Oct 2, 2026

The Centers for Medicare & Medicaid Services (CMS) has just released information about Medicare Part D plans for 2027, including plan availability and premiums for the coming year. The agency emphasized stability in the Part D prescription drug plan (PDP) marketplace for 2027 (as it did for 2026) and estimated only a modest $1 increase in the average monthly PDP premium from $35 to $36. KFF analysis of PDP availability and premiums for 2027 shows a mixed picture, with modest premium increases for many Part D enrollees for their current plan but steeper increases for others, and a reduction in the number of PDP options for the fourth year in a row. Key takeaways include:

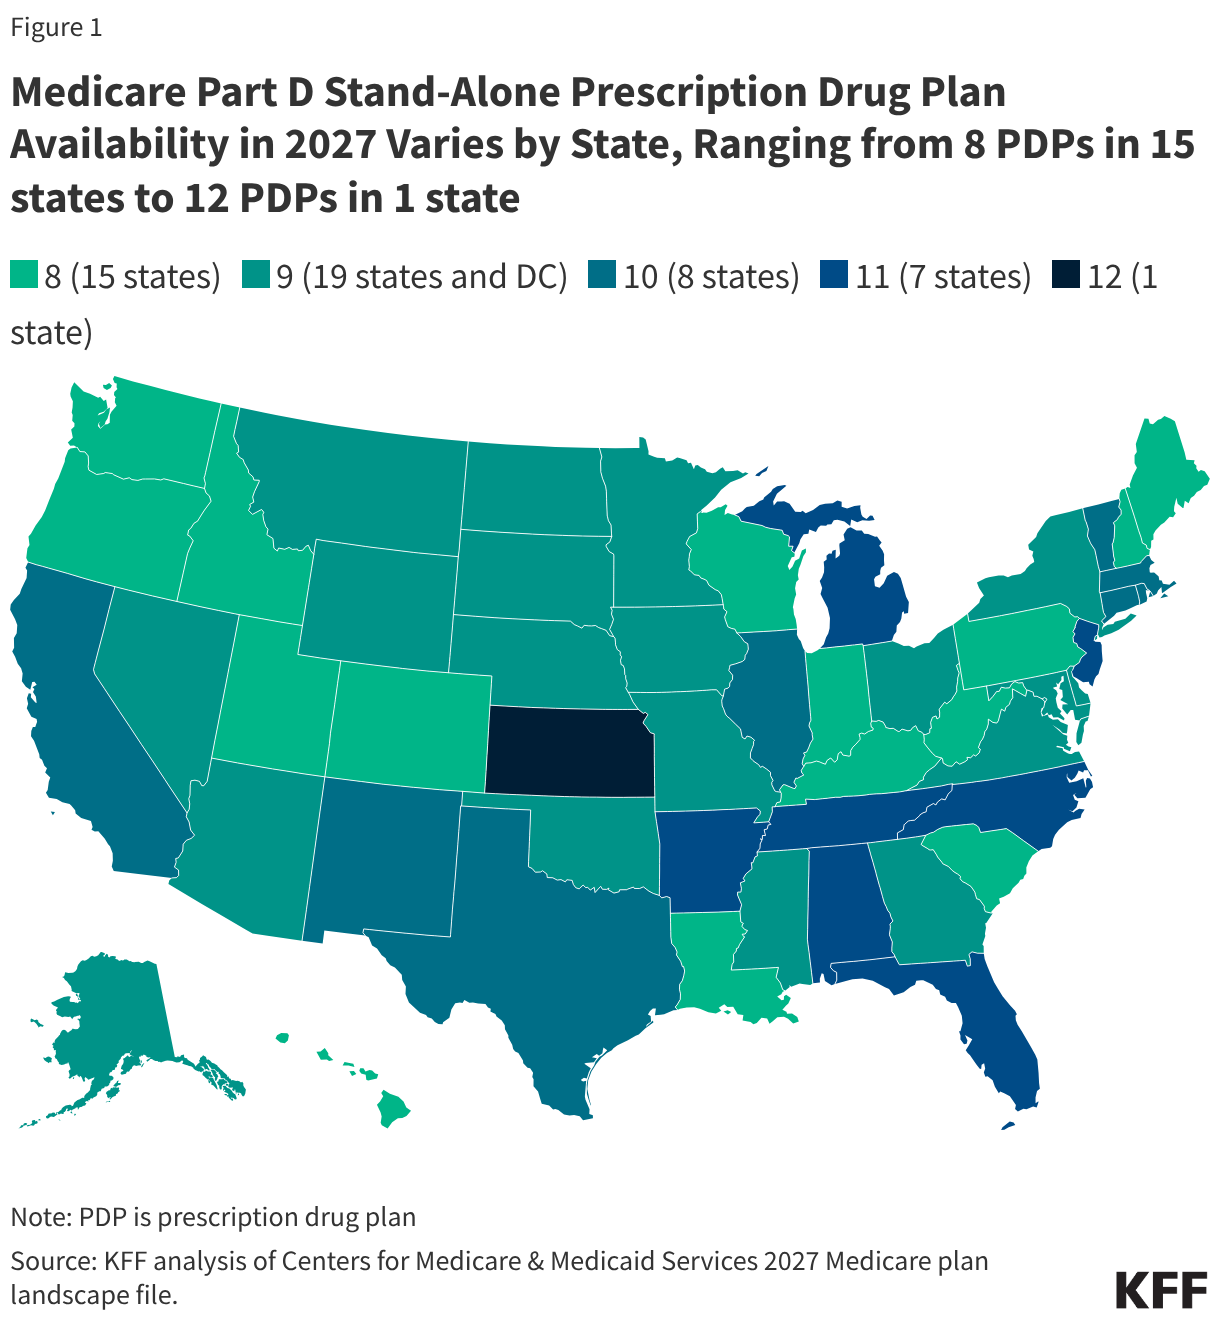
  • The number of stand-alone PDPs available to the average beneficiary will fall for the fourth year in a row, from 11 in 2026 to 9 in 2027. PDP availability in 2027 varies by state, ranging from 8 PDPs in 15 states to 12 PDPs in 1 state, the same range as in 2026 but with most states having 8 or 9 PDPs rather than 10 or more.
  • Many PDP enrollees will see premium reductions or only modestly higher premiums in 2027 if they keep their current plan, but others will face substantially higher premiums. Enrollees in six of the eight PDPs that will continue to be offered on a national basis in 2027 will see premium reductions in some states if they keep their current plan, but enrollees in many other states will see higher premiums for these same plans if they don’t switch. Centene continues to offer the lowest-premium PDPs in 2027, with premiums for both Wellcare PDPs under $10 per month in many states, while enrollees in United’s AARP-branded PDPs will face substantially higher premiums and monthly increases of $50 or more in many states if they keep their current plan.
  • There will be no zero premium PDPs available for Part D enrollees who do not receive low-income subsidies (LIS) in 2027. All 4 million PDP enrollees who paid no monthly premium in 2026 will face higher premiums in 2027 whether they keep their current plan or switch to a new PDP.
  • With 56% of all Part D enrollees in Medicare Advantage drug plans in 2026, a majority of Part D enrollees will not be affected by PDP premium changes and may not face premium increases of any magnitude. Medicare Advantage plans can use rebate dollars from the federal government to reduce premiums for prescription drug coverage, funds that are not available to plan sponsors for PDPs.
  • Ending the Part D Premium Stabilization Demonstration did not result in substantially higher across-the-board PDP premiums but still likely affected premium levels for 2027. The disappearance of zero premium PDPs for Part D enrollees without low-income subsidies and monthly premium increases greater than $50 for some PDP enrollees if they keep their current plan are possibly related to the termination of extra subsidies that were provided to PDP plan sponsors under the demonstration.

Findings

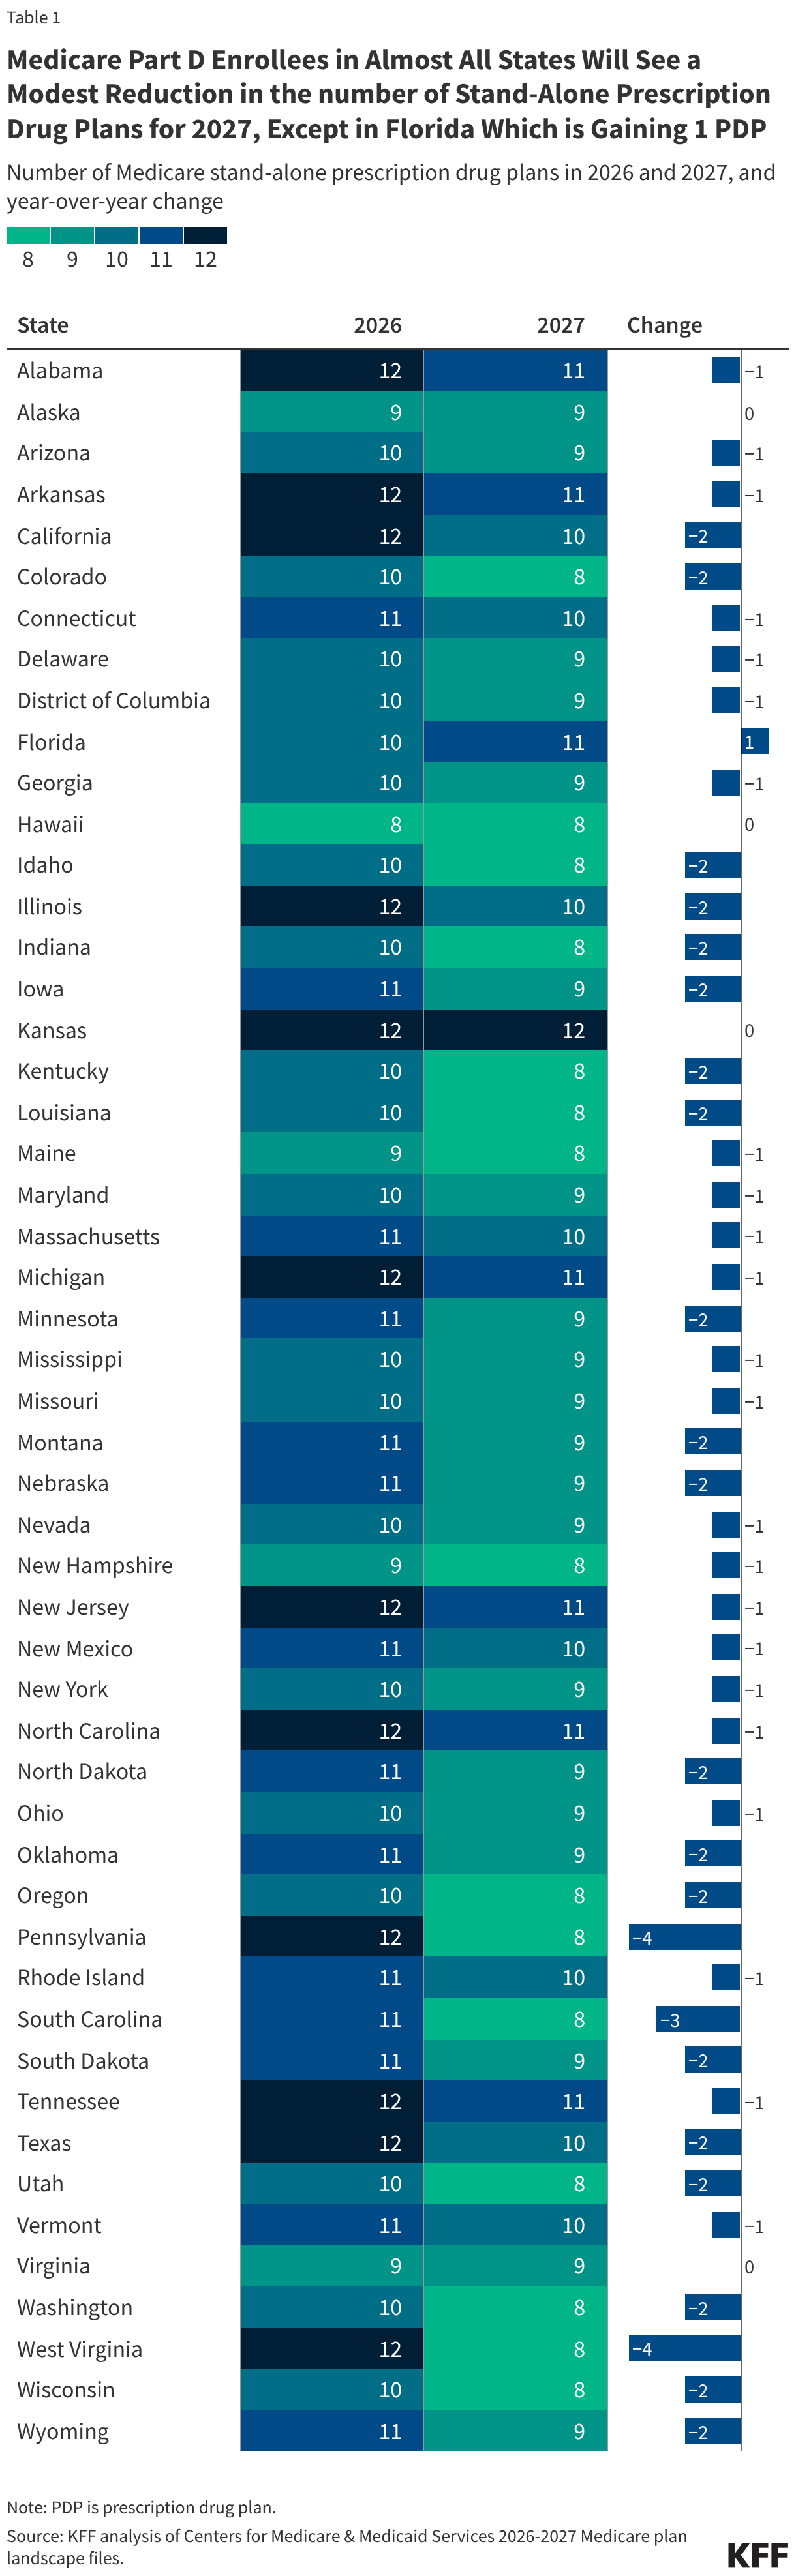
The number of stand-alone PDPs available to the average beneficiary will fall for the fourth year in a row, from 11 in 2026 to 9 in 2027, while the total number of stand-alone drug plans available will fall from 360 plans nationwide offered by 17 parent organization in 2026 to 316 plans offered by 15 parent organizations in 2027. The reduction in PDP offerings is largely due to two plan sponsors scaling back: Health Care Service Corporation is withdrawing the HealthSpring Extra Rx PDP from 22 regions, and CVS Health is withdrawing the Silverscript Choice PDP from 13 regions. Humana remains the only insurer offering three PDPs in all 34 PDP regions. PDP availability in 2027 varies by state, ranging from 8 PDPs in 15 states to 12 PDPs in 1 state (Figure 1) – the same range as in 2026 but with most states having 8 or 9 PDPs rather than 10 or more. Medicare Part D enrollees in almost all states will see a modest reduction in the number of PDPs for 2027, except Florida which is gaining 1 PDP and no change in 4 other states (Table 1).

Medicare Part D Stand-Alone Prescription Drug Plan Availability in 2027 Varies by State, Ranging from 8 PDPs in 15 states to 12 PDPs in 1 state (Choropleth map)

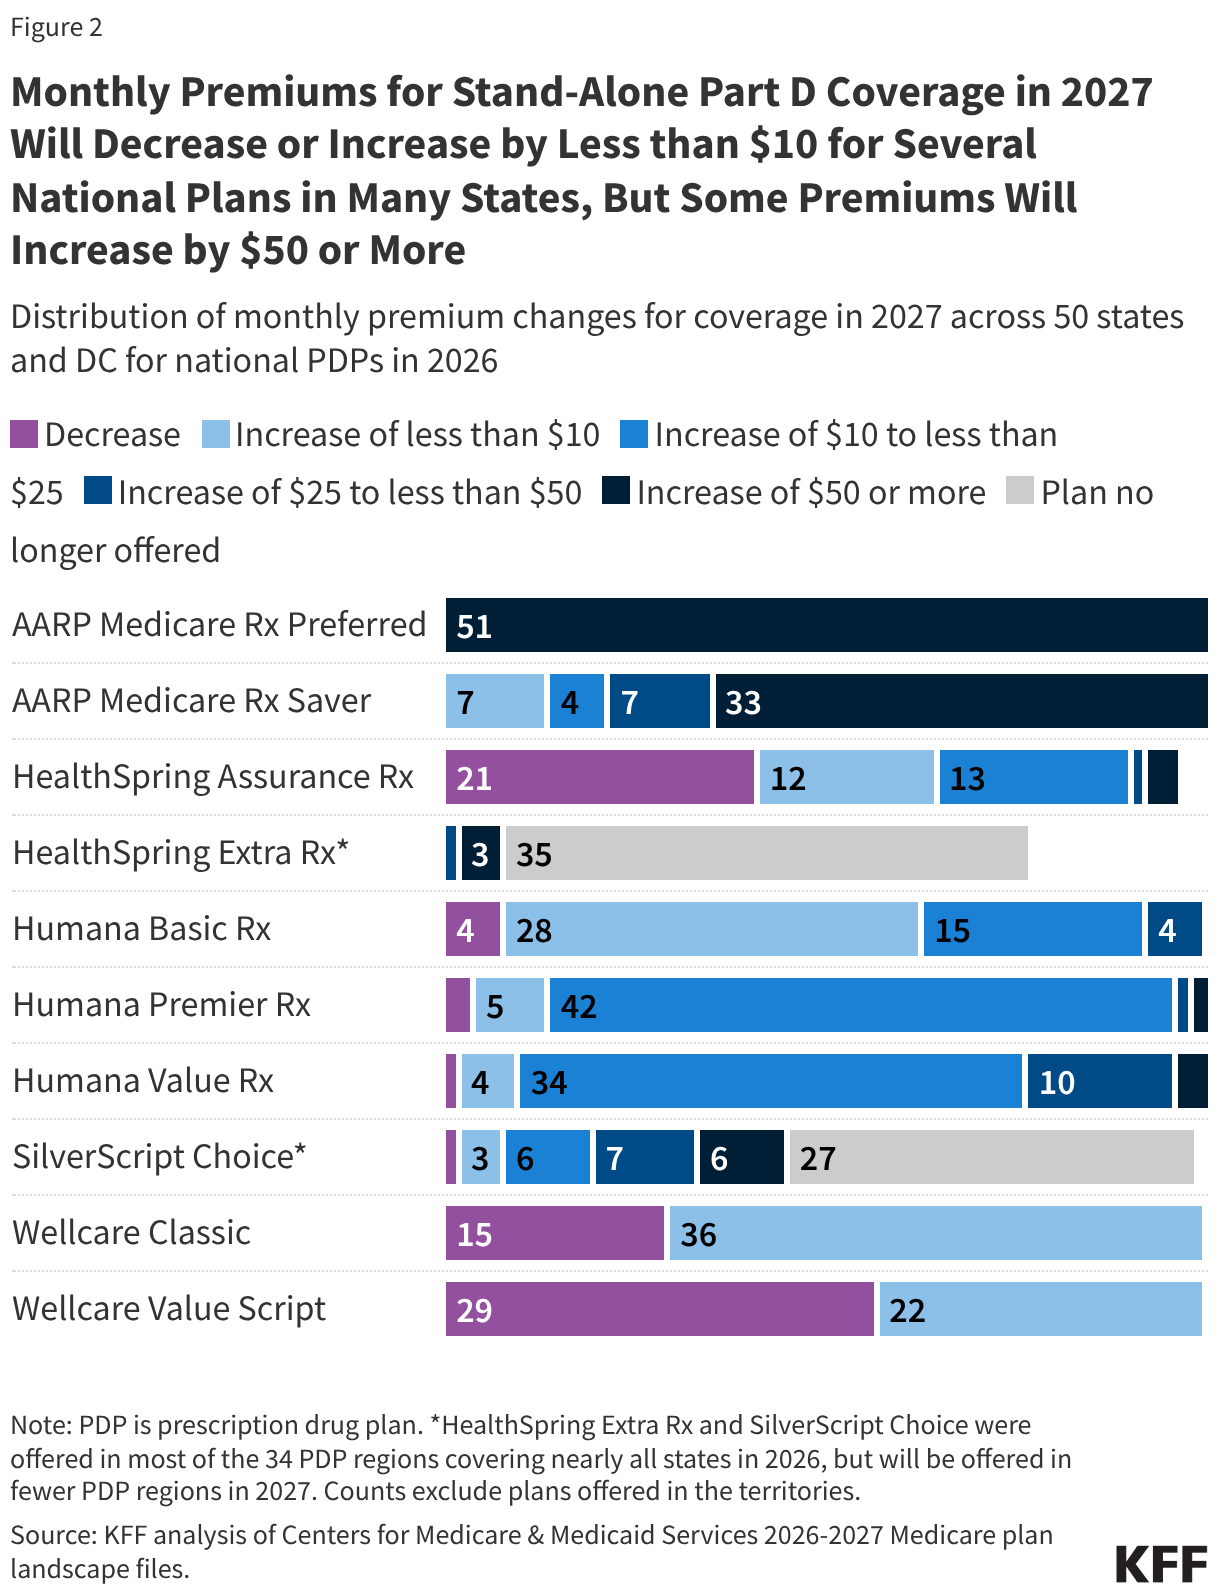
Many PDP enrollees will see premium reductions or only modestly higher premiums in 2027 if they keep their current plan, but others will pay substantially higher premiums. Enrollees in six of the eight PDPs that will continue to be offered on a national basis in 2027 will see premium reductions in some states if they keep their current plan, but enrollees in many other states will see higher premiums for these same plans if they don’t switch (Figure 2).

Monthly Premiums for Stand-Alone Part D Coverage in 2027 Will Decrease or Increase by Less than  for Several National Plans in Many States, But Some Premiums Will Increase by  or More (Stacked Bars)

Other takeaways from an initial analysis of 2027 PDP premiums and changes from 2026 include:

  • There will be no $0 premium PDPs available for Part D enrollees who do not receive low-income subsidies (LIS) in 2027. According to KFF analysis, 28% of PDP enrollees without LIS, or 4 million PDP enrollees, paid no monthly premium in 2026. All these enrollees will face higher premiums in 2027 whether they keep their current plan or switch to a new PDP. This includes:
    • Humana Basic Rx PDP enrollees in 28 states, facing premium increases of $6.30 to $30.60 per month if they keep this plan;
    • Wellcare Value Script and Wellcare Classic enrollees in 16 states, facing monthly increases of $5.30 and $7.30 respectively;
    • HealthSpring Assurance Rx enrollees in 11 states, facing monthly increases of $9.30 to $14.70;
    • Humana Value Rx enrollees in 5 states, facing monthly increases of $17.20 to $22.30; and
    • AARP Medicare Rx Saver enrollees in 3 states, facing a monthly increase of $10.30.
  • Centene continues to offer the lowest premium PDPs, with 2027 monthly premiums of $5.30 for Wellcare Value Script in 45 states and $7.30 for Wellcare Classic in 33 states. For the 5.9 million non-LIS enrollees in Wellcare Value Script in 2026, those in 29 states will see premium reductions in 2027 ranging from less than $1 to $17.50 if they keep their current plan, while those in another 22 states will see premium increases in 2027 ranging from less than $1 to $5.30.
  • Enrollees in United’s AARP-branded PDPs will face substantially higher premiums in many states if they keep their current plan, with monthly premium increases of $50 or more in all 50 states and DC for AARP Medicare Rx Preferred (including 37 states with premium increases greater than $75 and 4 states with premium increases of more than $100) and increases of $50 or more in 33 states for AARP Medicare Rx Saver. Together, these plans enroll more than 2 million non-LIS enrollees in 2026. Switching to a less expensive PDP is an option in all areas, but KFF analysis shows that many enrollees don’t compare plans or switch during open enrollment.

With 56% of all Part D enrollees in Medicare Advantage drug plans in 2026, a majority of Part D enrollees will not be affected by PDP premium changes and may not face premium increases of any magnitude. According to CMS, the average Medicare Advantage drug plan premium for 2027 will continue to be considerably lower than the average monthly PDP premium, and it’s likely that most MA-PD enrollees will be in plans charging zero premium in 2027, as in 2026 and previous years. This is because Medicare Advantage plans can use rebate dollars from the federal government to reduce premiums for prescription drug coverage, funds that are not available to plan sponsors for PDPs.

Ending the Part D Premium Stabilization Demonstration did not result in substantially higher across-the-board PDP premiums but still likely affected premium levels for 2027. CMS’s decision to terminate the Part D Premium Stabilization Demonstration for 2027, rather than continue it for a third year as originally planned when the demonstration was announced, seemed to point in the direction of higher premiums for PDP coverage in 2027. The demonstration provided extra subsidies to PDP plan sponsors, and by extension PDP enrollees, in two ways – reducing the base beneficiary premium, which is used in the calculation of individual plan premiums, and capping the year-over-year increase in the monthly premium. CMS determined that the extra financial support provided to PDP sponsors under the demonstration was no longer needed after 2026, and in fact, across-the-board substantial PDP premium increases for 2027 didn’t materialize. However, the disappearance of zero premium PDPs for Part D enrollees without low-income subsidies is a possible outcome of the termination of the demonstration, and eliminating the cap on the year-over-year increase in the monthly PDP premium has meant that monthly premium increases greater than $50 are possible for some PDP enrollees if they keep their current plan.

Even if the monthly premium for a given Part D drug plan is decreasing or increasing only modestly, premiums are only one feature for beneficiaries to consider when evaluating their Part D coverage. As is commonly advised during open enrollment, Medicare beneficiaries may want to evaluate what other features of their Part D plan might be changing, including what drugs are and aren’t covered on the plan’s formulary, tier placement of covered drugs, deductibles, and cost-sharing requirements. With Part D costs overall on the rise, the tradeoff Part D enrollees might face as their premium increases are kept in check is that their coverage may be getting less generous, which could mean fewer drugs covered, higher cost-sharing requirements, or greater utilization management restrictions – or possibly a combination of all three.

Medicare Part D Enrollees in Almost All States Will See a Modest Reduction in the number of Stand-Alone Prescription Drug Plans for 2027, Except in Florida Which is Gaining 1 PDP (Table)

Medicare 101

0:00
0:00

KFF Authors:

Table of Contents

What Is Medicare?

Copy link to What Is Medicare?

Medicare is the federal health insurance program established in 1965 under Title XVIII of the Social Security Act for people age 65 or older, regardless of income or medical history, and later expanded to cover people under age 65 with long-term disabilities. Today, Medicare provides health insurance coverage to 68 million people, including 61 million people age 65 or older and 7 million people under age 65. Medicare covers a comprehensive set of health care services, including hospitalizations, physician visits, and prescription drugs, along with post-acute care, skilled nursing facility care, home health care, hospice, and preventive services. People with Medicare can choose to get coverage under traditional Medicare or Medicare Advantage private plans.

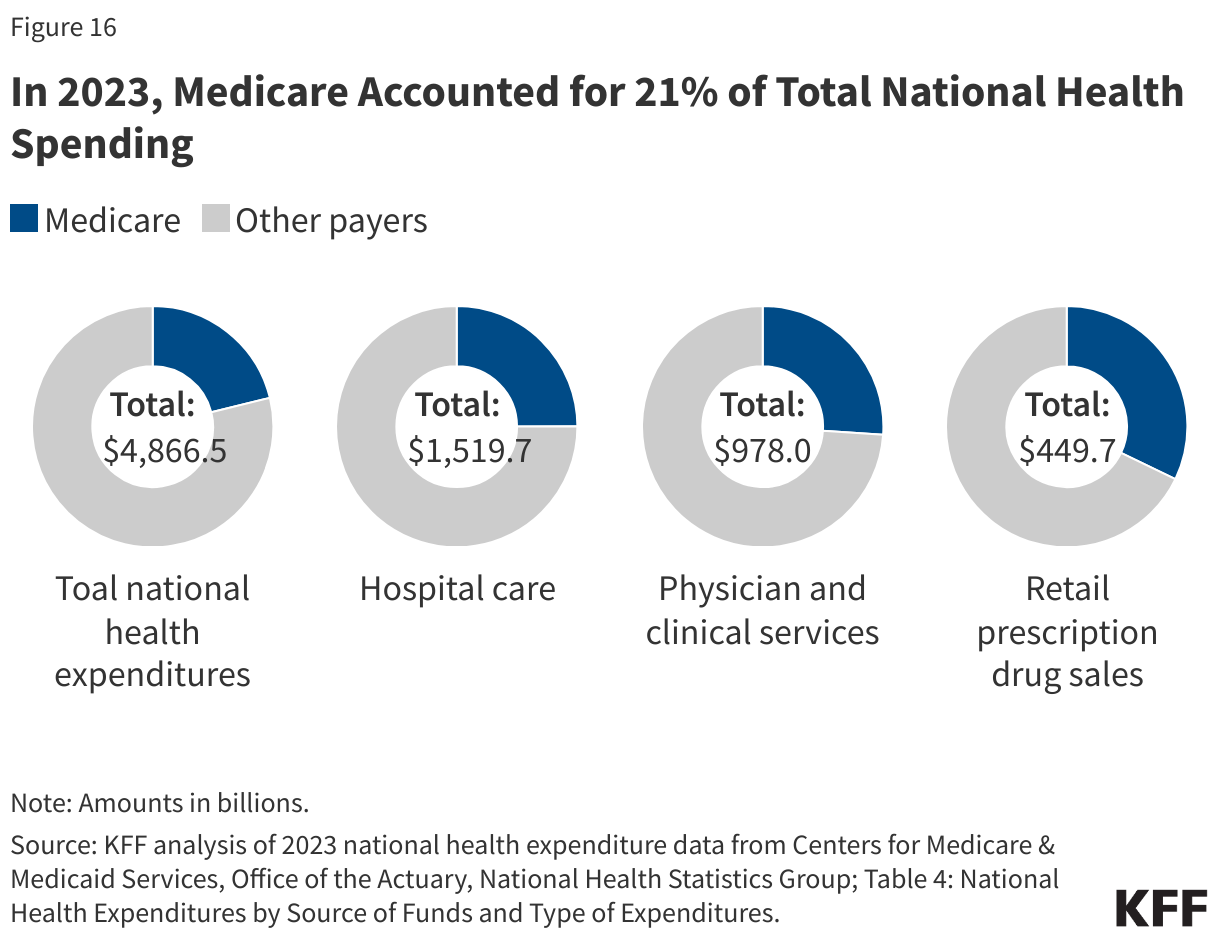
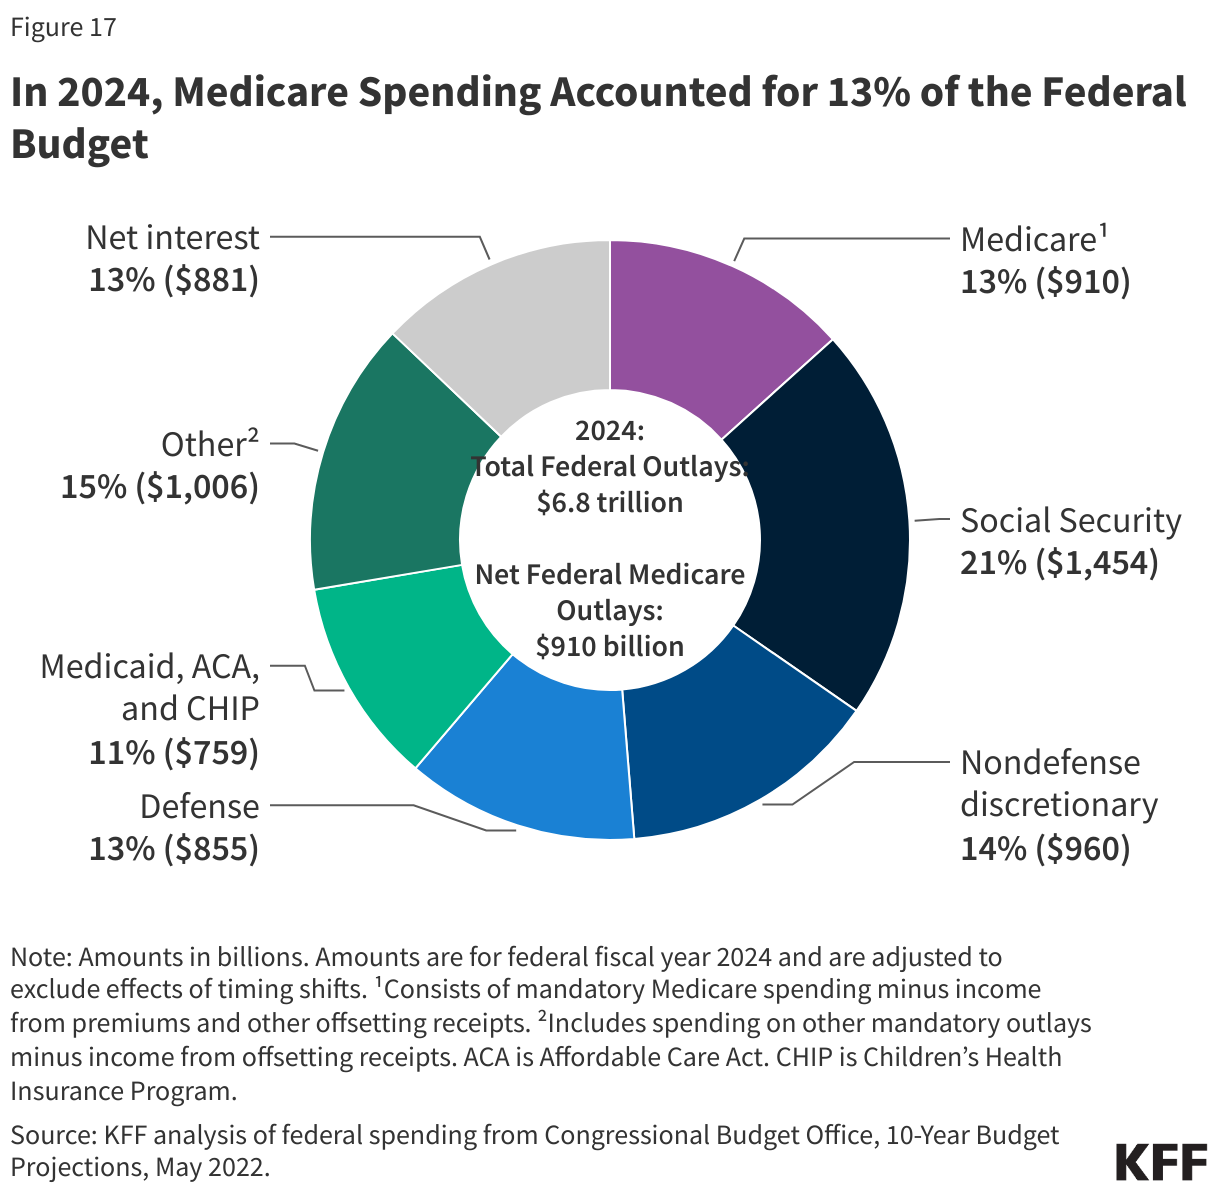
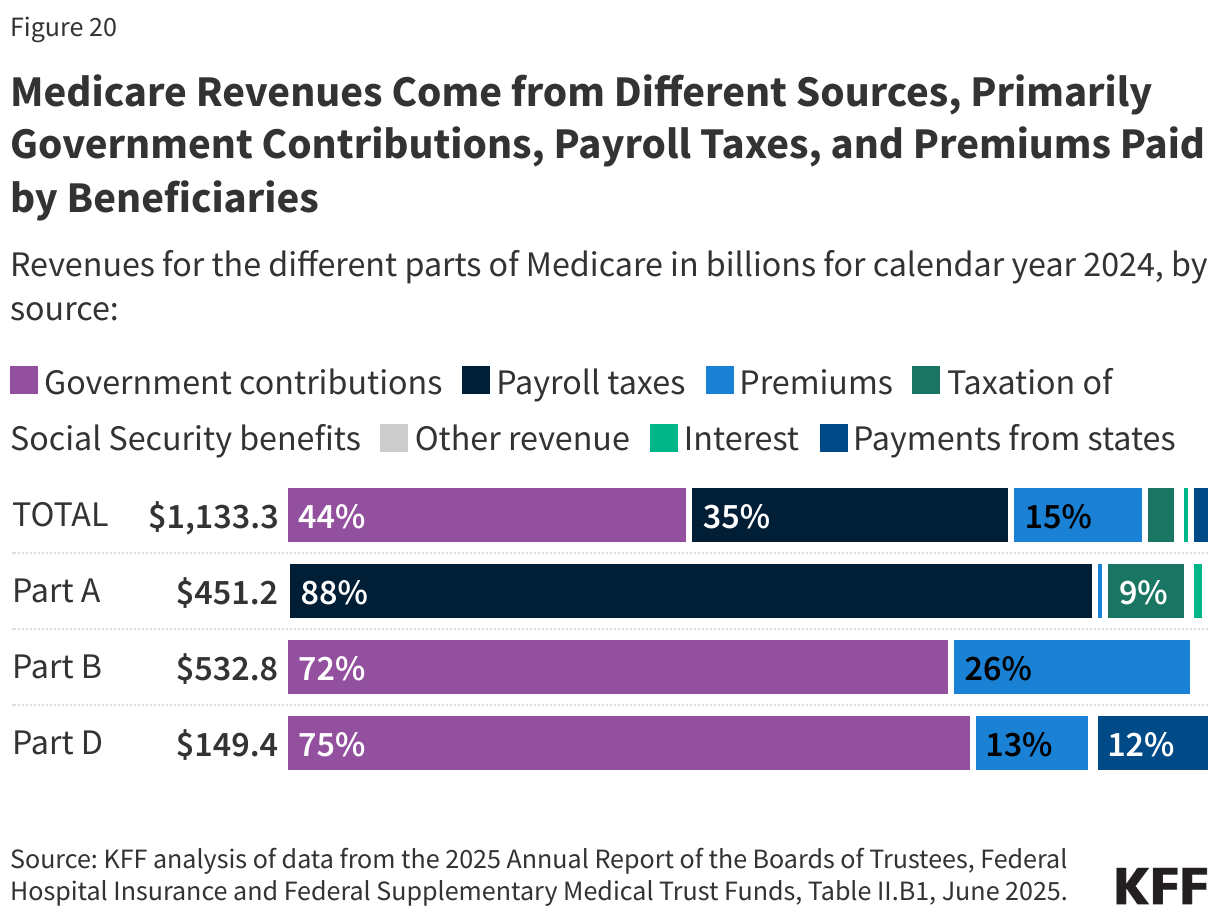
Medicare spending comprised 13.5% of the federal budget in 2024 and 21.2% of national health care spending in 2023. Funding for Medicare comes primarily from government contributions, payroll tax revenues, and premiums paid by beneficiaries. Over the longer term, the Medicare program faces financial pressures associated with higher health care costs, growing enrollment, and an aging population.

Who Is Covered by Medicare?

Copy link to Who Is Covered by Medicare?

Most people become eligible for Medicare when they reach age 65, regardless of income, health status, or medical conditions. Residents of the U.S., including citizens and permanent residents, are eligible for premium-free Medicare Part A if they have worked at least 40 quarters (10 years) in jobs where they or their spouses paid Medicare payroll taxes and are at least 65 years old. People under age 65 who receive Social Security Disability Insurance (SSDI) payments generally become eligible for Medicare after a two-year waiting period. People diagnosed with end-stage renal disease (ESRD) and amyotrophic lateral sclerosis (ALS) become eligible for Medicare with no waiting period.

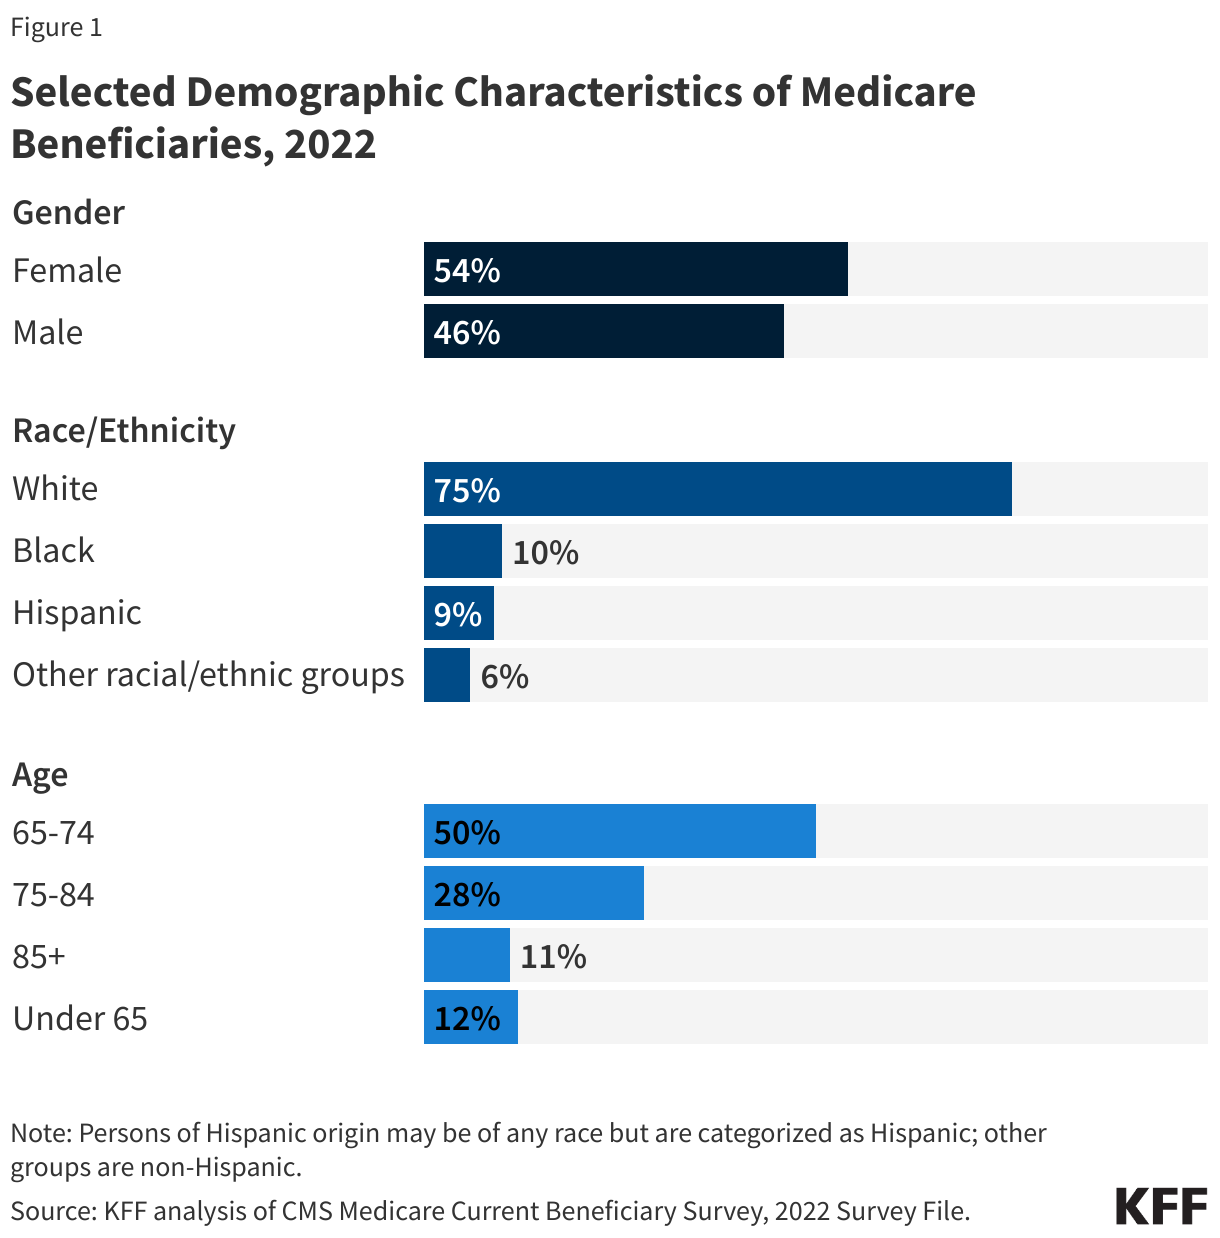
Medicare covers a diverse population in terms of demographics and health status, and this population is expected to grow larger and more diverse in the future as the U.S. population ages. Currently, most people with Medicare are White, female, and between the ages of 65 and 84 (Figure 1). The share of U.S. adults who are age 65 or older is projected to grow from 17% in 2022 to nearly a quarter of the nation’s total population (24%) in 2060. Among people ages 65 and older, the share of people ages 80 and older will increase from 23% in 2022 to 34% in 2060. As the U.S. population ages, the number of Medicare beneficiaries is projected to grow by more than one-third from 68 million people in 2024 to more than 93 million people in 2060. The Medicare population will also grow more racially and ethnically diverse. By 2060, people of color will comprise 44% of the U.S. population ages 65 and older, up from a quarter in 2022.

Selected Demographic Characteristics of Medicare Beneficiaries, 2022

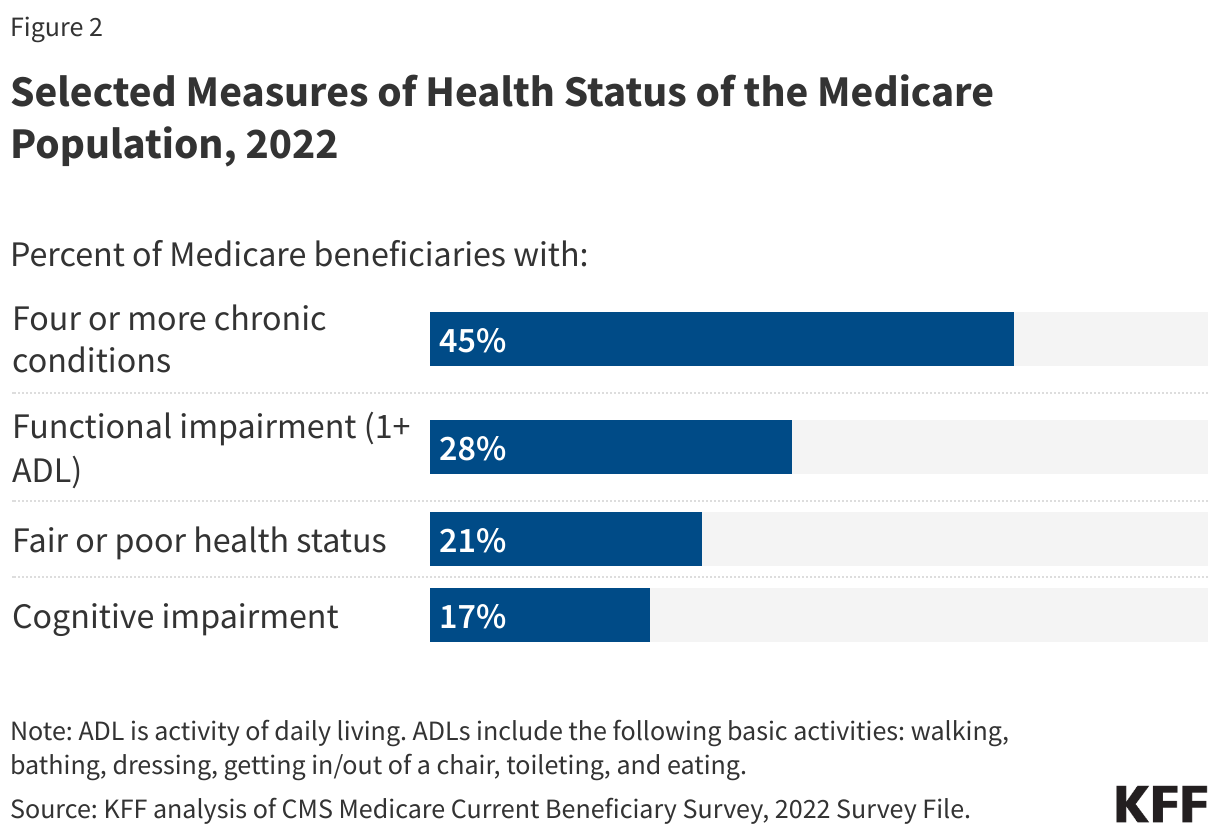
While many Medicare beneficiaries enjoy good health, others live with health problems that affect their quality of life, including multiple chronic conditions, limitations in their activities of daily living, and cognitive impairments. In 2022, nearly half (45%) of Medicare beneficiaries had four or more chronic conditions, more than a quarter (28%) had a functional impairment, and 17% had a cognitive impairment (Figure 2).

Selected Measures of Health Status of the Medicare Population, 2022

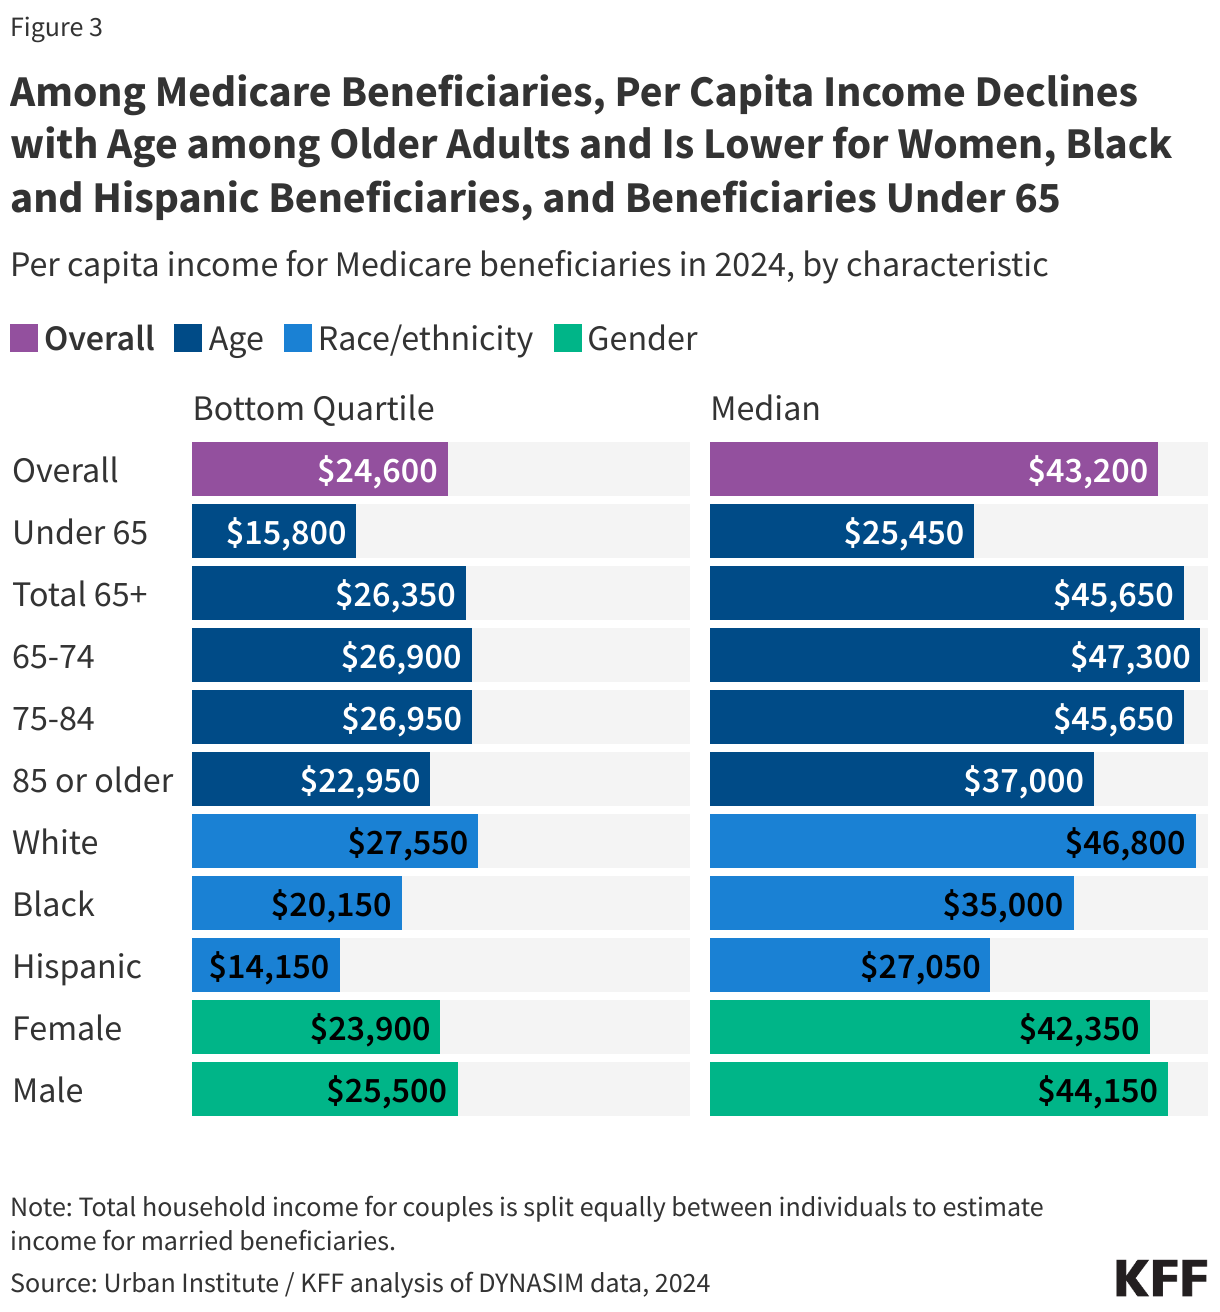
Most Medicare beneficiaries have limited financial resources, including income and assets. In 2024, one in four Medicare beneficiaries - 16.5 million people with Medicare - lived on incomes below $24,600 per person, and half (32.9 million) of all Medicare beneficiaries lived on incomes below $43,200 per person; one in four Medicare beneficiaries had savings below $18,950 per person in 2024, while half had savings below $110,100 per person. Income among Medicare beneficiaries is generally lower for women than men, for people of color than White beneficiaries, and for beneficiaries under age 65 with disabilities than older beneficiaries (Figure 3).

Among Medicare Beneficiaries, Per Capita Income Declines with Age among Older Adults and Is Lower for Women, Black and Hispanic Beneficiaries, and Beneficiaries Under 65 (Split Bars)

What Does Medicare Cover and How Much Do People Pay for Medicare Benefits?

Copy link to What Does Medicare Cover and How Much Do People Pay for Medicare Benefits?

Benefits. Medicare covers a comprehensive set of medical care services, including hospital stays, physician visits, and prescription drugs. Medicare benefits are divided into four parts: 

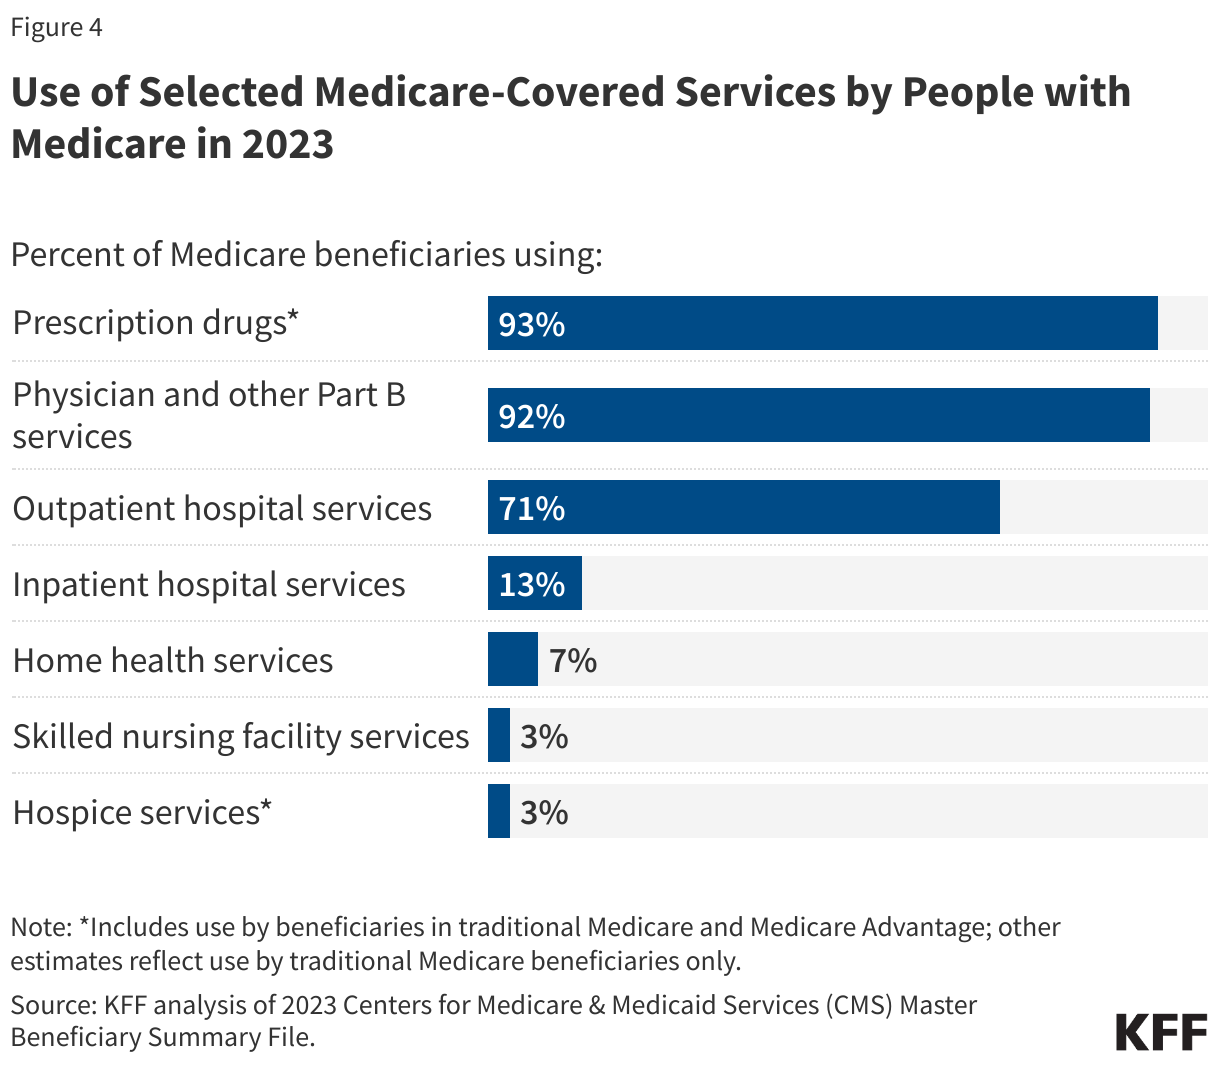
  • Part A, also known as the Hospital Insurance (HI) program, covers inpatient care provided in hospitals and short-term stays in skilled nursing facilities, hospice care, post-acute home health care, and pints of blood received at a hospital or skilled nursing facility. An estimated 67.5 million people were enrolled in Part A in 2024. In 2023, 13% of beneficiaries in traditional Medicare had an inpatient hospital stay, while 7% used home health care services (which are also covered under Part B), and 3% had a skilled nursing facility stay (Figure 4). (Comparable utilization data for beneficiaries in Medicare Advantage is not available.)
  • Part B,the Supplementary Medical Insurance (SMI) program, covers outpatient services such as physician visits, outpatient hospital care, and preventive services (e.g., mammography and colorectal cancer screening), among other medical benefits. An estimated 62 million people were enrolled in Part B in 2024. A larger share of beneficiaries use Part B services compared to Part A services. For example, in 2023, more than 9 in 10 (92%) traditional Medicare beneficiaries used physician and other services covered under Part B and 59% used outpatient hospital services.
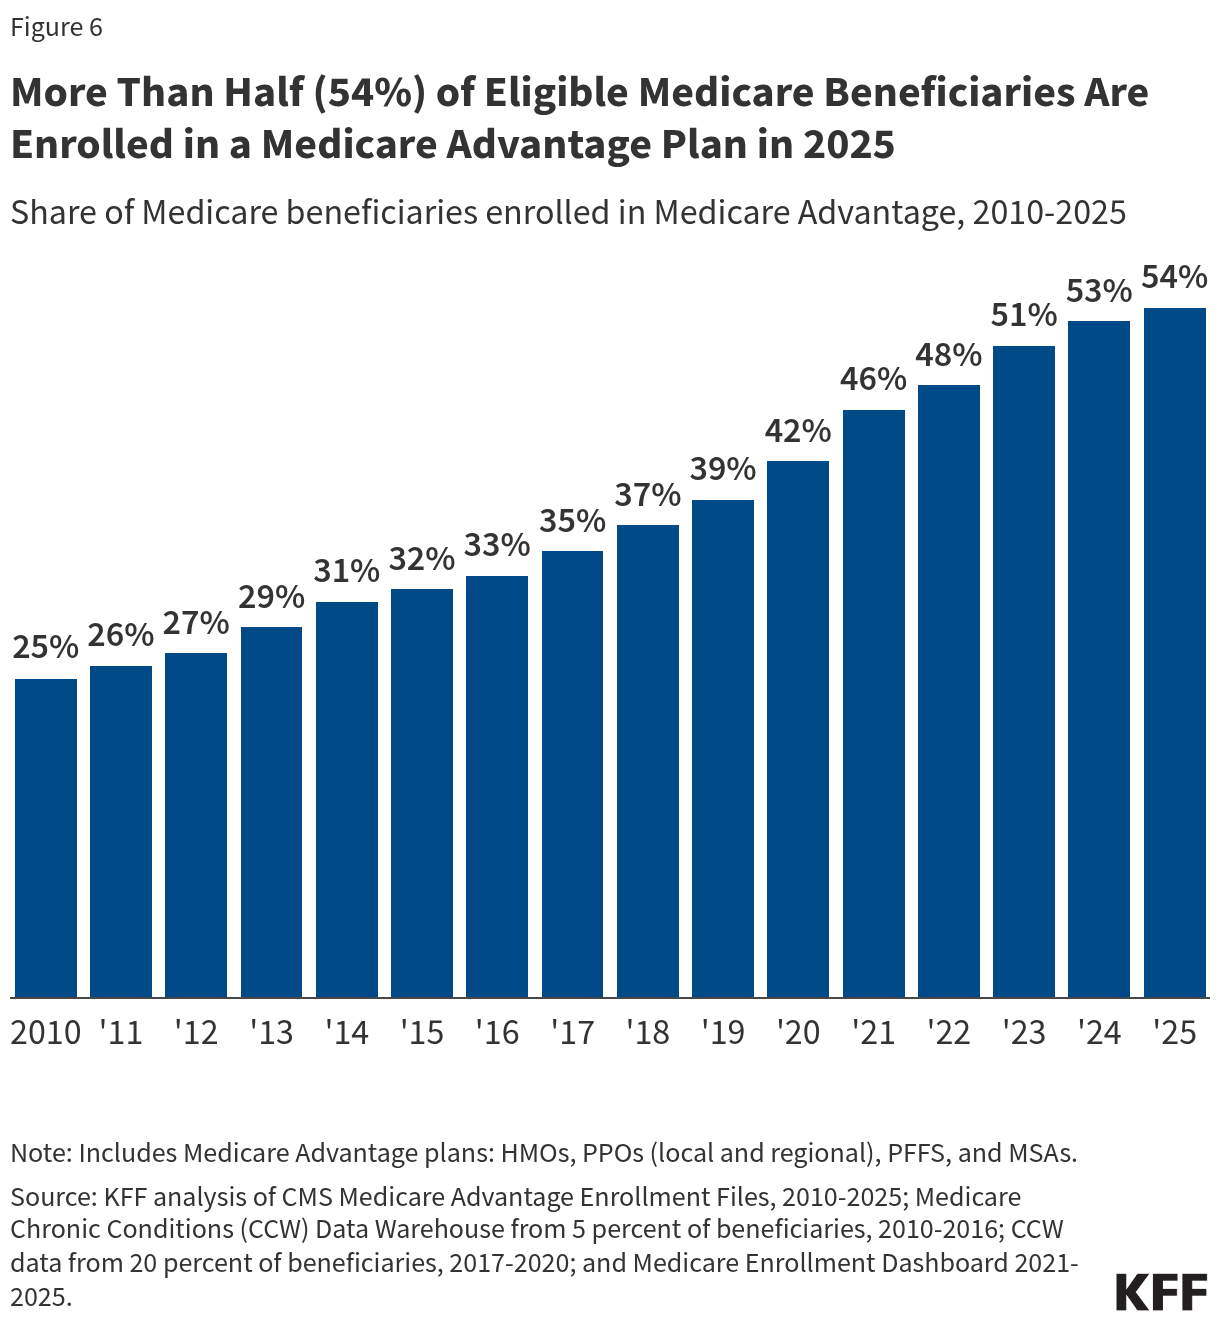
  • Part C, more commonly referred to as the Medicare Advantage program, allows beneficiaries to enroll in a private plan, such as a health maintenance organization (HMO) or preferred provider organization (PPO), as an alternative to traditional Medicare. Medicare Advantage plans cover all benefits under Medicare Part A, Part B, and, in most cases, Part D (Medicare’s outpatient prescription drug benefit), and typically offer extra benefits, such as dental services, eyeglasses, and hearing exams. In 2025, 34.1 million beneficiaries are enrolled in Medicare Advantage, which is 54% of Medicare beneficiaries who are eligible to enroll in Medicare Advantage plans. (See “What Is Medicare Advantage and How Is It Different From Traditional Medicare?” for additional information.) 
  • Part D is a voluntary outpatient prescription drug benefit delivered through private plans that contract with Medicare, either stand-alone prescription drug plans (PDPs) or Medicare Advantage prescription drug (MA-PD) plans. In 2025, 54.8 million beneficiaries are enrolled in Part D, with 58% enrolled in MA-PDs and 42% enrolled in PDPs. In 2023, over 9 in 10 Medicare beneficiaries enrolled in Part D (93%) used prescription drugs. (See “What Is the Medicare Part D Prescription Drug Benefit?” for additional information.)
Use of Selected Medicare-Covered Services by People with Medicare in 2023

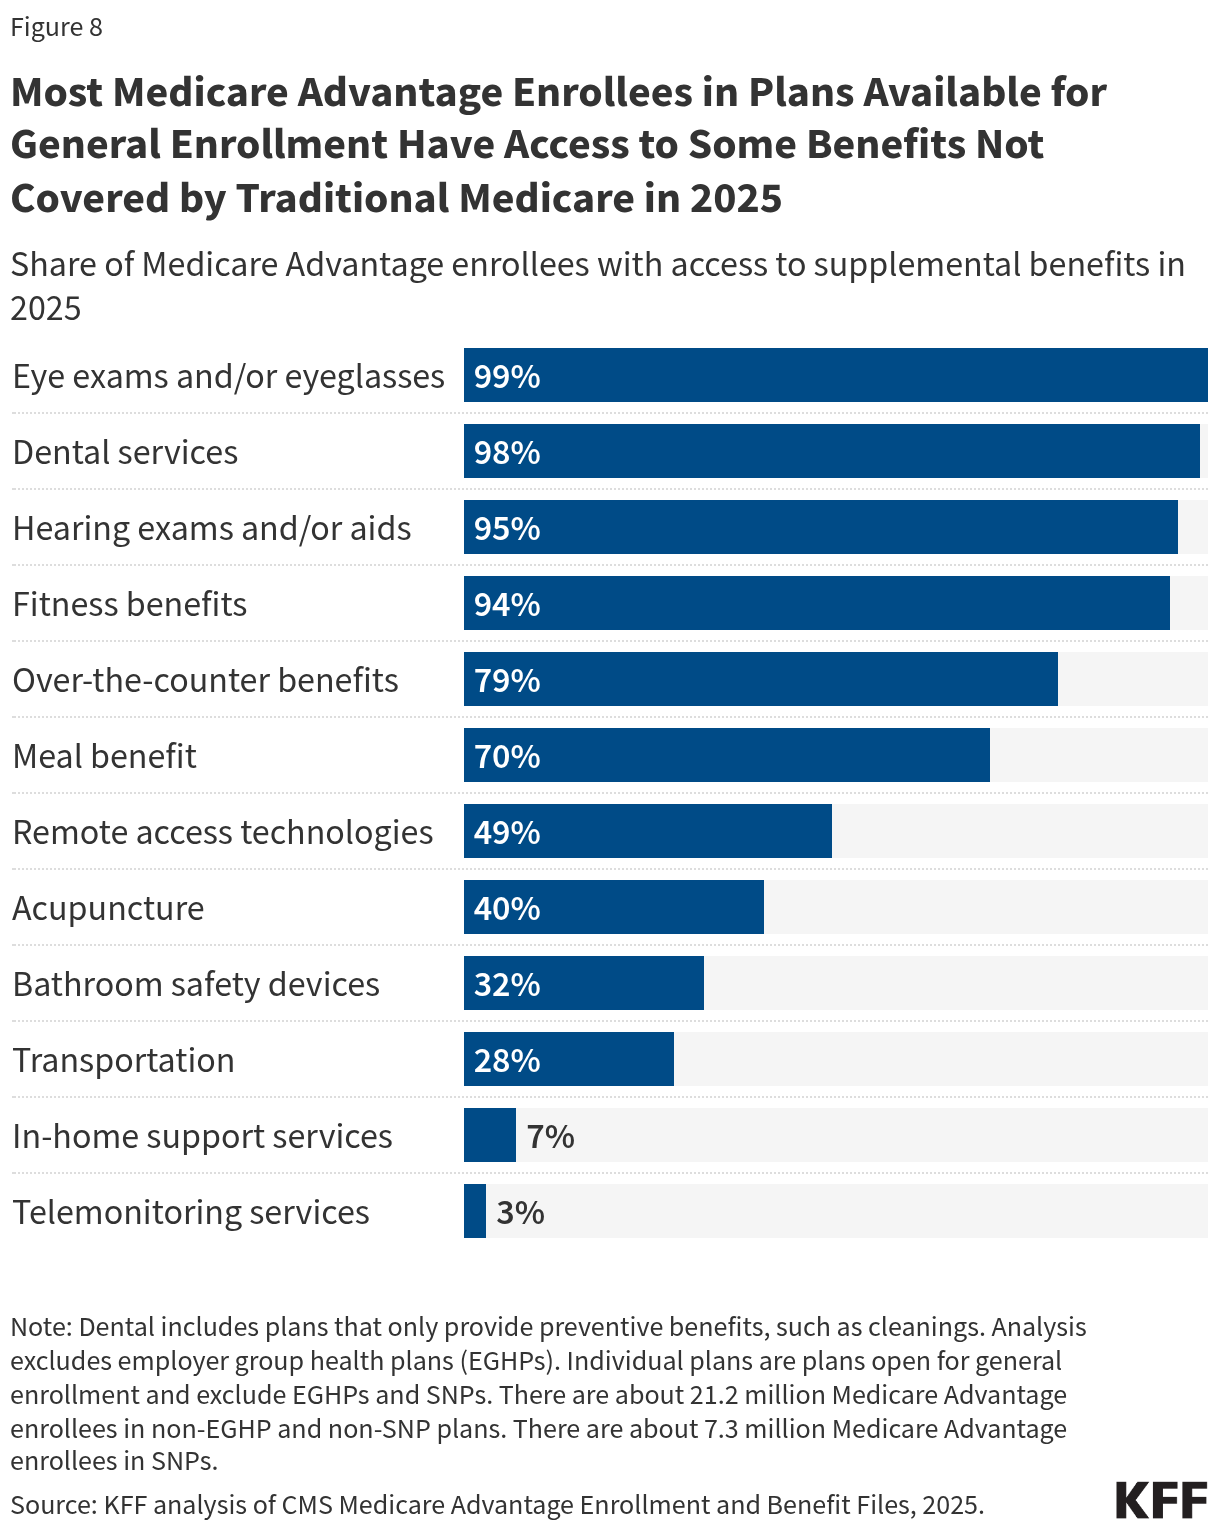
Although Medicare covers a comprehensive set of medical benefits, Medicare does not cover long-term care services. Additionally, coverage of vision services, dental care, and hearing aids is not part of the standard benefit, though most Medicare Advantage plans offer some coverage of these services.

Premiums and cost sharing. Medicare has varying premiums, deductibles, and coinsurance amounts that typically change each year to reflect program cost changes.

  • Part A: Most beneficiaries do not pay a monthly premium for Part A services, but are required to pay a deductible for inpatient hospitalizations ($1,676 in 2025). (People who are working contribute payroll taxes to Medicare and qualify for premium-free Part A at age 65 based on having paid 1.45% of their earnings over at least 40 quarters.) Beneficiaries are generally subject to cost sharing for Part A benefits, including extended inpatient stays in a hospital ($419 per day for days 61-90 and $838 per day for days 91-150 in 2025) or skilled nursing facility ($209.50 per day for days 21-100 in 2025). There is no cost sharing for home health visits.
  • Part B: Beneficiaries enrolled in Part B, including those in traditional Medicare and Medicare Advantage plans, are generally required to pay a monthly premium ($185 in 2025). Beneficiaries with annual incomes greater than $106,000 for a single person or $212,000 for a married couple in 2025 pay a higher, income-related monthly Part B premium, ranging from $259 to $628.90. Approximately 8% of Medicare beneficiaries with Part B coverage are expected to pay income-related Part B premiums in 2025. Part B benefits are subject to an annual deductible ($257 in 2025), and most Part B services are subject to coinsurance of 20 percent.
  • Part C: In addition to paying the Part B premium, Medicare Advantage enrollees may be charged a separate monthly premium for their Medicare Advantage plan, although three-quarters (76%) of enrollees are in plans that charge no additional premium in 2025. Medicare Advantage plans are generally prohibited from charging more than traditional Medicare, but vary in the deductibles and cost-sharing amounts they charge. Medicare Advantage plans typically establish provider networks and may require higher cost sharing for services received from non-network providers.
  • Part D: Part D plans vary in terms of premiums, deductibles, and cost sharing. People in traditional Medicare who are enrolled in a separate stand-alone Part D plan generally pay a monthly Part D premium unless they qualify for full benefits through the Part D Low-Income Subsidy (LIS) program and are enrolled in a premium-free (benchmark) plan. In 2025, the average enrollment-weighted premium for stand-alone Part D plans is $39 per month, substantially higher than the enrollment-weighted average monthly portion of the premium for drug coverage in MA-PDs ($7 in 2025).

Sources of coverage. Most people with Medicare have some type of coverage that may protect them from unlimited out-of-pocket costs and may offer additional benefits, whether it’s coverage in addition to traditional Medicare or coverage from Medicare Advantage plans, which are required to have an out-of-pocket cap and typically offer supplemental benefits (Figure 5). However, based on KFF analysis of data from the 2022 Medicare Current Beneficiary Survey, 3.2 million people with Medicare have no additional coverage, which places them at risk of facing high out-of-pocket spending or going without needed medical care due to costs. 

  • Medicare Advantage plans now cover more than half (54%) of all Medicare beneficiaries enrolled in both Part A and Part B, or 34 million people (in 2022, Medicare Advantage enrollment was just under half of beneficiaries, or 29.9 million people). (See “What Is Medicare Advantage and How Is It Different From Traditional Medicare?” for additional information.)
  • Employer and union-sponsored plans provided some form of coverage to 14.5 million Medicare beneficiaries – nearly a quarter (24%) of Medicare beneficiaries overall in 2022. Of the total number of beneficiaries with employer coverage, 9.1 million beneficiaries had this coverage in addition to traditional Medicare (31% of beneficiaries in traditional Medicare), while 5.4 million beneficiaries were enrolled in Medicare Advantage employer group plans. (These estimates exclude 5.6 million Medicare beneficiaries with Part A only in 2022, primarily because they or their spouse were active workers and had primary coverage from an employer plan and Medicare as a secondary payer.) 
  • Medicare supplement insurance, also known as Medigap, covered 2 in 10 (21%) Medicare beneficiaries overall, or 42% of those in traditional Medicare (12.5 million beneficiaries) in 2022. Medigap policies, sold by private insurance companies, fully or partially cover Medicare Part A and Part B cost-sharing requirements, including deductibles, copayments, and coinsurance. 
  • Medicaid, the federal-state program that provides health and long-term services and supports coverage to low-income people, was a source of coverage for 11.6 million Medicare beneficiaries with low incomes and modest assets in 2022 (19% of all Medicare beneficiaries), including 7.0 million enrolled in Medicare Advantage and 4.6 million in traditional Medicare. (This estimate is somewhat lower than KFF estimates published elsewhere due to different data sources and methods used.) For these beneficiaries, referred to as dual-eligible individuals, Medicaid typically pays the Medicare Part B premium and may also pay a portion of Medicare deductibles and other cost-sharing requirements. Most dual-eligible individuals are eligible for full Medicaid benefits, including long-term services and supports.
Nearly all People with Medicare Had Coverage Either Through Medicare Advantage Plans or Traditional Medicare Coupled with Some Other Type of Coverage in 2022

What Is Medicare Advantage and How Is It Different From Traditional Medicare?

Copy link to What Is Medicare Advantage and How Is It Different From Traditional Medicare?

Medicare Advantage, also known as Medicare Part C, allows beneficiaries to receive their Medicare benefits from a private health plan, such as a health maintenance organization (HMO) or preferred provider organization (PPO). Medicare pays private insurers to provide Medicare-covered benefits (Part A and B, and often Part D) to enrollees. Virtually all Medicare Advantage plans include an out-of-pocket limit for benefits covered under Parts A and B, and most offer additional benefits not covered by traditional Medicare, such as vision, hearing, and dental. The average Medicare beneficiary can choose from 34 Medicare Advantage plans with prescription drug coverage offered by eight insurance companies in 2025. These plans vary across many dimensions, including premiums, cost-sharing requirements, out-of-pocket limits, extra benefits, provider networks, prior authorization and referral requirements, denial rates, and prescription drug coverage.

More than half of all eligible Medicare beneficiaries (54%) are currently enrolled in a Medicare Advantage plan, up from 25% in 2010 (Figure 6). The share of eligible Medicare beneficiaries in Medicare Advantage plans varies across states, ranging from 2% in Alaska to 63% in Alabama and Michigan.  Growth in Medicare Advantage enrollment is due to a number of factors. Medicare beneficiaries are attracted to Medicare Advantage due to the multitude of extra benefits, the simplicity of one-stop shopping (in contrast to traditional Medicare where beneficiaries might also purchase a Part D plan and a Medigap plan), and the availability of plans with no premiums beyond the Part B premium, driven in part by the current payment system that generates high gross margins in this market (see “How Does Medicare Pay Private Plans in Medicare  Advantage and Medicare Part D?” for additional information). Insurers market these plans aggressively, airing thousands of TV ads for Medicare Advantage during the Medicare open enrollment period. In some cases, Medicare beneficiaries have no choice but to be enrolled in a Medicare Advantage plan for their retiree health benefits as some employers are shifting their retirees into these plans; if they are dissatisfied with this option, they may have to give up retiree benefits altogether, although they would retain Medicare and have the option to choose traditional Medicare (potentially with a Medigap supplement).

More Than Half (54%) of Eligible Medicare Beneficiaries Are Enrolled in a Medicare Advantage Plan in 2025

There are several differences between Medicare Advantage and traditional Medicare. Medicare Advantage plans can establish provider networks, the size of which can vary considerably for both physicians and hospitals, depending on the plan and the county where it is offered. These provider networks may also change over the course of the year. Medicare Advantage enrollees who seek care from an out-of-network provider might be required to pay higher cost sharing or pay in full out of pocket for their care. In contrast, traditional Medicare beneficiaries can see any provider that accepts Medicare and is accepting new patients. In 2019, 89% of non-pediatric office-based physicians accepted new Medicare patients, with little change over time. Only 1% of all non-pediatric physicians formally opted out of the Medicare program in 2024.

Medicare Advantage plans also often use tools to manage utilization and costs, such as requiring enrollees to receive prior authorization before a service will be covered and requiring enrollees to obtain a referral for specialists or mental health providers. In 2024, virtually all Medicare Advantage enrollees were in plans that required prior authorization for some services, most often higher-cost services. Medicare Advantage insurers made nearly 50 million prior authorization determinations in 2023 (Figure 7). Prior authorization and referrals to specialists are used less frequently in traditional Medicare, with prior authorization generally applying to a limited set of services.

Medicare Advantage Insurers Made Nearly 50 Million Prior Authorization Determinations in 2023

Medicare Advantage plans are required to use payments from the federal government that exceed their costs of covering Part A and B services (known as rebates) to provide supplemental benefits to enrollees, such as lower cost sharing, extra benefits not covered by traditional Medicare, or reducing the amount of Part B and/or Part D premiums. Examples of extra benefits include eyeglasses, hearing exams, preventive dental care, and gym memberships (Figure 8). (See “How Does Medicare Pay Private Plans in Medicare Advantage and Medicare Part D?” for a discussion of how Medicare pays Medicare Advantage plans.) Medicare Advantage plans must also include a cap on out-of-pocket spending, which provides protection from catastrophic medical expenses. Traditional Medicare does not have an out-of-pocket limit, though purchasing a Medigap policy effectively provides protection from catastrophic costs for beneficiaries in traditional Medicare. (See “What Does Medicare Cover and How Much Do People Pay for Medicare Benefits?” for a brief discussion of Medigap.)

Most Medicare Advantage Enrollees in Plans Available for General Enrollment Have Access to Some Benefits Not Covered by Traditional Medicare in 2025

What Is the Medicare Part D Prescription Drug Benefit?

Copy link to What Is the Medicare Part D Prescription Drug Benefit?

Medicare Part D, Medicare’s voluntary outpatient prescription drug benefit, was established by the Medicare Modernization Act of 2003 (MMA) and launched in 2006. Before the addition of the Part D benefit, Medicare did not cover the cost of outpatient prescription drugs. Under Part D, Medicare helps cover prescription drug costs through private plans that contract with Medicare to offer the Part D benefit to enrollees, which is unlike coverage of Part A and Part B benefits under traditional Medicare, and beneficiaries must enroll in a Part D plan if they want this benefit.

A total of 54.8 million people with Medicare are currently enrolled in plans that provide the Medicare Part D drug benefit, including plans open to everyone with Medicare (stand-alone prescription drug plans, or PDPs, and Medicare Advantage drug plans, or MA-PDs) and plans for specific populations (including retirees of a former employer or union and Medicare Advantage Special Needs Plans, or SNPs). Nearly 6 in 10 Part D enrollees are in MA-PDs, as overall enrollment in Medicare Advantage plans has grown in recent years. Just over 13 million low-income beneficiaries receive extra help with their Part D plan premiums and cost sharing through the Part D Low-Income Subsidy Program (LIS).

For 2025, the average Medicare beneficiary has a choice of 14 stand-alone Part D plans and 34 Medicare Advantage drug plans. These plans vary in terms of premiums, deductibles and cost sharing, the drugs that are covered, any utilization management restrictions that apply, and pharmacy networks. People in traditional Medicare who are enrolled in a separate stand-alone Part D plan generally pay a monthly Part D premium unless they qualify for full benefits through the Part D LIS program and are enrolled in a premium-free (benchmark) plan. In 2025, the average enrollment-weighted premium for stand-alone Part D plans is $39 per month. In 2025, most stand-alone Part D plans include a deductible, averaging $491. Plans generally impose a tiered structure to define cost-sharing requirements and cost-sharing amounts charged for covered drugs, typically charging lower cost-sharing amounts for generic drugs and preferred brands and higher amounts for non-preferred and specialty drugs, and a mix of flat dollar copayments and coinsurance (based on a percentage of a drug’s list price) for covered drugs.

The standard design of the Medicare Part D benefit currently has three distinct phases, where the share of drug costs paid by Part D enrollees, Part D plans, drug manufacturers, and Medicare varies. Based on changes in the Inflation Reduction Act, these shares changed in 2024 and 2025 (Figure 9). Most notably, the Part D benefit now includes a $2,000 out-of-pocket spending cap, meaning Part D enrollees face no additional costs once their out-of-pocket costs exceed $2,000 in 2025. Previously, enrollees with high drug costs who did not receive low-income subsidies were responsible for paying 5% of their total drug costs when they reached the catastrophic coverage phase. This new out-of-pocket spending cap is projected to help an estimated 11 million Part D enrollees in 2025, including 6.1 million enrollees not receiving low-income subsidies.

The Share of Medicare Part D Drug Costs Paid by Enrollees, Plans, Drug Manufacturers, and Medicare Changed in 2024 and 2025

The Inflation Reduction Act of 2022, signed into law by President Biden on August 16, 2022, includes several provisions to lower prescription drug costs for people with Medicare and reduce drug spending by the federal government, including several changes related to the Part D benefit. These provisions include (but are not limited to) (Figure 10):

  • Requiring the Secretary of the Department of Health and Human Services to negotiate the price of some Part D and Part B drugs covered under Medicare. The law that established the Part D benefit included a provision known as the “noninterference” clause, which prevented the HHS Secretary from being involved in price negotiations between drug manufacturers and pharmacies and Part D plan sponsors. In addition, the Secretary of HHS does not currently negotiate prices for drugs covered under Medicare Part B (administered by physicians). To date, Medicare has completed one round of price negotiation on 10 Part D drugs, with negotiated prices available in 2026, and selected 15 more Part D drugs for price negotiation in the second round, with negotiated prices available in 2027.
  • Adding a hard cap on out-of-pocket drug spending under Part D, which phased in beginning in 2024, and was limited to $2,000 in 2025 (increasing to $2,100 in 2026). As noted above, under the original design of the Part D benefit, enrollees had catastrophic coverage for high out-of-pocket drug costs, but there was no limit on the total amount that beneficiaries paid out of pocket each year.  
  • Limiting the out-of-pocket cost of insulin products to no more than $35 per month in all Part D plans and in Part B and making adult vaccines covered under Part D available for free as of 2023. Until these provisions took effect, beneficiary costs for insulin and adult vaccines were subject to varying cost-sharing amounts.
  • Expanding eligibility for full benefits under the Part D Low-Income Subsidy program in 2024, eliminating the partial LIS benefit for individuals with incomes between 135% and 150% of poverty. Beneficiaries who receive full LIS benefits pay no Part D premium or deductible and only modest copayments for prescription drugs until they reach the catastrophic threshold, at which point they face no additional cost sharing.
  • Requiring drug manufacturers to pay a rebate to the federal government if prices for drugs covered under Part D and Part B increase faster than the inflation rate, with the initial period for measuring Part D drug price increases running from October 2022-September 2023. Previously, Medicare had no authority to limit annual price increases for drugs covered under Part B or Part D. Year-to-year drug price increases exceeding inflation are not uncommon and affect people with both Medicare and private insurance.
Implementation Timeline of the Prescription Drug Provisions in the Inflation Reduction Act

How Does Medicare Pay Hospitals, Physicians, and Other Providers in Traditional Medicare?

Copy link to How Does Medicare Pay Hospitals, Physicians, and Other Providers in Traditional Medicare?

In 2024, Medicare was estimated to spend $464 billion on benefits covered under Part A and Part B for beneficiaries in traditional Medicare. Medicare pays providers in traditional Medicare using various payment systems depending on the setting of care (Figure 11).

Spending on Part A and Part B Benefits in Traditional Medicare is Estimated to be $464 Billion in 2024

Medicare relies on a number of different approaches when determining payments to providers for Part A and Part B services delivered to beneficiaries in traditional Medicare. These providers include hospitals (for both inpatient and outpatient services), physicians, skilled nursing facilities, home health agencies, and several other types of providers. Of the $464 billion in estimated spending on Medicare benefits covered under Part A and Part B in traditional Medicare in 2024, $149 billion (32%) was for hospital inpatient services and $68 billion (15%) was for hospital outpatient services, $71 billion (15%) was for services covered under the physician fee schedule, and $176 billion (38%) was for all other Part A or Part B services for beneficiaries in traditional Medicare.

Medicare uses prospective payment systems for most providers in traditional Medicare. These systems generally require that Medicare pre-determine a base payment rate for a given unit of service (e.g., a hospital stay, an episode of care, a particular service). Then, based on certain variables, such as the provider’s geographic location and the complexity of the patient receiving the service, Medicare adjusts its payment for each unit of service provided. Medicare updates payment rates annually for most payment systems to account for inflation adjustments. 

The main features of hospital, physician, outpatient, and skilled nursing facility payment systems (altogether accounting for 69% of spending on Part A and Part B benefits in traditional Medicare) are described below:

  • Inpatient hospitals (acute care): Medicare pays hospitals per beneficiary discharge using the Inpatient Prospective Payment System. The rate for each discharge corresponds to one of over 770 different categories of diagnoses – called Medicare Severity Diagnosis Related Groups (MS-DRGs), which reflect the principal diagnosis, secondary diagnoses, procedures performed, and other patient characteristics. DRGs that are likely to incur more intense levels of care and/or longer lengths of stay are assigned higher payments. Medicare’s payments to hospitals also account for a portion of hospitals’ capital and operating expenses.
  • Medicare also makes additional payments to hospitals in particular situations. These include additional payments for rural or isolated hospitals that meet certain criteria. Further, Medicare makes additional payments to help offset costs incurred by hospitals that are not otherwise accounted for in the inpatient prospective payment system. These include add-on payments for treating a disproportionate share (DSH) of low-income patients, as well as for covering costs associated with care provided by medical residents, known as indirect medical education (IME). While not part of the Inpatient Prospective Payment System, Medicare also pays hospitals directly for the costs of operating residency programs, known as Graduate Medical Education (GME) payments.
  • Physicians and other health professionals: Medicare reimburses physicians and other health professionals (e.g., nurse practitioners) based on the Physician Fee Schedule for over 10,000 services. Payment rates for these services are based on three components: (1) clinician work, (2) practice expenses, and (3) professional liability insurance (also known as medical malpractice insurance), which are measured in terms of “relative value units” (RVUs). Each component is adjusted to account for differences across geography and then multiplied by a conversion factor. Payment rates for individual services may be updated each year based in part on the recommendations of the AMA/Specialty Society RVS Update Committee (RUC), a volunteer committee of physicians and other professionals overseen by the American Medical Association (AMA). CMS also makes annual updates to the conversion factor based on statutory factors, as well as adjustments to preserve budget neutrality, which may result in payment cuts for physicians and other clinicians whenever the projected cost of all Physician Fee Schedule spending is expected to increase by more than $20 million for the year.
  • Payment rates specified under the Physician Fee Schedule are subject to further adjustments under the Quality Payment Program, established by the Medicare Access and CHIP Reauthorization Act of 2015 (MACRA). Clinicians can receive payment increases if they participate in qualified advanced alternative payment models (A-APMs), which bear some financial risk for the costs of patient care, while those who participate in the Merit-based Incentive Payment System (MIPS) may receive payment increases or decreases (or no change) depending on their performance on specific quality measures. (See “What Is Medicare Doing to Promote Alternative Payment Models?” for more information about alternative payment models in Medicare.)
  • While not part of the Physician Fee Schedule, Medicare also pays for a limited number of drugs that physicians and other health care providers administer. For drugs administered by physicians, which are covered under Part B, Medicare reimburses providers based on a formula set at 106% of the Average Sales Price (ASP), which is the average price to all non-federal purchasers in the U.S, inclusive of rebates (other than rebates paid under the Medicaid program).
  • Hospital outpatient departments: Medicare pays hospitals for ambulatory services provided in outpatient departments, using the Hospital Outpatient Prospective Payment System, based on the classification of individual services into Ambulatory Payment Classifications (APC) with similar characteristics and expected costs. Final determination of Medicare payments for outpatient department services is complex. It incorporates both individual service payments and payments “packaged” with other services, partial hospitalization payments, as well as numerous exceptions, such as payments for new technologies. Medicare payment rates for services provided in hospital outpatient departments are typically higher than for similar services provided in physicians’ offices, and evidence indicates that providers have shifted the billing of services to higher-cost settings. There is bipartisan interest in proposals to expand so-called “site-neutral” payments, meaning that Medicare would align payment rates for the same service across settings.
  • Skilled Nursing Facilities (SNFs): SNFs are freestanding or hospital-based facilities that provide post-acute inpatient nursing or rehabilitation services. Medicare pays SNFs based on the Skilled Nursing Facility Prospective Payment System, and payments to SNFs are determined using a base payment rate, adjusted for geographic differences in labor costs, case mix, and, in some cases, length of stay. Daily rates consider six care components – nursing, physical therapy, occupational therapy, speech–language pathology services, nontherapy ancillary services and supplies, and non–case mix (room and board services).

How Does Medicare Pay Private Plans in Medicare Advantage and Medicare Part D?

Copy link to How Does Medicare Pay Private Plans in Medicare Advantage and Medicare Part D?

Medicare Advantage. Medicare pays firms offering Medicare Advantage plans a set monthly amount per enrollee. The payment is determined through an annual process in which plans submit “bids” for how much they estimate it will cost to provide benefits covered under Medicare Parts A and B for an average beneficiary. The bid is compared to a county “benchmark”, which is the maximum amount the federal government will pay for a Medicare Advantage enrollee and is a percentage of estimated spending in traditional Medicare in the same county, ranging from 95 percent in high-cost counties to 115 percent in low-cost counties. When the bid is below the benchmark in a given county, plans receive a portion of the difference (the “rebate”), which they must use to lower cost sharing, pay for extra benefits, or reduce enrollees’ Part B or Part D premiums. Payments to plans are risk adjusted, based on the health status and other characteristics of enrollees, including age, sex, and Medicaid enrollment. In addition, Medicare adopted a quality bonus program that increases the benchmark for plans that receive at least four out of five stars under the quality rating system, which increases plan payments.

Generally, Medicare pays more to private Medicare Advantage plans for enrollees than their costs would be in traditional Medicare. The Medicare Payment Advisory Commission (MedPAC) reports that while it costs Medicare Advantage plans 83% of what it costs traditional Medicare to pay for Medicare-covered services, plans receive payments from CMS that are 120% of spending for similar beneficiaries in traditional Medicare, on average. The higher spending stems from features of the formula used to determine payments to Medicare Advantage plans, including setting benchmarks above traditional Medicare spending in half of counties and higher benchmarks due to the quality bonus program, resulting in bonus payments of at least $12.7 billion in 2025. This amount is four times greater than spending on bonus payments in 2015 (Figure 12).

Total Spending on Medicare Advantage Plan Bonuses Quadrupled Between 2015 and 2025 From At Least $3 Billion to $12.7 Billion

The higher spending in Medicare Advantage is also related to the impact of coding intensity, where Medicare Advantage enrollees look sicker than they would if they were in traditional Medicare, resulting in plans receiving higher risk adjustments to their monthly per person payments, translating to an estimated $84 billion in excess payments to plans in 2025.

Higher payments to Medicare Advantage plans allow them to offer extra benefits attractive to enrollees. However, these benefits come at a cost to all beneficiaries through higher Part B premiums – amounting to $13 billion in 2025 alone – and contribute to the strain on the Medicare Part A Hospital Insurance Trust Fund. (See “How Much Does Medicare Spend and How Is the Program Financed?” for additional information .)

Medicare Part D. Medicare pays Part D plans, both stand-alone prescription drug plans and Medicare Advantage plans that offer drug coverage, based on an annual competitive bidding process. Plans submit bids yearly to Medicare for their expected costs of providing the drug benefit plus administrative expenses. Plans receive a direct subsidy per enrollee, which is risk-adjusted based on the health status of their enrollees, plus reinsurance payments from Medicare for the highest-cost enrollees and adjustments for the low-income subsidy (LIS) status of their enrollees. (Unlike Medicare Advantage, there is no quality bonus program that provides higher payments to Part D plans with higher Part D quality ratings.) Risk-sharing arrangements with the federal government (“risk corridors”) limit plans' potential total losses or gains.

Under reinsurance, Medicare subsidizes 20% of total drug spending incurred by Part D enrollees with relatively high drug spending above the catastrophic coverage threshold, as of 2025, down from 80% in prior years, based on a provision of the Inflation Reduction Act. This provision was designed to shift more of the responsibility for catastrophic drug costs to Part D plans and drug manufacturers. Plans now pay 60% of total drug costs above the catastrophic threshold, up from 15% to 20% in prior years. (See “What Is the Medicare Part D Prescription Drug Benefit?” for more detail on plan liability under various phases of the Part D benefit and more information on changes to Part D included in the Inflation Reduction Act.) In the aggregate, Medicare’s reinsurance payments to Part D plans in 2025 are estimated to account for 18% of total Part D spending, down from close to half of total Part D spending (46%) in 2024 (Figure 13).

Spending for Catastrophic Coverage (“Reinsurance”) Accounted for Close to Half (46%) of Total Medicare Part D Spending in 2024, But Is Estimated to Decrease to 18% in 2025 as Inflation Reduction Act Changes to the Part D Benefit Take Effect

For 2025, Medicare’s actuaries estimate that Part D plans will receive direct subsidy payments averaging $1,855 per enrollee overall, $1,313 for enrollees receiving the LIS, and $517 in reinsurance payments for very high-cost enrollees.

What Is Medicare Doing to Promote Alternative Payment Models?

Copy link to What Is Medicare Doing to Promote Alternative Payment Models?

While Medicare has traditionally paid providers on a fee-for-service basis, the program is implementing various alternative payment models designed to tie payments under traditional Medicare to provider performance on quality and spending. Although the overarching goals of these various models are similar—improving the quality and affordability of patient care, increasing coordination between care teams, and reducing health care costs—the specific aims vary by model.

A notable example of an alternative payment model within Medicare is the Medicare Shared Savings Program (MSSP), a permanent accountable care organization (ACO) program in traditional Medicare established by the Affordable Care Act (ACA) that offers financial incentives to providers for meeting or exceeding savings targets and quality goals. ACOs are groups of doctors, hospitals, and other health care providers who voluntarily form partnerships to collaborate and share accountability for the quality and cost of care delivered to their patients. The MSSP currently offers different participation options to ACOs, allowing these organizations to share in savings only or both savings and losses, depending on their level of experience and other factors.

ACOs have a defined patient population for the purpose of calculating annual savings or losses. Beneficiaries in traditional Medicare may choose to align themselves to an ACO (voluntary alignment) or may be assigned to a particular ACO based on where they received a plurality of their primary care services. In either case, beneficiaries are free to seek treatment from any provider who accepts Medicare and are not limited to ACO-affiliated providers. This contrasts with enrollment in Medicare Advantage, where beneficiaries are generally limited to seeing providers in their plan’s network or face higher out-of-pocket costs for seeing out-of-network providers.

In 2023, the Medicare Shared Savings Program saved Medicare an estimated $2.1 billion relative to annual spending targets. As of 2025, there are 476 MSSP ACOs nationwide, with over 643,000 participating clinicians and 10.8 million beneficiaries aligned to MSSP ACOs (Figure 14).

Medicare Shared Savings Program ACOs Are Operating in Every State and the District of Columbia

The ACA also established the Center for Medicare and Medicaid Innovation (CMMI, also known as the Innovation Center), an operating center within the Centers for Medicare & Medicaid Services tasked with designing and testing alternative payment models to address concerns about rising health care costs, quality of care, and inefficient spending within the Medicare, Medicaid, and CHIP programs. Since its start in 2010, CMMI has launched more than 80 models across six different categories, including accountable care models, disease-specific models, health plan models, and others (Figure 15). CMMI models are designed to be tested over a limited number of years, but Congress gave CMMI the authority to expand models nationwide permanently if they meet certain quality and savings criteria. As of the most recent estimate, six models have shown statistically significant savings, and four have met the requirements for permanent expansion into the wider Medicare program, including the Medicare Diabetes Prevention Program and the Home Health Value-Based Purchasing Model.

While the overall aims of CMMI are set in law, changes of administration have brought about changes in the strategic direction of the Innovation Center and the types of models that have been pursued, along with the reframing or termination of certain models from the previous administration. For example, the Biden administration placed a greater emphasis on health equity in CMMI models, while the second Trump administration is prioritizing evidence-based preventive care, empowering consumers with data and information to make health decisions, and promoting choice and competition in health care markets.

The Center for Medicare and Medicaid Innovation (CMMI) has Implemented Numerous Programs and Pilot Projects to Test New Payment Models

According to the Congressional Budget Office (CBO), the activities of CMMI increased federal spending by $5.4 billion from 2011 to 2020, which CBO attributes in part to the mixed success of many models at generating sufficient savings to offset their high upfront costs. (CBO had initially projected that CMMI would reduce federal spending by $2.8 billion in its first decade of operation.) However, evidence suggests that savings vary by model type, with the greatest savings found among state and community-based models. Further, a review of select CMMI models provides evidence of improvements in care coordination, team-based care, and other care delivery changes, even in the absence of savings. CBO projects that CMMI’s activities will come closer to the breakeven point regarding federal spending over the course of the current decade (2024-2033).

How Much Does Medicare Spend and How Is the Program Financed?

Copy link to How Much Does Medicare Spend and How Is the Program Financed?

Spending. Medicare plays a significant role in the health care system, accounting for 21% of total national health spending in 2023, a quarter of spending on both hospital care and physician and clinical services, and 32% of spending on retail prescription drug sales (Figure 16).

In 20222023, Medicare Accounted for 21% of Total National Health Spending

In 2024, Medicare spending, net of income from premiums and other offsetting receipts, totaled $910 billion and accounted for 13% of the federal budget — a similar share as spending on Medicaid, the ACA, and the Children’s Health Insurance Program combined, and defense spending (Figure 17).

In 2024, Medicare Spending Accounted for 13% of the Federal Budget

In 2025, Medicare benefit payments are estimated to total $1.1 trillion, up from $632 billion in 2015 (including spending for Part A, Part B, and Part D benefits in both traditional Medicare and Medicare Advantage). Medicare spending per person has also grown, increasing from $5,800 to $16,700 between 2000 and 2023 – or 4.7% average annual growth over the 23-year period. In recent years, however, growth in spending per person has been lower in Medicare than in private health insurance .

Spending on Medicare Part A benefits (mainly hospital inpatient services) has decreased as a share of total Medicare spending over time as care has shifted from inpatient to outpatient settings, leading to an increase in spending on Part B benefits (including physician services, outpatient services, and physician-administered drugs). Spending on Part B services now accounts for the largest share of Medicare benefit spending (50% in 2024) (Figure 18). Moving forward, Medicare spending on physician services and other services covered under Part B is expected to grow to more than half of total Medicare spending by 2034, while spending on hospital care and other services covered under Part A is projected to decrease further as a share of the total.

Spending on Physician Services and Other Medicare Part B Services Now Accounts for the Largest Share of Total Medicare Benefits Spending

Payments to Medicare Advantage plans for Part A and Part B benefits tripled as a share of total Medicare spending between 2014 and 2024, from $156 billion to $462 billion, partly due to steady enrollment growth in Medicare Advantage plans. Growth in spending on Medicare Advantage also reflects that Medicare pays more to private Medicare Advantage plans for enrollees than their costs in traditional Medicare, on average. (See “How Does Medicare Pay Private Plans in Medicare Advantage and Medicare Part D?” for additional information.) These higher payments have contributed to growth in spending on Medicare Advantage and overall Medicare spending. In 2024, half of all Medicare program spending for Part A and Part B benefits was for Medicare Advantage plans, up from just under 30% in 2014. Between 2024 and 2034, Medicare Advantage payments are projected to total close to $9 trillion, $2.5 trillion more than spending under traditional Medicare (Figure 19).

Medicare Advantage Payments are Projected to Total Close to $9 Trillion Between 2024 and 2034, $2.5 Trillion More than Spending Under Traditional Medicare

Financing. Medicare funding, which totaled $1.1 trillion in 2024, comes primarily from government contributions (44%), payroll tax revenues (35%), and premiums paid by beneficiaries (15%). Other sources include taxes on Social Security benefits, payments from states, and interest.

The different parts of Medicare are funded in varying ways, and revenue sources dedicated to one part of the program cannot be used to pay for another part (Figure 20).

Medicare Revenues Come from Different Sources, Primarily Government Contributions, Payroll Taxes, and Premiums Paid by Beneficiaries
  • Part A, which covers inpatient hospital stays, skilled nursing facility (SNF) stays, some home health visits, and hospice care, is financed primarily through a 2.9% tax on earnings paid by employers and employees (1.45% each). Higher-income taxpayers (more than $200,000 per individual and $250,000 per couple) pay a higher payroll tax on earnings (2.35%). Payroll taxes accounted for 88% of Part A revenue in 2024.
  • Part B, which covers physician visits, outpatient services, preventive services, and some home health visits, is financed primarily through a combination of government contributions (72% in 2024) and beneficiary premiums (26%) (and 2% from interest and other sources). The standard Part B premium that most Medicare beneficiaries pay is calculated as 25% of annual Part B spending, while beneficiaries with annual incomes over $106,000 per individual or $212,000 per couple pay a higher, income-related Part B premium reflecting a larger share of total Part B spending, ranging from 35% to 85%.
  • Part D, which covers outpatient prescription drugs, is financed primarily by government contributions (75%) and beneficiary premiums (13%), with an additional 12% of revenues coming from state payments for beneficiaries enrolled in both Medicare and Medicaid. Higher-income enrollees pay a larger share of the cost of Part D coverage, as they do for Part B.
  • The Medicare Advantage program (sometimes referred to as Part C) does not have its own separate revenue sources. Funds for Part A benefits provided by Medicare Advantage plans are drawn from the Medicare HI trust fund. Funds for Part B and Part D benefits are drawn from the Supplementary Medical Insurance (SMI) trust fund. Beneficiaries enrolled in Medicare Advantage plans pay the Part B premium and may pay an additional premium if required by their plan. In 2025, 76% of Medicare Advantage enrollees pay no additional premium.

Measuring the level of reserves in the Medicare Hospital Insurance trust fund, out of which Part A benefits are paid, is a common way of measuring Medicare's financial status. Each year, Medicare’s actuaries provide an estimate of the year when the reserves are projected to be fully depleted. In 2025, the Medicare Trustees projected sufficient funds would be available to pay for Part A benefits in full until 2033, 8 years from now – three years earlier than the 2024 projection. At that point, in the absence of Congressional action, Medicare will be able to pay 89% of costs covered under Part A using payroll tax revenues. At the same time, the Congressional Budget Office has recently updated its projection of the Part A trust fund, extending the year of trust fund depletion to 2052, based on changes in its projections of Part A spending and revenues and a change in CBO’s modeling related to graduate medical education payments. OACT projects both lower income and higher spending under Part A than CBO, as well as faster Part A spending growth, which helps to account for the difference in the projected HI trust fund depletion dates.

Since 2010, the projected year of trust fund reserve depletion, based on projections by Medicare’s actuaries, has ranged from 5 years out (in 2021) to 19 years out (in 2010) (Figure 21).

The Medicare Hospital Insurance Trust Fund Reserves Are Projected to Be Depleted in 2033, Based on a Projection by Medicare's Actuaries

The level of reserves in the Part A Trust Fund is affected by growth in the economy, which affects revenue from payroll tax contributions, health care spending and utilization trends, and demographic trends: an increasing number of beneficiaries as the population ages, especially between 2010 and 2030 when the baby boom generation reaches Medicare eligibility age, and a declining ratio of workers per beneficiary making payroll tax contributions. 

Part B and Part D do not have financing challenges similar to Part A, because both are funded by beneficiary premiums and government contributions that are set annually to match expected outlays. However, future increases in spending under Part B and Part D will require increases in government (and taxpayer) funding and higher premiums paid by beneficiaries.

Future Outlook

Copy link to Future Outlook

Looking to the future, Medicare faces a number of challenges from the perspective of beneficiaries, health care providers and private plans, and the federal budget. These include:

  • How best to address the fiscal challenges arising from an aging population and increasing health care costs through spending reductions and/or revenue increases.
  • Whether and how to improve coverage for Medicare beneficiaries, including an out-of-pocket limit in traditional Medicare, enhanced financial support for lower-income beneficiaries, and additional benefits, such as dental and vision.
  • How to control spending while ensuring fair and adequate payments to hospitals, physicians and other providers, and Medicare Advantage plans, including whether and how to reduce overpayments to Medicare Advantage plans.
  • How to address the implications for traditional Medicare of the predominant role that Medicare Advantage now plays in covering Medicare beneficiaries.

Any potential changes to Medicare to address these challenges could have implications for federal spending and taxpayers, the solvency of the Medicare Hospital Insurance trust fund, total health care spending, the affordability of health care for Medicare’s growing number of beneficiaries, many of whom have limited incomes, and access to high-quality medical care.

Resources

Copy link to Resources

Citation

Copy link to Citation

Cubanski, J., Freed, M., Ochieng, N., Cottrill, A., Fuglesten Biniek, J., & Neuman, T., Medicare 101. In Altman, Drew (Editor), Health Policy 101, (KFF, October 2025) https://www.kff.org/health-policy-101-medicare/ (date accessed).

Status of State Medicaid Expansion Decisions

Published: Oct 1, 2026

The Affordable Care Act’s (ACA) Medicaid expansion expanded Medicaid coverage to nearly all adults with incomes up to 138% of the Federal Poverty Level ($21,597 for an individual in 2025) and provided states with an enhanced federal matching rate (FMAP) for their expansion populations.

To date, 41 states (including DC)   have adopted   the Medicaid expansion and 10 states   have not adopted   the expansion. Current status for each state is based on KFF tracking and analysis of state expansion activity.

These data are also available in a table format. The map may be downloaded as a Powerpoint.

Status of State Action on the Medicaid Expansion Decision (Choropleth map)
Key States with Expansion Activity (Table)

Medicaid Expansion Resources

The Average Medicare Beneficiary has 28 Medicare Advantage Prescription Drug Plan Options for 2027

Published: Oct 1, 2026

Earlier this week, the Centers for Medicare and Medicaid Services (CMS) published information about the Medicare Advantage plans that will be available for the coming 2027 plan year. Starting October 1st, insurers, brokers, and other third-party entities can market Medicare Advantage plans, and during the annual open enrollment period, which runs from October 15th through December 7th, Medicare beneficiaries can make changes to their Medicare coverage for the coming year. In a press release, CMS emphasized stability in the Medicare Advantage marketplace overall. This analysis explores Medicare Advantage plan availability for the average beneficiary and at the state level.

KFF’s analysis of plan offerings shows that, on average, Medicare beneficiaries will have the option of 28 Medicare Advantage prescription drug (MA-PD) plans in 2027, a decline from the 32 options available in 2026 (excluding employer plans and special needs plans not available for general enrollment). The number of MA-PD options grew steadily between 2010 and 2024, reaching a peak of 36 options for the average Medicare beneficiary in 2024. The number of options available for 2027 will be higher than the number available in 2021 (27) and every year before (Figure 1).

The Average Medicare Beneficiary has 28 Medicare Advantage Prescription Drug Plan Options in 2027 (Stacked Bars)

Across all Medicare Advantage plans for general enrollment, including those with and without prescription drug coverage, the average Medicare beneficiary can choose from among 35 plans in 2027, compared to 39 plans in 2026. Similar to the trend for MA-PDs, the total number of Medicare Advantage plans available to the average beneficiary is higher than the average number of plans available in every year between 2010 and 2021. While Medicare Advantage plans are required to cover all Medicare Part A and Part B benefits, plans decide whether to include Part D prescription drug coverage as part of the benefit package. Enrollees may pay a separate premium for Part D coverage, or plans can use the rebate portion of their payment from the federal government to cover these costs. Most Medicare Advantage enrollees are in plans that include prescription drug coverage and most pay no premium beyond the Part B premium.

The modest decrease in the number of Medicare Advantage plans available to the average beneficiary means that some Medicare beneficiaries will find that their current coverage is no longer an option for next year. In most cases, these beneficiaries live in counties where they will continue to have robust Medicare Advantage plan options available for 2027, as well as traditional Medicare. Some beneficiaries in plans that have exited the market will have the option to enroll in a plan offered by the same insurer, and in many cases, enrollees will be moved into a new plan offered by the same insurer automatically if the contract includes another plan of the same type (i.e., HMO or PPO) in the same county. Others will have to make an active choice about their Medicare coverage if they wish to enroll in another Medicare Advantage plan or will be automatically covered by traditional Medicare.

The number of Medicare Advantage plans with prescription drug coverage available to the average beneficiary varies across states (Figure 2). In 26 states and Puerto Rico, the average Medicare beneficiary has at least 20 MA-PD options in 2027, including 3 states (PA, MI, and OH), where the average beneficiary has at least 40 MA-PD options. In 9 states and DC, the average Medicare beneficiary has fewer than 10 MA-PD options in 2027. This includes Alaska, which has no plans available in 2027, as in 2026 (Alaska has historically had few or no Medicare Advantage plans available for general enrollment). Connecticut is not included in this calculation because of differences in how counties are reported across CMS enrollment and plan files.

Medicare Advantage Prescription Drug Plan Options for the Average Beneficiary Vary Widely, With 20 or More Options Available in More Than Two Dozen States (Choropleth map)

Across most states, the average beneficiary will have fewer Medicare Advantage plan options in 2027 compared to 2026. The states with the largest drop in the number of MA-PDs available for general enrollment are Texas (-9), Illinois and Ohio (-8), and Minnesota, New Mexico, and Washington (-7). In nine states beneficiaries will have the same number of MA-PD options in 2027 as in 2026 (excludes Alaska where no MA-PDs are available in 2026 or 2027), and in four states beneficiaries will have more options (Figure 3).

Number of Medicare Advantage Plans Available to the Average Medicare Beneficiary in 2026 and 2027, by State (Table)

Choosing how to receive Medicare benefits remains a challenge for Medicare beneficiaries. Beyond the number of plans available, every year there are changes to Medicare Advantage plan benefits and costs, including the scope and generosity of extra benefits, cost sharing for Medicare-covered benefits, out-of-pocket limits, rules for using covered services (such as referral requirements and prior authorization), drug formularies, and provider networks. (These data are released separately by CMS and a comprehensive analysis from KFF will follow.) Despite these changes, most Medicare beneficiaries report that they do not compare coverage options on an annual basis. Further, prior Medicare focus groups indicate that Medicare enrollees are often overwhelmed by the number of Medicare Advantage choices and have difficulty sorting through all plan options. With more than two dozen MA-PDs available in 2027, on average, and year-to-year changes in benefits and costs, understanding how plans differ and how these differences could affect costs and access remains a challenge for beneficiaries.

How Is The Federal Government Counting Measles Deaths?

Published: Oct 1, 2026

Overview

Amid the largest U.S. measles epidemic in decades, and one that threatens the country’s measles elimination status, a controversy has emerged regarding how to count deaths from measles. In August and September this year, Pennsylvania reported that four measles deaths had occurred in the state but so far, the Centers for Disease Control and Prevention (CDC) has recognized just one of these in its official measles statistics. CDC announced in early September that it would change how it counts measles deaths, no longer relying solely on reports from state health departments and instead looking to official death records as tracked by the National Center for Health Statistics (NCHS, a sub-agency within CDC). This new CDC policy of relying on NCHS-based mortality data to count measles deaths marks a departure from historical norms and processes that have accepted measles death reports from state health departments.

This Policy Watch reviews how measles deaths are typically determined, how these deaths are counted by the federal government and the role of two distinct but related federal public health surveillance systems at the center of the controversy – the CDC’s Nationally Notifiable Diseases Surveillance System (NNDSS) and NCHS’ National Vital Statistics System (NVSS). NNDSS and NVSS are separate public health surveillance systems with their own strengths and limitations: with NNDSS focused on real-time disease tracking that at times can also provide preliminary mortality information, while NVSS is focused on collecting longer-term, retrospective data on deaths and providing final determinations regarding the cause(s) of death though not necessarily designed for real-time tracking.  These two systems are complements, but one does not entirely replace the other.

Context

On August 25, Pennsylvania Governor Josh Shapiro held a press conference to announce that two deaths attributed to measles had occurred, the first such deaths in the state since 1992. As is standard protocol for cases of infectious diseases of national interest such as measles, the Pennsylvania Department of Health (PA DOH) also reported these as “measles-associated” deaths directly to CDC via the Nationally Notifiable Disease Surveillance System (NNDSS). PA DOH relied on pre-existing definitions for measles and for respiratory disease-associated mortality – which include clinical, laboratory, epidemiologic, and vital records criteria – in making the determination that these particular deaths were measles associated.

The Secretary of Health and Human Services (HHS) Robert F. Kennedy, Jr. initially objected to Pennsylvania’s classification of these deaths as measles-associated, saying Shapiro’s announcement was “premature” and suggesting the deaths “may even have been altogether fabricated.” CDC staff initially accepting the state’s death reports, though Kennedy later asked the CDC Director to remove any reference to those measles deaths on the CDC website. After the coroner in Lancaster County confirmed that measles was a contributing cause to the reported deaths, on September 4 Kennedy recognized measles as the cause for “only the second infant’s death” and stated: “The National Center for Health Statistics does not currently have any death records from 2026 that indicate measles is the underlying cause” but indicated CDC will update its measles death statistics upon receipt of such records. On September 14, a CDC spokesperson stated the agency had changed how it will count measles deaths in its official statistics, and going forward CDC would “report measles deaths if and when the National Center for Health Statistics reports measles as the underlying cause of death.”  The next day, PA DOH reported two additional measles-associated deaths, bringing the state’s own total to four. However, at present the CDC measles outbreak tally reports two deaths for 2026, with a note saying: “This number is subject to change; CDC will update its reporting as additional information becomes available and relevant reviews are completed.”

Two Systems with Different Purposes

The dispute around reporting measles deaths has brought new focus to two separate federal public health surveillance systems: the Nationally Notifiable Disease Surveillance System (NNDSS) and the National Vital Statistics System (NVSS). Each of these has a long history, dating back to the early 20th century, but serves different purposes. These systems are described below (see Table 1). 

Nationally Notifiable Disease Surveillance System (NNDSS): Timely Case Reporting

NNDSS is a collaboration between CDC and jurisdictions across the country that supports sharing and monitoring public health information for a set of diseases and conditions of national interest. NNDSS has roots extending to a system established in 1893 by Congress for jurisdictions to report cases of disease to the Surgeon General. Over time the system expanded, with responsibility for overseeing the system transferred to CDC in 1961. Local and state public health departments have the authority and responsibility to track cases of disease, typically through reporting from health care providers, laboratories, and other sources. In turn, jurisdictions then may provide case information to CDC through NNDSS. Key characteristics of NNDSS include:

  • A set of approximately 120 diseases and conditions that are designated by CDC as “nationally notifiable,” meaning the agency requests state and local health departments report to CDC when new cases of any of these conditions are identified. Measles is a nationally notifiable disease, and has been since 1912. Importantly, CDC cannot require jurisdictions to report case information, but all do, especially for high consequence infectious diseases such as measles. CDC itself says “since continuous endemic measles transmission has been eliminated, measles is an immediately notifiable disease.”
  • For each NNDSS disease or condition there is a pre-established definition that jurisdictions can consult to help determine if a notifiable case has occurred. These case definitions assure a level of standardization across jurisdictions. The definitions for nationally notifiable diseases are developed in collaboration with the Council of State and Territorial Epidemiologists (CSTE) and intermittently updated and refined. The current NNDSS case definition for measles dates to 2013.
  • Jurisdictions determine the extent of detail provided in their reports. Information shared through NNDSS is “de-identified” (i.e. with personally identifying information removed), but jurisdictions may include demographic, clinical, and epidemiologic characteristics and the course of clinical illness (including whether death occurred) in their case reports.
  • NNDSS reports can preliminarily indicate the cause of death in a particular case, but are not expected or designed to be a final determination. For this reason, Pennsylvania has reported the four deaths as being “measles-associated” rather than presenting a final determination of measles as the cause of death. The NNDSS definition for measles does not include specific guidance for when and how to report a death as being caused by measles infection, though CDC reports it is working with CSTE to update the definition “to promote consistent classification and reporting of measles deaths across jurisdictions.” 
  • A relative strength of NNDSS is the ability for rapid communication of case-level epidemiologic information between jurisdictions and the CDC, which can allow for near real-time tracking of outbreaks and disease trends. A limitation is that rapidly reported information may only be preliminary in nature, and case reports could be incomplete or lacking in detail.
Table 1
Characteristics of the CDC’s Nationally Notifiable Disease Surveillance System (NNDSS) Case Data and NCHS’ National Vital Statistics System (NVSS) Mortality Data
CharacteristicCDC – NNDSS Case DataNCHS – NVSS Mortality Data
Primary PurposeTimely tracking of cases of important diseases and conditions occurring nationwideComprehensive tracking of mortality statistics, including cause of death
Basic Unit of ReportingCases (such as cases of measles infection); can include associated clinical outcomes such as deathDeaths
Primary Data Source(s)Reports submitted by state/local departments of healthDeath certificate data from state/local vital statistics offices
Timing/speedNear real-time for high consequence infectious diseases such as measlesA lag of 3 months up to a year between deaths and release of data
Approach to Death AttributionPotential provisional attribution of death related to a case (e.g. “measles associated” death) as determined by a jurisdictional health department’s analysis of clinical, epidemiological, laboratory, and other criteriaCause of death must be determined by a licensed provider such as a physician/coroner, and attribution can incorporate multiple factors as contributing causes to death
Key Strengths Related to Reporting DeathsTimely data collection and analysis supports rapid response and ongoing tracking of public health threatsComprehensiveness and completeness of mortality data and causes of death
Key Limitations and Challenges Related Reporting DeathsReported death information is preliminary in nature and may require further investigation/confirmation; reporting is voluntary and may not be completeTime lag between deaths and data availability
Sources: CDC, NCHS, and KFF Analysis.

National Vital Statistics System (NVSS): Comprehensive Cause of Death Reporting

NVSS is the federal government’s primary mechanism for tracking mortality (and other vital statistics) data. The NVSS has roots going back to 1902, when Congress created a permanent Census Bureau and authorized the government to obtain copies of state vital records. By 1933, all states were required to record births and deaths and provide data to the Census Bureau. The NCHS was created in 1960, with responsibility for federal vital statistics transferred there.  The responsibility and legal authority for documenting births, deaths, and other vital statistics resides at the state and local level, but by statute NCHS has authority to collect and review these data – each state has a contract with NCHS that allows the federal government access to this information to produce national vital statistics. Key characteristics of NVSS include:

  • Housing the most complete set of data on deaths and births in the U.S. Death certificate information captured through NVSS is the most comprehensive source for mortality information nationally.
  • Death certificate information captured through NVSS is considered the benchmark for cause of death data. When completing a death certificate, a provider must include the best and final judgement on the proximate cause(s) of death as well as potential other factors that may have contributed to the death. Information from an autopsy, or laboratory and other test results may be included. Demographic details are also reported through the system such as age, sex, race/ethnicity, and education.
  • Nuances regarding a possible chain of events leading to a death and potentially multiple contributing factors can introduce complexity in cause of death determinations. Regarding the Pennsylvania cases, there has been some debate about measles being a primary cause of the deaths reported by the PA DOH, especially in relation to one of the initial reported deaths – a newborn infant that died from a lacerated spleen but was also positive for measles. 
  • State/local vital records offices are responsible for inspecting death certificates for timeliness, completeness, and accuracy of information, processing, and storing the records. Data files derived from these state/local records are then transmitted to NCHS.
  • NCHS reviews and processes vital statistics data and codes mortality statistics according to the current revision of the International Classification of Diseases (presently ICD-10, which the U.S. began to use in 1999). ICD-10 provides definitions and rules for selecting the underlying cause of death when generating vital statistics through NVSS. Typically, NVSS will release “provisional” cause of death data with a 3 to 9 month lag (depending on the cause of death), though full provisional data may take up to one a year to be released. Final cause of death data is made available after about two years. For example, the most recent NVSS provisional cause of death data are for 2025 while the most recent final cause of death data are from 2024. In special circumstances, provisional death data can become available even earlier – for example, during the COVID-19 pandemic NVSS provided updated COVID-19 related death statistics on a weekly basis.
  • A relative strength of the NVSS is its completeness and the comprehensiveness of its cause of death information. A relative weakness of the NVSS is the time lag between when deaths occur and the availability of cause of death data.


What Are the Recent Trends in Health Sector Employment

Authors: Emma Wager, Imani Telesford, Paul Hughes-Cromwick, and Lynne Cotter
Published: Sep 30, 2026

This updated chart collection uses federal labor data to compare jobs and wages in the health care sector with the rest of the economy. Health sector employment has grown steadily while job growth in other non-farm sectors has plateaued. Over the past year, the health sector added 378,500 jobs—a 2% increase—compared with 0.2% growth in non-health, non-farm employment. Health care wage growth has slowed slightly compared to other industries over the past three years.

Health care jobs now account for 11.6% of all non-farm jobs, up from 10.7% a decade ago. Since 1990, health sector employment has grown over three times as much as all other non-health, non-farm employment sectors, increasing most in outpatient settings (up 40% since August 2016.)

The chart collection is available on the Peterson-KFF Health System Tracker, an online information hub dedicated to monitoring and assessing the performance of the U.S. health system