Children of Immigrants: Key Facts on Health Coverage and Care

Published: Jan 15, 2025

Note: This brief was updated on April 10, 2025 to update state take-up of Medicaid and CHIP options for immigrant children.

Introduction

One in four children aged 18 and under living in the U.S. has at least one immigrant parent. Policies that may be implemented under the incoming Trump administration could have significant implications for these children, the vast majority of whom are citizens. These policies include potentially reinstating changes to public charge policy that were implemented during the first Trump administration, a proposal to end birthright citizenship for the children of some immigrants, and plans to carry out mass detention and deportations of immigrants, potentially including their citizen children and other family members. Birthright citizenship is a right guaranteed under the 14th amendment of the U.S. Constitution for children born in the U.S. regardless of their parents’ immigration status at the time of the child’s birth. Such actions could increase fears and confusion among children of immigrants and increase reluctance among parents to enroll them in programs for which they are eligible, including health coverage. They may also have long-term ramifications for the nation’s economy and workforce given the significant contributions immigrants and the adult children of immigrants make.

This brief provides key data on socioeconomic characteristics and health coverage among children (aged 18 and under) of immigrants based on KFF analysis of the 2023 American Community Survey 1-year Public Use Microdata Sample. It also examines potential implications of policies and actions that may be implemented by the incoming Trump administration. Key takeaways from the analysis include the following:

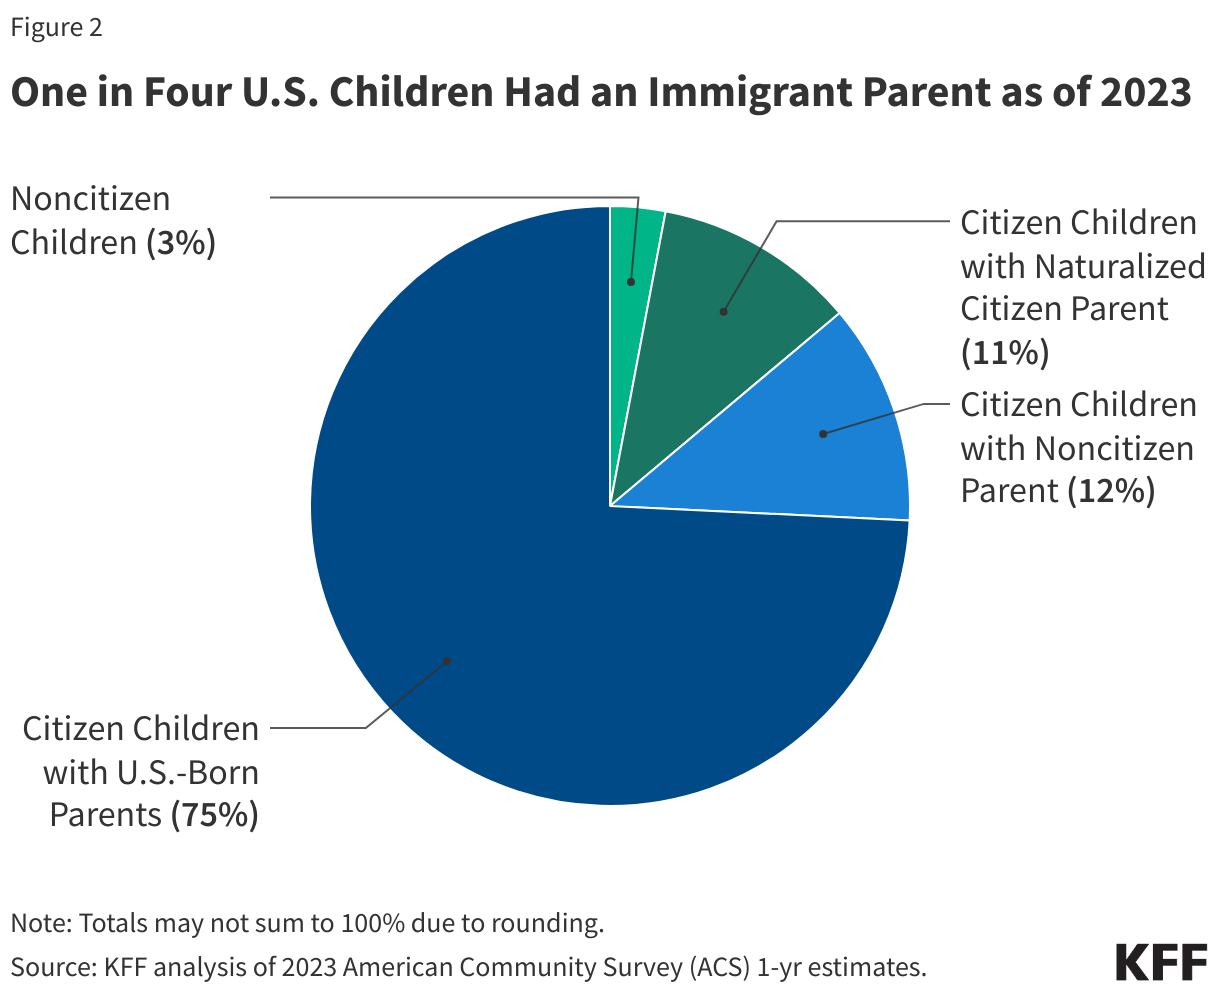
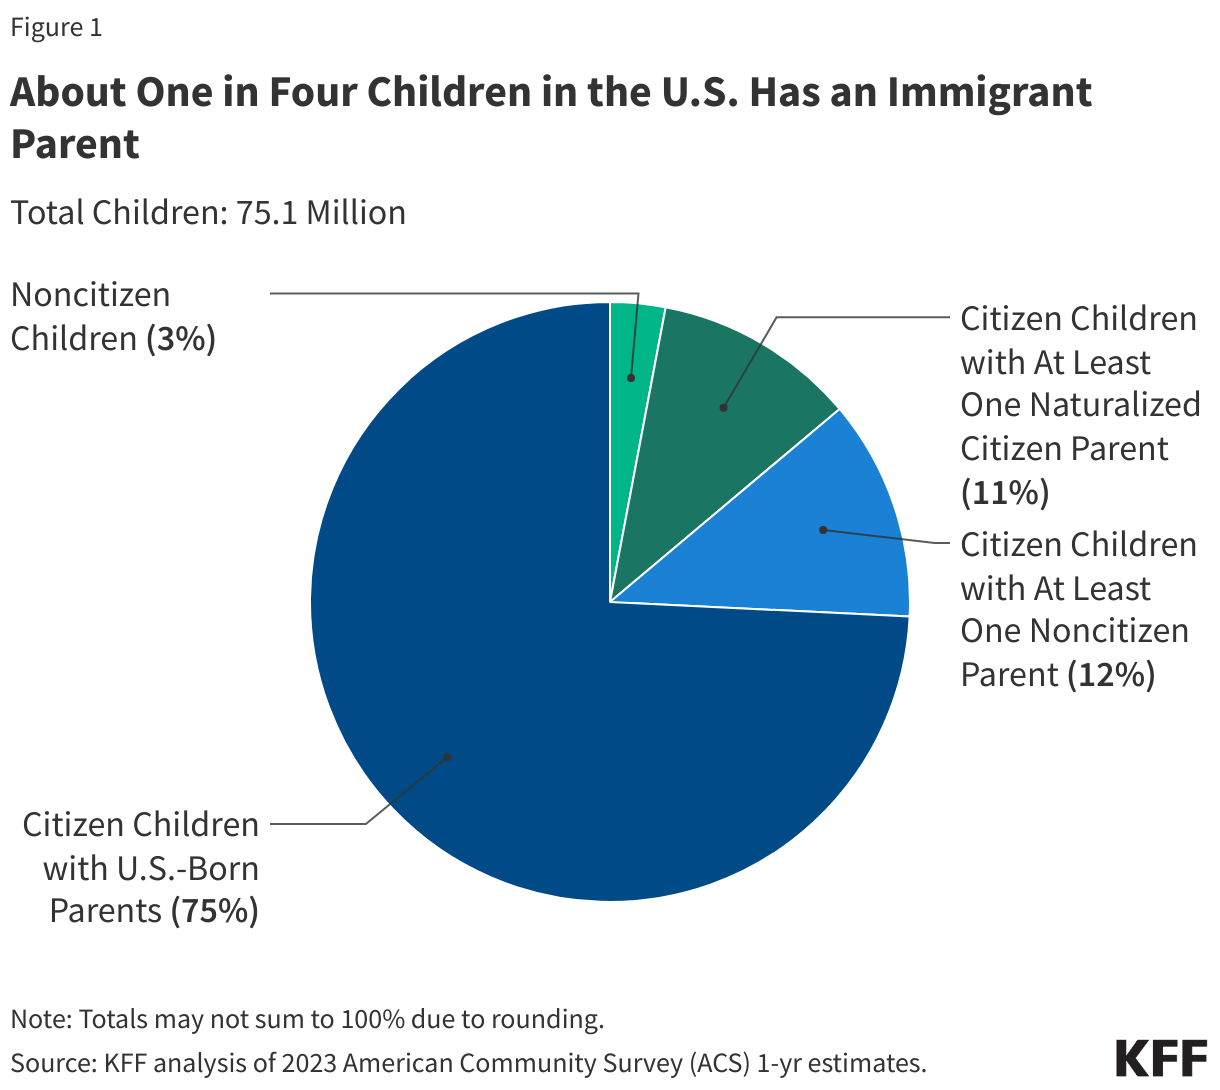
One in four children aged 18 and under in the U.S. has an immigrant parent, and the vast majority of these children are U.S. citizens. As of 2023, 19 million, or one in four, children in the U.S. had an immigrant parent. This includes one in ten (12%) who are citizen children with a noncitizen parent, a similar share (11%) who are citizen children with a naturalized citizen parent, and 3% who are noncitizen children.

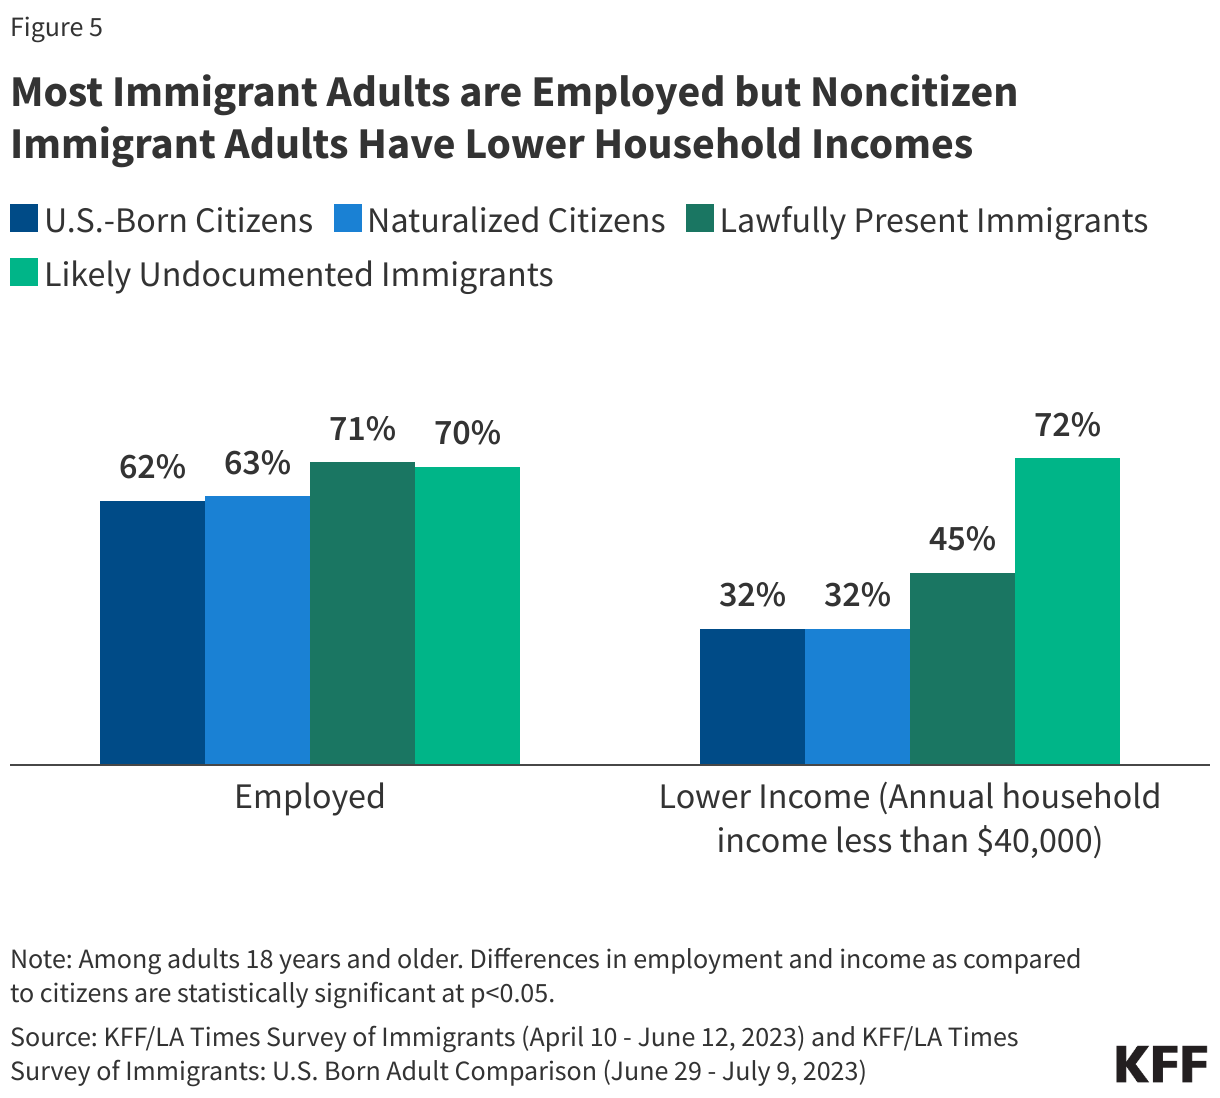
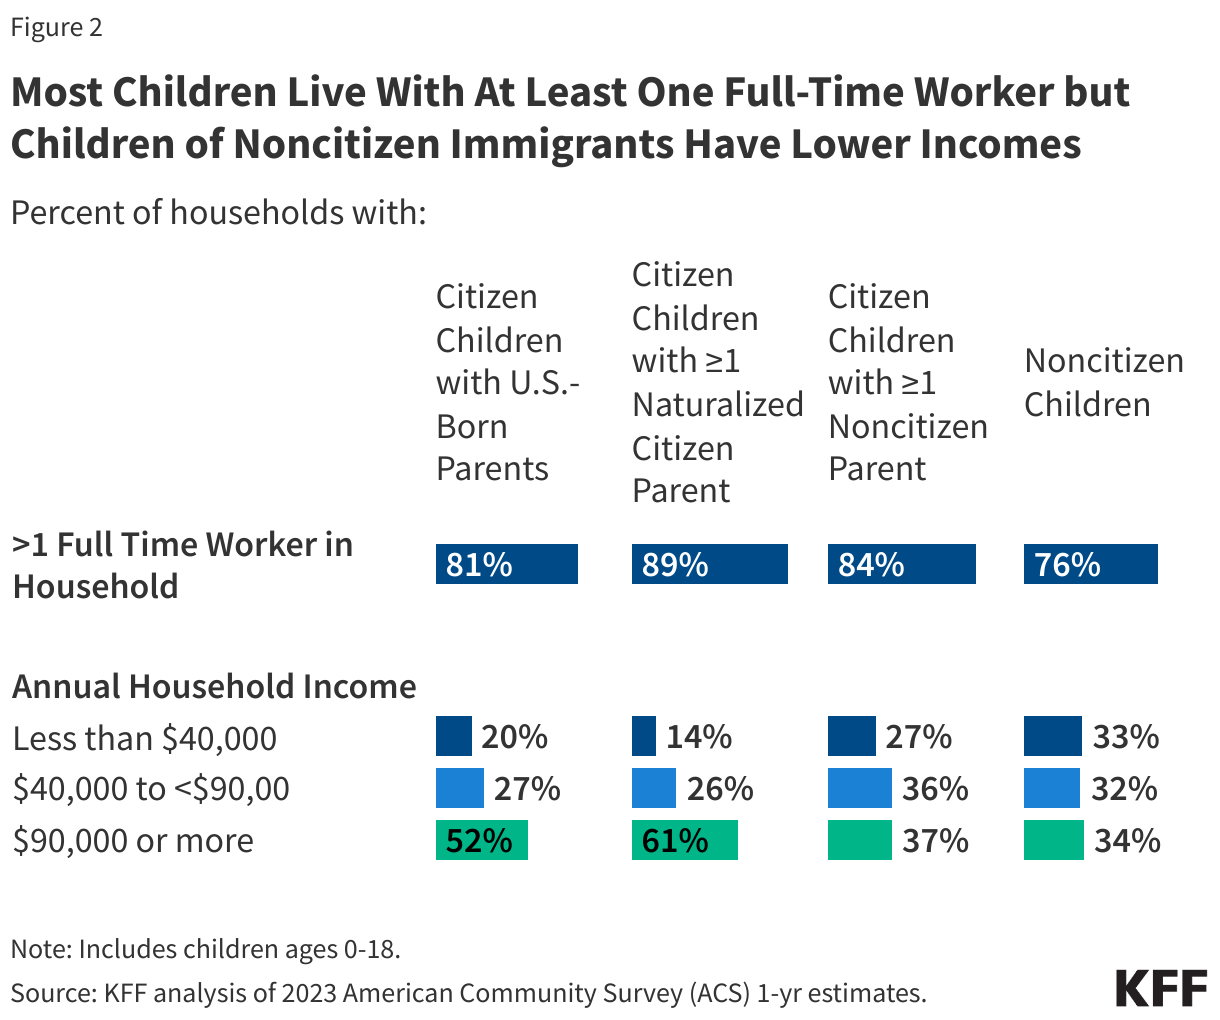
Most children of immigrants live in households with a full-time worker regardless of parental citizenship status; however, children with a noncitizen parent are more likely than children with citizen parents to live in lower income households. More than eight in ten citizen children live in a household with a full-time worker across parental citizenship statuses, and over three in four (76%) noncitizen children live in a household with a full-time worker. However, noncitizen children (33%) and citizen children with a noncitizen parent (27%) are more likely than those with U.S.-born parents (20%) and naturalized citizen parents (14%) to live in lower income households with annual incomes of less than $40,000.

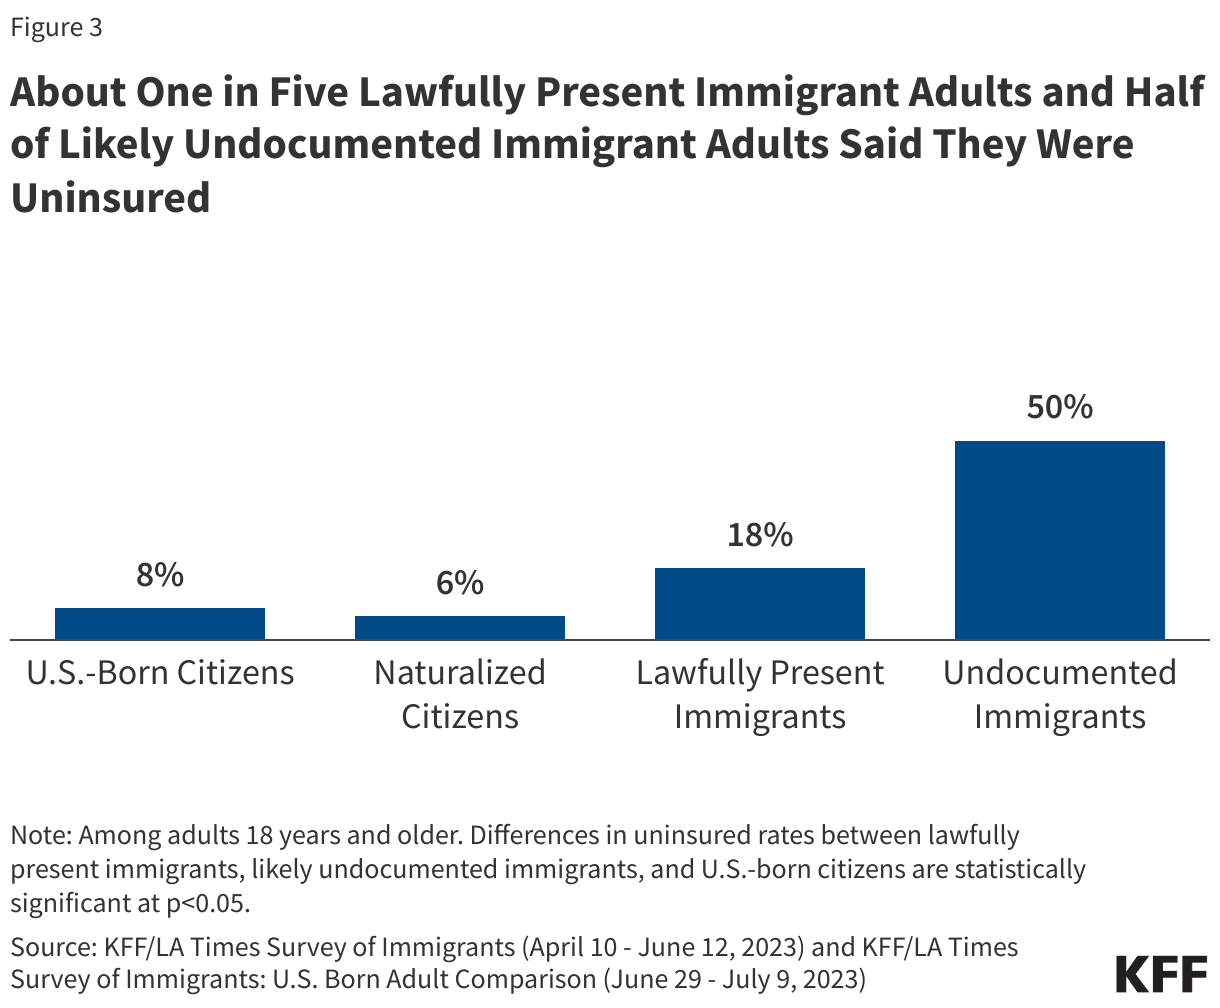
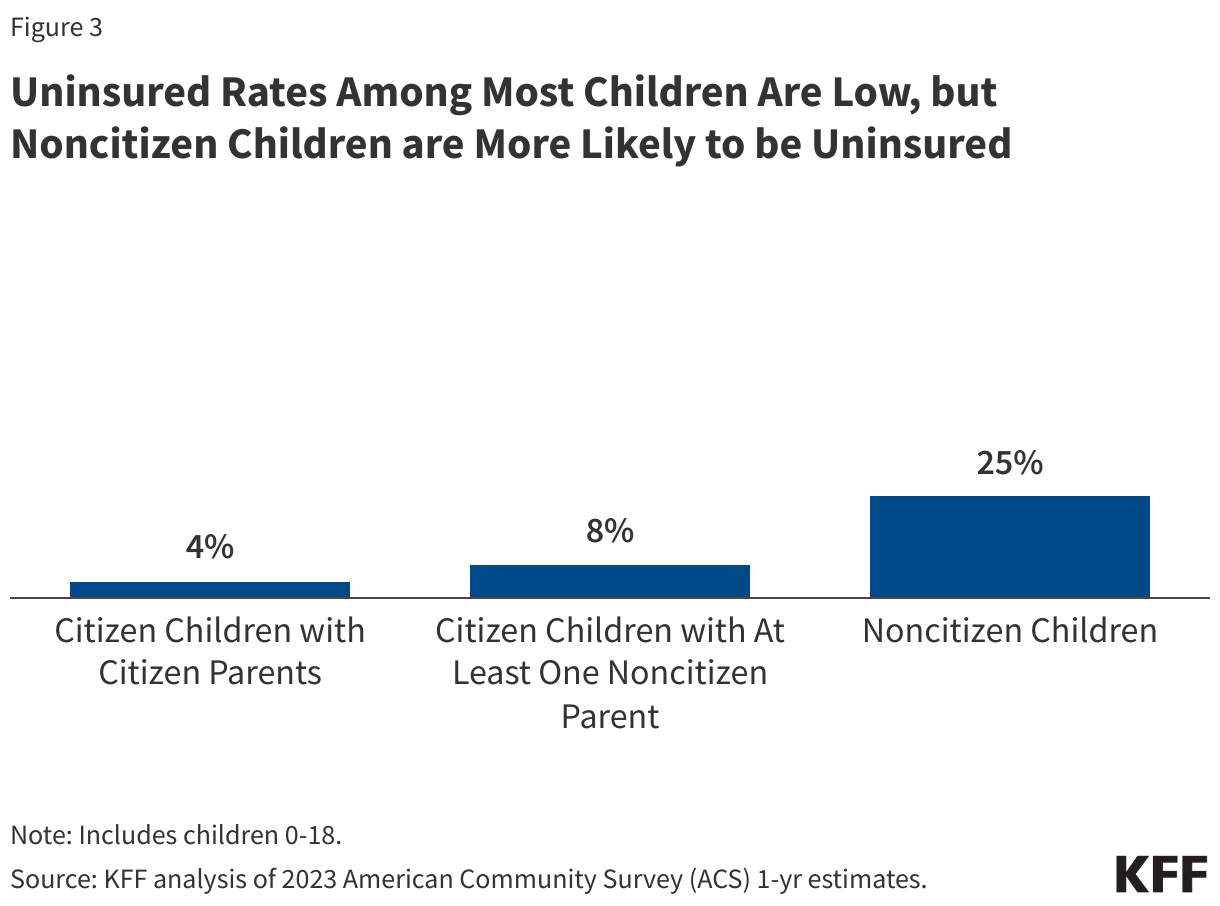
Uninsured rates among most children of immigrants remain low reflecting that most are citizens and broad coverage options are available for low-income children. As of 2023, fewer than one in ten citizen children with U.S.-citizen parents (4%) and citizen children with noncitizen parent(s) (8%) were uninsured. The small share of children who are noncitizens had a higher uninsured rate (25%). Low uninsured rates among most children reflect broad coverage for lower income children through Medicaid and the Children’s Health Insurance Program (CHIP), including state take-up of options to cover immigrant children and some state-funded coverage programs that cover children regardless of immigration status. However, coverage gaps remain for noncitizen children.

Policies that may be implemented under the incoming Trump administration could negatively affect the health and well-being of children of immigrants and have long-term negative consequences for the nation’s economy and workforce. During the first Trump administration, uninsured rates among children in immigrant families increased and immigrant families experienced negative impacts on health due to changes in public charge policy and enhanced enforcement actions. Potential immigration policies and actions that may be taken under the incoming Trump administration such as mass detention and deportation efforts, ending birthright citizenship, and/or reinstating changes to public charge policy would likely increase fears among immigrant families and negatively impact the health of children in immigrant families. The proposed policies would also likely have broader ramifications for the economy and workforce, given the major role immigrants and their adult children play, particularly in certain industries, including health care.

Overview of Children of Immigrants

As of 2023, 19 million or one in four children aged 18 and under in the U.S. had an immigrant parent. These include one in ten (12%) or 9 million who are citizen children with a noncitizen parent, a similar share (11%) or 8.3 million who are citizen children with a naturalized citizen parent, and 3%, or about 2.3 million, who are noncitizens themselves (Figure 1).

About One in Four Children in the U.S. Has an Immigrant Parent

While most children of noncitizen immigrants are U.S. citizens and live in a family with at least one full-time worker, they are more likely to live in lower income households than the children of U.S.-citizen parents. As of 2023, eight in ten or more of citizen children of U.S.-born citizen parents (81%), naturalized citizen parent(s) (89%), and noncitizen parent(s) (84%) lived in a family with at least one full-time worker (Figure 2). Three-quarters of noncitizen children (76%) also lived in a family with at least one full-time worker in 2023. However, citizen children with at least one noncitizen parent (27%) and noncitizen children (33%) were more likely to live in a lower income household (annual household income of less than $40,000) than citizen children with U.S.-born citizen parents (20%) or those with at least one naturalized citizen parent (14%) (Figure 2). Lower household income among children of noncitizen immigrants reflects noncitizen immigrants’ disproportionate employment in lower-wage jobs in industries such as construction, agriculture, and transportation, which are less likely to provide employer-sponsored insurance.

Most Children Live With At Least One Full-Time Worker but Children of Noncitizen Immigrants Have Lower Incomes

Access to Health Coverage and Care Among Children of Immigrants

Overall, uninsured rates among most children of immigrants remain low reflecting that the majority are citizens and broad-based coverage options are available for low-income children. Among children with citizen parents, 4% are uninsured, while this share rises to 8% among children with at least one noncitizen parent. Among the small group of children who are noncitizens, uninsured rates are significantly higher at 25% (Figure 3). Medicaid and/or CHIP provide broad eligibility for children with a median eligibility level of 255% of the federal poverty level across states. Higher uninsured rates among citizen children with a noncitizen parent and noncitizen children reflect enrollment barriers such as fears and confusion and language access challenges and eligibility restrictions for federally-funded health coverage, including Medicaid and CHIP, for noncitizen immigrants.

Uninsured Rates Among Most Children Are Low, but Noncitizen Children are More Likely to be Uninsured

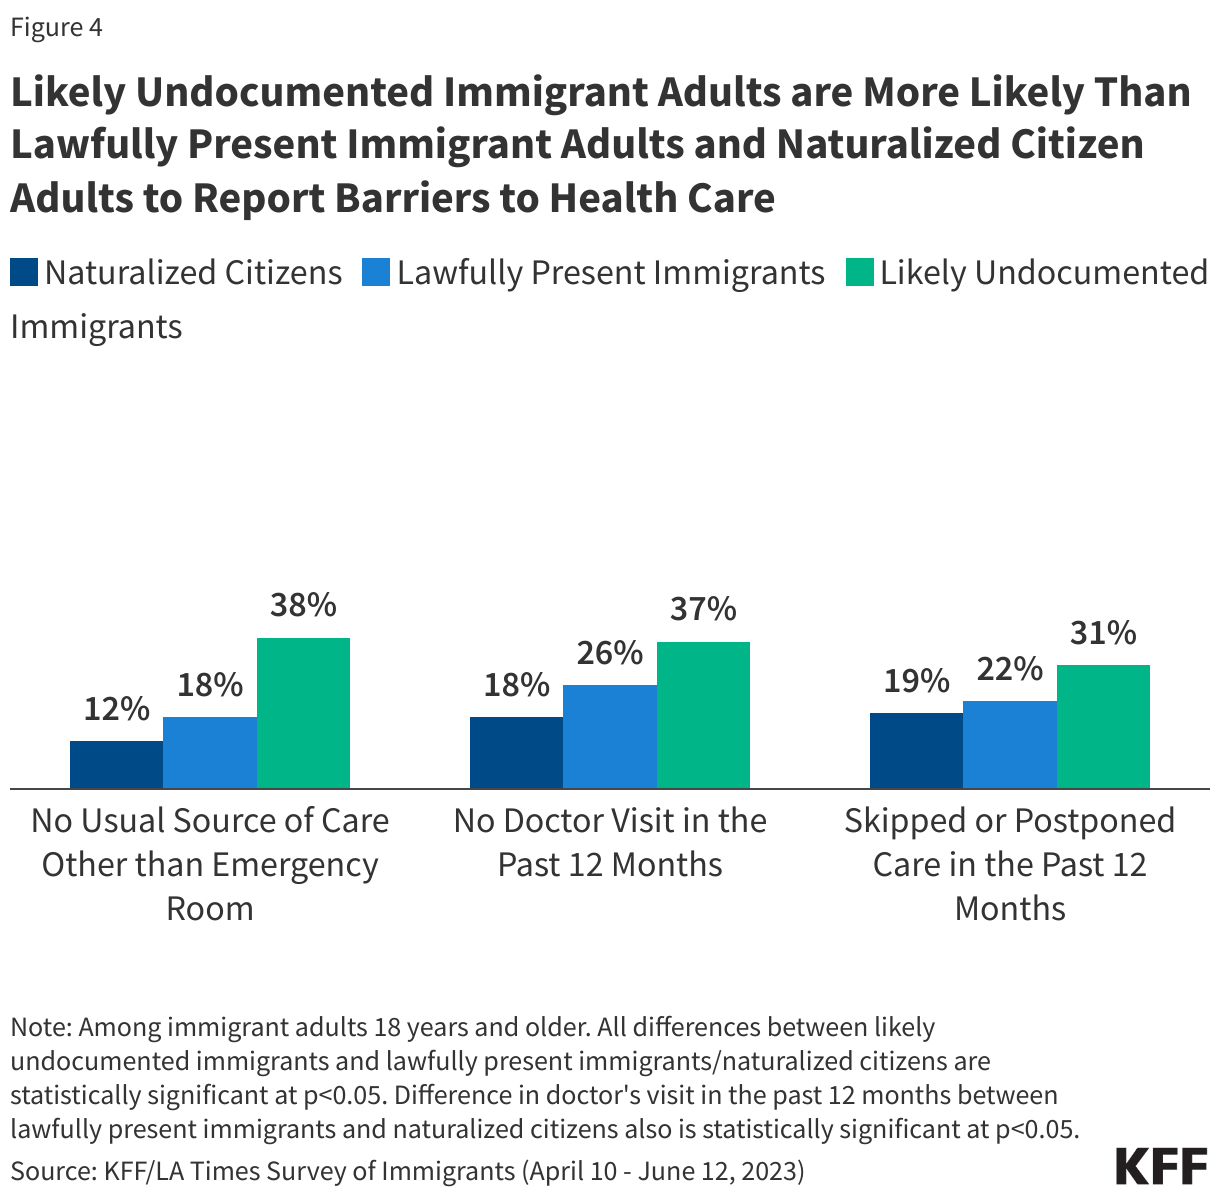
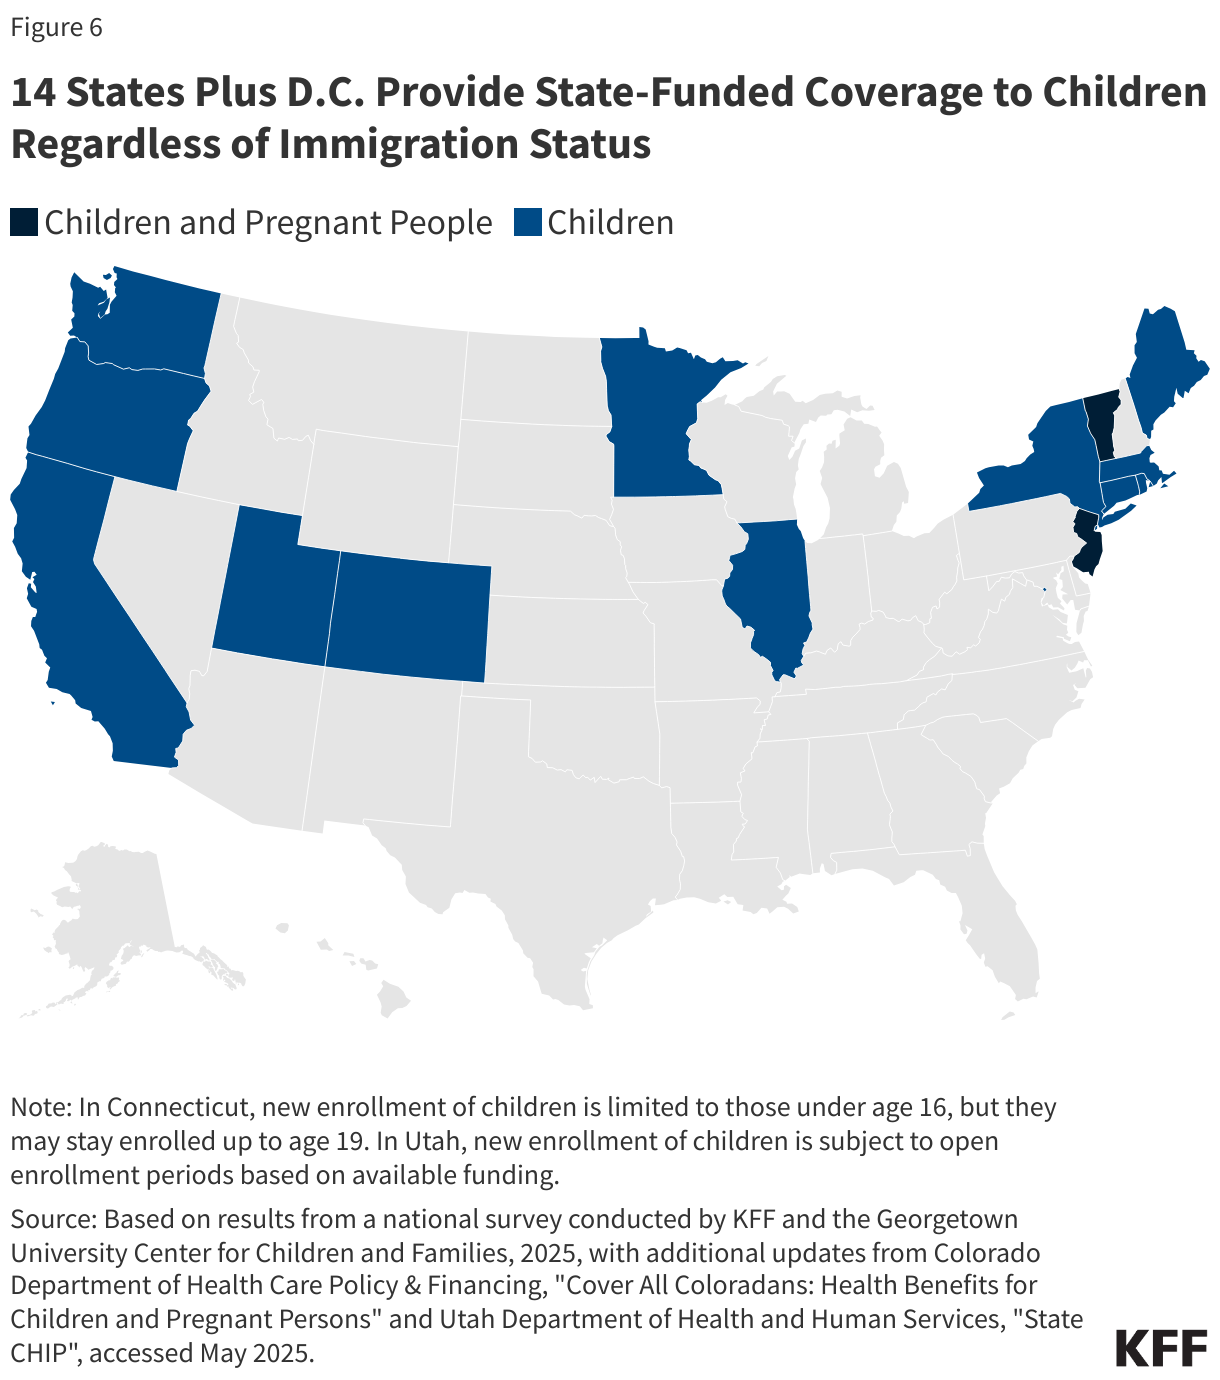
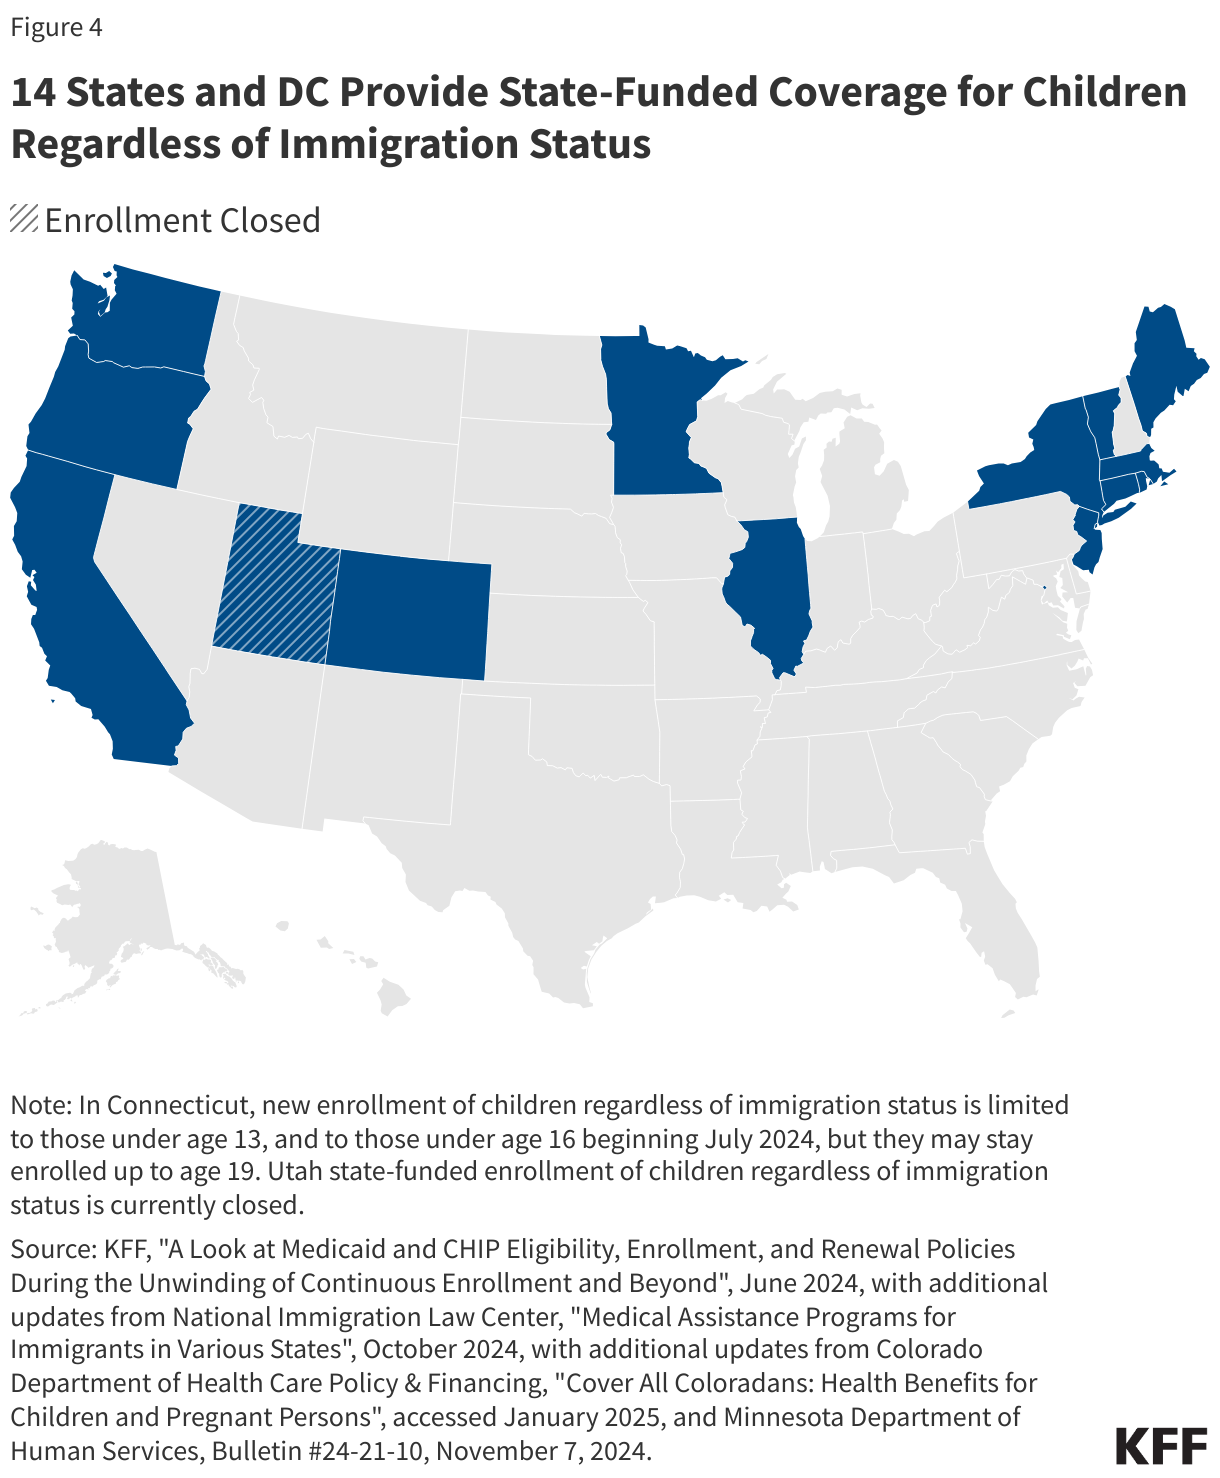
Most states have taken up options to expand coverage for immigrant children. As of April 2025, 37 states plus D.C. cover lawfully residing immigrant children without a five-year waiting period in Medicaid and CHIP. As of April 2025, 14 states and D.C. provide comprehensive fully state-funded coverage for children regardless of immigration status (Figure 4).

14 States and DC Provide State-Funded Coverage for Children Regardless of Immigration Status

While public coverage increases spending by states and the federal government, coverage helps ensure children can access needed care and promotes long-term positive outcomes for children. States have taken steps to expand Medicaid and CHIP coverage, reduce enrollment barriers, and implement continuous eligibility for children in face of rising child poverty and uninsured rates. Children without health coverage are more likely than those with coverage to delay or forgo care because of costs. Coverage expansions to immigrant children also increase access to health care and are associated with improved health outcomes. California’s 2016 expansion to cover low-income children regardless of immigration status was associated with a 34% decline in uninsured rates. Similarly, a study found that children who reside in states that have expanded coverage to all children regardless of immigration status were less likely to be uninsured, to forgo medical or dental care, and to go without a preventive health visit than children residing in states that have not expanded coverage. Research suggests that more expansive health coverage for noncitizens does not increase migration of immigrant children from other states.

Potential Implications of Incoming Trump Administration Policies

During the first Trump administration, uninsured rates among children in immigrant families increased and immigrant families experienced negative impacts on health. During his first term, President Trump implemented changes to public charge policies and enforcement actions that increased fears and uncertainty among immigrant families. Uninsured rates increased among citizen children with a noncitizen parent between 2015 to 2019, which reflected an overall decline in use of public benefits. From 2016-2019, participation in public programs such as Medicaid, CHIP, and the Supplemental Nutrition Assistance Program among citizen children with noncitizen household members fell twice as fast as those with only U.S. citizen household members. Research also shows that enrollment in Medicaid among immigrant mothers fell and newborn birth weight declined following the public charge rule changes. Immigrant families also reported increasing mental health issues among their children related to immigration-related fears and stress during the first Trump administration. There was also decreased use of health care among Hispanic children and fewer well-child visits among children of immigrant mothers following actions on immigration during the first Trump administration.

Fears persist among immigrant families. Although President Biden rescinded public charge and other policy changes implemented by President Trump during his first term, KFF survey data show that as of 2023, about a quarter (27%) of likely undocumented immigrant adults said they avoided applying for government programs that help pay for food, housing, or health care for themselves or a family member in the past year due to immigration-related fears. In addition, a majority of immigrant adults regardless of immigration status remain unsure about whether the use of non-cash assistance programs like Medicaid and CHIP can be used to make public charge determinations or incorrectly believe that to be the case.

Policies under the incoming Trump administration could negatively affect the health and well-being of children of immigrants and have long-term negative consequences for the nation’s economy and workforce. Potential immigration policies and actions that may be taken under the incoming Trump administration such as mass detention and deportation efforts, ending birthright citizenship, and/or reinstating changes to public charge policy would likely increase fears among immigrant families and negatively impact the health of children in immigrant families. For example, research shows that workplace raids to carry out enforcement actions can lead to family separations, poor physical and mental health outcomes for immigrant families, negative birth and educational outcomes for the children of immigrants, and financial hardship due to employment losses. Ending birthright citizenship would limit access to health coverage and care for the children of immigrants given eligibility restrictions for noncitizen immigrants. The proposed policies would also likely have broader ramifications for the economy and workforce given the major role immigrants and their adult children play, particularly in certain industries, including health care. Adult children of immigrants have higher educational attainment and incomes than their parents as well as the adult children of U.S.-born parent(s) and play an outsized role in the U.S. health care workforce. Moreover, immigrants and their adult children contribute billions of dollars in federal, state, and local taxes each year and help to create jobs for U.S.-born people. Research further shows that adult children of immigrants contribute more in taxes on average than their parents or the rest of the U.S.-born population and that their fiscal contributions exceed their costs associated with health care, education, and other social services.

Key Facts on Health Coverage of Immigrants

Published: Jan 15, 2025

Note: This content was updated on June 2, 2025 to include updated state-funded coverage for immigrants as well as immigrant health coverage-related provisions in the budget reconciliation bill.  

Summary

As of 2023, there were 47.1 million immigrants residing in the U.S., including 22.4 million noncitizen immigrants and 24.7 million naturalized citizens, who each accounted for about 7% of the total population. Noncitizens include lawfully present and undocumented immigrants. Many individuals live in mixed immigration status families that may include lawfully present immigrants, undocumented immigrants, and/or citizens. One in four children has an immigrant parent, including over one in ten (12%) who are citizen children with at least one noncitizen parent. This brief provides an overview of health coverage for immigrants based on data from the 2023 KFF/LA Times Survey of Immigrants, the largest nationally representative survey focused on immigrants, and discusses potential implications of incoming Trump administration policies for coverage of immigrants.

As of 2023, half (50%) of likely undocumented immigrant adults and one in five (18%) lawfully present immigrant adults reported being uninsured compared to less than one in ten naturalized citizen (6%) and U.S.-born citizen (8%) adults. Noncitizen immigrants are more likely to be uninsured than citizens because they have more limited access to private coverage due to working in jobs that are less likely to provide health benefits. They also face eligibility restrictions for federally funded coverage options, including Medicaid, the Children’s Health Insurance Program (CHIP), Affordable Care Act (ACA) Marketplace coverage, and Medicare. Moreover, those who are eligible for coverage face a range of enrollment barriers including fear, confusion about eligibility rules, and language access challenges. Reflecting their higher uninsured rate, noncitizen immigrants are more likely than citizens to report barriers to accessing health care and skipping or postponing care. Immigrants have lower health care expenditures than their U.S.-born counterparts reflecting lower use of care due to a combination of them being younger and healthier and facing more barriers to accessing  care.

Some states have expanded access to health coverage for immigrants. At the state-level there has been continued take up of state options to expand Medicaid and CHIP coverage for lawfully present immigrant children and pregnant people, and a small but growing number of states have expanded fully state-funded coverage to certain groups of low-income people regardless of immigration status. However, many immigrants, particularly those who are undocumented, remain ineligible for coverage options.

Many immigrants remain fearful of accessing assistance programs, including health coverage. The Biden administration reversed prior Trump administration changes to public charge rules so that they did not consider participation in non-cash assistance programs, including Medicaid and CHIP. It also increased funding for Navigator programs that provide enrollment assistance to individuals, which is particularly important for helping immigrant families enroll in coverage. However, as of 2023, nearly three-quarters of immigrant adults, including nine in ten of those who are likely undocumented, reported uncertainty about how use of non-cash assistance programs may impact immigration status or incorrectly believed use may reduce the chances of getting a green card in the future. About a quarter (27%) of likely undocumented immigrant adults and nearly one in ten (8%) lawfully present immigrant adults say they avoided applying for food, housing, or health care assistance in the past year due to immigration-related fears.

Fears about accessing assistance programs, including health coverage, will likely increase under the second Trump administration and provisions in the House budget reconciliation bill could eliminate health coverage access for many lawfully present and undocumented immigrants. The Trump administration is undertaking broad enforcement aimed at restricting immigration which will likely increase fears and uncertainty among immigrant families about accessing assistance programs and seeking health care. In addition, provisions in the budget reconciliation bill being considered by Congress would eliminate ACA Marketplace and Medicare coverage for many lawfully present immigrants and would penalize states that use their own funds to provide health coverage to immigrants regardless of immigration status.

Overview of Immigrants

Based on federal survey data, as of 2023, there were 47.1 million immigrants residing in the U.S., including 22.4 million noncitizen immigrants and 24.7 million naturalized citizens, who each accounted for about 7% of the total population (Figure 1). Estimates suggest that about six in ten noncitizens were lawfully present immigrants, such as lawful permanent residents (green card holders) and those with a valid work or student visa, while the remaining four in ten were undocumented immigrants, who may include individuals who entered the country without authorization and individuals who entered the country lawfully and stayed after their visa or status expired.1  Many individuals live in mixed immigration status families that may include lawfully present immigrants, undocumented immigrants, and/or citizens. A total of 19 million or one in four children living in the U.S. had an immigrant parent as of 2023, and the majority of these children were citizens (Figure 2). About 8.6 million or 12% were citizen children with at least one noncitizen parent.

There Were Over 47 Million Immigrants Residing in the U.S. as of 2023
One in Four U.S. Children Had an Immigrant Parent as of 2023

Uninsured Rates by Immigration Status

The 2023 KFF/LA Times Survey of Immigrants, the largest nationally representative survey focused on immigrants, provides data on health coverage of immigrant adults and experiences accessing health care, including by immigration status.

Although the majority of uninsured people are citizens, noncitizen immigrant adults, particularly likely undocumented immigrants, are significantly more likely to report being uninsured than citizens. As of 2023, half (50%) of likely undocumented immigrant adults and one in five (18%) lawfully present immigrant adults said they were uninsured compared to 6% of naturalized citizen adults and 8% of U.S.-born citizen adults (Figure 3).

About One in Five Lawfully Present Immigrant Adults and Half of Likely Undocumented Immigrant Adults Said They Were Uninsured

Reflecting their higher uninsured rates, noncitizen immigrants, especially those who are likely undocumented, are more likely than citizens to report barriers to accessing health care and skipping or postponing care. Research shows that having insurance makes a difference in whether and when people access needed care. Those who are uninsured often delay or go without needed care, which can lead to worse health outcomes over the long-term that may ultimately be more complex and expensive to treat. Overall, likely undocumented immigrant adults are more likely than lawfully present immigrant adults and naturalized citizen adults to report not having a usual source of care other than an emergency room, not having a doctor’s visit in the past 12 months, and skipping or postponing care in the past 12 months (Figure 4). Lawfully present immigrant adults also are more likely than naturalized citizen adults to say they have not had a doctor’s visit in the past 12 months.

Likely Undocumented Immigrant Adults are More Likely Than Lawfully Present Immigrant Adults and Naturalized Citizen Adults to Report Barriers to Health Care

Research also shows that immigrants have lower health care use and expenditures than their U.S.-born counterparts and help to subsidize health care for U.S.-born citizens. Overall, research shows that immigrants, including lawfully present and undocumented immigrants, use less health care than U.S.-born citizens. Lower use of health care among immigrants likely reflects a combination of them being younger and healthier than their U.S.-born counterparts as well as them facing increased barriers to care including a higher uninsured rate, language access challenges, confusion, and immigration-related fears. Reflecting their lower use of health care, immigrants have lower health care expenditures than their U.S.-born counterparts. KFF analysis of 2021 medical expenditure data show that, on average, annual per capita health care expenditures for immigrants are about two-thirds those of U.S.-born citizens ($4,875 vs. $7,277). Recent research further finds that, because immigrants, especially undocumented immigrants, have lower health care use despite contributing billions of dollars in insurance premiums and taxes, they help subsidize the U.S. health care system and offset the costs of care incurred by U.S.-born citizens.

Access to Health Coverage Among Immigrants

Private Coverage

Despite high rates of employment, noncitizen immigrants have limited access to employer-sponsored coverage. Although most noncitizen immigrant adults say they are employed, they are significantly more likely than citizens to report being lower income (household income less than $40,000) (Figure 5). This pattern reflects disproportionate employment of noncitizen immigrants in low-wage jobs and industries that are less likely to offer employer-sponsored coverage. Given their lower incomes, noncitizen immigrants also face challenges affording employer-sponsored coverage when it is available or through the individual market.

Most Immigrant Adults are Employed but Noncitizen Immigrant Adults Have Lower Household Incomes

Federally Funded Coverage

Lawfully present immigrants may qualify for Medicaid and CHIP but are subject to certain eligibility restrictions. In general, lawfully present immigrants must have a “qualified” immigration status to be eligible for Medicaid or CHIP, and many, including most lawful permanent residents or “green card” holders, must wait five years after obtaining qualified status before they may enroll. Some immigrants with qualified status, such as refugees and asylees, as well as citizens of Compact of Free Association (COFA) nations, do not have to wait five years before enrolling. Some immigrants, such as those with temporary protected status, are lawfully present but do not have a qualified status and are not eligible to enroll in Medicaid or CHIP regardless of their length of time in the country (Appendix A). For children and pregnant people, states can eliminate the five-year wait and extend coverage to some lawfully present immigrants without a qualified status. As of April 2025, 37 states plus D.C. have taken up this option for children and 31 states plus D.C. have elected the option for pregnant individuals.

In December 2020, Congress restored Medicaid eligibility for citizens of COFA nations, and in March 2024, eligibility was restored for additional federally funded programs including CHIP. The U.S. government has COFA agreements with the Republic of the Marshall Islands, the Federated States of Micronesia, and the Republic of Palau. Certain citizens of these nations can lawfully work, study, and reside in the U.S., but they had been excluded from federally funded Medicaid since 1996, under the Personal Responsibility and Work Opportunity Reconciliation Act. As part of a COVID-relief package, Congress restored Medicaid eligibility for COFA citizens who meet other eligibility requirements for the program effective December 27, 2020. On March 9, 2024, Congress further extended eligibility for COFA citizens to newly include other federally funded programs such as CHIP, the Supplemental Nutrition Assistance Program (SNAP), and Temporary Assistance for Needy Families (TANF), among others.

A total of 24 states plus D.C. have also extended coverage to pregnant people regardless of immigration status through the CHIP From-Conception-to-End-of-Pregnancy (FCEP) option. States have the option in CHIP to provide prenatal care and pregnancy related benefits to targeted low-income children beginning from conception to end of pregnancy regardless of their parent’s citizenship or immigration status. While other pregnancy-related coverage in Medicaid and CHIP requires 60 days of postpartum coverage, the CHIP FCEP option does not include this coverage. However, some states that took up this option provide postpartum coverage through a CHIP health services initiative or using state-only funding. Twelve of the states that have implemented the FCEP option (California, Colorado, Connecticut, Illinois, Maine, Massachusetts, Minnesota, New York, Oregon, Rhode Island, Texas, and Washington) plus D.C. have used state funding or CHIP health services initiatives to extend postpartum coverage to 12 months to align with the Medicaid extension established by the American Rescue Plan Act. Maryland extends coverage for four months postpartum, and Alabama and Virigina extend coverage for 60 days postpartum using CHIP health services initiatives.

Lawfully present immigrants can purchase coverage through the ACA Marketplaces and, like citizens, may receive tax credits to help pay for premiums and cost sharing that vary on a sliding scale based on income. Generally, these tax credits are available to people with incomes starting from 100% of the federal poverty level (FPL) who are not eligible for other affordable coverage. In addition, lawfully present immigrants with incomes below 100% FPL may receive tax credits if they are ineligible for Medicaid based on immigration status. This group includes lawfully present immigrants who are not eligible for Medicaid or CHIP because they are in the five-year waiting period or do not have a “qualified” status. Individuals with Deferred Action for Childhood Arrivals (DACA) status were not considered lawfully present for purposes of health coverage eligibility and remained ineligible despite having a deferred action status, which otherwise qualified for Marketplace coverage. On May 3, 2024, the Biden administration published regulations that changed the definition of lawfully present to include DACA recipients for purposes of eligibility to purchase coverage through the ACA Marketplaces and to receive tax credits to help pay for premiums and cost sharing. The rule became effective on November 1, 2024, to coincide with the 2025 Open Enrollment Period and the Biden administration estimates that 100,000 DACA recipients will receive coverage under the new rule. Implementation of the coverage expansion remains subject to ongoing litigation with DACA recipients in 19 states (AL, AR, FL, IA, ID, IN, KS, KY, MS, MT, ND, NE, NH, OH, SC, SD, TN, TX, VA) being unable to enroll in ACA Marketplace coverage as of January 2025. Further, in March 2025, the Centers for Medicare and Medicaid Services (CMS) submitted a Notice of Proposed Rulemaking to the Federal Register seeking to exclude DACA recipients from the definition of “lawfully present” immigrants for the purposes of health coverage, which would make DACA recipients across the U.S. ineligible for purchasing coverage through the ACA Marketplaces.

Lawfully present immigrants also can qualify for Medicare subject to certain restrictions. Specifically, they must have sufficient work history to qualify for premium-free Medicare Part A. If they do not have sufficient work history, they may qualify if they are lawful permanent residents and have resided in the U.S. for five years immediately prior to enrolling in Medicare, although they must pay premiums to enroll in Part A.

Undocumented immigrants are not eligible to enroll in federally funded coverage including Medicaid, CHIP, or Medicare or to purchase coverage through the ACA Marketplaces. Medicaid payments for emergency services may be made to hospitals on behalf of individuals who are otherwise eligible for Medicaid but for their immigration status. These include lawfully present immigrants who are subject to a five-year bar for Medicaid and undocumented immigrants. These payments may help cover the costs for emergency care provided to immigrants who remain ineligible for Medicaid but are not coverage for individuals. Much of Emergency Medicaid spending goes towards labor and delivery costs and Emergency Medicaid spending represented less than 1% of total Medicaid spending in fiscal year 2023.

State Funded Coverage

As of April 2025, 14 states plus D.C. provide comprehensive state-funded coverage to children regardless of immigration status (Figure 6). These states include California, Colorado, Connecticut, Illinois, Maine, Massachusetts, Minnesota, New Jersey, New York, Oregon, Rhode Island, Utah, Vermont, Washington, and D.C. Additionally, two of these states (New Jersey and Vermont) also provide state-funded coverage to income-eligible pregnant people regardless of immigration status, with Vermont extending this coverage for 12 months postpartum.

14 States Plus D.C. Provide State-Funded Coverage to Children Regardless of Immigration Status

As of April 2025, seven states (California, Colorado, Illinois, Minnesota, New York, Oregon, Washington) plus D.C. have also expanded fully state-funded coverage to at least some income-eligible adults regardless of immigration status (Figure 7). Some additional states cover some income-eligible adults who are not otherwise eligible due to immigration status using state-only funds but limit coverage to specific groups, such as lawfully present immigrants who are in the five-year waiting period for Medicaid coverage, or provide more limited benefits. In addition to these states, Maryland plans to allow income-eligible individuals to purchase Marketplace coverage without subsidies regardless of immigration status starting November 2025 through a section 1332 waiver. Recently, some states have proposed rolling back state-funded health coverage for some groups of immigrants due to budget constraints.

As of January 2025, Seven States Plus D.C. Provide State-Funded Coverage to At Least Some Adults Regardless of Immigration Status

Data suggest that state coverage expansions for immigrants make a difference in their health coverage and health care access and use. The 2023 KFF/LA Times Survey of Immigrants shows that immigrant adults residing in states with more expansive coverage policies for immigrants are less likely to be uninsured compared to their counterparts living in states with less expansive coverage policies. California’s 2016 expansion to cover low-income children regardless of immigration status was associated with a 34% decline in uninsurance rates. Similarly, a study found that children who reside in states that have expanded coverage to all children regardless of immigration status were less likely to be uninsured, to forgo medical or dental care, and to go without a preventive health visit than children residing in states that have not expanded coverage. Other research has found that expanding Medicaid coverage to pregnant people regardless of immigration status was associated with higher rates of prenatal care and improved outcomes including increases in average gestation length and birth weight among newborns, while more restrictive state coverage policies were associated with reduced postpartum care utilization. The cost of providing insurance to immigrant adults through Medicaid expansion was also found to be less than half the per person cost of doing so for U.S-born adults. Recent estimates also suggest that the state-funded expansion to all immigrants regardless of status in California could reduce poverty among noncitizen immigrants and their families.

Enrollment Barriers

Among immigrants who are eligible for coverage, many remain uninsured because of a range of enrollment barriers, including fear, confusion about eligibility policies, difficulty navigating the enrollment process, and language access challenges. Research suggests that changes to immigration policy made by the first Trump administration contributed to growing fears among immigrant families about enrolling themselves and/or their children in Medicaid and CHIP even if they were eligible. In particular, changes to the public charge policy likely contributed to decreases in participation in Medicaid among immigrant families and their primarily U.S.-born children. The Biden administration reversed many of these changes, including the changes to public charge policy, and increased funding for Navigator programs that provide enrollment assistance to individuals, which is particularly important for helping immigrant families enroll in coverage. However, as of 2023, nearly three-quarters of immigrant adults, including nine in ten of those who are likely undocumented, report uncertainty or an incorrect understanding about how use of non-cash assistance programs may impact immigration status or incorrectly believe use may reduce the chances of getting a green card in the future. About a quarter (27%) of likely undocumented immigrants and nearly one in ten (8%) lawfully present immigrants say they avoided applying for food, housing, or health care assistance in the past year due to immigration-related fears.

Fears about participating in programs, including health coverage, will likely increase under the second Trump administration. Although President-elect Trump has not indicated whether his incoming administration plans to reinstate his first-term changes to public charge policy, doing so could lead to widespread confusion, fears, and broad chilling effects among immigrant families. In addition, broader immigration enforcement actions proposed by President-elect Trump such as mass deportation of immigrants, elimination of the DACA program and its associated ACA health coverage expansion, and ending birthright citizenship for the children of some immigrants could limit access to health care for immigrant families, negatively impact their daily lives and well-being, and increase fears and confusion about participating in programs, including health coverage.

Appendix A

Lawfully Present Immigrants by Qualified Status

Qualified Immigrant CategoryOther Lawfully Present Immigrants
Lawful permanent resident (LPR or green card holder)Granted Withholding of Deportation or Withholding of Removal, under the immigration laws or under the Convention against Torture (CAT)
RefugeeIndividual with Non-Immigrant Status, includes worker visas, student visas, U-visa, and other visas, and citizens of Micronesia, the Marshall Islands, and Palau
AsyleeTemporary Protected Status (TPS)
Cuban/Haitian entrantDeferred Enforced Departure (DED)
Paroled into the U.S. for at least one yearDeferred Action Status
Conditional entrant granted before 1980Lawful Temporary Resident
Granted withholding of deportationAdministrative order staying removal issued by the Department of Homeland Security
Battered noncitizen, spouse, child, or parentResident of American Samoa
Victims of trafficking and their spouse, child, sibling, or parent or individuals with pending application for a victim of trafficking visaApplicants for certain statuses
Member of a federally recognized Indian tribe or American Indian born in CanadaPeople with certain statuses who have employment authorization
Citizens of the Marshall Islands, Micronesia, and Palau who are living in one of the U.S. states or territories (referred to as Compact of Free Association or COFA migrants)People with certain statuses who have employment authorization
  1. The estimate of the total number of noncitizens in the U.S. is based on the 2023 American Community Survey (ACS) 1-year Public Use Microdata Sample (PUMS). The ACS data do not directly indicate whether an immigrant is lawfully present or not. KFF draws on the methods underlying the 2013 analysis by the State Health Access Data Assistance Center (SHADAC) and the recommendations made by Van Hook et. al. This approach uses the Survey of Income and Program Participation (SIPP) to develop a model that predicts immigration status; it then applies the model to ACS, controlling to state-level estimates of total undocumented population from Pew Research Center. For more detail on the immigration imputation used in this analysis, see Technical Appendix B. ↩︎
News Release

Affordable Care Act Marketplace and Medicaid Expansion Enrollment Reached a Combined 44 Million in 2024  

Published: Jan 15, 2025

A new KFF analysis finds that there were 44 million people enrolled in health coverage through the Affordable Care Act’s Marketplaces and its expansion of the Medicaid program in 2024. That represents about 1 in every 6 people under age 65, or 16.4%.  

There was significant variation in ACA enrollment across states, ranging from about 1 in 4 nonelderly people in Louisiana, Oregon, Florida, and New York to fewer than 1 in 10 in Tennessee, Alabama, Wyoming, Kansas, and Wisconsin, according to the analysis.  

With the exception of Florida, the states with the largest ACA-related enrollment as a share of population had adopted the Medicaid expansion, while all five states with the lowest share of enrollment were non-expansion states. (The data includes enrollment in the Basic Health Program, an option offered by some states under the ACA to provide coverage for low-income residents who would otherwise be eligible to obtain coverage through the Marketplace. There were 1.3 million people enrolled in this option in 2024.) 

The new analysis helps illustrate how many people could potentially be affected by the anticipated policy debates in Congress, including whether to allow enhanced ACA Marketplace subsidies to expire this year, whether to reduce the federal share of Medicaid expansion funding, or whether to enact deeper spending cuts to ACA subsidies and Medicaid to help pay for expected tax cuts.   

From 2020 to 2024, total enrollment in ACA programs (Medicaid, Marketplace, and Basic Health Plan) increased by nearly 60%, with the largest increase among Marketplace enrollees, helping to drive the uninsured rate down to historic lows.  The number of Marketplace enrollees increased by 10 million people nationally, almost doubling, over the period, and the number of Medicaid expansion enrollees increased by 6.2 million people. States with the largest increases in enrollment, in percentage terms, included Missouri (243%), Oklahoma (227%), Texas (212%), Mississippi (190%), North Carolina (185%) and Georgia (186%).  

Growth in Marketplace enrollment over the period can be largely attributed to the temporary enhanced subsidies that were made available in 2021, which were extended through 2025. Marketplace enrollment climbed to a new record high in 2025, with nearly 24 million people signing up for plans during the current enrollment period.  Marketplace enrollment was 21.4 million in 2024.

Medicaid expansion enrollment increased due to more states implementing expansion (seven states—Idaho, Missouri, Nebraska, North Carolina, Oklahoma, South Dakota, and Utah—implemented Medicaid expansion during or after 2020) and because of the pause in disenrollments from the pandemic-era continuous enrollment provision. Medicaid expansion enrollment totaled 21.3 million people in 2024. Even with the unwinding of the continuous enrollment provision that was still in play through March 2024, overall enrollment in Medicaid expansion is higher than in 2020.   

A Look at ACA Coverage through the Marketplaces and Medicaid Expansion Ahead of Potential Policy Changes

Published: Jan 15, 2025

The Affordable Care Act (ACA) expanded health insurance coverage by extending Medicaid coverage to nearly all adults with incomes up to 138% of the federal poverty level (FPL) ($20,783 for a single individual in 2024) and by creating new health insurance Marketplaces through which individuals can purchase private insurance coverage with financial help to afford premiums and cost-sharing. Marketplace subsidies are available for individuals not eligible for Medicaid with incomes above 100% FPL. The Medicaid expansion was originally mandatory for states, but expansion became effectively optional after a Supreme Court decision in 2012. States can opt to provide more affordable coverage to individuals who would otherwise be eligible for Marketplace coverage with incomes between 133% and 200% FPL through a Basic Health Program (BHP). In 2024 Minnesota had a BHP plan, Oregon newly implemented a BHP on July 1, 2024, and New York had a BHP until April 2024 when it transitioned to provide the same coverage to individuals with incomes up to 250% FPL through the state’s Essential Plan (EP).

In total, 2024 ACA enrollment (including Marketplace, Medicaid expansion, and BHP) reached 44 million, or 16.4% of the nonelderly U.S. population. In 2024, Marketplace enrollment hit a new record high, of 21.4 million people (almost double the 11 million people enrolled in 2020), Medicaid expansion enrollment was 21.3 million (a 41% increase from 2020), and BHP enrollment in 2024 was 1.3 million (up from 880,000 in 2020).

Marketplace growth since 2020 can be largely attributed to enhanced subsidies made available by the American Rescue Plan Act (ARPA) in 2021 and renewed through 2025 under the Inflation Reduction Act (IRA). These enhanced subsidies significantly reduced premium payments across the board for ACA Marketplace enrollees – including $0 monthly premiums for enrollees with incomes up to 150% FPL – and made some middle-income people who had previously been priced out of coverage newly eligible for financial assistance. Medicaid expansion enrollment increased due to seven states newly implementing expansion in 2020 or later and adoption of the continuous enrollment provision, a pandemic-era policy that prohibited states from disenrolling people from Medicaid in exchange for enhanced federal funding. Even with the unwinding of the continuous enrollment provision starting April 1, 2023, enrollment in the Medicaid expansion today is higher than it was in 2020.

The uninsured rate hit an historic low in 2023 as coverage through the ACA and Medicaid increased, but these coverage gains may not last for long. If enhanced subsidies are not renewed by Congress and are instead allowed to expire at the end of 2025, ACA enrollee premium payments are expected to increase by over 75% on average, and the Congressional Budget Office (CBO) estimates that the number of people who are uninsured will increase by 3.8 million, on average, in each year over the 2026-2034 period. In addition, potential Congressional efforts to lower the Medicaid expansion match rate from the current 90% rate could reduce federal spending but would shift costs to states and likely result in decisions by many states to terminate coverage. About 4.3 million Medicaid expansion enrollees live in states with some type of trigger law that would end Medicaid expansion or require review of expansion coverage to mitigate increases in state costs if federal funding for the expansion is reduced. There is also potential for deeper cuts to the ACA and Medicaid to help offset increases in the deficit if expiring tax cuts are extended.

While 1 in 6 nonelderly people in the U.S. had some form of ACA coverage in 2024, there was significant variation across states. More than 1 in 5 nonelderly people in seven states (Louisiana, Oregon, Florida, New York, California, New Mexico, and Vermont) and the District of Columbia had ACA coverage through Medicaid expansion, Marketplace, or BHP in 2024. Meanwhile, fewer than 1 in 10 nonelderly residents of five states (Alabama, Kansas, Tennessee, Wisconsin, and Wyoming) had coverage through one of these three ACA programs (Figure 1). With the exception of Florida, the states with the largest ACA enrollment as a share of population had adopted the Medicaid expansion. The five states with the lowest share of enrollment were Medicaid non-expansion states.

In 2024, 1 in 6 nonelderly people had health coverage through the Affordable Care Act (ACA).

From 2020 to 2024, total enrollment in ACA programs (Medicaid expansion, Marketplace, and Basic Health Plan) increased by nearly 60%, with the largest increase among Marketplace enrollees. Growth in Marketplace enrollment from 2020 can be largely attributed to the temporary enhanced subsidies that were made available in 2021 and extended through 2025. Marketplace enrollment growth was greatest among states that have not expanded Medicaid. Meanwhile, Medicaid expansion enrollment similarly increased due to more states implementing expansion (seven states — Idaho, Missouri, Nebraska, North Carolina, Oklahoma, South Dakota, and Utah — implemented Medicaid expansion during or after 2020), and because of the pause in disenrollments from the continuous enrollment provision. Even with the unwinding of the Medicaid continuous enrollment provision that was still in play through March 2024, enrollment in Medicaid expansion is currently higher than it was in 2020. The number of Marketplace enrollees increased by 10 million people nationally, almost doubling, between 2020 and 2024, and the number of Medicaid expansion enrollees increased by 6.2 million people. In 2024, Marketplace consumers made up 49% of all people enrolled in ACA coverage compared to 42% in 2020 (Figure 2).

Total Number of People Enrolled in ACA Coverage Through the Marketplaces, Basic Health Plans, and Medicaid Expansion, 2020 and 2024

From 2020 to 2024, the rate of growth in ACA enrollment varied widely by state, more than doubling in some states while changing very little in others. Enrollment across the three ACA programs more than doubled from 2020 to 2024 in twelve states: Missouri (243%), Oklahoma (227%), Texas (212%), Mississippi (190%), North Carolina (185%), Georgia (181%), Tennessee (177%), South Carolina (167%), South Dakota (155%), Alabama (141%), Florida (120%), and Nebraska (113%, Figure 3). Meanwhile, other states saw less than 20% growth over those four years: Washington (19%), Rhode Island (18%), Kentucky (17%), Colorado (17%), the District of Columbia (16%), Montana (14%), New Mexico (11%), and Massachusetts (10%).

Percent Change in ACA Coverage Enrollment in the Marketplaces, Basic Health Plans, and in the Medicaid Expansion, 2020-2024

Of the ten states with the largest increase in ACA program enrollment from 2020 to 2024, all were won by President Trump in the 2024 election, and none had expanded Medicaid before 2020. In non-expansion states, individuals with incomes between 100% and 138% FPL are eligible for subsidized Marketplace coverage, and with the enhanced subsidies making the coverage more affordable by providing coverage with $0 premiums, more people enrolled. All non-expansion states, except Wisconsin, and all states that adopted Medicaid expansion in 2020 or later, except Idaho, had increases in ACA enrollment that exceeded the national increase of 61%. (Wisconsin Medicaid eligibility extends to 100% FPL so there is no coverage gap.) Meanwhile, many of the states with lower enrollment growth over the last four years have long embraced the ACA (adopting Medicaid expansion early on and creating their own state-based Marketplaces), so they started out with relatively high shares of their populations already enrolled in ACA coverage in 2020 (Table 1).

Enrollment in ACA Coverage Through the Marketplaces, Basic Health Plans, and Medicaid Expansion, 2020-2024

How do Medicaid Home Care Programs Support Family Caregivers?

Authors: Alice Burns, Abby Wolk, Molly O'Malley Watts, and Maiss Mohamed
Published: Jan 13, 2025

Issue Brief

KFF estimates that 4.5 million people use Medicaid home care, which provides medical and supportive services to help people with the activities of daily living (such as eating and bathing) and the instrumental activities of daily living (such as preparing meals and managing medications). Medicare generally does not cover home care (also known as home- and community-based services or HCBS), and Medicaid paid for two-thirds of home care spending in the United States in 2022. In Medicaid home care, many people “self-direct” their services, giving them greater autonomy over the types of services provided and who they are provided by; and in some cases, allowing payments to family caregivers. Beyond paying for their caregiving, Medicaid supports family caregivers with services such as training, support groups, and respite care (which is paid care that allows family caregivers to take a break from their normal responsibilities). According to a document made public by Politico, House Republicans are considering reducing Medicaid spending by $2.3 trillion over 10 years, which represents a nearly one-third reduction in Medicaid spending. Cuts of that magnitude would limit states’ ability to continue supporting family caregivers.

This issue brief describes the availability of self-directed services and supports for family caregivers in Medicaid home care. (It is unknown how many people are receiving paid care from family and friends, or how many family caregivers are receiving supports from Medicaid.) The data come from the 22nd KFF survey of officials administering Medicaid home care programs in all 50 states and the District of Columbia, which states completed between April and October 2024. The survey was sent to each state official responsible for overseeing home care benefits (including home health, personal care, and waiver services for specific populations such as people with physical disabilities). All states except Florida, Indiana, and Utah responded to the 2024 survey, but response rates for certain questions were lower. Key findings include:

  • All reporting states except Alaska allow Medicaid enrollees to self-direct their home care in at least some circumstances, and among those states all allow enrollees to select, train, and dismiss their caregivers.
  • All responding states (which includes the District of Columbia) pay family caregivers under some circumstances and provide family caregivers with other types of support, including respite care (Figure 1, Appendix Table 1)
  • Family supports are most widely available for caregivers of people with intellectual or developmental disabilities.

All Responding States Pay Family Caregivers Under Some Circumstances

Self-directed services and payments to family caregivers are one of the tools states are using to address shortages of direct care workers, including those who work in home and community settings. Shortages and high turnover rates among the direct care workforce reflect demanding work and low wages. The COVID-19 pandemic escalated an existing workforce challenge for Medicaid home care, and states used new federal funding and flexibility to maintain service levels by increasing self-directed services and payments to family caregivers. Although the pandemic-era flexibilities have ended and the extra funding is winding down, states continue to provide wide-ranging support to family caregivers through Medicaid home care programs.

There is bipartisan support for family caregivers, but funding for programs that support family caregivers is at risk under proposals to cut Medicaid spending by a third. In recent years, there has been bipartisan support for family caregivers, and Congress enacted 2018 law to create a Family Caregiving Advisory Council. The Council’s 2024 report notes that family caregivers are the backbone of the nation’s long-term care system, and that without support, the health, well-being, qualify of life, and finances of family caregivers often suffer. In keeping with bipartisan recognition of the role of family caregivers in the long-term care system, President-elect Trump proposed new supports for family caregivers prior to the election. However, those supports are at risk under Republican proposals to reduce Medicaid spending by $2.3 trillion over 10 years. Over half of Medicaid spending is for the types of Medicaid enrollees most likely to use home care and related services, and major cuts to Medicaid will have implications for their care. States may be forced to reduce spending on Medicaid by eliminating coverage for some people; covering fewer services, and (or) cutting payment rates to providers and supports for family caregivers.

Which states allow Medicaid enrollees to self-direct their home care and for what services?

Nearly all states allow Medicaid enrollees to self-direct their home care in some circumstances (Figure 2, Appendix Table 2). Self-direction came out of the “consumer-directed” movement for personal care services that started with demonstration programs in 19 states funded through grants from the Robert Wood Johnson Foundation. Today, states may give people the option to self-direct home care through a wide variety of optional home care programs. States most frequently allow self-direction in waivers that serve people with intellectual or developmental disabilities, followed by people who are ages 65 and older or have physical disabilities. Among the 48 states responding to KFF’s survey, Alaska is the only reporting state that does not permit self-direction under any of the home care programs.

Nearly All States Allow Individuals to Self-Direct Home Care Under at Least One Program

Among states that authorize self-direction, all states allow enrollees to select, dismiss, and train workers (Figure 3). The ability to select, train, and dismiss workers is referred to as “employer authority” because it allows Medicaid enrollees (with the help of their designated representatives when appropriate) to decide who will be caring for them. All states with self-directed services programs provide employer authority to enrollees. Most states also allow enrollees to establish payment rates for their caregivers (38) and to determine how much Medicaid funding is spent among the various authorized services (36).

All States with Self-Directed Home Care Programs Allow Enrollees to Select their Caregivers

Which states pay family caregivers and through which home care programs?

All responding states pay family caregivers through one or more Medicaid home care programs (Figure 1, Appendix Table 1). Payments for family caregivers are generally allowed for the provision of personal care, which may be offered through several different types of Medicaid HCBS programs. Personal care may be provided through waivers such as 1115 or 1915(c) programs, through the Medicaid state plan, or a combination of both. Waiver services tend to encompass a wider range of benefits than the state plan benefit, but waivers are usually restricted to specific groups of Medicaid enrollees based on geographic region, income, or type of disability; and are often only available to a limited number of people, resulting in waiting lists.

All responding states allow payments to family and friends through one or more waiver programs, but fewer states allow payments to legally responsible relatives. Forty states allow payments to legally responsible relatives through waiver programs, and only six states allow payments to legally responsible relatives through the state plan. Payments to other family and friends are also less common through the state plan—allowed by only 22 states. The less common payments to family caregivers through the state plan is because not all states provide personal care through the state plan, and because the legal requirements governing state plan services differ from those governing waiver services.

What are the legal requirements for paying family caregivers?

Medicaid laws have more complicated requirements for states to pay legally responsible relatives than is the case for other types of family and friend caregivers. The specific legal requirements for paying family caregivers are complicated and differ across home care programs:

• For personal care offered through the state plan using section 1905 authority, there is a federal prohibition on paying for services provided by spouses and parents of minor children. Other family and friends may be paid if they meet applicable provider qualifications, there are strict controls on the payments, and the provision of care is justified (which can be done when there is a lack of other qualified providers in the area).

• For home care offered through waiver programs, states may pay legally responsible relatives when the services being provided are “extraordinary care,” which is defined as care that exceeds the range of activities a legally responsible relative would ordinarily perform and is necessary to health, welfare, and avoiding institutionalization. All family and friends who are paid must meet similar requirements as to those governing personal care in the state plan.

• For personal care offered through the state plan using one of the section 1915 authorities, states may pay legally responsible relatives using criteria like those of the waiver programs. Some of those authorities designate a family member as a legal representative and in some cases, family members who are legal representatives may not also be paid caregivers.

Payments for family caregivers are most common under waivers for people with intellectual or developmental disabilities (Figure 4, Appendix Table 3). Among the 45 states that responded to the survey and have waivers for people with intellectual or developmental disabilities, 44 allow payments to family caregivers. There are fewer states with other types of waivers, and the percentage of those states that allow payments to family caregivers is also lower – 39 states for waivers serving adults who are ages 65 and older or have physical disabilities, 17 states for people with traumatic brain or spinal cord injuries, and less states for other types of waivers.

Among Waivers and Programs, States are Most Likely to Pay Family Caregivers for People with Intellectual or Developmental Disabilities

In most cases, family caregivers receive hourly wages like those of other employees, but 10 states have adopted programs known as structured family caregiving, in which family members are paid a per diem rate (Appendix Table 4). Structured family caregiving is a Medicaid benefit that supports unpaid caregivers of people who use Medicaid home care through waiver programs. In the structured program, Medicaid pays provider agencies a daily stipend for participants. The agency is responsible for directing a care coordinator or social worker and a nurse to oversee the family caregiver, answer health-related questions, and provide emotional support; conducting home visits about once per month; and passing a fixed percentage of the stipend (usually 50% – 65%) on to the family caregiver. Among the handful of payment rates reported in an overview of the program by the American Council on Aging, payments to family members are around $40 or $50 per day. States reported structured family caregiving programs in the following waivers:

  • Seniors and people with disabilities in 7 states (Connecticut, Georgia, Indiana, Louisiana, North Carolina, North Dakota, and South Dakota),
  • People with intellectual and developmental disabilities in 3 states (Indiana, Maryland, and New Mexico),
  • Medically fragile children in North Carolina, and
  • People with Alzheimer’s and related disorders in Missouri.

What other types of support does Medicaid home care provide for family caregivers?

All responding states provide support for family caregivers—who may be paid or unpaid—and most offer more than one type of support (Figure 5, Appendix Table 5). The most commonly covered benefit was respite care (offered by 47 states—all responding states except for Oregon), which provides short-term relief for caregivers, allowing them to rest, travel, attend appointments, or spend time with other family and friends. Other commonly covered benefits include caregiver training (33 states), and counseling or support groups (23 states).

All Responding States Provide Supports for Family Caregivers Through Medicaid Home Care

Respite care may be provided anywhere from a few hours to several weeks at a time. Medicare only covers respite care for people who are receiving hospice care, which is only available for people who are terminally ill and electing to receive comfort care instead of curative care for their illness. That makes Medicaid’s respite care the primary source of coverage for caregivers of people with Medicare and Medicaid. Respite care is offered most frequently under waivers for people with intellectual or developmental disabilities (42 states) and seniors and people with disabilities (38 states).

Daily respite care is offered by the most states (40), followed by institutional respite care (offered by 35), but different types of waivers tend to rely more heavily on different types of respite care (Figure 6, Appendix Table 6). Daily respite care is available under waivers for people with intellectual and developmental disabilities in 31 states but only available in 26 states within waivers for people who are ages 65 and older or have physical disabilities. Alternatively, 26 states provide institutional respite care within waivers for people who are ages 65 and older or have physical disabilities but only 19 states do so within waivers for people with intellectual and developmental disabilities. Weekly respite care is the least frequently offered, and over half of states (30) report offering other types such as hourly, monthly, or annual. Some states reported covering respite care through adult day centers or overnight camps.

Among Waivers and Programs, States are Most Likely to Offer Daily Respite Care

This work was supported in part by Arnold Ventures. KFF maintains full editorial control over all of its policy analysis, polling, and journalism activities.

Appendix

States' Policies to Allow Medicaid Home Care Payments to Spouses, Parents of Minor Children, and Other Legally Responsible Relatives for Caregiving

States' Policies to Allow Individuals to Self-Direct Medicaid Home Care by Waiver/Program

States' Policies to Allow Medicaid Home Care Payments to Spouses, Parents of Minor Children, and Other Legally Responsible Relatives as well as Family and Friends for Caregiving

States Offering the Structured Family Caregiver Program, Which Supports Unpaid Caregivers of Persons Who are Using Medicaid Home Care, and Waivers the Program is Offered Under

States’ Policies for Offering Different Types of Family Caregiving Supports

Types of Respite Care Offered by State and Home Care Program: Daily, Weekly, Institutional, and Other

Section 1115 Waiver Watch: A Look at the Use of Contingency Management to Address Stimulant Use Disorder

Published: Jan 9, 2025

This analysis was updated on January 9, 2025 to reflect the approval of Hawaii’s waiver.As of 2019, over 800,000 Medicaid enrollees between the ages of 12 to 64 had a diagnosed stimulant use disorder that was recorded in Medicaid claims data (though this is likely an undercount). Stimulant use disorder—which can involve dependence on cocaine, methamphetamine, or other psychostimulants, like prescription stimulants—can lead to severe physical and psychological complications. Unlike opioid and alcohol use disorders, there are no FDA-approved medications for treatment, limiting treatment options for those affected. A November 2023 report from the Assistant Secretary for Planning and Evaluation (ASPE) included recommendations to expand “contingency management.”

Contingency management is an evidence-based psychosocial intervention that uses motivational incentives, such as vouchers or gift cards, to encourage recovery behaviors like stimulant abstinence and treatment session (e.g., cognitive behavioral therapy, group therapy) attendance. According to the American Society of Addiction Medicine, contingency management is the current evidence-based standard of care for treatment of stimulant use disorder. However, access through most payers, including Medicaid, remains limited. CMS policy only allows states to add contingency management coverage through Medicaid 1115 demonstration waiver authority.

The Biden administration has approved five state contingency management waivers (California, Delaware, Hawaii, Montana, and Washington); two additional state contingency management requests are currently pending federal review. These waivers are primarily for the treatment of stimulant use disorder. It is uncertain if these waivers will be a priority under the next Trump administration. This waiver watch briefly explains what contingency management is and summarizes contingency management 1115 waiver approvals to-date.


What is contingency management?

Contingency management is a treatment for stimulant use disorder that uses incentives (e.g., gift cards or vouchers) to reward patients for meeting treatment goals, such as stimulant abstinence. For instance, a contingency management treatment plan may involve weekly urine drug tests, with immediate rewards for negative results. Contingency management can also be combined with other therapies, such as cognitive behavioral therapy, with incentives tied to participation in treatments like group therapy or counseling sessions. The American Society of Addiction Medicine recognizes contingency management as the current standard of care for stimulant use disorder due its strong evidence base. Currently, there are no medication treatment options available for stimulant use disorder. Contingency management can also be used as a treatment or support for other types of substance use disorders, such as improving adherence to medication for opioid or alcohol use disorders. Although the Department of Veterans Affairs began implementing contingency management over a decade ago, access through most payers, including Medicaid, remains limited.


How are states using Section 1115 waivers to provide contingency management?

In December of 2021, CMS approved the first contingency management waiver in California and has since approved contingency management waivers in four additional states (Delaware, Hawaii, Montana, and Washington). Two states currently have pending contingency management requests (Michigan and Rhode Island). In waiver approvals, CMS clarifies that for the purposes of these demonstrations, motivational incentives do not violate federal rules that prohibit or limit providers from offering incentives to patients, and contingency management is considered a Medicaid-covered item or service based on the available scientific evidence for treating a substance use disorder. Some states, such as Montana and Washington, are using waivers to build upon successful state contingency management pilots that are grant or state funded, or funded using opioid settlement funds. Key waiver approval details include (Table 1):

  • Eligibility. All states with current approvals cover contingency management treatment services for people with stimulant use disorder. In some states, contingency management will also be used for people with other types of substance use disorders alongside FDA approved medication-assisted treatment for opioid or alcohol use disorders to improve treatment adherence. CMS notes medication-assisted treatment should be prioritized for opioid and alcohol use disorders.
  • Program length. State approvals range from 12-week programs to 64-week programs (based on target population).
  • Incentive amounts. Gift cards (e.g., to Walmart or other retailers) begin at $10-$12 and increase with each week the participating beneficiary demonstrates non-use of stimulants but are “reset” back to the base amount if a participant submits a positive sample or has an unexcused absence. (Motivational incentives earned through these programs do not count towards gross countable income for determining Medicaid eligibility).

All waiver approvals include protections such as staff training requirements, incentive restrictions, and protections against fraud and abuse. Waiver special terms and conditions detail the following requirements for all states:

  • Providers. Contingency management benefits are to be delivered through behavioral health providers approved by the state. States must conduct provider readiness reviews to ensure that providers are able to offer contingency management benefit in accordance with state standards. Staff providing or overseeing contingency management benefits must participate in contingency management-specific training.
  • Incentive restrictions. Restrictions must be placed on incentives so they cannot be used to purchase cannabis, tobacco, alcohol, or lottery tickets.
  • Provider fraud and abuse protections. To protect against fraud and abuse, states must set standard incentive amounts (i.e., providers will not have discretion to set these amounts). States also must use secure incentive management tools with safeguards against fraud and abuse that automatically calculate incentive amounts and generate incentives for patients based on drug test results inputted by the coordinator.

Of the 800,000 Medicaid enrollees aged 12 to 64 with a diagnosed stimulant use disorder recorded in Medicaid claims data in 2019, about 22% were residing in states that now have approved 1115 waivers for contingency management services (California, Delaware, Hawaii, Montana, Washington). If the currently pending waivers (Michigan and Rhode Island) are also approved, this coverage could extend to 26% of enrollees with a diagnosed stimulant use disorder. However, these numbers likely underestimate the total number of Medicaid enrollees with a stimulant use disorder, as not all individuals are screened, and diagnoses are not always recorded. Not all individuals with stimulant use disorder in these states will be eligible for or receive contingency management services. In California, 3,255 people received contingency management services from the launch of the program in April 2023 to June 2024.

Summary Of Approved Section 1115 Contingency Management Waivers

How State Policies Shape Access to Abortion Coverage

(Updated January 8, 2025 with new updates for Minnesota) 

State and federal efforts to limit abortion coverage began soon after the 1973 Supreme Court’s Roe v Wade decision. In 1977, the Hyde Amendment banned federal funding for abortion, with exceptions for pregnancies that endanger the life of the woman, or result from rape or incest. Some states use their own funds to cover other medically necessary abortions under Medicaid or have been compelled to do so by the courts. The passage of the ACA in 2010 led to renewed legislative efforts to limit abortion coverage, this time in private insurance plans. The ACA maintains the Hyde Amendment’s limits, and permits states to ban abortion coverage from Marketplace plans. Since 2010, many states have enacted private plan restrictions and also banned abortion coverage from Marketplace plans, some of which are more restrictive than the Hyde limitations. A handful of states, however, have enacted laws that require Medicaid and private plans to cover abortion.

The interactive map below shows the increase in states with laws restricting abortion coverage in Medicaid and private insurance in 2010 compared to the present.

Medicaid Coverage Limitations (35 states & DC) – State limits Medicaid coverage of abortion to the Hyde Amendment restrictions (only allowed in the cases of rape, incest or life endangerment).

Private Insurance Coverage Limitations (5 states) – State has a law that prohibits coverage of abortions from being included in private insurance policies sold in the state (with certain exceptions). Private insurance includes individual, small group, and large group. Some states may allow abortion coverage to be purchased as a rider.

State Marketplace Coverage Limitations – State has a law that prohibits plans sold on state Marketplaces from covering abortion (with certain exceptions).

No Coverage Limitations (14 states) – State does not limit coverage of abortion in private insurance or the state Marketplace and the state Medicaid program permits the use of state funds (non-federal) to pay for abortion in circumstances outside of those allowed by the Hyde Amendment.

Requires Abortion Coverage in Medicaid and Private Plans (1 state) – State has a law that requires all fully-insured group plans and individual plans to include abortion coverage.

How State Policies Shape Access to Abortion Coverage

(Updated January 8, 2025 with new updates for Minnesota) 

State and federal efforts to limit abortion coverage began soon after the 1973 Supreme Court’s Roe v Wade decision. In 1977, the Hyde Amendment banned federal funding for abortion, with exceptions for pregnancies that endanger the life of the woman, or result from rape or incest. Some states use their own funds to cover other medically necessary abortions under Medicaid or have been compelled to do so by the courts. The passage of the ACA in 2010 led to renewed legislative efforts to limit abortion coverage, this time in private insurance plans. The ACA maintains the Hyde Amendment’s limits, and permits states to ban abortion coverage from Marketplace plans. Since 2010, many states have enacted private plan restrictions and also banned abortion coverage from Marketplace plans, some of which are more restrictive than the Hyde limitations. A handful of states, however, have enacted laws that require Medicaid and private plans to cover abortion.

The interactive map below shows the increase in states with laws restricting abortion coverage in Medicaid and private insurance in 2010 compared to the present.

On June 24, 2022, the Supreme Court overturned Roe v. Wade, eliminating the federal constitutional standard that had protected the right to abortion. States can now set their own policies to ban or protect abortion. As of January 8, 2025, 12 states have banned abortion (Alabama, Arkansas, Idaho, Indiana, Kentucky, Louisiana, Mississippi, Oklahoma, South Dakota, Tennessee, Texas, and West Virginia). For more details about legal status of abortion in states, please visit our Abortion in the United States Dashboard.

Medicaid Coverage Limitations (30 states & DC) – State limits Medicaid coverage of abortion to the Hyde Amendment restrictions (only allowed in the cases of rape, incest or life endangerment).

Private Insurance Coverage Limitations (10 states) – State has a law that prohibits coverage of abortions from being included in private insurance policies sold in the state (with certain exceptions). Private insurance includes individual, small group, and large group. Some states may allow abortion coverage to be purchased as a rider.

State Marketplace Coverage Limitations (25 states) – State has a law that prohibits plans sold on state Marketplaces from covering abortion (with certain exceptions).

No Coverage Limitations (8 states) – State does not limit coverage of abortion in private insurance or the state Marketplace and the state Medicaid program permits the use of state funds (non-federal) to pay for abortion in circumstances outside of those allowed by the Hyde Amendment.

Requires Abortion Coverage in Medicaid, Private and ACA Marketplace Plans (12 states) – State requires all fully-insured group plans and individual plans to include abortion coverage. Nine of these states require no cost-sharing for abortion—Illinois, Minnesota, and New Jersey allow cost sharing if there is cost-sharing for similar services in the plan. Effective January 1, 2026, Illinois will prohibit cost-sharing for abortion services. In Colorado, individual and small group health plans are required to include abortion coverage beginning July 24, 2025, but are encouraged to begin coverage in January 2025.

Community Health Center Patients, Financing, and Services

Authors: Akash Pillai, Bradley Corallo, and Jennifer Tolbert
Published: Jan 6, 2025

Key Takeaways

Community health centers are a national network of over 1,300 safety-net primary care providers, serving more than 31 million patients in 2023. They are located in medically underserved urban and rural communities and serve all patients regardless of their ability to pay, providing a range of medical, behavioral, and supportive services. This brief reports on health center patients, services, experiences, and financing in 2023 and analyzes changes from 2019 (pre-pandemic) through 2023 using data from the Uniform Data System (UDS), to which all health centers are required to report annually, and the 2022 Health Center Patient Survey. Key takeaways include the following:

  • The health center patient population increased to over 31 million patients in 2023, up slightly from 30.5 million in 2022. While the number of children served at health centers increased to over 9.1 million in 2023, this remains slightly lower than the 9.2 million served pre-pandemic in 2019, possibly reflecting overall reduced utilization of primary and preventive services among children on Medicaid.
  • Health centers disproportionately served low-income people, people of color, and rural residents. In 2023, 90% of patients had incomes that were at or below 200% of the federal poverty level (FPL), and 40% were Hispanic patients, 17% were Black patients, and 4% were Asian patients. In addition, over three in ten (31%) patients were rural residents.
  • From 2019 to 2023, the share of patients who were uninsured dropped from 23% to 18%, while the share of patients covered by Medicaid increased from 49% to 51%, likely due to the Medicaid continuous enrollment provision, which temporarily halted Medicaid disenrollments from March 2020 through March 2023. The share of patients with private coverage and Medicare also increased modestly.
  • Medicaid was the largest revenue source for health centers, accounting for 43% of the $46.7 billion in total health center revenue in 2023, but revenue by payer source varies by state. From 2019-2023, health center revenue increased due to the availability of COVID-19 funding and increased payments from payers. However, net margins after costs fell from 4.5% in 2022 to 1.6% in 2023.
  • About 66% of visits were for medical services and 13% were for mental health and substance use disorder (SUD) services. Patients continued to return to in-person care; however, health centers conducted 5 million visits (13%) via telehealth in 2023. Telehealth visits dropped by nearly half from the peak of 28.5 million visits (25%) in 2020 at the start of the COVID-19 pandemic.
  • Most patients report positive experiences at health centers, with over nine in ten patients reporting that they were treated with respect. However, Black and Hispanic patients were less likely than White patients to report that health center doctors or health professionals explained things in a way that was easy to understand.

Since 2019, health centers have seen a steady rise in the share of their patients who have health coverage and have experienced stable financing; however, potential changes to the Medicaid program could reverse those trends. Changes that would impose new barriers to Medicaid enrollment or alter how the program is financed that may be adopted by the incoming Trump administration or Congress in 2025 would likely lead to an increase in the number of uninsured patients and a loss of Medicaid funding for health centers that could ultimately undermine access to primary care in medically underserved urban and rural areas.

Health Center Patients

In 2023, 1,363 health center organizations served more than 31 million patients at over 15,600 service delivery sites (Figure 1). Roughly six in ten health centers served patients in medically underserved urban areas, while four in ten served rural communities. Nearly three-quarters (73%) of health centers provided care to 25,000 or fewer patients while 3% of health centers served 100,000 or more patients in 2023. Generally, smaller health centers are located in rural areas or focus services on certain neighborhoods or populations, while larger health centers tend to serve more urban areas and operate multiple clinic locations.

Interactive DataWrapper Embed

Health centers served over 9.1 million children in 2023, an increase of 3.4% from 2022, but still lower than the number of children served prior to the pandemic (Figure 2). The number of child patients ages 0-17 dropped in 2020 likely due to temporary site closures and social distancing guidance at the start of the COVID-19 pandemic. While the number of adult health center patients quickly rebounded after plateauing in 2020, the number of children served by health centers has been slower to recover. There is evidence indicating that utilization of primary and preventive services among children on Medicaid remains below pre-pandemic levels, which may partially explain the drop in pediatric patients at health centers. Although still a small share of the total patient population, the number of adult patients ages 65+ grew by nearly 30% or over 800,000 from 2019-2023.

Health Center Patients by Age Group, 2019-2023

A majority of health center patients live in low-income households (Figure 3). Reflecting the mission of health centers to serve anyone regardless of ability to pay, nine in ten patients served at health centers had incomes that were at or below 200% of the federal poverty level (FPL) and two-thirds of patients (67%) had incomes at or below the poverty level in 2023 (the poverty level was $30,000 for a family of four in 2023). The share of low-income patients served at health centers is roughly three times that of the U.S. population, in which 28% of individuals lived in households earning under 200% FPL in 2023.

Health Center Patients by Income Status, 2023

Most health center patients (63%) are people of color, but there are differences between urban and rural health centers in the racial and ethnicity of patients (Figure 4). Across all health centers, Hispanic patients comprised the largest share of patients at 40%, followed by White patients (37%), Black patients (17%), Asian patients (4%), and all other patients (3%). However, the share of health center patients who are patients of color is higher at health centers in urban areas compared to those in rural areas, reflecting differences in the characteristics of people with low-income across the two settings. Patients of color comprise a majority (75%) of patients at urban health centers while White patients represent the majority (61%) of patients at rural health centers.

Race and Ethnicity of Health Center Patients in Urban and Rural Settings, 2023

Health centers served millions of patients who were part of special populations with distinct health needs in 2023 (Figure 5). The Health Resources and Services Administration (HRSA), which administers the health center program, provides targeted funding for health centers that serve certain populations identified as underserved by the federal government, including migratory agricultural workers and people experiencing homelessness. In 2023, health centers served 1.4 million patients experiencing homelessness (5% of all patients) and 1 million agricultural workers (3% of all patients). In addition, health centers are also required to report data on other populations with known challenges accessing primary care. For example, three in ten patients (31% or 9.7 million) were rural residents, which is higher than the 20% of the U.S. population living in rural areas, and roughly a quarter of patients (27% or 8.4 million) were best served in a language other than English.

Health Center Patients by Selected Special Populations, 2023

Health Center Patient Coverage and Financing

Fewer than one in five health center patients were uninsured in 2023, continuing the decline in the share of uninsured patients since the start of the pandemic in 2020 (Figure 6). As safety-net providers, health centers serve many patients who are uninsured, enrolled in Medicaid, or who otherwise have difficulty affording care. From 2019 to 2023, the share of uninsured patients dropped from 23% to 18%, while the share of Medicaid patients increased from 49% to 51% and the share of both privately insured and Medicare patients increased. The drop in uninsured patients is likely attributable to the effects of pandemic-era coverage protections, including the Medicaid continuous enrollment provision, which temporarily halted Medicaid disenrollments from March 2020 through March 2023, and enhanced subsidies for Marketplace coverage, enacted in 2021 and extended through 2025. After March 2023, states resumed disenrollments as part of the unwinding of continuous enrollment in Medicaid, and national Medicaid/CHIP enrollment has since declined. Because the unwinding was still ongoing into 2024, the full effect on health center patients’ health coverage will not be clear until data for 2024 and 2025 are available.

Health Coverage Among Health Center Patients, 2019-2023

In 2023, total health center revenue was $46.7 billion, with Medicaid comprising the largest source of funding (Figure 7). Over two-thirds (68%) of health center revenue came from payments from Medicaid, private insurance, Medicare and self-pay patients, with Medicaid accounting for over 60% of patient care revenue and 43% of total revenue. Federal Section 330 grant funding, which supports health centers’ role as safety net providers, made up 11%. COVID-19 funding, which is set to expire after 2023, accounted for 4% of total revenue. Research suggests that the impact of the expiration of these funds on health center financing may be greater for health centers located in rural areas and in the South, and those with higher shares of sicker, uninsured, and unhoused patients because they generally received higher COVID-19 funding on a per patient basis.

Health center revenue has increased since 2019 in part because of the availability of COVID-19 funding and other supplemental funding during the pandemic. Revenue from payers has also increased in response to the growth in patients. Although Medicaid remains the largest source of funding, Medicaid revenue as a share of total health center revenue decreased from 44% in 2019 to 43% in 2023 (Figure 7). At the same time, payments from private insurance and Medicare both increased as a share of total revenue. In contrast, Federal Section 330 grant funding remained relatively flat, increasing by only $200,000 over the four years and dropping from 16% to 11% of total revenue.

Health Center Revenue by Payer Source, 2019 - 2023

After rising during the pandemic, the national health center net margin fell to 1.6% in 2023 (Figure 8). The increase in health centers’ net margins, which account for both costs and revenue and are reported as a percentage of revenue, was driven primarily by the increase in COVID-related and other supplemental funding during the pandemic. The drop in the net margin in 2023, which is still slightly higher than the margin in 2019, reflected higher costs due to inflation as well as the expiration of COVID-19 funding.

Health Center Net Margins, 2019-2023

Health Center Services

Health centers provided more than 132 million visits in 2023 (Figure 9). Most visits (66%) were for medical services, though health centers also provided a wide range of other clinical and supportive services, including mental health and substance use disorder (SUD) services (13%), dental services (12%), vision services (1%), and other professional services (3%), which include services such as nutrition counseling, physical therapy, and traditional healing. Enabling or supportive services, which are non-clinical services like case management, transportation, and health education that facilitate access to care, represented 6% of all visits. Health centers are required by federal law to provide primary care and supportive services, and they may offer dental, vision, or other services depending on patient need and organizational capacity.

Health Center Visits by Service Type, 2023

More patients are returning to in-person care but reliance on telehealth continues. In 2023, health centers provided 17.5 million telehealth visits, which represented 13% of all visits (Figure 10). The number of telehealth visits peaked in 2020 at the start of the coronavirus pandemic when 28.5 million visits (25%) were conducted via telehealth but has declined every year since. Despite the decrease, telehealth still represents an important way for patients to access health center services in 2023, particularly since some patients face geographic and transportation barriers that can make it more difficult for them to attend in-person visits.

Telehealth and In-Person Visits to Health Centers, 2019-2023

Roughly two-thirds (68%) of adult patients have utilized supportive services that are designed to reduce socioeconomic barriers to health care. According to a 2022 survey of health center patients, 65% of adult patients reported ever receiving certain medical-related assistance services and 22% reported ever receiving economic-related assistance through their health center (Figure 11). The medical-related assistance patients reported receiving included help arranging medical appointments outside of the health centers (46%), health education services (24%), free medication (19%), transportation to medical appointments (11%), interpretation during medical visits (8%), and home visits to discuss health needs (3%). Health center patients reported receiving economic-related assistance that included help applying for government benefit programs like Medicaid or nutrition assistance (17%), obtaining food (7%), finding a place to live (4%), obtaining clothing or shoes (3%), and finding employment (2%). Health centers provide economic-related services on-site or through referrals. While the survey identifies some of the most common types of supportive services, the list is not comprehensive.

Share of Adult Health Center Patients Who Report Ever Receiving Selected Supportive Services Through A Health Center, as of 2022

Health Center Patient Experience

Roughly eight in ten patients reported that they were able to get appointments as soon as they needed at health centers in 2022 (Figure 12). Based on self-reported responses, 60% of health center patients reported they were “always” able to get a check-up or routine care as soon as they needed while 21% said they could “usually” get care as quickly as needed. For patients who needed immediate or urgent care in the past year, three-quarters reported they were “always” (54%) or “usually” (21%) able to the care they needed right away.

Patient-Reported Access to Health Center Appointments, 2022

Across racial and ethnic groups, most health center patients reported positive experiences interacting with health center doctors and other professionals, but Black and Hispanic patients were less likely than White patients to say doctors or health professionals explained things in a way that was easy to understand (Figure 13). More than nine in ten health center patients (95%) reported that they were usually or always treated with respect by doctors or other professionals at health centers. There were no differences in the share of White, Black, and Hispanic adults who said they were treated with respect. Similarly, 93% of patients said health center staff usually or always listened to them, with no differences between White, Black, and Hispanic patients. These findings for health center patients contrast with other KFF research that shows Hispanic, Black, Asian, and American Indian or Alaska Native adults are more likely than White adults to report unfair treatment by a health care provider due to their race and ethnicity, which can negatively impact their health and well-being. However, Black and Hispanic patients were less likely than White patients to report that health center doctors or health professionals explained things in a way that was easy to understand.

Patient-Reported Experiences with Health Center Staff by Race and Ethnicity, 2022

How has U.S. Spending on Health Care Changed Over Time?

Published: Dec 20, 2024

This chart collection explores National Health Expenditure (NHE) data from the Centers for Medicare and Medicaid Services (CMS). These data offer insights into changes in health spending over time in the U.S., as well as the driving forces behind spending growth. The data specifically show how healthcare spending changed in 2023. A related interactive tool contains more of the latest NHE data.

The slideshow is part of the Peterson-KFF Health System Tracker, an online information hub dedicated to monitoring and assessing the performance of the U.S. health system.