Medicaid Enrollment & Spending Growth: FY 2025 & 2026
Issue Brief
States are facing a more tenuous fiscal climate due to slowing revenue growth and increasing spending demands in state fiscal year (FY) 2026. Recent shifts in economic conditions as well as recent federal actions, including cuts to safety net programs and tax code changes in the recently passed reconciliation law (H.R.1), changes to the Affordable Care Act (ACA) enhanced Marketplace subsidies, federal workforce cuts, and tariff changes, contribute to further fiscal uncertainty for states, though fiscal conditions and the impact of federal changes vary across states. For Medicaid, states are navigating the new “normal” for their programs following the expiration of pandemic-era policies while contending with shifts in state fiscal conditions and longer-term fiscal uncertainty. The Medicaid provisions in H.R.1 are estimated to reduce federal Medicaid spending by $911 billion (or by 14%) over a decade and increase the number of uninsured people by 7.5 million, though the impacts vary by state with spending cuts ranging from 4% to almost one-fifth of all federal Medicaid spending in some states. While many provisions in the new law, including some of the largest sources of federal Medicaid savings such as work requirements and financing changes, do not take effect until FY 2027 or later, many states noted they were anticipating the new law’s implementation and impact. Looking ahead, the challenging fiscal climate and the magnitude of federal Medicaid cuts will make it difficult for states to absorb or offset the reductions.
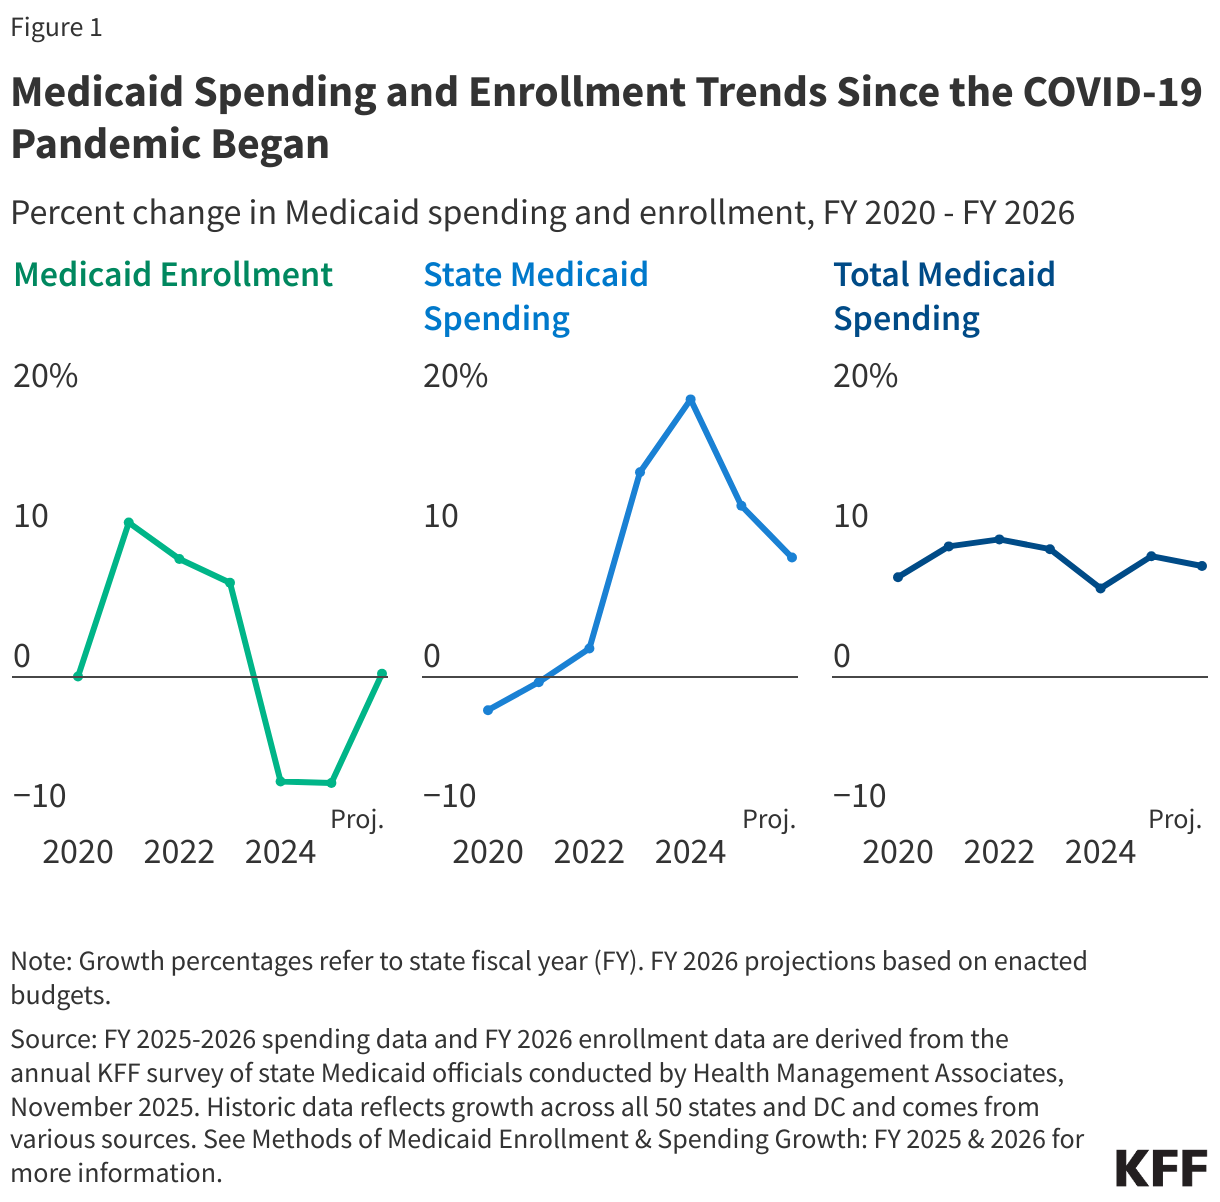
Leading up to FY 2026, states experienced significant changes in Medicaid spending and enrollment trends (Figure 1). For a three-year period following the onset of the COVID-19 pandemic, states provided continuous Medicaid enrollment in exchange for enhanced federal funding, resulting in record high Medicaid enrollment, declines in the uninsured rate, and shifts in Medicaid spending. Most states began the process of “unwinding” the continuous enrollment provision in late state fiscal year (FY) 2023, and the enhanced federal funding phased down through the end of 2023 (part way through FY 2024). Over the unwinding period, millions of people were disenrolled from Medicaid and enrollment and spending trends shifted once again. By midway through FY 2025, most states had completed unwinding and returned to more typical renewal operations.
This brief analyzes Medicaid enrollment and spending trends for FY 2025 and FY 2026, based on data provided by state Medicaid directors as part of the 25th annual survey of Medicaid directors. 48 states (including the District of Columbia) responded to the 2025 survey, although response rates for specific questions varied. More information on response rates and methodology can be found at the end of the brief. Most officials indicated that their spending projections reflect what is assumed in their states’ adopted budgets and do not account for the recently passed reconciliation law. Key survey findings include the following:
- Medicaid enrollment declined by 7.6% in FY 2025, driven primarily by the unwinding of the continuous enrollment provision. The completion of unwinding renewals as well as competing upward and downward enrollment pressures are expected to result in flat Medicaid enrollment growth (0.2%) in FY 2026.
- Total Medicaid spending growth was 8.6% in FY 2025 and is expected to slow slightly (7.9%) in FY 2026. States are experiencing several significant upward expenditure pressures that outweigh the downward pressure from Medicaid enrollment trends, including rate increases, higher health care needs among enrollees post-unwinding, and increasing long-term care, pharmacy, and behavioral health care costs.
- State Medicaid spending growth was 12.2% in FY 2025 and is projected to slow to 8.5% in FY 2026, similar to total spending growth levels and marking the end of shifts caused by pandemic-era enhanced federal funding. While most of the state (or non-federal) share of Medicaid spending comes from state general funds, there is considerable variation in how much states rely on other non-federal share funding sources and how they account for those other funding sources.
- Almost two-thirds of responding states at the time of the survey thought the chance of a Medicaid budget shortfall in FY 2026 was “50-50”, “likely”, or “almost certain.” A few states are implementing Medicaid spending cuts to address recent budget challenges, and other states may follow as they contend with potential Medicaid budget gaps and look ahead to the implementation of the Medicaid changes in H.R.1.
Context
Medicaid is the primary program providing comprehensive health and long-term care to one in five people living in the U.S. and accounts for nearly $1 out of every $5 spent on health care (and over half of all spending on long-term care). Medicaid is administered by states within broad federal rules and jointly funded by states and the federal government through a federal matching program with no cap. Medicaid is often central to state fiscal decisions as it is simultaneously a significant spending item as well as the largest source of federal revenues for states.
The pandemic, and the ensuing federal and state responses, led to significant changes in Medicaid enrollment and spending. Medicaid enrollment and spending typically increase during recessions, and, as in past economic downturns, Congress enacted legislation during the pandemic that temporarily increased the federal share of Medicaid spending (or “FMAP”) to help states maintain their Medicaid programs. In exchange, states were required to keep individuals continuously enrolled in the program, resulting in record high Medicaid enrollment. Gains in Medicaid as well as ACA Marketplace coverage contributed to significant declines in the uninsured rate. Following the end of the continuous enrollment provision on March 31, 2023 (late FY 2023 for most states), states began the process of “unwinding” (i.e., resuming historically typical eligibility redeterminations and disenrolling individuals found to be no longer eligible for Medicaid), resulting in millions being disenrolled from Medicaid. Most states had completed unwinding by midway through FY 2025, and total Medicaid and CHIP enrollment as of June 2025 was 77.7 million, a 18% decline from total enrollment in March 2023 but still 9% higher than enrollment levels in February 2020, prior to the pandemic. In addition, the enhanced FMAP phased down through end of 2023 (part way through FY 2024). In federal fiscal year (FFY) 2024, total Medicaid spending was $919 billion, with 35% financed by states and 65% paid by the federal government.
State fiscal conditions have also seen substantial shifts since the pandemic began. State economic conditions worsened rapidly when the pandemic hit but recovered quickly, leading to a period of record-breaking revenue and expenditure growth for states. Favorable state fiscal conditions combined with federal fiscal relief allowed states to build up rainy day funds and make investments and expansions, including to Medicaid programs. Given strong revenue growth and budget surpluses, states also adopted some of the largest tax cuts on record, with all almost all states enacting some kind of tax cut since 2021. However, these tax cuts combined with a weaker stock market performance and changes in inflation and consumer consumption patterns led to flat state revenue growth by FY 2023 and FY 2024. Revenue growth continued to slow in FY 2025, though revenue did exceed initial estimates in most states and state fiscal conditions remained generally stable.
For FY 2026, states are facing another year of slow revenue growth and uncertainty in their longer-term fiscal outlook. Enacted FY 2026 state budgets overall include modest increases in state general fund spending and total state spending. However, there is variation across states, with some state budgets including slight declines in total state spending and more budget management strategies like spending cuts or other cost containment measures. States are also contending with increasing spending demands from Medicaid, employee health care, education, housing, and disaster response. Recent changes in economic conditions as well as recent federal actions, including cuts to safety net programs and tax code changes in the recently passed reconciliation law, changes to the ACA enhanced Marketplace subsidies, federal workforce cuts, and tariff changes, have generated additional uncertainty, with some states revising revenue forecasts downward. State rainy day fund capacity is also beginning to decline following all-time highs, though funds remain stronger than before the pandemic. Overall, states appear to be in stable fiscal condition but are facing tighter budget conditions and longer-term fiscal uncertainty.
Trends in Enrollment Growth
Medicaid enrollment declined by 7.6% in FY 2025 but is expected to flatten, growing by only 0.2%, in FY 2026 (Figure 2). Following the onset of the COVID-19 pandemic and start of the Medicaid continuous enrollment provision, enrollment rose sharply in FY 2021 and continued to grow, though more slowly, through FY 2023. Once the continuous enrollment provision ended and states began unwinding-related eligibility redeterminations, Medicaid enrollment declined in FY 2024 and again in FY 2025. Most states either completed unwinding redeterminations by FY 2024 (two-thirds of states) or by midway through FY 2025 (another one-sixth of states), with the remainder noting their redeterminations continued through the second half of FY 2025 or would continue into FY 2026. Medicaid enrollment growth is projected to be flat in FY 2026, though Medicaid enrollment remains above pre-pandemic levels in many states. Notably, there was little variation in state reported enrollment growth rates for FY 2026 (see Methods), with most states reporting little to no growth in enrollment.
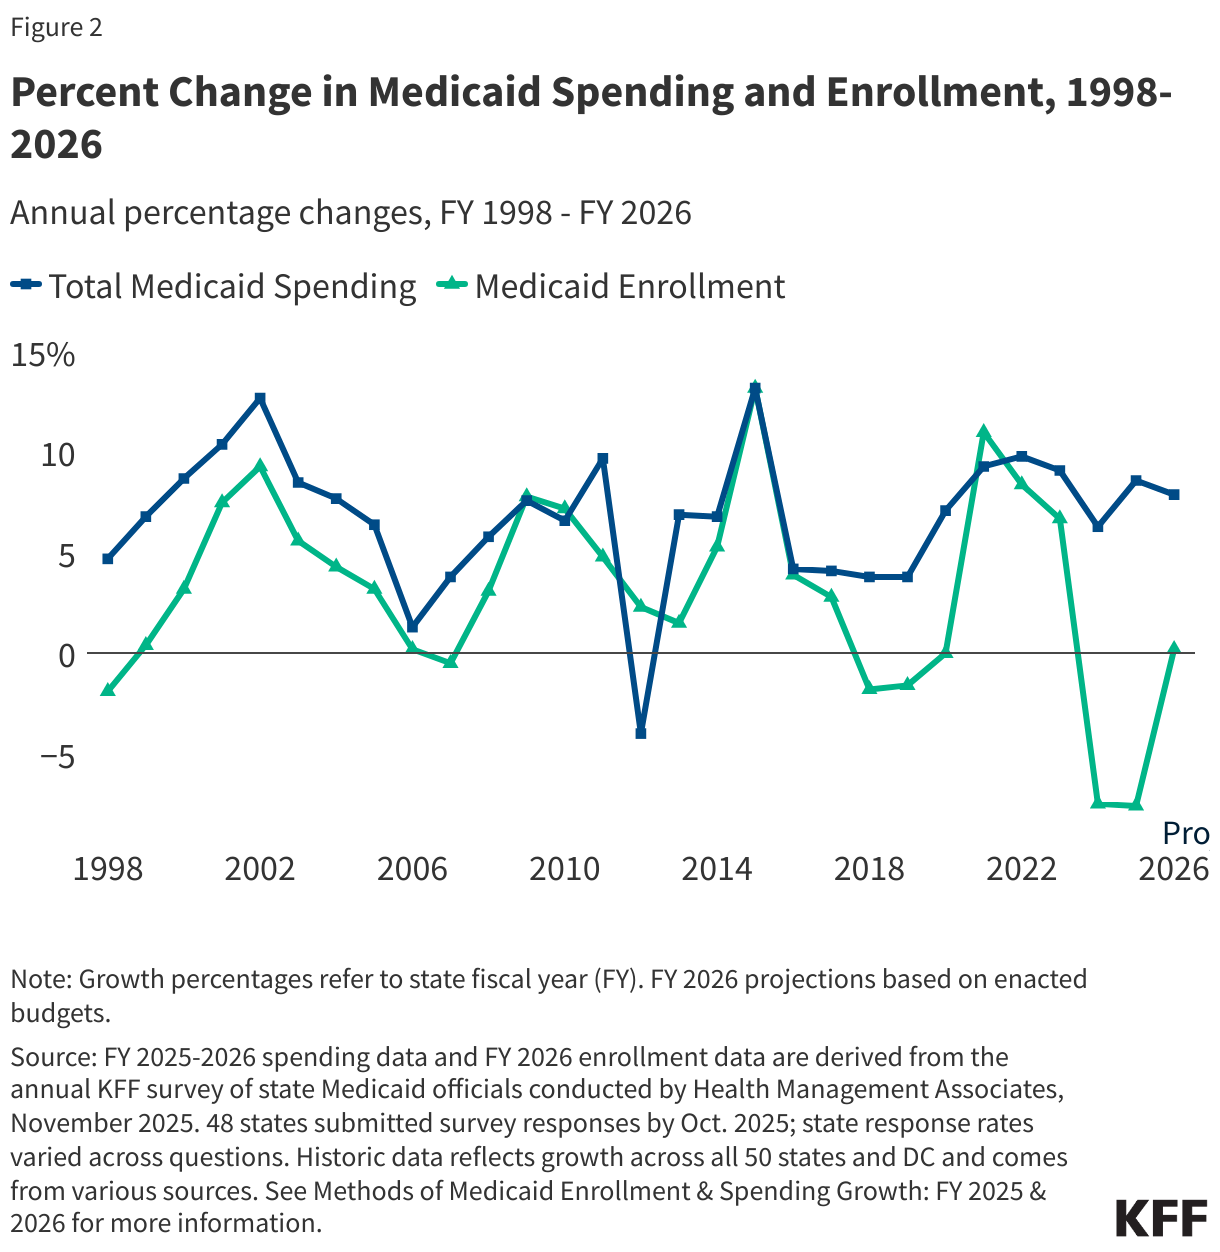
While the unwinding continued to be the largest driver of declining enrollment in FY 2025, the completion of unwinding renewals as well as competing upward and downward growth pressures are expected to result in flat enrollment growth in FY 2026. While about two-thirds of responding states reported that the unwinding was the most significant driver of Medicaid enrollment declines in FY 2025, almost half of responding states also mentioned recent eligibility expansions, including children’s continuous eligibility changes and Medicaid postpartum coverage changes, were putting an upward pressure on enrollment. About a quarter of responding states also reported increases in the populations utilizing long-term care, with some specifically pointing to an aging population in their state. For FY 2026, the completion of unwinding renewals across most states is expected to result in flat enrollment growth, though a few states reported continued downward pressure from unwinding. Some states also noted continued upward pressure from eligibility expansions and long-term care enrollment. Across both FY 2025 and FY 2026, a few states mentioned a strong economy as a significant downward pressure on Medicaid enrollment, while a few other states noted worsening economic conditions in their state as an upward pressure, signaling the variation and uncertainty in state fiscal conditions at this time. Lastly, about a quarter of responding states mentioned they were expecting recent federal changes, including H.R.1, to have a downward impact on enrollment in future years as provisions go into effect.
Trends in Spending Growth
Total Medicaid spending growth was 8.6% in FY 2025 and is expected to slow slightly to 7.9% in FY 2026 (Figure 2). Total spending growth increased when the pandemic and continuous enrollment period began before peaking in FY 2022 and starting to slow in FY 2023 and FY 2024 as states completed unwinding-related eligibility redeterminations. Despite unwinding-related Medicaid enrollment declines, total Medicaid spending growth was 8.6% in FY 2025 and is projected to slow slightly to 7.9% in FY 2026. FY 2025 and FY 2026 Medicaid spending growth rates were calculated as weighted averages across all states to provide a snapshot of overall trends (see Methods), but there was considerable variation in state reported annual growth rates. Most responding states reported that Medicaid spending projections for FY 2026 reflect the assumptions used in the state’s adopted budget. Most states also noted that FY 2026 projections did not reflect any federal policy changes under the recently passed reconciliation law, as most states enacted their FY 2026 budgets before the law’s passage and many of the Medicaid provisions do not take effect until FY 2027 or later.
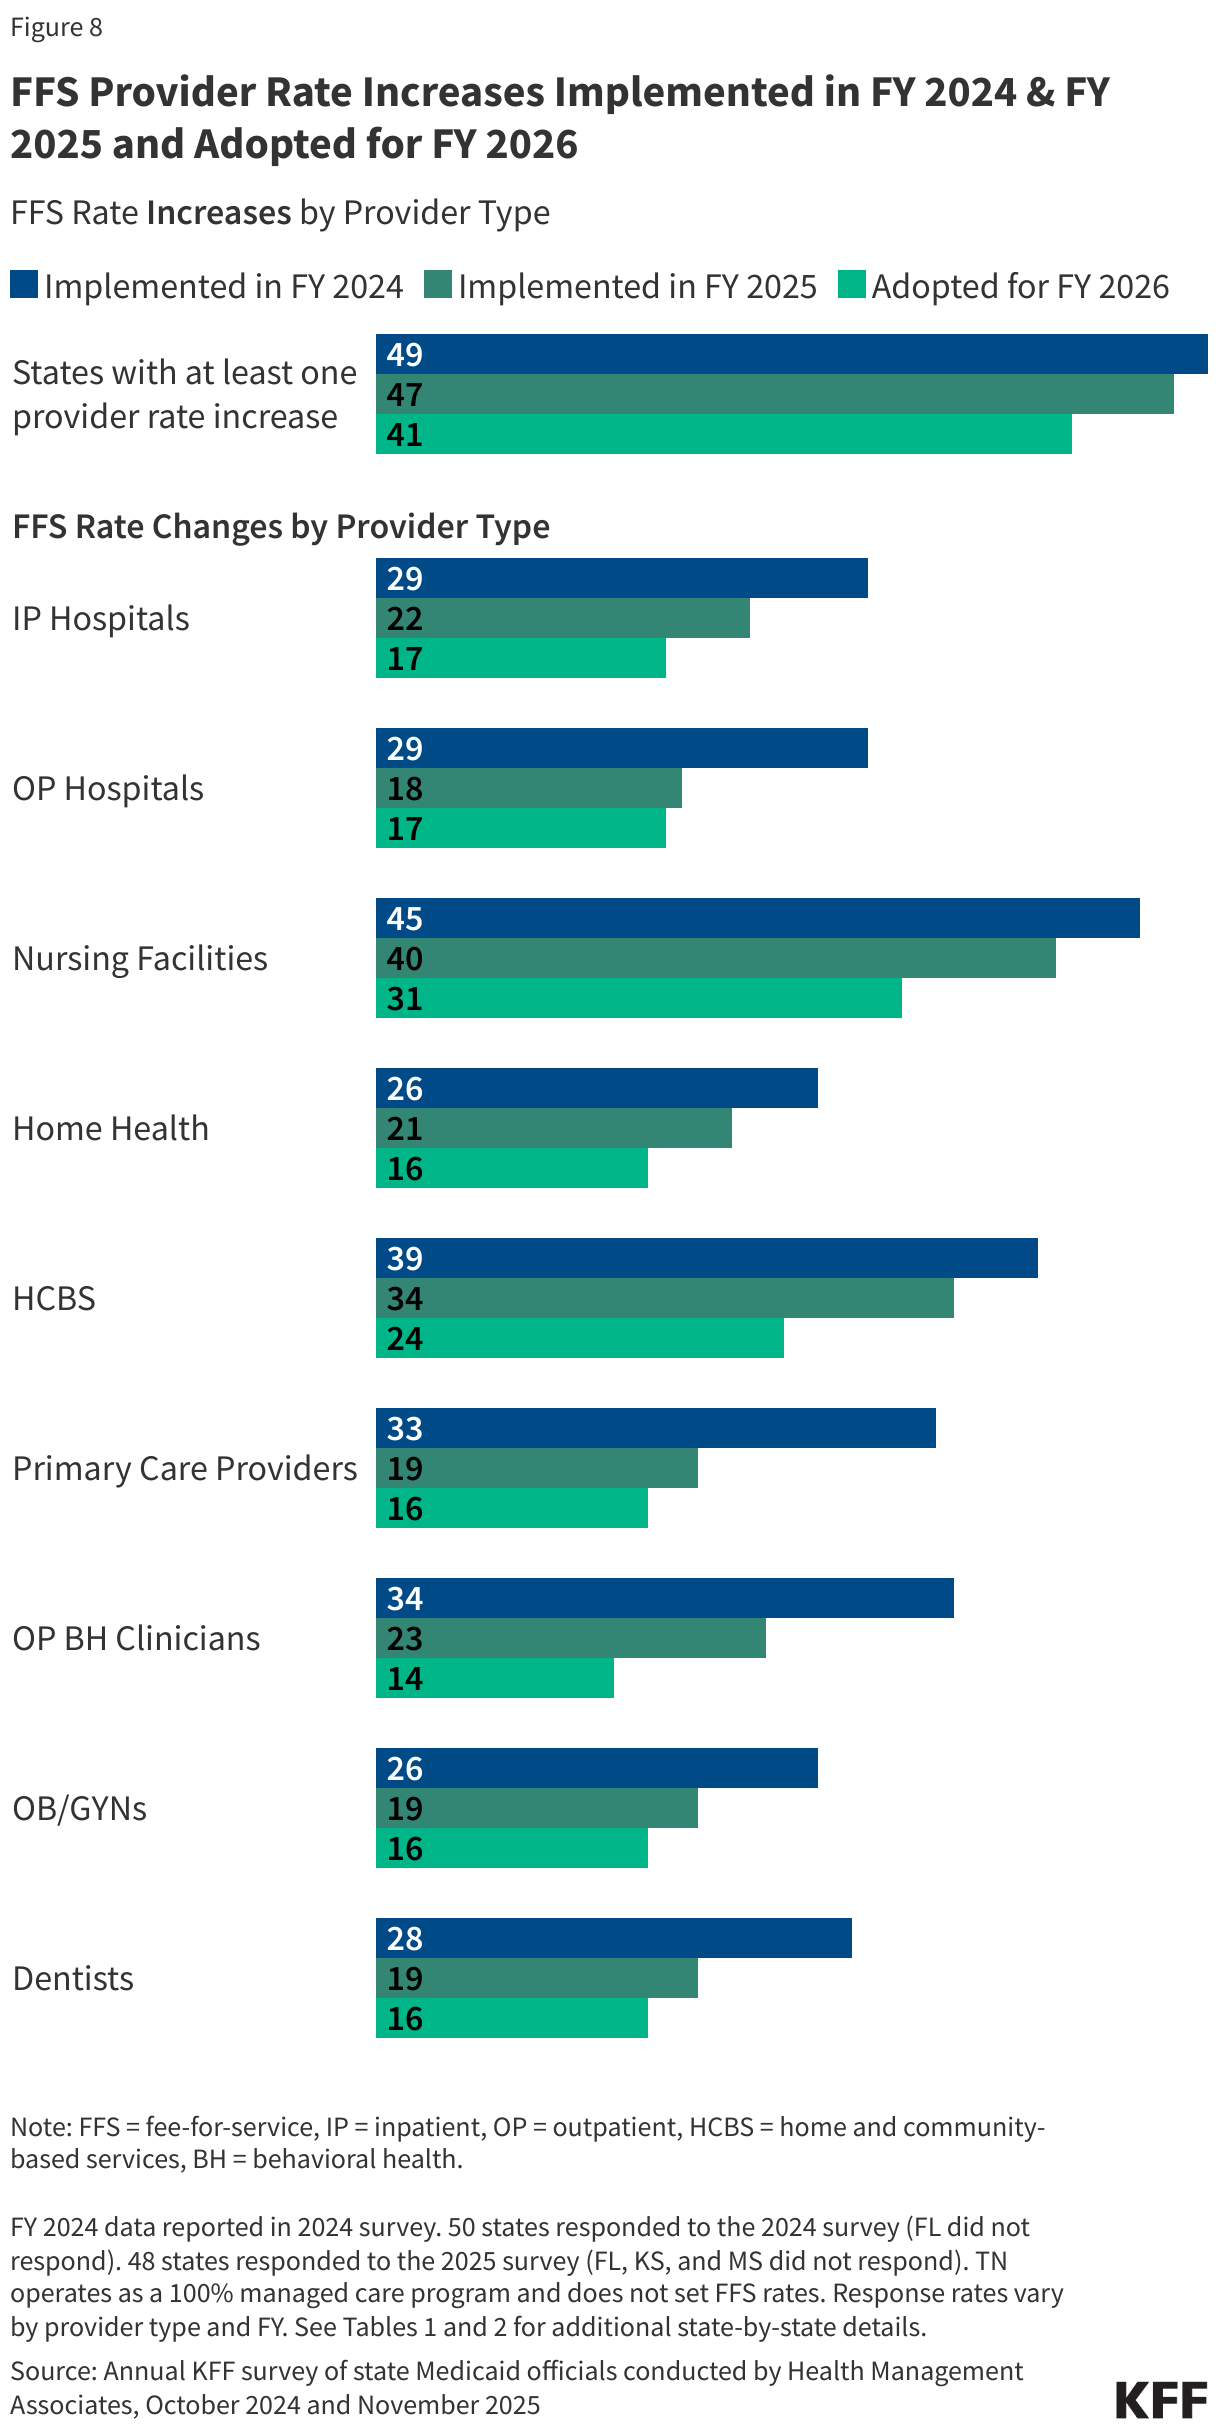
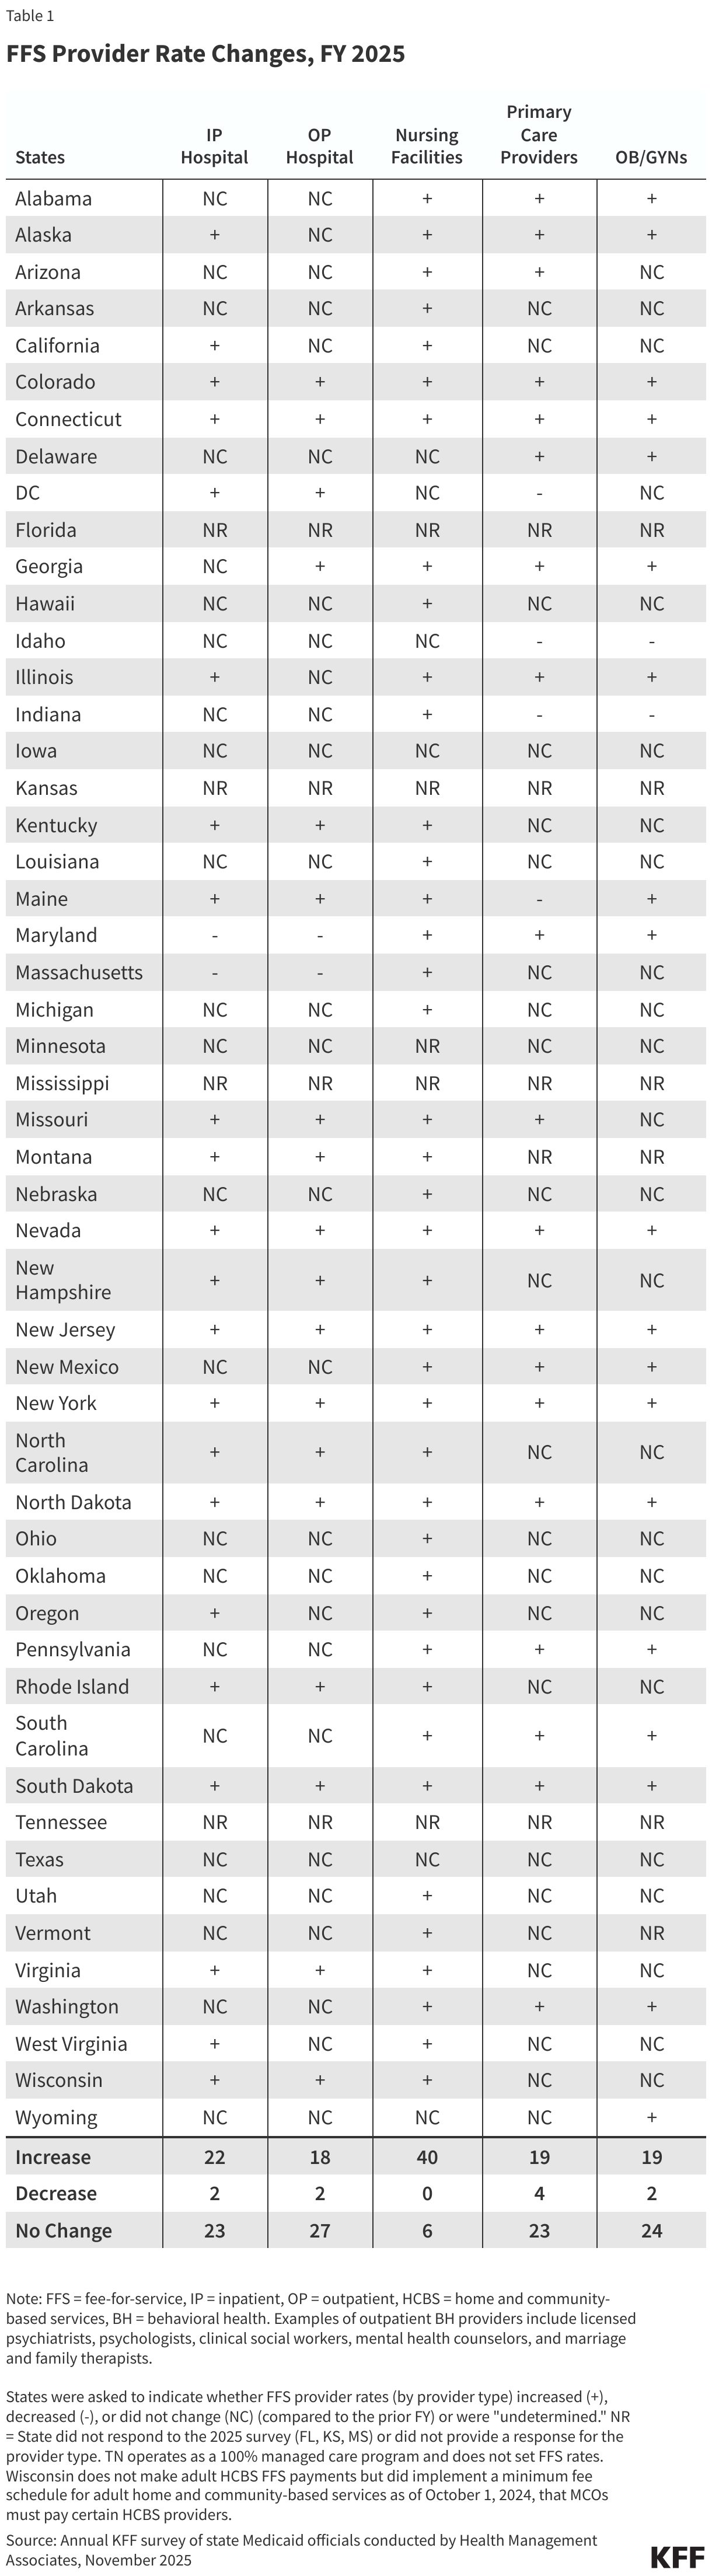
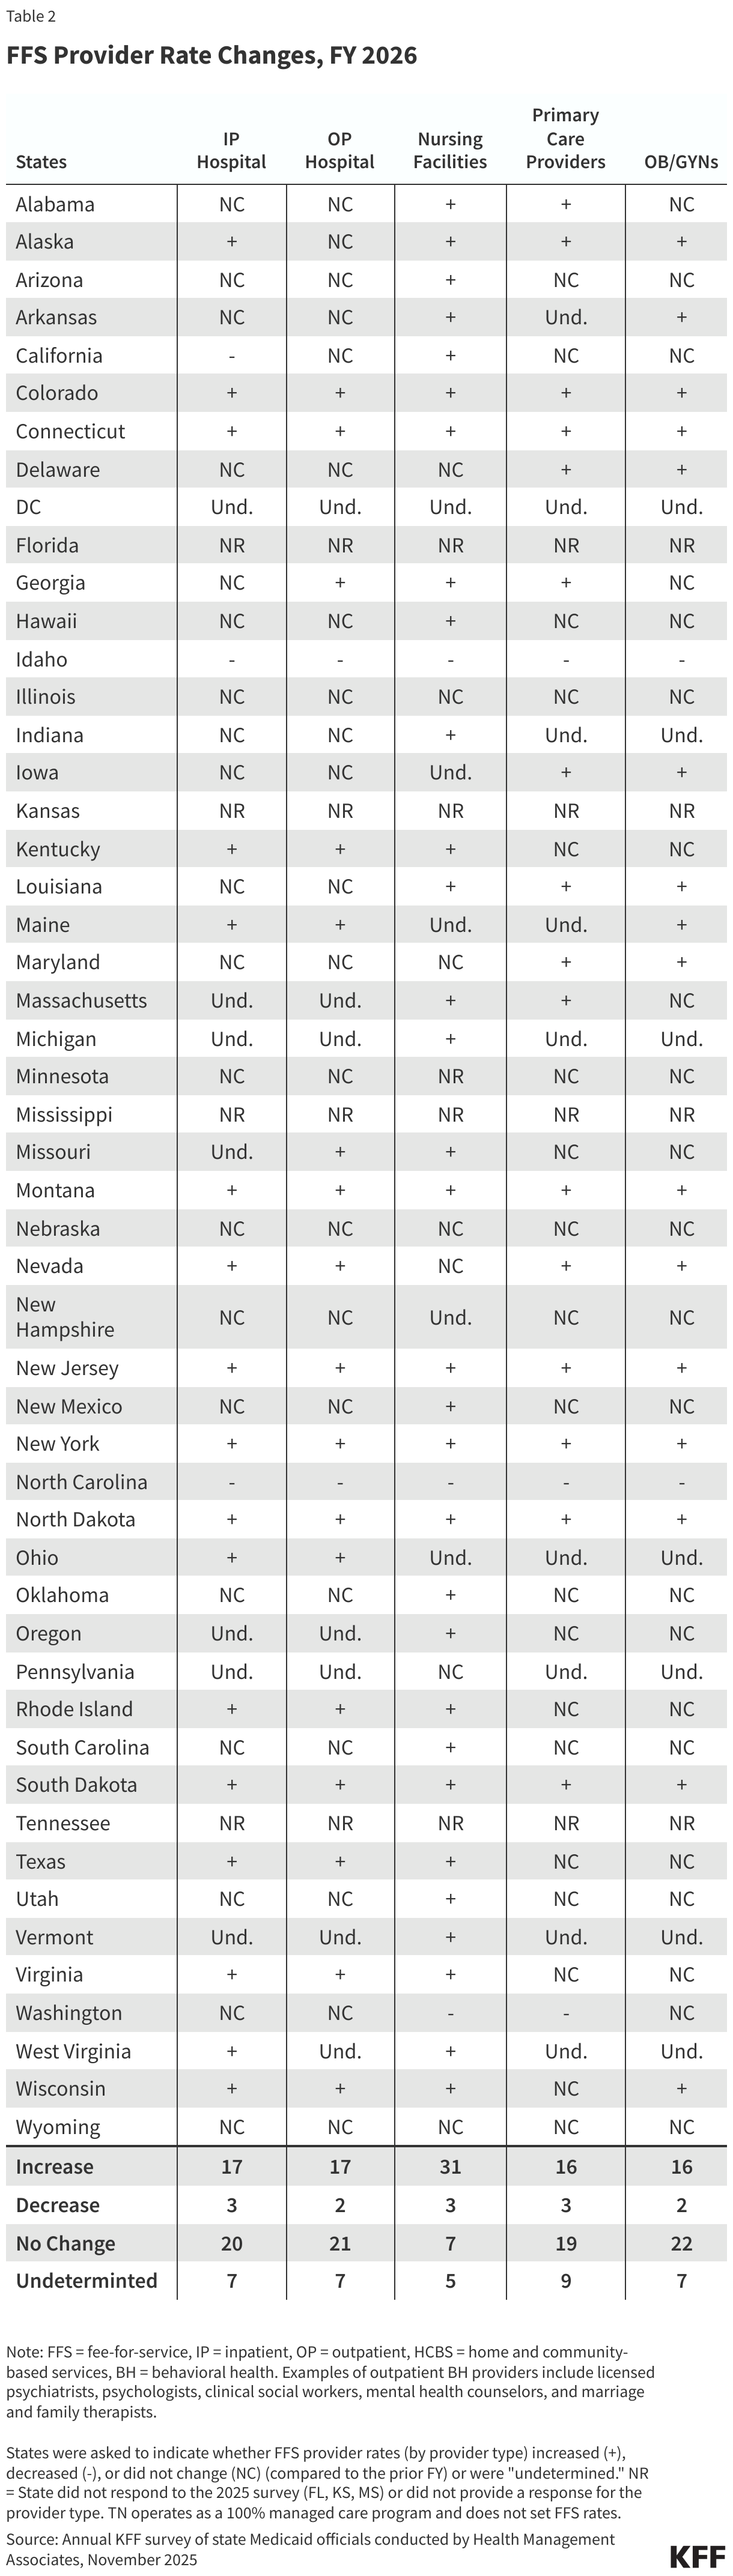
States reported several factors driving growth in total Medicaid spending, including rate increases, higher health care needs among enrollees post-unwinding, and increasing long-term care, pharmacy, and behavioral health care costs. Many responding states noted that enrollment trends were a significant downward pressure in FY 2025 and FY 2026. Beyond enrollment, states did not mention many downward pressures in FY 2025 or FY 2026, though a few states noted downward pressure from pharmacy rebates. However, states are simultaneously experiencing several significant upward expenditure pressures that outweigh the downward pressure from enrollment trends, causing increases in total Medicaid spending (and as a result, spending per enrollee):
- Over half of responding states cited managed care or provider rate increases as an upward pressure on total spending in FY 2025, FY 2026, or both.
- Almost half of states noted that the enrollees that retained coverage during unwinding have higher health care needs (or higher acuity) and utilize more services than those disenrolled.
- Over one-third of states reported increases in long-term care enrollment and/or increases in utilization of long-term care as an upward pressure on total spending in FY 2025, FY 2026, or both.
- Over one-third of states also reported rising pharmacy costs as a factor driving changes in total spending, with some states noting cost pressure particularly due to emerging high-cost specialty drugs.
- About a quarter of states reported increasing behavioral health costs, including growing use of intensive or specialty behavioral health services or certified community behavioral health clinics (CCBHCs) expansions, as another factor contributing to increases in spending.
- Lastly, about a quarter of states noted inflation or general increases in health care costs as an upward pressure on total spending. KFF’s annual employer health benefits survey found premiums for employer coverage increased in 2025 and are expected to increase further in 2026, with employers noting similar cost pressures such as new prescription drugs, prevalence of chronic disease, and higher utilization of services.
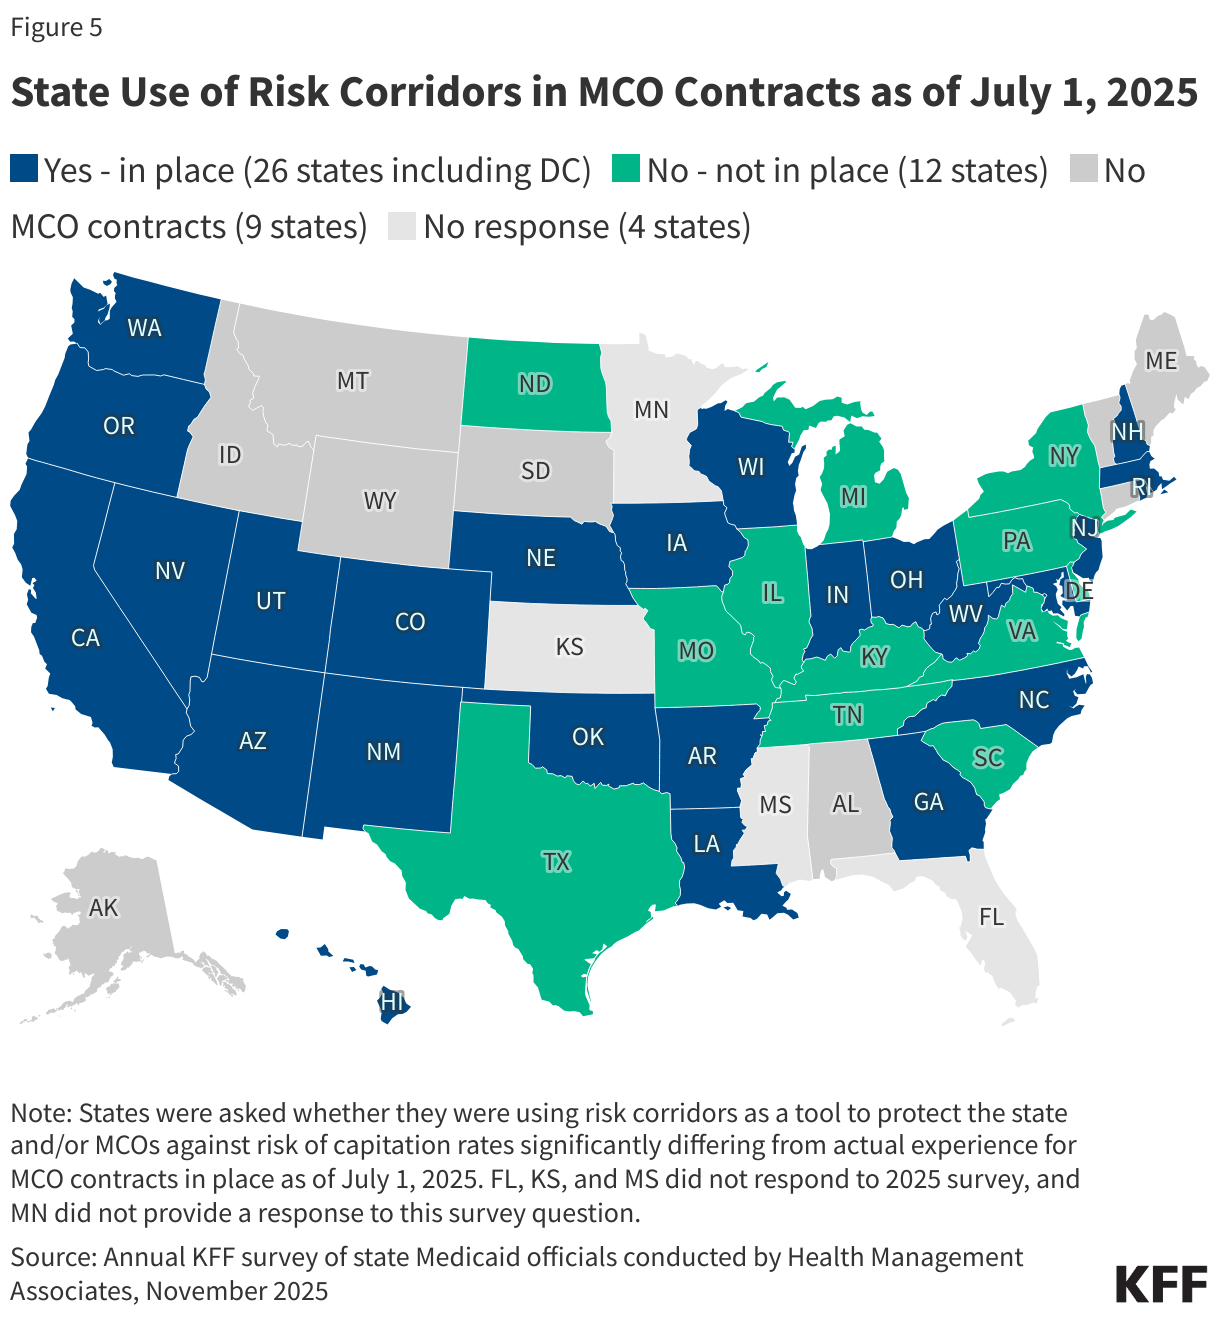
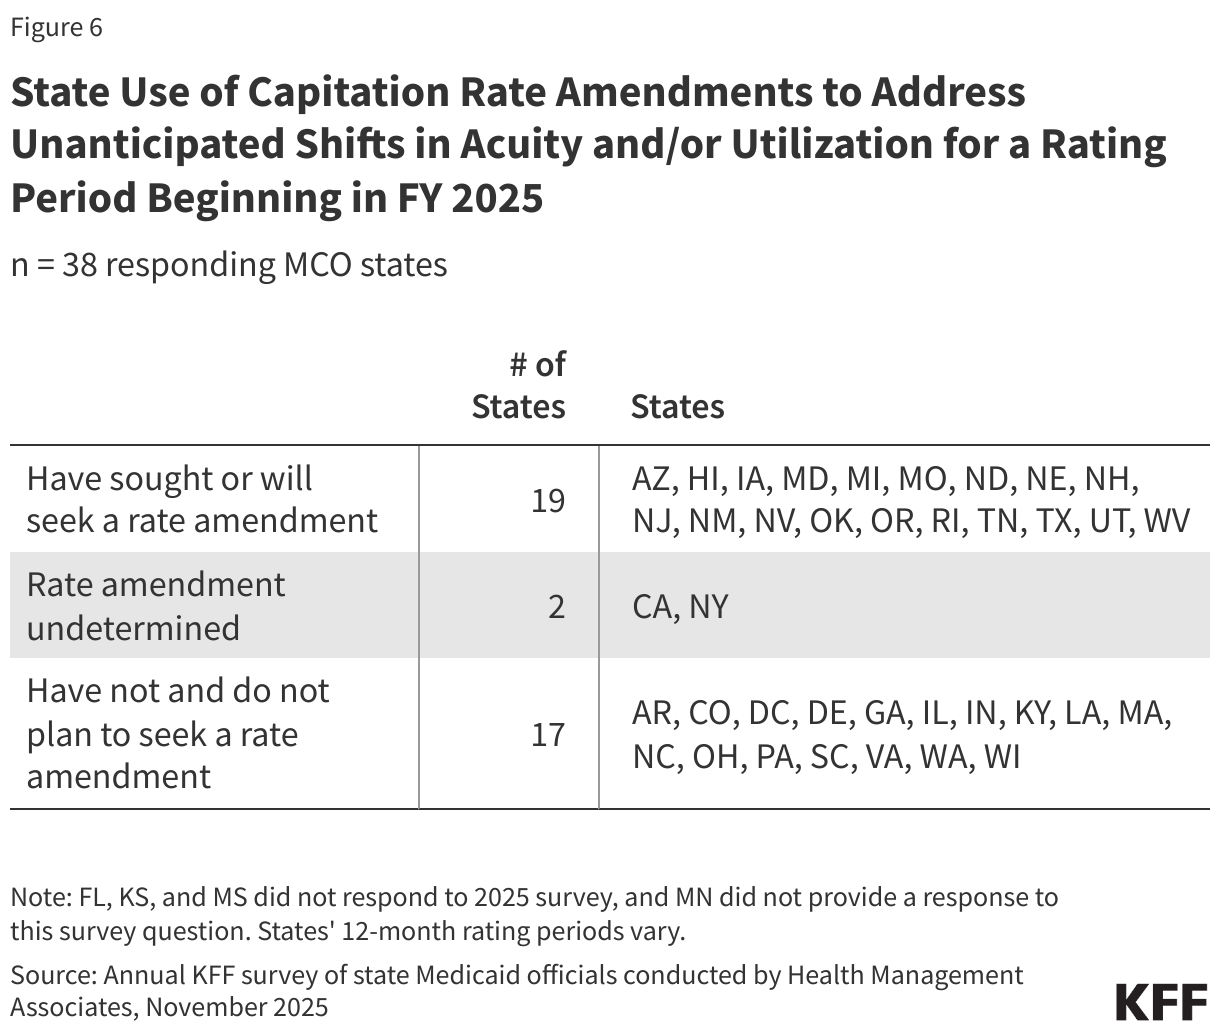
- States also reported that these recent cost pressures were making it challenging for states to set managed care capitation rates in FY 2026.
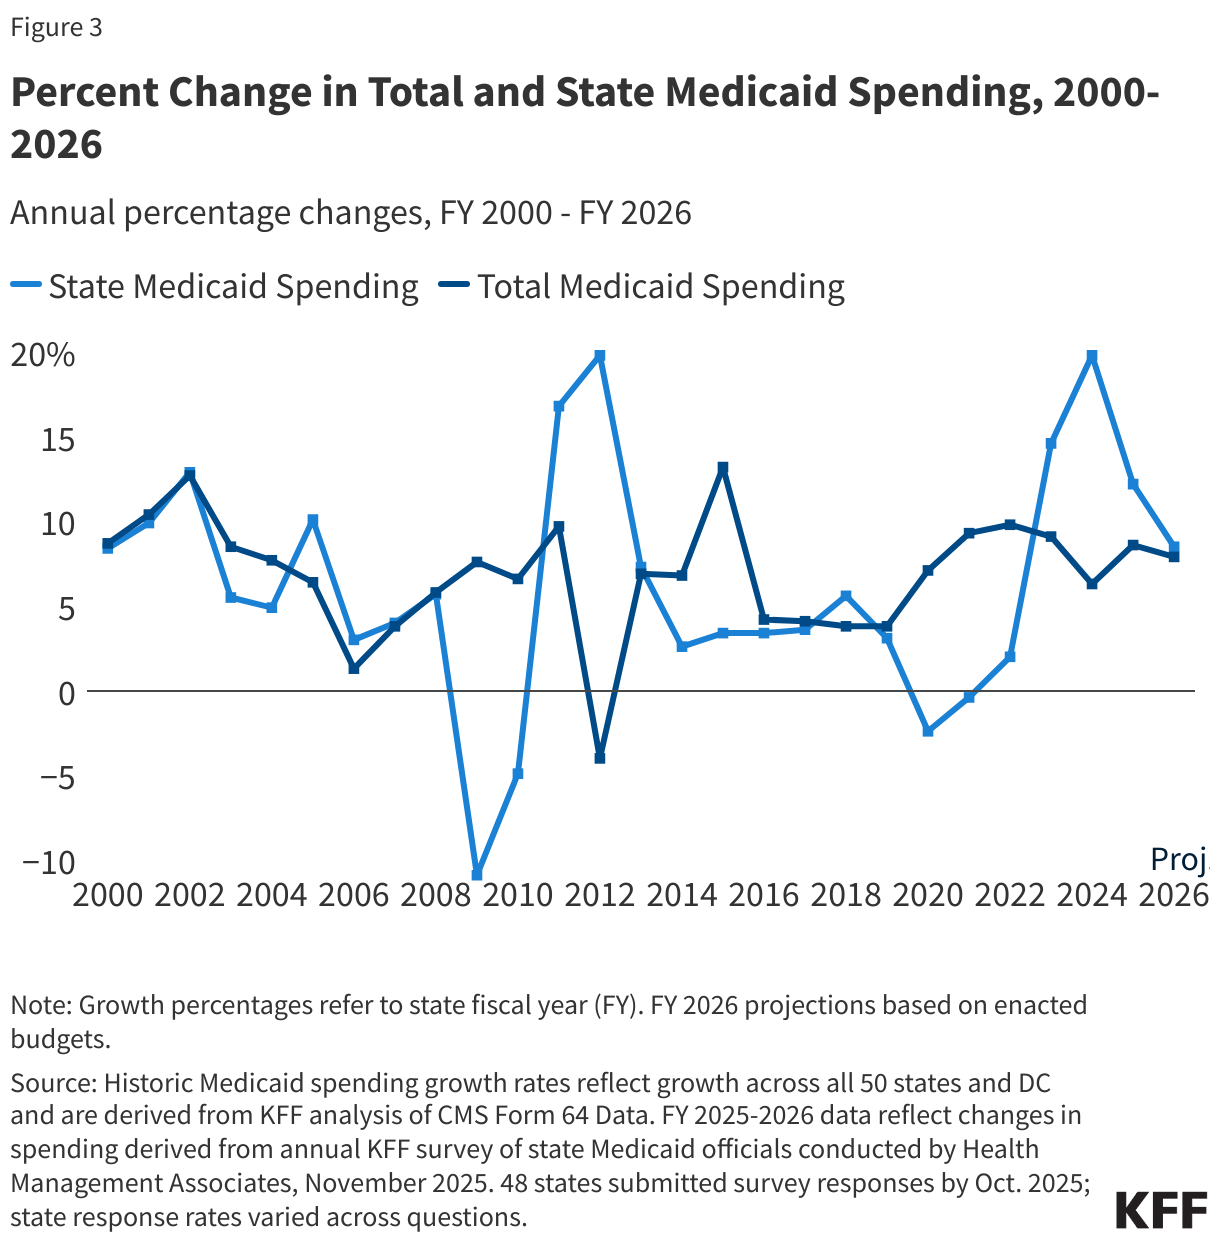
State Medicaid spending growth was 12.2% in FY 2025 and is projected to slow to 8.5% in FY 2026, reaching total spending growth levels and marking the end of shifts caused by the pandemic-era enhanced FMAP (Figure 3). The state (or non-federal) share of Medicaid spending typically grows at a similar rate as total Medicaid spending growth unless there is a change in the FMAP. During the Great Recession, state Medicaid spending declined due to fiscal relief from a temporary FMAP increase provided in the American Recovery and Reinvestment Act (ARRA) but increased sharply when that fiscal relief ended. This pattern repeated during the COVID-19 pandemic, when state Medicaid spending declined in FY 2020 and FY 2021 then increased at a slower rate than total spending in FY 2022 due to the pandemic-era enhanced FMAP. State spending growth increased in FY 2023 and peaked in FY 2024 as the enhanced FMAP was phased down. Following the expiration of the enhanced FMAP, state Medicaid spending slowed in FY 2025 and is expected to continue to slow in FY 2026 to match total Medicaid spending growth.
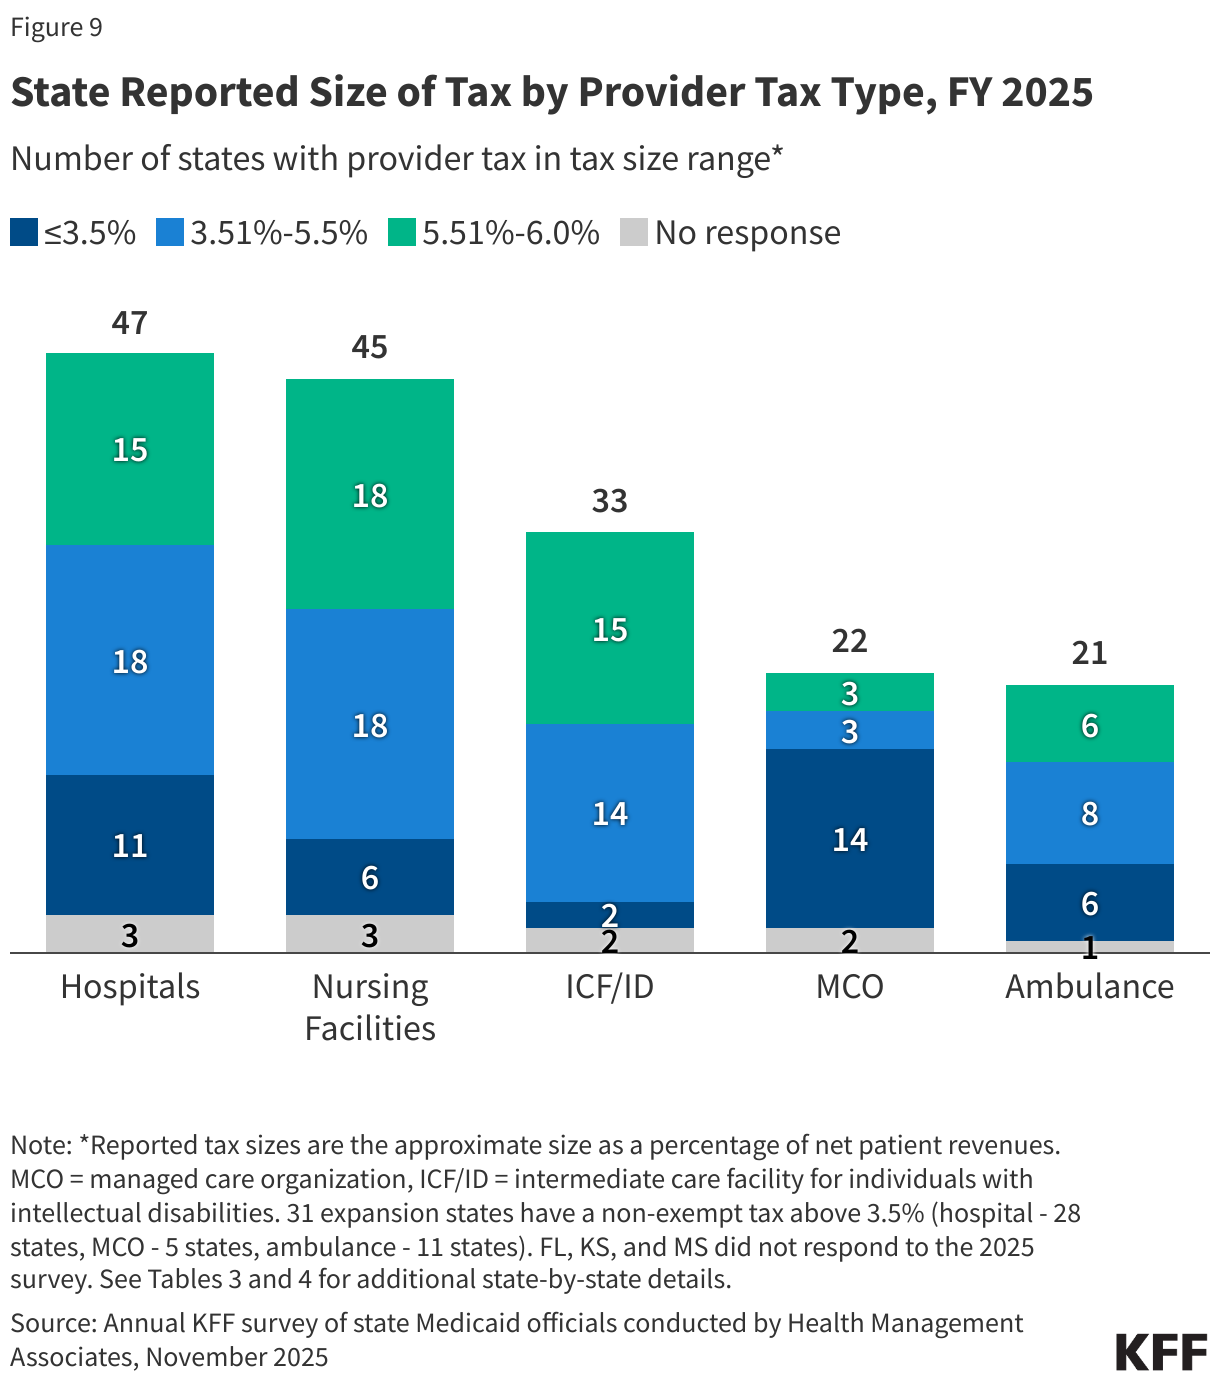
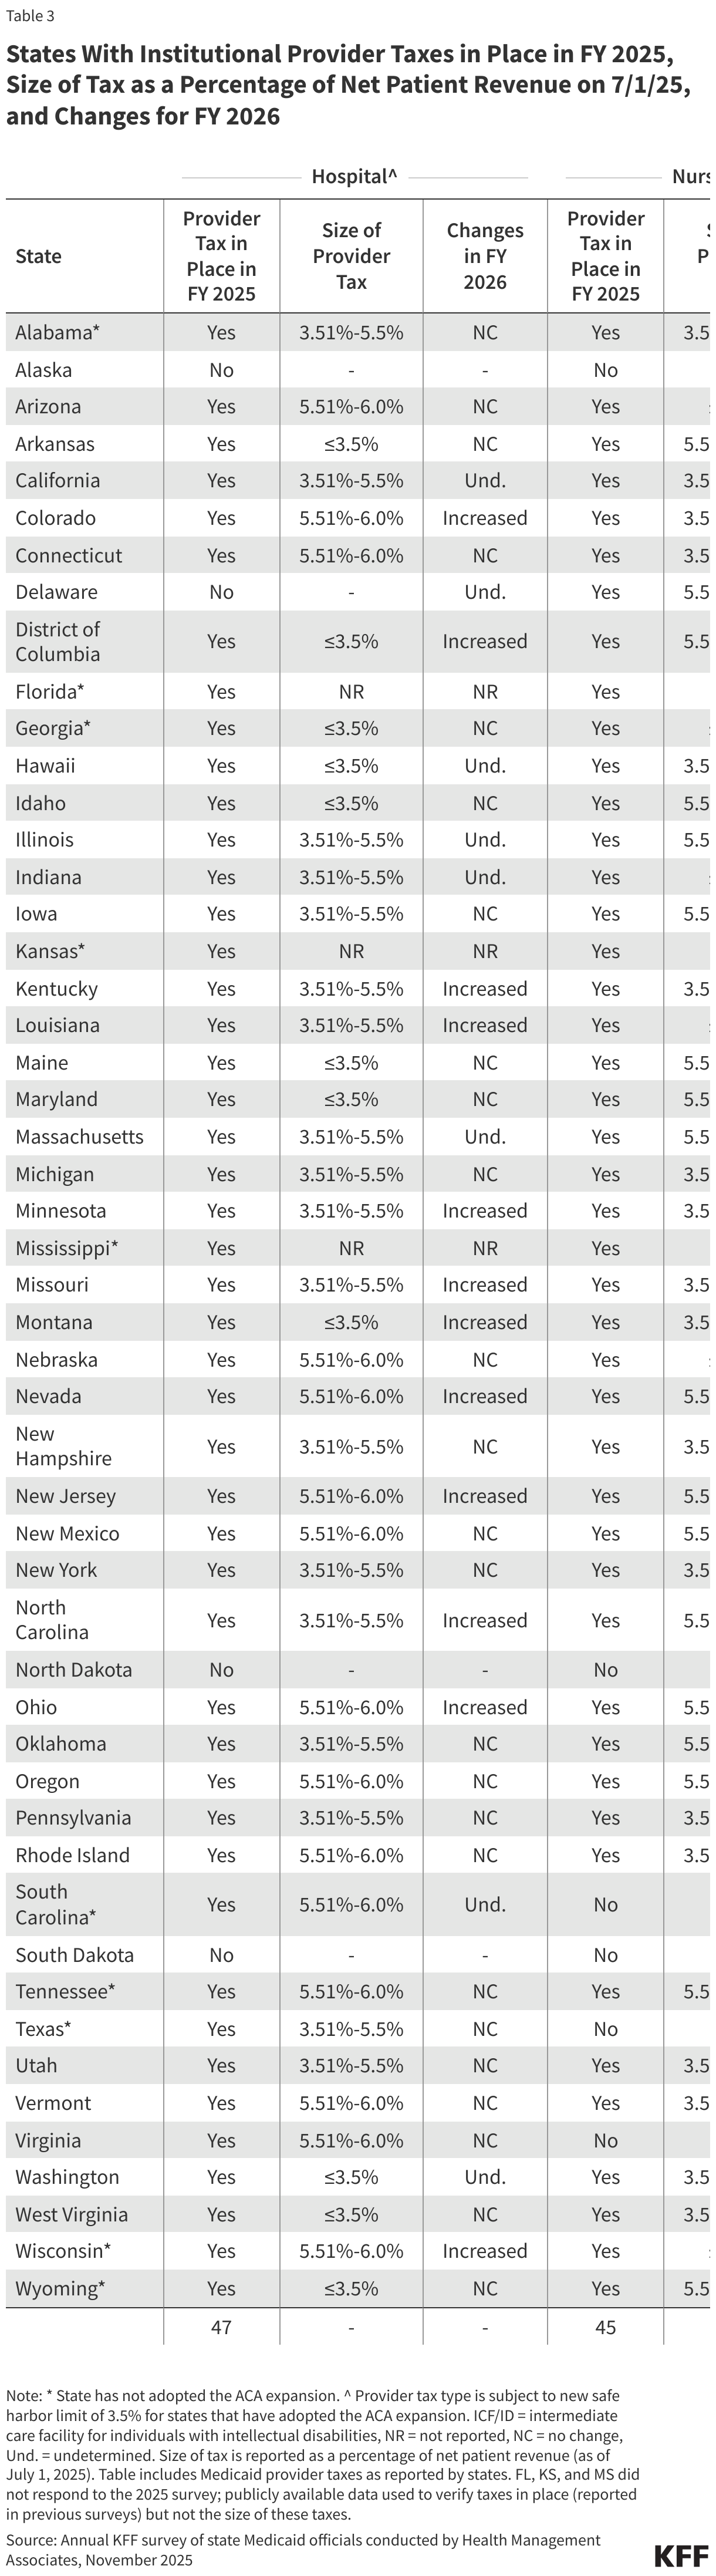
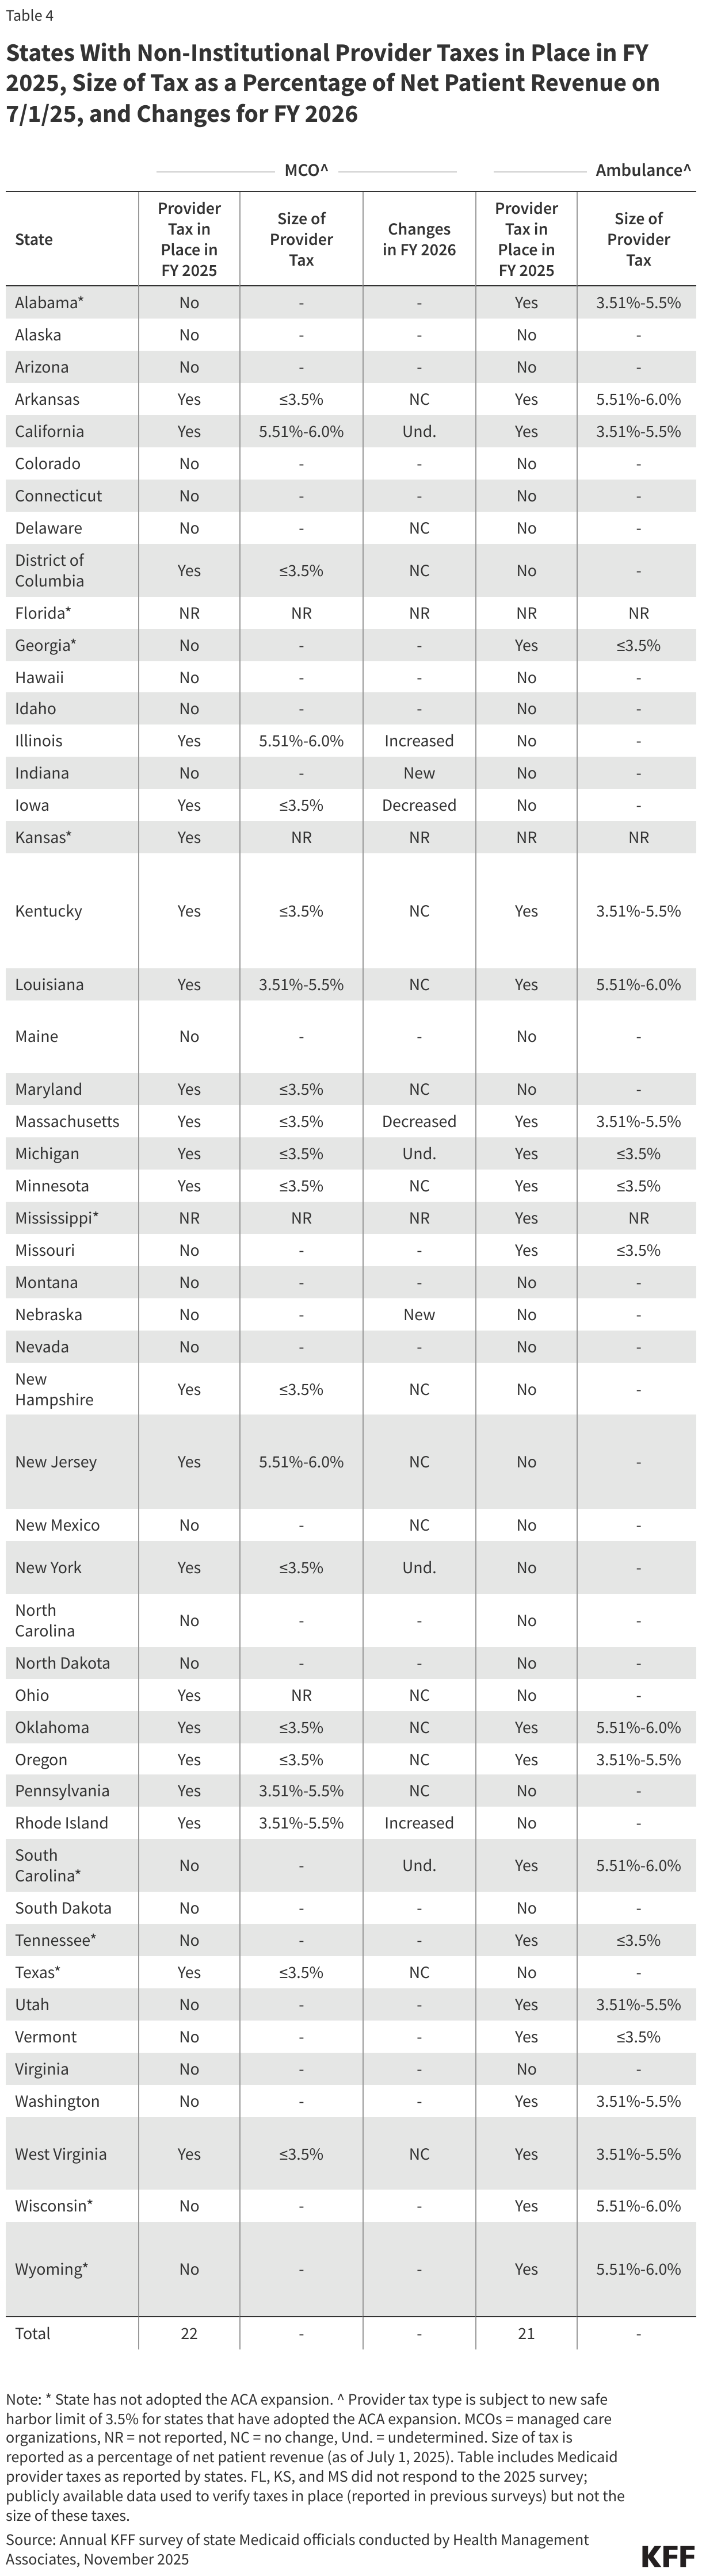
While most of the state (or non-federal) share of Medicaid spending comes from state general funds, there is considerable variation in how much states rely on other non-federal share funding sources and how they account for those other funding sources. Without adjusting for accounting differences across states, states reported that general funds accounted for a median of 70% of the non-federal share in FY 2026 enacted budgets, while provider taxes accounted for 18% and funds from local governments or other sources accounted for 6% (this is relatively similar to 2018 data on non-federal share funding sources reported by the Government Accountability Office (GAO) and 2024 data on general fund spending from the National Association of State Budget Officers (NASBO)). However, there was substantial variation in the extent to which states relied on various funding sources as well as considerable variation in state accounting procedures and how states categorized specific non-federal share revenue sources. For example, a few states noted that provider taxes and/or local government funds went directly into the general fund, making it difficult to parse out the individual funding sources. The reconciliation law includes new limits on provider taxes, prohibiting all states from establishing new provider taxes or from increasing existing taxes and reducing existing provider taxes for states that have adopted the ACA expansion. As these changes restrict a key source of state Medicaid funding, how states finance the non-federal share will likely shift in the coming years.
Almost two-thirds of responding states at the time of the survey thought the chance of a Medicaid budget shortfall in FY 2026 was “50-50”, “likely”, or “almost certain.” This is a slight increase from last year’s survey that found over half of states were facing a Medicaid budget shortfall, highlighting the increasing uncertainty in state fiscal conditions. A few states have also begun implementing budget management strategies like spending cuts or cost containment measures. States are facing uncertainty in their longer-term fiscal outlook due to slowing revenues, increasing cost pressures, shifting economic conditions, and recent federal changes. More states may consider Medicaid cuts as they contend with current Medicaid budget gaps and look ahead to the implementation of the Medicaid changes in the reconciliation law.
Methods
KFF commissioned Health Management Associates (HMA) to survey Medicaid directors in all 50 states and DC to identify and track trends in Medicaid spending, enrollment, and policymaking. Given differences in the financing structure of their programs, the U.S. territories were not included in this analysis. This is the 25th annual survey, conducted at the beginning of each state fiscal year from FY 2002 through FY 2026. State fiscal years begin on July 1 in most states except for: New York on April 1; Texas on September 1; Alabama, Michigan, and District of Columbia on October 1. The KFF/HMA Medicaid survey for this report was sent to each Medicaid director in June 2025. 48 states provided survey responses by October 2025; Florida, Kansas, and Mississippi did not respond to this year’s survey.
Medicaid Enrollment Growth: The average annual Medicaid enrollment growth rate for FY 2026 was calculated using weights based on Medicaid and CHIP preliminary monthly enrollment data for June 2025 published by CMS. For FY 2026, 46 states reported Medicaid enrollment growth rates. The data reported for FY 2025 and FY 2026 for Medicaid spending and FY 2026 for Medicaid enrollment are weighted averages, and therefore, data reported for states with larger enrollment and spending have a greater effect on the national average.
Historical enrollment trend data for FY 1998 to FY 2013 reflects the annual percentage change from June to June of monthly enrollment data for Medicaid beneficiaries collected from all states and DC. Enrollment trend data for FY 2014 to FY 2025 reflects growth in average monthly enrollment based on KFF analysis of the Medicaid & CHIP Monthly Applications, Eligibility Determinations, and Enrollment Reports from CMS for all 50 states and DC. Note that several states have revised monthly enrollment data as far back as June 2017 to better align with reporting criteria for the CMS, Medicaid & CHIP Monthly Applications, Eligibility Determinations, and Enrollment Reports. Data for months prior to June 2017 have not been revised and may use slightly different criteria for reporting monthly enrollment and generally result in larger enrollment totals.
Medicaid Spending Growth: For FY 2025 and FY 2026, annual rates of growth for Medicaid spending were calculated as weighted averages across all states. 48 states reported Medicaid expenditure growth rates for FY 2025 and FY 2026. Weights for spending were derived from net Medicaid expenditure data (including collections and adjustments) for FY 2024 from the CMS-64 Financial Management Reports and adjusted for state fiscal years.
FY 2024 spending growth rate is also derived from net Medicaid expenditure data (including collections and adjustments) from the CMS-64 Financial Management Reports, adjusted for state fiscal years. We estimate state fiscal year spending by summing 75% of spending from the same federal fiscal year with 25% of spending from the previous federal fiscal year. Historic Medicaid spending for FY 2022 and earlier are based on estimates prepared for KFF by the Urban Institute using CMS Form 64 reports.
Definition of Medicaid Spending. Total Medicaid spending includes all payments to Medicaid providers for Medicaid-covered services provided to enrolled Medicaid beneficiaries. Medicaid spending also includes special disproportionate share hospital (DSH) payments that subsidize uncompensated hospital care for persons who are uninsured and unreimbursed costs of care for persons on Medicaid. Total Medicaid spending does not include Medicaid administrative costs and federally mandated state “Clawback” payments to help finance the Medicare Part D prescription drug benefit for Medicaid beneficiaries who are also enrolled in Medicare. States are also asked to exclude costs for the Children’s Health Insurance Program (CHIP). Total Medicaid spending includes payments financed from all sources, including state funds, local contributions, and federal matching funds. Historical state Medicaid spending refers to all non-federal spending, which may include local funds and provider taxes and fees as well as state general fund dollars.