KFF COVID-19 Vaccine Monitor: December 2020
Findings
The KFF COVID-19 Vaccine Monitor is an ongoing research project tracking the public’s attitudes and experiences with COVID-19 vaccinations. Using a combination of surveys and focus groups, this project will track the dynamic nature of public opinion as vaccine development unfolds, including vaccine confidence and hesitancy, trusted messengers and messages, as well as the public’s experiences with vaccination as distribution begins.
Key Findings
- With the launch of the KFF COVID-19 Vaccine Monitor, a new KFF survey finds an increase in the share of the public saying they would definitely or probably get a vaccine for COVID-19 if it was determined to be safe by scientists and available for free to everyone who wanted it. This share now stands at 71%, up from 63% in a September survey conducted in partnership with ESPN’s The Undefeated. Following on the heels of the presidential election and promising news about several COVID-19 vaccine candidates, the new survey finds an increase in the share who say they would get vaccinated across racial and ethnic groups, and among both Democrats and Republicans (willingness to get vaccinated among independents has not changed).
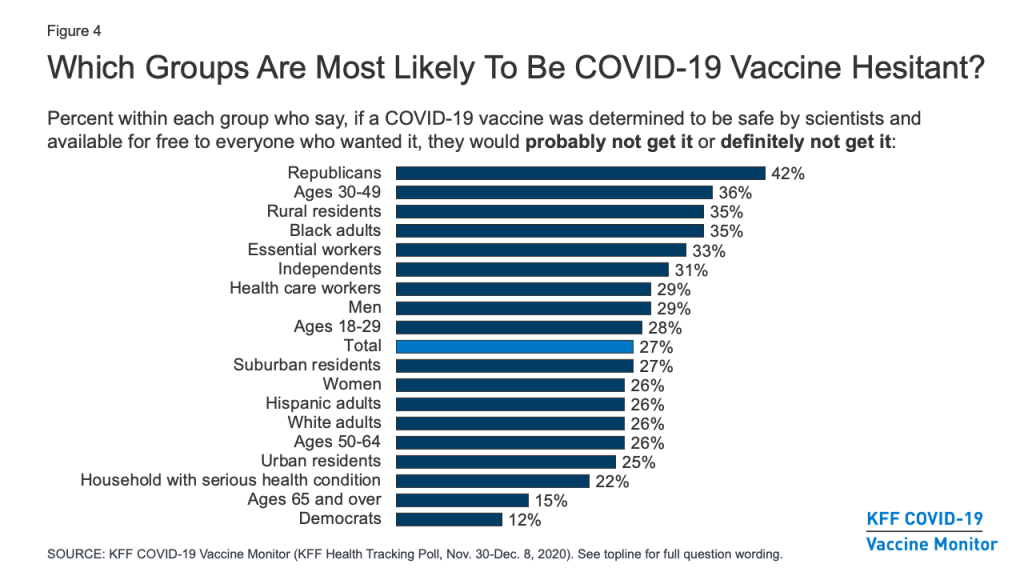
- About a quarter (27%) of the public remains vaccine hesitant, saying they probably or definitely would not get a COVID-19 vaccine even if it were available for free and deemed safe by scientists. Vaccine hesitancy is highest among Republicans (42%), those ages 30-49 (36%), and rural residents (35%). Importantly, 35% of Black adults (a group that has borne a disproportionate burden of the pandemic) say they definitely or probably would not get vaccinated, as do one third of those who say they have been deemed essential workers (33%) and three in ten (29%) of those who work in a health care delivery setting .
- Among those who are hesitant to get a COVID-19 vaccine, the main reasons are worries about possible side effects (59% cite this as a major reason), lack of trust in the government to ensure the vaccines’ safety and effectiveness (55%), concerns that the vaccine is too new (53%), and concerns over the role of politics in the development process (51%). About half of Black adults who say they probably or definitely won’t get vaccinated cite as major reasons that they don’t trust vaccines in general (47%) or that they are worried they may get COVID-19 from the vaccine (50%), suggesting that messages combatting particular types of misinformation may be especially important for increasing vaccine confidence among this group.
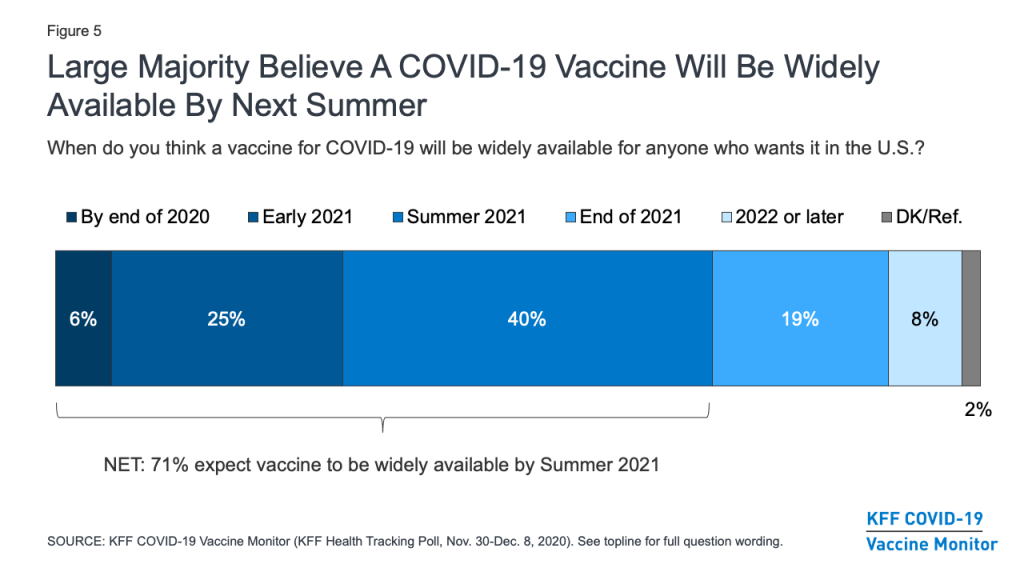
- A large majority (71%) of the public believes a vaccine will be widely available for anyone who wants it in the U.S. by the summer of 2021. This includes about three in ten who believe it will be available sooner, either by the end of 2020 or early in 2021. Despite promising news about vaccines by both Pfizer/BioNTech and Moderna, expectations may need to be tempered for this group, given the small number of initial doses available and the hurdles to producing and distributing enough vaccine doses to cover everyone in the United States.
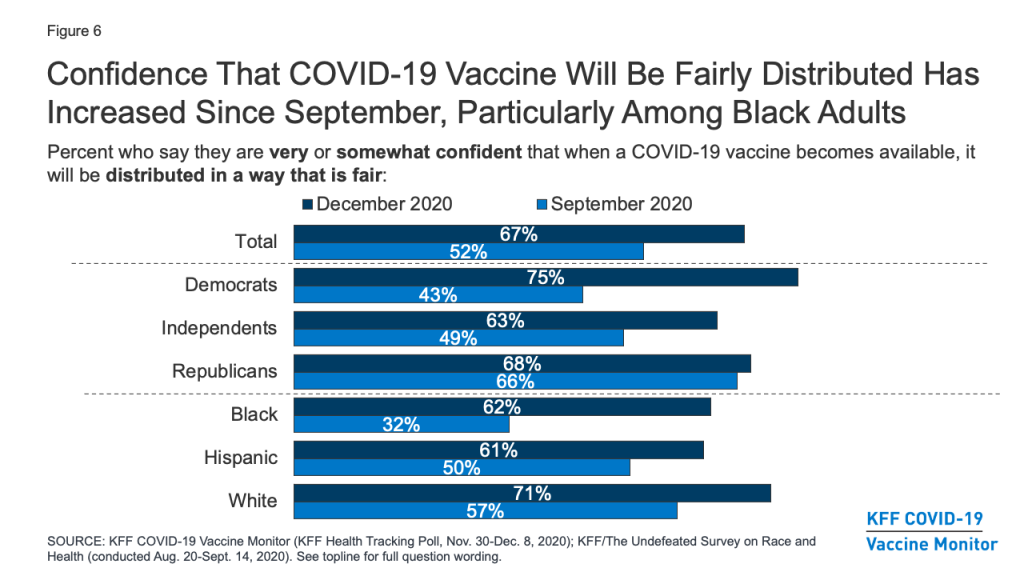
- A critical question that has already begun to face policymakers is how to prioritize different groups and ensure equitable distribution of the vaccine. On this question, the public’s confidence has increased markedly over the past several months, particularly among Black Americans. Two-thirds of the public now say they are at least somewhat confident that when a COVID-19 vaccine becomes available, it will be distributed in a way that is fair, up from about half (52%) in September. Among Black Americans, the share has nearly doubled, from 32% to 62%. Still, concerns remain about whether the needs of people of color are being accounted for in the vaccine development process. About half (48%) of Black adults say they are not confident that the development of a COVID-19 vaccine is taking the needs of Black people into account, and over a third (36%) of Hispanic adults say the same about the needs of Hispanic people.
- Understanding who the public trusts for reliable vaccine information will be critical for any COVID-19 vaccination outreach effort. The survey finds that, as with many health topics, people’s personal health care providers are the most trusted source for information on COVID-19 vaccines, with 85% saying they trust their own doctor or health care provider at least a fair amount for reliable vaccine information. Some local, state, and national messengers – including the CDC, FDA, Dr. Anthony Fauci, and state and local health officials – are trusted by majorities of the public as well, but trust in these government-affiliated sources divides somewhat on partisan lines, with Democrats tending to express higher levels of trust than Republicans.
- The KFF COVID-19 Vaccine Monitor is also tracking the public’s enthusiasm for getting vaccinated and identified four groups of individuals that may require different communication strategies when it comes to a COVID-19 vaccine. These include: the “as soon as possible” group (34% of the public) who say that when a vaccine is approved and widely available, they will get it as soon as they can; the “wait and see” group (39%) who say that they will wait to see how the vaccine is working for other people before getting vaccinated themselves; the “only if required” group (9%) who say they will only get vaccinated if it is required for work, school, or other activities; and the “definitely not” group (15%) who say they definitely would not get a vaccine, even if it was free and determined to be safe by scientists. This last group is likely to be the hardest to convince, given that they have low trust in public health messengers, very low rates of flu vaccination, and high rates of believing misinformation about other public health measures, like mask-wearing.
COVID-19 Vaccine Hesitancy: Trends, Reasons, And Subgroups
Share Of Public Willing To Get Vaccinated For COVID-19 Has Increased
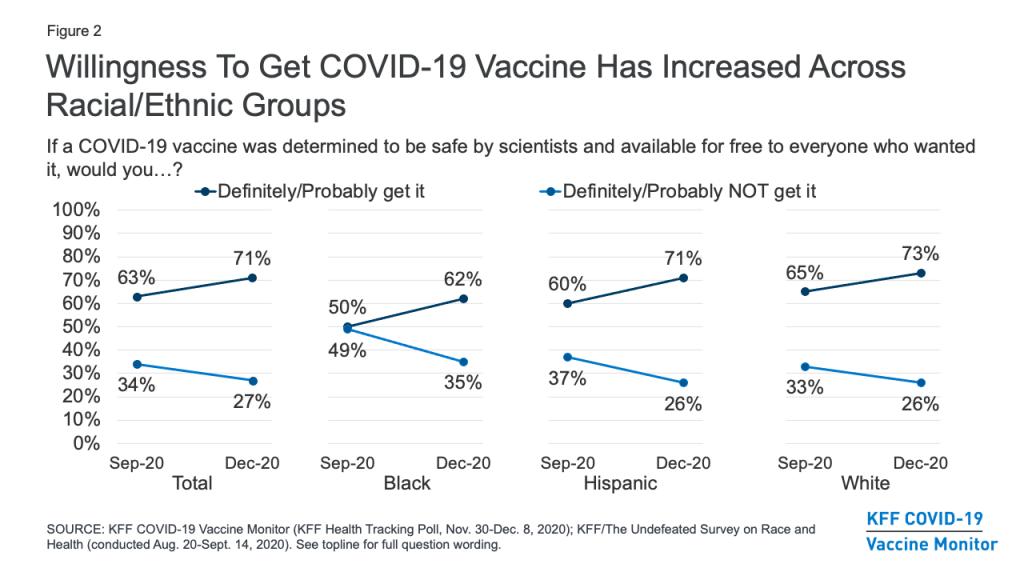
The KFF COVID-19 Vaccine Monitor finds that the share of the public saying they would definitely or probably get a vaccine for COVID-19 if it was determined to be safe by scientists and available for free to everyone who wanted it has increased modestly since September, following the results of the presidential election and promising news about several COVID-19 vaccine candidates. In the new survey, seven in ten (71%) say they would definitely (41%) or probably (30%) get such a vaccine, while about a quarter (27%) say they would probably (12%) or definitely (15%) not get it. The share saying they would definitely or probably get vaccinated is up 8 percentage points from a KFF survey conducted in September in partnership with ESPN’s The Undefeated (from 63% to 71%), while the share saying they would definitely or probably not get vaccinated is down 7 percentage points (from 34% to 27%).

Looking across racial and ethnic groups, there has been an increase in vaccine willingness among Black, Hispanic, and White adults alike. The change is perhaps most dramatic among Black adults, among whom willingness to get vaccinated increased from 50% in September to 62% in December. While Black adults were about evenly split in September on whether or not they would get a COVID-19 vaccine that was free and determined to be safe by scientists, they are now almost twice as likely to say they would get vaccinated as to say they would not (62% vs. 35%).
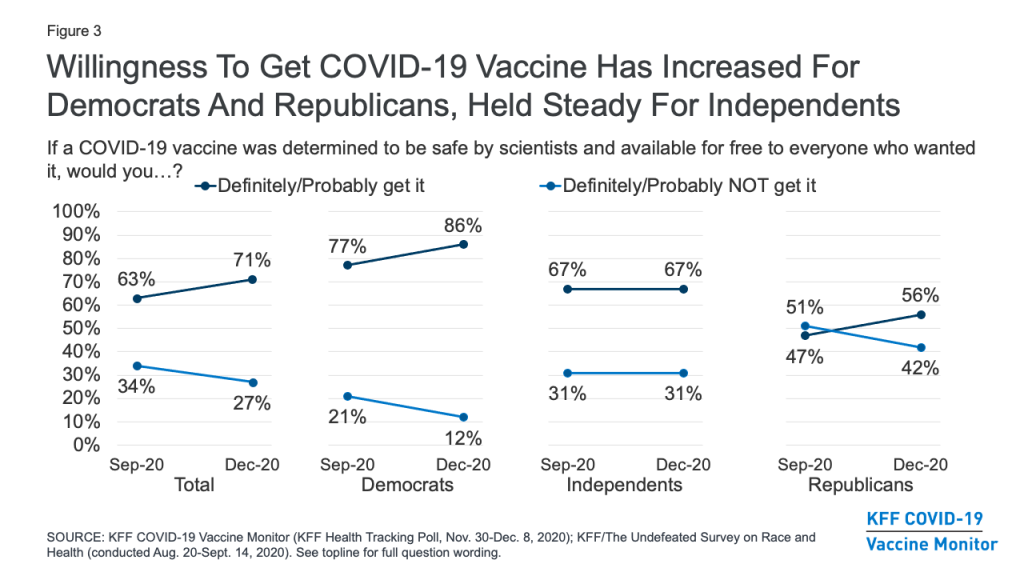
While a large partisan gap remains, willingness to get vaccinated for COVID-19 has increased for both Democrats (from 77% in September to 86% in December) and Republicans (from 47% to 56%), but has remained the same among independents (67%).
One-Quarter Remain Hesitant To Get A COVID-19 Vaccine, Including Four In Ten Republicans
About a quarter (27%) of the public remains vaccine hesitant, saying they probably or definitely would not get a COVID-19 vaccine even if it were available for free and deemed safe by scientists. Vaccine hesitancy is highest among Republicans (42%), those ages 30-49 (36%), and rural residents (35%). Importantly, 35% of Black adults (a group that has borne a disproportionate burden of the pandemic) say they definitely or probably would not get vaccinated, as do one-third of those who say they have been deemed essential workers and three in ten (29%) of those who work in a health care delivery setting.
Different Groups Have Different Reasons For COVID-19 Vaccine Hesitancy
Among those who are hesitant to get a COVID-19 vaccine, the main reasons are worries about possible side effects (59% cite this as a major reason), lack of trust in the government to ensure the vaccines’ safety and effectiveness (55%), concerns that the vaccine is too new (53%), and concerns over the role of politics in the development process (51%). About four in ten cite as reasons that the risks of COVID-19 are being exaggerated (43%) or they don’t trust vaccines in general (37%), while about a third say they don’t trust the health care system (35%), and smaller shares say they are worried they may get COVID-19 from the vaccine (27%) or they don’t think they’re at risk of getting sick from the virus (20%).
Among the vaccine hesitant, members of different racial groups have somewhat different reasons for not wanting to get vaccinated. For example, Black adults who are vaccine hesitant are more likely than White adults to cite concerns about side effects (71% vs. 56%) and the newness of the vaccine (71% vs. 48%) as major reasons for not wanting to get vaccinated. Importantly, about half of Black adults who say they probably or definitely won’t get vaccinated cite as major reasons that they are worried they may get COVID-19 from the vaccine (50%) or that they don’t trust vaccines in general (47%), suggesting that messages combatting particular types of misinformation may be especially important for increasing vaccine confidence among this group.
Reasons for vaccine hesitancy also differ somewhat by partisan identification. Among Republicans who say they won’t get vaccinated, a top reason is that they think the risks of COVID-19 are being exaggerated, named as a major reason by 57% of Republicans who are vaccine hesitant (24% of all Republicans).
| Table 1: Reasons For Vaccine Hesitancy By Party Identification, Age, and Race/Ethnicity | |||||||
| AMONG THOSE WHO WOULD DEFINITELY NOT OR PROBABLY NOT GET VACCINATED: Percent who say each of the following is a major reason why: | Total | Party ID | Age | Race/Ethnicity | |||
| Independent | Republican | 18-49 | 50+ | Black | White | ||
| Worried about possible side effects | 59% | 59% | 54% | 58% | 63% | 71% | 56% |
| Do not trust the government to make sure the vaccine is safe and effective | 55 | 52 | 56 | 55 | 53 | 58 | 54 |
| Vaccine is too new and want to wait and see how it works for other people | 53 | 54 | 41 | 57 | 46 | 71 | 48 |
| Politics has played too much of a role in the vaccine development process | 51 | 46 | 53 | 47 | 59 | 54 | 49 |
| The risks of COVID-19 are being exaggerated | 43 | 40 | 57 | 40 | 51 | 33 | 49 |
| Don’t trust vaccines in general | 37 | 43 | 31 | 37 | 38 | 47 | 36 |
| Do not trust the health care system | 35 | 34 | 36 | 32 | 42 | 28 | 36 |
| Worried that they may get COVID-19 from the vaccine | 27 | 30 | 18 | 26 | 26 | 50 | 21 |
| Don’t think they are at risk of getting sick from COVID-19 | 20 | 18 | 23 | 18 | 26 | 20 | 19 |
| NOTE: Sample size too small to report separately among Democrats and Hispanics who say they definitely or probably won’t get vaccinated. See Appendix A for tables based on total. | |||||||
COVID-19 Vaccine Confidence And Expectations
A large majority (71%) of the public believes a vaccine will be widely available for anyone who wants it in the U.S. by the summer of 2021. This includes about three in ten who believe it will be available sooner, either by the end of 2020 or early in 2021. About a quarter (26%) of the public is more skeptical, expecting that a vaccine won’t be widely available until the end of 2021 or sometime in 2022.
A critical question that has already begun to face policymakers is how to prioritize different groups and ensure equitable distribution of the vaccine. On this question, the public’s confidence has increased markedly over the past several months, particularly among Black Americans. Two-thirds of the public now say they are at least somewhat confident that when a COVID-19 vaccine becomes available, it will be distributed in a way that is fair, up from about half (52%) in September (before the presidential election and positive news about several vaccine candidates). Among Black Americans, the share has nearly doubled, from 32% to 62%.
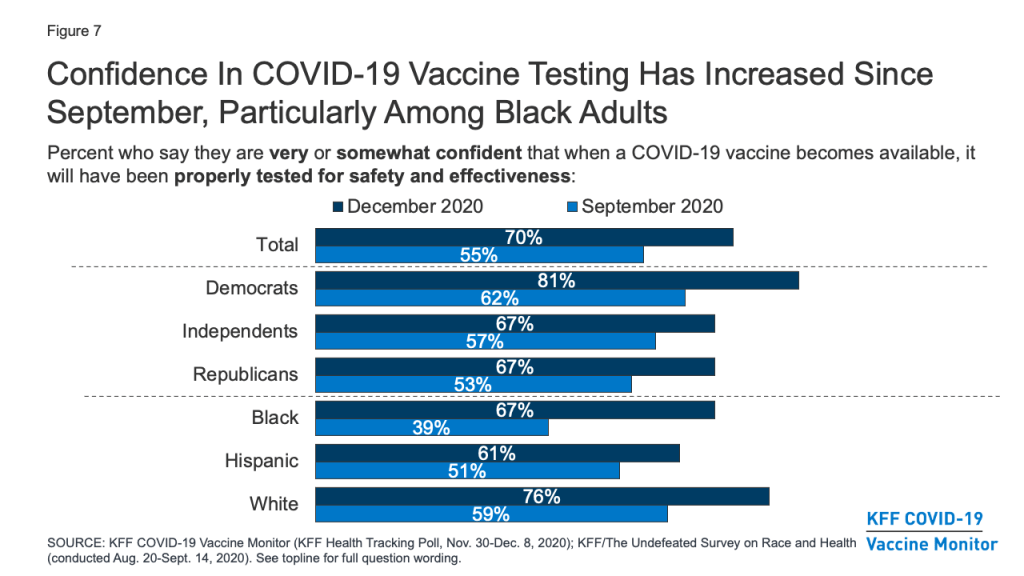
Similarly, a larger share of the public now compared to September say they are very or somewhat confident that when a COVID-19 vaccine becomes available, it will have been properly tested for safety and effectiveness (70%, up from 55% in September). Again, the increase was most pronounced among Black Americans (67%, up from 39%).
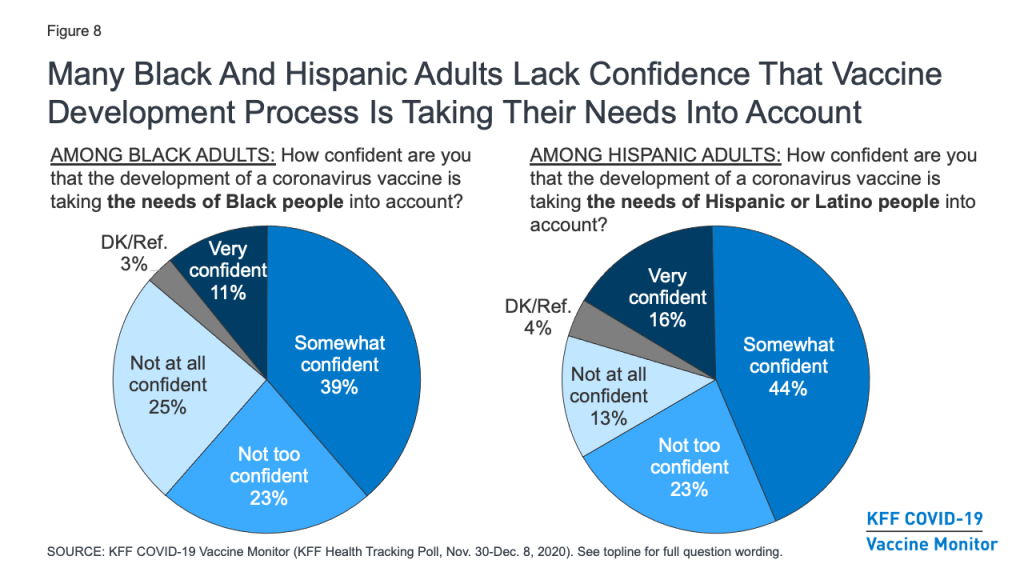
Still, concerns remain about whether the needs of people of color are being accounted for in the vaccine development process. About half (48%) of Black adults say they are not confident that the development of a COVID-19 vaccine is taking the needs of Black people into account (down from 65% in September), and over a third (36%) of Hispanic adults say the same about the needs of Hispanic people.
Other COVID-19 Vaccine Attitudes
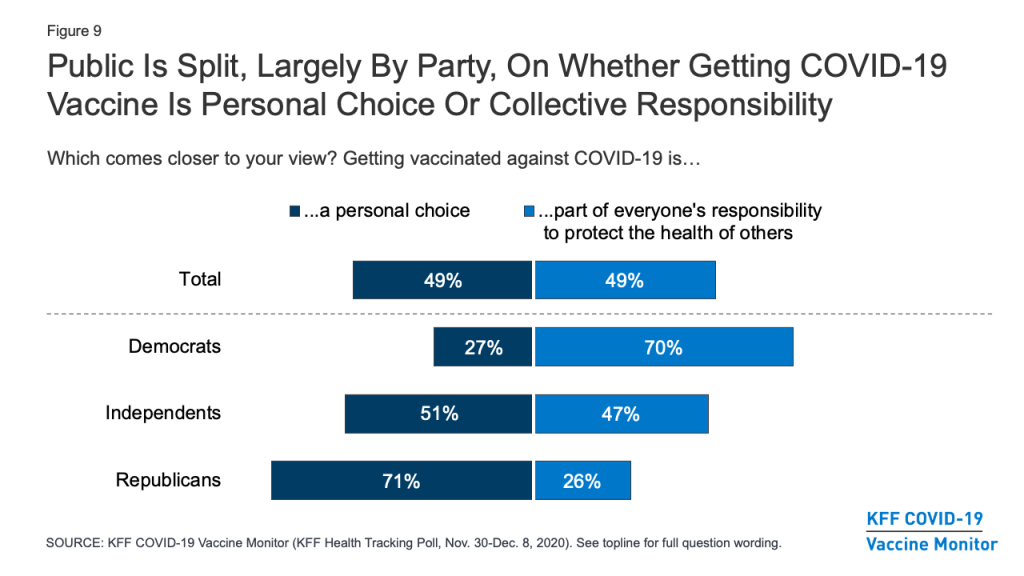
The KFF COVID-19 Vaccine Monitor is also tracking other attitudes related to vaccination and examining the relationship of these attitudes to vaccine hesitancy. One question that has implications for vaccine messaging is whether people think getting vaccinated is more a matter of individual freedom or one of collective responsibility. The latest survey finds the public evenly divided, with about half (49%) saying that getting vaccinated against COVID-19 is “a personal choice” and the other half (49%) saying it is “part of everyone’s responsibility to protect the health of others.” Partisans diverge on this question, with seven in ten Democrats saying getting vaccinated part of everyone’s responsibility to protect public health, and a similar share of Republicans (71%) saying it is a personal choice. As will be shown below, these attitudes are related to people’s personal plans to get a COVID-19 vaccine when one becomes available.
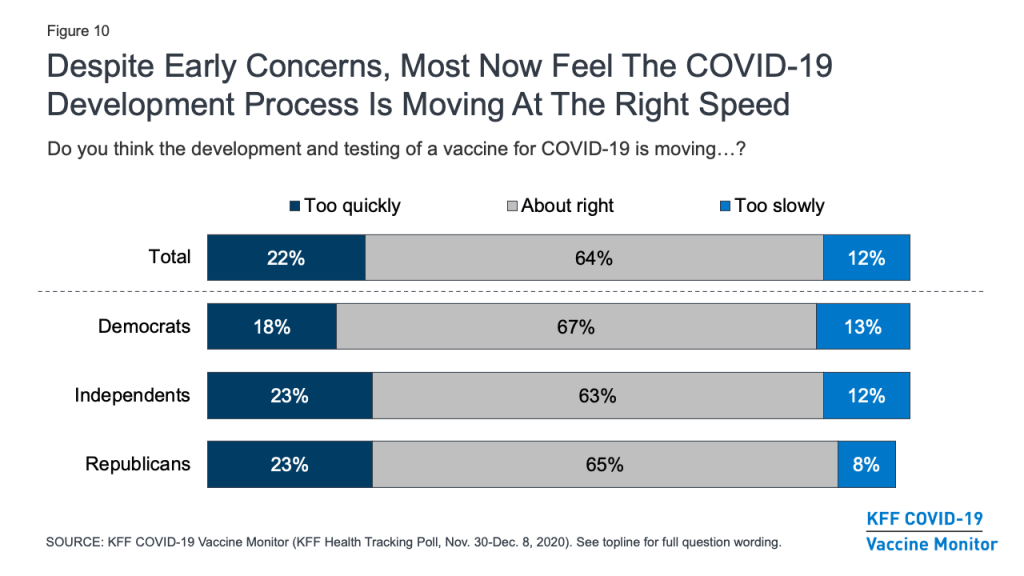
With the name “Operation Warp Speed” given to the U.S. COVID-19 vaccine development effort, there were early concerns that the public would lack trust in a vaccine they might view as being rushed to market. In fact, KFF polling in September and October found that many U.S. adults were concerned that the FDA would rush to approve a vaccine under political pressure from the Trump White House. The latest survey, however, finds that about two-thirds of the public (64%) – including similar shares of Democrats, Republicans, and independents – feel that the development and testing of the vaccine is moving at about the right speed, while small shares say it is moving too quickly (22%) or too slowly (12%).
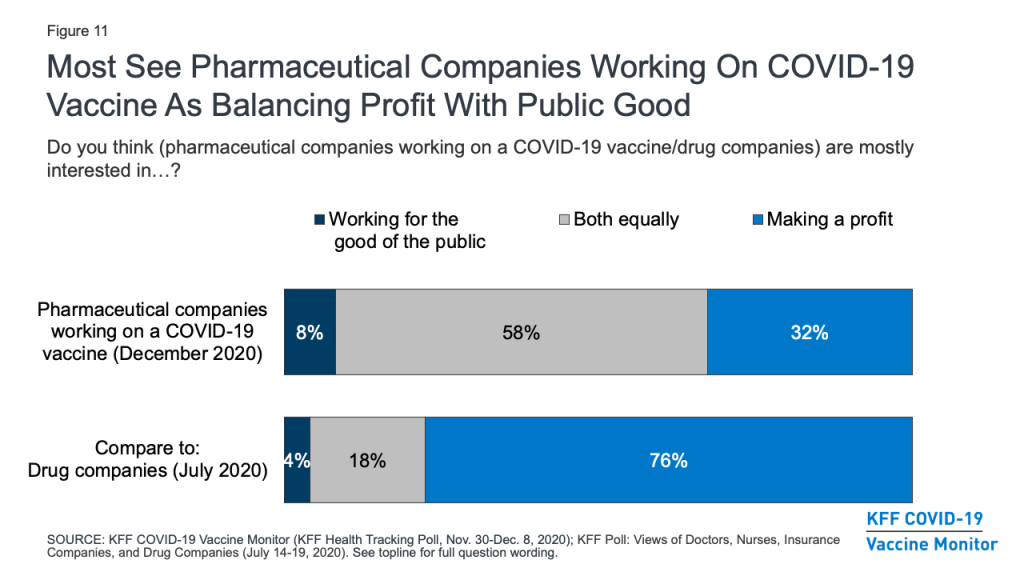
The financial motivations of pharmaceutical companies have also been raised as a potential barrier to gaining the public’s trust in a COVID-19 vaccine. The survey suggests that the public’s typically harsh views of these companies’ profit motives may be somewhat softened in light of the pandemic. A KFF survey earlier this year that asked about “drug companies” in general found that three-quarters (76%) of the public thought these companies were mostly interested in making a profit, while smaller shares said they were mainly interested in working for the good of the public (4%) or about equally motivated by both profits and the public good (18%). The December survey asked more specifically about “pharmaceutical companies working on a COVID-19 vaccine” and found that most (58%) said these companies were equally interested in working for the public good and making a profit, while the share who saw profit as their main motivation was much smaller (32%).
Profiles Of The Public By Vaccine Enthusiasm Levels
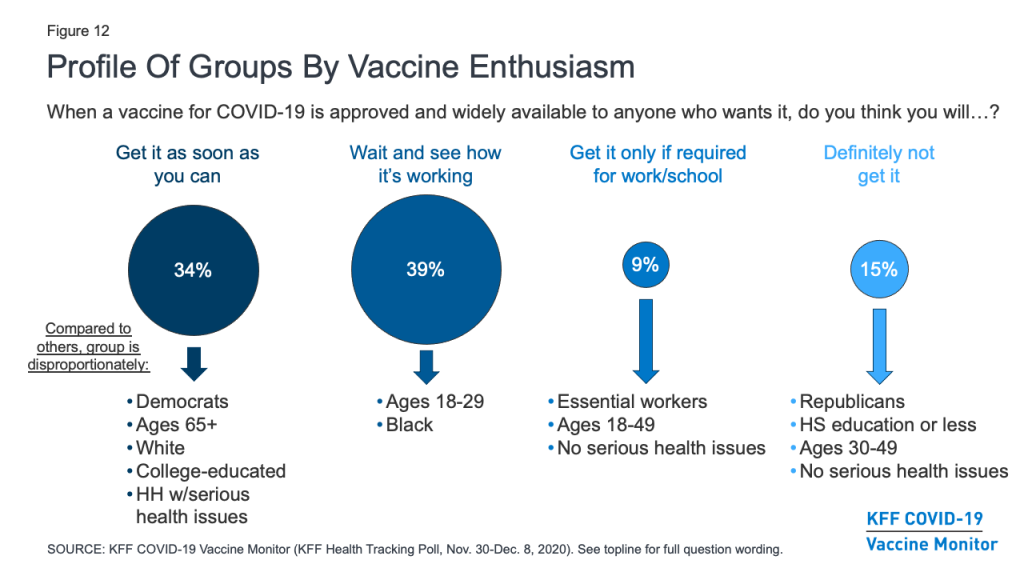
The KFF COVID-19 Vaccine Monitor also gauged the public’s enthusiasm for getting vaccinated and identified four groups of individuals that may require different communications strategies when it comes to a COVID-19 vaccine. (See Appendix B for more details about the demographics of each of these groups.)
About a third of the public (34%) belong to the “as soon as possible” group who say that when a vaccine is approved and widely available, they will get it as soon as they can. This group is disproportionately made up of Democrats (43% vs. 32% of the public overall), adults ages 65 and over (33% vs. 21%), White adults (71% vs. 61%), those with college degrees (39% vs. 31%), and those who have a serious health condition or live with someone who does (52% vs. 46%). Given their eagerness to get vaccinated, some people in this group may be frustrated with the pace of vaccine distribution if they do not fall into one of the priority groups for early vaccination. Messages emphasizing the reasons why different groups are prioritized may be important for this group.
About four in ten (39%) of the public belong to the “wait and see” group. These individuals are a mix of those who say they definitely or probably will get vaccinated and those who say they probably will not – but all say that when a vaccine becomes widely available, they will wait until it has been available for a while to see how it is working for other people before getting vaccinated themselves. This group looks a lot like the general public, but it somewhat overrepresents young adults ages 18-29 (28% vs. 21% of the general population) and Black adults (16% vs. 12%). Ultimate willingness to get vaccinated among this group will depend a lot on news coverage of events that unfold during the early rollout of the vaccine with priority populations. What they hear and learn about side effects, efficacy, and access to the vaccine will be important in shaping their ultimate decisions about whether and when to get vaccinated. This group is also likely to be the most dynamic during the early stages of rollout, potentially shifting their responses between “probably will” and “probably won’t” get vaccinated as the narrative around the COVID-19 vaccine changes.
The smallest group – representing 9% of the public – says they will only get vaccinated if it is required for work, school, or other activities. This group is somewhat younger than the general population (74% are under age 50, compared with 54% of all adults). Importantly, about six in ten within this group (61%) say they have been classified as an essential worker, meaning they are required to work outside their home during the pandemic. Though small, the fact that such a large share of this group is in a category at high risk for coronavirus exposure makes them an important group for increasing vaccine confidence.
Finally, 15% of the public falls into the group that is most resistant, those who say they definitely would not get a COVID-19 vaccine, even if it were deemed safe by scientists and available for free. This group is disproportionately made up of Republicans (41% vs. 25% of the general public) and those with no additional schooling beyond high school (53% vs. 38%). It also somewhat overrepresents people ages 30-49 (46% vs. 33%). This group is the most skeptical, and may be the hardest to reach with pro-vaccine messaging.
Looked at another way, the share of the public that falls into each of these groups differs by partisanship and racial and ethnic background. For example, about half of Black adults (52%) fall into the “wait and see” group, compared to about four in ten Hispanic adults (43%) and just over a third of White adults (36%). By contrast, White adults (40%) are more likely than Black adults (20%) or Hispanic adults (26%) to be in the “as soon as possible” group.
Looking across partisan groups, nearly half of Democrats (47%) are in the “as soon as possible” category, compared to about three in ten independents (30%) and Republicans (28%). And while majorities across partisan groups are in one of the first two categories, a quarter of Republicans and 17% of independents say they definitely won’t get the vaccine, much higher than the share among Democrats (5%).
| Table 2: COVID-19 Vaccine Enthusiasm By Party Identification And Race/Ethnicity | |||||||
| Percent who say, when a vaccine for COVID-19 is approved by the FDA and widely available to anyone who wants it, they will: | Total | Party ID | Race/Ethnicity | ||||
| Dem. | Ind. | Rep. | Black | Hispanic | White | ||
| Get the vaccine as soon as they can | 34% | 47% | 30% | 28% | 20% | 26% | 40% |
| Wait until it has been available for a while to see how it is working for other people | 39 | 41 | 38 | 33 | 52 | 43 | 36 |
| Only get the vaccine if they are required to do so for work, school, or other activities | 9 | 5 | 11 | 10 | 10 | 11 | 7 |
| Definitely not get the vaccine | 15 | 5 | 17 | 25 | 15 | 18 | 15 |
| Don’t know/Refused | 3 | 2 | 4 | 4 | 3 | 2 | 3 |
Besides differing in their demographics, these groups also differ in many of their attitudes and behaviors. For example, the vast majority (93%) of those who say they definitely won’t get vaccinated and two-thirds (66%) of those who say they’ll only get vaccinated if required to do so for work or school view getting vaccinated for COVID-19 as a personal choice, compared to about half (47%) of the “wait and see” group and just a quarter (23%) of the “as soon as possible” group. The more hesitant groups are also much more likely than the more enthusiastic groups to say that the seriousness of COVID-19 is generally exaggerated in the news. Conversely, about eight in ten in both the “as soon as possible” (80%) and “wait and see” groups (77%) say they are very or somewhat worried that they or someone in their family will get sick with COVID-19, compared to about six in ten in the “only if required” group (57%) and just a quarter (27%) of the “definitely not” group.
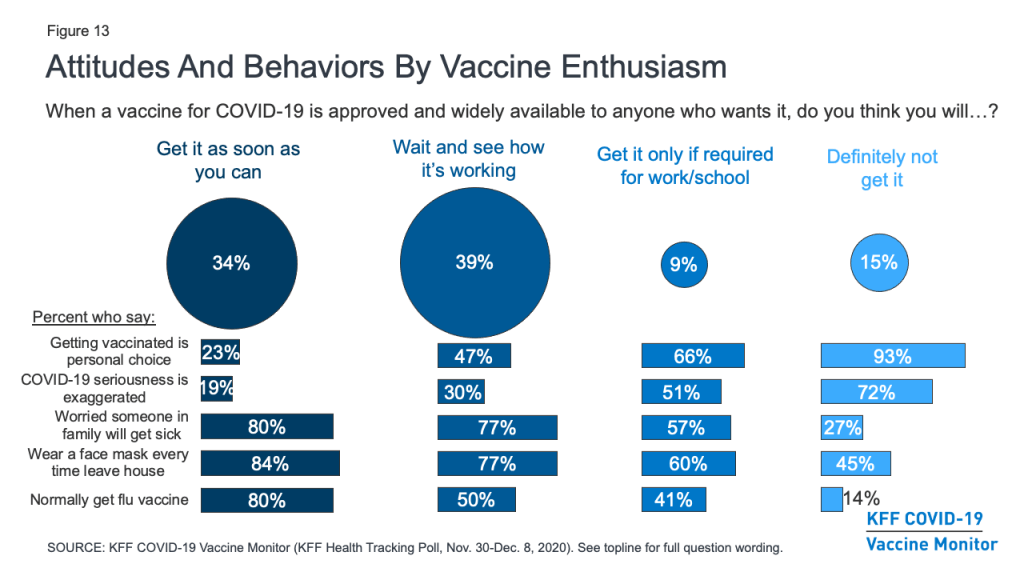
Behaviors around non-coronavirus vaccines and other protective measures also differ among these groups. For example, about eight in ten in the more vaccine-accepting groups say they wear a face mask every time they leave the house and might be in contact with other people, compared with about six in ten in the “only if required” group and fewer than half (45%) in the “definitely not” group. There is also a linear relationship between vaccine enthusiasm and the share who say they normally get a flu vaccine each year, ranging from 80% in the “as soon as possible” group to just 14% in the “definitely not” group.
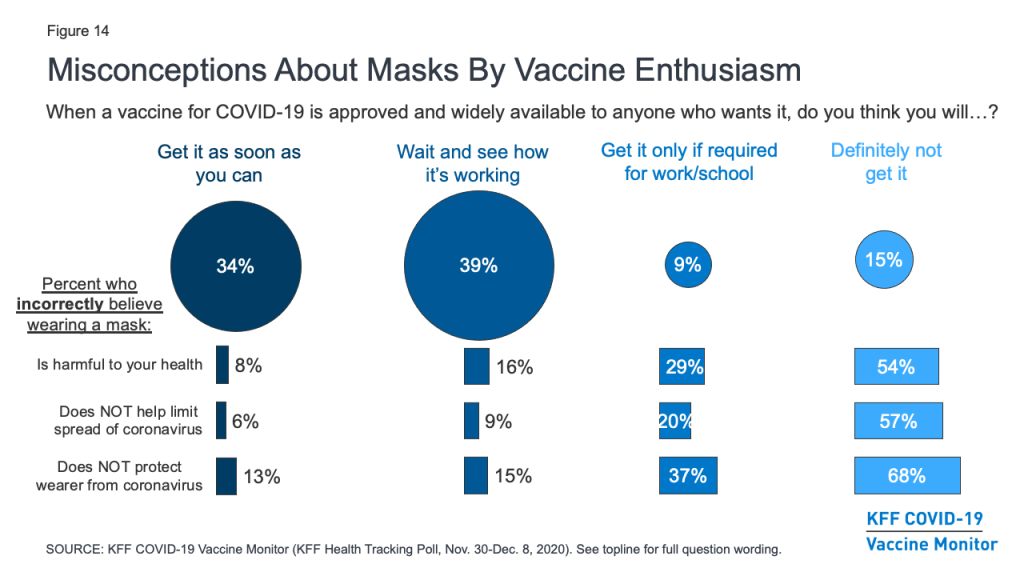
Importantly, the survey also suggests those who are more hesitant to get vaccinated for COVID-19 are also more likely to harbor misconceptions about other important public health measures. For example, about two-thirds (68%) of those who say they definitely won’t get vaccinated and nearly four in ten (37%) of those who say they’ll only get it if required believe that wearing a face mask does not help protect the wearer from coronavirus. Similarly, over half (54%) of the “definitely not” group and three in ten (29%) of the “only if required” group believe that wearing a face mask is harmful to one’s health. Given that the basic public health messaging about the benefits of mask-wearing has not broken through for many of these individuals, novel strategies may be necessary to connect with them with during vaccination outreach efforts.
Trusted Messengers
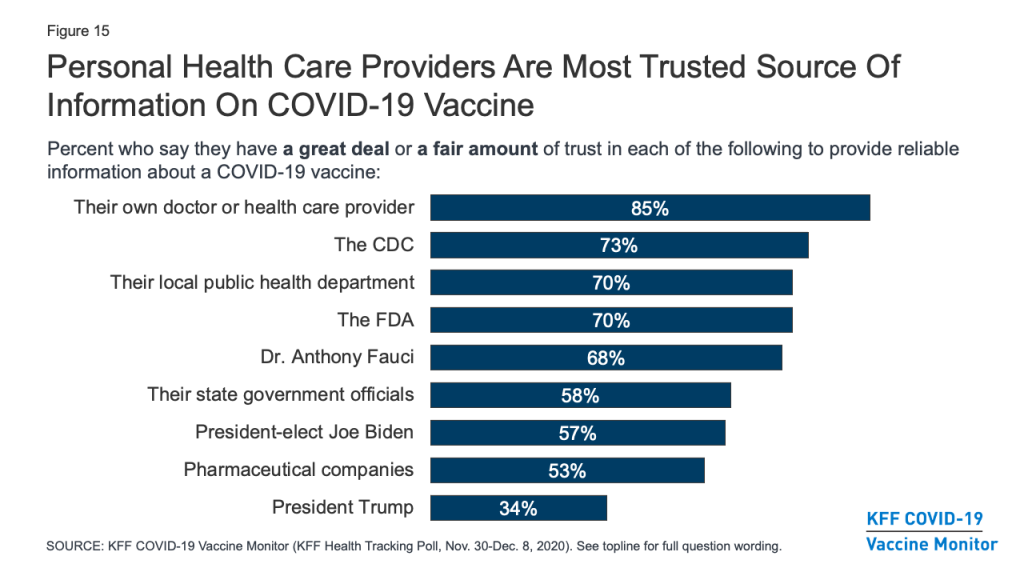
As vaccination efforts continue to roll out, the KFF COVID-19 Vaccine Monitor will be tracking which messengers are the most trusted sources of vaccine information for the public. The latest survey finds that, as with many health topics, people’s personal health care providers are at the top of the list, ahead of any national, state, or local messengers. More than eight in ten (85%) say they trust their own doctor or health care provider “a great deal” or “a fair amount” to provide reliable information on a COVID-19 vaccine. About seven in ten also trust national messengers like the U.S. CDC (73%), FDA (70%), and Dr. Anthony Fauci (68%), as well as their local public health department (70%). Somewhat fewer, but still a majority, put at least a fair amount of trust in their state government officials (58%), president-elect Joe Biden (57%), and pharmaceutical companies (53%), while just 34% say they trust President Trump.
Trust in personal doctors for vaccine information is universally high across partisan identification and race/ethnicity. However, when it comes to government-affiliated sources of information such as the CDC and even local public health departments, a much larger share of Democrats compared with Republicans say they trust each to provide reliable information about a COVID-19 vaccine, with independents generally falling in the middle. Predictably, trust in President-elect Biden and President Trump falls sharply along partisan lines.
| Table 3: Trust In Sources Of COVID-19 Vaccine Information By Party Identification And Race/Ethnicity | |||||||
| Percent who say they trust each of the following a great deal or a fair amount to provide reliable information about a COVID-19 vaccine: | Total | Party ID | Race/Ethnicity | ||||
| Dem. | Ind. | Rep. | Black | Hispanic | White | ||
| Their own doctor or health care provider | 85% | 93% | 84% | 81% | 85% | 75% | 87% |
| The U.S. Centers for Disease Control and Prevention, or CDC | 73 | 88 | 70 | 57 | 78 | 71 | 73 |
| The U.S. Food and Drug Administration, or FDA | 70 | 81 | 67 | 62 | 74 | 66 | 71 |
| Their local public health department | 70 | 87 | 67 | 56 | 79 | 65 | 70 |
| Dr. Anthony Fauci, the director of the National Institute of Allergy and Infectious Diseases | 68 | 90 | 67 | 47 | 77 | 62 | 68 |
| Their state government officials | 58 | 77 | 53 | 47 | 65 | 53 | 60 |
| President-elect Joe Biden | 57 | 93 | 52 | 23 | 76 | 58 | 54 |
| Pharmaceutical companies | 53 | 67 | 48 | 45 | 58 | 50 | 54 |
| President Trump | 34 | 7 | 30 | 78 | 12 | 26 | 41 |
Trusted messengers also differ among the different profile groups according to vaccine enthusiasm. The easiest group to convince – those who say they’ll get the vaccine as soon as they can – place a high level of trust in each type of messenger asked about, with the exception of President Trump. The “wait and see” and “only if required” groups both place the highest level of trust in their own health care providers, but majorities of both of these groups also say they trust a variety of national and local messengers including the CDC, FDA, Dr. Anthony Fauci, and their local public health departments. The “only if required” group is somewhat more divided politically, with about four in ten (43%) saying they trust President-elect Biden at least a fair amount for reliable vaccine information and a similar share (46%) saying they trust President Trump.
The group that says they definitely will not get vaccinated may be the hardest to reach with any traditional public health messengers. Very few say they place much trust in most of the messengers asked about at the national, state, or local level. Only two messengers are trusted by at least half the people in this group: their own doctor or health care provider (59%) and President Trump (56%), suggesting that individual health care practitioners will be one of the only avenues for reaching this group with accurate and timely vaccine information.
| Table 4: Trust In Sources of COVID-19 Vaccine Information By COVID-19 Vaccine Enthusiasm | ||||||
| Percent who say they trust each of the following a great deal or a fair amount to provide reliable information about a COVID-19 vaccine: | Total | Get it as soon as you can | Wait and see | Get it only if required | Definitely will not get | |
| Their own doctor or health care provider | 85% | 96% | 87% | 82% | 59% | |
| The U.S. Centers for Disease Control and Prevention, or CDC | 73 | 89 | 78 | 68 | 26 | |
| The U.S. Food and Drug Administration, or FDA | 70 | 86 | 75 | 66 | 26 | |
| Their local public health department | 70 | 84 | 76 | 67 | 28 | |
| Dr. Anthony Fauci, the director of the National Institute of Allergy and Infectious Diseases | 68 | 87 | 73 | 64 | 16 | |
| Their state government officials | 58 | 72 | 61 | 57 | 22 | |
| President-elect Joe Biden | 57 | 77 | 62 | 43 | 14 | |
| Pharmaceutical companies | 53 | 70 | 53 | 46 | 20 | |
| President Trump | 34 | 26 | 28 | 46 | 56 | |
Appendices
| Appendix A. Shares Who Say They Are Vaccine Hesitant And Reasons Why, By Party Identification, Age, and Race/Ethnicity | |||||||||
| Total | Party ID | Age | Race/Ethnicity | ||||||
| Dems | Inds | Reps | 18-49 | 50+ | Black | White | Hisp. | ||
| Percent who say they would definitely or probably not get vaccinated for COVID-19: | 27% | 12% | 31% | 42% | 33% | 21% | 35% | 26% | 26% |
| Percent say they would probably or not get vaccinated and each of the following is a major reason why (based on total): | |||||||||
| Worried about possible side effects | 16% | 10% | 18% | 23% | 19% | 13% | 25% | 14% | 15% |
| Do not trust the government to make sure the vaccine is safe and effective | 15 | 8 | 16 | 23 | 18 | 11 | 21 | 14 | 13 |
| Vaccine is too new and want to wait and see how it works for other people | 15 | 10 | 17 | 17 | 19 | 10 | 25 | 13 | 16 |
| Politics has played too much of a role in the vaccine development process | 14 | 7 | 14 | 22 | 15 | 12 | 19 | 13 | 12 |
| The risks of COVID-19 are being exaggerated | 12 | 3 | 13 | 24 | 13 | 11 | 12 | 13 | 9 |
| Don’t trust vaccines in general | 10 | 5 | 13 | 13 | 12 | 8 | 17 | 9 | 9 |
| Do not trust the health care system | 10 | 5 | 11 | 15 | 11 | 9 | 10 | 9 | 7 |
| Worried that they may get COVID-19 from the vaccine | 7 | 5 | 9 | 8 | 8 | 5 | 17 | 6 | 6 |
| Don’t think they are at risk of getting sick from COVID-19 | 6 | 2 | 6 | 10 | 6 | 5 | 7 | 5 | 7 |
| Appendix B. Demographic Profiles Of Vaccine Enthusiasm Groups | |||||
| “As soon as possible” | “Wait and see” | “Only if required” | “Definitely won’t get it” | Percent of total public | |
| Percent of total | 34% | 39% | 9% | 15% | 100% |
| Gender | |||||
| Male | 49% | 46% | 53% | 53% | 49% |
| Female | 51 | 53 | 47 | 47 | 51 |
| Party ID | |||||
| Democrats | 43% | 33% | 18% | 11% | 32% |
| Independents | 27 | 30 | 38 | 34 | 30 |
| Republicans | 20 | 22 | 28 | 41 | 25 |
| Age | |||||
| 18-29 | 13% | 28% | 28% | 18% | 21% |
| 30-49 | 26 | 30 | 47 | 46 | 33 |
| 50-64 | 28 | 23 | 21 | 23 | 25 |
| 65+ | 33 | 19 | 5 | 11 | 21 |
| Race/Ethnicity | |||||
| White, Non-Hispanic | 71% | 56% | 47% | 58% | 61% |
| Black, Non-Hispanic | 7 | 16 | 14 | 12 | 12 |
| Hispanic | 12 | 18 | 20 | 19 | 16 |
| Other | 8 | 7 | 16 | 7 | 9 |
| Essential worker status | |||||
| Employed and essential worker | 30% | 34% | 61% | 44% | 37% |
| Employed and not essential worker | 21 | 20 | 11 | 14 | 18 |
| Not employed (includes those who are retired or students) | 49 | 45 | 27 | 42 | 44 |
| Health care worker in household | |||||
| Health care worker in household | 13% | 16% | 21% | 16% | 16% |
| Respondent is a health care worker | 5 | 6 | 14 | 3 | 6 |
| Other household member is a health care worker | 7 | 9 | 6 | 11 | 8 |
| Respondent and another household member are health care workers | 1 | 0 | 1 | 2 | 1 |
| No health care worker in household | 86 | 84 | 79 | 84 | 84 |
| Serious health condition in household | |||||
| Someone in household has a serious health condition | 52% | 48% | 33% | 34% | 46% |
| No one in household has serious health condition | 47 | 50 | 67 | 65 | 53 |
| Community Type | |||||
| Urban | 38% | 35% | 33% | 35% | 36% |
| Suburban | 51 | 53 | 53 | 49 | 51 |
| Rural | 11 | 12 | 14 | 16 | 12 |
| Education | |||||
| High school or less | 30% | 41% | 31% | 53% | 38% |
| Some college | 30 | 30 | 38 | 28 | 30 |
| College+ | 39 | 29 | 31 | 19 | 31 |
| Household income | |||||
| <$40K | 33% | 37% | 31% | 35% | 35% |
| $40K-<$90K | 27 | 32 | 27 | 26 | 28 |
| $90K+ | 33 | 21 | 36 | 29 | 28 |
| Don’t know/Refused | 7 | 9 | 6 | 10 | 9 |
Methodology
This KFF COVID-19 Vaccine Monitor survey was designed and analyzed by public opinion researchers at the Kaiser Family Foundation (KFF). The survey was conducted November 30- December 8, 2020, among a nationally representative random digit dial telephone sample of 1,676 adults ages 18 and older (including interviews from 298 Hispanic adults and 390 non-Hispanic Black adults), living in the United States, including Alaska and Hawaii (note: persons without a telephone could not be included in the random selection process). Phone numbers used for this study were randomly generated from cell phone and landline sampling frames, with an overlapping frame design, and disproportionate stratification aimed at reaching Hispanic and non-Hispanic Black respondents. The sample also includes interviews completed with respondents who had previously completed an interview on the KFF Tracking Poll (n =267) or an interview on the SSRS Omnibus poll (and other RDD polls) and identified as Hispanic (n = 80; including 14 in Spanish) or non-Hispanic Black (n=179). Computer-assisted telephone interviews conducted by landline (391) and cell phone (1,285, including 947 who had no landline telephone) were carried out in English and Spanish by SSRS of Glen Mills, PA. To efficiently obtain a sample of lower-income and non-White respondents, the sample also included an oversample of prepaid (pay-as-you-go) telephone numbers (25% of the cell phone sample consisted of prepaid numbers) Both the random digit dial landline and cell phone samples were provided by Marketing Systems Group (MSG). For the landline sample, respondents were selected by asking for the youngest adult male or female currently at home based on a random rotation. If no one of that gender was available, interviewers asked to speak with the youngest adult of the opposite gender. For the cell phone sample, interviews were conducted with the adult who answered the phone. KFF paid for all costs associated with the survey.
The combined landline and cell phone sample was weighted to balance the sample demographics to match estimates for the national population using data from the Census Bureau’s 2019 U.S. American Community Survey (ACS), on sex, age, education, race, Hispanic origin, and region, within race-groups, along with data from the 2010 Census on population density. The sample was also weighted to match current patterns of telephone use using data from the January- June 2019 National Health Interview Survey. The weight takes into account the fact that respondents with both a landline and cell phone have a higher probability of selection in the combined sample and also adjusts for the household size for the landline sample, and design modifications, namely, the oversampling of prepaid cell phones and likelihood of non-response for the re-contacted sample. All statistical tests of significance account for the effect of weighting.
The margin of sampling error including the design effect for the full sample is plus or minus 3 percentage points. Numbers of respondents and margins of sampling error for key subgroups are shown in the table below. For results based on other subgroups, the margin of sampling error may be higher. Sample sizes and margins of sampling error for other subgroups are available by request. Note that sampling error is only one of many potential sources of error in this or any other public opinion poll. Kaiser Family Foundation public opinion and survey research is a charter member of the Transparency Initiative of the American Association for Public Opinion Research.
| Group | N (unweighted) | M.O.S.E. |
| Total | 1,676 | ± 3 percentage points |
| Race/Ethnicity | ||
| White, non-Hispanic | 842 | ± 4 percentage points |
| Black, non-Hispanic | 390 | ± 7 percentage points |
| Hispanic | 298 | ± 7 percentage points |
| Party Identification | ||
| Democrat | 617 | ± 5 percentage points |
| Republican | 382 | ± 6 percentage points |
| Independent | 478 | ± 5 percentage points |
| Vaccine Uptake | ||
| Definitely/probably would get vaccine | 1,213 | ± 4 percentage points |
| Definitely/probably would not get vaccine | 427 | ± 6 percentage points |