Impact of Key Provisions of the American Rescue Plan Act of 2021 COVID-19 Relief on Marketplace Premiums

Authors: Daniel McDermott, Cynthia Cox, and Krutika Amin
Published: Mar 15, 2021

Data Note

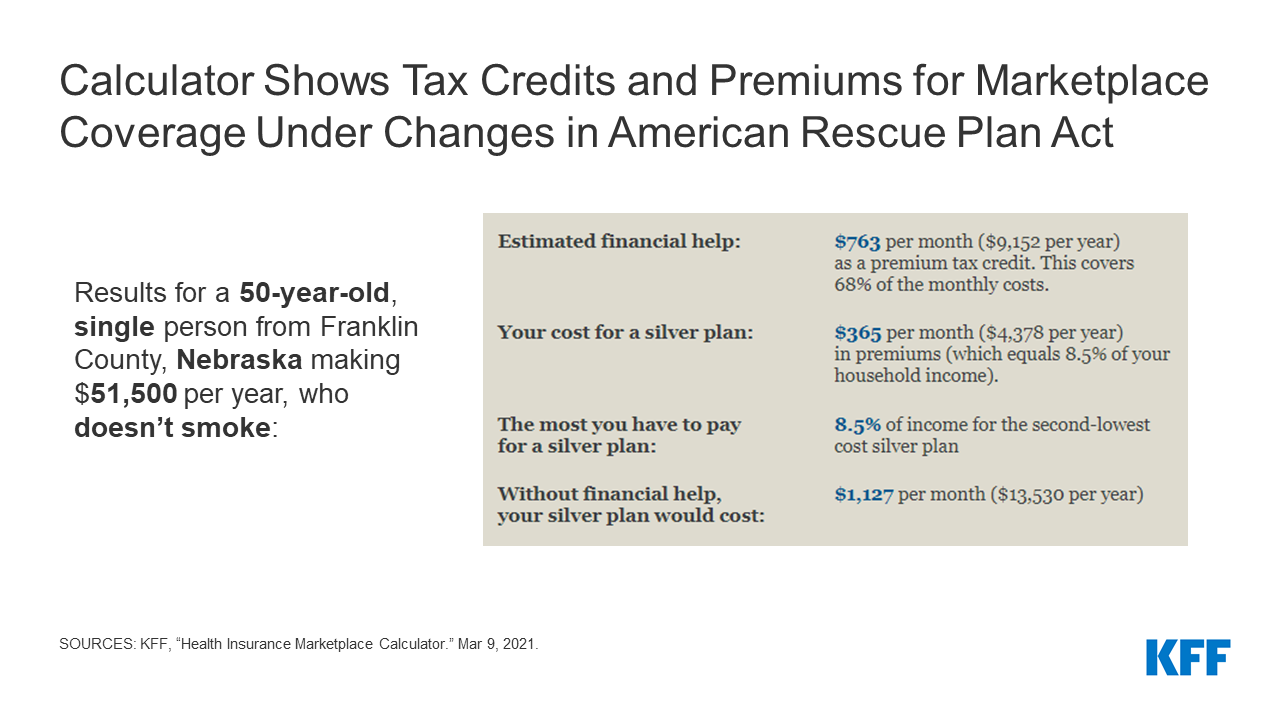
The Affordable Care Act (ACA) made premium tax credits available to people purchasing health coverage on the Marketplaces, but generally only when their incomes fall between 100% and 400% of the federal poverty level. These subsidies work by capping what an enrollee must spend on a silver benchmark plan premium at no more than a certain percentage of the enrollee’s household income. The premium tax credit amount equals the difference between the actual benchmark plan premium for that individual and the required contribution. The tax credit can be applied to any metal level plan.

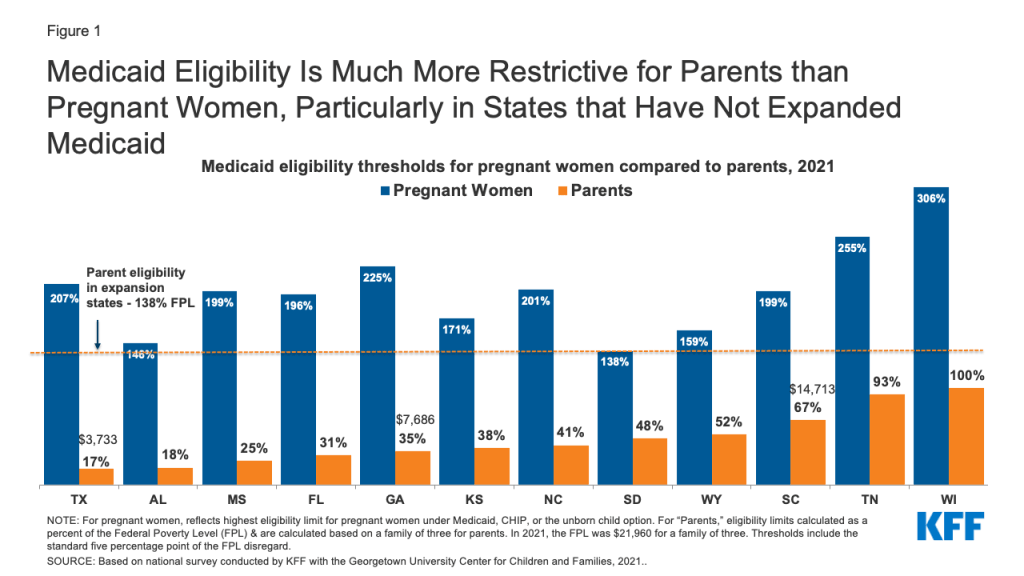
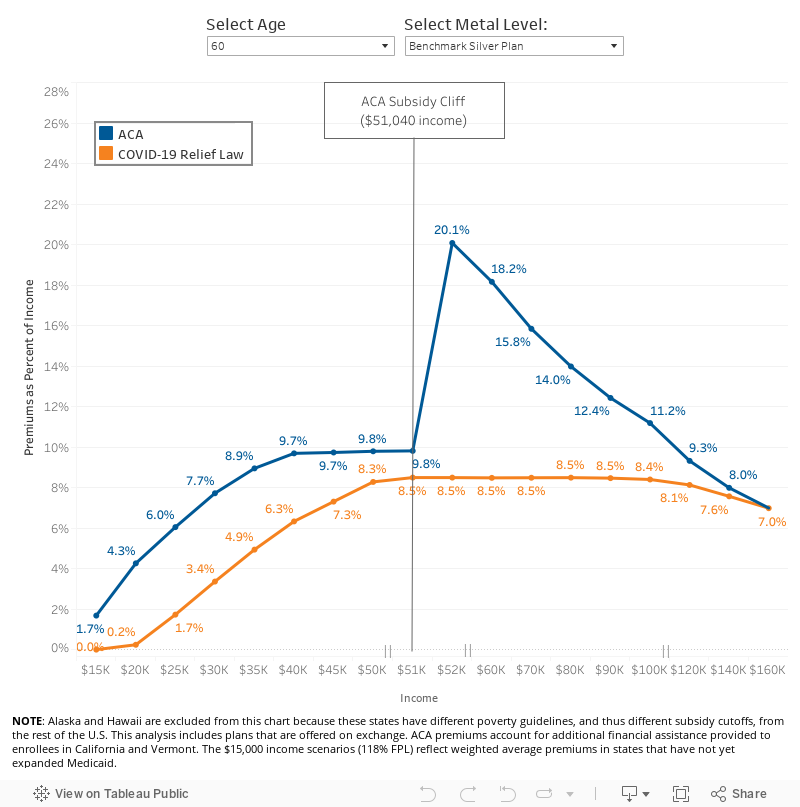
However, a sharp cliff exists at 400% of the poverty level. Under the ACA before any legislative changes, a 60-year-old making $50,000 per year (392% of poverty) would pay no more than $410 per month for a benchmark silver plan (9.83% of her income, after receiving an average subsidy of $548 per month). However, if her income crossed above $51,040 per year (400% of poverty), health insurance would become much more expensive. For example, at an income of $52,000 per year (408% of poverty), a 60-year-old would pay the full-priced premium, which, for a benchmark silver plan, averages $957 per month nationwide (22% of her income). This doubling of the premium payment for people with incomes just over 400% of poverty has been called the “subsidy cliff,” as shown in the blue line in Figure 1 below.

Additionally, there are millions of uninsured people who could be getting subsidized coverage on the ACA Marketplaces, but have not taken advantage of this financial help. In many cases, it may be that the financial help available to them is not sufficient to make the premium or the deductible affordable.

COVID-19 Relief Marketplace Subsidy Expansions

The American Rescue Plan Act of 2021 (COVID-19 relief) law passed in March 2021 expands Marketplace subsidies above 400% of poverty and also increases subsidies for those making between 100% and 400% of the poverty level, for two years (2021 and 2022), consistent with what President Biden proposed during his campaign.

These additional subsidies will yield substantially lower premium payments for the vast majority of the nearly 15 million uninsured people who are eligible to buy on the Marketplace and the nearly 14 million people insured on the individual market. With some exceptions (in the case of the highest income enrollees whose premiums may not be high enough to qualify for a subsidy), most of these 29 million people could see lower health insurance premiums as a result of these subsidies, and many could also afford lower deductible plans. However, it is far from certain how many people will take advantage of the new financial assistance.

Table 1 below compares the ACA and COVID-19 relief subsidy schedule, both of which are benchmarked to the premium of the second-lowest cost silver plan. The COVID-19 relief subsidy schedule increases subsidies across the board, notably extending them for the first time to people with incomes over 400% of the poverty level and guaranteeing access to a plan with a zero dollar premium payment for people with incomes between 100-150% of poverty. The COVID-19 relief law also expands Marketplace subsidies to people receiving unemployment insurance (UI), which we discuss more below.

Table 1: Percent of Income Paid for Marketplace Benchmark Silver Premium, by Income
Income (% of poverty)Affordable Care Act(before legislative change)COVID-19 Relief (current law 2021-2022)
Under 100%Not eligible for subsidies*Not eligible for subsidies**
100% – 138%2.07%0.0%
138% – 150%3.10% – 4.14%0.0%
150% – 200%4.14% – 6.52%0.0% – 2.0%
200% – 250%6.52% – 8.33%2.0% – 4.0%
250% – 300%8.33% – 9.83%4.0% – 6.0%
300% – 400%9.83%6.0% – 8.5%
Over 400%Not eligible for subsidies8.5%
NOTES: *Lawfully present immigrants whose household incomes are below 100% FPL and are not otherwise eligible for Medicaid are eligible for tax subsidies through the Marketplace if they meet all other eligibility requirements.**In the COVID-19 relief law, lawfully present immigrants in states that have not expanded Medicaid would continue to be eligible for marketplace subsidies. In addition, people receiving Unemployment Insurance (UI) are treated as though their income is no more than 133% of poverty for the purposes of the premium tax credit. This could extend premium tax credits to some individuals with incomes below poverty.SOURCE: KFF

Removing the Subsidy Cliff

We estimate that there are about 8 million people who either are buying unsubsidized plans or faced paying full-price for ACA coverage before the COVID-19 relief legislation went into effect. This included an estimated 3.4 million uninsured people who fell into the subsidy cliff (i.e. had incomes too high to qualify them for subsidies under the ACA). Additionally, it included about 3.3 million people buying off-exchange coverage and 1.4 million people buying unsubsidized on-exchange plans, presumably because many were ineligible to buy subsidized coverage.

By extending eligibility for Marketplace subsidies above 400% of poverty, the COVID-19 relief law flattens out the ACA’s subsidy cliff and lowers premiums for virtually everyone already eligible for Marketplace subsidies. As shown in Figure 1, older people with incomes just above 400% of poverty ($51,040 for a single individual) would receive substantial new subsidies. The benefit would gradually phase out at higher incomes, as benchmark silver premiums no longer cross the 8.5% of income threshold.


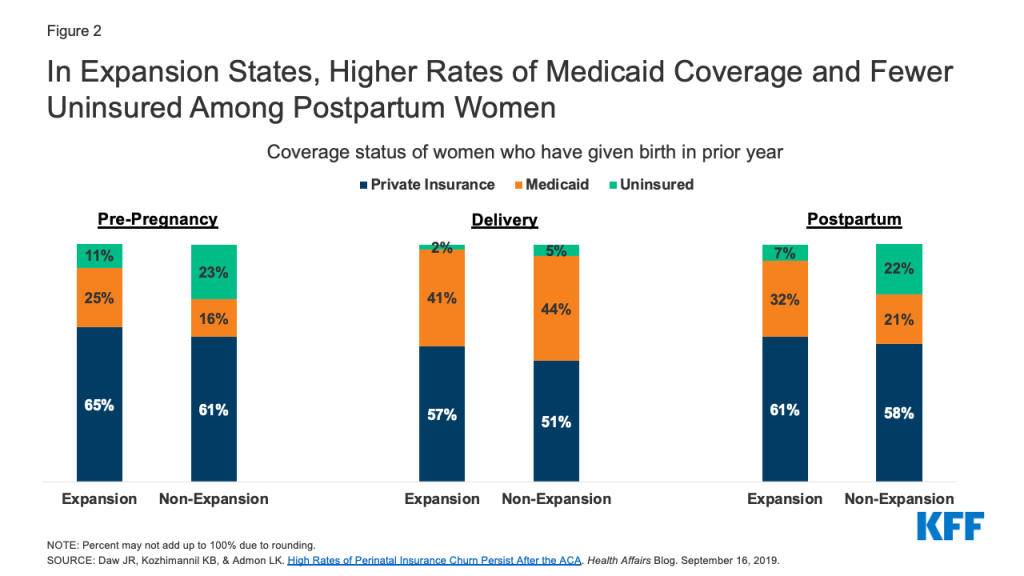
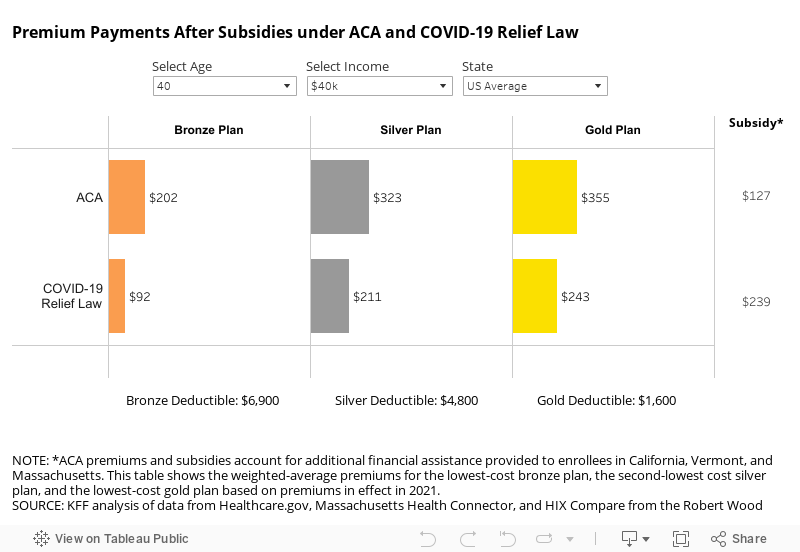
As noted above, older adults with incomes above 400% of poverty would generally see some of the most significant savings from the COVID-19 relief law. Uninsured people in the subsidy cliff tend to be older, on average, than those eligible for subsidies, because premiums were so high for this group under the ACA. Figure 2 below shows the amount of savings available to older enrollees currently falling in the subsidy cliff. Compared to current premium payments, a 60-year-old with a $55,000 income would pay 77% less for a bronze plan ($146 vs. $634 per month), 56% less for a benchmark silver plan ($390 vs. $887 per month), and 52% less for a gold plan ($453 vs. $951 per month), on average, under the COVID-19 Relief law. Many young adults with incomes above 400% of poverty who are currently in the subsidy cliff would also see savings under the COVID-19 relief law, but those savings would be more modest (a 6-9% drop, depending on the metal level, for an average 27 year old).

Expanded Subsidies for Those Already Eligible

While removing the subsidy cliff would provide some of the largest drops in premium payments, the COVID-19 relief’s additional subsidies to those already eligible are also substantial, particularly because they would guarantee zero-premium silver plans to millions of low-income enrollees. At least 3.4 million of the lowest income enrollees would see a 100% decrease in their premium contribution.

The COVID-19 relief sets benchmark silver premium contributions at $0 of income for all enrollees with incomes below 150% of poverty. These zero-premium silver plans would also come with cost-sharing reductions that lower deductibles substantially. Enrollees with incomes between 100-150% of poverty would become eligible for a zero-premium silver plan with an average deductible of $177.

Most of these enrollees would have already been eligible for a zero-premium bronze plan under the ACA, but bronze plans have a typical deductible of about $6,900. For the same $0 premium, the lowest-income Marketplace enrollees could have a deductible that is 97% lower under COVID-19 relief law.

People Receiving Unemployment Insurance

The COVID-19 relief law makes special considerations for people approved to receive or receiving unemployment compensation at any point in 2021. Under the COVID-19 relief law, if a person is receiving unemployment compensation and she qualifies to purchase insurance on the Marketplace, she and any eligible dependents can get a silver plan with a $0 premium. That is because, under the proposal, any household income above 133% of poverty is not considered in the calculation of her premium tax credit if she receives unemployment insurance.

For people receiving unemployment compensation at any point in 2021, their income up to 133% of poverty is counted in determining eligibility for a cost-sharing reduction, which is only available to people with incomes between 100% and 250% of poverty. That is, a person with income, including unemployment compensation, of 260% of poverty would receive a premium and cost-sharing reduction subsidy as if her income is 133% of poverty. A person receiving unemployment income would still need to attest that they do not have an affordable offer of employer-sponsored insurance from their spouse or other family member. As the COVID-19 relief law does not change the so-call “family glitch” in the ACA, if an employer offer is deemed affordable (9.83% of household income for 2021 for self-only coverage), this may disqualify people receiving unemployment income from receiving ACA subsidies if they still have a working family member with an employer offer.

State-Level Differences

As is the case under the ACA, the amount of the subsidy in the COVID-19 relief law would vary by age, income, and geography. Tables in the Appendix show premium payment at the national level for various age and income scenarios, and at the state level for a 60-year-old currently in the ACA subsidy cliff. Note that all tables take into account additional state subsidies that are already provided in California and Vermont, so the typical savings would be even greater if those state were excluded.

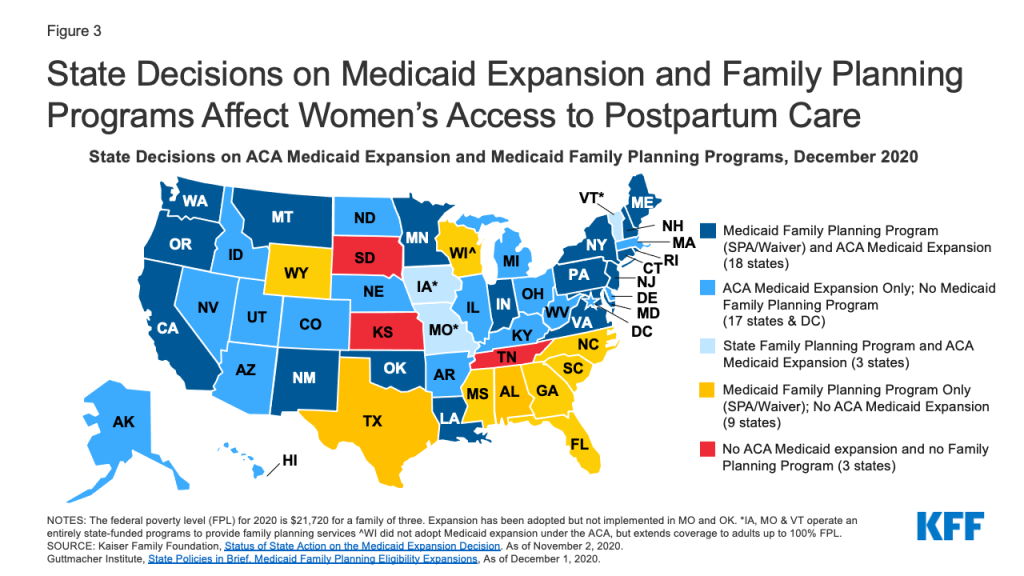
Older adults in the ACA subsidy cliff who are living in states with high premiums would see the largest premium savings from the COVID-19 relief law. As shown in the map below, a 60-year-old making $55,000 per year living in Wyoming, West Virginia, South Dakota, Nebraska, Connecticut, or Alabama would save over 70% on the benchmark silver plan, on average. Older adults previously in the ACA subsidy-cliff in several states would even become eligible for free bronze plans, as shown in the state-level Appendix table.

Implications for Federal Government Costs and the Uninsured Rate

The Congressional Budget Office (CBO) and Joint Committee on Taxation (JCT) project that the enhanced premium tax credits in the original House COVID-19 relief proposal would increase federal deficits by $34.2 billion over ten years (including an increase in direct federal spending of $22.0 billion and a reduction in revenues of $12.2 billion). Additionally, CBO and JCT expect the enhanced subsidies for people receiving unemployment insurance to add another $4.5 billion over the next ten years (including an increase in outlays of $2.4 billion and a decrease in revenues of $2.1 billion).

CBO projections are generally over a 10-year period. Because the enhanced subsidies only last two years, though, most of the costs would be concentrated in 2021 and 2022. However, CBO and JCT expect some new enrollees to continue purchasing subsidized Marketplace coverage for a few years, even if those enrollees are no longer receiving enhanced subsidies.

The CBO and JCT estimate that, in 2022, 1.7 million people would gain coverage through the Marketplace. They estimate that new enrollees will account for $13.0 billion in federal costs, with the remaining going to enhanced premium tax credits for existing enrollees.

Methods

We analyzed data from the 2021 Individual Market Medical files to determine premiums and the benchmark amounts to calculate premium tax credits for the scenarios presented. Premiums for state-based Marketplaces are from KFF analysis of data received from Massachusetts Health Connector, Covered CA, and KFF analysis of data published by HIX Compare from the Robert Wood Johnson Foundation. This analysis only includes on-exchange plans. The premium caps used to model premiums under the ACA and the COVID-19 relief law are shown in Table 1 above.

All averages are weighted by county-level 2020 plan selections. 2020 plan selections come from the 2020 Marketplace Open Enrollment Period County-Level Public Use file provided by CMS. In states running their own exchanges, we gathered county-level plan selection data where possible and otherwise estimated county plan selections based on the county population in the 2010 Census and total state plan selections in the 2020 OEP State-Level Public Use File provided by CMS.

Premium Interactive

Appendix

Appendix Table 1: Change in Monthly Benchmark Premium under  COVID-19 Relief Law
  27-year-old40-year-old60-year-old
IncomeFPLACACOVID-19 ReliefACACOVID-19 ReliefACACOVID-19 Relief
$20,000157%$72$4$72$4$72$4
$25,000196%$126$37$126$37$126$37
$30,000235%$193$85$193$85$193$85
$35,000274%$261$145$261$145$261$145
$40,000313%$316$211$323$211$324$211
$45,000353%$341$274$362$274$366$274
$50,000392%$354$330$394$344$408$346
$60,000470%$373$357$450$404$909$425
$70,000549%$373$367$450$430$924$496
$80,000627%$373$371$450$442$933$566
$90,000705%$373$373$450$447$933$636
$100,000784%$373$373$450$449$933$701
NOTES: This table shows enrollment-weighted average premiums for the lowest-cost bronze plan. ACA premiums account for additional financial assistance provided to enrollees in California, Vermont, and Massachusetts.SOURCE: KFF analysis of data from Healthcare.gov, Massachusetts Health Connector, and HIX Compare from the Robert Wood Johnson Foundation.
Appendix Table 2: Change in Monthly Bronze Premium under the COVID-19 Relief Law
  27-year-old40-year-old60-year-old
IncomeFPLACACOVID-19 ReliefACACOVID-19 ReliefACACOVID-19 Relief
$20,000157%$4$0$2$0$1$0
$25,000196%$37$0$24$0$3$0
$30,000235%$92$7$74$3$12$0
$35,000274%$158$49$139$33$42$2
$40,000313%$215$111$202$92$89$17
$45,000353%$240$172$240$153$124$50
$50,000392%$253$229$272$222$163$107
$60,000470%$272$256$328$282$656$178
$70,000549%$272$266$328$308$671$246
$80,000627%$272$270$328$320$680$315
$90,000705%$272$272$328$325$680$384
$100,000784%$272$272$328$327$680$449
NOTES: This table shows enrollment-weighted average premiums for the lowest-cost bronze plan. ACA premiums account for additional financial assistance provided to enrollees in California, Vermont, and Massachusetts.SOURCE: KFF analysis of data from Healthcare.gov, Massachusetts Health Connector, and HIX Compare from the Robert Wood Johnson Foundation.
Appendix Table 3: Change in Monthly Gold Premium under the COVID-19 Relief Law
 27-year-old40-year-old60-year-old
IncomeFPLACACOVID-19 ReliefACACOVID-19 ReliefACACOVID-19 Relief
$20,000157%$96$33$101$40$137$80
$25,000196%$150$62$155$68$190$106
$30,000235%$220$112$225$118$259$154
$35,000274%$287$172$293$177$326$212
$40,000313%$343$238$355$243$388$277
$45,000353%$368$300$393$306$430$339
$50,000392%$381$357$426$375$472$410
$60,000470%$400$384$482$436$972$489
$70,000549%$400$394$482$462$988$560
$80,000627%$400$398$482$474$996$630
$90,000705%$400$400$482$479$996$699
$100,000784%$400$400$482$481$996$765
NOTES: This table shows enrollment-weighted average premiums for the lowest-cost bronze plan. ACA premiums account for additional financial assistance provided to enrollees in California, Vermont, and Massachusetts.SOURCE: KFF analysis of data from Healthcare.gov, Massachusetts Health Connector, and HIX Compare from the Robert Wood Johnson Foundation.
Appendix Table 4: Average Change in Monthly Premium for Enrollee at $55,000 Income (430% of Poverty) Under the COVID-19 Relief Law, by State
 Lowest-Cost BronzeBenchmark SilverLowest-Cost Gold
StateACACOVID-19 ReliefACACOVID-19 ReliefACACOVID-19 Relief
Alabama$852$1$1,253$390$1,421$558
Arizona$726$198$925$390$1,175$640
Arkansas$684$238$836$390$1,059$613
California$349$176$566$390$605$428
Colorado$579$223$746$390$813$458
Connecticut$781$0$1,349$390$1,116$157
DC$726$221$894$390$929$424
Delaware$850$94$1,146$390$1,098$342
Florida$720$144$968$390$1,038$459
Georgia$738$162$966$390$982$406
Idaho$701$41$1,051$390$1,117$456
Illinois$716$210$897$390$1,016$509
Indiana$706$212$883$390$1,257$763
Iowa$660$13$1,110$390$941$221
Kansas$793$170$1,013$390$1,063$440
Kentucky$726$107$1,009$390$1,229$609
Louisiana$871$121$1,154$390$1,304$539
Maine$738$196$932$390$1,049$507
Maine$534$271$653$390$769$506
Maryland$471$123$738$390$695$347
Massachusetts$467$238$619$390$707$478
Michigan$542$196$738$390$785$437
Mississippi$864$279$974$390$1,153$569
Missouri$738$116$1,016$390$1,125$498
Montana$701$89$1,001$390$1,026$415
Nebraska$932$4$1,485$390$1,340$247
Nevada$594$150$834$390$1,003$559
New Hampshire$525$207$707$390$770$453
New Jersey$677$207$859$390$1,404$934
New Mexico$501$171$719$390$687$358
New York$430$223$597$390$709$502
North Carolina$742$64$1,095$390$1,101$395
North Dakota$579$0$1,047$390$918$261
Ohio$595$213$772$390$910$527
Oklahoma$780$63$1,177$390$1,065$287
Oregon$675$141$923$390$973$439
Pennsylvania$635$99$927$390$881$344
Rhode Island$491$139$742$390$719$367
South Carolina$697$86$1,005$390$1,090$474
South Dakota$965$57$1,312$390$1,385$463
Tennessee$722$152$983$390$1,197$604
Texas$640$113$917$390$911$383
Utah$578$22$956$390$980$413
Vermont$491$212$669$390$674$394
Virginia$760$134$1,016$390$984$358
Washington$595$163$821$390$895$463
West Virginia$1,266$281$1,375$390$1,752$767
Wisconsin$718$140$970$390$1,020$439
Wyoming$1,103$0$1,679$390$1,369$80
NOTES: This table shows enrollment-weighted average premiums for the lowest-cost bronze plan, the second-lowest cost silver plan, and the lowest-cost gold plan in each county, based on premiums in effect in 2021. ACA premiums account for additional financial assistance provided to enrollees in California, Vermont, and Massachusetts.SOURCE: KFF analysis of data from Healthcare.gov, Massachusetts Health Connector, and HIX Compare from the Robert Wood Johnson Foundation.

Medicaid Spending and Enrollment Trends Amid the COVID-19 Pandemic – Updated for FY 2021 & Looking Ahead to FY 2022

Authors: Elizabeth Hinton, Lina Stolyar, and Robin Rudowitz
Published: Mar 12, 2021

Summary

Even as the COVID-19 vaccine roll-out is accelerating across the country, the public health and economic effects of the pandemic continue to put pressure on Medicaid spending and enrollment. In mid-February 2021, the Kaiser Family Foundation (KFF) and Health Management Associates (HMA) fielded a two-part rapid, mini-survey of Medicaid directors in all 50 states and the District of Columbia as a follow-up to the annual Medicaid Budget Survey conducted last summer. This brief provides insights into the current status of Medicaid enrollment and spending trends in FY 2021 and state projections for FY 2022. See separate brief for findings from Part II of this mini-survey, related to state Medicaid agency involvement with the COVID-19 vaccination roll-out. A total of 38 states responded to the Part I enrollment and spending survey, although not all of these states answered all of the survey questions. These states accounted for over three-quarters of total Medicaid enrollment.1  For most states, the state fiscal year begins on July 1. Key findings include the following:

  • Most states with updated Medicaid enrollment projections expect overall FY 2021 enrollment to exceed original projections (30 of 37 states). Most states reported that expansion adults and other adults had the highest rates of growth. Two-thirds of states with updated Medicaid expenditure projections for FY 2021 (24 of 37 states) also expect total FY 2021 Medicaid expenditures to exceed original projections.
  • Looking ahead to FY 2022, just under half of responding states (12 of 29) are projecting a higher total Medicaid expenditure growth rate in FY 2022 compared to FY 2021, while just over half (14 of 29) are expecting the growth rate to be lower. While fewer states reported specific FY 2022 spending growth rate percentages, the median rate for 21 reporting states was 5.6% while the median projected enrollment growth rate for 17 reporting states was 5.5%. Most states with updated projections assumed that the public health emergency (PHE) would remain in effect through CY 2021, part-way through the state fiscal year.

Medicaid spending and enrollment trends will continue to depend on the trajectory of the pandemic and the economic downturn as well as the duration of the PHE. In particular, the expiration of the PHE and the enhanced FMAP will have implications for state spending during the 2022 fiscal year.

Background/Context

The coronavirus pandemic has generated both a public health crisis and an economic crisis, with major implications for Medicaid, a countercyclical program. During economic downturns, more people enroll in Medicaid, increasing program spending at the same time state tax revenues may be falling. To help support states as Medicaid enrollment grows and ensure continuous coverage for enrollees, the Families First Coronavirus Response Act (FFCRA) authorized a 6.2 percentage point increase in the federal match rate (“FMAP”) for states that meet certain “maintenance of eligibility” (MOE) requirements. The additional funds were retroactively available to states beginning January 1, 2020 and continue through the quarter in which the PHE period ends. While the current PHE declaration expires on April 21, 2021, the Biden Administration has notified states that the PHE will likely remain in place throughout CY 2021 and that states will receive 60 days-notice before the end of the PHE to allow states time to prepare for the end of emergency authorities and the resumption of pre-PHE rules.

After relatively flat Medicaid enrollment growth in FY 2020 (0.4%), states responding to KFF’s annual Medicaid Budget Survey conducted in June-August 2020, projected, on average, that Medicaid enrollment would increase 8.2% in FY 2021 (over FY 2020) and total spending would increase by 8.4%. Preliminary national data show that total Medicaid and CHIP enrollment grew to 77.3 million in September 2020, an increase of 6.1 million, or 8.6%, from February 2020. This growth likely reflects both changes in the economy, as more people experience income and job loss and become eligible and enroll in Medicaid coverage, and the FFCRA MOE provisions that require states to ensure continuous coverage for current Medicaid enrollees through the end of the month in which the PHE ends. This growth represents a reversal of recent Medicaid enrollment trends in 2016 through 2019, when the rate of total Medicaid and CHIP enrollment growth was declining or negative.

All states are experiencing fiscal stress tied to the pandemic, although individual state experiences vary. The impact of the pandemic on states depends on a variety of factors including the composition of state economies, tax structures, and virus transmission levels, among other factors. For example, states that are more dependent on tourism and the energy sector have seen larger economic and state revenue impacts. Overall, however, state revenues declined in FY 2020 and greater declines are expected in FY 2021. As a result, states’ enacted budgets for FY 2021 reflect the first general fund spending decrease in more than ten years as states make reductions to meet balanced budget requirements. While the state fiscal relief provided by FFCRA has undoubtedly helped states avoid more severe budget cuts, some states still face budget gaps that they must address. While states often turn to provider rate and benefit restrictions to constrain Medicaid spending during economic downturns, these cost containment approaches may not be as viable with providers facing revenue shortfalls and enrollees facing increased health risks due to the pandemic.

KEY FINDINGS

Enrollment

Most states with updated Medicaid enrollment projections expect overall FY 2021 enrollment to exceed original projections (30 of 37 states) with higher growth rates reported for expansion and other adults. We asked states to identify the eligibility group (children, parent/caretakers, expansion adults, persons with disabilities, or seniors) that has experienced the highest rate of enrollment growth in FY 2021 (Figure 1). A majority of responding states that had implemented the ACA Medicaid expansion as of February 2021 (22 of 28) indicated “expansion adults” have experienced the highest rate of enrollment growth in FY 2021 while four expansion states identified “parent/caretakers” and two expansion states identified “children.” Among the 10 responding non-expansion states, seven states indicated “parent/caretakers” have experienced the highest enrollment growth in FY 2021 while three states indicated “children.” No states reported seniors or persons with disabilities as groups experiencing the highest rate of enrollment growth. Nonelderly adults are more likely to be affected by changes in the economy and more likely to experience churn on and off the program that the FFCRA MOE has eliminated during the PHE.

Figure 1: FY 2021 Medicaid enrollment growth projections and groups with highest growth rates amid COVID-19

The median growth rate for the 17 states reporting Medicaid enrollment growth projections for FY 2022 over FY 2021 is 5.5%. We asked states whether their projections accounted for the likelihood that the PHE and continuous coverage requirements would remain in place through CY 2021 as indicated in a January 2021 Biden administration letter to Governors. More than half of the responding states indicated that their projections reflect the PHE remaining in place throughout 2021, followed by a gradual enrollment decline beginning in CY 2022 after the expiration of continuous coverage requirements (during the second half the state fiscal year for most states). Several states indicated that their projections did not assume that the PHE and continuous coverage requirements would remain in place through the end of CY 2021 suggesting that the projections were developed prior to the release of the Biden Administration letter or that some states may not consider the letter to reflect enough certainty. Based on these assumptions, these states generally reported lower expected enrollment growth for FY 2022 than states that assumed the PHE would continue through CY 2021. To the extent that the PHE remains in place longer, actual enrollment could be higher than projected. In addition to uncertainty regarding the PHE end date, states cited other currently unknown factors that could significantly affect the accuracy of current FY 2022 enrollment projections such as future trends in unemployment and the Medicaid enrollment impacts of the ACA special enrollment period.

Expenditures

Almost two-thirds of states with updated Medicaid expenditure projections for FY 2021 (24 of 37) expect total FY 2021 Medicaid expenditures to exceed original projections (Figure 2). Nearly all of these states (23 of 24) indicated higher enrollment as the most significant driver of FY 2021 Medicaid expenditures so far. States attributed increases in enrollment to both the economic downturn and to the FFCRA MOE requirements. In contrast, about one third of states with updated FY 2021 projections expect total Medicaid expenditures to be lower than (7 of 37) or about the same as (6 of 37) earlier projections. Four states expecting lower FY 2021 total Medicaid expenditures attribute decreases to net decreases in utilization; three of these states deliver Medicaid services to enrollees through fee-for-service delivery systems where net decreases in utilization immediately result in lower Medicaid expenditures. While utilization may have been initially depressed in FY 2021 due to enrollees foregoing or providers limiting non-urgent care, some states commented that utilization was starting to rebound. Decreases in utilization in heavily capitated managed care states may not result in lower expenditures unless states adjust capitation rates.

Although many states’ updated FY 2021 total Medicaid expenditure projections exceed the projections originally made at the beginning of the state fiscal year, nine of 38 states reported mid-year cost containment policy actions. Three states indicated implementing mid-year provider rate cuts, and although not specifically asked about provider taxes, one state reported that they implemented a new provider tax in 2021. Eight states indicated making mid-year managed care plan rate adjustments. However, several states also commented that MCO contracts were amended to add risk mitigation strategies (e.g., risk corridors). One state reported implementing mid-year benefit restrictions, and one state reported several benefit expansions passed by the state legislature in 2020 were removed before implementation. The survey did not ask about the effects of the federal fiscal relief, but states had reported in an earlier survey that the fiscal relief helped to mitigate Medicaid cuts and address Medicaid shortfalls.

Of the 29 states with expenditure projections for next fiscal year, half anticipate that total Medicaid expenditure growth in FY 2022 will slow down compared to FY 2021 while just under half expect the rate to accelerate (Figure 2). Three states expect the rate of spending growth to be “about the same.” The median growth rate for the subset of states (21) reporting actual growth rates for FY 2022 is 5.6% (over FY 2021). While we only asked about total spending projections, state spending growth is likely to accelerate in FY 2022 when the PHE and enhanced FMAP expire, as states will need to replace the expiring federal funds with state funds.

About one-third of responding states (12 of 38) reported plans to introduce cost containment policy actions in FY 2022. Six states plan to introduce provider rate cuts in FY 2022, seven states plan to make MCO rate adjustments, and three states plan to introduce benefit restrictions. Other planned FY 2022 cost containment strategies/actions reported by states include expansion of value-based payment initiatives, new utilization management strategies, and the introduction of risk-based managed care. Similar to the mid-year cost containment strategies reported for FY 2021, several states reported plans to introduce (or continue) capitated managed care plan risk mitigation strategies (e.g., risk corridors) and at least one state plans to implement revenue generating provider fees. Fourteen states reported that no cost containment policy actions are planned for FY 2022, nine states reported that FY 2022 actions are undetermined, and three states responded, “don’t know.”

Figure 2: FY 2021 and FY 2022 Medicaid spending growth projections amid COVID-19

Looking Ahead

As states approach the end of FY 2021 and adopt budgets for FY 2022 (that begins in July for most states), they must account for the ongoing impacts of the pandemic and resulting economic downturn on Medicaid spending and enrollment trends. While substantial enrollment growth has already occurred across all states, more growth is possible as individuals continue to struggle with the economic downturn and due to the decision to open enrollment in the federal ACA Marketplaces from February 15 through May 15, combined with $50 million in federal spending on outreach and education about ACA coverage options. This outreach has the potential to reach millions of people who became uninsured prior to or during the pandemic and will likely result in more eligible low-income people enrolling in Medicaid. State spending and enrollment projections must also account for the expiration of the PHE. At that time, states will resume eligibility renewals and redeterminations, possibly leading to slower enrollment growth and decreased total spending growth. The end of the PHE, however, will also end the enhanced FMAP requiring states to increase state spending to replace the expiring federal funds. Finally, even if total Medicaid spending growth is lower in FY 2022 relative to 2021, median growth rates in excess of 5 percent may difficult to absorb, depending on how quickly the economy and state revenues recover.

  1. The 13 states that did not respond were: Arkansas, the District of Columbia, Georgia, Hawaii, Idaho, Louisiana, New Hampshire, New Jersey, New Mexico, Ohio, Texas, Utah, and Vermont. ↩︎

A Look at How Medicaid Agencies Are Assisting with the COVID-19 Vaccine Roll-Out

Authors: Elizabeth Hinton, Lina Stolyar, and Robin Rudowitz
Published: Mar 12, 2021

As of February 2021, there are three COVID-19 vaccines approved for emergency use in the U.S. and states are playing a central role in their timely distribution and prioritizing eligible populations. Because Medicaid covers for over 77 million enrollees, including groups disproportionately at risk of contracting COVID-19 as well as hard-to-reach groups, Medicaid agencies can be important partners for the public health agencies that are typically leading the state COVID-19 vaccination efforts. In mid-February 2021, the Kaiser Family Foundation (KFF) and Health Management Associates (HMA) fielded a two-part rapid, mini-survey of Medicaid directors in all 50 states and the District of Columbia. Of the 32 states that responded to Part II of the survey, 29 reported that Medicaid agencies were involved in at least one vaccine roll-out activity (Figure 1). This brief provides insights regarding how state Medicaid agencies are assisting with the COVID-19 vaccine roll-out including specific actions taken. (See separate brief for findings from Part I of the mini-survey related to Medicaid enrollment and spending trends.)

Figure 1: States reported taking specific actions related to vaccine roll-out in state

Three-quarters of responding states (24 of 32) reported partnering with public health or other agencies to plan and implement the vaccine roll-out. Several states indicated close coordination with their state departments of public health that are taking the lead on vaccine distribution and roll-out. For example, one state commented that it amplifies the public health department’s messaging and communications, but also periodically relays back concerns from key Medicaid stakeholders (e.g., behavioral providers not included in the Phase 1a priority group for health care workers). Fewer states, however, reported being involved with determining state vaccination priority lists (11 of 32).

Over three-quarters of responding states indicated their state Medicaid agencies are providing technical assistance to providers (25 of 32). States reported communicating directly with Medicaid providers regarding the roll-out of COVID-19 vaccinations through, for example, provider bulletins and dedicated webpages that include information on COVID-19 vaccination coverage, reimbursement, and billing and a dedicated email address/inbox for provider questions. One state also reported that it has worked to ensure that there is an expedited process for vaccinators to enroll in Medicaid (if not already enrolled).

Over half of responding states reported conducting outreach to Medicaid enrollees to encourage COVID vaccination take-up (19 of 32). Several states discussed working with Medicaid managed care plans on vaccine roll-out activities including: messaging to address member vaccine hesitancy; clarifying the availability of MCO care coordination and transportation services that could reduce vaccine access barriers; coordinating COVID vaccine appointments; calling high-risk members, and making vaccination appointment reminder calls. Over half of responding states (17 of 32) are expanding services to assist with vaccine roll-out. For example, a few states specifically mentioned authorizing nonemergency medical transportation (NEMT) services for vaccine appointments. A number of states (12 of 32) also reported planning or authorizing new or expanded Medicaid administrative supports. One state, for example, commented that its existing nurse advice line will provide general information to callers regarding vaccine administration.   

The majority of responding states reported that the Medicaid agency is involved with specific activities to assist with vaccine roll-out to groups disproportionately covered by Medicaid. About two-thirds of responding states (22 of 32) reported that their state Medicaid agencies are involved with specific activities to assist with vaccine roll-out to HCBS recipients. About half of responding states also reported assisting with vaccine roll-out efforts for residents of non-nursing home institutions, communities of color, and people in rural areas (Figure 2). Several states commented on a number of specific activities underway including:

  • Data sharing with the public health agency on seniors receiving HCBS who are not in a nursing facility or alternative living facility. The public health agency matched the data provided against its vaccine registry and is now conducting outreach to those not yet vaccinated.
  • Developing quality measures focused on closing vaccination disparities between whites and communities of color.
  • Proactively outreaching to NEMT drivers to get vaccinated and drive to vaccination events.
  • Requesting federal approval to provide COVID-19 vaccines to populations who are in limited benefit programs (e.g., family planning program, COVID-19 uninsured group, and restricted scope programs where only emergency and pregnancy related services are offered).
  • Partnering with Rite Aid to provide vaccinations to long-term care facilities not covered by the federal pharmacy partnership program.
  • Encouraging MCOs to utilize community health workers to conduct outreach to individuals that are transient or difficult to reach, including individuals experiencing homelessness, people with disabilities, or individuals with substance use disorders.
Figure 2: States reported taking specific actions to assist with vaccine roll-out to groups disproportionately covered by Medicaid

More than three-quarters of states (26 of 32) indicated at least one way in which partnerships between public health and Medicaid had been or could be further developed to assist with vaccine roll-out efforts. The most common areas of opportunity reported were coordinating outreach, data sharing, and holding daily or weekly meetings between agencies. States described other activities that could assist in vaccine roll-out efforts including: creating opportunities to have staff work across agencies; coordinating to assist individuals without internet access and individuals whose first language is not English in scheduling vaccination appointments, and working to help ensure and promote equity regarding the vaccine roll-out.

Majority Who Received First COVID Vaccine Dose at Community Health Centers Were People of Color

Authors: Bradley Corallo, Jennifer Tolbert, Chelsea Rice, and Emma Anderson
Published: Mar 11, 2021

Early data suggest significant racial disparities in COVID-19 vaccinations, with higher vaccination rates among White people compared to Hispanic and Black people as of early March, based on available state-reported data. The Biden administration has identified equity as a key priority in its national COVID-19 response strategy. One action the administration is pursuing to advance equity in vaccinations is to increase distribution through community health centers.

Community health centers are a national network of safety net primary care providers and are a primary source of care for many low-income populations and people of color. This analysis examines the extent to which early vaccination efforts through community health centers are reaching people of color using data from the federal government’s weekly Health Center COVID-19 Survey. We include data from the survey weeks of January 8 through February 26, 2021, largely before the start of the federal health center COVID-19 vaccination program.

Just over half (54%) of people who received their first dose of the COVID-19 vaccine from health centers were people of color, including 26% who were Hispanic and 12% who were Black. These shares are higher than the shares of nationwide vaccinations; show that 9% of people receiving one more dose of vaccine as of March 7, 2021 were Hispanic and 7% were Black. The shares of vaccinations received by people of color at community health centers increased in more recent weeks compared to vaccinations in January 2021.

The shares of people receiving the first dose of the COVID-19 vaccine at health centers who were Black, Hispanic, and Asian generally matched or exceeded their shares of the total population. However, their shares of vaccinations were similar or slightly lower than their shares of the overall health center patient population. Patterns of health center vaccinations by race/ethnicity compared to their population distributions varied widely by state.

While vaccinations at health centers represent a relatively small share of total vaccinations administered nationally to date, further ramping up health centers’ involvement in vaccination efforts at the federal, state, and local levels will likely be a meaningful step in reaching people of color and advancing equity on a larger scale.

Source

Community Health Centers’ Role in Delivering Care to the Nation’s Underserved Populations During the Coronavirus Pandemic

News Release

KFF COVID-19 Vaccine Monitor: The Impact of the COVID-19 Pandemic on LGBT People

Published: Mar 11, 2021

The latest report from the KFF COVID-19 Vaccine Monitor examines how the COVID-19 pandemic has impacted the lives of lesbian, gay, bisexual and transgender (LGBT) people and finds that larger shares of LGBT adults report economic losses and mental health struggles than their non-LGBT counterparts.

Based on data gathered on self-identified LGBT and non-LGBT individuals over two months, some of the key differences include:

  • Economic impact. Most LGBT adults say that they or a household member lost a job or income due to the pandemic (56%), which compares to 44% of non-LGBT adults.
  • Mental health. Three quarters (74%) of LGBT people say worry and stress from the pandemic has had a negative impact on their mental health, compared to half (49%) of non-LGBT people. LGBT people are also more than twice as likely to say this negative impact has been major (49% to 23%).
  • Vaccine intentions. LGBT people are about as eager to get vaccinated as other Americans but more view it as a part of everyone’s responsibility to protect the public health (75%) rather than a personal choice (24%). Non-LGBT individuals are about as equally likely to say it is part of everyone’s responsibility (48%) and a personal choice (49%).

Differences in the experiences of LGBT and non-LGBT individuals likely reflect a number of factors. Other research has found that LGBT individuals are more likely to work in health care, restaurants and other industries highly impacted by the pandemic; have lower average incomes; and may experience discrimination and stigma, including in accessing health care.

The new report is available through the Monitor’s online dashboard.

This analysis is based on interviews conducted in December and January among a nationally representative random digit dial telephone sample of 3,239 adults, including 174 who identified as lesbian, gay, bisexual, or transgender. The margin of sampling error is plus or minus 9 percentage points for the full LGBT sample and 2 percentage points for the non-LGBT sample. For results based on subgroups, the margin of sampling error may be higher. Detailed methodology can be found in the toplines for the December and January KFF COVID-19 Vaccine Monitor.

The KFF COVID-19 Vaccine Monitor is an ongoing research project tracking the public’s attitudes and experiences with COVID-19 vaccinations. Using a combination of surveys and qualitative research, this project tracks the dynamic nature of public opinion as vaccine development and distribution unfold, including vaccine confidence and acceptance, information needs, trusted messengers and messages, as well as the public’s experiences with vaccination.

Poll Finding

The Impact of the COVID-19 Pandemic on LGBT People

Published: Mar 11, 2021

Key Findings

There has been little data on how the coronavirus pandemic has impacted the lives of lesbian, gay, bisexual, and transgender individuals (LGBT) in the U.S. Drawing on previous research indicating that LGBT individuals are at greater risk of both COVID-19 health and economic outcomes, this analysis examines the reported experiences from self-identified LGBT individuals from two months of the KFF COVID-19 Vaccine Monitor and finds that LGBT people have experienced the COVID-19 pandemic differently than non-LGBT people, including being harder hit in some areas:

  • Economic: A larger share of LGBT adults compared to non-LGBT adults report that they or someone in their household has experienced COVID-era job loss (56% v. 44%).
  • Mental health: Three-fourths of LGBT people (74%) say worry and stress from the pandemic has had a negative impact on their mental health, compared to 49% of those who are not LGBT, and are more likely to say that negative impact has been major (49% v 23%).
  • Views: One-third (34%) of LGBT adults say the news has generally underestimated the seriousness of the pandemic (compared to 23% of non-LGBT adults). Three-fourths of LGBT adults (74%) are either “very worried” or “somewhat worried” that they or someone in their family will get sick from the coronavirus, similar to responses from, non-LGBT adults (67%). A large share of LGBT adults report being willing to take CDC recommend steps to avoid acquisition/transmission of the virus.
  • Vaccine: While LGBT people report wanting to get vaccinated at a similar pace as non-LGBT people, a greater share of LGBT adults see doing so as part of everyone’s responsibility to protect the health of others (75% v. 48%), while greater shares of non-LGBT people see vaccination as a personal choice (49% v 24%).

Why Examine COVID-19 Views and Experiences of LGBT Populations?

Limited early data available on how LGBT people have experienced the COVID-19 pandemic in the United States (U.S.) has suggested that this group may be disproportionately impacted. The reasons are far-reaching and may include: LGBT individuals being at greater risk of worse COVID-19 outcomes due to higher rates of comorbidities; working in highly affected industries such as health care and restaurants/food services; living on average on lower incomes than non-LGBT people; experiencing stigma and discrimination related to sexual orientation/gender identity, including in accessing health care; and, for transgender individuals, being less likely to have health coverage. As the pandemic continues to take a toll nationwide, our analysis from the KFF COVID-19 Vaccine Monitor explores self-identified LGBT people’s COVID-19 experiences and offers comparisons to the non-LGBT population. We find that LGBT adults have experienced the pandemic differently than non-LGBT people in some key domains including with respect to their risk of COVID-19, mental health, employment loss, vaccine attitudes, and willingness to engage in risk-reduction behavior such as social distancing.

The analysis is based on findings from the December and January KFF COVID-19 Vaccine Monitor and building on previous research conducted early on, offers a new look at experiences nearly a year into the pandemic.

COVID-19 Economic and Health Impacts

Echoing previous research conducted earlier on in the pandemic, we find that LGBT adults and their household members report facing COVID-era job loss at higher rates than non-LGBT adults. Since February 2020, 56% of LGBT people report that they or another adult in their household have lost a job, been placed on furlough, or had their income or hours reduced because of the coronavirus outbreak, compared to 44% of non-LGBT people. Separate research has found that LGBT people are more likely to work in industries hard hit by the pandemic, such as restaurants or food services, than their non-LGBT peers.

LGBT Households Have Faced COVID-era Job Loss at Higher Rates Than Non-LGBT Households, with Over Half Reporting This Experience

In addition to personal or familial experience with job loss, the COVID-19 pandemic has been hard hitting for LGBT people in terms of mental health. Prior to the pandemic, LGBT people experienced certain mental health conditions at higher rates than non-LGBT people. In this analysis, we find three-fourths of LGBT people (74%) say worry and stress from the pandemic has had a negative impact on their mental health, compared to 49% of non-LGBT people. In addition, LGBT people more than twice as likely to say this negative impact has been major (49% compared to 23%).

Three-quarters of LGBT People Report Stress and Worry Related to the Coronavirus, Compared to 1 in 2 non-LGBT People.

Views Of the COVID-19 Pandemic

LGBT people have a different perspective on some aspects of the pandemic compared to non-LGBT people, including regarding the media’s portrayal and their own level of concern. They also have different views on COVID-19 risk mitigation efforts.

One-third (34%) of LGBT adults say the news has generally underestimated the seriousness of the pandemic (compared to 23% of non-LGBT adults).  A much smaller share of LGBT people say the seriousness of coronavirus is exaggerated in the news compared to non-LGBT people (15% vs 34%). Previous KFF COVID-19 Vaccine Monitor analysis finds that these views are largely driven by partisanship, with larger shares Republicans saying the seriousness of the pandemic has been “generally exaggerated” compared to Democrats and independents.

Just 15% of LGBT People Think the Media Exaggerates the Seriousness of the Coronavirus Compared to One-third of Non-LGBT People.

Three-fourths of LGBT adults (74%) say they are either  “very worried” or “somewhat worried” that they or someone in their family will get sick from the coronavirus. While this share is not statistically different than those of non-LGBT adults (67%), it demonstrate the high level of concern among LGBT individuals which may be correlated to taking more precautions to protect themselves and family members.

Three-fourths of LGBT People Are Worried They Will Get Sick From the Coronavirus

In addition to worry surrounding the virus, large shares of LGBT people report being willing to take CDC recommend steps to avoid acquisition/transmission of COVID-19. Larger shares of LGBT people say they could follow social distancing guidelines for more than six months or until there is a vaccine widely available than non-LGBT people (85% v 69%). Conversely, larger shares of non-LGBT people say they could follow social distancing guidelines for only up to six months compared to LGBT people (28% v. 14%). Additionally and similarly to non-LGBT people, vast majorities of LGBT people also say they wear a mask every time or most of the time when they leave the house (97%) and accurately believe masks limit the spread of coronavirus (90%).

LGBT People Report Longer-term Willingness to Follow Social Distancing Guidelines than Non-LGBT people.

While LGBT people report wanting to get vaccinated at the same rate as non-LGBT people, LGBT people hold different views on whether getting vaccinated is public health imperative or individual choice. LGBT people report wanting to get the vaccine as soon as possible (40%) or take a wait and see approach (39%) at similar rates as non-LGBT people (36% and 36%, respectively). One in ten LGBT people (10%) say they definitely do not plan to get the vaccine, statistically similar to 15% of non-LGBT people.

Majorities of LGBT People Plan to Get a COVID Vaccine as Possible or to Wait and See How it is Working for others. Just 1 in 10 Do Not Plan to Get Vaccinated

In Their Own Words.

We asked LGBT people to explain in their own words, “What is the biggest concern you have about getting a COVID-19 vaccine?” Select responses follow:“My biggest concern is actually getting the vaccine on a timely manner and then the second dose. With so much chaos in this country” – Male, white, transgender, California

“Honestly, I just think that the vaccine was "rushed", but I'll probably consider it later on the future for any side affects of any kind.” – Female, black, bisexual, Florida

“Know what really it contains? Is it trustworthy?” – Female, Hispanic, bisexual, Florida

However, a larger share of LGBT people believe getting vaccinated is part of everyone’s responsibility to protect the health of others (75% v. 48%) and a smaller share sees it as a personal choice (24% v. 49%) compared to non-LGBT people.

Majorities of LGBT People View Vaccination as a Responsibility to Protect Others, While Non-LGBT People are Divided, Half See it as an Individual Choice.

Implications

Compared to non-LGBT adults, larger shares of LGBT people report experiencing COVID-era job loss, say the pandemic has had a negative impact on their mental health, and report being worried about getting COVID-19. As such it may not be surprising that smaller shares believe the media has overstated the seriousness of the pandemic and with more saying it has been understated. The greater levels of concern and negative experiences with the pandemic in certain domains may also play a role in LGBT people’s willingness to take recommend steps to avoid acquisition/transmission of the virus. Finally, a larger share of LGBT people view COVID-19 vaccination as a collective responsibility than as an individual choice, potentially reflecting the community’s experience with HIV, another infectious disease that requires community level buy-in of public health strategies to curb. While sexual orientation and gender identity may drive some of the differences we find between LGBT and non-LGBT adults, it is also important to note the two populations differ markedly in other key areas. Compared to non-LGBT adults, larger shares of LGBT adults are younger, live on lower incomes, and identify as Democrats, factors that may also contribute to the difference observed. Targeted vaccine outreach to LGBT people could be helpful in reaching a group that has high rates of comorbidities that place them at elevated risk for COVID-19 but has traditionally faced barriers to accessing medical care.

Methods

The KFF COVID-19 Vaccine Monitor is an ongoing research project tracking the public’s attitudes and experiences with COVID-19 vaccinations. Using a combination of surveys and qualitative research, this project tracks the dynamic nature of public opinion as vaccine development and distribution unfold, including vaccine confidence and acceptance, information needs, trusted messengers and messages, as well as the public’s experiences with vaccination.

Designed and analyzed by researchers at KFF, this analysis is based on interviews conducted in December and January among a nationally representative random digit dial telephone sample of 174 adults who identified as lesbian, gay, bisexual, or transgender. The margin of sampling error is plus or minus 9 percentage points for the full LGBT sample and 2 percentage points for the non-LGBT sample. For results based on subgroups, the margin of sampling error may be higher. Detailed methodology can be found in the toplines for the December and January KFF COVID-19 Vaccine Monitor. Methods for the qualitative “in their own words” findings can be found at KFF COVID-19 Vaccine Monitor: In their Own Words.

This work was supported in part by the Elton John AIDS Foundation. We value our funders. KFF maintains full editorial control over all of its policy analysis, polling, and journalism activities. KFF paid for all costs associated with the survey.

News Release

Updated KFF Calculator Estimates Marketplace Premiums to Reflect Expanded Tax Credits in COVID-19 Relief Legislation

Published: Mar 10, 2021

KFF has updated its 2021 Health Insurance Marketplace Calculator to reflect the expanded premium tax credits available to people who purchase their own coverage through their state’s health insurance exchange as passed by Congress in the American Rescue Plan Act and expected to be signed into law soon.

The calculator allows users to enter their age, income, family size, and zip code to assess their eligibility for tax credits and how much they can expect to spend on premiums for coverage purchased through the Affordable Care Act’s marketplaces. It reflects the actual cost of health plans in the region and the changes to how the tax credits are calculated under the legislation’s provisions.

The American Rescue Plan Act increases the premium tax credits available both to people previously eligible and to those at higher incomes who had been ineligible before but face high premiums. The enhanced tax credits will expire after two years and are projected to increase federal deficits by $34.2 billion.

A previous KFF analysis found that the changes would result in premium savings for the vast majority of the nearly 14 million people already insured through the individual market, while millions of uninsured Americans would become eligible for new or bigger tax credits that could make marketplace coverage more affordable.

Those likely to see the biggest drop in what they pay in premiums include those who make just above 400% of the federal poverty rate ($51,040 for an individual), who were not previously eligible for tax credits and would have had to pay the full cost of coverage.

Some examples from the calculator:

  • A 50-year-old in Franklin County, Nebraska making $51,500 annually is newly eligible for tax credits under the legislation that would lower what they would pay in premiums for a benchmark plan from $1,127 per month to $365 per month.
  • A 50-year-old in Jefferson County, Oklahoma making $18,000 annually is now eligible for a benchmark plan with significant help to lower deductibles. Previously, they would have had to pay $54 per month for that plan, or enroll in a less generous plan with a large deductible for no premium.

HealthCare.gov, the federal health insurance marketplace serving 36 states, last month began a special enrollment period that runs through May 15. All state-based marketplaces also launched their own special enrollment periods, though the exact dates vary.

News Release

Early COVID-19 Vaccination Efforts Through Community Health Centers Are Reaching People of Color

Published: Mar 10, 2021

More than half of those who received their first dose of a COVID-19 vaccine through a community health center were people of color, suggesting that health centers appear to be doing a better job of reaching people of color than are overall vaccination efforts, finds a new KFF analysis.

People of color accounted for 54 percent of people who got their first dose of the vaccine through a health center, the analysis finds, including 26 percent who were Hispanic and 12 percent who were Black. The analysis is based on weekly surveys of health centers by the Health Resources and Services Administration starting the week of January 8 through February 26.

In contrast, Centers for Disease Control data show that, as of March 7, just 9 percent of people receiving one or more doses of a COVID-19 vaccine nationally were Hispanic and 7 percent were Black.

As part of an effort to increase vaccination rates among people of color, the Biden administration recently announced an initiative to provide health centers with direct access to vaccine supply. The more than 1,300 health centers in the U.S. are a national network of primary care providers serving nearly 30 million patients annually, many of them low-income and living in underserved communities.

The analysis finds that, among those receiving the 1st dose of the vaccine, health centers appear to be vaccinating people of color at similar or higher rates than their shares of the total population. However, their shares were similar or slightly lower than that of the health center patient population. It also finds that patterns of health center vaccinations by race/ethnicity and population distributions varied widely by state. People of color appear to be receiving a larger share of vaccinations at health centers in recent weeks compared to vaccinations at health centers in January.

Also newly available from KFF is the brief, How are States Addressing Racial Equity in COVID-19 Vaccine Efforts?. For more data and analyses on COVID-19 and vaccination efforts, including KFF’s Vaccine Monitor project, visit kff.org.

How are States Addressing Racial Equity in COVID-19 Vaccine Efforts?

Authors: Nambi Ndugga, Samantha Artiga, and Olivia Pham
Published: Mar 10, 2021

Introduction

As COVID-19 vaccine distribution continues and expands to larger segments of the population, early KFF analysis of state-reported data raise concerns about disparities in vaccinations for Black and Hispanic people. Ensuring equitable access to the vaccines will be important to mitigate the disproportionate impacts of the pandemic for underserved populations, prevent widening disparities going forward, and achieve broad population immunity. The Biden administration’s national COVID-19 response strategy outlines equity as a key priority, including as part of vaccine distribution efforts. Some states have also emphasized equity as a priority in their vaccine distribution plans and, in some cases, have taken responsive action to address disparities in vaccinations revealed by early data.

This brief reviews information available through state websites and publicly available vaccine distribution plans as of February 2021 to provide greater insight into how states are addressing equity through vaccine allocation and distribution strategies, outreach and communications efforts, and data collection and reporting. The review seeks to provide a snapshot and examples of state efforts in these areas. However, this review does not provide a fully exhaustive summary of all state actions, and given the rapidly evolving nature of state vaccination efforts, it may not reflect the latest developments in state approaches. Beyond the state-level strategies highlighted in this review, efforts to advance equitable access to the vaccines are also underway at the city and county level, among health systems and providers, and in the private sector. Moreover, the federal government is implementing a range of approaches to expand vaccine access and uptake — including direct distribution through community health centers — with a particular focus on reaching underserved areas and communities hardest hit by the pandemic.

Vaccine Allocation and Distribution

Where and how people can sign-up for and access vaccines has direct implications for who will receive them. People living in underserved and disproportionately affected areas may face increased challenges accessing vaccines due to more limited resources available to navigate online sign-up systems, lack of transportation, and other access challenges. States are employing a range of strategies to increase the availability and accessibility of vaccines for disproportionately affected areas and people.

Some states are allocating additional vaccine doses to enhance vaccine supplies in underserved and disproportionately affected areas. About half the states indicated in their vaccine distribution plans that they planned to use the Center for Disease Control and Prevention’s (CDC’s) Social Vulnerability Index (SVI) or similar indices to inform their vaccine allocation strategies. States varied in the level of detail they provided in their plans on how they would use these resources to inform their allocation approach, although some states have provided more specific implementation details. For example, in December, Governor Baker of Massachusetts pledged to allocate 20% additional vaccines to communities with high social vulnerability to help address the pandemic’s disproportionate impact on people of color. New Hampshire has indicated that it will reserve 10% of its vaccine supply for allocation to communities that have been hard hit by the pandemic. Connecticut reports providing an additional roughly 10% of the state’s allocation to areas that have high vulnerability based on the SVI. North Carolina also reports allocating additional doses to counties with larger older populations and historically marginalized populations. They indicate that vaccines will be invested into projects and events that promote increased access and partnerships in the community, with a particular focus on achieving equitable access to the vaccine. California will begin reserving 40% of vaccines for residents in the most disadvantaged areas of the state.

Some states are prioritizing vaccine appointments or eligibility for certain groups or areas. In response to early data showing gaps in vaccinations in certain wards of the city, Washington DC changed its vaccine appointment system to prioritize people living in these low-income, underserved areas. Residents in these wards are given the opportunity to register for vaccine appointments 24 hours before they become available to people living in other areas of the city. California provided codes that would provide access to vaccine appointments to community organizations that were intended to be distributed to people living in largely Black and Hispanic communities, although media reports pointed to problems with the initial rollout of this approach. Rhode Island has taken a different approach of prioritizing eligibility for broader groups of residents in certain geographic areas that have an increased risk for COVID-19 hospitalizations and deaths, including Central Falls and certain other areas of the state. Montana and Utah include people of color in their initial vaccine priority groups. With Montana vaccinating American Indians and people of color who may be at elevated risk for COVID-19 complications in Phase 1b, and Utah including people living in Tribal reservation communities and racial/ethnic groups at increased risk in Phase 1c.

Nineteen states have established call centers or provided text options to facilitate access to vaccine appointments for people who may not be able to navigate online sign-up systems. For example, Mississippi and Alabama have set up vaccine appointment scheduling hotlines for residents who cannot or do not want to use the web-based booking programs. In Maryland, the Departments of Health and Aging collaborated to create a telephone-based support line and appointment system designed to assist those without internet access. Connecticut is working with the United Way to provide a call center to schedule appointments that is available 12 hours a day and 7 days a week. However, many states have also encountered initial challenges with this approach, due to overwhelming demand. For example, New Jersey opened up a phone line to schedule vaccine appointments, but it was quickly stretched beyond its initial capacity. Some states are using text-based approaches to provide notifications of when appointments become available. Oklahoma is piloting a text-based notification system that sends second dose appointment updates to individuals who have registered for the vaccine through their scheduling portal.

Some states are deliberately locating vaccine clinics in underserved or disproportionately affected areas. For example, Tennessee is partnering with pharmacies and community health centers to add more than 100 vaccination sites, with a particular focus on rural and underserved areas. Colorado has outlined several strategies to increase the accessibility of vaccines, including partnering with counties to host community clinics, establishing community partnerships to reach communities of color, and coordinating with transportation providers to assist people without vehicles in getting to appointments. The state has also established a goal of having vaccines available through a community-based clinic in “50% of the top 50 census tracts with a high-density of low-income and minority communities.” Alaska is using an Area Deprivation Index to identify areas to provide targeted efforts to ensure equitable access to the vaccine through partnerships with Federally Qualified Health Centers and other community and locally-led organizations. While placing vaccine clinics in underserved or disproportionately affected areas can make vaccines more accessible to people living in areas, location alone will not necessarily ensure access if people face barriers completing sign up processes, and appointments are taken by people living in other areas. As such, prioritizing or reserving appointments for people living in those areas is also important.

Outreach and Communications Strategies

In addition to ensuring individuals can access the vaccine, making sure people receive clear information that explains how and when they can obtain the vaccine and addresses any concerns or questions they have about the vaccine also is important. Moreover, it is key for this information to be provided in culturally and linguistically appropriate ways through trusted messengers.

Some states are collaborating with and supporting community-based organizations and health centers to conduct outreach, communication, and education. For example, Massachusetts launched a targeted outreach initiative through which the Department of Health will invest resources directly into the 20 cities and towns most impacted by COVID-19 to increase awareness of vaccine safety and efficacy by working with local leaders and community- and faith-based groups. The state has also invested $1 million in the Massachusetts league of community health centers to provide grants to health centers to assist in engaging patients and community members in vaccination discussions and increase vaccination rates in the states’ hardest hit communities. The state of Washington has Community Outreach Services Contracts with several community-rooted organizations and groups to assist with COVID-19 vaccine outreach and makes investments in community/ethnic media outlets and community based organizations for community-driven messaging efforts. Colorado announced it is working to schedule more than 175 vaccine equity clinics across the state in partnership with community based organizations, local public health agencies, and Tribes, with community organizations playing a key role in providing outreach to their community members and registering people for appointments.

Many states are launching their own vaccination communications campaigns, often with a focus on reaching people of color and other groups who may face heightened barriers to vaccination. As part of its GoVAX outreach campaign, Maryland launched a mobile public health education unit—or sound truck—to provide information about COVID-19 prevention and vaccination availability in Spanish and English in selected neighborhoods that have been hardest hit by the virus. Volunteers will also distribute informational flyers and face masks at designated stops. In Ohio, health officials are hosting virtual town halls that will be replayed weekly on television to tackle COVID-19 vaccine myths. The town halls are focused on addressing questions and concerns of Black, Hispanic, Asian, Pacific Islander, and rural residents. In addition to these outreach efforts, all states provide information through public-facing websites to address questions and concerns about the vaccine. For example, many prominently feature frequently asked questions (FAQ) sections that address common questions.

Most state websites include information clarifying that the vaccine is available for free, although the information is not always highlighted prominently. Some states highlight this information up front. For example, North Carolina clarifies that the vaccine is available for free to all who want it on its landing page for vaccine information (Figure 1). Similarly, Minnesota includes this information in the FAQs listed on its “vaccine basics” page. Clarifying that people can receive the vaccine at no cost regardless of insurance status is important for facilitating equity, as recent survey data show that Black and Hispanic adults have heightened concerns about potentially having to pay out-of-pocket costs. Possibly, even more important is whether vaccine providers clarify that the vaccine is available at no cost and ensure people are able to sign up for appointments without providing insurance information.

Figure 1: Examples of State Website Information Clarifying the Vaccine is Available for Free

Fewer state websites clarify that individuals are eligible for that vaccination regardless of immigration status and/or that obtaining the vaccine will not negatively affect immigration status. Clarifying this information can help address fears and confusion that could present barriers to vaccination among immigrants. For example, Rhode Island clarifies that undocumented immigrants are eligible for vaccination and that information will not be shared with immigration authorities (Figure 2). In Massachusetts, they emphasize that the vaccine is free for all Massachusetts residents, and that health care providers may request reimbursement from the federal government to cover the administrative costs of providing vaccines to undocumented immigrants.

Figure 2: Examples of State Websites Clarifying Immigrant Eligibility for the COVID-19 Vaccine

All websites provide options to access information in different languages, but they vary in how they provide this access. Some states solely utilize google translate or similar translation software; others provide translated materials through downloadable resources, in some cases linking to translated materials provided by CDC. However, recent reporting finds that many vaccine registration and information websites at the federal, state, and local levels violate disability rights laws, hindering the ability of blind people to sign up.

Data Collection and Reporting

Collecting and analyzing COVID-19 vaccination data by race/ ethnicity is integral to gaining insight into who is and is not receiving vaccines and can be used to direct resources and efforts to address disparities as they are identified.

As of March 1, 2021, 41 states are publicly reporting COVID-19 vaccination data by race and/or ethnicity. While most states are reporting data, the quality, completeness, and timeliness of the data vary widely across states, which affects its usefulness. For example, as of March 1, 2021, in Minnesota and Washington D.C., race/ethnicity information was missing for over 40% of vaccinations, while North Carolina reported less than 1% as missing race/ethnicity information. States also vary in the extent to which they disaggregate data to allow an understanding of the experiences of specific groups. For example, Florida groups people who report their race as Asian, Native Hawaiian or Pacific Islander, or other into a single “Other race category.” In contrast, other states, like Maine, disaggregate data separately for racial and ethnic groups. Very few states report vaccination data by race/ethnicity and other demographic factors like age or gender. However, South Carolina and Washington provide data in these more detailed ways, allowing for a more nuanced understanding of who is being vaccinated that can inform efforts to address gaps.

Several states have taken actions designed to increase the completeness of race/ethnicity data. For example, North Carolina and Texas are requiring vaccine providers to collect race/ ethnicity data. Texas is updating its immunization registry system so that race and ethnicity must be entered to complete the data entry process. Michigan added a hand-entry field into their registry system to collect race and ethnicity data since the system had not previously collected this information. In addition, Virginia added language to its website to encourage individuals to report demographic data and clarifying how the data will be used (Figure 3).

Figure 3: Example of State Website Information on Importance of Reporting Demographic Data and How Data Will Be Used

Conclusion

In sum, early data pointing to racial disparities in COVID-19 vaccinations underscore the importance of intentional efforts focused on ensuring equity as the vaccine rollout continues. As highlighted in this brief, a number of states included a focus on equity in their vaccine distribution plans and are taking responsive action to try to address emerging disparities through vaccine allocation and distribution approaches, outreach and communications strategies, and data collection and reporting. Continued monitoring of data to understand who is and is not receiving the vaccine will be important for gauging the effectiveness of these approaches; and will help guide ongoing efforts to prevent and reduce disparities as distribution continues.

As noted, beyond the state-level strategies highlighted in this review, efforts to advance equitable access to the vaccines are also underway at the local level, among health systems and providers, and in the private sector. Moreover, at the federal level, the Biden administration has outlined equity as a key goal of its national COVID-19 response strategy, including as a part of vaccine distribution efforts. To that end, it has established a COVID-19 Health Equity task force; indicated plans to work with states to incorporate equity into their vaccine distribution processes; is taking steps to expand vaccine availability in underserved areas through federally-supported vaccination centers and allocations of vaccine doses directly to community health centers and retail pharmacies; is launching and vaccination communication plan; and is focused on expanding data collection and reporting. The American Rescue Plan Act includes additional funding that will further enhance these approaches.

Expanding Postpartum Medicaid Coverage

Published: Mar 9, 2021

Issue Brief

High rates of preventable maternal mortality and morbidity and wide racial and ethnic disparities have caught the attention of clinicians, public health practitioners, advocates, and policymakers.1  In the closing days of the Trump Administration, HHS released an action plan to improve maternal health, and President-elect Biden has cited this topic as a key health care issue. Vice President-elect Harris has been an advocate in the Senate for improving maternal health, particularly stemming the disproportionately high rates of maternal mortality and morbidity among Black women, and may continue to champion this work at the Executive Branch. During the 2019-2020 Congressional session, more than a dozen bills across political lines related to maternal health outcomes, care, and coverage were introduced, and many could be re-introduced when the new Congress is seated. Several federal and state efforts aim to address the postpartum period, the time shortly after the birth of an infant, an important but often neglected element of maternity care. Birthing parents may be dealing with a host of medical conditions, such as complications from childbirth, pain, depression or anxiety, all while caring for a newborn. It can be a medically vulnerable period and many cases of maternal mortality occur in the postpartum period.

While Medicaid pays for more than four in ten births and must cover pregnant women through 60 days postpartum, after that period states can and have made very different choices regarding whether eligibility for Medicaid coverage is continued. In states that have not expanded Medicaid under the Affordable Care Act (ACA), many women are left without a pathway to coverage and become uninsured just two months after giving birth. Recently, there has been growing interest from federal and state policymakers, clinicians, and health advocates in expanding Medicaid’s postpartum coverage from 60 days to one year. This brief discusses Medicaid’s eligibility for pregnancy and postpartum care, describes gaps in coverage particularly for low-income women who live in states that have not expanded Medicaid under the ACA, and highlights several state and federal efforts to extend postpartum coverage for a longer period of time.

What is Medicaid’s role for pregnancy and postpartum care?

Medicaid has long prioritized coverage of pregnant women and now finances more than four in ten births in the United States.2  Federal law requires that all states extend eligibility for pregnant women with incomes up to 138% of the federal poverty level (FPL); however, most states (48 and DC) go beyond this minimum threshold, ranging from 138% to 380% FPL. Pregnancy-related coverage must last through 60 days postpartum and the infant is eligible for Medicaid for the first year after birth. For women who qualify for Medicaid on the basis of pregnancy, all states provide pregnant women with a wide range of Medicaid benefits, including prenatal care, childbirth and delivery services. States have discretion to determine specific maternity care benefits under Medicaid. For example, many states cover substance use treatment and home visiting services but fewer cover other services such as doula care and home births.

For pregnant women who are eligible for Medicaid under the ACA’s Medicaid expansion pathway, states must cover all preventive services recommended by the United States Preventive Services Task Force (USPSTF) including many pregnancy-related services, such as prenatal screening tests and folic acid supplements as well as services in the postpartum period, such as lactation consultation and breastfeeding supplies. Importantly, all states cover family planning services before and after pregnancy. Pregnancy-related services for those enrolled under any Medicaid pathway are exempt from cost-sharing. For low-income people in particular, the lower cost sharing and absence of deductibles under Medicaid can be a major advantage over private insurance.

Where are the gaps in coverage during the postpartum period?

Following the 60 days postpartum period, mothers with incomes up to 138% FPL in the states that have expanded Medicaid under the ACA (38 states and DC) have a continued pathway to coverage. Those with incomes above 138% FPL may qualify for subsidized coverage through the ACA Marketplace. However, in the 12 states that have not adopted the ACA’s Medicaid expansion, postpartum women could qualify for Medicaid as parents to stay on the program, but Medicaid income eligibility levels for parents are much lower than for pregnant people in all of the states (Figure 1). As a result, many women in non-expansion states become uninsured after pregnancy-related coverage ends 60 days postpartum because, even though they are poor, their income is still too high to qualify for Medicaid as parents and too low to qualify for Marketplace subsidies. For example, in Texas, a married mother with a newborn loses Medicaid coverage two months after giving birth if she and her partner have an annual income above $3,733 (17% FPL).

Figure 1: Medicaid Eligibility Is Much More Restrictive for Parents than Pregnant Women, Particularly in States that Have Not Expanded Medicaid

Research shows that Medicaid coverage is higher and uninsured rates are lower among women before and after pregnancy in expansion states compared to non-expansion states (Figure 2). As shown in Figure 2, coverage patterns are similar during pregnancy between expansion and non-expansion states. After pregnancy, however, Medicaid coverage declines and the uninsured rate climbs, with the effect more pronounced in non-expansion states.3 

Figure 2: In Expansion States, Higher Rates of Medicaid Coverage and Fewer Uninsured Among Postpartum Women

Furthermore, many women in non-expansion states who do not qualify for Medicaid after 60 days postpartum may also not qualify for subsidies to assist with the purchase of private insurance in state Marketplaces because they have incomes between the income limit for parents and 100% FPL, leaving them in the “coverage gap” with few options for affordable coverage.

How has the coronavirus affected postpartum coverage?

The Families First Coronavirus Recovery Act (FFCRA) includes an enhanced federal match (FMAP) to states, contingent on meeting maintenance of eligibility (MOE) requirements that include ensuring continuous coverage for enrollees until the end of the month in which the public health emergency (PHE) is in place. Under earlier guidance issued by the Centers for Medicare and Medicaid Services (CMS), someone qualifying on the basis of pregnancy would remain enrolled in that group, even after the 60 days postpartum period. Under a new interim final rule effective on November 2, states can move a pregnant woman from the pregnancy group to another eligibility pathway if eligible for another full benefit group, such as ACA expansion, and the benefit package for the new group is the same or more generous than the pregnant woman benefit package, move to new group. However, if the pregnancy benefit package is more generous than another pathway or the person is ineligible for any other full benefit group, they would remain enrolled in pregnancy group.

In addition to changing eligibility for coverage, the coronavirus pandemic has changed the way pregnancy and postpartum care is provided. New mothers may be more isolated from postpartum support, such as family members or doulas and women may be accessing services such as lactation consultations or postpartum checkups via telehealth. Continuity of coverage may be even more valuable given the other disruptions in care that new parents may be facing during the pandemic.4 

Why is coverage for postpartum care important?

Postpartum care encompasses a range of important health needs, including recovery from childbirth, follow up on pregnancy complications, management of chronic health conditions, access to family planning, and addressing mental health conditions. While postpartum care has traditionally centered around one clinical visit six to eight weeks after delivery, there has been a paradigm shift to emphasize that postpartum care is an ongoing process that typically requires multiple visits and follow up care that may last a year or even longer. This is particularly important for those who experience pregnancy complications or have chronic conditions, such as hypertension or diabetes.

Mental health is a major concern during and after pregnancy. Suicidality among pregnant and postpartum people has risen over the past decade. At least one in ten women experience perinatal depression, and some studies suggest higher rates but poorer access to treatments among some communities of color and low-income women. ACOG recommends screening during the postpartum visit and initiation of treatment or referral to a mental health provider when a woman is identified with depression. This kind of care may be provided over a long duration, often lasting beyond 60 days.

Addressing pregnancy-related deaths (typically defined as death within one year of pregnancy)5 , particularly the substantially higher rates among Black and American Indian and Alaska Native (AIAN) women, is an urgent health challenge.6  At least one-third of maternal deaths occur in the postpartum period. Identifying the causes of maternal mortality and morbidity is complex, and coverage is only one factor, but research strongly indicates that access to health care throughout a woman’s reproductive years, is essential for prevention, early detection, and treatment of some of the conditions that place women at higher risk for pregnancy-related complications, including cardiovascular disease, diabetes, and chronic hypertension. Coverage disruptions during the perinatal period disproportionately affect Black, AIAN, and Hispanic women. Furthermore, a wide array of conditions that may present or persist through the postpartum period, including mental health challenges, intimate partner violence, and substance use, all play a role in maternal mortality and broader maternal health outcomes.

What can states do to extend postpartum coverage under Medicaid?

Assuring that low-income women have continuous coverage after pregnancy would support improvements in infant and maternal outcomes. States have several main pathways for broadening coverage in the postpartum period to Medicaid beneficiaries. These would all involve some increase in state spending, but with substantial federal matching funds available as well. Potential approaches, in decreasing order of scope and reach, include:

  • Expand full scope Medicaid–Expanding Medicaid eligibility under ACA would provide the most comprehensive approach to broadening postpartum coverage, and the federal government would pay 90% of the costs for the expansion population. Postpartum women with incomes up to 138% FPL would be able to retain Medicaid past 60 days postpartum, providing greater continuity of coverage and care. Furthermore, other individuals with incomes up to 138% FPL would also qualify for Medicaid coverage, expanding Medicaid benefits to mothers and fathers as well as people without children, including those who intend to become pregnant and need preconception care. Research demonstrates the impact of Medicaid expansion on pregnancy-related coverage and care to date. One study found that Medicaid expansion was associated with lower maternal mortality rates compared to non-expansion states.7  Full Medicaid expansion would also narrow the coverage gap in non-expansion states for poor parents who do not qualify for either Medicaid or subsidies in the Marketplace. Research from the Urban Institute suggests that at least a quarter of uninsured new mothers would likely newly qualify for Medicaid postpartum if their state expanded Medicaid.
  • Raise parental income eligibility levels under Medicaid– Short of full expansion, non-expansion states have another tool at their disposal to narrow the postpartum coverage cliff– raising income eligibility thresholds for parents, which is one of the pre-ACA eligibility categories. States set income eligibility levels for Medicaid. Raising the eligibility thresholds for parents could extend Medicaid eligibility to more low-income mothers and fathers and partially close the coverage gap in non-expansion states. Currently, Wisconsin sets eligibility thresholds for parents at 100% FPL and Tennessee is not far behind at 93% FPL (Table 1). The rest of the non-expansion states are much more restrictive however and currently have large gaps in coverage for parents. States would receive their regular federal match rate for any new enrollees who qualify as a result of higher parental eligibility levels.
  • Extend pregnancy-related Medicaid coverage beyond 60 days postpartum– A number of states, both expansion and non-expansion, are taking action to try to extend the period of Medicaid postpartum eligibility, but the initiatives vary in scope.8 ,9  Some states are applying for Section 1115 waivers from CMS to extend Medicaid beyond 60 days postpartum. Georgia, a non-expansion state, enacted legislation to extend postpartum coverage from 60 days to six months for those who had a Medicaid funded birth, and the state has submitted a waiver application to CMS. Even in Medicaid expansion states, postpartum women may lose Medicaid coverage postpartum, particularly if their incomes are above 138% FPL, and need to transition to Marketplace insurance. Even with a premium subsidy, some may find the out of pocket costs unaffordable and they may have to change providers with a coverage transition. Some expansion states, such as Illinois and New Jersey, are also seeking waivers from CMS to extend Medicaid’s postpartum period so that low-income postpartum women at income levels above 138% FPL keep their Medicaid coverage beyond two months postpartum.
  • Expand coverage for specific postpartum services or specific populations- There has been some interest in broadening Medicaid postpartum coverage for specific health needs. The HHS maternal health action plan recommends supporting policies that allow states to maintain coverage for pregnant and postpartum people with substance use disorders. The postpartum period can be a particularly susceptible time for substance use relapse, with loss of coverage and access to care considered a potential trigger for relapse. Missouri and Indiana have submitted waiver applications to CMS that propose Medicaid postpartum extension to 12 months for postpartum women in need of services for substance use. Missouri’s waiver would allow postpartum women to continue to receive substance use and mental health services for a year, while Indiana’s proposal would extend full Medicaid coverage for those with opioid use disorder. Additionally, both states participate in CMS’ Maternal Opioid Misuse (MOM) model, a funding initiative that the agency offers for states to develop and improve programs to care for pregnant and postpartum people with opioid use disorder..Some states have used state dollars to extend postpartum coverage to certain populations. California enacted legislation and is using state funds to extend Medicaid coverage to a year for postpartum individuals diagnosed with a maternal mental health condition. Since September 2020, the state of Texas has been using state funds to provide a limited package of postpartum services for one year to those enrolled in the state’s Healthy Texas Women program, which is for uninsured reproductive age women. The state has submitted a Section 1115 waiver application to CMS to draw down federal funds for this program.
  • Provide postpartum coverage for family planning services – Outside of lengthening the postpartum period under Medicaid, half of states provide Medicaid coverage for just family planning services to individuals who do not qualify for full Medicaid coverage. While these programs do not provide coverage that is as comprehensive as full scope Medicaid, they provide access to postpartum and intrapartum contraceptive services, which is important for pregnancy planning and healthy birth spacing. Most of the non-expansion states have a Medicaid or state-funded family planning program (Figure 3). However, in three states – Tennessee, Kansas, and South Dakota – postpartum individuals who were covered by Medicaid for pregnancy likely become uninsured after 60 days because the state has not expanded Medicaid under the ACA, and may not even have access to contraceptive services after pregnancy because the state does not have a Medicaid-funded family planning program.
Figure 3: State Decisions on Medicaid Expansion and Family Planning Programs Affect Women’s Access to Postpartum Care

What legislative proposals are currently being considered at the federal level to broaden postpartum coverage and strengthen maternity care?

In the 2019-2020 Congressional session, a number of federal bills related to maternal health care coverage, access, and quality are pending. Major themes across these bills include extension of Medicaid postpartum coverage to 12 months, coverage of doulas, greater support for state maternal mortality review committees, broadening provider networks in rural areas, and training on health equity and implicit bias for providers. Some notable federal bills that have garnered attention include:

  • H.R. 4996 Helping Medicaid Offer Maternity Services (MOMS) Act of 2019 (sponsored by Rep. Robin Kelly), would amend the Medicaid program to allow states the option to extend continuous coverage with full benefits for postpartum individuals through one year postpartum. The bill was approved unanimously by voice vote in the House, and while many advocates and policymakers called for the Senate to pass the bill before the end of the 2019-2020 session, it was not passed.
  • H.R. 1425, Patient Protection and Affordable Care Act Enhancement Act – This bill focuses on strengthening the ACA, but also includes a change to the postpartum period under Medicaid from 60 days to a full year. This differs from the Helping MOMS Act, which proposes a state option, while this bill requires mandatory 12 months postpartum coverage in all states. There would likely be significant differences in financing and access to care between proposals that create a mandatory expansion versus a state option, which some states would not adopt.10  A CBO analysis of the coverage extension in HR 1425 estimates a resulting $6 billion increase in the deficit over ten years. The bill passed the full House of Representatives in June 2020.
  • H.R. 6142 – The MOMNIBUS is a package of nine bills sponsored by the Black Maternal Health Caucus in the House of Representatives and Vice-President elect Kamala Harris in the Senate. It is intended to improve different aspects of maternal health care for pregnant people, with a focus on health equity. Key components in the package include an extension of WIC benefits for one year postpartum, measures to diversify the perinatal workforce, funding to enhance maternal mortality committees and data collection, and mitigating the impact of social determinants of health. The MOMNIBUS has not yet been heard in a House committee.

Conclusion

As President-elect Biden, Vice President-elect Harris, and a new Congress come into office, maternal health, particularly large and persistent racial and ethnic inequities, continues to be a major health challenge. Coverage changes alone cannot address these issues, but given Medicaid’s large role in maternity financing and health coverage for communities of color, an extension of postpartum coverage for the full year after a Medicaid birth could provide stable coverage and care to more low-income birthing parents in both non-expansion and expansion states. For birthing parents, the need for health care services does not end two months after childbirth.

The ACA offers states the option to extend Medicaid eligibility to low-income parents with incomes up to 138% of the federal poverty level. However, in the 12 states that have not adopted full scope Medicaid expansion, most postpartum women lack a pathway to coverage and are at greater risk of becoming uninsured and losing access to critical health services in the postpartum and intrapartum periods. Some federal and state-level initiatives are in place to provide coverage for family planning or other more limited services to some reproductive age and postpartum people, but they do not provide the same level of coverage afforded by full scope Medicaid. Absent federal action, these decisions will continue to be in the hands of the states to decide whether to choose from among a number of pathways to expand coverage for new parents.

Table

Endnotes

  1. Black Mamas Matter Alliance, Policy Working Group. Advancing Holistic Maternal Care for Black Women Through Policy, December 2018. ↩︎
  2. Martin, et al. National Center for Health Statistics. “Births in the United States, 2019,” October 2020. ↩︎
  3. Daw, et al. High Rates of Perinatal Insurance Churn Persist After the ACA, Health Affairs, September 16, 2019. ↩︎
  4. Eckert, E. “Preserving the Momentum to Extend Postpartum Medicaid Coverage,” Women’s Health Issues, September 2020. ↩︎
  5. March of Dimes. Maternal Death and Pregnancy-Related Death, September 2019. ↩︎
  6. Howell, E. Reducing Disparities in Severe Maternal Morbidity and Mortality, Clinical Obstetrics and Gynecology, June 2018. ↩︎
  7. Eliason, E. “Adoption of Medicaid Expansion is Associated with Lower Maternal Mortality,” Women’s Health Issues, February 2020. ↩︎
  8. National Academy for State Health Policy (NASHP). States’ Efforts to Extend Medicaid Coverage to Postpartum Women. ↩︎
  9. American College of Obstetricians and Gynecologists (ACOG). Extend Postpartum Medicaid Coverage. ↩︎
  10. Heberlein, M. MACPAC. “Extending Postpartum Coverage.” December 10, 2020. ↩︎