Medicaid Spending and Enrollment Trends Amid the COVID-19 Pandemic – Updated for FY 2021 & Looking Ahead to FY 2022
Summary
Even as the COVID-19 vaccine roll-out is accelerating across the country, the public health and economic effects of the pandemic continue to put pressure on Medicaid spending and enrollment. In mid-February 2021, the Kaiser Family Foundation (KFF) and Health Management Associates (HMA) fielded a two-part rapid, mini-survey of Medicaid directors in all 50 states and the District of Columbia as a follow-up to the annual Medicaid Budget Survey conducted last summer. This brief provides insights into the current status of Medicaid enrollment and spending trends in FY 2021 and state projections for FY 2022. See separate brief for findings from Part II of this mini-survey, related to state Medicaid agency involvement with the COVID-19 vaccination roll-out. A total of 38 states responded to the Part I enrollment and spending survey, although not all of these states answered all of the survey questions. These states accounted for over three-quarters of total Medicaid enrollment.1 For most states, the state fiscal year begins on July 1. Key findings include the following:
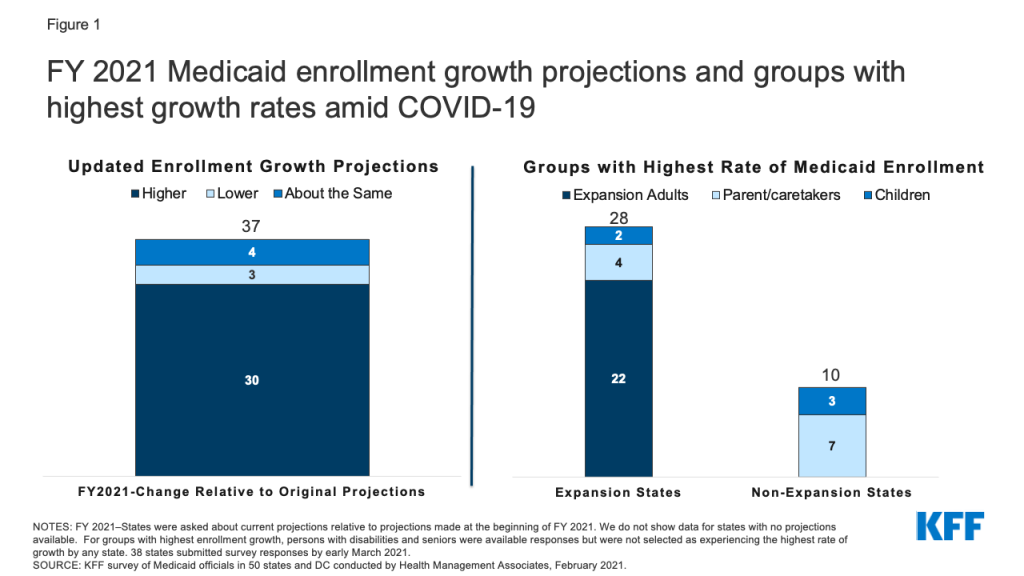
- Most states with updated Medicaid enrollment projections expect overall FY 2021 enrollment to exceed original projections (30 of 37 states). Most states reported that expansion adults and other adults had the highest rates of growth. Two-thirds of states with updated Medicaid expenditure projections for FY 2021 (24 of 37 states) also expect total FY 2021 Medicaid expenditures to exceed original projections.
- Looking ahead to FY 2022, just under half of responding states (12 of 29) are projecting a higher total Medicaid expenditure growth rate in FY 2022 compared to FY 2021, while just over half (14 of 29) are expecting the growth rate to be lower. While fewer states reported specific FY 2022 spending growth rate percentages, the median rate for 21 reporting states was 5.6% while the median projected enrollment growth rate for 17 reporting states was 5.5%. Most states with updated projections assumed that the public health emergency (PHE) would remain in effect through CY 2021, part-way through the state fiscal year.
Medicaid spending and enrollment trends will continue to depend on the trajectory of the pandemic and the economic downturn as well as the duration of the PHE. In particular, the expiration of the PHE and the enhanced FMAP will have implications for state spending during the 2022 fiscal year.
Background/Context
The coronavirus pandemic has generated both a public health crisis and an economic crisis, with major implications for Medicaid, a countercyclical program. During economic downturns, more people enroll in Medicaid, increasing program spending at the same time state tax revenues may be falling. To help support states as Medicaid enrollment grows and ensure continuous coverage for enrollees, the Families First Coronavirus Response Act (FFCRA) authorized a 6.2 percentage point increase in the federal match rate (“FMAP”) for states that meet certain “maintenance of eligibility” (MOE) requirements. The additional funds were retroactively available to states beginning January 1, 2020 and continue through the quarter in which the PHE period ends. While the current PHE declaration expires on April 21, 2021, the Biden Administration has notified states that the PHE will likely remain in place throughout CY 2021 and that states will receive 60 days-notice before the end of the PHE to allow states time to prepare for the end of emergency authorities and the resumption of pre-PHE rules.
After relatively flat Medicaid enrollment growth in FY 2020 (0.4%), states responding to KFF’s annual Medicaid Budget Survey conducted in June-August 2020, projected, on average, that Medicaid enrollment would increase 8.2% in FY 2021 (over FY 2020) and total spending would increase by 8.4%. Preliminary national data show that total Medicaid and CHIP enrollment grew to 77.3 million in September 2020, an increase of 6.1 million, or 8.6%, from February 2020. This growth likely reflects both changes in the economy, as more people experience income and job loss and become eligible and enroll in Medicaid coverage, and the FFCRA MOE provisions that require states to ensure continuous coverage for current Medicaid enrollees through the end of the month in which the PHE ends. This growth represents a reversal of recent Medicaid enrollment trends in 2016 through 2019, when the rate of total Medicaid and CHIP enrollment growth was declining or negative.
All states are experiencing fiscal stress tied to the pandemic, although individual state experiences vary. The impact of the pandemic on states depends on a variety of factors including the composition of state economies, tax structures, and virus transmission levels, among other factors. For example, states that are more dependent on tourism and the energy sector have seen larger economic and state revenue impacts. Overall, however, state revenues declined in FY 2020 and greater declines are expected in FY 2021. As a result, states’ enacted budgets for FY 2021 reflect the first general fund spending decrease in more than ten years as states make reductions to meet balanced budget requirements. While the state fiscal relief provided by FFCRA has undoubtedly helped states avoid more severe budget cuts, some states still face budget gaps that they must address. While states often turn to provider rate and benefit restrictions to constrain Medicaid spending during economic downturns, these cost containment approaches may not be as viable with providers facing revenue shortfalls and enrollees facing increased health risks due to the pandemic.
KEY FINDINGS
Enrollment
Most states with updated Medicaid enrollment projections expect overall FY 2021 enrollment to exceed original projections (30 of 37 states) with higher growth rates reported for expansion and other adults. We asked states to identify the eligibility group (children, parent/caretakers, expansion adults, persons with disabilities, or seniors) that has experienced the highest rate of enrollment growth in FY 2021 (Figure 1). A majority of responding states that had implemented the ACA Medicaid expansion as of February 2021 (22 of 28) indicated “expansion adults” have experienced the highest rate of enrollment growth in FY 2021 while four expansion states identified “parent/caretakers” and two expansion states identified “children.” Among the 10 responding non-expansion states, seven states indicated “parent/caretakers” have experienced the highest enrollment growth in FY 2021 while three states indicated “children.” No states reported seniors or persons with disabilities as groups experiencing the highest rate of enrollment growth. Nonelderly adults are more likely to be affected by changes in the economy and more likely to experience churn on and off the program that the FFCRA MOE has eliminated during the PHE.
The median growth rate for the 17 states reporting Medicaid enrollment growth projections for FY 2022 over FY 2021 is 5.5%. We asked states whether their projections accounted for the likelihood that the PHE and continuous coverage requirements would remain in place through CY 2021 as indicated in a January 2021 Biden administration letter to Governors. More than half of the responding states indicated that their projections reflect the PHE remaining in place throughout 2021, followed by a gradual enrollment decline beginning in CY 2022 after the expiration of continuous coverage requirements (during the second half the state fiscal year for most states). Several states indicated that their projections did not assume that the PHE and continuous coverage requirements would remain in place through the end of CY 2021 suggesting that the projections were developed prior to the release of the Biden Administration letter or that some states may not consider the letter to reflect enough certainty. Based on these assumptions, these states generally reported lower expected enrollment growth for FY 2022 than states that assumed the PHE would continue through CY 2021. To the extent that the PHE remains in place longer, actual enrollment could be higher than projected. In addition to uncertainty regarding the PHE end date, states cited other currently unknown factors that could significantly affect the accuracy of current FY 2022 enrollment projections such as future trends in unemployment and the Medicaid enrollment impacts of the ACA special enrollment period.
Expenditures
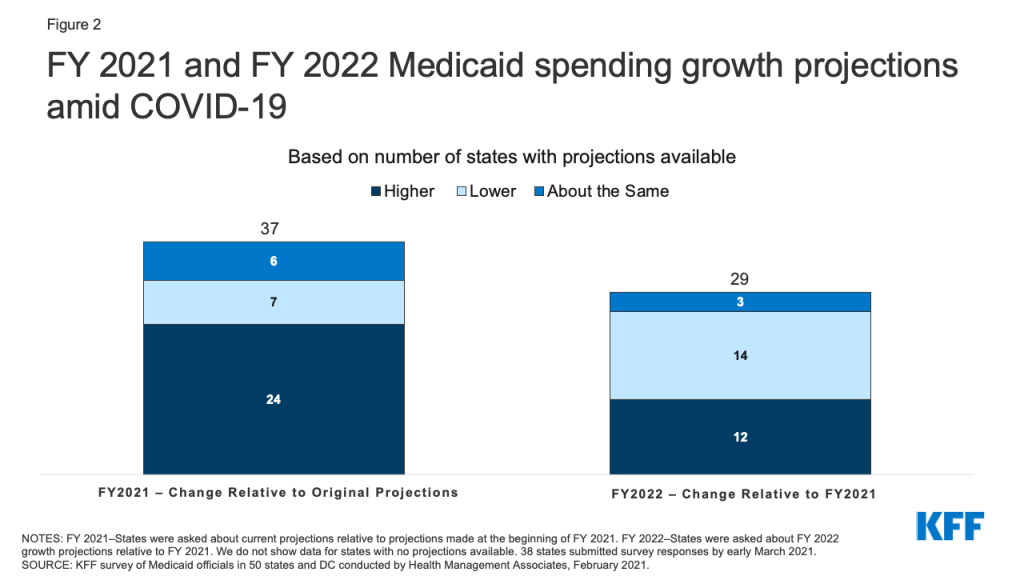
Almost two-thirds of states with updated Medicaid expenditure projections for FY 2021 (24 of 37) expect total FY 2021 Medicaid expenditures to exceed original projections (Figure 2). Nearly all of these states (23 of 24) indicated higher enrollment as the most significant driver of FY 2021 Medicaid expenditures so far. States attributed increases in enrollment to both the economic downturn and to the FFCRA MOE requirements. In contrast, about one third of states with updated FY 2021 projections expect total Medicaid expenditures to be lower than (7 of 37) or about the same as (6 of 37) earlier projections. Four states expecting lower FY 2021 total Medicaid expenditures attribute decreases to net decreases in utilization; three of these states deliver Medicaid services to enrollees through fee-for-service delivery systems where net decreases in utilization immediately result in lower Medicaid expenditures. While utilization may have been initially depressed in FY 2021 due to enrollees foregoing or providers limiting non-urgent care, some states commented that utilization was starting to rebound. Decreases in utilization in heavily capitated managed care states may not result in lower expenditures unless states adjust capitation rates.
Although many states’ updated FY 2021 total Medicaid expenditure projections exceed the projections originally made at the beginning of the state fiscal year, nine of 38 states reported mid-year cost containment policy actions. Three states indicated implementing mid-year provider rate cuts, and although not specifically asked about provider taxes, one state reported that they implemented a new provider tax in 2021. Eight states indicated making mid-year managed care plan rate adjustments. However, several states also commented that MCO contracts were amended to add risk mitigation strategies (e.g., risk corridors). One state reported implementing mid-year benefit restrictions, and one state reported several benefit expansions passed by the state legislature in 2020 were removed before implementation. The survey did not ask about the effects of the federal fiscal relief, but states had reported in an earlier survey that the fiscal relief helped to mitigate Medicaid cuts and address Medicaid shortfalls.
Of the 29 states with expenditure projections for next fiscal year, half anticipate that total Medicaid expenditure growth in FY 2022 will slow down compared to FY 2021 while just under half expect the rate to accelerate (Figure 2). Three states expect the rate of spending growth to be “about the same.” The median growth rate for the subset of states (21) reporting actual growth rates for FY 2022 is 5.6% (over FY 2021). While we only asked about total spending projections, state spending growth is likely to accelerate in FY 2022 when the PHE and enhanced FMAP expire, as states will need to replace the expiring federal funds with state funds.
About one-third of responding states (12 of 38) reported plans to introduce cost containment policy actions in FY 2022. Six states plan to introduce provider rate cuts in FY 2022, seven states plan to make MCO rate adjustments, and three states plan to introduce benefit restrictions. Other planned FY 2022 cost containment strategies/actions reported by states include expansion of value-based payment initiatives, new utilization management strategies, and the introduction of risk-based managed care. Similar to the mid-year cost containment strategies reported for FY 2021, several states reported plans to introduce (or continue) capitated managed care plan risk mitigation strategies (e.g., risk corridors) and at least one state plans to implement revenue generating provider fees. Fourteen states reported that no cost containment policy actions are planned for FY 2022, nine states reported that FY 2022 actions are undetermined, and three states responded, “don’t know.”
Looking Ahead
As states approach the end of FY 2021 and adopt budgets for FY 2022 (that begins in July for most states), they must account for the ongoing impacts of the pandemic and resulting economic downturn on Medicaid spending and enrollment trends. While substantial enrollment growth has already occurred across all states, more growth is possible as individuals continue to struggle with the economic downturn and due to the decision to open enrollment in the federal ACA Marketplaces from February 15 through May 15, combined with $50 million in federal spending on outreach and education about ACA coverage options. This outreach has the potential to reach millions of people who became uninsured prior to or during the pandemic and will likely result in more eligible low-income people enrolling in Medicaid. State spending and enrollment projections must also account for the expiration of the PHE. At that time, states will resume eligibility renewals and redeterminations, possibly leading to slower enrollment growth and decreased total spending growth. The end of the PHE, however, will also end the enhanced FMAP requiring states to increase state spending to replace the expiring federal funds. Finally, even if total Medicaid spending growth is lower in FY 2022 relative to 2021, median growth rates in excess of 5 percent may difficult to absorb, depending on how quickly the economy and state revenues recover.
- The 13 states that did not respond were: Arkansas, the District of Columbia, Georgia, Hawaii, Idaho, Louisiana, New Hampshire, New Jersey, New Mexico, Ohio, Texas, Utah, and Vermont. ↩︎