Medicare and Dental Coverage: A Closer Look

Authors: Meredith Freed, Nancy Ochieng, Nolan Sroczynski, Anthony Damico, and Krutika Amin
Published: Jul 28, 2021

Issue Brief

Dental benefits are not generally covered by Medicare, except under limited circumstances, and many people on Medicare do not have any dental coverage at all. Some Medicare beneficiaries have access to dental coverage through other sources, such as Medicare Advantage plans, but the scope of dental benefits, when covered, varies widely and is often quite limited, which can result in high out-of-pocket costs among those with serious dental needs or unmet need.

Policymakers are now discussing options to make dental care more affordable by broadening dental coverage for people on Medicare. President Biden’s FY 2022 budget request includes as part of the President’s healthcare agenda “improving access to dental, hearing, and vision coverage in Medicare.” Senate Democrats recently announced an agreement to include Medicare expansions, including dental, vision, and hearing, as part of the budget reconciliation package, though details of the agreement have not yet been released. In 2019, the House of Representatives passed the Elijah E. Cummings Lower Drug Costs Now Act (H.R.3) that would add a dental benefit to Medicare Part B, along with a vision and hearing benefit, in addition to provisions to reduce prescription drug costs. Earlier this year, Representative Doggett, joined by 76 members of the House of Representatives, introduced the Medicare Dental, Vision, and Hearing Benefit Act (H.R. 4311) which would cover these benefits under Medicare Part B.

In light of these ongoing policy discussions, this brief provides new data on the share of Medicare beneficiaries with dental coverage, the share with a dental visit in the past 12 months, and out-of-pocket spending on dental care. It also takes a closer look at the scope of dental benefits offered to Medicare Advantage enrollees in individual plans in 2021. We focus on Medicare Advantage plans because they have become the leading source of dental coverage among Medicare beneficiaries. Our analysis draws from multiple datasets, including the Medicare Current Beneficiary Survey for information on dental visits and out-of-pocket dental costs and the Medicare Advantage Enrollment and Benefit files for data on individual Medicare Advantage plans. To present a more detailed picture of dental benefits beyond what’s available in these data sets, we examine dental coverage offered by 10 geographically dispersed Medicare Advantage plans offered by different insurers with relatively high enrollment that offer dental benefits (see Methodology and Appendix for more information).

Key Findings

  • Nearly half of Medicare beneficiaries (47%), or 24 million people, do not have dental coverage, as of 2019.
  • Almost half of all Medicare beneficiaries did not have a dental visit within the past year (47%), with higher rates among those who are Black (68%) or Hispanic (61%), have low incomes (73%), or who are in fair or poor health (63%), as of 2018.
  • Average out-of-pocket spending on dental services among Medicare beneficiaries who had any dental service was $874 in 2018. One in five Medicare beneficiaries (20%) who used dental services spent more than $1,000 out-of-pocket on dental care.
  • In 2021, 94% of Medicare Advantage enrollees in individual plans (plans open for general enrollment), or 16.6 million enrollees, are in a plan that offers access to some dental coverage. Among these Medicare Advantage enrollees:
    • Most (86%) of these enrollees are offered both preventive and more extensive dental benefits.
    • More than three in four (78%) Medicare Advantage enrollees offered more extensive coverage are in plans with annual dollar limits on dental coverage, with an average limit of $1,300 in 2021; more than half (59%) of these enrollees are in a plan with a maximum dental benefit of $1,000 or less.
    • Nearly two-thirds of enrollees (64%) with access to preventive benefits, such as oral exams, cleanings, and/or x-rays, pay no cost sharing for these services, though their coverage is typically subject to an annual dollar cap.
    • The most common coinsurance for more extensive dental services, such as fillings, extractions, and root canals, is 50%.
    • About 10% of Medicare Advantage beneficiaries are required to pay a separate premium to access any dental benefits.

Dental Coverage, Utilization and Out-of-Pocket Spending

Nearly 24 million people, or about half of all Medicare beneficiaries (47%), did not have any form of dental coverage in 2019 (Figure 1).

Figure 1: Nearly half of all people on Medicare (47%) have no dental coverage

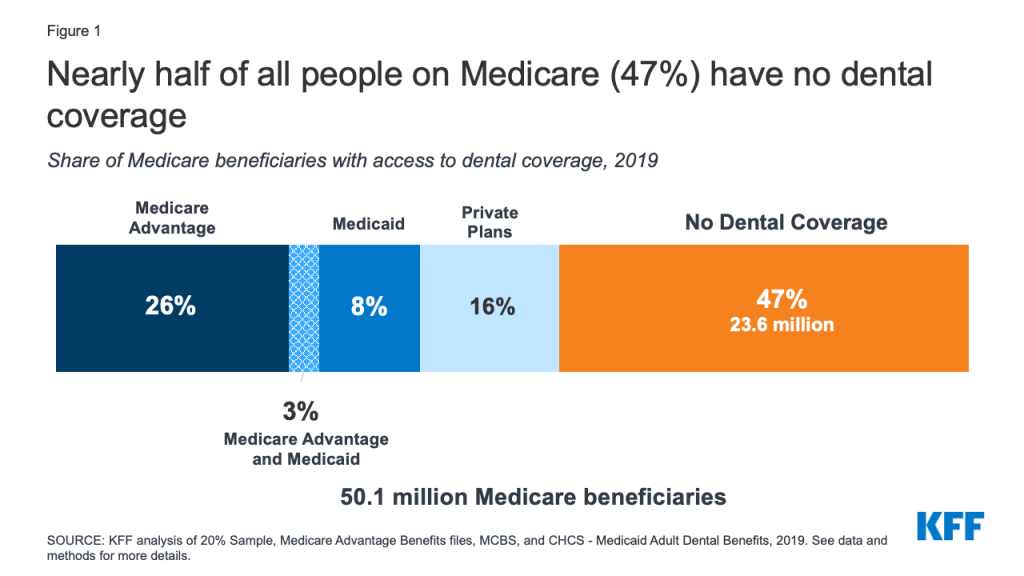
The remaining Medicare beneficiaries have access to dental coverage through Medicare Advantage plans, Medicaid, and private plans, including employer-sponsored retiree plans and individually purchased plans.

In 2019, 29% of all Medicare beneficiaries had access to some dental coverage through Medicare Advantage plans (including 3% of beneficiaries also eligible for Medicaid who had access to dental coverage through a Medicare Advantage plan). Another 16% had coverage through private plans. About 11% of Medicare beneficiaries had access to dental coverage through Medicaid (including the aforementioned who also have coverage through Medicare Advantage plans). With the rise of Medicare Advantage enrollment, a growing share of Medicare beneficiaries have access to some dental coverage through their Medicare Advantage plan, so the share of all Medicare beneficiaries with some dental coverage would likely be higher in 2021.

A prior KFF analysis of the 2016 Medicare Current Beneficiary Survey (MCBS) and other data sources indicated that nearly two-thirds of people on Medicare (65%) had no dental coverage that year. However, due to a data collection and processing issue subsequently identified by CMS, the estimates for private dental coverage derived from the MCBS were lower than they should have been by an unknown magnitude. CMS resolved this issue in 2017. Due to this and other methodological changes in our analysis, as explained in the methodology, estimates of the number of people on Medicare with dental insurance cannot be trended using our 2016 estimate.

Lack of dental care can exacerbate chronic medical conditions, such as diabetes and cardiovascular disease, contribute to delayed diagnosis of serious medical conditions, and lead to preventable complications that sometimes result in costly emergency room visits.1  Limited or no dental coverage and cost concerns contribute to Medicare beneficiaries foregoing routine and other dental procedures.

Utilization. In 2018, half of Medicare beneficiaries did not have a dental visit (47%) – with even higher rates reported among those who are Black or Hispanic (68% and 61%, respectively) (Figure 2).

Nearly half of all Medicare beneficiaries, and nearly two-thirds of Black beneficiaries, did not visit the dentist in the past year (2018)

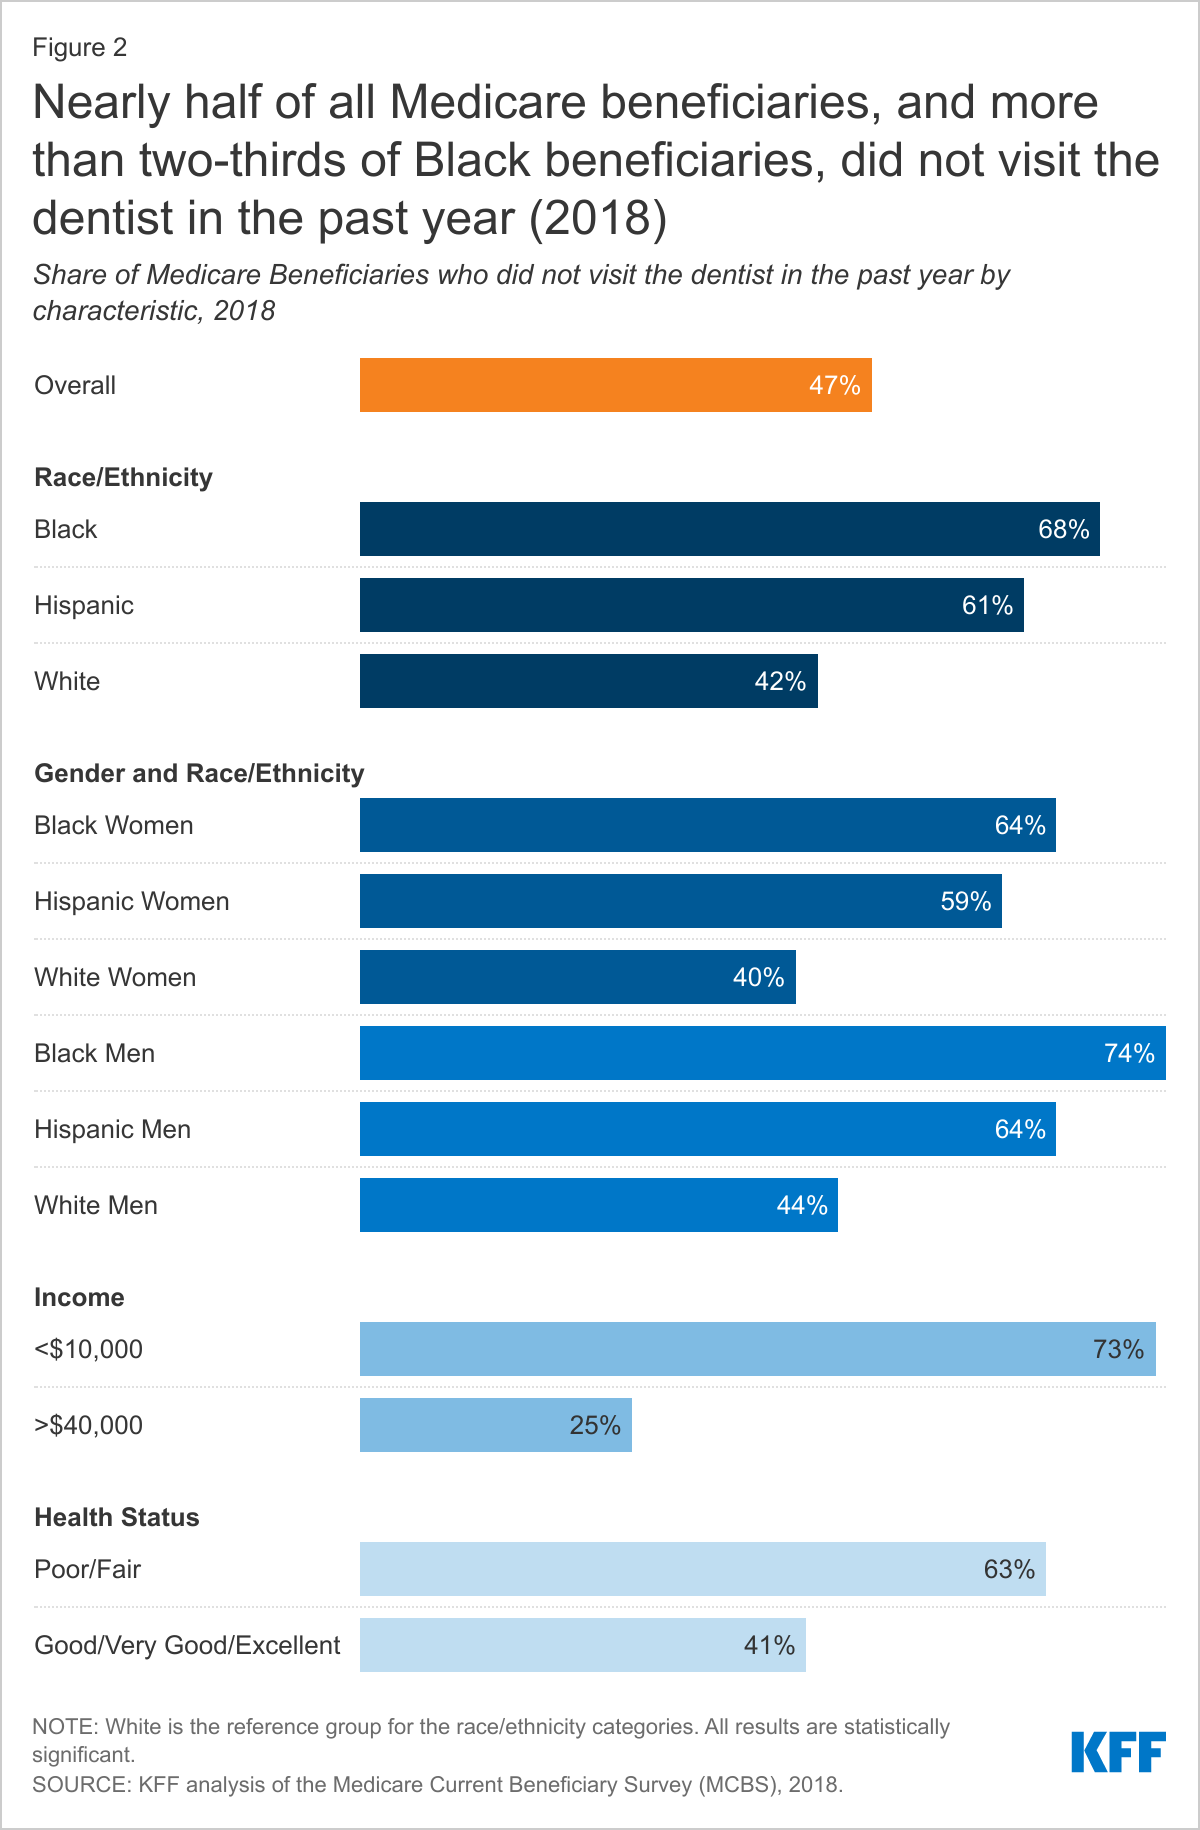
When we looked by race and gender, we found a larger share of Black and Hispanic women (64% and 59%, respectively) went without any dentist visit in the past year than White women (40%). The same pattern exists among men: a larger share of Black (74%) and Hispanic (64%) men than White men (44%) went without a dental visit.

Low-income beneficiaries are far less likely than higher-income beneficiaries to report a dental visit in the prior year. Nearly three-quarters (73%) of Medicare beneficiaries with incomes of less than $10,000 per year did not visit a dentist, as compared to 25% of beneficiaries with incomes above $40,000.

Health status was also correlated with dental care. Nearly two-thirds (63%) of all beneficiaries in fair or poor self-assessed health had a dental visit in the past year, as compared to 41% of beneficiaries in excellent, very good, or good health.

These relatively low rates of dental use are not attributable to a drop in utilization caused by the COVID-19 pandemic, as they are based on 2018 data, the most recent year available, which was prior to the pandemic.

Out-of-Pocket Spending. Most beneficiaries who received dental services in 2018 (88%) paid out of pocket for their care. Across all beneficiaries, average out-of-pocket spending on dental care was $454 in 2018, although this includes a large number of beneficiaries who did not have any dental care that year. Among the roughly half of all Medicare beneficiaries who used any dental services, average out-of-pocket spending on dental care was $874 in 2018. One in five beneficiaries who used dental services spent more than $1,000 out-of-pocket on dental care, including one in ten that spent more than $2,000 (Figure 3).

One in five Medicare beneficiaries who used any dental services spent more than $1,000

Medicare Advantage Dental Benefits

Medicare Advantage plans may provide extra (“supplemental”) benefits that are not covered under traditional Medicare, such as dental, vision, hearing, and fitness benefits. The cost of these benefits may be covered using rebate dollars. Plans can also charge additional premiums for such benefits. In 2021, 94% of Medicare Advantage enrollees in individual plans, have access to some dental coverage. The majority (86%) of these Medicare Advantage enrollees have access to a plan with more extensive coverage, while 14% had access to preventive coverage only. Preventive dental coverage under Medicare Advantage plans generally includes oral exams, cleanings, dental x-rays, and sometimes fluoride treatments. More extensive benefits cover a range of services, including restorative services (e.g., fillings), endodontics (e.g., root canals), periodontics (e.g., scaling and root planing), prosthodontics (e.g., dentures, dental implants), and oral surgery.

The Scope of Covered Dental Benefits Varies Across Medicare Advantage Plans

Virtually all Medicare Advantage enrollees in plans that offer access to dental benefits (including if they have to pay a premium for those benefits), have access to preventive services, including oral exams (100%), cleanings (100%), and x-rays (99%), although fewer enrollees have access to fluoride treatment (59%).

Service Limits. Medicare Advantage plans typically limit the frequency of obtaining certain covered services during defined time frames. For example, nearly all enrollees (88%) are in plans that have frequency limits on the number of cleanings, with the most common limit being twice per year. For other services, such as x-rays, the frequency limits vary more across plans. For example, 36% of enrollees are in plans that limit the number of x-rays to a specified time frame, with the most common limit being once per year.

Covered Services (Other Than Preventive). Among enrollees in plans that offer access to more extensive services, the type of covered services varies across plans: 96% of enrollees are in plans that offer restorative services, such as fillings; 83% are in plans that cover extractions; 76% are in plans that cover periodontics and/or prosthodontics; 64% are in plans that cover endodontics, such as root canals; and 60% are in plans that cover diagnostic services and/or non-routine services. However, we did not examine frequency limits for more extensive services because these service categories encompass a variety of treatments, and it is not always clear what an individual plan covers in each of these service categories.

like other dental benefits, coverage for dentures varies across plans

As part of the prosthodontics service category, some beneficiaries may have access to coverage for dentures, a commonly needed service among older adults. As of 2018, nearly 14% of adults 65 and older are edentulous, meaning they have no natural teeth. We were unable to determine specifics about denture coverage based on the analysis of national data, so we looked at the ten illustrative plans in more detail. Five of the ten plans specified that they covered dentures (partial and full) and each of these plans limit dentures to 1 set every 5 years (Appendix Table 1). Among these five plans, cost sharing imposed on beneficiaries for dentures ranges from no copayment to a $500 copayment, and 50% to 70% coinsurance. All of these cost-sharing amounts are for in-network dental providers. Four out of the five plans have annual caps toward covered services, while one plan does not specify if it has an annual cap. The other five plans that offered dental coverage did not specify if dentures were covered.

Medicare Advantage Plans That Offer Dental Benefits Typically Have an Annual Dollar Cap on Dental Coverage

Most Medicare Advantage enrollees have access to more extensive benefits and the majority (78%) of these enrollees are in plans that impose a maximum annual dollar cap on the amount the plan will pay for dental care. Some plans just cap the amount they will pay for the relatively extensive dental benefits (with no cap on preventive services), but the majority of enrollees are in plans that cap cost sharing for both preventive and more extensive services.

The average annual limit on dental coverage among plans that offer more extensive benefits is about $1,300 in 2021, and more than half (59%) of enrollees in these plans have dental benefits that are capped at $1,000 or less (Figure 4).

More than half (59%) of Medicare Advantage enrollees are in plan with a maximum dental benefit of $1,000 or less (among those in plans with an annual limit)

About 16% are in a plan that pays up to $500, while 22% of enrollees are in plans with a $2000 annual limit, and 8% of enrollees are in plans with a limit greater than $2,000 and up to $5,000. Coverage limits are far more common among plans that cover more extensive benefits than plans that cover only preventive services.

Preventive Services Are Often Covered Without Cost Sharing (Subject to Annual Dollar Limits); For More Extensive Dental Services, 50% Coinsurance and Caps Are the Norm

Medicare Advantage plans’ cost sharing for dental benefits varies across plans and by service category – some plans do not charge any cost sharing (primarily for preventive services), while others charge coinsurance and/or a flat copayment.

  • Preventive Services. Nearly two-thirds of enrollees (64%) in plans with access to oral exams, cleanings, and/or x-rays do not pay cost sharing for these services, although the majority of these enrollees are in plans that have annual limits on covered preventive services. An additional 8% of enrollees may have preventive services bundled as part of an office visit, which means they may only pay cost sharing for the visit itself, or in other cases, may have additional cost sharing for each individual service. About 3% of enrollees are in plans that require them to pay some type of cost sharing, which varies across plans. About 25% are in plans that do not report their cost-sharing amounts for these preventive services.
  • More Extensive Dental Services. For plans that offer more extensive benefits and require cost sharing, coinsurance is more common than copayments, and the most common coinsurance amount is 50% across the more extensive service categories, including restorative services, extractions, endodontics, periodontics, prosthodontics, non-routine services, and diagnostic services.
  • Cost sharing for more extensive dental services varies across plans (and services) and are typically subject to annual plan limits. For example, 39% of enrollees that are offered endodontic services (e.g. root canals) are in plans that do not require cost sharing for these services, but the majority of these enrollees are subject to an annual maximum on dental coverage. Another 30% are required to pay coinsurance for endodontic services – most often 50% – and also typically with an annual maximum. Among the remainder, 15% are required to pay copayments for endodontic services, and 15% of plans did not include data on cost-sharing amounts.

Among the ten illustrative Medicare Advantage plans with dental coverage, only one charges any cost sharing for preventive services ($10 copayment per service), though almost all plans (7) include an annual limit. Among the nine plans that offer more extensive dental services, five of the plans charge coinsurance, each of which is subject to an annual plan limit, with coinsurance ranging from 20% to 70% depending on the service, with 50% as the most common coinsurance amount across service categories. One of the plans requires copayments for more extensive dental benefits that vary depending on the service category (no annual maximum specified). Two plans that cover more extensive services do not require coinsurance or copayments; one of these plans has an annual limit ($2,300), while the other does not specify an annual limit.

Some Medicare Advantage Enrollees Must Pay a Separate Premium for Any Dental Coverage

Overall, 10% of Medicare Advantage enrollees in individual plans are required to pay a monthly premium to access any dental benefits, either preventive benefits only or more extensive benefits. For these enrollees, premiums average $270 per year, ranging from about $108 per year to $692 per year.

Some Medicare Advantage enrollees are in a plan where they are offered an option to pay a premium for additional dental benefits beyond those included in their plan, and some of these plans include vision and hearing benefits as part of that coverage. Dental premiums are in addition to premiums for other Medicare Advantage benefits, as well as the Medicare Part B premium ($148.50 in 2021).

Medicare Advantage Plans Tend to Limit Coverage to In-Network Providers or Charge More for Out-of-Network Care

Medicare Advantage plans that offer dental coverage may require enrollees to receive all covered services from in-network dental providers or impose additional cost sharing for services delivered out-of-network. Due to data limitations, we were unable to assess cost-sharing requirements for out-of-network dental care across all Medicare Advantage plans, so instead reviewed the practices of the 10 Medicare Advantage plans selected for this analysis.

Among the 10 illustrative Medicare Advantage plans, three plans do not cover any out-of-network dental care (Appendix Table 1). Two plans pay for out-of-network care “up to a certain amount” (amount not specified), with the patient billed for the remainder of the charges. Two plans impose coinsurance ranging from 50-55% for more extensive services received out-of-network, and another plan imposes 30% coinsurance for preventive services and 70% coinsurance for more extensive services delivered out-of-network. One plan covers out-of-network dental care for emergencies only, paying a maximum of $100 for any other out-of-network service. Finally, one plan covers 100% of preventive services received out-of-network.

How Medicare Advantage Dental Coverage Compares to Affordable Care Act (ACA) Marketplace Coverage

As context for assessing the scope of dental benefits offered to Medicare Advantage enrollees, we reviewed dental coverage available to those who purchase dental coverage through the ACA Marketplaces. Adults purchasing plans through the ACA Marketplace may have dental coverage as part of their medical plan, or may choose to purchase separate stand-alone dental coverage. Among stand-alone dental plans available to adults on HealthCare.gov in 2021 (the federal marketplace), 100% cover routine preventive dental services (e.g. exams, cleanings, x-rays), 97% cover basic dental care (e.g. fillings, extractions, gum disease treatment, and root canals), and 81% cover major dental care (e.g. crowns, bridges, and dentures). Unlike the analysis of Medicare Advantage plans, the data on the ACA Marketplace is not enrollment-weighted.

Like Medicare Advantage plans, most plans have little to no cost sharing for preventive services. For adult routine dental coverage, most plans charge no coinsurance (57% of dental plans), followed by no coinsurance after meeting the dental deductible (32%). The median dental deductible for an individual is $50. For adult basic dental care, the most common cost sharing amount is 50% coinsurance after meeting the dental deductible (40% of plans that cover this benefit).

Similarly, for adult major dental care, the most common cost sharing amount is 50% coinsurance after meeting the deductible (58% of plans that cover this benefit). These most common coinsurance amounts for basic and routine dental coverage are the same as those in Medicare Advantage plans for more extensive services (50% coinsurance), though most Medicare Advantage plans do not first charge a deductible. All of these coinsurance rates for the ACA Marketplace dental plans are for in-network providers.

Most plans on the ACA Marketplace have an annual limit the plan will pay toward covered services, typically ranging from $1,000 to $2,000. For stand-alone dental coverage, premiums vary slightly depending on the age of the enrollee. For an adult age 40, the average premium in 2021 is $290 per year, and ranges from $97 per year to $780 per year.

How Current Proposals Would Add a Dental Benefit to Medicare

In the 116th Congress, the House of Representatives passed the Elijah E. Cummings Lower Drug Costs Now Act (H.R.3), which among many provisions, provided for dental coverage under Part B of the Medicare program, starting in 2025 if enacted into law. Medicare would cover 80% of the cost of preventive services and basic treatments, and would phase up coverage for more major treatments, covering 10% of the cost in 2025, increasing 10 percentage points per year to 50% in 2029 and thereafter. The Congressional Budget Office estimated this benefit would cost almost $238 billion over 10 years (2020-209). The recently reintroduced version of H.R. 3 does not include coverage for a dental benefit.

Representative Doggett introduced the Medicare Dental, Vision, and Hearing Benefit Act (H.R. 4311) in July 2021 that would provide dental coverage under Medicare Part B. In contrast to H.R.3, the proposal, according to a press release, would require no coinsurance for preventive services, and impose a 20% coinsurance for more extensive benefits, which is similar to how the Part B benefit is structured for physician and other outpatient services, and is lower than the 50% coinsurance typically charged by Medicare Advantage plans.

Discussion

Since its enactment in 1965, Medicare has not covered routine dental care and half of Medicare beneficiaries (47%) do not have any dental coverage, as of 2019. Without dental coverage, many people on Medicare forego needed and routine dental care – an issue that disproportionately impacts communities of color – with significantly fewer visits to the dentist in the past year among Black and Hispanic beneficiaries (68% and 61%, respectively) compared to White beneficiaries (42%). Untreated oral health can exacerbate certain chronic diseases, delay diagnosis of serious health conditions, and result in costly emergency visits. Further, among beneficiaries who have the ability to pay for dental treatment, many experience high out-of-pocket costs, with 20% of people spending more than $1,000 out-of-pocket on dental care.

Medicare Advantage plans are the leading source of dental coverage for people with Medicare. While the scope of dental coverage varies across Medicare Advantage plans, there are some common features: virtually all Medicare Advantage enrollees with access to dental coverage as part of their plan have preventive benefits, and most have access to more extensive dental benefits, though cost sharing for more extensive services is typically 50% for in-network care, and subject to an annual cap on plan payments. More than three out of four (78%) enrollees with access to more extensive services are subject to annual caps – averaging about $1,300 in 2021.

In conducting this analysis, we found that plans do not use standard language when defining their benefits and include varying levels of detail, making it challenging for consumers or researchers to compare the scope of covered benefits across plans.

Given the continued interest in adding a dental benefit to Medicare, policymakers will need to weigh a variety factors in designing this benefit, including the scope of covered benefits, cost sharing for specific services, and how different levels of dental coverage may affect Medicare costs and premiums.

Meredith Freed, Nancy Ochieng, Nolan Sroczynski, and Krutika Amin are with KFF.

Anthony Damico is an independent consultant.

Methodology

Methodology

This analysis uses data from multiple sources: Medicare Current Beneficiary Survey (MCBS), 2018 and 2019; Medicare Chronic Conditions Data Warehouse data from 20 percent of beneficiaries (20% Sample), 2019; and CMS Medicare Advantage Enrollment and Benefit files, 2019 and 2021. The analysis also uses data from the Center for Health Care Strategies’ (CHCS) Medicaid Adult Benefits data, updated September 2019.

To determine dental coverage in Figure 1, we combined data from multiple sources. The 20% Sample and Medicare Advantage Benefits files, 2019 were used to determine the number of Medicare Advantage enrollees with access to dental coverage. The 20% Sample, combined with data from CHCS 2019, was used to calculate the number of full dual eligible beneficiaries with some dental coverage based on whether they lived in a state that offered adult dental benefits through Medicaid. While we use CHCS data for dental coverage for adults, it is possible that not all duals are covered by adult dental benefits because the benefit may vary based on eligibility pathway. Private dental coverage was calculated using the share of MCBS 2019 responses to questions about whether a beneficiary has dental coverage, and then using that share to calculate a comparable number of people with private dental coverage using the 20% Sample for estimates of all Medicare beneficiaries. The populations are those with both Parts A and B in March of 2019, excluding the US territories. Had we included those with Part A-only, which is primarily people who have employer-based coverage or some public retirees, the number and share with private dental coverage would be higher.

This analysis of Medicare dental coverage differs from KFF’s analysis of dental coverage in 2016 in several ways, and therefore this data cannot be trended using our 2016 estimate. CMS identified a data collection and processing issue in the Medicare Current Beneficiary Survey 2016 data that resulted in lower estimates of private dental coverage than should have been reported based on actual survey responses. CMS resolved this issue in the 2017 MCBS. In our prior analysis, full dual eligible beneficiaries who lived in states with adult emergency-only dental coverage were considered to have dental coverage. However, in this analysis, they are not considered to have dental coverage because emergency-only coverage does not compare to most coverage provided under Medicare Advantage or private plans; Medicare also provides some emergency-only coverage. There were 16 states that we codified as not providing dental coverage to adults on Medicaid based on CHCS data: AL, TN, MD (no coverage); AK, AZ, FL, GA, ME, MS, NV, OK, TX, UT, WV (emergency-only coverage); and NH, DE (dental benefit was under development in 2019). We excluded from the total 4.4 million Medicare Advantage enrollees who are in employer-group health plans from this analysis (but not in the prior analysis) because information describing supplemental benefits, including dental coverage, are not available. Finally, in our prior analysis, we combined estimates from the 20% Sample and MCBS to determine the total number of Medicare beneficiaries in 2016, whereas the 2019 total population is derived from the 20% Sample.

The 2018 MCBS Cost Supplement file was also used to look at visits to the dentist, and out-of-pocket costs for dental services. MCBS Cost Supplement data from 2019 are not yet available for these variables.

The Medicare Advantage Enrollment and Benefit files for 2021 were used to look at dental coverage for beneficiaries enrolled in individual Medicare Advantage plans (e.g. excludes Special Needs Plans and employer-group health plans). This analysis includes enrollees in Puerto Rico and other territories. Plans with enrollment of 10 or fewer people were also excluded because we are unable to obtain accurate enrollment numbers.

To supplement the Medicare Advantage analysis, we examined the scope of dental coverage offered by ten Medicare Advantage plans in greater detail. We reviewed 2021 Medicare Advantage plans with the highest enrollment, and among these highest enrollment plans, we selected 10 geographically dispersed plans, taking into account variations across firms and a mix of HMO and PPO plans. As part of this illustrative analysis, we examined a variety of aspects of Medicare Advantage plans including premiums, annual caps, coinsurance/copayments, covered services, and networks, among others.

The Healthcare.gov 2021 QHP landscape data was used to look at plans available on the ACA Marketplace. This data only includes dental information from the federal marketplace; states that have their own marketplaces are not represented in this data. Child-only plans were excluded. Data used in this analysis was not enrollment-weighted.

Appendix

Table 1: Dental Coverage Among Select 10 Medicare Advantage Plans

Endnotes

  1. U.S. Department of Health and Human Services. Oral Health in America: A Report of the Surgeon General. Rockville, MD: U.S. Department of Health and Human Services, National Institute of Dental and Craniofacial Research, National Institutes of Health, 2000; Schenkein HA, Loos BG. Inflammatory mechanisms linking periodontal diseases to cardiovascular diseases. J Clin Periodontol 2013;40 (Suppl. 14):S51–S69 https://onlinelibrary.wiley.com/doi/epdf/10.1111/jcpe.12060; Teeuw WJ, Gerdes VE, Loos BG. Effect of periodontal treatment on glycemic control of diabetic patients: a systematic review and meta-analysis. Diabetes Care 2010;33(2):421-7. https://www.ncbi.nlm.nih.gov/pmc/articles/PMC2809296/pdf/zdc421.pdf; Preshaw PM, Alba AL, Herrera D, et al. Periodontitis and diabetes: a two-way relationship. Diabetologia 2011;55(1):21-31. https://www.ncbi.nlm.nih.gov/pmc/articles/PMC3228943/#CR7; Allareddy V, Rampa S, Lee MK, et al. Hospital-based emergency department visits involving dental conditions. The Journal of the American Dental Association 2014;45(4):331–337. https://jada.ada.org/article/S0002-8177(14)60010-6/fulltext; Okunseri C, Okunseri E, Thorpe JM, Xiang Q, Szabo A. Patient characteristics and trends in nontraumatic dental condition visits to emergency departments in the United States. Clin Cosmet Investig Dent 2012;4:1-7. https://www.ncbi.nlm.nih.gov/pmc/articles/PMC3652363/ ↩︎
News Release

Millions of Medicare Part D Enrollees Have Had Out-of-Pocket Drug Costs High Enough to Exceed the Catastrophic Threshold Over Time

Findings Come as Lawmakers in Congress Consider Establishing a Hard Cap on Such Spending

Published: Jul 23, 2021

Nearly 3 million Medicare Part D enrollees had out-of-pocket drug spending above the catastrophic threshold in a recent five-year period, finds a new KFF analysis that takes a comprehensive look at how many people on Medicare have drug expenses high enough to push them above that limit.

While the Part D drug benefit has helped make drugs more affordable for people with Medicare, the lack of a hard cap on annual out-of-pocket spending under Part D exposes enrollees to significant costs, unless they qualify for low-income subsidies.

While a relatively small number of enrollees exceeds the threshold in any given year, the new analysis shows that, over time, the number of beneficiaries with expenses above the cap grows — including beneficiaries who have persistently high drug costs over multiple years and people who have high costs in one year but not others.

In 2019, for instance, nearly 1.5 million Medicare Part D enrollees had out-of-pocket spending above the catastrophic coverage threshold, the new analysis finds. Looked at more broadly over a five-year period (2015-2019), the number with spending above the threshold in at least one year increases to 2.7 million Part D enrollees. And over 10 years (2010-2019) the number of enrollees with out-of-pocket drug spending above the threshold in at least one year during the period increases to 3.6 million.

The study findings come amidst ongoing public concern about the high cost of prescription drugs, and as policymakers on both sides of the aisle support proposals in the House and Senate to modify the design of the Part D benefit and establish a hard cap on out-of-pocket drug spending by Part D enrollees.

The standard Part D benefit includes a catastrophic coverage threshold above which enrollees must pay five percent of their total drug costs out-of-pocket, with the rest covered mainly by Medicare. In 2021, the catastrophic threshold is set at $6,550 in out-of-pocket drug costs, an amount that includes what beneficiaries themselves pay plus the value of the manufacturer discount on the price of brand-name drugs in the coverage gap (aka, “donut hole”), which counts towards this amount.

That five percent coinsurance, however, can really add up. Medicare beneficiaries who take high-cost drugs for conditions such as cancer, multiple sclerosis, rheumatoid arthritis, or hepatitis C can pay thousands of dollars out-of-pocket for their medications after exceeding the Medicare Part D catastrophic threshold. Proposals to cap what beneficiaries pay could add costs to the program, unless combined with other policies to lower Medicare drug spending.

All told, Part D enrollees with drug spending above the catastrophic threshold at some point between 2010 and 2019 collectively incurred $9.9 billion in out-of-pocket costs for prescriptions filled in the catastrophic phase – representing more than one-third of their total out-of-pocket drug costs over the period ($26.1 billion).

Under H.R. 3, the Elijah E. Cummings Lower Drug Costs Now Act, out-of-pocket drug spending under Part D would be capped at $2,000, while under H.R. 19, the Lower Costs, More Cures Act, the House GOP prescription drug bill, and bipartisan legislation that passed out of the Senate Finance Committee in the 116th Congress (S. 2543, Prescription Drug Pricing Reduction Act of 2019, and the Senate Finance bill), the cap would be set at $3,100. Both amounts exclude the value of the manufacturer discount.

Also available is the newly updated brief, What’s the Latest on Medicare Drug Price Negotiations?, which describes the status of proposals to give the federal government the authority to negotiate drug prices in Medicare, including how the negotiation process would work under H.R. 3 and the expected effects on spending for Medicare, beneficiaries and people with private insurance.

For more data and analyses about Medicare and prescription drug costs, visit kff.org.


What’s the Latest on Medicare Drug Price Negotiations?

Published: Jul 23, 2021

For details on the Inflation Reduction Act’s Medicare Drug Price Negotiation Program, see “FAQs About the Inflation Reduction Act’s Medicare Drug Price Negotiation Program”

Prescription drug costs are a major concern for consumers and a fiscal challenge for public and private payers, representing 10% of national health spending and nearly 20% of health benefit costs for large employers and Medicare. In response, lawmakers are considering a broad range of policy options, including one that would allow the federal government to negotiate prescription drug prices on behalf of Medicare beneficiaries and people enrolled in private plans, a proposal that has strong bipartisan public support. This brief describes the current status of drug price negotiation proposals, looks back at the history of proposals to give the federal government the authority to negotiate drug prices in Medicare, describes the negotiation provisions in key legislation (H.R. 3), and discusses the potential spending effects for the federal government and individuals.

What’s the status of Medicare drug price negotiation proposals?

President Biden supports a change in law that would allow Medicare to negotiate drug prices, according to a July 2021 executive order and the FY2022 budget proposal, although the Administration has not outlined a specific process for drug price negotiation and estimated savings from this proposal were not reflected in the budget. The executive order, which also endorsed other proposals to lower drug prices, such as inflation caps, called for HHS to develop more specific proposals to lower drug prices within 45 days of the order’s issue date.

In Congress, proposals to authorize the federal government to negotiate drug prices for Medicare and other payers appear to have some momentum in the both the House and Senate. In the House, this proposal is a key feature of H.R. 3, the Elijah E. Cummings Lower Drug Costs Now Act, which was reintroduced in the 117th Congress in April 2021 after passing the House in the previous session. H.R. 3 would require the Secretary of the Department of Health and Human Services (HHS) to negotiate the price of at least 50 brand-name drugs without generic competitors starting in 2025 and would make the negotiated price available to both Medicare and private payers. Other legislation has been introduced in the House that would also allow government negotiation of drug prices.

In the Senate, Democrats are reportedly planning to include a provision to allow Medicare drug price negotiation provision in a budget reconciliation package, although specific details have not yet been released. The chairman of the Senate Finance Committee, Senator Ron Wyden (D-OR), released a set of principles for drug pricing reform in June 2021 that endorsed Medicare drug price negotiation, among other approaches, but has not yet released drug price legislation in the 117th Congress. According to Senator Wyden’s principles document, allowing Medicare to negotiate drug prices could address circumstances of market failure around drug prices, such as when there is inadequate or no competition or when drugs launch at high prices that may not be justified based on their clinical value. The principles call for a policy that establishes clear criteria for which drugs to include in price negotiation, gives the HHS Secretary the requisite tools to negotiate a “fair” price, and creates incentives for manufacturers to participate in the negotiation process.

What’s the history of Medicare drug price negotiations?

Under the Medicare Part D program, which covers retail prescription drugs, Medicare contracts with private plan sponsors to provide a prescription drug benefit and gives plan sponsors authority to negotiate drug prices with pharmaceutical companies. The law that established the Medicare Part D benefit, which covers retail prescription drugs, includes a provision known as the “noninterference” clause, which stipulates that the HHS Secretary “may not interfere with the negotiations between drug manufacturers and pharmacies and PDP [prescription drug plan] sponsors, and may not require a particular formulary or institute a price structure for the reimbursement of covered part D drugs.” In effect, this provision means that the government can have no direct role in negotiating or setting the price of drugs in Medicare Part D. This approach contrasts with how drug prices are determined in some other federal programs, such as mandatory drug price rebates in Medicaid, and the use of ceiling prices and minimum discounts, in conjunction with a national formulary, in the Department of Veterans Affairs (VA).

For drugs administered by physicians that are covered under Medicare Part B, Medicare reimburses providers 106% of the Average Sales Price (ASP), which is the average price to all non-federal purchasers in the U.S, inclusive of rebates.  When no ASP is available, Medicare pays 103% of the wholesale acquisition cost (WAC) until ASP data are available. The WAC is equivalent to a list price and typically higher than ASP. In other words, Medicare does not set its own rates for drugs covered under Part B, in contrast to how traditional Medicare sets payment rates for hospitals, physicians, and other providers.

The Part D non-interference clause has been a longstanding target for some policymakers since even before the Part D drug benefit took effect in 2006. And with the rise in the number of high-priced drugs coming to market, including the recently-approved Alzheimer’s drug, and with drug prices rising faster than the rate of inflation, there is renewed interest in proposals to lower drug spending, including allowing the federal government to negotiate drug prices for Medicare beneficiaries and people with private insurance. Proponents of this approach believe that giving the HHS Secretary the authority to negotiate drug prices would provide the leverage needed to lower drug costs, particularly for high-priced drugs for which there are no competitors, where private plans may be less able to negotiate lower prices. Opponents counter that the current system of private plan negotiation is working well, and that government involvement in price negotiations could dampen incentives for pharmaceutical companies to invest in research and development.

How would Medicare negotiate drug prices under H.R. 3?

H.R. 3 amends the non-interference clause under current law by adding an exception that allows for the price negotiation process established by the legislation. The negotiation process applies to at least 25 (in 2024) and 50 (in 2025 and subsequent years) single-source brand-name drugs lacking generic or biosimilar competitors, selected from among the 125 drugs with the highest net Medicare Part D spending and the 125 drugs with the highest net spending in the U.S., which could include physician-administered drugs covered under Medicare Part B, along with all insulin products. Drugs that are new to market could also be subject to negotiation if their list price is greater than median household income and their projected spending would place them among the list of drugs with the highest spending under Medicare or the U.S. overall.

From these lists, the Secretary selects specific drugs for negotiation based on projections of the greatest savings to the federal government or to individuals eligible for the negotiated price. The Secretary would then negotiate with pharmaceutical manufacturers to determine a “maximum fair price” for each of the selected drugs. H.R. 3 defines a target price for a selected drug equal to the lowest average price in one of six countries (Australia, Canada, France, Germany, Japan, and the United Kingdom), or 80% of the average manufacturer price in cases where there is no international price, as might be the case for relatively new drugs. The bill also establishes an upper limit for the negotiated price equal to 120% of the Average International Market (AIM) price paid by at least one of the six applicable countries. For selected drugs where there is no AIM price available, the proposal establishes a maximum price equal to 85% of the average manufacturer price (AMP). The AMP is defined as the average price charged by drug companies to wholesalers and pharmacists, net of discounts.

In determining the maximum fair price, H.R. 3 requires the Secretary to consider research and development costs, market data, production and distribution costs, and existing therapeutic alternatives, including comparative effectiveness data. If a manufacturer offers a price that is no more than the target price, the proposal requires the Secretary to accept this as the maximum fair price for the drug. The agreed-upon negotiated price would be made available to private plan sponsors in Medicare Part D and commercial payers in group and individual markets, and to providers that administer physician-administered drugs.

H.R. 3 imposes financial penalties on drug companies that do not comply with the negotiating process as well as if negotiations fail. Manufacturers that fail to negotiate successfully with the Secretary would face an escalating excise tax on the previous year’s gross sales of the drug in question, starting at 65% and increasing by 10% every quarter to a maximum of 95%. In addition, manufacturers that refuse to offer an agreed-upon negotiated price to any payer would pay a civil monetary penalty equal to 10 times the difference between the price charged and the maximum fair price (based on AIM, as explained above).

The timeline for the negotiation process spans a roughly two-year period. To make negotiated prices available in 2024, the list of selected drugs for negotiation would be published on April 15, 2022. The period of negotiation between the Secretary and manufacturers would occur between June 15, 2022 and March 31, 2023, and the negotiated “maximum fair prices” would be published no later than April 1, 2023.

What has CBO said about the potential for savings from Medicare drug price negotiation under H.R. 3?

CBO estimated over $450 billion in 10-year (2020-2029) savings from the Medicare drug price negotiation provision in the version of H.R. 3 in the 116th Congress, including $448 billion in savings to Medicare and $12 billion in savings for subsidized plans in the ACA marketplace and the Federal Employees Health Benefits Program. CBO also estimated an increase in revenues of about $45 billion over 10 years resulting from lower drug prices available to employers, which would reduce premiums for employer-sponsored insurance, leading to higher compensation in the form of taxable wages.

separate CBO estimate of the same Medicare drug price negotiation provision included in another House bill in the 116th Congress (H.R. 1425, the Patient Protection and Affordable Care Enhancement Act) estimated higher 10-year (2021-2030) savings of nearly $530 billion, mainly because the Secretary would negotiate prices for a somewhat larger set of drugs in year 2 of the negotiation program under H.R. 1425 than under the version of H.R. 3 that CBO scored (50 vs. 25 drugs; this change is incorporated in the current version of H.R. 3).

In prior analyses of drug price negotiation, CBO said that providing the Secretary with broad authority to negotiate drug prices without also exerting some form of pressure on drug manufacturers to lower their prices would likely produce negligible savings. However, in its analysis of H.R 3, CBO indicates that the excise tax provision provides the Secretary with needed leverage to achieve lower drug prices and federal savings by creating a strong incentive for drug companies to engage in the negotiation process.

While CBO expects that the lower drug prices resulting from allowing the federal government to negotiate drug prices would lead to lower Medicare beneficiary premiums and cost sharing under Part D, CBO also expects that this policy would lower revenues for drug manufacturers, lead to higher drug prices in other countries and a lag in the introduction of new drugs in the six reference countries, and lead to a modest reduction in the number of drugs coming to market in the future, due to the loss in revenue for drug manufacturers. CBO estimates eight fewer drugs coming to market over the next 10 years, of the approximately 300 drugs expected to be approved during this period, and 30 fewer drugs in the subsequent decade.

How would drug price negotiations affect out-of-pocket drug spending and premiums?

Allowing the federal government to negotiate drug prices on behalf of Medicare beneficiaries and private plan enrollees would reduce out-of-pocket drug spending and premiums, according to an analysis by Medicare’s actuaries of the version of H.R. 3 that passed the House of Representatives in the 116th Congress. (CBO has not conducted a similar analysis for H.R. 3.) The actuaries estimated that the negotiation provisions of H.R. 3 would reduce spending by Medicare Part D enrollees by $117 billion between 2020 and 2029, including a reduction of nearly $103 billion in cost sharing for people who use drugs covered under Part D that are subject to negotiation, and another $14 billion reduction in Part D premiums. In addition, the actuaries estimated that the negotiation authority in H.R. 3 would reduce beneficiary spending under Part B by an additional $18 billion during this time period by reducing cost sharing for Part B drugs by more than $6 billion and by reducing Part B premiums by nearly $12 billion. These estimates do not reflect the interactive effects of other provisions in H.R. 3, such as the Part B and Part D inflation caps or Part D benefit redesign, which would also affect beneficiary premiums and cost sharing.

Because the lower negotiated prices would also apply to private health insurers under H.R. 3, people with private insurance would also face lower cost sharing for prescription drugs and premiums, according to the actuaries. Overall, people with private health insurance would save an estimated $54 billion between 2020 and 2029, including $25 billion in lower cost sharing for enrollees who use drugs subject to negotiation and $29 billion in savings due to lower premiums.

These estimates may understate savings for Medicare beneficiaries and private plan enrollees that could be achieved under the current version of H.R. 3, which requires the Secretary to negotiate prices for a larger number of drugs in year 2 than the version of H.R. 3 that the actuaries analyzed.

What are the prospects for Medicare drug price negotiation?

With President Biden in the White House and Democrats now controlling both chambers of Congress, the prospects for a change in law that would allow the federal government to negotiate drug prices appear to be more favorable than under the previous Administration, although the path forward for this proposal remains uncertain. Congressional Democrats are generally supportive of government negotiations on drug prices, as is the public, based on concerns about high and rising drug prices, particularly for new drugs with little or no competition. Many supporters would also like to apply budgetary savings from this proposal to pay for other health care priorities. But even among Democrats, support for this proposal is not universal, and it is not clear that current legislative proposals have sufficient votes to pass the House this Congressional session, given a narrower majority, and concerns about preserving incentives for innovation raised by some centrist Democratic lawmakers.

Congressional Republicans have generally been opposed to allowing the Secretary to negotiate drug prices under Medicare and did not include this proposal in their drug price legislation, H.R. 19. The pharmaceutical industry continues to express strong opposition to government involvement in drug price negotiations based on concerns that it could lower revenue for drug companies, have a dampening effect on research and development, and limit access to new drugs. H.R. 3 includes $7.5 billion in additional funding over 10 years (2022-2031) for the National Institutes of Health (NIH) to support innovative biomedical research through the NIH Innovation Projects, which would supplement the $5 billion in funding allocated for such research in the 21st Century Cures Act.

While the immediate prospects for legislation to allow the federal government to negotiate drug prices for Medicare and private payers are unclear, the proposal may have greater momentum in the current session of Congress given support among the leadership in the House and Senate, the strength of public support among both Democrats and Republicans, and the potential to achieve meaningful savings for patients, employers, and Medicare.

This work was supported in part by Arnold Ventures. We value our funders. KFF maintains full editorial control over all of its policy analysis, polling, and journalism activities.

Millions of Medicare Part D Enrollees Have Had Out-of-Pocket Drug Spending Above the Catastrophic Threshold Over Time

Authors: Juliette Cubanski, Tricia Neuman, and Anthony Damico
Published: Jul 23, 2021

Medicare Part D, the outpatient prescription drug benefit for Medicare beneficiaries, provides catastrophic coverage for high out-of-pocket drug costs, but there is no limit on the total amount that beneficiaries have to pay out of pocket each year. Medicare Part D enrollees with drug costs high enough to exceed the catastrophic coverage threshold are required to pay 5% of their total drug costs unless they qualify for Part D Low-Income Subsidies (LIS). In 2021, the catastrophic threshold is set at $6,550 in out-of-pocket drug costs, which includes what beneficiaries themselves pay and the value of the manufacturer discount on the price of brand-name drugs in the coverage gap (sometimes called the “donut hole”), which counts towards this amount. With no hard cap on out-of-pocket drug spending, Medicare beneficiaries without LIS who take high-cost drugs for conditions such as cancer, multiple sclerosis, rheumatoid arthritis, or hepatitis C may pay thousands of dollars in out-of-pocket costs for their medications after exceeding the catastrophic threshold.

Policymakers on both sides of the aisle support proposals to modify the design of the Part D benefit and establish a hard cap on out-of-pocket prescription drug spending by Part D enrollees. This proposal is included in H.R. 3, the Elijah E. Cummings Lower Drug Costs Now Act, which passed the U.S. House of Representatives in December 2019 and was recently reintroduced in the 117th Congress; H.R. 19, the Lower Costs, More Cures Act, the House GOP prescription drug bill; bipartisan legislation that passed out of the Senate Finance Committee in the 116th Congress (S. 2543, Prescription Drug Pricing Reduction Act of 2019); and other legislation. Under H.R. 3, out-of-pocket drug spending under Part D would be capped at $2,000, while under H.R. 19 and the Senate Finance bill, the cap would be set at $3,100 (both amounts exclude the value of the manufacturer price discount).

By design, catastrophic coverage is intended to protect Part D enrollees with high drug costs, which may affect only a small share of enrollees in any given year but a larger share over time, including those who have persistently high drug costs over multiple years and others who have high costs in one year but not over time. To inform discussions about proposals to add a hard cap on out-of-pocket spending under Part D, we analyzed the number of Part D enrollees without low-income subsidies who have exceeded the catastrophic coverage threshold annually, and over multiple years, based on 2007-2019 Part D claims data for Part D enrollees without low-income subsidies from the Centers for Medicare & Medicaid Services Chronic Conditions Data Warehouse (see Methods for details).

Takeaways

  • In 2019, nearly 1.5 million Medicare Part D enrollees had out-of-pocket spending above the catastrophic coverage threshold. Looking over a five-year period (2015-2019), the number of Part D enrollees with out-of-pocket spending above the catastrophic threshold in at least one year increases to 2.7 million, and over a 10-year period (2010-2019), the number of enrollees increases to 3.6 million (Figure 1).
Close to 3 Million Medicare Part D Enrollees Had Out-of-Pocket Spending Above the Catastrophic Threshold in at Least One Year Over the Five-Year Period From 2015 to 2019
  • More than 1.4 million Part D enrollees had out-of-pocket spending above the catastrophic threshold in two or more years during the five-year period between 2015 and 2019, and nearly 2 million enrollees had spending above the catastrophic threshold in two or more years over a 10-year period (2010-2019).
  • The number of Part D enrollees with out-of-pocket drug spending above the catastrophic threshold in a given year has more than tripled from nearly 400,000 in 2010 to 1.5 million in 2019 and has been at or above 1 million each year since 2015 (Figure 2). Similarly, the percent of all Part D enrollees not receiving low-income subsidies with out-of-pocket spending above the catastrophic coverage threshold has more than doubled, from 2.1% in 2010 to 4.4% in 2019.
The Number of Medicare Part D Enrollees With Out-of-Pocket Spending above the Catastrophic Threshold in a Given Year Has Increased Since 2010 and Has Been At or Above 1 Million Enrollees Since 2015
  • The increase in the number of Part D enrollees with out-of-pocket drug spending above the catastrophic coverage threshold since 2010 is partly due to the availability of new higher-priced drugs, drug price increases, and changes made by the Affordable Care Act (ACA) to the coverage gap phase of the Part D benefit and the calculation of out-of-pocket spending before enrollees qualify for catastrophic coverage, which have reduced the out-of-pocket cost burden on enrollees.
    • The ACA phased out the coverage gap (sometimes called the “donut hole”) by lowering the share of total costs paid in the gap by Part D enrollees from 100% to 25% over a 10-year period, and requiring drug manufacturers to provide a discount on the price of brand-name drugs in the gap. This price discount counts as beneficiary out-of-pocket spending that qualifies an enrollee for catastrophic coverage, which enables enrollees to move through the coverage gap more quickly.
    • Between 2018 and 2019 alone, the number of non-LIS enrollees who reached the catastrophic coverage phase increased from 1.1 million to 1.5 million, coinciding with an increase in the manufacturer discount on brand-name drugs in the coverage gap, from 50% in 2018 to 70% in 2019.
  • The 3.6 million Part D enrollees with out-of-pocket drug spending above the catastrophic threshold between 2010 and 2019 spent a cumulative $9.9 billion out of pocket for prescriptions filled in the catastrophic phase over these years (Figure 3). This represents more than one-third of their aggregate total out-of-pocket drug costs over this time period ($26.1 billion).
    • In 2019 alone, the 1.5 million Part D enrollees with out-of-pocket spending above the catastrophic threshold spent $1.8 billion out of pocket in the catastrophic coverage phase, which was nearly half of their total out-of-pocket drug spending for the year ($3.8 billion).
Medicare Part D Enrollees Spent $1.8 Billion Out of Pocket for Prescriptions Filled in the Catastrophic Coverage Phase in 2019 and $9.9 Billion Over 10 Years (2010-2019)

Conclusion

As new, high-priced drugs come to market and are covered under Medicare Part D, the current requirement for beneficiaries to pay a coinsurance of 5% in the catastrophic coverage phase can lead to thousands of dollars in out-of-pocket costs. Our analysis demonstrates that while most Part D enrollees have not had out-of-pocket costs high enough to exceed the catastrophic coverage threshold in a single year, the likelihood of a Medicare beneficiary incurring drug costs above the catastrophic threshold increases when looking over a longer time span.

Adding a hard out-of-pocket cap to Part D, as has been proposed by policymakers on both sides of the aisle, would help the growing number of Medicare beneficiaries who take just one very high-priced drug for medical conditions such as cancer or multiple sclerosis, or who take a handful of relatively costly brand or specialty medications to manage chronic illness. Capping out-of-pocket costs under Part D would protect Medicare beneficiaries against very high levels of out-of-pocket drug costs, including those with one-time catastrophic costs as well as those with high drug expenses year after year. While adding a cap on out-of-pocket drug spending under Part D would generate cost savings to enrollees, it could also add costs to the program, unless combined with other policies to lower Medicare drug spending, which are the subject of ongoing discussion in Congress.

Juliette Cubanski and Tricia Neuman are with KFF. Anthony Damico is an independent consultant. This work was supported in part by Arnold Ventures. We value our funders. KFF maintains full editorial control over all of its policy analysis, polling, and journalism activities.

Methods

This analysis is based on 2007-2019 Medicare Part D claims data from the Centers for Medicare & Medicaid Services Chronic Conditions Data Warehouse. For this analysis, we estimated the number of Part D enrollees without low-income subsidies who had out-of-pocket spending above the catastrophic coverage threshold in each year between 2007 and 2019, as well as those with spending above the catastrophic threshold in at least one year and in multiple time periods between 2010 and 2019. We excluded Part D enrollees receiving full low-income subsidies, who face no cost sharing above the catastrophic coverage threshold, as well as those receiving partial low-income subsidies, who pay modest copayments of no more than $3.70 for generics and $9.20 for brands in the catastrophic phase, but do not face the 5% coinsurance requirement that enrollees without low-income subsidies face. In 2019, 39,000 partial LIS enrollees had out-of-pocket spending above the catastrophic coverage threshold, and 151,000 had out-of-pocket spending above the catastrophic threshold in at least one year between 2010 and 2019.

LGBT+ People’s Health and Experiences Accessing Care

Published: Jul 22, 2021


Key Findings

Key Takeaways

Understanding the health care needs and experiences of LGBT+ people in the United States is important for addressing barriers and facilitating access to care and coverage. We analyzed nationally representative data from a new KFF survey to compare the experiences of self-identified LGBT+ adults to their non-LGBT+ counterparts. Key findings include the following:

  • The demographics of the LGBT+ community differ in some ways from that of their non-LGBT+ counterparts, differences that may have implications for health needs and access. Specifically, LGBT+ adults are younger, lower income, and less likely to be married.
  • LGBT+ people more commonly report being in fair or poor health than non-LGBT+ people, despite being a younger population, and report higher rates of ongoing health conditions and disability or chronic disease.
  • While LGBT+ people are as likely to have a usual source of care and regular provider, and use similar sites of care as their non-LGBT+ counterparts, they were more likely to report a range of negative provider experiences, including being blamed for health problems or having their concerns dismissed. At the same time, LGBT+ people were more likely to discuss certain health and social issues with their providers than non-LGBT+ people.
  • LGBT+ people also more commonly report that they or a household family member has had problems paying medical bills in the past 12 months than non-LGBT+ people, and as for non-LGBT+ people, this is a challenge that sometimes impacts their ability to afford basic necessities.
  • LGBT+ people’s utilization of health services compared to non-LGBT+ people varies considerably by service type. For example, LGBT+ women were less likely to report having had a recent mammogram or ever had gynecological exam than non-LGBT+ women but LGBT+ people were more likely to report having received other preventive screenings, including for sexual health.
  • In some cases, LGBT+ people faced more challenging COVID-related circumstances than non-LGBT+ people, including a higher share of LGBT+ people seeking mental health care because of the pandemic.
  • Smaller, but still substantial, shares of LGBT+ women report ever being pregnant compared to non-LGBT+ women, and majorities reported giving birth, though miscarriage was also a common experience.

Introduction

Understanding the health care needs and experiences of the more than 11 million LGBT people in the United States is important for addressing barriers and facilitating access to care and coverage. Studies have found that LGBT+ people experience certain health and access to care challenges at higher rates than their non-LGBT+ peers. Recognizing this, the National Institutes of Health (NIH) has identified sexual and gender minorities as a “health disparity population” to encourage and support research in this area. Health disparities among LGBT+ people can vary across the population and can intersect with factors beyond sexual orientation and gender identity to include race/ethnicity, class, nationality, and age, among other aspects of identity.

Despite some significant progress in researching these issues over the last decade, a recent study found that most population-based research still does not include measures of sexual orientation and gender identity, limiting the ability of policymakers, policy implementers, and researchers to assess national trends, disparities, and identify needed interventions. We sought to add to the knowledge base in this area by analyzing newly available, nationally representative data from the 2020 KFF Women’s Health Survey to compare the experiences of self-identified LGBT+ adults to their non-LGBT+ counterparts.

The survey included measures of sexual orientation and gender identity, as well as other demographic characteristics, and asked about a range of issues from general well-being to experiences engaging in the health system, HIV, reproductive health care, and the impact of COVID-19. The survey, conducted between November and December 17, 2020, included a nationally representative sample of 4,805 people ages 18-64 using an online probability-based panel, including 492 LGBT+1  people and oversampled lesbian and bisexual women.2  (A breakdown of sample size by LGBT+ group is available in the appendix.) Data are representative of people who self-identified as ‘female’ or ‘male’ (regardless of sex assigned at birth) and two separate survey questionnaires were designed for these two gender groups. While we aimed to be as inclusive as possible, we were not able to obtain a large enough sample to support a separate questionnaire focused on non-binary or gender-fluid people. In addition, small sample size limits our ability to report representative estimates of experiences among transgender people.

Report

Demographics and Family

The demographics of the LGBT+ community differ in some ways from that of their non-LGBT+ counterparts, differences that may have implications for health needs and access (Figure 1):

  • LGBT+ people are younger than non-LGBT+ people. More than half (59%) are between the ages of 18-35 compared to 38% of non-LGBT+ people.
  • LGBT+ people are also more likely to be low-income, with 34% having incomes below 200% of the federal poverty level (FPL)3  compared to 25% of non-LGBT+ people.
  • While LGBT+ people report being employed at similar rates to non-LGBT+ people (65% v. 69%, respectively), they more commonly report that their employment is part-time (17% v. 12%, not shown in figure).
  • Similar shares of LGBT+ and non-LGBT+ individuals are people of color, identify as female, and live in urban areas.
Larger shares of LGBT+ adults are under 35 years old and living on lower income than their non-LGBT+ peers

Family structure also differs for LGBT+ and non-LGBT+ people, differences which may have bearing on health and insurance coverage (Figure 2).

  • LGBT+ people are less likely to be living with a partner than non-LGBT+ people (39% v. 56%), including being half as likely to be married (23% v. 48%). LGBT+ people are more likely, however, to be living with a partner to whom they are not married (15% v. 8%).
  • One in five LGBT+ people (21%) are parents of children under age 18, a smaller share than non-LGBT+ adults (37%).
Smaller shares of LGBT+ are married or parenting than non-LGBT+ people, larger shares live with a partner to whom they are not married

(Back to top)

Health Status

Data on the health status of the LGBT+ community reveals some of the disparities that exist for this group compared to their non-LGBT+ peers (Figure 3).

  • Despite being a younger population that would typically be expected to be in better health, LGBT+ people more commonly report that their health is fair or poor than non-LGBT+ people (23% v. 14%), who are more likely to report good or excellent health (86% v. 77%).
  • Among LGBT+ people, those with Medicaid coverage (compared to private insurance4 ), lower education, and lower incomes report fair/poor health status at higher rates than their LGBT+ peers in other groups.
Nearly one in four LGBT+ people report being in fair or poor health

Chronic Health Conditions and Disabilities

Many LGBT+ people are managing chronic conditions or living with disabilities that impact daily life, in some cases more so than among non-LGBT+ people (Table 1).

  • Almost half (47%) of LGBT+ people report that they have an ongoing health condition that requires regular monitoring, medical care, or medication, a higher share than for non-LGBT+ people (40%).
    • This is particularly the case for LGBT+ people aged 45 and older, who are twice as likely to report having an ongoing health condition than younger LGBT+ people (77% v. 39%).
    • LGBT+ men and women report similar rates of an ongoing health conditions (52% and 44%, respectively. Similarly, rates of ongoing conditions do not vary between those with private insurance and those with Medicaid (48% and 51%, respectively).
  • A larger share of LGBT+ people report having a disability or chronic disease that keeps them from participating fully in work, school, housework, or other activities than non-LGBT+ people (21% v. 14%).
    • LGBT+ people with Medicaid are more likely to report a disability or limiting chronic disease than LGBT+ people with private insurance (34% v.14%).
Table 1: Many LGBT+ people are living with ongoing health conditions or disabilities

(Back to top)

Health Care Access

Sites of Care and Providers

LGBT+ people are as likely to have a usual source of care and report using similar sites of care as their non-LGBT+ counterparts, factors that are associated with increased use of preventive care and better health outcomes (Figure 4).

  • Eighty-one percent (81%) of LGBT+ people report that they have a place they usually go when they are sick or need advice about their health, similar to non-LGBT+ people (82%) and rates increase among older LGBT+ people (96%).
Nearly all LGBT+ people ages 45-64 report having a usual place of care
  • The type of location where care is received is also similar among LGBT+ and non-LGBT+ people (Figure 5). Most LGBT+ people with a usual source of care receive it at a doctor’s office (71%), though one in five (22%) obtain care at a clinic, such as a health center, urgent care center, or clinic inside a store or pharmacy. Smaller shares go to an emergency room (4%) or some other place (3%).
    • Among LGBT+ people who usually visit a health center or clinic, 39% go to a community health center or public health department and 38% go to a walk-in clinic such as an urgent care center or clinic inside a store or pharmacy.
Figure 5: Seven in ten LGBT+ people with a regular site or source of care usually go to a doctor’s office and two in ten visit a health center or clinic
  • In addition to having a regular place to get care, most LGBT+ people (72%) have a regular doctor or health care provider they see when they are sick or need routine care, similar to non-LGBT+ people (78%) (Figure 6).
    • This share increases with age, from 65% among those 18-44 years old to 95% among those 45-65 years old but does not differ between those with private insurance and those with Medicaid.
    • Despite these high rates, 16% of LGBT+ people with an ongoing health condition that requires regular monitoring, medical care, or medication do not have a regular provider (data not shown in figure).
Seven in ten LGBT+ people report having a regular doctor or health care provider, increasing to virtually all LGBT+ people over age 44
  • About seven in ten (73%) LGBT+ people with a regular doctor report that they obtain their health care from a family or internal medicine doctor. Ten percent (10%) describe their primary provider as a physician assistant or nurse practitioner. Smaller shares see another type of provider (Figure 7).
Most LGBT+ people with a usual source of care describe their primary provider as a family or internal medicine doctor

Experiences Accessing Care

LGBT+ people report different, and in some case more challenging, experiences accessing care than their non-LGBT+ peers.

  • LGBT+ people are more likely to report the following providers experiences compared to non-LGBT+ people (Figure 8). Had a provider
    • Not believe they were telling the truth (16% v. 8%)
    • Suggest they were personally to blame for a health problem (13% v. 8%)
    • Assume something about them without asking (21% v. 11%)
    • Dismiss their concerns (29% v. 16%)
  • Altogether, over one-third (36%) of LGBT+ people reported at least one of these negative experiences with a provider, compared to fewer than one in five (22%) non-LGBT+ people.
  • Generally, these differences were especially apparent among LGBT+ women compared to non-LGBT+ women (data not shown).
  • Those reporting mistreatment most commonly thought they were treated this way because of their age, followed by their gender, and then race/ethnicity. LGBT+ women are more likely to believe they had received poor treatment because of their gender compared to non-LGBT+ women (33% v. 18%).
Larger shares of LGBT+ adults report negative experiences with their providers compared with non-LGBT+ adults

While larger shares of LGBT+ than non-LGBT+ people reported negative provider experiences, LGBT+ people are also more likely to discuss certain health issues with their providers (Figure 9).

  • Larger shares of LGBT+ people report having had a conversation with a provider or being asked about mental health than non-LGBT+ people (76% v. 64%), potentially reflecting higher mental health care needs in this group. Similar shares of LGBT+ people and non-LGBT+ people report having conversations or being asked about smoking (76% v. 70%) and alcohol or drug use (68% vs. 66%).
  • LGBT+ people are more likely than non-LGBT+ people to have had a conversation about or been asked on a form about social vulnerability issues including housing security (26% v. 17%) and access to reliable transportation (22% v. 12%). (LGBT+ people are also more likely to discuss sexual health with their providers – see section on Sexual Health.)
Larger shares of LGBT+ adults than non-LGBT+ adults report having certain conversations with providers about behavioral health & social vulnerability

Health Care Costs

LGBT+ people report having problems with health care costs at higher rates than non-LGBT+ people, including those related to medical bills and other insurance costs, potentially reflecting both lower incomes and higher health needs.

  • A larger share of LGBT+ people report that they or a household family member has had problems paying medical bills in the past 12 months than non-LGBT+ people (30% v. 19%) (Figure 10).
    • This was more common among LGBT+ people ages 18-44 than ages 45-64 (33% v. 20%) and LGBT+ people in self-described poorer health (41% v. 27%), findings that may be correlated with income.
    • Thirty-five percent (35%) of LGBT+ women have had problems paying medical bills in the past two years, as have nearly one-quarter of LGBT+ men (24%).
    • Among the 30% of LGBT+ people who had trouble paying medical bills in the past 12 months, nearly six in ten (58%) say that it was due, at least in part, to the COVID-19 pandemic. (See the COVID-19 Experiences section for more details.)
Three in ten LGBT+ people have had trouble paying their medical bills in the past 12 months

Medical bills have consequences on LGBT+ people’s financial well-being, including their ability to afford basic necessities, similar to experiences among non-LGBT+ people (Figure 11).

  • Among the 30% of LGBT+ people who report having trouble paying medical bills in the past 12 months, two-thirds (67%) say they used up all or most of their savings, and six in ten had to set up a payment plan with a doctor or hospital (60%) and/or have been contacted by a collection agency (59%).
  • Half (52%) of LGBT+ people who had trouble paying medical bills in the past 12 months have had difficulty paying for basic necessities like food, heat, or housing, and four in ten (41%) borrowed money from family or friends.
Two-thirds of LGBT+ people who have had problems paying medical bills in the past year have used up all or most of their savings

Insurance Barriers

Even with health insurance, some LGBT+ people experience barriers or problems accessing or paying for health care (Figure 12).

  • Similar to non-LGBT+ people, one in four (25%) LGBT+ people with health insurance report their plan would not cover a prescription medication, or charged high cost sharing for it, in the past 12 months; 10% say their plan stopped covering a medication they were taking; and 13% say that their plan would not cover a test or scan their doctor recommended.
  • About one in four (26%) LGBT+ people with health insurance report that their plan did not cover a medical bill for themselves or a family member that they thought would be covered, or that it paid less for that service than expected. Twenty-four percent (24%) say the doctor they wanted to see was not covered by their health plan.
One in four LGBT+ people with health insurance say their preferred doctor was not covered by their plan

(Back to top)

Utilization of Health Services

In addition to asking about experiences with and barriers related to accessing health care, we explored LGBT+ people’s use of primary care services, including prescription drugs, wellness check-ups, and preventive cancer screenings. Utilization rates among LGBT+ and non-LGBT+ people vary considerably by service type

Prescription Drug Use

People take prescription medications for a range of reasons including to treat or manage chronic conditions and acute illnesses or to prevent pregnancy. Larger shares of LGBT+ people report taking at least one prescription medication on a regular basis than non-LGBT+ people (64% v. 51%) and as with non-LGBT+ people, prescription use increases with age (Figure 13).

A larger share of LGBT+ people regularly take a prescription medication than non-LGBT+ people across most age groups

General Check-ups

Regular provider visits give people an opportunity to address new, chronic, and emerging health issues, access preventive screenings, and discuss a broad range of issues with a clinician.

  • While nine in ten (91%) LGBT+ people have seen a doctor or health care provider in the past two years, just three-quarters (68%) of this group has had a general check-up or well-woman visit5  in the past two years (Table 2). These shares are similar to non-LGBT+ people (90% and 71%, respectively).
Table 2: Most LGBT+ people have seen a doctor or health care provider in the past 2 years, with variation by age

Cancer Screenings

Use of preventive cancer screenings can lead to early identification of conditions when they are more responsive to medical interventions and potentially avert serious complications (Figure 14).

  • Substantially smaller shares of LGBT+ women aged 40-64 report having had a mammogram in the past two years than non-LGBT+ women (35% v. 64%).
  • LGBT+ people in the targeted screening groups report having Pap smears and colon cancer screenings in the past two years at similar rates as non-LGBT+ people (54% v. 60% and 52% v. 47%, respectively).
A smaller share of LGBT+ women have had a mammogram in the past two years than non-LGBT+ people

(Back to top)

COVID-19 Pandemic Experiences

The COVID-19 pandemic has impacted people’s lives across the country. In some cases, LGBT+ people have had similar COVID-related experiences to non-LGBT+ people, but in other situations, they faced more challenging circumstances.

  • LGBT+ people and non-LGBT+ people reported having used telehealth at similarly low rates prior to the pandemic (16% v 12%, respectively). While experience with telehealth increased for both groups during the pandemic, it was higher among LGBT people (49% v. 34%, respectively) (Figure 15).
A larger share of LGBT+ people had a telehealth visit after the start of the COVID-19 pandemic compared to non-LGBT+ people
  • LGBT+ people and non-LGBT+ people reported difficulty getting appointments (29% v. 25%) and skipping or delaying care at similar rates because of the coronavirus pandemic, including with respect to accessing preventive services (36% v. 31%), a recommended test or treatment (24% v. 18%), and birth control (6% v. 4%).
  • While LGBT+ and non-LGBT+ people report skipping or delaying care at similar rates by a range of measures, LGBT+ people are more likely to report that their health condition worsened as a result of skipping care than non-LGBT+ people (22% v. 13%) (Figure 16).
  • LGBT+ people also report similar rates of veering from prescription drug regimens (e.g., not filling prescriptions, cutting pills in half or skipping doses) as non-LGBT+ people (11% and 9%, respectively).
Larger shares of LGBT+ people than non-LGBT+ people say their health condition has gotten worse as a result of skipping care during the pandemic
  • In addition, LGBT+ people were more likely to report seeking mental health care because of the pandemic compared to non-LGBT+ people (24% v.12%), potentially reflecting separate findings that LGBT people report the pandemic negatively impacted their mental health more widely and severely than non-LGBT people.
  • LGBT+ people are also more likely than non-LGBT+ people to report having to quit a job for a reason related to COVID-19 (15% v. 7%), taking time off work because of personally becoming ill with COVID-19 or quarantining (19% v. 11%), or taking time off work to care for a family member who was sick with COVID-19 or quarantining (10% v. 5%) (Figure 17).
Quitting a job or taking time off work in response to COVID-19 was a more common experience for LGBT+ people than non-LGBT+ people
  • Among the 30% of LGBT+ people who report having problems paying medical bills in the past 12 months (see section on health care costs), 58% say that it was at least in part because of the COVID-19 pandemic, with more than a quarter (27%) saying it was due only to the impact of the pandemic alone (Figure 18).
Figure 18: Over half of LGBT+ people who had problems paying medical bills in the past 12 months say it was due at least in part to the COVID-19 pandemic

(Back to top)

Sexual and Reproductive Health

STI and HIV Testing

  • LGBT+ people report higher rates of testing for sexually transmitted infections (STIs) and HIV than their non-LGBT+ peers, services that are recommended for early detection, treatment, and preventing transmission. This could reflect higher rates of STIs in the community as well as greater awareness of testing (Table 3).
  • Thirty-five percent (38%) of LGBT+ people ages 18-64 have been tested for an STI (other than HIV) such as chlamydia or herpes in the past two years, higher than the share of non-LGBT+ people (17%). Among LGTB+ people, rates are higher among those with Medicaid (54%) than private insurance (33%). STI testing rates among bisexual women (46%) are higher than the average (data not shown in figure).
  • Thirty-seven percent (37%) of LGBT+ people ages 18-64 have been tested for HIV in the past two years, higher than the share of non-LGBT+ people (16%). Approximately six in ten LGBT+ people with Medicaid (60%) report being tested for HIV in past two years.
Table 3: Fewer than four in ten LGBT+ adults have had an STI or HIV test in the past 2 years, with variation by insurance type

The survey also asked how people knew they had been tested for STIs and HIV (Figure 19).

  • Among LGBT+ people who report that they have been tested for HIV or another STI in the past two years, about half say they asked to be tested. LGBT+ people are more likely to request HIV testing than non-LGBT+ people (53% v. 32%).
  • Some LGBT+ people say they had been tested for HIV (16%) and STIs (16%) because they believed it was a routine part of their exam. It is possible that some in this group who believe they were tested but it wasn’t discussed may not have actually received the test. Larger shares of non-LGBT+ believe they had been tested for HIV but that it wasn’t discussed than non-LGBT+ people (24%).
Figure 19: About half of LGBT+ people who were tested for an STI or HIV knew they had been tested because they asked to be tested

Sexual Health Counseling

LGBT+ people more commonly report talking with a provider about a range of sexual health and relationship issues than non-LGBT+ people, counseling that, for most insured people, is required to be covered without cost-sharing (Figure 20).

  • Among the 90% of people who have visited a provider in the past two years, larger shares of LGBT+ people report recently talking with a provider about their sexual history or relationships than non-LGBT+ people (64% v. 44%, respectively).
  • LGBT+ people also more commonly report talking with providers about HIV (36% v. 22%) and other STIs (33% v. 19%) than non-LGBT+ people.
  • While conversations about PrEP, a medication that prevents HIV, are relatively uncommon among both groups, they are more than twice as common among LGBT+ people than non-LGBT+ people (18% v. 8%).
  • We note some key differences by gender:
    • Among LGBT+ women who have visited a provider in the past two years, bisexual women report the highest rates of conversations about sexual history (74%), HIV (30%) and other STIs (36%) with providers. Rates are generally lower among lesbian and non-LGBT+ women. LGBT+ women and non-LGBT+ women have similarly low rates of conversations about PrEP with their providers (11% and 9%, respectively).
    • Compared to non-LGBT+ men, LGBT+ men are more likely to talk to their providers about their sexual history (56% v. 34%), HIV (43% v. 22%), and other STIs (32% v. 17%). In particular, LGBT+ men are more than 3 times as likely to talk with their providers about PrEP than non-LGBT+ men (25% v. 8%).
    • Approximately two-thirds of LGBT+ (67%) and non-LGBT+ (68%) women report that they have discussed contraception with a provider in the past two years.

    A higher share of LGBT+ people report recent conversations with providers about some sexual health topics, but relatively low overall

  • Approximately four in ten (39%) LGBT+ women and 44% of non-LGBT+ women rate their most recent contraceptive care provider as “excellent” on all four items of person-centered contraceptive counseling.

Reproductive Health Experiences

Gynecological exams typically include cervical and breast cancer screening, education, and counseling and in some cases, LGBT+ women report lower rates of accessing this care (Figure 21). We did not assess service utilization based on sex assigned at birth/biological need for services. As such, transgender men, and others who could benefit from reproductive care, may have been excluded from these findings drawn from a base of respondents who identified as female.

  • Smaller shares of lesbian women aged 18-64 report having had a gynecological visit in the past three years compared to non-LGBT+ women (59% v. 73%).
  • One in five (20%) lesbian women and 12% of bisexual women say that they have never seen a doctor or nurse for a gynecological exam, which is significantly higher than non-LGBT+ women (6%).
Larger shares of lesbian and bisexual women have never had a gynecological exam compared to non-LGB women

Contraception

People use contraception for a range of reasons and sometimes for more than one reason at a time (Figure 22).

  • In the past 12 months, over half of LGBT+ women ages 18-49 (56%) and half of non-LGBT+ women (51%) report using contraception to prevent pregnancy, manage a medical condition, prevent a sexually transmitted infection (STI), or some other reason.
    • Contraception use among LGBT+ women is driven by bisexual women, nearly two-thirds (63%) of whom have used it in the past 12 months (data not shown in figure).
  • One in seven LGBT+ women ages 18-49 (14%) use contraception to manage a medical condition, which is nearly twice the share of non-LGBT+ women (8%).
1 in 7 LGBT+ women use contraception to manage a medical condition
  • The majority of LGBT+ (87%) and non-LGBT+ (87%) women ages 18-64 report using contraception in their lifetime. Among LGBT+ women, this share is driven by bisexual women (Table 4).
    • Male condoms and oral contraceptives are the most commonly used methods among both LGBT+ women and non-LGBT+ women. LGBT+ women, driven by bisexual women, are more likely to report using contraceptive implants (12%) and emergency contraception (32%) than non-LGBT+ women.
    • LGBT+ women reported using an average of 3.6 different contraceptive methods throughout their lifetime, similar to the average of 3.4 methods among non-LGBT+ women.
  • One in four LGBT+ women (25%), primarily bisexual women, said if they could use any type of birth control method available, they would want to use a different method than they’re currently using, compared to one in six (17%) non-LGBT+ women.
Table 4: Larger shares of LGBT+ women have used contraceptive implants and emergency contraception compared to non-LGBT+ women

Pregnancy Experiences

Over four in ten (41%) LGBT+ women ages 18-64, including 45% of bisexual women and 19% of lesbian women, report ever being pregnant in their lifetime compared to seven in ten (71%) non-LGBT+ women (Table 5).

  • Of those who report ever having a pregnancy, 83% of LGBT+ women and 92% of non-LGBT+ women report giving birth. Nearly half (46%) of LGBT+ women and 37% of non-LGBT+ women who have been pregnant report having a miscarriage.
Table 5: Fewer LGBT+ women have ever been pregnant than non-LGBT+ women
  • Over half (56%) of bisexual women and 21% of lesbian women report a time they were concerned they were pregnant when they did not want to be, compared to 42% of non-LGB women (Figure 23).
    • The top reason for both groups of women was they did not use birth control, followed by missing a pill or using birth control incorrectly, and a birth control method failure, such as a condom breaking.
    • Larger shares of bisexual women (25%) report not being confident the method they were using worked than non-LGB women (16%).
Larger shares of bisexual women report being concerned about an unwanted pregnancy compared to non-LGB women and were less confident in their contraceptive method

Abortion

Most women say that they know someone who has had an abortion. This is higher among LGBT+ women (68%) than non-LGBT+ women (59%). Nearly two-thirds of LGBT+ women (64%) say they have heard of a medication abortion (a pregnancy termination protocol used up to the first 10 weeks of pregnancy that involves taking two different drugs, mifepristone and misoprostol), higher than the share of non-LGBT+ women (55%) (Figure 24).

The majority of women know someone who has had an abortion and have heard of medication abortion, but higher among LGBT+ women

Conclusion

This brief aims to add to the evolving body of work on the health of LGBT+ communities. We find that while in many cases LGBT+ people have similar health and health care experiences to non-LGBT+ people, there are some notable differences, particularly with respect to some poorer health outcomes and negative provider experiences, as well as lower utilization of care in some cases and a higher burden of medical bills. LGBT+ people have also experienced certain COVID-era challenges at higher rates.

While data collection on LGBT+ people is improving, particularly at the federal level, it is still not standard, and as such, knowledge gaps remain, including with respect to health status, health needs, and health care access. Lack of research in this area limits the ability of those in both policy and health care sectors to address health needs and disparities within the population. Given LGBT+ people’s common experiences with stigma, discrimination, and violence in a range of environments (e.g., home, work, school, health care, etc.) and the evolving legal protections based on sexual orientation and gender identity, collecting this data is especially important in furthering goals of equity and access.

This work was supported in part by the Elton John AIDS Foundation. We value our funders. KFF maintains full editorial control over all of its policy analysis, polling, and journalism activities.

Appendix

Sample Size and Margin of Sampling Error (M.O.S.E.) for Survey Group

Endnotes

  1. LGBT+ is defined to include people who identified as lesbian, gay, bisexual, transgender, or “something else” (other than straight). ↩︎
  2. See the Methodology section for more details and the toplines for full question wording. ↩︎
  3. The FPL for a family of four in 2020 was $26,200. ↩︎
  4. Private health insurance includes insurance provided through an employer and insurance purchased individually. ↩︎
  5. Survey respondents who identified as female were asked if they had had either a general check-up or a well-woman visit. All others were asked if they had had a general check-up. ↩︎

Tracking Global COVID-19 Vaccine Equity

Published: Jul 21, 2021

As of July 7, 2021, of the estimated 3.3 billion COVID-19 vaccine doses administered globally, most had been provided in a small number of countries only. For much of the world, particularly for those living in low- and middle-income countries, COVID-19 vaccines remain out of reach. While international efforts, such as COVAX and additional vaccine donations are seeking to increase global vaccine access, several estimates suggest that many countries may not achieve substantial levels of vaccination until at least 2023.

Drawing on and complementing existing efforts that track global vaccine access, such as Our World in Data, the Launch and Scale Speedometer, and Bloomberg’s Vaccine Tracker, we examine several measures of global vaccine equity in an effort to assess where the biggest gaps are and whether they are narrowing or getting worse. Specifically, we group countries by income and by region and look at:

  • Share of the total population having received at least one vaccine dose
  • Rate of first vaccine doses administered (Using the 7-day rolling average per 1,000,000 people)

Based on the current rate of vaccine doses administered, we also estimate how much the pace would need to increase in order to reach global vaccine coverage goals1  set by the World Health Organization, World Trade Organization, International Monetary Fund, and World Bank: 40% coverage by the end of 2021 and 60% by mid-2022. We do this at the country-level, and for countries by income group and regional classification.

As we find here, there are wide disparities in access by income and by region (especially where these overlap), with low-income countries (LICs) in particular lagging far behind, followed closely by lower middle-income countries (LMICs), and Africa lagging behind all other regions. If current rates continue, most low-income countries and most countries in Africa are not on track to meet global vaccination targets.

COVID-19 Vaccinations by Country Income

There are large differences in the share of the population that has received at least one vaccine dose by country income, with LMICs lagging significantly behind. As of July 7, whereas more than half of individuals (51%) have received at least one dose in high-income countries (HICs), only 1% of the population in LICs, 14% in LMICs, and 31% in upper middle-income countries (UMICs) have received at least one dose (see Figure 1 and Figure 2).

Share of Population That Has Received At Least One Dose by Income
Share of Population That Has Received At Least One Dose by Country and Income

Three countries (China, India and the United States) account for the majority (57%) of all first doses administered globally. When removed, the difference between HICs and middle-income countries becomes even starker, with HICs still well ahead of other income groups in share of population that has received at least one dose (see Figure 3). See Table 1 for the full list of countries in each income group by share of population that has received at least one dose.

Share of Population That Has Received At Least One Dose by Income


Similarly, there is also a large gulf in the rate at which vaccines are being administered by country income. While the daily rate of first doses administered varies by country (see Figure 4), HICs were administering first doses at a rate nearly 2 times the rate in LMICs and in UMICs, and nearly 30 times the rate in LICs. See Table 2 for a breakdown of top countries in each income group by coverage and daily administration rates.

Daily Rate of First Doses Administered per One Million People by Country and Income

If current trends continue, these disparities are likely to grow, and LICs are unlikely to meet vaccination targets. Based on current vaccination rates (using rates of first doses administered), HICs and UMICs are on track to have 40% or more of their populations having received at least one dose by the end of the year, whereas LMICs would need to increase their daily rate by 1.03 times and LICs would need to increase their daily rate by nearly 19 times in order to meet the same goal. HICs, UMICs, and LMICs are on track to have 60% or more of their populations having received at least one dose by mid-2022, while LICs would need to increase their daily rate by 14 times (see Figure 5). Certain countries, primarily HICs, have already met some of these vaccination targets.

Projected Share of Population That Has Received At Least One Dose by Income Using Global Targets

COVID-19 Vaccinations by Region

As with country income, there are large differences in the share of the population that has received at least one vaccine dose among regions, with the highest coverage in Europe and smallest in Africa. As of July 7, the region with the highest coverage is Europe (40%) followed by the Americas (39%) and the Western Pacific (37%); Africa has the lowest coverage (2%) (see Figure 6 and Figure 7).

Share of Population That Has Received At Least One Dose by  Region
Share of Population That Has Received At Least One Dose by Country and Region

Similar to income level, China, India and the U.S. are driving trends in vaccination coverage in their respective regions. For instance, China accounts for 87% of first doses administered in Western Pacific, the US accounts for 46% in the Americas, and India accounts for 84% in South-East Asia. When removing these countries, the differences between Europe and the Americas, Western Pacific, and South-East Asia are larger (see Figure 8). See Table 3 for a breakdown of top countries in each region by coverage and daily administration rates.

Share of Population That Has Received At Least One Dose by Region

The rate of vaccine administration is highest in Europe and the Americas and lowest in Africa. While rates of first doses administered vary by country (see Figure 9), Europe and the Americas currently have the highest rate of daily doses administered. These regions are vaccinating at a rate approximately 1.5 times that of South-East Asia, nearly 3 times that of Eastern Mediterranean, 4 times that of the Western Pacific, and more than 13 times higher that of Africa. See Table 4 for a breakdown of top countries in each region by coverage and daily administration rates.

Daily Rate of First Doses Administered per One Million People by Country and Region

These disparities are likely to grow based on current vaccination trends. Western Pacific, Europe, the Americas, and South-East Asia are all ahead of schedule toward reaching 40% by the end of 2021 while Eastern Mediterranean would need to increase its rate of daily first doses administered by nearly 1.6 times the current rate, and Africa by approximately 11 times the current rate. They are also ahead of schedule to reach 60% by mid-2022, while Eastern Mediterranean would need to increase its rate of daily first doses administered by approximately 1.4 times the current rate, and Africa by approximately 8 times the current rate (see Figure 10). Certain countries, primarily those in Europe, have already met some of these vaccination targets.

Projected Share of Population That Has Received At Least One Dose by Region Using WHO Targets

Implications

These findings underscore an ongoing equity gap in access to COVID-19 vaccinations around the world, particularly for those living in the poorest countries and in countries in Africa. Furthermore, they suggest that if current rates continue, some of these disparities may grow and many low-income countries will not meet global targets of vaccinating 40% of each countries’ population by end of 2021 and 60% by mid-2022. Increasing vaccine supplies and stepping up the pace of vaccinations in those countries lagging furthest behind can narrow the equity gap and help all countries achieve COVID-19 vaccination coverage goals.

Tables

Table 1: Countries by Share of Population that Has Received at Least One Dose

Methodology

Vaccination Data: We used country-level vaccination data on doses administered, provided by Our World in Data (OWID), to assess global vaccination trends at the income and regional level. Totals for some entities were combined (Taiwan, Hong Kong, and Macao included as part of China, and Jersey and Guernsey were combined and reported as the Channel Islands). Where missing data in the daily doses provided existed between two dates for a country, we estimated the number of doses administered each day between the two reported dates assuming a linear distribution. For countries that have stopped reporting data, we assumed no change in new doses administered. For countries that report total doses administered but not share of population that has received at least one dose, we use OWID’s suggested methodology and calculated a lower-bound estimate. As a result, our estimates are conservative and the actual share of the population receiving one dose is likely higher. For data on daily administration of first doses, we calculated the rolling 7-day average in daily change of the number of people who have received at least one dose. For projecting increased rate needed for groupings to reach certain benchmarks (40% by end of 2021 and 60% by July 1, 2022), we calculated the rate needed to reach these benchmarks for each grouping, based on number of first doses already administered and population, and calculated the percentage change from the current daily rate in first doses being administered to the increased rate needed to reach these targets. Lastly, for all data, to account for any lag in country reporting, we use data up to one week prior (July 7, 2021).

Population Data: Population data were obtained from the United Nations World Population Prospects using 2020 estimates for total population (and the CIA World Factbook for Serbia and Kosovo). Totals for some entities were combined (Taiwan, Hong Kong, and Macao included as part of China), while others were separated (separating Kosovo from Serbia).

Income Data: Income classifications were obtained using World Bank data. Entities lacking an income classification were excluded from the income-level analysis.

Regional Data: Region classifications were obtained using World Health Organization data. Entities lacking a region classification were excluded from the region-level analysis.

  1. While the coverage goals seek to reach 40% and 60% coverage, it is not clear whether this refers to partial coverage (share of population that has received at least one dose) or full coverage (share of population that is fully vaccinated). For our analysis, we focus on share of population that has received at least one dose. Additionally, while these goals aim to vaccinate the global population, we look at populations by income-level and region. ↩︎
News Release

Disparities in Global Vaccination Progress Are Large and Growing, With Low-Income Countries and Those in Africa Lagging Behind

Published: Jul 21, 2021

A new KFF analysis finds that only 1% of those in low-income countries have received at least one vaccine dose compared to 51% in high-income countries, highlighting the substantial vaccine inequities around the world. The analysis examines these inequities by country income level and by region, finding large differences for each.

By region, Africa has the lowest coverage (2%) while Europe has the highest (40%), followed by the Americas (39%) and the Western Pacific (37%).

At the current pace of vaccinations, low-income countries are unlikely to meet the global vaccine targets set by the World Health Organization, World Trade Organization, International Monetary Fund, and World Bank of 40% coverage by the end of 2021, and 60% by mid-2022. Low-income countries would need to increase their daily vaccination rate by nearly 19 times to reach 40% coverage by the end of 2021. And while the Western Pacific, Europe, the Americas, and South-East Asia are ahead of schedule for reaching these vaccination goals, Africa would need to increase its rate of first dose administration by 8 times to reach 40% by the end of 2021.

The new analysis digs deeper into the growing equity gap and what this trend means for the future of global COVID-19 vaccination efforts. For additional information on the United States involvement in helping improve global COVID-19 vaccine equity, such as helping to expand vaccine manufacturing or waiving intellectual property restrictions on COVID-19 vaccine technologies, see the KFF brief on Global COVID-19 Vaccine Equity: U.S. Policy Options and Actions to Date.

News Release

Most Insurers Participating in the Marketplaces Don’t Expect COVID to Affect Their 2022 Costs

Published: Jul 19, 2021

After a tumultuous year of unpredictable COVID-19 changes to utilization and spending, a review of early rate filings for individual market insurers participating in the Affordable Care Act Marketplace finds that most are expecting a return to normal in 2022 without the pandemic playing a large role.

The review of insurers’ preliminary rate filings in 13 states and the District of Columbia reveals that most expect health utilization patterns to return to their pre-pandemic levels and generally aren’t expecting any additional costs or savings related to COVID-19 in their 2022 rates. Of the 75 insurer filings submitted in these states, 16 predict that COVID-19 will have an impact in 2022, generally pushing rates up by less than a 1 percentage point.

The pandemic led to a sharp drop in health spending in April 2020, as many providers cancelled elective procedures and patients practiced social distancing and avoided health care facilities. Since then, spending has mostly rebounded, though utilization this year remains somewhat lower than normal.

Other factors that insurers cite as impacting their 2022 rates include continued use of telehealth services in place of in-person visits, and a somewhat healthier marketplace population due to increased tax credits included in the American Rescue Plan Act. Few mentioned any impact from the No Surprises Act, which prohibits most surprise out-of-network bills starting next year.

Although the ACA Marketplaces cover a relatively small share of the privately insured population, the rate filings for this market are quite detailed and publicly accessible, making them a useful source of information on how insurers are thinking about their likely health costs. Insurers largely made similar assumptions about how COVID-19 would affect their group market costs, the analysis finds.

The brief is available on the Peterson-KFF Health System Tracker, an online information hub dedicated to monitoring and assessing the performance of the U.S. health system.

State Options to Expand Medicaid HCBS: Examples & Evaluations of Section 1115 Waivers

Authors: Madeline Guth and MaryBeth Musumeci
Published: Jul 16, 2021

Issue Brief

The coronavirus pandemic’s disproportionate impact on seniors and people with disabilities and chronic illnesses has brought heightened focus on the unmet need for home and community-based services (HCBS). Medicaid serves as the primary source of coverage for HCBS, which help these populations to live independently outside institutions by assisting with daily needs. In addition to determining whether to retain Medicaid HCBS policy changes adopted during the pandemic, states are currently developing plans to access an increased federal matching rate (“FMAP”) for Medicaid HCBS spending established in the American Rescue Plan Act (ARPA) of 2021. In the future, states may also be able to access increased HCBS funds proposed in the Biden Administration’s American Jobs Plan and the Better Care Better Jobs Act recently introduced in Congress.

To provide context for state considerations of policy options for the post-pandemic period and the potential use of new federal funds, this brief highlights examples of Medicaid HCBS policy changes authorized through Section 1115 demonstration waivers in seven states (Arizona, Delaware, New Jersey, New York, Rhode Island, Vermont, and Washington). Where available, we discuss waiver evaluation findings and reports that assess the impact of these policy changes. Key waiver provisions seeking to expand HCBS include the following (and are summarized in a state-by-state table in the Appendix):

  • Streamline processes for determining eligibility and providing services.
  • Expand financial eligibility rules to help certain enrollees afford to live in the community.
  • Serve additional populations by expanding financial and/or functional eligibility rules.
  • Offer new services through alternative benefit packages.

States may be unlikely to pursue new 1115 waivers to use the ARPA HCBS funds because these funds are available for states to claim for one year only (though states have until March 2024 to spend the enhanced funds). However, these examples from 1115 waivers identify policy areas that states may consider targeting through existing state plan or HCBS waiver authorities, particularly where state evaluations and experiences have found that policy changes seeking to expand HCBS access have achieved their goals.

Streamlining eligibility and enrollment processes

To provide faster access to HCBS, states have used 1115 authority to streamline processes for determining eligibility and providing services, including by authorizing benefits during a presumptive eligibility period and accepting self-attestation as verification for financial eligibility.

Authorizing benefits during a presumptive eligibility period. Presumptive eligibility is a longstanding option that allows states to authorize certain qualified entities to enroll individuals who appear likely eligible for coverage while the state processes the full application and makes a final eligibility determination. Presumptive eligibility can facilitate access to coverage and services when individuals in need of critical services also may need extra time to collect documents needed to complete a full eligibility determination. While states may allow hospitals to determine presumptive eligibility for Medicaid pathways based on old age or disability without an 1115 waiver, several states have used 1115 authority to provide presumptive eligibility (determined by non-hospital entities) for more limited populations and/or benefits to provide faster access to HCBS. For example:

  • Washington uses 1115 authority to provide presumptive eligibility for both its Tailored Support for Older Adults (TSOA) and Medicaid Alternative Care (MAC) programs, which provide supportive services to older adults and their caregivers (see Appendix for program details). An interim evaluation Quarterly progress reports from 2020 indicate high proficiency for appropriate determinations of nursing facility level of care, performed primarily by local Area Agencies on Aging, for those enrolled presumptively and low percentages of enrollees determined ineligible after the presumptive eligibility period. In a recent pending waiver amendment requesting to further extend presumptive eligibility for LTSS, Washington noted that the high accuracy rate of presumptive eligibility determinations for TSOA “exemplifies the minimal risk to the state and [] federal partners.”
  • Rhode Island’s waiver also authorizes HCBS benefits to new long-term care (LTC) applicants during a presumptive eligibility period while final financial eligibility determinations are pending.

Accepting self-attestation as verification for financial eligibility. States may simplify the Medicaid application process by allowing applicants to self-attest to certain financial eligibility criteria. During the COVID-19 public health emergency (PHE), some states are using Medicaid emergency authorities to allow self-attestation of eligibility requirements for applicants to Medicaid pathways based on old age or disability. States may also use 1115 authority to allow more limited populations to self-attest to financial eligibility requirements. For example,

  • New Jersey’s 1115 waiver eliminates state review and instead accepts self-attestation of no asset transfers during the five-year look-back period for applicants below 100% FPL seeking LTC and HCBS. The look-back period delays the date of Medicaid eligibility for applicants who transferred assets for less than fair market value, which instead could have been used to meet long-term care needs. New Jersey conducted electronic asset verification of randomly selected applications in 2015 and 2016 and found a 0% error rate on these sampled self-attestations, concluding that “the often burdensome five year lookback process can be safely eliminated for many low-income applicants.”

Expanding financial eligibility rules

To help enrollees maintain community residence, states have used 1115 authority to modify financial eligibility rules for limited populations (though states may more generally expand financial eligibility without waiver authority). These expanded eligibility rules enable enrollees to more easily afford to live in the community rather than in nursing facilities and include:

  • Establishing an income disregard that accounts for average rent (in New York). New York’s 1115 waiver applies a special income disregard that accounts for average rent when determining financial eligibility for individuals moving from institutional to community settings. An evaluation of New York’s waiver has found positive impacts among individuals transitioning out of institutional settings, including that high percentages of enrollees remained in the community.
  • Increasing the asset limit for certain HCBS beneficiaries (in Vermont). Vermont uses 1115 authority to increase the asset limit for certain high-need beneficiaries receiving HCBS. Evaluation results suggest positive impacts for this population, including an increase in the percentage of participants living in home and community settings versus in nursing facilities.
  • Increasing the personal needs allowance for certain HCBS beneficiaries (in Rhode Island). For enrollees transitioning from nursing facilities to the community, Rhode Island’s 1115 waiver increases the personal needs allowance, which is the amount of funds not considered available to contribute to the cost of LTC services.

Serving new populations by expanding eligibility rules

Several states use 1115 authority to expand financial and/or functional eligibility rules to serve additional populations, such as:

  • Elderly and near-elderly adults (in Washington). Washington’s TSOA program creates a new eligibility pathway and benefit package for otherwise ineligible adults older than 55 who require nursing facility level of care. By serving these adults with and without unpaid caregivers, TSOA aims to delay or avoid the need for more intensive LTSS. An interim evaluation of the program suggests that TSOA has met this goal: while 24-35% of TSOA participants enrolled in regular Medicaid within 6 months of TSOA enrollment, only a very small percentage used traditional LTSS. Both TSOA caregivers and recipients expressed high satisfaction with the program, with 86-90% of recipients indicating that the TSOA program would help keep them from moving to a nursing home or adult family home.
  • Young adults with disabilities (in Rhode Island). Rhode Island’s 1115 waiver covers young adults age 19 to 21 who age out of the Katie Beckett group (which provides coverage to children with significant disabilities without regard to family income) and are in need of services for behavioral health or medical/developmental diagnoses. This new pathway aims to enable children with disabilities to maintain continuity of care and remain in the community as they age into young adulthood. Issues related to continuity of care for young adults with disabilities are widespread beyond Rhode Island: for example, a recent New York Times article details how in New York, the change from “medically fragile child” to “medically fragile adult” includes lower pay rates for nurses that could result in young adults with disabilities losing care and being forced to move into nursing homes.
  • Children with disabilities (in Delaware). Delaware’s 1115 waiver creates a new eligibility pathway for children with disabilities who do not meet institutional level of care criteria for the Katie Beckett pathway, but are at risk of institutionalization absent the provision of services. By providing benefits to serve these children with disabilities in the community, this new pathway could help delay or avoid the use of more costly LTSS. States may use Section 1915 (i) state plan authority to serve enrollees with functional needs that are less than an institutional level of care; however, Delaware uses 1115 authority in order to limit this population to children with incomes at or below 250% of Supplemental Security Income (SSI) ($1,985 per month in 2021).

Offering new services

While states may add services to existing benefit packages without 1115 authority, they instead may use 1115 waivers to design alternative benefit packages. For example, the MAC program created by Washington’s 1115 waiver provides an alternative benefit package to support unpaid caregivers for older adults who are otherwise Medicaid eligible. This provision supports these enrollees and their caregivers by providing additional HCBS benefits not available in the standard Medicaid benefit package (though not the full Medicaid benefit package in other respects), which in turn may help the clients they care for remain in the community. An interim evaluation report shows that MAC enrollment has been lower than anticipated (with just 251 caregiver/care-receiver pairs enrolled in MAC as of October 2020, compared to initial projections of 4,673 MAC enrollees in that month) and suggests that further outreach may be necessary to reach eligible populations. Of those who did enroll, however, both caregivers and care recipients reported high satisfaction with the MAC services provided. The report also suggests that MAC participation has reduced the occurrence of adverse health outcomes and helped enrollees delay or avoid the use of more intensive traditional Medicaid LTSS.

Looking Ahead

As the primary source of coverage for HCBS, Medicaid plays a significant role in helping states meet community integration obligations under the Americans with Disabilities Act and the Supreme Court’s Olmstead decision. While the unmet need for HCBS for seniors and people with disabilities pre-dates the COVID-19 pandemic, during the PHE states have taken a number of emergency Medicaid LTSS actions, such as HCBS benefit expansions and provider payment rate increases for HCBS. In guidance on considerations for the end of the PHE, CMS specifically encourages states to identify temporary authorities that increase access to HCBS and to consider making these changes permanent. Further, the American Rescue Plan Act provided a time-limited increase in the Medicaid FMAP for HCBS spending to fund activities beyond what is currently available in states’ Medicaid programs. States must develop plans to use these funds for expanded HCBS activities such as streamlining eligibility/enrollment processes, increasing covered services, and supporting family caregivers. The existing HCBS policy changes in Section 1115 waivers summarized in this brief may provide useful examples of areas that states could target, particularly where state evaluations and experiences have found that policies seeking to expand HCBS access have achieved their goals.

Appendix

Appendix

Key Section 1115 Waivers with Approved HCBS Provisions as of 7/7/21
StateDemonstration NameKey HCBS Provisions
AZArizona Health Care Cost Containment SystemExpanding financial eligibility rules: AZ uses 1115 authority to remove the LTSS estate recovery penalty for acute care enrollees age 55 or older who receive long-term care services.
DEDelaware Diamond State Health PlanServing new populations by expanding eligibility rules: New eligibility pathway (“TEFRA-Like Group”) for children with disabilities under age 18 up to 250% SSI who do not meet institutional level of care criteria for Katie Beckett state plan option, but are at risk of institutionalization absent the provision of services.
NJNew Jersey FamilyCare Comprehensive DemonstrationStreamlining eligibility and enrollment processes: At the time of application for LTC and HCBS, NJ accepts self-attestation in lieu of an asset transfer review for applicants up to 100% FPL. Applicants complete a self-attestation form attesting that no transfers were made during the five-year look-back period.

Expanding financial eligibility rules: NJ also provides supports and services to adults over age 21 with developmental disabilities up to 300% SSI who live with family members or in their own homes (“Supports Program”). In determining HCBS financial eligibility for this population, NJ disregards Social Security benefits based on parent’s work history.

NYNew York Medicaid Redesign TeamExpanding financial eligibility rules: Individuals discharged from an NF who would be eligible for HCBS but for spousal impoverishment rules (“Institution to Community” population) are subject to a special income standard that accounts for average rent. This standard is determined by subtracting 30% of the Medicaid income level for an individual from the regional Housing and Urban Development Fair Market Rent dollar amount.
RIRhode Island Comprehensive Demonstration1. Streamlining eligibility and enrollment processes by authorizing benefits during a presumptive eligibility period: Limited HCBS benefit package up to 90 days for new long-term care applicants who meet functional eligibility criteria and self-attest to financial eligibility criteria (while final financial eligibility determinations are pending).

2. Expanding financial eligibility rules: Increases personal need allowance by $400 for those in NFs for 90 days who are transitioning to the community and otherwise would be unable to afford community residence.

3. Serving new populations by expanding eligibility rules: New coverage group (“Beckett aged out”) for young adults (age 19-21) with disabilities aging out of the Katie Beckett group with incomes below 250% FPL, who are otherwise ineligible for Medicaid, and who are in need of services/treatment for behavioral health or medical/developmental diagnoses.

VTVermont Global Commitment to HealthExpanding financial eligibility rules: VT uses 1115 authority to increase the asset limit to $10,000 for beneficiaries in the Highest Need and High Need groups (part of the Choices for Care program) who own and reside in their homes and receive HCBS, but are at risk for institutionalization.
WAWashington Medicaid Transformation ProjectMedicaid Transformation Project Initiative 2 creates two alternatives to traditional LTSS for older adults & their caregivers:

1. Offering new services: Medicaid Alternative Care Program (MAC) provides supportive services for unpaid caregivers of adults age 55+ eligible for NF care who are financially eligible for Medicaid.

2. Serving new populations by expanding eligibility rules: Tailored Support for Older Adults (TSOA) provides the same supportive services for unpaid caregivers of adults age 55+ eligible for NF care who do not meet the financial qualifications for LTSS despite being at risk of impoverishment. TSOA additionally provides personal assistance services to individuals without an informal caregiver.

Streamlining eligibility and enrollment processes by authorizing benefits during a presumptive eligibility period for both MAC and TSOA enrollees.

Expanding financial eligibility rules: WA also removes the LTSS estate recovery penalty for MAC and TSOA enrollees.

DEFINITIONS: HCBS = home community-based services. LTC = long-term care. LTSS = long-term services and supports. NF = nursing facility. SSI = Supplemental Security Income.SOURCE: KFF analysis of Section 1115 waivers and evaluations posted to Medicaid.gov and state websites.

How Could $400 Billion New Federal Dollars Change Medicaid Home and Community-Based Services?

Author: MaryBeth Musumeci
Published: Jul 16, 2021

At the end of March 2021, the Biden Administration announced the American Jobs Plan, which includes $400 billion to expand access to Medicaid home and community-based services (HCBS) for seniors and people with disabilities and strengthen the direct care workforce. The Better Care Better Jobs Act, recently introduced by Democratic lawmakers, outlines three provisions to implement President Biden’s American Jobs Plan HCBS proposal. The major provision is a new “HCBS Infrastructure Improvement Program,” which offers permanent enhanced federal Medicaid matching funds for HCBS if states choose to participate and meet certain requirements. The other provisions would make both Money Follows the Person and the requirement for states to apply spousal impoverishment protections to HCBS permanent.

HCBS assist with self-care, such as eating and bathing, and household activities, such as preparing meals, for people who need help with these tasks due to health or functional needs. Most HCBS are provided through Medicaid and are not covered by other payers, including Medicare. States can offer Medicaid HCBS as state plan benefits, which must be provided to all enrollees who qualify, and waivers, which allow states to target services to specific populations, expand income and asset limits, and set enrollment caps. The new proposal responds to growing demands for HCBS stemming from the disproportionate number of COVID-19 cases and deaths among people in nursing homes and other congregate settings, the growing elderly population, and the unmet need for community-based care that preceded the pandemic.

The proposal also aims to expand and strengthen caregiving jobs supported by Medicaid HCBS. Like people who rely on HCBS, direct care workers who provide these services have been disproportionately affected by the pandemic. The workforce is predominantly female, low-wage, and people of color. Home care workers earned on average $11.52 per hour, or $16,200 per year, in 2018. Despite the ongoing unmet need for HCBS, which is expected to grow with the increasing senior population, states regularly cite workforce shortages as a barrier to expanding HCBS. This issue brief places the American Jobs Plan in the context of current Medicaid HCBS spending and considers how policymakers might allocate the new funding (Figure 1), drawing on the provisions of the recently introduced Better Care Better Jobs Act.

Figure 1: Better Care Better Jobs Act Proposal for New $400 Billion in Federal Medicaid Home and Community-Based Services

How much does Medicaid spend for HCBS?

Medicaid HCBS spending is estimated to be about $114 billion in FY 2021, before the increase from the American Rescue Plan Act (ARPA) (discussed below). Medicaid funds the majority (57%) of HCBS, with private insurance covering 12% and 7% paid out-of-pocket.1  State Medicaid programs must cover long-term services and supports (LTSS) in nursing homes, while most HCBS are optional, resulting in substantial variation across states. State HCBS programs face a number of challenges, including waiting lists for waiver services, direct care workforce shortages (which predated and have been exacerbated by the pandemic), and a lack of affordable, accessible community-based housing. Nationally, more than half of Medicaid LTSS spending is for community-based care. Like other Medicaid services, costs are shared between the states and the federal government.

The ARPA provides an additional 10 percentage point increase in federal matching funds for state spending on HCBS from April 2021 through March 2022, an estimated $11.4 billion increase in federal spending nationally. Under the ARPA, states must maintain their current spending levels and use the increased funds “to enhance, expand, or strengthen” HCBS. Due to the 1-year time limit on ARPA funds, states may be more likely to adopt policies to directly address the pandemic, such as providing hazard or overtime pay to direct care workers or offering targeted services such as home-delivered meals or assistive technology, as opposed to dedicating funds to serving more HCBS enrollees over the longer-term.

The new $400 billion in federal funds from the American Jobs Plan proposal could increase annual spending for HCBS in Medicaid by at least 33% annually, and by even more if state spending also increases. If the new funding were evenly spent over the next 10 years and allocated entirely through the Medicaid program, that would equate to new federal HCBS spending of $40 billion per year on top of the $114 billion baseline plus the $11.4 billion from the ARPA.

How could new HCBS funds be used?

The Better Care Better Jobs Act, recently introduced by Democratic lawmakers, outlines three provisions to expand and strengthen Medicaid HCBS and the direct care workforce, as proposed in President Biden’s American Jobs Plan (Figure 1). The major provision, which would account for most of the funding, is a new “HCBS Infrastructure Improvement Program,” which offers permanent enhanced federal Medicaid matching funds for HCBS if states choose to participate and meet certain requirements. The other provisions would make both Money Follows the Person and the requirement for states to apply spousal impoverishment protections to HCBS permanent.

The HCBS Infrastructure Improvement Program proposed in the Better Care Better Jobs Act includes a permanent 10 percentage point increase in federal Medicaid matching funds for HCBS for states with Secretary-approved plans to expand and strengthen HCBS.2  Like the temporary ARPA increase, the new increase would stack on top of other increases and be capped at 95%. The new program is designed so that states could continue to access an additional 10 percentage point increase in federal funding for HCBS after the ARPA provision expires (Figure 2).

Figure 2: Availability of 10 Percentage Point Medicaid HCBS Federal Funding Increase as Proposed in Better Care Better Jobs Act

The bill allows states to continue to receive a 10 percentage point increase in federal Medicaid matching funds for HCBS after the ARPA provision expires, while states are developing their HCBS Infrastructure Improvement Program plans. States must continue to maintain existing HCBS eligibility and benefits while receiving the enhanced federal funds. The bill includes $100 million for state planning grants to be awarded within one year of enactment. States would have two years to submit their plans, and the Secretary is directed to approve plans as long as they are complete and contain assurances that states will meet the program requirements. State plans must describe their current Medicaid HCBS program, how the state will meet annual measures and benchmarks, and the state’s goals for improving HCBS. Plans must consider people currently on Medicaid HCBS waiver waiting lists as well as those who would be eligible but are not currently on a waiting list and any HCBS that are provided in other states but not in the planning grant state.

States with Secretary-approved HCBS Infrastructure Improvement Plans could continue to receive the 10 percentage point increase in federal matching funds for HCBS as they implement their plans. Specifically, states would have to continue to maintain existing HCBS eligibility and benefits as well as engage in activities to expand HCBS access,3  strengthen the direct care workforce,4  and monitor HCBS quality (Figure 3). States also would have to provide an annual report on their HCBS program to the Secretary beginning in the 5th fiscal year of their program participation. Additionally, states would have to report on the following four benchmarks to continue receiving the enhanced federal funds after seven years of program participation:

  • Increased availability of HCBS relative to the date of the state improvement plan;
  • Increased access to and utilization of HCBS by populations identified as having the lowest access and utilization in the state improvement plan;
  • Evidence that the majority of direct care workers receive competitive wages and benefits; and
  • The share of LTSS spending devoted to HCBS. States that spent less than 50% of their LTSS dollars on HCBS at the time of their improvement plan must increase their HCBS spending to at least 50%. States that spent more than 50% of their LTSS dollars on HCBS at the time of their improvement plan must maintain that share.
Figure 3: Better Care Better Jobs Act HCBS Improvement Program State Requirements for Enhanced Federal Funding

States with Secretary-approved plans also could receive additional enhanced federal matching funds to support self-direction and for HCBS administrative costs. States that adopt a program to support self-direction could receive an additional two percentage point increase in federal matching funds for one year, capped at 95%. Self-direction program activities include offering a worker registry and independent provider recruitment and training, engaging in quality oversight, coordinating with other state agencies and providers, establishing an “agency with choice” model, supporting family caregivers (if the state allows them to be paid providers), and ensuring that state policies allow for cooperation with or are neutral toward organized labor. Separately, all states with Secretary-approved plans could receive enhanced federal funds for administrative costs, increased from 50% to 80%. Administrative costs could include data and technology infrastructure, modifications to rate setting processes, quality measures, worker training, and worker registries.

Extending Medicaid’s Money Follows the Person (MFP) program is the one specific policy proposal in the American Jobs Plan, and the Better Care Better Jobs Act would make MFP permanent. MFP provides enhanced federal matching funds that, from 2008 through 2019, have helped over 101,000 seniors and people with disabilities across 44 states and DC moving from nursing homes to the community. States can fund services, such as first month’s rent and household set-up costs, and staff to help enrollees locate community housing. Program evaluations have found improved enrollee quality of life and cost savings after moves from institutions to the community, though repeated short-term extensions have created uncertainty for states. Affordable and accessible housing for low-income seniors and people with disabilities remains in short supply and presents a barrier to deinstitutionalization. While Medicaid does not pay for housing, many states have used MFP funds to hire housing coordinators to collaborate with affordable housing agencies and assist enrollees with locating community-based housing. A federal evaluation of MFP showed about 5,000 new participants in each six month period from December 2013 through December 2016, indicating a continuing need for the program. The aging of the population will also increase demand for the program. MFP currently expires in September 2023, with federal funding since 2007 totaling just under $6 billion over the entire period5  (a relatively small amount compared to the proposed $400 billion). The Better Care Better Jobs Act includes $450 million in federal funding for MFP for each fiscal year after FY 2021.

The Better Care Better Jobs Act would permanently extend the ACA change to Medicaid spousal impoverishment rules which requires states to treat HCBS and institutional care equally. To financially qualify for Medicaid LTSS, an individual must have low income and limited assets. When one spouse in a married couple needs LTSS, Medicaid spousal impoverishment rules protect some income and assets to support the other spouse’s living expenses. Since Congress enacted the spousal impoverishment rules in 1988, federal law has required states to apply them when a married individual seeks nursing home care. Prior to 2014, states had the option to apply the rules when a married individual sought home and-community based waiver services. However, since January 2014, the ACA has required states to apply the spousal impoverishment rules to HCBS waivers and also expanded the rules to apply to the Section 1915 (i) HCBS state plan option, Community First Choice (CFC) attendant care services and supports, and individuals eligible through a medically needy spend down. The ACA provision was set to expire at the end of 2018, but Congress subsequently adopted several short-term reauthorizations.

A KFF survey found that, as of 2018, some states may stop applying the spousal impoverishment rules to HCBS if Congress allowed the ACA provision to expire. At that time, 14 states expected that allowing the ACA provision to expire would affect Medicaid HCBS enrollees, for example by making fewer individuals eligible for waiver services. Additionally, eight states reported that the repeated temporary extensions resulted in confusion among enrollees and/or increased workload or administrative burdens for states.

Looking Ahead

If enacted, the American Jobs Plan HCBS proposal, as outlined in the Better Care Better Jobs Act, could build on the ARPA by adding further federal support for state efforts to increase access to Medicaid HCBS. With additional federal dollars available over a longer timespan, compared to the 1-year ARPA, states could be incentivized to expand HCBS eligibility by adopting new optional pathways, raising existing income or asset limits, or increasing waiver enrollment caps to serve more people and reduce waiting lists. States also could offer new optional HCBS, increase the scope of currently covered services, expand opportunities for enrollees to self-direct services, or offer supports to family caregivers such as respite care. Such initiatives could address Medicaid’s historical institutional bias by working to equalize access to HCBS. Expanding Medicaid HCBS also can help people with disabilities participate in the workforce, by offering services such as attendant care or supported employment, and help family members remain in the workforce instead of leaving paid employment to care for a child with disabilities or an aging relative. This proposal would mean an unprecedented $400 billion increase in federal spending on home and community-based services, and will likely face competition with other priorities as Congress considers a sweeping budget measure this year.

The new proposal could be an incremental step toward a larger goal of eliminating Medicaid’s historical institutional bias and making HCBS mandatory. In the near term, states, providers, health plans, and seniors and people with disabilities who need HCBS will be watching to see how the American Jobs Plan and the Better Care Better Jobs Act proposals continue to take shape in Congress. The new proposal includes a number of activities and benchmarks for states to meet, but also provides access to significant new funding through a permanent increase in federal Medicaid matching funds for HCBS, which could incentivize states to participate.

  1. KFF estimates based on 2019 National Health Expenditure Accounts data from CMS, Office of the Actuary. Spending totals may not align with other sources due to differences in state reporting or which services are included in the definition of HCBS. ↩︎
  2. HCBS eligible for the enhanced match include the following state plan services: home health, personal care, PACE, Section 1915 (i), Section 1915 (j) self-direction, Community First Choice attendant services, case management, targeted case management, and rehabilitative services including those related to behavioral health. HCBS authorized under Section 1915 (b) or (c) or 1115 waivers or provided through alternative benefit plans and other services specified by the Secretary also are eligible for the enhanced match. ↩︎
  3. For example, as of 2018, over ¾ of HCBS waivers set financial eligibility at the federal maximum (300% SSI), 34 states cover personal care state plan services, and 45 states offer a Medicaid eligibility buy-in pathway for working people with disabilities. ↩︎
  4. The bill defines the direct care workforce as direct support professionals, personal care attendants, direct care workers, home health aides, and any other relevant worked as determined by the HHS Secretary. ↩︎
  5. Deficit Reduction Act of 2005, § 6071, Pub. L. No. 109-171 (Feb. 8, 2006); Patient Protection and Affordable Care Act,  § 2403, Pub. L. No. 111-148 (March 23, 2010); Medicaid Extenders Act of 2019, § 3, Pub. L. No. 116-3 (Jan. 24, 2019); Medicaid Services Investment and Accountability Act of 2019, § 2, Pub. L. No. 116-16 (April 18, 2019); Sustaining Excellence in Medicaid Act of 2019, Pub. L. 116-39 (Aug. 6, 2019); Further Consolidated Appropriations Act of 2020, § 205, Pub. L. No. 116-94 (Dec. 20, 2019); CARES Act, § 3811, Pub. L. No. 116-136 (March 27, 2020); Continuing Appropriations Act of 2021, § 2301, Pub. L. No. 116-159 (Oct. 1, 2020); Further Continuing Appropriations Act of 2021, § 1107, Pub. L. No. 116-215 (Dec. 11, 2020); Consolidated Appropriations Act of 2021, § 204, Pub. L. No. 116-260 (Dec. 27, 2020).   ↩︎