State Medicaid Home & Community-Based Services (HCBS) Programs Respond to COVID-19: Early Findings from a 50-State Survey

Authors: Molly O’Malley Watts, MaryBeth Musumeci, and Meghana Ammula
Published: Aug 10, 2021

Issue Brief

Key Takeaways

The COVID-19 pandemic presented a public health emergency that was unprecedented in its scope and duration and brought new focus to the long-standing unmet need for home and community-based services (HCBS) among seniors and people with disabilities and direct care workforce shortages. Recognizing Medicaid’s role as the primary payer for HCBS, this issue brief presents early findings from the most recent KFF 50-state survey of Medicaid HCBS programs. It focuses on state policies adopted in response to challenges posed by the pandemic, the pandemic’s impact on Medicaid HCBS enrollees and providers, and states’ early plans for the new American Rescue Plan Act (ARPA) 10 percentage point temporary increase in federal Medicaid matching funds for HCBS. We survey states about HCBS provided through state plan authorities and waivers. There were 277 HCBS waivers in FY 2018. Overall, 41 states responded to the survey by mid-July 2021, accounting for 87% of total HCBS spending nationally in FY 2018, though response rates for specific questions varied. We highlight some specific state examples where states provided additional information with their responses. Key finding include the following:

  • Important data gaps remain, with just under half of responding states tracking COVID-19 vaccination rates among Medicaid HCBS enrollees. At the same time, state HCBS programs are playing a role in facilitating vaccine access for HCBS enrollees, with most responding states adopting multiple policies in this area. Over one-third of responding states have publicly available data on COVID-19 cases and deaths among HCBS enrollees.
  • The Medicaid HCBS provider infrastructure declined during the pandemic, with two-thirds of responding states reporting a permanent closure of at least one provider. Most of these states reported permanent closures among more than one HCBS provider type. States most frequently cited workforce shortages as the pandemic’s primary impact on in-home and group home services, while closures due to social distancing measures was the most frequently reported primary impact on adult day health and supported employment programs.
  • Over half of responding states reported early plans for the new ARPA temporary enhanced federal funds for Medicaid HCBS. The most frequently reported activities were provider payment rate increases and workforce recruitment.

Expanding HCBS access and strengthening the direct care workforce would help to improve care as pandemic recovery efforts continue and beyond, while also increasing public spending. While the ARPA enhanced funds are available only for one year, additional federal funding for HCBS is part of the budget reconciliation package proposed by Democratic leaders, though the details will be worked out by Congressional committees. President Biden earlier this year proposed a $400 billion federal investment in Medicaid HCBS, though it is unclear how much of that funding increase will be approved by Congress as it considers competing priorities in the budget package.

Introduction

The COVID-19 pandemic presented a public health emergency (PHE) that was unprecedented in its scope and duration. Key Medicaid populations, including seniors and nonelderly people with disabilities who use long-term services and supports (LTSS), are disproportionately at risk of serious illness or death from COVID-19 compared to the general population. This risk is heightened for people who receive LTSS in congregate settings and for the direct care workers who provide these services. The pandemic’s impact on these populations brought new focus to pre-existing issues, including unmet need for home and community-based services (HCBS) and workforce shortages. Drawing on Medicaid’s role as the primary payer for LTSS, including HCBS, federal and state policymakers have adopted a number of policies to aid pandemic response.

This issue brief presents early findings from the most recent KFF survey of Medicaid HCBS programs in all 50 states and the District of Columbia. It focuses on state policies adopted in response to challenges posed by the pandemic, the pandemic’s impact on Medicaid HCBS enrollees and providers, and states’ initial plans for the new American Rescue Plan Act 10 percentage point temporary increase in federal Medicaid matching funds for HCBS available from April 2021 through March 2022. Additional survey findings and state-level data related to Medicaid HCBS enrollment, spending, and key state policies will be released later. We survey states about HCBS provided through state plan authorities and waivers. There were 277 HCBS waivers in FY 2018.1  Overall, 41 states responded to the survey by mid-July 2021, though response rates for specific questions varied.2  The 41 responding states account for 87% of total HCBS spending nationally in FY 2018. We highlight specific state examples where states provided additional information with their responses.

COVID-19 Impact on Medicaid HCBS Enrollees

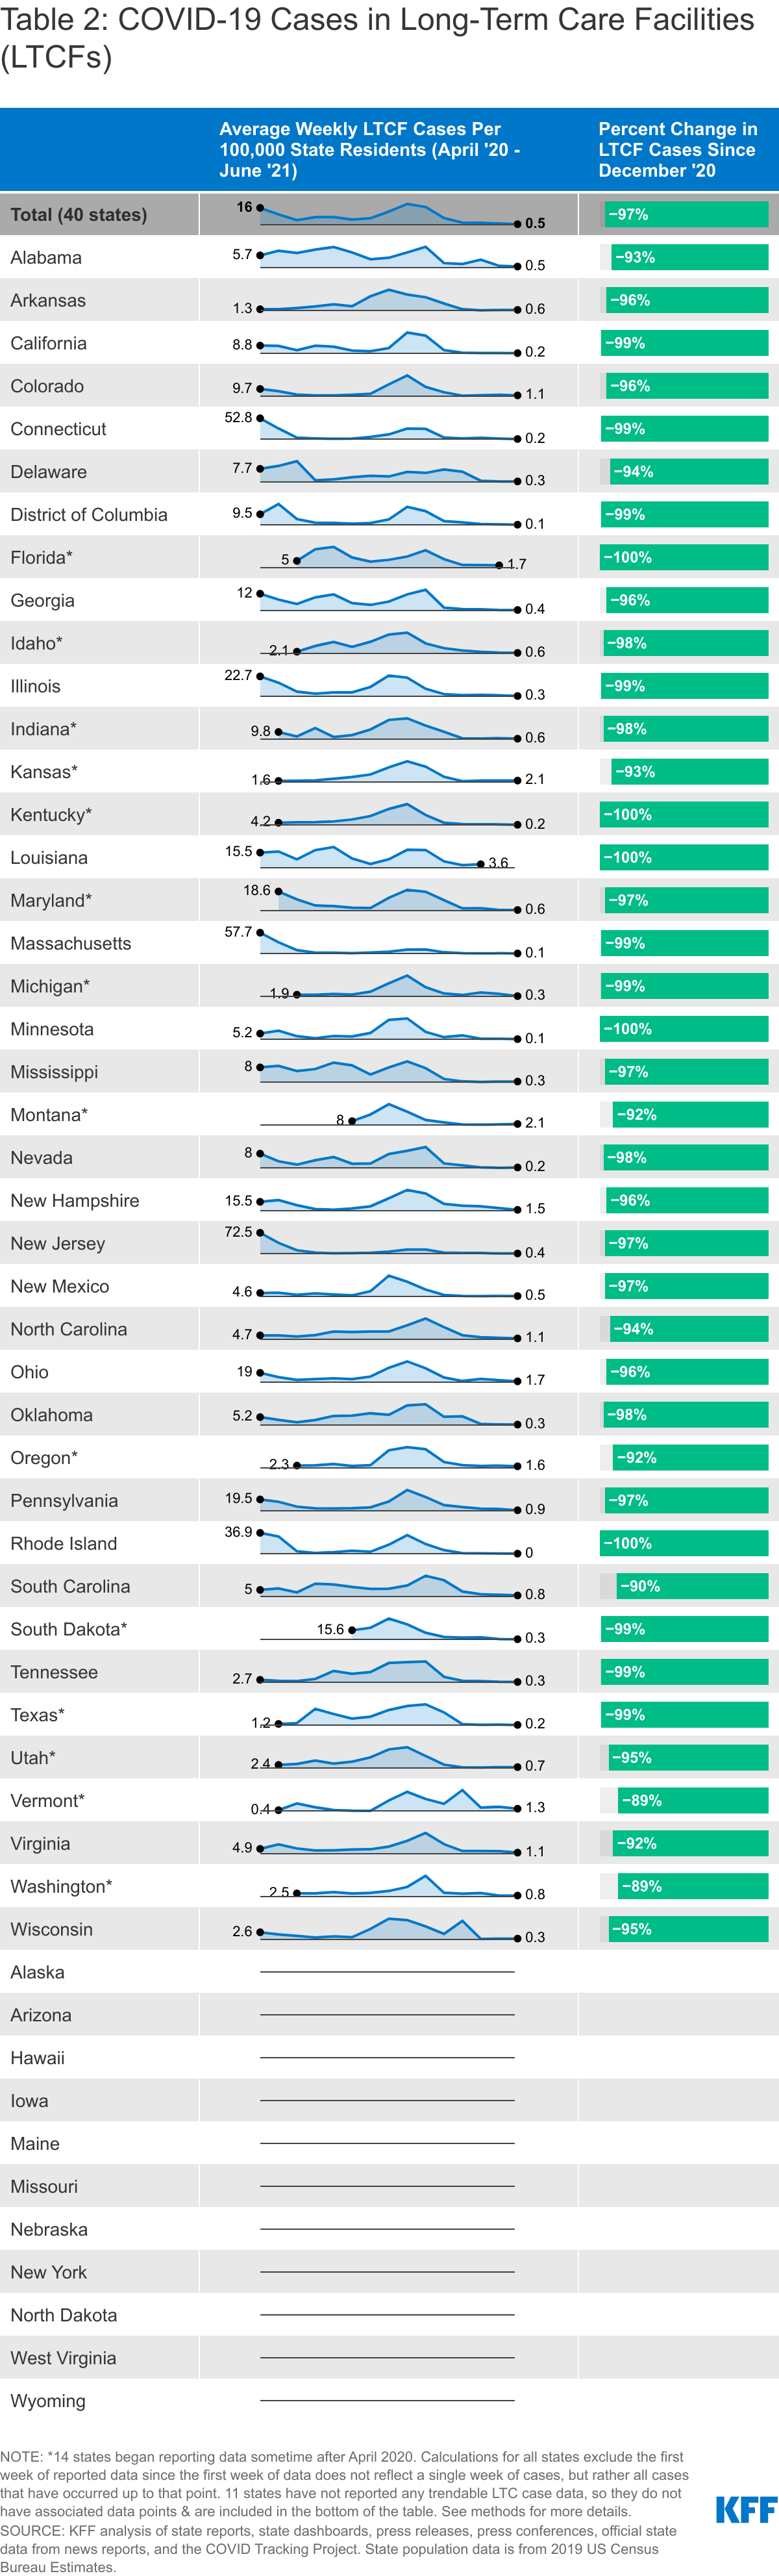
Over one-third of responding states reported having publicly available data on COVID-19 cases and deaths among Medicaid HCBS enrollees.3  Though states are monitoring COVID-19 cases and deaths generally, and some are tracking overall cases and deaths by demographic characteristics such as age, race, and sex, fewer are collecting these data specifically for Medicaid HCBS enrollees. Among the 14 states reporting publicly available data specific to HCBS enrollees, 12 states’ responses to this question varied by waiver program. This suggests that even when states are tracking COVID-19 cases and deaths among HCBS enrollees, tracking may not be uniform across all HCBS programs. For example, Illinois reported that it makes COVID-19 cases and deaths data publicly available for three HCBS waivers serving people with intellectual and developmental disabilities (I/DD) but not for its HCBS waivers serving other populations.4  Rhode Island reported that efforts to track COVID-19 cases and deaths among its HCBS waiver enrollees are under development, though data are not yet publicly available.

Just under half of responding states reported tracking COVID-19 vaccination rates for Medicaid HCBS enrollees.5  Nearly all of these states indicated that these data are used internally to inform outreach efforts, while two states (Delaware and Indiana) noted that they make these data publicly available. Seven states’ responses to this question varied by HCBS program, again suggesting that tracking may not be uniform across all HCBS enrollees. In addition, Washington reported that it is beginning to track COVID-19 vaccination status among its Section 1115 HCBS waiver enrollees as part of the functional assessment process.

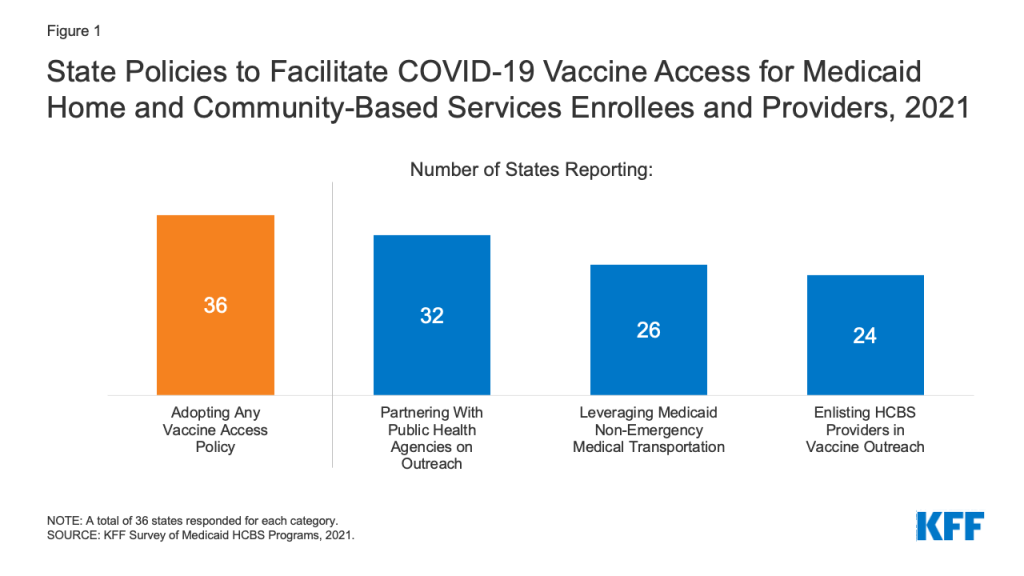
All responding states reported having at least one policy in place to facilitate access to COVID-19 vaccines for Medicaid HCBS enrollees and providers, with 8 in 10 responding states reporting more than one policy.6  The most frequently reported policy was partnering with public health agencies on vaccine outreach and education initiatives (Figure 1). For example, West Virginia provided a list of homebound HCBS enrollees to local health departments to arrange for appointments to administer vaccines in enrollees’ homes. Other frequently reported policies included leveraging Medicaid’s non-emergency transportation benefit to provide enrollees with access to vaccination appointments and enlisting HCBS providers in vaccine outreach and education efforts (Figure 1). Additional policies to facilitate vaccine access reported by states included placing certain HCBS populations in higher vaccine access priority groups, having Medicaid managed care plans contact enrollees to provide education and schedule vaccination appointments,7  and partnering with pharmacies to provide vaccination clinics for HCBS enrollees.8  Washington reported having “strike teams” travel to some HCBS settings to offer vaccinations to staff and enrollees.

Figure 1: State Policies to Facilitate COVID-19 Vaccine Access for Medicaid Home and Community-Based Services Enrollees and Providers, 2021

The pandemic affected all Medicaid HCBS settings, though the primary impact identified by states varied somewhat by setting type. States most frequently reported that the pandemic resulted in workforce shortages for HCBS provided in an enrollee’s home9  and in group homes,10  while closures due to social distancing measures was the most frequently reported impact for adult day health programs11  and supported employment programs12  (Figure 2). For HCBS provided in an enrollee’s home, workforce shortages was closely followed by enrollees declining to have workers in their homes (Figure 2). States reported that some HCBS enrollees and their family members declined services due to fear of coronavirus exposure and had concerns about receiving in-person services until enrollees and providers could be vaccinated. To minimize service interruptions, some states reported using Medicaid emergency authorities to provide HCBS via telehealth where possible to enrollees at home and in adult day health programs. Some states also noted that utilization of supported employment services dropped due to job loss during the pandemic among the enrollees who received these services.

Figure 2: Top State-Reported Primary Impacts of COVID-19 on Medicaid Home and Community-Based Settings, by Setting Type, 2021

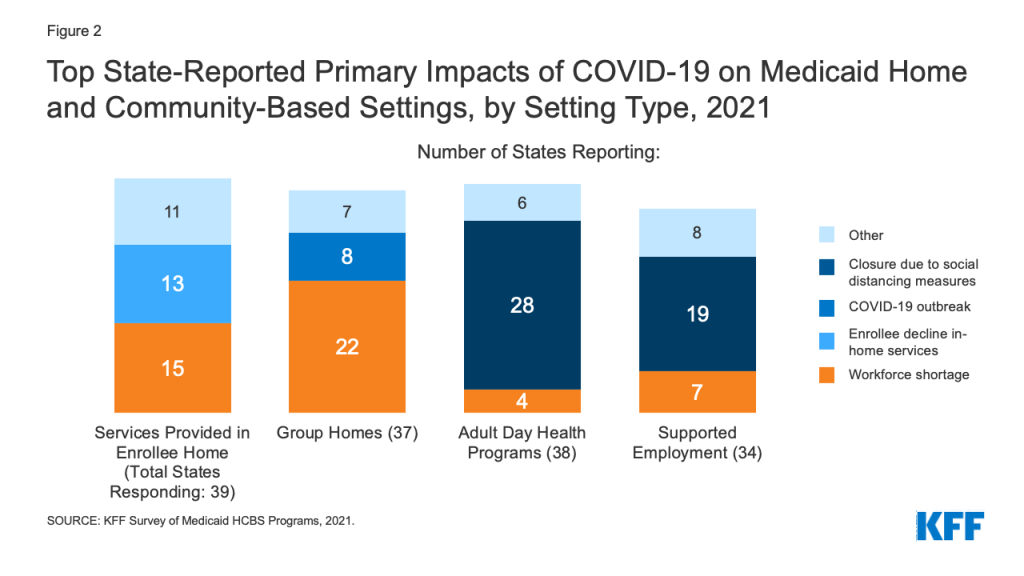
Eight states identified COVID-19 outbreaks as the pandemic’s primary impact in group homes (Figure 2). (Other states also may have experienced outbreaks but did not identify them as the pandemic’s “primary” impact on group homes in their survey response.) Arizona provided additional detail about the pandemic’s impact on group homes, noting that group homes had to increase staffing to support HCBS enrollees during the day when outside day habilitation and supported employment programs became less available. In addition, Arizona noted that its group homes had to identify alternative places to quarantine residents exposed to coronavirus to mitigate the risk of spreading infection to other residents and staff.

COVID-19 Impact on Medicaid HCBS Providers

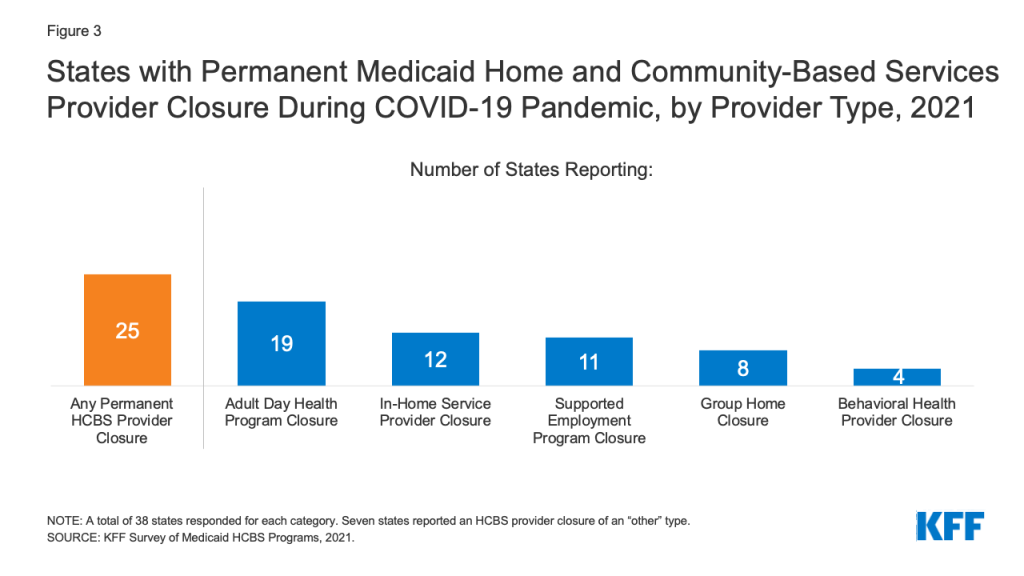
Two-thirds of responding states reported a permanent closure of at least one Medicaid HCBS provider during the pandemic (Figure 3).13  Most of these states (16) reported permanent closures among more than one HCBS provider type. Adult day health programs were the most frequently reported HCBS provider type to have permanently closed, followed by providers of in-home services, supported employment providers, and group homes (Figure 3). Several states indicated that workforce shortages already existed prior to pandemic and worsened during the COVID-19 PHE. For example, Oregon noted that HCBS providers experienced challenges with remaining financially viable due to the pandemic, which will impact their ability to reopen. Specific challenges cited by Oregon related to providers’ ability to maintain leased space, retain trained staff, and provide supported employment services such as job search, placement, and coaching.

Figure 3: States with Permanent Medicaid Home and Community-Based Services Provider Closure During COVID-19 Pandemic, by Provider Type, 2021

About three-quarters of responding states reported that they used CMS-approved authority to provide retainer payments to financially support Medicaid HCBS providers during the pandemic.14  Retainer payments allow providers to continue to bill and be paid for habilitation and personal care services that are authorized in enrollee service plans, which is intended to help providers maintain capacity when circumstances prevent enrollees from actually receiving those services.15  For example, some HCBS providers such as adult day health centers had to temporarily close to comply with social distancing orders during the COVID-19 PHE, and some HCBS enrollees may have had to temporarily stop receiving in-home services due to self-quarantine.

Most responding states (20 of 29) reported that the initial federal limit of three 30-day episodes for retainer payments was insufficient to fully support HCBS providers during the pandemic.16  Some states’ responses to this question varied by HCBS program, indicating that the federal retainer payment limit may have been sufficient to support some service provider types but not others. For example, Pennsylvania reported the federal retainer payment limit was insufficient for I/DD service providers but was sufficient for providers serving enrollees in its waiver for seniors and people with physical disabilities. CMS’s initial guidance allowed states to make up to three 30-day episodes of retainer payments during the COVID-19 PHE.17  This guidance was in effect when we began fielding our survey in March 2021. Subsequent CMS guidance revised federal policy to allow states to offer retainer payments for up to three additional 30-day periods in calendar year 2021, recognizing the extended duration of the COVID-19 PHE.18 

Early State Plans for ARPA HCBS Funding Increase

Nearly six in 10 responding states identified the top initiatives that they were planning to target with the new temporary enhanced federal Medicaid matching funds for HCBS in the American Rescue Plan Act (ARPA).19  The ARPA increases the federal matching rate for state spending on HCBS by 10 percentage points from April 1, 2021 through March 31, 2022.20  States must maintain their current HCBS spending and use the enhanced funds for activities that expand or strengthen Medicaid HCBS. KFF previously estimated that this ARPA provision could increase federal Medicaid HCBS spending by about $11.4 billion nationally. The increase will be distributed proportional to the size of state HCBS programs, reflecting variation in both state size and optional policy choices. The ARPA was enacted just as our survey went into the field in March 2021, and survey responses reflect states’ early plans. States’ plans for the ARPA funds may change in light of CMS implementation guidance issued in mid-May 2021, and based on stakeholder input as states develop their formal plans to submit to CMS.

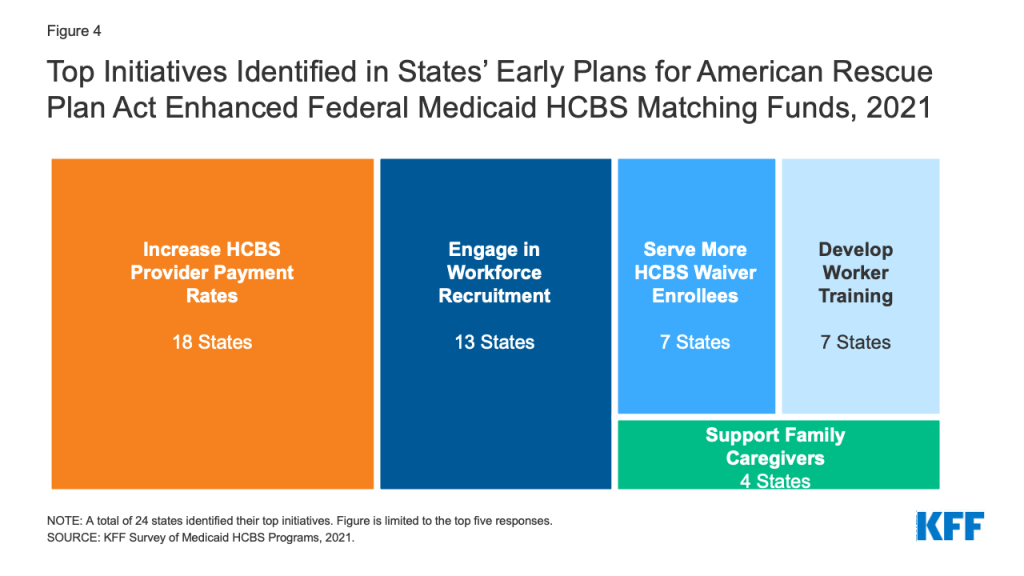
The two initiatives most frequently reported by states as potential uses of the new APRA funds were increasing HCBS provider payment rates and workforce recruitment (Figure 4). Other initiatives rounding out the top five included serving additional HCBS waiver enrollees, investing in worker training, and supporting family caregivers (Figure 4). Fewer states reported providing emergency equipment and supplies (4 states), providing worker hazard or overtime pay (3 states), providing retainer payments (3 states), providing services to mitigate enrollee isolation due to the pandemic (2 states), adding or increasing waiver services (2 states), and funding nursing home to community transitions (2 states) among their top anticipated uses of APRA funds. We asked states to identify their top two initiatives, though a number of states’ responses to this question varied by HCBS program with 14 states reporting three or more initiatives across different programs. The May 2021 CMS guidance clarified that states also can use ARPA funds to facilitate access to COVID-19 vaccines, so some states may include this initiative in their final plans.

Figure 4: Top Initiatives Identified in States’ Early Plans for American Rescue Plan Act Enhanced Federal Medicaid HCBS Matching Funds, 2021

Looking Ahead

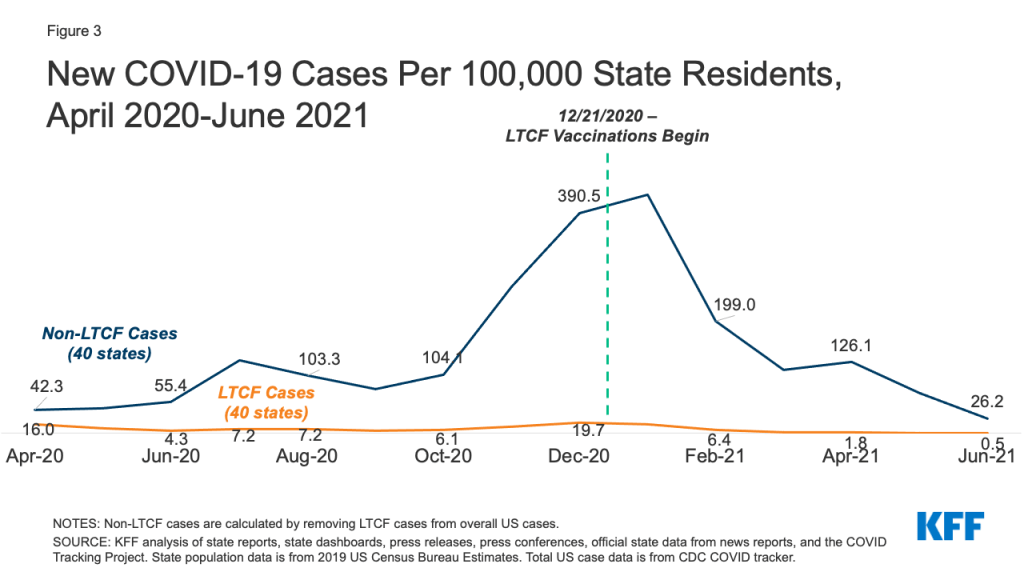
Understanding the pandemic’s impact on Medicaid HCBS enrollees and providers can help to inform ongoing pandemic response and recovery efforts. Important data gaps remain, with most states lacking publicly available data on COVID-19 cases and deaths among HCBS enrollees. While the availability of vaccines has led to substantial decreases in cases and deaths among those in LTSS settings, CMS has noted that ongoing vaccination efforts will be necessary due to workforce turnover and to ensure widespread vaccine access. Our survey results indicate that while some states are tracking vaccination rates among Medicaid HCBS enrollees, tracking is not yet uniform across all states and among all HCBS programs within states. A recent interim final rule adopting requirements for certain LTSS settings to report on, provide education about, and offer the COVID-19 vaccine to residents and staff applies to nursing homes but deferred establishing similar requirements for congregate community-based settings like group homes and adult day health centers. Until data, resource, and oversight gaps across the LTSS continuum are filled, nonelderly people with disabilities may continue to experience disproportionate barriers to vaccine access compared to people in nursing homes, and the full impact of COVID-19 on this population will not be understood completely. Despite limited efforts to track vaccination rates, our survey also found that state HCBS programs are playing a role in facilitating vaccine access for HCBS enrollees, with most states adopting multiple policies in this area. These efforts could be expanded if states choose to direct a portion of their ARPA enhanced HCBS funds to activities supporting COVID-19 vaccine access as permitted in recent CMS guidance.

The pandemic has brought new attention among policymakers and the public to the longstanding unmet need for HCBS and direct care workforce shortage, driven by low wages, high turnover, and limited opportunities for career advancement. Most states reported workforce shortages as the pandemic’s primary impact on HCBS provided in an enrollee’s home  and in group homes. Many states also reported permanent closure of Medicaid HCBS providers during the pandemic, affecting adult day health centers, in-home service providers, supported employment providers, and group homes. Most states that reported provider closures experienced the loss of more than one provider type. Though many states reported using retainer payment authority to financially support providers, the original federal episode limit may have been insufficient to meet some providers’ needs, particularly those with narrow operating margins. Medicaid providers also faced challenges accessing federal provider relief funds, both in the amount of funding received and delays in allocations compared to other provider types.

Maintaining and increasing the HCBS provider infrastructure is key to meeting enrollee need and expanding access to these services as pandemic recovery efforts continue and beyond. The APRA one-year enhanced funds for HCBS represents the first new federal investment in Medicaid HCBS since the Affordable Care Act in 2010. States have adopted a number of policies to expand access to Medicaid HCBS during the PHE, such as expanding eligibility criteria, streamlining enrollment processes, adding services, and increasing provider payment rates, but their ability to continue many of these policies after the PHE ends may be limited by budgetary constraints. Our survey found that states’ initial plans for the new ARPA funds centered on provider payment rate increases and workforce recruitment, two areas which experience during the pandemic has confirmed are crucial to sustaining and expanding access to HCBS. While the ARPA enhanced funds are available only for one year, additional federal funding for HCBS is part of the budget reconciliation package proposed by Democratic leaders, though the details will be worked out by Congressional committees. President Biden earlier this year proposed a $400 billion federal investment in Medicaid HCBS, though it is unclear how much of that funding increase will be approved by Congress as it considers competing priorities in the budget package.

Endnotes

  1. The total number of HCBS waivers may differ somewhat for FY 2021. That data will be included in a subsequent report. ↩︎
  2. The 10 states that did not respond by mid-July 2021 are Connecticut, District of Columbia, Georgia, Hawaii, Minnesota, New Hampshire, New Mexico, North Carolina, Tennessee, and Utah. ↩︎
  3. Thirty-nine states responded to this survey question. ↩︎
  4. Illinois reported that the state agencies operating its HCBS waivers for seniors, people with physical disabilities, and people with HIV/AIDS are reporting COVID-19 cases and deaths among those enrollees to local health departments, and managed care plans are tracking COVID-19 cases and deaths across several Illinois HCBS waivers, but this information is not publicly available. ↩︎
  5. Thirty-eight states responded to this survey question. ↩︎
  6. Thirty-six states responded to this survey question. ↩︎
  7. This initiative was reported by five states (Florida, Massachusetts, New Jersey, Ohio, and Virginia). ↩︎
  8. This initiative was reported by three states (Illinois, Pennsylvania, and Wisconsin). ↩︎
  9. Thirty-nine states responded to this survey question. ↩︎
  10. Thirty-seven states responded to this survey question. ↩︎
  11. Thirty-eight states responded to this survey question. ↩︎
  12. Thirty-four states responded to this survey question. ↩︎
  13. Thirty-eight states responded to this survey question. ↩︎
  14. Thirty-nine states responded to this survey question. Our survey asked states whether they actually used CMS-approved authority to provide retainer payments. KFF’s Medicaid emergency authorities tracker lists states with CMS-approved authority, without indicating whether states actually used an approved authority. This difference may account for discrepancies in state totals between the two sources. ↩︎
  15. Since 2000, CMS Olmstead guidance has permitted states to make retainer payments to personal care and attendant service providers while an HCBS enrollee who usually receives those services is hospitalized or absent from their home. This policy places personal assistance services on equal footing with nursing facility services, for which states are allowed to make bed hold payments in an enrollee’s absence. The 2000 guidance applies to personal assistance services provided through HCBS waivers and allows a retainer payment period of 30 consecutive days or the number of days for which the state allows a nursing facility bed hold payment, whichever is less. CMS’s Section 1115 COVID-19 demonstration waiver template allowed states to request authority to make retainer payments to habilitation and personal care service providers affected by the pandemic in an effort to preserve this provider network. CMS COVID-19 guidance clarified that retainer payment authority also is available as a regular state plan amendment or a disaster state plan amendment for Section 1915 (i) HCBS and Community First Choice attendant services as well as through HCBS waiver Appendix K. CMS, COVID-19 Frequently Asked Questions (FAQs) for State Medicaid and Children’s Health Insurance Program Agencies, at pp. 101-102 (last updated Jan. 6, 2021), https://www.medicaid.gov/state-resource-center/downloads/covid-19-faqs.pdf. ↩︎
  16. Twenty-eight states responded to this survey question. One state reported that it used retainer payment authority but did not respond to this follow-up question. ↩︎
  17. Consecutive days are those that are eligible for billing, which means that 30 consecutive billing days for services provided Monday through Friday encompasses a 6-week period. CMS, COVID-19 FAQs, supra. n.16 at p. 99. ↩︎
  18. The revised policy is retroactive to January 1, 2021. CMS State Medicaid Director letter, SMD #21-003, Implementation of American Rescue Plan Act of 2021 Section 9817:  Additional Support for Medicaid Home and Community-Based Services during the COVID-19 Emergency, at p. 11 (May 13, 2021), https://www.medicaid.gov/federal-policy-guidance/downloads/smd21003.pdf. ↩︎
  19. Forty-one states responded to this survey question. ↩︎
  20. States have until March 31, 2024 to spend the enhanced funds. ↩︎
Poll Finding

KFF COVID-19 Vaccine Monitor: July 2021

Published: Aug 4, 2021

Findings

The KFF COVID-19 Vaccine Monitor is an ongoing research project tracking the public’s attitudes and experiences with COVID-19 vaccinations. Using a combination of surveys and qualitative research, this project tracks the dynamic nature of public opinion as vaccine development and distribution unfold, including vaccine confidence and acceptance, information needs, trusted messengers and messages, as well as the public’s experiences with vaccination.

Key Findings

  • The latest Vaccine Monitor finds the share of adults who say they have either received a COVID-19 vaccine (67%) or say they will get vaccinated as soon as they can (3%) is relatively unchanged from June. The poll, conducted July 15-27th, may not capture any recent uptick in vaccinations after the most recent data from the Centers for Disease Control and Prevention (CDC), citing the increased risk of the Delta variant to both unvaccinated and vaccinated people.
  • Three in ten adults remain unvaccinated including one in ten who say they want to “wait and see” how the vaccine works for other people before getting vaccinated and 3% who say they will do so “only if required” (down from 6% in June). An additional 14% say they will “definitely not” get a vaccine, a share that has held relatively steady since December. One-fourth of unvaccinated adults (8% of all adults) say they are likely to get a vaccine before the end of 2021, including nearly half (45%) of those who say they want to “wait and see.”
  • Unvaccinated adults, especially those who say they will “definitely not” get a vaccine, are much less worried about the coronavirus, the Delta variant, and have less confidence in the safety and effectiveness of the vaccines compared to those who are vaccinated. Three-fourths of unvaccinated adults, including nine in ten of those who say they will “definitely not” get the vaccine, say they are “not worried” about getting seriously sick from the virus, less than half say they are worried about the Delta variant worsening the pandemic, more than half (including 75% of “definitely not”) say getting vaccinated is a bigger risk to their health than getting infected with coronavirus, and a quarter (just one in ten of “definitely not”) say the vaccines are effective at keeping vaccinated people from dying from COVID-19 or getting seriously ill.
  • The increase in COVID-19 cases and news of the Delta variant spreading in the U.S. has made some people say they are more likely to wear a mask in public or avoid large gatherings, though this is mainly driven by vaccinated adults. Majorities of vaccinated adults say news of the variants has made them more likely to wear a mask in public (62%) or avoid large gatherings (61%), while fewer unvaccinated adults say the same (37% and 40%, respectively). However, one in five unvaccinated adults (22%) say news of variants has made them more likely to get vaccinated for COVID-19. This includes one-third (34%) of those who want to “wait and see,” but few (2%) of those who say they will “definitely not” get a vaccine say the news made them more likely to get vaccinated.
  • The public is divided on whether the federal government should recommend employers require vaccines among their employees. Half (51%) say the federal government should recommend employers require their employees to get the COVID-19 vaccine unless they have a medical exception while a similar share (45%) say the federal government should not recommend this. Views towards this issue are sharply divided by both vaccination status and party identification, with 68% of vaccinated adults and 75% of Democrats saying the federal government should issue this recommendation, while eight in ten (81%) unvaccinated adults and 67% of Republicans say the federal government should not do this.
  • Prior to the CDC issuing the newest guidance encouraging all adults, regardless of vaccine status, to wear masks indoors if they are in an area with higher transmission levels of coronavirus, half of adults said they wore a protective mask at least “most of the time” at an indoor setting like a grocery store, while less than half report wear a mask at least “most of the time” on public transit (44%), at work (42%), outdoors in crowded places (41%), or outdoors with household members or friends (18%). Across most places asked about, vaccinated adults were more likely to report wearing a mask at least “most of the time” than unvaccinated adults. Majorities of Republicans saying they “never” wear a mask outdoors in crowded places, outdoors with friends and household members, at work, or in a grocery store. Democrats, on the other hand, are more likely to report wearing a mask in all of these locations, except when outdoors with household members and friends.

The latest KFF COVID-19 Vaccine Monitor finds roughly two-thirds of U.S. adults (67%) saying they have received at least one dose of a COVID-19 vaccine with an additional 3% saying they will get vaccinated as soon as they can, as of July 27th. Three in ten adults (31%) remain unvaccinated. Those who remain unvaccinated include 10% who say they want to “want and see” how the vaccines work for other people before getting vaccinated, 3% who say they will get a vaccine “only if required” to do so for work, school, or other activities (down from 6% in June), and 14% who say they will “definitely not” get the vaccine. The shares of adults who remain unvaccinated is statistically similar to the KFF June COVID-19 Vaccine Monitor and the share who are the most reluctant to get the vaccine has remained relatively unchanged since KFF began tracking vaccine intentions at the end of 2020.

Seven In Ten Adults Have Either Gotten A COVID-19 Vaccine Or Plan To Do So ASAP

Among unvaccinated adults, one-fourth (8% of all adults) say it is likely they will get the COVID-19 vaccine before the end of the year including 13% who say it is “very likely.” The majority, however, say it is either “somewhat unlikely” or “very unlikely” they will get vaccinated before the end of 2021 (25%), or originally said they will “definitely not” get a vaccine (46%). Nearly half (45%) of those who say they want to “wait and see” say it is likely they will get the vaccine by the end of the year.

One-Fourth Of Unvaccinated Adults Say They Will Get A Vaccine Before The End Of The Year

At least seven in ten White adults, older adults, Democrats, college graduates, those with serious health conditions, and urban residents say they have received at least one dose of the COVID-19 vaccine. Younger adults (18-29 years old), Republicans, rural residents, and the uninsured still report lower rates of vaccine uptake than other demographic groups. A larger share of Hispanic adults (16%) than Black adults (11%) and White adults (8%) say they want to “wait and see” before getting vaccinated, and at least one fifth of uninsured adults, White Evangelical Christians, rural residents, and 18-29 year-olds say they will “definitely not” get a vaccine.

The gender gap in vaccine uptake that emerged last month is still present with women still eight percentage points more likely to report being vaccinated than men (71% vs. 63%), and a larger share of men saying they will “definitely not” get the vaccine (18% vs. 10%). Yet, this is still largely attributed to the differences in partisan identification between men and women, with larger shares of men than women identifying as Republicans or Republican-leaning independents.

Republicans, Rural Residents, Younger Adults, And Uninsured Lag In Vaccine Uptake

In recent days there has been an increase in calls from Republican lawmakers encouraging people to get a COVID-19 vaccine. The latest data from the KFF COVID-19 Vaccine Monitor (fielded from July 15-27) finds 56% of Republicans saying they either have already gotten a COVID-19 vaccine or plan to do so “as soon as possible,” statistically unchanged from June (54%). While this is the largest share of Republicans reporting this intention since we began the Vaccine Monitor, Republicans lag behind both Democrats (89%) and independents (67%) in their willingness to get a COVID-19 vaccine.

Who Remains Unvaccinated?

A previous KFF analysis examined the demographic groups among the unvaccinated population finding two distinct groups, those who are open to getting a vaccine (“wait and see”) and those who say they will definitely not get a COVID-19 vaccine. The latest KFF COVID-19 Vaccine Monitor finds the key demographic differences between the “wait and see” and the “definitely not” groups still center on racial and ethnic identity and political partisanship. Four in ten of those in the “wait and see” group are people of color, while the most vaccine resistant group, those who say they will “definitely not” get a COVID-19 vaccine, is overwhelmingly made up of White adults (65% of the group compared to 50% of the “wait and see” group). Partisanship also plays a major role with more than half (58%) of the “definitely not” group identifying as Republican or Republican-leaning. In addition, religious identity also plays a role as White Evangelical Christians make up nearly twice the share of the “definitely not” group (32%) as the “wait and see” group.

Wait And See" Group Has Larger Share Of Hispanic Adults, Adults With A H.S. Diploma Or Less; Definitely Not Group Has Larger Shares Of White Adults

In addition to key demographics that help explain vaccine intentions, views of the pandemic generally, concerns about getting sick, and views of whether the vaccine or the virus is a greater health risk are also   contributing factors to whether an individual has gotten a COVID-19 vaccine.

Unvaccinated adults, especially those who say they will “definitely not” get a vaccine, are more likely to say they are not worried they personally will get seriously sick from the coronavirus and to believe that getting the vaccine is a bigger risk to their own health than getting the virus. Nine in ten of those who say they will “definitely not” get the vaccine are either “not too worried” or “not at all worried” about getting sick from the coronavirus and three-fourths of this group say getting the COVID-19 vaccine is a greater risk to their health than becoming infected with the coronavirus.

Unvaccinated Adults Who Say They Definitely Won’t Get Vaccinated Are Less Worried About Getting Sick From Coronavirus, See Getting Vaccinated As A Bigger Risk To Their Health

A majority of vaccinated adults (61%) are also not worried about getting sick from the coronavirus, perhaps an indicator of the relief some people are now feeling as a result of getting the vaccine. Unsurprisingly, nine in ten (88%) vaccinated adults say becoming infected with coronavirus is bigger risk to their health than getting the COVID-19 vaccine.

Furthermore, the majority (57%) of unvaccinated adults say they think the news has “generally exaggerated” the seriousness of the coronavirus, while three-fourths of vaccinated adults say the news has been “generally correct” or “generally underestimated” the pandemic’s seriousness. The view that the seriousness of the coronavirus has been “generally exaggerated” is the dominant view among those who say they will “definitely not” get a vaccine (75%).

Views Of The Seriousness Of Coronavirus Are Closely Tied To Vaccine Intentions With Most Who Say They Won’t Get Vaccinated Also Saying The Pandemic Has Been Exaggerated

The Emergence Of The Delta Variant

News about the Delta variant and the recent increases in the number of coronavirus cases in the country has raised concerns only a few weeks after many states and businesses relaxed masking and social distancing guidelines. The vast majority of adults (90%) have heard or read at least “a little” about new strains or variants of the coronavirus, such as the Delta variant. The share of the public who had heard or read about the Delta variant remain unchanged over the field period.

Overall, nearly two-thirds of adults are worried the new variants of the coronavirus will lead to a worsening of the pandemic in the U.S., including 26% who are “very worried.” A majority are also worried that new variants will lead to a worsening of the pandemic in their local area. Fewer are worried they will personally get sick from a new variant of the coronavirus.

Majority Are Worried New COVID-19 Variants Will Lead To A Worsening Of The Pandemic, More Than One-Third Are Worried About Getting Sick

Vaccinated people report higher levels of concerns than unvaccinated people about new variants of the coronavirus leading to a worsening of the pandemic in the U.S. (74% vs. 39%), in their local area (65% vs. 34%), and are more worried they will personally get sick from a new variant (40% vs. 27%).

Majorities Of U.S. Adults Are Worried New Variants Will Lead To Worsening Of Pandemic

Concerns that new variant of the coronavirus will lead to a worsening of the pandemic in the U.S. increased only slightly over the last week of interviews (starting on July 19th)1  during which there was increased media attention on the threat of the Delta variant and more positive vaccine messaging from Republican lawmakers. Nearly two-thirds of adults interviewed during that time period say they are worried (compared to 57% in the week prior). Worries about the pandemic worsening in their local area or that they will personally get sick from a new variant stayed relatively stable over the survey field period.

News of the variants spreading in the U.S. has made some people say they are “more likely” to wear a mask in public or avoid large gatherings. Majorities of vaccinated adults say news of the variants has made them more likely to wear a mask in public (62%) or avoid large gatherings (61%). Unvaccinated adults are much less likely than vaccinated adults to report that the news of the variants has made them more likely to wear a mask (37%) or avoid large gatherings (40%). However, about one in five unvaccinated adults (22%) say the news has made them more likely to get vaccinated for COVID-19. One-third (34%) of those who want to “wait and see” say the news of the variants has made them more likely to get vaccinated for COVID-19 compared to few (2%) of those who say they will “definitely not” get a vaccine.

News Of Coronavirus Variants Has Caused Some Adults To Change Behavior, Two In Ten Unvaccinated Adults Say It Has Made The More Likely To Get Vaccinated

In addition to news about the variants, six in ten adults have heard or read “a lot” or “some” about the possibility that COVID-19 booster shots might be needed for some vaccinated people to keep them protected, including about a quarter (26%) who have heard “a lot.” While similar shares of vaccinated and unvaccinated Americans have heard “a lot” about booster shots, more than double the percentage of unvaccinated adults report hearing nothing about booster shots (28%) compared to vaccinated adults (12%).

Over Half Of Adults, Including Two-Thirds Of Vaccinated Adults, Have Heard A Lot Or Some About The Need For Booster Shots

Among vaccinated adults who have heard or read at least a little about boosters for COVID-19, around a quarter (24%) say this news has caused them to worry that they may not be well-protected from coronavirus, even though they are vaccinated. That worry is significantly larger among vaccinated Black and Hispanic adults, with 36% of Black adults and 44% of Hispanic adults reporting concern compared to 17% of White adults. Three quarters of adults who have heard something about the boosters say this news has not caused them to worry about their protection from COVID-19.

A Majority Of Vaccinated Adults Say News About The Possibility Of A Booster For The COVID-19 Vaccine Hasn't Caused Them To Worry About COVID-19 Protection, Black And Hispanic Adults Slightly More Concerned

Employer mandates

In recent days some cities, states, hospitals, and the federal government have issued requirements mandating some employees be vaccinated against the coronavirus. In addition, some private businesses are requiring employees and patrons to be vaccinated and many colleges are requiring students as well as staff to get vaccinated before the start of the fall semester.

Earlier this month, the U.S. Justice Department issued a statement saying federal law doesn’t prohibit employers from requiring COVID-19 vaccines. The public is split in whether they think the federal government should recommend that employers require employees to get the COVID-19 vaccine unless they have a medical exception with similar shares saying they think the federal government should recommend this (51%) and should not (45%). An additional 3% offer a “don’t know” response.

Public Divided Across Vaccination Status, Partisanship On Whether Federal Government Should Recommend Employers Mandate Vaccines Among Employee

Views toward this issue are sharply divided by both vaccination status and party identification. Two-thirds of vaccinated adults (68%) and three-quarters of Democrats (75%) say the federal government should issue this recommendation, while eight in ten (81%) unvaccinated adults and 67% of Republicans say the federal government should not do this. Independents are divided in their views with 51% saying the federal government should not make this recommendation and 46% saying it should. Health care workers are also divided with half of health care workers (48%) saying the federal government should recommend employers require COVID-19 vaccinations among their employees.2 

Vaccinated Are Confident In Effectiveness Of Available Vaccines While unvaccinated are not

While most vaccinated Americans view the available coronavirus vaccines as effective against preventing many repercussions of COVID-19, unvaccinated adults are less convinced.

Majorities of vaccinated adults say the COVID-19 vaccines are either “extremely effective” or “very effective” at preventing vaccinated individuals from dying from COVID-19 (75%), at preventing vaccinated individuals from becoming seriously ill or hospitalized if they become infected (71%), and at preventing vaccinated individuals from becoming infected with coronavirus if they are exposed to someone who is sick (64%). Fewer vaccinated adults (50%) say the vaccines are “extremely” or “very” effective at preventing vaccinated individuals from passing coronavirus on to others if they become infected. This survey was fielded before recent data from the CDC, finding that vaccinated people who experience breakthrough infections can transmit the virus.

However, significantly fewer unvaccinated Americans agree about the overall effectiveness of the vaccines. Fewer than one quarter of unvaccinated adults think the available vaccines are “extremely” or “very” effective at preventing death, serious illness, infection, or transmission, and at least one-third say the vaccines are “not too effective” or “not at all effective” at preventing each of these.

Majorities Of Vaccinated Adults See COVID-19 Vaccines As Effective, Especially At Preventing Death And Hospitalization; Unvaccinated Adults Less So

Groups that have lower rates of vaccinations also have smaller shares saying the vaccines are effective at preventing death or serious illness among vaccinated adults, as well as preventing vaccinated adults from becoming infected or passing on the virus to others. But even among those groups with lower vaccine rates, including young people, Black and Hispanic adults, and Republicans, at least four in ten report thinking the vaccines are extremely or very effective at preventing hospitalization or death.

Demographic Subgroups Differ On Effectiveness Of COVID-19 Vaccines At Preventing Infections And Passing Along The Virus

Perceived SAFETY OF THE DIFFERENT VACCINES

The percent of adults who say they are “very confident” or “somewhat confident” that each of the COVID-19 vaccines are safe has not changed significantly since April, with 74% believing the COVID-19 vaccines currently available in the U.S. are safe, similar to 71% in April. Similar shares say the same for the Pfizer vaccine (72%) and the Moderna vaccine (68%). A smaller share of the public is confident in the overall safety of the Johnson & Johnson vaccine, but it remains unchanged since April (47%).

Perceptions Of COVID-19 Vaccines Safety Have Not Significantly Changed Since April, With J&J Still Lowest Safety Confidence

Unvaccinated adults are much less confident in the overall safety of the COVID-19 vaccines with majorities saying they are either “not too confident” or “not at all confident” in the safety of each of the available vaccines. One-third of unvaccinated adults say they are “very” or “somewhat” confident in the overall safety of COVID-19 vaccines available in the United States. Confidence is highest among unvaccinated adults when it comes to the safety of the Pfizer vaccine (37%), compared to 31% who are confident in the safety of the Moderna vaccine and 18% who are confident in the safety of the Johnson & Johnson vaccine.

Majorities Of Unvaccinated Adults Are Not Confident In The Safety Of All Available COVID-19 Vaccines In The U.S.

Mask-Wearing Is More Common Among Vaccinated Adults, Democrats

On July 27, 2021 the Centers for Disease Control and Prevention (CDC) issued updated guidance encouraging all adults, regardless of vaccine status, to wear masks indoors if they are in an area with higher transmission levels of coronavirus, which includes nearly two-thirds of all counties in the U.S.. Prior to the CDC issuing the newest guidance, half of adults said they wore a protective mask “every time” or “most of the time” at an indoor setting like a grocery store, while less than half report wearing a mask at least “most of the time” on public transit (44%), at work (42% of those who work outside their home), outdoors in crowded places (41%), or outdoors with household members or friends (18%).

Across most places asked about, vaccinated adults were more likely to report wearing a mask at least “most of the time” than unvaccinated adults including outdoors in crowded places (45% vs. 35%), at work (45% vs. 35%), in a grocery store (53% vs. 44%), or on public transportation (47% vs. 37%). Smaller shares of both vaccinated and unvaccinated adults say they wear masks at least “most of the time” when outdoors with household members or close friends (18% vs. 16%).

Larger Shares Of Vaccinated Adults Report Wearing Masks In Most Locations

Mask-wearing has become a partisan issue during the coronavirus pandemic with majorities of Republicans saying they “never” wear a mask outdoors in crowded places, outdoors with friends and household members, at work, or in a grocery store. Democrats, on the other hand, are more likely to report wearing a mask in all of these locations, except when outdoors with household members and friends.

Most Republicans Report Never Wearing Masks At Outdoor Or Indoor Settings While Democrats Largely Report Wearing Them, Except When Outdoors With Household Members And Friends

Methodology

This KFF COVID-19 Vaccine Monitor was designed and analyzed by public opinion researchers at the Kaiser Family Foundation (KFF). The survey was conducted July 15-July 27, 2021, among a nationally representative random digit dial telephone sample of 1,517 adults ages 18 and older (including interviews from 322 Hispanic adults and 300 non-Hispanic Black adults), living in the United States, including Alaska and Hawaii (note: persons without a telephone could not be included in the random selection process). Phone numbers used for this study were randomly generated from cell phone and landline sampling frames, with an overlapping frame design, and disproportionate stratification aimed at reaching Hispanic and non-Hispanic Black respondents as well as those living in areas with high rates of COVID-19 vaccine hesitancy. Stratification was based on incidence of the race/ethnicity subgroups and vaccine hesitancy within each frame. High hesitancy was defined as living in the top 25% of counties as far as the share of the population not intending to get vaccinated based on the U.S. Census Bureau’s Household Pulse Survey.  The sample also included 28 respondents reached by calling back respondents that had previously completed an interview on the KFF Tracking poll at least nine months ago. Another 118 interviews were completed with respondents who had previously completed an interview on the SSRS Omnibus poll (and other RDD polls) and identified as Hispanic (n =50 ; including 21 in Spanish) or non-Hispanic Black (n=68). Computer-assisted telephone interviews conducted by landline (176) and cell phone (1,341, including 1,015 who had no landline telephone) were carried out in English and Spanish by SSRS of Glen Mills, PA. To efficiently obtain a sample of lower-income and non-White respondents, the sample also included an oversample of prepaid (pay-as-you-go) telephone numbers (25% of the cell phone sample consisted of prepaid numbers) Both the random digit dial landline and cell phone samples were provided by Marketing Systems Group (MSG). For the landline sample, respondents were selected by asking for the youngest adult male or female currently at home based on a random rotation. If no one of that gender was available, interviewers asked to speak with the youngest adult of the opposite gender. For the cell phone sample, interviews were conducted with the adult who answered the phone. KFF paid for all costs associated with the survey.

The combined landline and cell phone sample was weighted to balance the sample demographics to match estimates for the national population using data from the Census Bureau’s 2019 U.S. American Community Survey (ACS), on sex, age, education, race, Hispanic origin, and region, within race-groups, along with data from the 2010 Census on population density. The sample was also weighted to match current patterns of telephone use using data from the January- June 2020 National Health Interview Survey. The weight takes into account the fact that respondents with both a landline and cell phone have a higher probability of selection in the combined sample and also adjusts for the household size for the landline sample, and design modifications, namely, the oversampling of potentially undocumented respondents and of prepaid cell phone numbers, as well as the likelihood of non-response for the re-contacted sample. All statistical tests of significance account for the effect of weighting.

The margin of sampling error including the design effect for the full sample is plus or minus 3 percentage points. Numbers of respondents and margins of sampling error for key subgroups are shown in the table below. For results based on other subgroups, the margin of sampling error may be higher. Sample sizes and margins of sampling error for other subgroups are available by request. Sampling error is only one of many potential sources of error and there may be other unmeasured error in this or any other public opinion poll. Kaiser Family Foundation public opinion and survey research is a charter member of the Transparency Initiative of the American Association for Public Opinion Research.

This work was supported in part by grants from the Chan Zuckerberg Initiative DAF (an advised fund of Silicon Valley Community Foundation), the Ford Foundation, and the Molina Family Foundation. We value our funders. KFF maintains full editorial control over all of its policy analysis, polling, and journalism activities.

GroupN (unweighted)M.O.S.E.
Total1,517± 3 percentage points
COVID-19 Vaccination Status
Have gotten at least one dose of the COVID-19 vaccine1,009± 4 percentage points
Have not gotten the COVID-19 vaccine482± 6 percentage points
Race/Ethnicity
White, non-Hispanic776± 4 percentage points
Black, non-Hispanic300± 7 percentage points
Hispanic322± 7 percentage points
Party Identification
Democrats475± 6 percentage points
Republicans330± 7 percentage points
Independents439± 6 percentage points

Endnotes

  1. In order to examine whether vaccine intentions and worries around the Delta variant with the changing news environment, the two samples (interviews conducted July 15-18, interviews conducted July 19-27) were weighted separately to population parameters. We found only a slight uptick in the share of people and Republicans who say they either have already gotten a COVID-19 vaccine or plan to do so “as soon as possible” in interviews conducted beginning on July 19th. The share of total adults and Republicans who said they were “definitely not” going to get a COVID-19 vaccine remained relatively unchanged in the last week (13% and 17%, respectively). The rest of the analysis included in this report uses a single weight for the entire field period. ↩︎
  2. For the purpose of this analysis, health care workers are those who identified as working in a health care delivery setting. ↩︎
News Release

Most Unvaccinated Adults Don’t Believe the Vaccines are Very Effective and See the Vaccines as a Greater Health Risk than COVID-19 Itself

Two Thirds of Adults Report Being Vaccinated in Late July, Little Changed from June, But About a Quarter of Unvaccinated Adults Say They Expect to Get a Shot by the End of the Year

Published: Aug 4, 2021

Vaccinated Adults Are Nearly Twice as Likely as Unvaccinated Ones to Worry that New Variants Like Delta Will Worsen the Pandemic Nationally and Locally

As public health officials struggle to boost vaccination rates nationally, the latest KFF COVID-19 Vaccine Monitor reports that a narrow majority (53%) of unvaccinated adults believe the vaccine poses a bigger risk to their health than COVID-19 itself.

In contrast, an overwhelming majority (88%) of vaccinated adults say that getting infected with COVID-19 is a bigger risk to their health than the vaccine.

Relatively small shares of unvaccinated adults also believe the vaccines are “extremely” or “very” effective at preventing death (23%), serious illness or hospitalization (21%), or getting infected after exposure (13%), in spite of substantial evidence and the conclusions of official scientific bodies that the vaccines work well at each of those things. Vaccinated adults are at least three times as likely to believe the vaccines prevent those outcomes.

Most (57%) unvaccinated adults also say that the news has “generally exaggerated” the seriousness of the pandemic, while three-fourths of vaccinated adults say the news has been “generally correct” (53%) or has “underestimated” its seriousness (24%). Among those who say they will “definitely not” get a vaccine, 75% say the news is exaggerated.

The sharply different views of the vaccinated and unvaccinated help to explain the contentiousness of ongoing policy debates about vaccine mandates.

For example, vaccinated adults are far more likely than unvaccinated adults to say the federal government should recommend employers require vaccinations among their workers (68% vs. 16%). The public overall is split, with similar shares saying they think the federal government should recommend this (51%) and should not (45%).

Vaccinated adults also are more likely to say they wear masks in grocery stores and other indoor places (53% vs. 44%), at work (45% vs. 35%), or in crowded outdoor settings (45% vs. 35%).

These differences are to a large degree driven by unvaccinated Republicans. Majorities of Republicans say they “never” wear a mask outdoors in crowded outdoor places, at work, or in a grocery store. Democrats are more likely to report wearing a mask at least most of the time in all of these locations.

Fielded from July 15-27, before developments on the Delta variant led the Centers for Disease Control and Prevention to issue new guidance on masking, two-thirds (67%) of adults in July report having gotten at least one dose of a COVID-19 vaccine, little changed from June (65%) as the pace of vaccinations nationally has slowed. Another 3% say they hope to get a shot “as soon as possible,” and one in 10 (10%) say they want to “wait and see” how the vaccine works for others before getting a shot.

In addition, 3% say that they would only get a vaccine “if required” to do so for work, school or other activities, and 14% say they will “definitely not” get vaccinated. The size of the “definitely not” group has not changed significantly since KFF started tracking people’s intentions in December.

At least eight in 10 Democrats, adults 65 and older and college graduates report having gotten at least one vaccine dose. At the other extreme, fewer than six in 10 uninsured adults, Republicans, rural residents and adults under age 50 report receiving a vaccine.

A quarter of unvaccinated adults (8% of all adults) say it is likely they will get a COVID-19 vaccine by the end of the year. This includes nearly half (45%) of those in the “wait and see” group.

“A quarter of those who were unvaccinated say they likely will get a shot by the end of the year,” KFF President and CEO Drew Altman said. “Seeing their friends get sick and local hospitals fill up again with COVID patients may speed them along and add to their ranks.” 

A companion Vaccine Monitor report focused on parents’ views and intentions as schools prepare to reopen in the Fall will follow next week.

Vaccinated Adults Worry More About New Variants Like Delta Worsening the Pandemic

As COVID-19’s Delta variant becomes the dominant strain in the U.S., most of the public say that they are worried that new virus variants will worsen the pandemic across the country (62%) and in their communities (55%).

Much larger shares of the vaccinated than unvaccinated say that they worry that variants will worsen the pandemic both in the country (74% and 39%) and in their communities (65% and 34%). Vaccinated people are also more likely than unvaccinated ones to worry that they personally will get sick from the new variants (40% and 27%).

Most vaccinated people who have heard or read at least a little about the new variants say the news has made them more likely to wear a mask in public (62%) and to avoid large gatherings (61%). Smaller shares of unvaccinated adults say they are more likely either to wear a mask (37%) or avoid large gatherings (40%).

Other results include:

  • Most adults (60%) say they have read or heard about the possibility that some vaccinated people might need COVID-19 booster shots to maintain their protection. A quarter (24%) of vaccinated adults who have heard about the potential need for booster shots say that this has caused them to worry that they may not be well-protected against the virus.
  • Confidence in the safety of the three COVID-19 vaccines currently available in the U.S. has not changed significantly since April. About three-quarters (74%) of adults now say the vaccines are safe. Similar shares say the Pfizer (72%) and Moderna (68%) vaccines are safe. About half (47%) say the Johnson & Johnson vaccine is safe.

Designed and analyzed by public opinion researchers at KFF, the KFF Vaccine Monitor survey was conducted from July 15-27 among a nationally representative random digit dial telephone sample of 1,517 adults, including oversamples of adults who are Black (300) or Hispanic (322). Interviews were conducted in English and Spanish by landline (176) and cell phone (1,341). The margin of sampling error is plus or minus 3 percentage points for the full sample. For results based on subgroups, the margin of sampling error may be higher.

The KFF COVID-19 Vaccine Monitor is an ongoing research project tracking the public’s attitudes and experiences with COVID-19 vaccinations. Using a combination of surveys and qualitative research, this project tracks the dynamic nature of public opinion as vaccine development and distribution unfold, including vaccine confidence and acceptance, information needs, trusted messengers and messages, as well as the public’s experiences with vaccination. 

What Can Employers Do to Require or Encourage Workers to Get a COVID-19 Vaccine?

Author: Karen Pollitz
Published: Aug 3, 2021

On July 29, President Biden announced that federal employees must be vaccinated against COVID-19 or meet other conditions, including wearing masks and undergoing periodic testing for COVID-19 infection. Growing numbers of private employers have also announced vaccine requirements for employees to return to work.   This fact sheet reviews what employers can and cannot do under current rules to require or encourage vaccination of their workers.

Can employers require employees to be vaccinated against COVID-19?

In general, yes, employers can require employees who physically enter the workplace to be vaccinated for COVID-19, and before the pandemic, other employer vaccine mandates have been applied, such as a requirement to get a flu vaccine.  For any vaccine mandate, key standards apply under federal law:

First, a mandatory workplace vaccination program must meet standards under the Americans with Disabilities Act (ADA) of being “job related” and “consistent with business necessity.”  This involves making a determination about the threat to safety posed by unvaccinated employees.  The determination will rest on facts and circumstances involving the workplace and job – such as whether work is conducted indoors or outdoors, or the frequency and duration of an unvaccinated employee’s interaction with other people. In addition, the determination must take into account the most current medical knowledge about COVID-19, such as the level of community spread of the virus. CDC is a key source of current medical knowledge about COVID-19.

Second, under the ADA, employers are generally required to provide reasonable accommodations for employees who, due to a disability (including pregnancy) do not get vaccinated against COVID-19.  Under Title VII of the Civil Rights Act, reasonable accommodations are also required for employees who do not comply based on a sincerely held religious belief.  Such accommodations are required unless they would pose an undue hardship, or substantial difficulty or expense, on the employer.  If it is determined that an unvaccinated employee could pose a safety threat, the employer must consider whether a reasonable accommodation could reduce or eliminate that threat. For example, unvaccinated employees might be required to wear masks, or get periodic tests for COVID-19, or be given the choice to telework.

Third, employers must not apply the vaccination requirement in ways that treat employees differently – on the basis race, color, religion, sex, national origin, age, or genetic information – in violation of other federal equal opportunity (EO) laws.

Finally, the employer can ask employees about their vaccine status or require proof of vaccination.  The ADA generally restricts employers from making disability-related inquiries of employees.  However, EEOC guidance states that asking about COVID-19 vaccination status is not a disability-related inquiry under the ADA, as there are numerous reasons why people might not be vaccinated.   If an employee has not been vaccinated due to a disability or sincerely held religious belief or another reason protected under federal EO laws, as noted above, then reasonable accommodations must be considered.

Can employers offer incentives to be vaccinated?

In general, yes, it is permissible for employers to offer workers incentives to get vaccinated against COVID-19.  These could include cash payments, gift cards, or other rewards or penalties.  The EEOC guidance notes that federal law generally would not limit the size of such incentives, with one key exception noted below. The guidance also says employers can take other steps to encourage or facilitation vaccination without violating federal laws.  These include providing information to educate employees about the vaccine and its benefits and to address common questions and concerns.  Employers can also offer time-off for vaccination and to recover from any side effects. The American Rescue Plan Act makes tax credits available to employers to cover the cost of providing paid leave to employees to receive and recover from COVID-19 vaccinations.

Special restrictions on incentives would apply in the case of employers that offer a COVID vaccination program directly to employees.  That is because, prior to administration of the vaccine, CDC requires pre-screening questions about health history, allergies, pregnancy status, etc., and, when the employer or its agent directly provides the vaccine, such pre-screening questions would constitute a disability-related inquiry by the employer.

Under the ADA, disability-related inquiries through an employer health program, including a workplace wellness program, are permitted only if participation in that program is voluntary.  The definition of “voluntary” under the ADA, and whether that could encompass incentives, has been the subject of controversy and litigation.  When the ADA was first implemented, EEOC guidance made clear that a voluntary employer health or wellness program could not require participation nor penalize employees for not participating.  Then, in 2015, an EEOC regulation revised the definition “voluntary” workplace health and wellness programs to include those that imposed substantial financial penalties – up to 30% of the cost of self-only coverage under the employer’s health plan.  A federal court overturned that regulation, ruling that the redefinition of “voluntary” was arbitrary and capricious.  In 2020, the agency began work on a revised regulation to permit wellness program incentives, but suspended activity in 2021.

With regard to employer-provided COVID-19 vaccination programs, current EEOC guidance allows incentives (which includes both rewards and penalties) to participate if incentives are not so large as to be coercive.  The agency does not, however, provide any detail on how large of an incentive would constitute coercion.  Guidance also makes clear that the incentive size limit – whatever it may be – does not apply if an employer offers an incentive to employees to voluntarily provide documentation that they received COVID-19 vaccination from a community provider.

How does FDA emergency use authorization affect COVID-19 mandates?

The US Department of Justice issued a recent opinion stating that employers and other entities are not prohibited from imposing vaccination requirements solely because the vaccine(s) are only available subject to FDA emergency use authorization (EUA).  Earlier, at least one federal lawsuit had been filed challenging an employer’s COVID-19 vaccine mandate on the grounds that vaccines are still subject to EUA.  It is possible that other legal challenges to employer vaccine mandates could arise.

State laws and employer vaccine requirements

In response to federal guidance, legislation has been introduced in many states to prohibit or restrict employers, including public employers, from requiring COVID-19 vaccinations as a condition of work.  As of July 29, such legislation had been enacted in 7 states and was pending in two others.  As a result, even when employers comply with all federal law requirements, it is possible that vaccine mandates could be challenged under state laws.

News Release

Once Common, COVID-19 Deaths in Long-Term Care Were Rare across Most States in June

Published: Aug 2, 2021

Early in the COVID-19 pandemic, residents and staff at nursing homes and other long-term care facilities accounted for a huge share of COVID deaths, but a new KFF analysis finds that they were relatively rare events across the country in June.

The analysis finds that 13 states and the District of Columbia in June reported either no COVID-19 deaths, or virtually no deaths compared to the state’s population, at long-term care facilities. Most other states reported average weekly deaths in long-term care facilities at or near their lowest levels since the pandemic began.

The analysis is based on data as of the week of June 27 from 42 states and the District of Columbia that report on cases and deaths in long-term care consistently enough to allow analysis of trends. It covers a period prior to the recent rise in cases and deaths nationally linked to the spread of the Delta variant.

Nationwide, states in June reported an average of 0.1 deaths among long-term care residents and staff per week per 100,000 population, down 96 percent from 1.6 deaths per week per 100,000 in December as the nation’s vaccination campaign began. That’s a somewhat sharper decrease in deaths than among the population outside long-term care settings.

Cases in long-term care facilities nationally averaged 0.5 per week per 100,000 population in June, down 97 percent from their peak in December. The analysis notes how quickly deaths and cases fell as the federal Pharmacy Partnership delivered nearly 8 million COVID-19 vaccine doses to long-term care residents and staff between December and April.

COVID-19 Cases and Deaths in Long-Term Care Facilities through June 2021

Authors: Priya Chidambaram and Rachel Garfield
Published: Aug 2, 2021

Data Note

A previous data note found that weekly deaths and cases in LTCFs dropped to an all-time low in April 2021, largely due to the high rates of vaccination among LTCF residents and staff. Additionally, five states in that previous analysis reported zero deaths per 100,000 state residents in April 2021. This data note examines state reported LTCF data from 42 states plus Washington DC through the end of June 2021 to examine patterns of COVID-19 cases and deaths among LTCF residents and staff. While most states report record low deaths and cases in LTCFs, a handful of states have seen an uptick in deaths, and 12 states report higher cases in June 2021 than a previous period. Ongoing tracking to assess the impact of the Delta variant on long-term care facilities at the state-level can highlight the effect of this recent wave on LTCFs.

LTCFs include a range of facilities, including nursing homes, assisted living facilities, and other congregate care facilities for people with disabilities or older adults. Data in this analysis is as of the week of June 27th, 2021. See methods for more details.

Table 1: COVID-19 Deaths in Long-Term Care Facilities (LTCFs)

COVID-19 Deaths in Long-Term Care Facilities

In most states, COVID-19 deaths in LTCFs have continued to fall, with 14 states reporting zero or close to zero weekly LTCF deaths per 100,000 state residents in June 2021. In 11 of these states, zero deaths per 100,000 state residents are rounded values that represent a very small number of LTCF deaths, while Washington DC, Montana, and Rhode Island reported real zero LTCF deaths in June 2021. 21 additional states reported an all-time low LTCF death rate (but not zero) in the most recent month of data available for the state (June 2021 for most states and May 2021 for Florida) (Appendix Table 1). Overall, the average weekly number of COVID-19 LTCF deaths per 100,000 state residents was 0.1 in June 2021, a decline of 96% from December 2020 (when average weekly deaths were 1.6 per 100,000). This decline ranges from 77% in Wisconsin to 100% in six states (California, Connecticut, Washington DC, Massachusetts, Montana, and Tennessee) (Table 1).1 

Figure 1: Average Weekly COVID-19 Deaths In Long-Term Care Facilities Per 100,000 State Residents, June 2021

However, five states reported an increase in COVID-19 deaths in LTCFs compared to an earlier period. In June 2021, average weekly deaths were higher than earlier months in Colorado (April 2021), Georgia (May 2021), New York (September 2020), and Wisconsin (July 2020) (Appendix Table 2). Louisiana reported slightly higher deaths in April 2021 (the most recent month available) compared to October 2020. Across all five states, however, LTCF deaths in the most recent month were still substantially lower than their peak.

While LTCF trends largely mirror COVID-19 deaths outside LTCFs, most states report higher death rates outside LTCFs. For example, states that reported zero or near zero LTCF deaths still reported deaths outside of long-term care facilities, ranging from 0.2 deaths per 100,000 in California to 1.2 deaths per 100,000 in Michigan (data not shown). Overall, COVID-19 deaths outside of LTCFs have dropped by 82%, from 3.5 to 0.6 deaths across the 40 states included in this analysis (Figure 2), a smaller decline than among LTCFs.

Figure 2: New COVID-19 Deaths Per 100,000 State Residents, April 2020-June 2021
Table 2: COVID-19 Cases in Long-Term Care Facilities (LTCFs)

COVID-19 Cases in Long-Term Care Facilities

Across the 40 states for which we can trend LTCF cases, average new weekly cases in LTCFs were just 0.5 per 100,000 in June 2021, compared to a peak of 19.7 in December 2020, a decrease of 97% (Figure 3 and Table 2). 28 states reported an all-time low case rate in the most recent month of data available for the state (June 2021 for 27 states and May 2021 for Florida) (Appendix Table 2). Nearly all states analyzed have seen a decline of at least 90% in LTCF cases since December 2020, and Vermont and Washington saw declines of 89%.

However, in contrast to deaths, just one state (Rhode Island) reported zero LTCF cases per 100,000 state residents, and 12 states reported higher average weekly LTCF cases in June 2021 compared to an earlier month (Table 2 and Appendix Table 2). Three states reported their lowest LTCF case rate in March 2021 (Colorado, Kansas, and Louisiana), six states reported their lowest LTCF case rate in April 2021 (Arkansas, Mississippi, Montana, New Mexico, Utah, and Wisconsin), two states reported their lowest LTCF case rate in May 2021 (Georgia and Nevada), and Vermont reported its lowest case rate in October 2020. Among the 12 states that report data on new cases among residents and staff separately, it most states reported higher new cases among LTCF staff than LTCF residents  (data not shown), likely reflecting the higher share of unvaccinated staff in LTCFs when compared to LTCF residents. It is unknown whether these new cases are among vaccinated or unvaccinated residents and staff, or whether these cases came from Delta variant infections.

Cases outside of LTCFs have been substantially higher than cases in LTCFs throughout the pandemic, with some state variation. Cases outside of LTCFs have dropped since December 2020, from 390.5 to 26.2 cases, a steep drop of 93% that mirrors the 97% drop in LTCF cases (Figure 3). However, of the six states that reported higher LTCF cases in June 2021 than April 2021 (Arkansas, Mississippi, Montana, New Mexico, Utah, and Wisconsin), only Arkansas reported higher cases outside of LTCFs in that same time period, suggesting faster spread of the virus in LTCFs than the surrounding community in the other 5 states.

Figure 3: New COVID-19 Cases Per 100,000 State Residents, April 2020-June 2021

Potential Impact of Delta Variant

The highly transmissible nature of the Delta variant may impact this trend of decreased LTCF cases and deaths. Preliminary federal data show a slight uptick in national nursing home cases and deaths in the first weeks of July 2021. Given the steady decline of LTCF cases and deaths since January 2021, additional weeks of data are necessary to understand whether this slight uptick is due to a data anomaly or the rise of the Delta variant in surrounding communities. While current data show that many of the recent hospitalizations and deaths due to COVID-19 are among unvaccinated individuals, many people in these facilities have pre-existing health conditions that could put them at high risk of illness or death if they experience a breakthrough infection, regardless of vaccination status. Ongoing tracking and analysis can shed light on the impact of increased community cases, given the close ties between community spread and LTCF cases and deaths.

Policy Implications

While LTCF cases and deaths have been steadily trending downward since the vaccine rollout, there are still several factors that prevent the long-term care crisis from coming to an end, including the rise of the Delta variant and low vaccination rates in some parts of the country (both in and out of LTCFs). These factors will be important to consider as policymakers use the experience of the pandemic in these settings to inform policy moving forward.

Most notably, the heavy toll that COVID-19 took among staff and residents at LTCFs highlighted the key role that timely, standardized, comprehensive data can play in policy—and the problems that can arise when it is absent. The federal government stood up a new COVID-19 data reporting system for nursing facilities relatively quickly, but there were still gaps in data from the early months of the pandemic, and that data excluded other long-term care settings that also had high rates of cases and deaths. Having robust, comparable data early on could have allowed researchers and policymakers to understand the link between community spread and the spread of the virus in facilities in real-time. In addition, limited data on characteristics of people in LTCFs who were infected or died hindered understanding of those at highest risk. Looking forward, building data systems that can be leveraged during crises to produce timely, detailed, accurate data can be instrumental in targeting policy responses.

The rollout of the long-term care partnership to deliver vaccines to residents and staff, while not perfect, had a nearly immediate effect that was evident in the data. The federal Pharmacy Partnership distributed nearly 8 million doses of the vaccine to LTCF residents and staff from December 2020 – April 2021. Within weeks of the first doses being administered, nursing home cases and deaths dropped while all other cases and deaths increased. Though the partnership experienced challenges (including low rates of staff vaccination and exclusion of some LTC settings), it was ultimately successful in vaccinating a high-risk population to reduce overall mortality due to COVID-19. The success of the partnership can provide a blueprint moving forward for successful public-private partnerships and leveraging pre-existing expertise and infrastructure in large-scale public health efforts.

Lastly, the experience of tracking COVID-19 in LTCFs highlights the importance of targeted or local efforts to understanding data across states. While the federal government eventually published weekly data on cases and deaths in nursing facilities that allowed comparison across all 50 states, data anomalies in this data led to efforts, including those by KFF, to track data directly from state websites. Even this effort yielded inconsistencies. For example, in March 2021, Wisconsin increased its cumulative long-term care death count by over 1,000 deaths with no conceivable explanation. A local news outlet had already reported on this discrepancy and allowed us to understand it was a data correction, and not reflective of what was happening on the ground. This pattern repeated throughout the pandemic: Many states had a few dedicated reporters and news outlets who kept a close eye on their individual state’s long-term care data and, importantly, had contacts in the right state departments. These local news outlets were instrumental in providing insight into data anomalies or state changes that affected data reporting, and effectively created an additional network of data experts for researchers to leverage.

Methodology

This analysis is based on data as of the week of June 27th, 2021 from 42 states plus Washington DC, for a total of 43 states. The remaining eight states were excluded because they do not directly report data on cases and deaths in long-term care facilities, their data is sourced from sporadically released media reports, or there were data quality or availability issues in trending data over time.

This analysis relies on state-reported data instead of federal data since federal data may exclude cases and deaths prior to May 8th, 2020. This exclusion may miss peaks in states such as New York, New Jersey, and Massachusetts. Additionally, the federal data does not include non-nursing home settings. COVID-19 has disproportionately impacted all types of long-term care settings, such as assisted living facilities and group homes. Thus, the state-reported data is more likely to capture the full burden of cases and deaths in long-term care facilities.

Within the 43 states included in this analysis, we were able to trend long-term care cases in 39 states plus DC and deaths in 39 states plus DC. We included states for which we could reliably trend at least six months of data, using the earliest reliable period reported in the state as the starting point for that state’s trend.

Louisiana’s trend stops at April 2021 due to reporting changes in May and June that prevent data from being trended. Florida’s trend stops in May 2021 due to the state halting their reporting of cumulative long-term care cases and deaths in June 2021.

States vary in which facilities they include in LTCF reporting and whether they include residents and staff in case and death counts. For all states, we trended the subset of facilities and populations that provide the longest reliable trend line. For example, our data for Delaware excludes staff cases because that data was not reported consistently; in Michigan, this analysis excludes cases and deaths in Adult Foster Care facilities since these cases and deaths were only added for recent weeks. For this reason, this analysis should not be used to identify state-level or national data on total long-term care cases and deaths. See below for details on how each indicator in the Tables and Appendix were calculated.

Average Weekly Long-Term Care Deaths/Cases Per 100,000 State Residents:

These data represent trends in long-term care deaths and cases in states overtime in the context of total state population. Total state population data is from 2019 estimates from the US Census Bureau. The first week of available long-term care data for each state was not included in this analysis since the first week of data does not reflect a single week of deaths and cases, but rather all deaths and cases that have occurred up to that point. New deaths and cases were calculated for each week thereafter, and then averaged for all of the weeks within the month. Weeks where states reported large increases or any decreases due to reporting changes or data reconciliation were not included in the calculations of monthly averages. These average new deaths and cases were converted to represent deaths and cases per 100,000 state residents to allow for easier comparison across states. Totals for each table were calculated by dividing total new deaths and new cases per month by the total state populations for the states represented in each month of data and converting values to represent totals per 100,000 state residents.

Percent Change In LTCF Deaths/Cases Since December 2020:

Percent change is calculated by taking the difference between average weekly deaths in December 2020 and average weekly deaths in June 2021 and dividing that difference by the average weekly deaths in December 2020.

Appendix

Appendix Table 1: Average Weekly Long-Term Care Deaths Per 100,000 State Residents, April 2020 - June 2021
Appendix Table 2: Average Weekly Long-Term Care Cases Per 100,000 State Residents, April 2020 - June 2021

Endnotes

  1. Florida and Louisiana reported lower declines between December 2020 and the most recent month of data available (58% and 69%); however, these declines were calculated using earlier months of data since they did not report data in June 2021 (see methods for more detail). ↩︎
News Release

COVID-19 Vaccine Breakthrough Cases Are Extremely Rare, According to KFF State Data Analysis

Published: Jul 30, 2021

As COVID-19 cases increase along with spread of the more transmissible Delta variant, the effectiveness of COVID-19 vaccines continues to be an important topic. A new KFF analysis looks at COVID-19 vaccine “breakthrough cases,” when fully vaccinated individuals become infected, as well as hospitalizations and deaths, to see which states are providing data on breakthrough events, how regularly, and what those data reveal.

After a review of the websites of all states and D.C. and other official sources, the new analysis found that half of states (25) report some data on COVID-19 breakthrough events. Within that, 15 states report these data on a weekly basis and one state reports on a daily basis, while the other nine report more infrequently. Overall, the data found that breakthrough events are extremely rare among those who are fully vaccinated, and that the vast majority of reported COVID-19 cases, hospitalizations, and deaths in U.S. are among those who are unvaccinated or not fully vaccinated. Some key highlights include:

  • The rate of breakthrough cases reported among those fully vaccinated is well below 1% in all reporting states, with Connecticut the lowest (0.01%) and Alaska the highest (0.29%). Hospitalization rates among those fully vaccinated ranged from effectively zero (0.00%) in California, Delaware, D.C., Indiana, New Jersey, New Mexico, Vermont, and Virginia to 0.06% in Arkansas. Death rates were even lower at 0.00% for all but two states, Arkansas and Michigan, where they were 0.01%.
  • More than 9 in 10 COVID-19 cases, hospitalizations, and deaths occurred among people who are unvaccinated or not yet fully vaccinated. The share of COVID-19 cases among those not fully vaccinated ranged from 94.1% in Arizona to 99.85% in Connecticut.

This analysis highlights how rare breakthrough events are but also how data remain limited, and only available for a subset of states.

COVID-19 Vaccine Breakthrough Cases: Data from the States

Authors: Jennifer Kates, Lindsey Dawson, Emma Anderson, Anna Rouw, Josh Michaud, and Natalie Singer
Published: Jul 30, 2021

While COVID-19 vaccines are highly effective at preventing severe disease, hospitalization, and death from COVID-19 and also reduce the likelihood of mild or asymptomatic infection, a small share of fully vaccinated individuals do become infected, and some become hospitalized or have died. These rare occurrences are known as “breakthrough cases” which are to be expected, and historically known to occur with other vaccines as none is 100% effective.

The Centers for Disease Control and Prevention (CDC) currently monitors hospitalizations and deaths, from any cause, among fully vaccinated individuals with COVID-19, but not breakthrough infections, which it stopped monitoring as of May 1. CDC presents this data in aggregate at the national level but not by state, and there is no single, public repository for data by state or data on breakthrough infections, since the CDC stopped monitoring them.

We therefore reviewed the websites and other official state sources for all 50 states and D.C. to see which are providing data on COVID-19 breakthrough cases, hospitalizations and deaths, how regularly, and what those data may tell us. We only used data from official state sources (we did not include data available only in news media reports, for example). Where a state did not provide comparable data on overall COVID-19 cases, hospitalizations, or deaths reported over the period in which it captured breakthrough events, we obtained data on cases and deaths from the Johns Hopkins University COVID-19 Dashboard and on hospitalizations from the U.S. Department of Health & Human Services for the appropriate period (see methods for more detail).

Importantly, not all hospitalizations and deaths of those fully vaccinated and diagnosed with COVID-19 are due to COVID-19 or have a known cause at the time of reporting. The CDC reports that as of July 19, of 5,601 hospitalized breakthrough cases, 27% were asymptomatic or not related to COVID-19 and of 1,141 fatal cases, 26% were asymptomatic or not related to COVID-19. States differ in whether they provide this detail. DC, for example, reports that as of July 11, 50% of hospitalized breakthrough cases were due to COVID-19, 19% were not, and 31% were of unknown reason. However, few states made these distinctions. Where they did, we only included breakthrough hospitalizations and deaths due to COVID-19. In other cases, some of these breakthrough events may be due to causes other than COVID-19.

Overall, we find that:

  • Half of states (25) report some data on COVID-19 breakthrough events (see Table 1). Twenty-four provide data on breakthrough cases, 19 on hospitalizations and on deaths.
  • Fifteen of these states regularly update these data, often on a weekly basis. The rest use a different frequency, have one-time reports, have stopped updating, or have an unclear reporting frequency.
  • The data reported from these states indicate that breakthrough cases, hospitalizations, and deaths are extremely rare events among those who are fully vaccinated against COVID-19 (see Figure 1). The rate of breakthrough cases reported among those fully vaccinated is below 1% in all reporting states, ranging from 0.01% in Connecticut to 0.54% in Arkansas.
    • The hospitalization rate among fully vaccinated people with COVID-19 ranged from effectively zero (0.00%) in California, Delaware, D.C., Indiana, New Jersey, New Mexico, Vermont, and Virginia to 0.06% in Arkansas. (Note: Hospitalization may or may not have been due to COVID-19.)
    • The rates of death among fully vaccinated people with COVID-19 were even lower, effectively zero (0.00%) in all but two reporting states, Arkansas and Michigan where they were 0.01%. (Note: Deaths may or may not have been due to COVID-19.)
Percent of Fully Vaccinated Individuals That Have Experienced a COVID-19 Breakthrough EventE
  • Almost all (more than 9 in 10) COVID-19 cases, hospitalizations, and deaths have occurred among people who are unvaccinated or not yet fully vaccinated, in those states reporting breakthrough data (see Figure 2).
    • The reported share of COVID-19 cases among those not fully vaccinated ranged from 94.1% in Arizona to 99.85% Connecticut.
    • The share of hospitalizations among those with COVID-19 who are not fully vaccinated ranged from in 95.02% in Alaska to 99.93% in New Jersey. (Note: Hospitalization may or may not have been due to COVID-19.)
    • The share of deaths among people with COVID-19 who are not fully vaccinated ranged from to 96.91% in Montana to 99.91% in New Jersey. (Note: Deaths may or may not have been due to COVID-19.)
Share of Overall COVID-19 Cases by Those Fully Vaccinated v. Those Not Fully Vaccinated Among Reporting States

Note that as more people get vaccinated, the share of cases, hospitalizations, and deaths accounted for by unvaccinated people will tend to fall, since there will be fewer unvaccinated people in the population. That will be true even if infection, hospitalization, and death from COVID-19 is still very rare among vaccinated people.

Implications

While information on breakthrough events is still limited and incomplete, this analysis of available state-level data indicates that COVID-19 breakthrough cases, and especially hospitalizations and deaths, among those who are fully vaccinated are rare occurrences in the United States. Moreover, this data indicate the vast majority of reported COVID-19 cases, hospitalizations, and deaths in U.S. are among those who are unvaccinated or not fully vaccinated. These findings echo the abundance of data demonstrating the effectiveness of currently authorized COVID-19 vaccines. Moving forward, particularly as the more transmissible Delta variant is now the dominant strain of COVID-19 circulating in the U.S., more robust state-level data will help to monitor ongoing vaccine effectiveness and inform discussions about booster vaccinations.

Table 1: COVID-19 Breakthrough Event Data, Source, and Notes by State

Methods

We reviewed the websites and other official state sources for all 50 states and D.C. to assess which states are providing data on COVID-19 breakthrough cases, hospitalizations, and deaths, how regularly these data are updated, and what those data reveal. We only included data from official state sources (excluding data where the only available source was the news media, for example) and data provided for a period longer than one month (data from South Carolina was only available for June and was not included in this analysis). Each state collects and provides these data across varying time periods. To account for this, we used overall COVID-19 cases, deaths, and hospitalizations during the applicable time period for each state. If a state reported breakthrough data as cumulative, we assumed a January 1, 2021 start date. We used state-provided data where available. Where these data were not available from the state, we relied on data from Johns Hopkins University for cases and deaths totals, and the U.S. Department of Health and Human Services for hospitalization totals. Hospitalization totals include only confirmed COVID-19 hospitalizations for both adults (18+ years old) and children (younger than 18 years). For the total number of fully vaccinated individuals by state, we relied on state-reported totals where available, and data from Johns Hopkins University otherwise, again using the applicable time period for each state.

We utilize two approaches in our analysis. The first assesses the share of fully vaccinated individuals that have experienced a COVID-19 event (i.e. diagnosis, hospitalization, or death) within each state. The second assesses the share of total COVID-19 cases, hospitalizations, and deaths attributable to fully vaccinated individuals compared to individuals who are not fully vaccinated within each state. Individuals who are not fully vaccinated may include those who are not vaccinated, partially vaccinated, or have an unknown vaccination status. In some cases, it is not possible to determine whether a hospitalization or death of a vaccinated individual with COVID-19 was due to COVID-19.

The Next Stage of COVID-19 Vaccine Roll-Out in United States: Children Under 12

Authors: Jennifer Kates, Samantha Artiga, Kendal Orgera, and Jennifer Tolbert
Published: Jul 30, 2021

There are approximately 48 million children under the age of 12 in the United States. This group is not yet eligible for COVID-19 vaccination, though it is widely expected that a vaccine will be authorized for at least some children by the end of the year (clinical trials are currently underway among children between the ages of 6 months and 11 years old). Although children have not borne the most severe brunt of COVID-19 relative to adults, some do become hospitalized, suffer long-term consequences, and even death from the disease. In addition, children can transmit to others, contributing to ongoing community transmission in the U.S., as the country continues to struggle to contain the virus in the midst of the much more transmissible Delta variant. Achieving a high rate of vaccine coverage among those under age 12, once eligible, is therefore important to protecting children and controlling continued spread of COVID-19, particularly as it is expected that many children will return to in-person schooling in the fall.

But reaching younger children may pose new challenges, including concerns about vaccination among parents. In almost all states, parental consent for vaccination is required for those under age 12. Yet, our KFF COVID-19 Vaccine Monitor surveys find that parents of younger children remain cautious about vaccinating their children against COVID-19, with almost three quarters (73%) saying they will either wait and see, will only do so if required by school, or won’t do so at all, although these views may change once a vaccine is authorized for kids. In addition, parents who may be willing to get their children vaccinated against COVID-19 could face barriers to accessing the vaccine.

Better understanding the characteristics of children under 12 in the U.S. may help inform vaccination efforts when they become eligible. We analyzed data from the U.S. Census and the 2019 American Community Survey to provide an overview of the population by age, region and state, race/ethnicity, poverty, and insurance status (see Methods for more information).

  • There are 48 million children under the age of 12 in the United States, almost three times the number of adolescents, aged 12-15, the most recent age group to become eligible for COVID-19 vaccination. Over half are between the ages of 5 and 11 (59.2%), the subset for whom authorization of a vaccine may come next. A quarter (24.9%) are between the ages of 2-4 and the remainder (15.9%) are under the age of 2. (A COVID-19 vaccine is not being tested for those under the age of 6 months, but data were not available to disaggregate further by age).
  • Children under the age of 12 represent 14.6% of the U.S. population, ranging from 11.6% in Maine to 19.5% in Utah. The largest share of children under age 12 live in the South (39.1%), followed by the West (24.3%), Midwest (21.0%), and Northeast (15.6%).
  • About half (50.5%) of children under the age of 12 are children of color, including more than a quarter (25.8%) who are Hispanic. An additional 13.3% are Black, 4.7% are Asian, and the remaining 6.7% are American Indian or Alaska Native, Native Hawaiian or Other Pacific Islander, or multiracial (Figure 1). Some states have even larger shares of children of color. For example, in 5 states (Hawaii, New Mexico, the District of Columbia, California, and Texas), more than two-thirds of children under age 12 are children of color (Table 1). Over 4 in 10 children under age 12 are Hispanic in five states, including 60.4% in New Mexico and 52.0% in California. In 4 states, more than a third of children under age 12 are Black including 48.5% of children in DC and 42.8% of children in Mississippi. Over 1 in 10 children under age 12 are Asian in California (11.1%) and this share rises to nearly a quarter (22.6%) in Hawaii. Overall, children under age 12 include a larger share of people of color compared to the rest of the population (50.5% vs. 38.1%).
Distribution of Children Under Age 12 by Race/Ethnicity
  • Almost four in ten (39.4%) children under the age of 12 live in households with incomes below 200% of the Federal Poverty Level (FPL). This includes 17.5% living below poverty and 21.9% between 100-200% FPL. The remainder are split between households with incomes between 200-400% FPL (30.2%) and at or above 400% FPL (30.4%) (Figure 2). Some states have much higher shares of children living in low-income households, including 3 states with more than half of children under 12 living in households with incomes less than 200% FPL – Mississippi (53.3%), Arkansas (53.1%), and New Mexico (50.6%). In 13 states, more than one-fifth of children live below poverty (Table 2). Children under age 12 are more likely to be living in poverty compared to the rest of the population (17.5% v. 11.5%).
Distribution of Children Under Age 12 by Family Poverty Level
  • Finally, while the majority of children under the age of 12 have health coverage, including 4 in 10 (39.8%) who are covered by Medicaid, 5.0% are uninsured (Figure 3). Because of broader Medicaid coverage, the uninsured rate for children under age 12 is nearly half that of those 12 and older (9.9%). Similar shares of children under age 12 and the rest of the population have private coverage.
Distribution of Children Under Age 12 by Insurance Status

Implications

Overall, these data show that children under age 12 account for a sizeable share of the population, suggesting that achieving a high vaccination rate among this group will not only be important for protecting them against infection and illness but can also help boost the country’s overall vaccination rate, facilitating efforts to contain the spread of the virus.

The data further show that children in this age group are more racially diverse than those older than age 12 and include a particularly high share of Hispanic children. They also are more likely than their older counterparts to be living in low-income or poor households. As such, success vaccinating this group may help to reduce racial disparities in overall vaccination rates for Black and Hispanic people. However, these data also highlight the importance of prioritizing equity when vaccinations begin for children under age 12 and focusing on reducing barriers to vaccination that disproportionately affect people of color and low-income people, such as concerns about missing work, transportation challenges, and/or other logistical barriers or information gaps.

Finally, an added challenge to vaccinating children in this age group is that a large share live in the South and in other states where vaccination rates are lowest. Direct outreach to parents in these states to address their questions and concerns about the vaccine will be important, as will working with pediatricians and family physicians to provide trusted information to parents and to administer vaccines. Schools will also likely play an important role in providing information and outreach to parents, and in some cases offering or requiring vaccination, particularly for those parents who say they want to wait and see or will only vaccinate their child if schools require it.

Table 1: Distribution of Children Under Age 12 by Race/Ethnicity
Table 2: Distribution of Children Under Age 12 by Family Poverty Status

Methods

Population totals are all sourced from the Census Bureau’s 2019 Population Estimates: Annual Estimates of the Resident Population by Single Year of Age and Sex for the United States: April 1, 2010 to July 1, 2019 (NC-EST2019-AGESEX-RES), available here: https://www.census.gov/data/tables/time-series/demo/popest/2010s-national-detail.html. Demographic, insurance, and geographic measures are sourced from KFF’s analysis of the 2019 American Community Survey (ACS), 1-Year Estimates. The population totals using ACS total to 46.6 million under age 12. This difference is likely attributed to children having missing income-to-poverty ratios, which are needed to create households within the data. For more information on our methodology to create households within the ACS data, see: https://www.kff.org/report-section/the-coverage-gap-uninsured-poor-adults-in-states-that-do-not-expand-medicaid-technical-appendix-a-household-construction/.

News Release

Lacking Dental Coverage, Many People on Medicare Forgo Dental Care, Especially Beneficiaries of Color

Analysis Takes In-Depth Look at Dental Benefits Provided by Medicare Advantage Plans, the Leading Source of Dental Coverage for Medicare Beneficiaries

Published: Jul 28, 2021

Many people enrolled in Medicare go without dental care, especially beneficiaries of color, according to a new KFF analysis of dental coverage and costs for people with Medicare.

Almost half of all Medicare beneficiaries (47%) did not have a dental visit within the past year as of 2018, the analysis finds, with rates higher among those who are Black (68%) or Hispanic (61%) compared to White beneficiaries (42%). Rates were also higher among those who have low incomes (73%), or who are in fair or poor health (63%). The data pre-date the onset of the coronavirus pandemic and do not reflect the slump in health care utilization during the public health emergency.

One reason Medicare beneficiaries do not seek care is a lack of insurance. Nearly half of all people with Medicare (47%) did not have dental coverage, as of 2019. The others got it through Medicare Advantage (29%), private insurance (16%) and Medicaid (8%).

The analysis also finds that beneficiaries can face significant out-of-pocket costs when they do seek care. Average out-of-pocket spending among Medicare beneficiaries who used any dental services was $874 in 2018, the analysis finds. One in five beneficiaries spent more than $1,000, including one in ten who spent more than $2,000.

The findings come at a time when Senate Democrats are seeking to add a standard dental, vision and hearing benefit to Medicare, as part of a sweeping $3.5 trillion budget reconciliation package. If it makes it through Congress, it would be the largest expansion of Medicare benefits since the inception of Part D prescription drug coverage in 2006.

The new analysis also provides an in-depth look at the scope of dental benefits available to people enrolled in Medicare Advantage plans, which have become the leading source of dental coverage among Medicare beneficiaries.

In 2021, 94 percent of Medicare Advantage enrollees in individual plans are in a plan that offers access to some dental coverage. The scope of coverage varies widely across these plans. Most Medicare Advantage enrollees with access to dental coverage have preventive benefits, such as cleanings, and access to more extensive dental benefits for services such as extractions and root canals that typically require 50 percent coinsurance for in-network care, and are subject to an annual dollar cap, the analysis finds. The average annual cap on dental benefits is about $1,300 in 2021.

Among the factors policymakers likely will consider in determining whether to add a dental benefit to Medicare are the scope of covered benefits, the amount of beneficiary cost sharing for specific services, and the impact on overall Medicare spending and premiums.

For more data and analyses about Medicare and dental coverage, visit kff.org