Recent State Actions Related to Immigrants’ Access to Services and Immigration Enforcement

Published: Jun 16, 2026

During the 2025 and 2026 legislative sessions, states enacted or proposed a range of legislation that will impact immigrants’ access to state-funded health coverage and other services as well as actions related to how states may enhance or limit federal enforcement activities. Several states have rolled back or plan to scale back state-funded health coverage programs for immigrants to reduce budget deficits amid economic uncertainties. Some states have also enacted laws to support the Trump administration’s increased interior immigration enforcement activities, including sharing data from Medicaid or other state agencies with federal enforcement officials. In contrast, some states are expanding access to health coverage or other benefits for immigrants, including lawfully present immigrants losing eligibility for federally funded health coverage under the 2025 reconciliation law, and/or enhancing protections for immigrants. While some states are seeking to enhance protections for immigrants, the Trump administration signed an executive order directing federal agencies to suspend federal grants and contracts with states or local jurisdictions identified as obstructing enforcement of federal immigration laws, or “sanctuary jurisdictions.” So far federal challenges to state and local sanctuary jurisdictions have largely failed. However, the federal stance may limit state or local actions.

This brief summarizes recent and proposed actions by states related to access to state-funded health coverage and other services for immigrants and immigration enforcement activity during the 2025 and 2026 legislative sessions. It reflects activity as of June 2026 based on KFF analysis of publicly available materials and the National Conference of State Legislatures’ Immigration Legislation Database. Several state legislatures were still in session as of June 2026, so additional actions may be taken during the 2026 session that are not reflected here. Additionally, states may have implemented similar policies prior to their 2025 legislative session that are not included.

Access to State-Funded Health Coverage and Other Services

As of June 2026, six states, including DC, have recently eliminated, reduced, or plan to scale back state-funded health coverage for immigrants due to budget pressures. Economic uncertainties and federal funding reductions that may reduce state revenues and the rising costs of health care and social services have driven states across the country to consider measures to reduce spending. Some states have eliminated or plan to eliminate coverage for some adults in their state funded coverage programs for immigrants, including Illinois, Minnesota, and DC. Several states have closed enrollment or reduced enrollment caps or income eligibility limits for some adults in their state-funded programs for immigrants, including California, Colorado, DC, and Washington. In California, some adults remaining in the program will face cuts to dental benefits and new premiums, and the governor has proposed implementing work requirements and more frequent six-month renewals, which would align with new Medicaid requirements under the 2025 reconciliation law, as well as further increasing premiums for some adults. A few states are reducing coverage for immigrant children and pregnant people. Colorado plans to cap enrollment and limit benefits for state-funded coverage for immigrant children and pregnant people beginning in January 2027. Additionally, North Carolina enacted a Medicaid funding bill in April 2026 that limited immigrant eligibility to coverage that the state is federally required to provide starting October 1, 2026. This would eliminate the state’s optional Medicaid coverage for lawfully residing children and pregnant women without a five-year wait. However, the governor has called for the state legislature to reinstate this coverage and some state legislators have indicated that the coverage cut was unintentional. These program reductions will likely have negative impacts on health care access and outcomes as research suggests that coverage expansions for immigrants are associated with lower uninsured rates and improved access to care.

In contrast, three states have plans to expand state-funded coverage to fill gaps in benefits that will be created by the 2025 reconciliation law eligibility restrictions for lawfully present immigrants. New Mexico plans to use state funds to cover Deferred Action for Childhood Arrivals (DACA) recipients who have already been ineligible for federally funded health coverage and lawfully present immigrants who will lose Medicaid, subsidized Affordable Care Act (ACA), and Supplemental Nutrition Assistance Program (SNAP) benefits under the 2025 reconciliation law. New York plans to use state funds to cover lawfully present immigrants losing Medicaid coverage and federally-subsidized health coverage through its Essential Plan. Under a longstanding court ruling, New York is required to provide state-funded coverage to lawfully present immigrants who would be eligible for Medicaid except for their immigration status. Additionally, Washington increased funding for the state-funded Food Assistance Program, which provides the same benefits as SNAP, in order to provide assistance to lawfully present immigrants who were eligible for SNAP benefits prior to the 2025 reconciliation law changes. California governor’s 2026-27 budget proposes using state funds to continue providing nutrition assistance to immigrants who were eligible for state-funded assistance prior to the 2025 reconciliation law and to offer assistance to income-eligible individuals age 55 and older regardless of immigration status starting October 1, 2027.

As of June 2026, some states have enacted legislation that would limit immigrant access to certain other benefits. In 2025, Idaho enacted legislation that decreases the maximum income refugees can earn to remain eligible for the Refugee Medical Assistance program from 150% to 133% of the federal poverty level. Idaho also enacted legislation preventing undocumented immigrants from accessing certain public benefits that were previously exempt from immigration status verification, including publicly funded vaccinations, communicable disease testing, prenatal and postnatal care, crisis counseling, and food assistance for children. Florida enacted legislation that made undocumented immigrants ineligible for in-state tuition rates at the state’s public universities as of July 2025. Tennessee enacted legislation that will hold churches and charitable organizations liable for providing housing aid to immigrants without legal status who commit crimes.

In contrast, several states have enacted legislation to coordinate or increase access to benefits and services for certain immigrants, including refugees, military members, youth, and aging immigrants. In 2025, Massachusetts enacted legislation requiring resettlement agencies to coordinate the provision of services to immigrant and refugee families and pregnant women. New York enacted legislation to direct its Military Immigrant Family Legacy Program to connect noncitizen military members and their families to immigration legal assistance. Utah created a new Refugee Services Office to coordinate services and benefits available to refugees. California will fund legal counsel for certain noncitizen immigrant youth and direct the state’s Department of Aging to identify recommendations to support older and aging immigrants.

Some states have taken action to protect or facilitate immigrants’ access to educational opportunities. In 2025, Oregon enacted legislation exempting asylum seekers enrolled in the state’s public universities from paying non-resident tuition and fees, and Colorado passed legislation that removed a requirement for immigrants to attest that they have applied or will apply for lawful presence when applying for in-state tuition at the state’s public universities. Oregon also enacted legislation in 2026 that would prevent school boards from declining to admit immigrant children due to their immigration status and adds immigration status as a protected class under anti-discrimination law. New York and Virginia enacted legislation protecting the right to education regardless of immigration status, with Virginia also prohibiting discrimination against students based on immigration status.

Several states have also passed legislation to enhance immigrants’ access to the workforce, including the health care workforce. Washington and Oklahoma enacted legislation in 2025 that would allow international medical graduates to practice in health care facilities in certain situations. An executive order by Washington’s governor also established a state Office of Equity to support coordination between state agencies responsible for implementing services for immigrants, including education, entrepreneurship, licensing, and workforce training. Hawaii and Rhode Island created a pathway for certain foreign medical school graduates to receive medical licensure, and Maine enacted legislation to direct the state to identify alternative pathways for foreign dentists to receive licensure. Wisconsin repealed restrictions on DACA recipients from working in jobs that require professional licensure, such as nursing. New Mexico established a New Americans division in the state Workforce Solutions Department to assist with expanding educational, workforce training and other initiatives for immigrants and to study their economic impact on the state.

Immigration Enforcement and Data Sharing

Several states have enacted legislation or executive orders to enhance immigration enforcement activities, building on state actions taken in prior years and multiple Trump administration executive orders directing federal agencies to take punitive actions against states and cities that limit cooperation with federal immigration enforcement. For example, Florida and Indiana passed legislation in 2025 that enhances criminal penalties for undocumented immigrants who are convicted of certain crimes. In 2026, Idaho passed legislation that would make it a state crime for noncitizens to enter or remain in the state after violating federal immigration laws, and Tennessee added a criminal penalty for someone who remains in the state after receiving a federal deportation order. Some states have prohibited localities and state entities from implementing policies that would limit cooperation with federal immigration enforcement authorities for civil immigration law violations, often referred to as sanctuary policies, including North Dakota, New Hampshire, Indiana, and Mississippi. Additionally, some states passed legislation to promote cooperation with federal immigration enforcement. New legislation in Kansas allows local law enforcement to enter into agreements with federal immigration enforcement authorities without local approval. Legislation in Mississippi directs the state’s Department of Public Safety to identify the number of undocumented immigrants residing in the state and requires all local detention facilities to enter into agreements with federal immigration enforcement. Governor executive orders in Texas and Nebraska also direct law enforcement and state agencies to cooperate with federal immigration enforcement.

Some states have implemented increased immigration verification requirements for driver’s licenses and voting, continuing earlier trends of driver’s licensure laws impacting immigrants. For example, Wyoming enacted legislation in 2025 invalidating driver’s licenses held by undocumented immigrants that were issued out-of-state, and Tennessee enacted legislation to publish lists of out-of-state driver’s licenses issued to undocumented immigrants that would be invalid in Tennessee. States have also enacted legislation related to voting. Legislation in Kansas creates a database of noncitizens holding driver’s licenses that would be cross-referenced with voter registration rolls to identify ineligible voters, and Alabama prohibits foreign driver’s licenses from being used as voter identification. Several states, including Mississippi, South Dakota, and Wyoming, enacted legislation since 2025 that would allow the state to verify immigration status during voter registration either by using the Department of Homeland Security’s (DHS) Systematic Alien Verification for Entitlements (SAVE) system or by requiring applicants to provide documentation of citizenship. 

In addition to enhanced enforcement and verification measures, several states have also implemented new requirements for state agencies to share data on immigrants with federal immigration enforcement officials or statewide databases. Missouri enacted legislation in 2025 that requires law enforcement to include the citizenship or immigration status of anyone arrested in reports submitted to the statewide crime reporting system, building on the Missouri governor’s executive order earlier in the year to expand analysis of crimes committed by undocumented immigrants. In 2026, Indiana, Louisiana, North Carolina, Tennessee, and Wyoming enacted legislation and Oklahoma’s governor issued an executive order requiring state agencies to report applicants or recipients of Medicaid and/or other public benefits whose immigration status could not be verified and/or who were verified to not have lawful presence to DHS or other federal authorities, or in the case of Tennessee, to a central state immigration enforcement agency. In Indiana and Wyoming, reporting may also include applicants’ household members determined to not be lawfully present. Tennessee also makes it a crime for government employees to not report undocumented immigrants to the central state immigration enforcement authority, and local governments could lose state funding if the state determines that they are not complying with state law.

In contrast, some states have enacted legislation and executive orders to limit federal immigration enforcement and/or collection or sharing of data for immigration enforcement purposes in certain settings, such as health care facilities and schools. California, Colorado, Maryland, New Jersey, New York, and Oregon have enacted legislation limiting civil immigration enforcement activity in “sensitive locations,” such as schools, health care facilities, libraries, courthouses, and places of worship. These state actions respond to a prior federal policy limiting federal immigration enforcement in sensitive areas that was eliminated by the Trump administration. New York’s legislation also prohibits local jails from detaining individuals on civil immigration charges. Illinois enacted legislation that bans civil immigration enforcement inside and near public areas such as state courthouses, hospitals, and colleges. California, Illinois, New Jersey, and Oregon enacted legislation requiring health care facilities to treat immigration status as protected health information, which would limit sharing personal data for immigration enforcement purposes, and to set protocols for when immigration enforcement officers appear on hospital grounds. Oregon also prohibits hospitals from retaliating against employees who share information about immigration legal services with patients. Rhode Island enacted legislation prohibiting health care facilities from asking patients about their immigration status or for proof of lawful presence in the U.S. Illinois and Oregon enacted legislation requiring school districts and colleges to develop an alert system to notify students and parents if federal agents appear on school property, and Connecticut and Delaware enacted legislation requiring every school to have a designated administrator and plan for interacting with federal immigration authorities and prohibiting public schools from sharing student information without a warrant. Pending court cases have challenged state policies asserting that they conflict with federal law, but recent federal actions against these states and local jurisdictions have not survived legal challenges.

Some states have also taken action to limit state agencies or localities from entering into enforcement agreements and/or data sharing for federal immigration enforcement purposes. Colorado, Illinois, New Jersey, and Oregon enacted legislation that prohibit state agencies from collecting immigration status information unless required by law, and from disclosing personally identifying information for federal immigration enforcement purposes. Oregon also enacted legislation barring landlords from collecting immigration status information from rental applicants or tenants and from disclosing confidential information with very limited exceptions. Vermont enacted legislation that would prohibit state agencies from entering into agreements with federal immigration enforcement without the governor’s approval. Maryland, New Mexico, and New York enacted legislation that prohibit local entities from creating agreements with federal immigration enforcement. Maryland also enacted legislation prohibiting local correctional facilities from notifying federal immigration enforcement about certain immigrants in their custody and legislation prohibiting state and local agencies from sharing certain personal information with individuals or agencies involved in civil immigration enforcement. Governor executive orders in Massachusetts and New Jersey would also limit state engagement with federal immigration enforcement. An executive order by Washington’s governor directed state agencies to ensure compliance with previously enacted state law, which limits state agencies from collecting immigration status data and from disclosing non-public personal information for federal immigration enforcement purposes, and created a new cross-agency office to coordinate the state’s response to matters such as immigrant data privacy.


The Business of Health with Chip Kahn

Bench to Bedside at AI Speed

June 16, 2026

Video

Audio

About this Episode


Episode 8, AI Series: How can AI determine who gets matched to new therapies, who is identified for clinical trials, and how patient tracking is scaled across large populations? Chip is joined by Dr. A.J. Blood, a practicing cardiologist at Brigham and Women’s Hospital and the co-founder and Chief Executive Officer of AIwithCare, a startup company that delivers AI-enabled solutions for research, clinical operations, and patient care. They discuss the role of AI in identifying patients for clinical trials and new therapies—which is typically a critical bottleneck in drug development—as well as how to ensure clinical trials are representative. Also, Dr. Blood shares insights from his extensive research background and the tool, RECTIFIER (RAG-Enabled Clinical Trial Infrastructure for Inclusion Exclusion Review), designed to enhance patient recruitment for clinical trials by efficiently sifting through complex medical data.

The Host


Headshot photo of Chip Kahn wearing a navy blue suit with a red tie, red pendant on lapel, and glasses.

Sr. Visiting Fellow

Charles N. Kahn III is a senior visiting fellow at KFF. He is also a visiting senior fellow at the American Enterprise Institute and a nonresident senior scholar at the University of Southern California’s Schaeffer Center for Health Policy & Economics. He serves as co-chair of the international Future of Health collaborative.

Guest


Co-founder and Chief Executive Officer, AIwithCare

Dr. Alexander J. “AJ” Blood is Co-founder and CEO of AIwithCare, a startup company that delivers AI-enabled solutions for research, clinical operations, and patient care. Additionally, he is a cardiologist and intensivist in the Cardiac Surgical Intensive Care Unit at Brigham and Women’s Hospital, where he serves as the associate director of the Accelerator for Clinical Transformation research group. Dr. Blood also serves as the director of the Cardiac Intensive Care Unit at Newton-Wellesley Hospital. Board-certified in internal medicine, cardiovascular disease, critical care medicine, and obesity medicine, Dr. Blood is an instructor of medicine at Harvard Medical School.

Dr. Blood completed his residency in internal medicine at Duke University and fellowships in cardiovascular disease and critical care medicine at Brigham and Women’s Hospital. He earned his medical degree from the Donald and Barbara Zucker School of Medicine at Hofstra/Northwell. Additionally, he holds a Master of Science degree from Harvard University and a Bachelor of Arts degree from Johns Hopkins University.

Resources


SERIES

This weekly podcast features insightful conversations between host Chip Kahn and his guests, who discuss the business of health care, connecting the dots between the health care business, policy, and patients.

The podcast’s first series on AI in health care illuminates how AI is changing health care, and features guests who are deploying this technology, managing its consequences, and designing policy around it.

Forthcoming Policy Changes to Medicaid State Directed Payments

Published: Jun 15, 2026

The 2025 reconciliation law reduced federal Medicaid spending by an estimated $911 billion from 2025 through 2034, some of which stems from new restrictions on Medicaid state directed payments (SDPs) for hospital and other health care services. While states are generally prohibited from directing how managed care organizations (MCOs) pay for care, states can implement SDPs that require MCOs to increase rates or set minimum rates for specified Medicaid services. In authorizing SDPs, the Centers for Medicare and Medicaid Services (CMS) aimed to help states improve access to care and provider participation. Many states that contract with MCOs use SDPs to make uniform rate increases that function like supplemental payments in fee-for-service (FFS) Medicaid.

This issue brief describes SDPs and forthcoming policy changes stemming from the 2025 reconciliation law and the proposed regulation to implement those requirements and make other changes. A companion issue brief describes states’ current spending on SDPs before those policy changes take effect.  Key takeaways include:

  • In 2016, CMS established SDPs and their use has grown since, contributing to higher federal Medicaid spending.
  • A 2024 rule on Medicaid managed care spurred additional spending on SDPs but also established new restrictions on how states could pay MCOs to implement them.
  • The 2025 reconciliation law established new limits on SDPs, capping them at or near Medicare rates.
  • CMS released a proposed rule in May 2026 to implement the SDP provisions in the law and included several provisions that would expand the scope of new limits on SDPs, estimating that implementing the changes would reduce federal spending by $510 billion between 2026 and 2034.
  • CMS’ estimated reductions in federal spending exceed those of the Congressional Budget Office (CBO) that accompanied the 2025 reconciliation law, but differences reflect variation in data and timing in addition to provisions that would expand the scope of SDP limits.

It is unknown how states and providers will respond to the new limits on SDPs and FFS Medicaid in the reconciliation law and accompanying rule. States may try to offset reductions in SDPs with increases in base payment rates, but offsetting reductions may be challenging due to other Medicaid financing changes (like limits on provider taxes) and more tenuous fiscal conditions. Some financially vulnerable providers could be forced to close or curtail services with less revenue from Medicaid, particularly if there are revenue losses from increases in the number of people without health insurance coming from Medicaid work requirements and reductions to Affordable Care Act premium subsidies. Other providers may be able to absorb reduced payments without changes to quality or access because research—including by KFF—suggests that average commercial rates are much higher than Medicare, reflecting consolidation in provider markets and constrained Medicare rates. However, providers that serve primarily Medicaid enrollees often have lower operating margins and may be more financially vulnerable than other providers, suggesting that safety net providers may be especially affected by the reduced revenues.

What are state directed payments (SDPs)?

The Centers for Medicare and Medicaid Services (CMS) established SDPs in 2016, allowing states to put in place requirements governing MCO payments to providers. States may use SDPs to require MCOs to adopt minimum or maximum payment rates for providers, provide uniform dollar or percentage increases to providers that supplement base payment rates, or implement value-based payment arrangements. The most common type of SDPs requires uniform rate increases that function similarly to supplemental payments in FFS Medicaid. Uniform rate increases instruct MCOs to make payments on top of their regular payment rates. They, along with SDPs that establish minimum or maximum fee schedules, require the state to specify a “benchmark.” Benchmarks are standardized rates to measure MCO rates relative to other payment rates such as Medicaid FFS, Medicare FFS, or average commercial rates. Since they were introduced in 2016, SDPs have become a core component of provider reimbursement in Medicaid (see Appendix for a timeline of SDP history).

A 2024 rule on Medicaid managed care spurred changes in SDP policy and higher federal spending on SDPs. Before 2024, there was no official cap on the total payment rate that accounted for base rates and SDPs, but CMS noted in the May 2026 proposed rule that it determined to use average commercial rates as the unofficial payment limit starting in 2018. The 2024 rule on Medicaid managed care codified the average commercial rate limit for hospital services, nursing facility services, and professional services at academic medical centers. CMS also indicated that it would continue applying the average commercial rate limit to other providers. Formalizing the payment limit for SDPs at average commercial rates likely increased states’ awareness of the limit and their confidence that SDPs at that level would be permitted to continue moving forward. As a result, the number of SDPs pegged to average commercial rates, and spending on those SDPs, increased after CMS released the final rule.

The 2024 rule also required states to incorporate all SDPs into their capitation rates (e.g., premium payments to MCOs) instead of using separate payment terms, which provide additional payments outside of the capitation rates. The change moves these payments from predictable, separate payments to more complex, risk-based arrangements, which may reduce states’ ability to target reimbursement for specific provider types. CMS eliminated separate payment terms due to concerns that the separate payments undermine the risk-based nature of managed care and are frequently driven by the financing of the non-federal share. MACPAC analysis found that over half of SDP arrangements approved between February 2023 and August 2024 were incorporated through separate payment terms.

Use of SDPs that paid providers with average commercial rates had been growing prior to the 2024 final rule and continued after CMS’ informal practice was codified. Tying payments to average commercial rates—which are substantially higher than the Medicare payment ceiling used for other Medicaid FFS supplemental payments—aimed to help Medicaid attract a broader network of providers and to ensure robust access to care for Medicaid enrollees. However, the new payments to health care providers resulted in higher Medicaid spending. In June 2024, the Congressional Budget Office (CBO) updated its Medicaid spending projections for 2025-2034 to reflect a 4% (or $267 billion) increase, with half of the increase attributed to expected growth in SDPs (driven in part by CMS’ projections in the final rule).

What changes to SDPs were included in the 2025 reconciliation law and CMS’ proposed regulations?

The 2025 reconciliation law created new payment limits for SDPs for four services, capping them at or near Medicare rates instead of average commercial rates. The law specified that the new limits would apply to inpatient and outpatient hospital services, nursing facility services, and professional services at academic medical centers. Under the limits, the total payment amount under the SDP may not exceed 100% of the Medicare payment rate in states that have adopted the Affordable Care Act (ACA) Medicaid expansion (“expansion states”) and 110% of the Medicare payment rate for non-expansion states. Payment rates for services without an applicable Medicare payment rate are limited to Medicaid fee-for-service rates. Certain SDPs are initially grandfathered (e.g., allowed to continue) but the total spending amount will be reduced by 10 percentage points each year (starting January 1, 2028) until they reach the allowable Medicare-related payment limit. At the time the bill was passed, the CBO estimated that revising the payment limit for SDPs would reduce federal Medicaid spending by $149 billion between 2025 and 2034.

CMS released a proposed rule in May 2026 to implement the SDP provisions in the law and included several provisions that would expand the scope of new limits on SDPs. The list below highlights some of the key provisions governing SDPs included in the proposed rule:

  • Expanded scope of services. The 2025 reconciliation law specified that new limits applied to hospital services, professional services at academic medical centers, and nursing facility services. The proposed rule would apply the new payment limits to all services.
  • Applicable in territories. The 2025 reconciliation law only applied to the 50 states and D.C., but the proposed rule would also apply to the territories. In FY 2025, Puerto Rico had four SDPs approved, which were projected to account for $131 million in federal Medicaid spending.
  • Eliminates uniform rate increases. The 2025 reconciliation law established new ceilings on SDP payment limits but did not prohibit certain types of SDPs from being used. The proposed rule would eliminate uniform rate increases in future years, the most common type of SDP. It is unclear whether it will be possible for states to transition uniform rate increases to other types of SDPs, such as minimum or maximum fee schedules. When combined with the elimination of separate payment terms from the 2024 rule, this change effectively precludes states from using SDPs to provide supplemental payments in managed care that parallel arrangements in FFS.
  • Phase-down of grandfathered SDPs. Starting with the first rating period after January 1, 2028, the proposed rule would reduce the total approved payment amount in grandfathered SDPs by 10% each year until they comply with the new limits in the 2025 reconciliation law. For example, if an SDP was approved at $1 billion, the first year’s decrease would be at least $100 million (unless the Medicare limit is reached in year 1 with a decrease of less than $100 million). This will cause some SDPs (particularly benchmarked to higher payment rates) to come into compliance somewhat earlier than if the SDP payment rate had been reduced by 10 percentage points (relative to Medicare rates) each year.

Beyond expanding the scope of new limits on SDPs, CMS’ proposed rule makes parallel changes for FFS payments that target specific providers. The proposed rule aims to align payment requirements across delivery systems by applying the Medicare-based payment limits for SDPs to some FFS payments (which govern all provider payments, not only supplemental payments). The new limits would apply to payments that target specific providers such as physicians, dentists, emergency and non-emergency medical transportation providers, and other licensed professionals. The new limits would not apply to payments that are already governed by other limits (e.g., upper payment limit rules). Those requirements would take effect for the first state fiscal year beginning on or after January 1, 2029.

The proposed rule also specifies the basis for new payment limits in SDPs and in FFS Medicaid payments that target specific providers.  Both types of payment limits would apply on a per-service (or per-discharge) basis, rather than being calculated in aggregate using an upper payment limit-like approach. Where possible, states would be required to use the published Medicare payment rates, drawing from the Medicare physician fee schedule, the hospital inpatient and outpatient prospective payment systems, and the skilled nursing facility prospective payment system. For providers who are paid based on their costs, such as critical access hospitals, cancer hospitals, and freestanding hospitals; states are instructed to use the Medicare cost reports as Medicare does.

Although most of the limits would be calculated similarly in SDPs and in targeted FFS Medicaid payments, there are some small differences. The most notable difference occurs when there are no Medicare payment rates available, as occurs for services that Medicaid covers but Medicare does not. In such instances, SDP payments would be limited to Medicaid FFS rates, which include rates established by 1115 waivers but exclude any supplemental payments. For FFS payments targeting specific providers, states would be required to develop methods for identifying reasonably comparable Medicare rates, which would then be the basis for the payment limit.

How might forthcoming changes affect federal spending on SDPs in the future?

In its May 2026 proposed rule, CMS estimates that SDP changes would reduce federal Medicaid spending by $510 billion between 2026 and 2035. Several factors contribute to the differences between CMS estimates and CBO’s estimate of limiting SDPs in the 2025 reconciliation law (which was $149 billion through 2034).

  • The CMS estimates account for SDPs in preprints available through December 31, 2025. During the 2025 calendar year, many states submitted new SDP proposals (some of which were submitted during deliberations on the reconciliation bill in anticipation of future restrictions). CMS posted many newly approved SDPs after the reconciliation law was enacted, some of which were posted 6 to 12 months after their start date. As a result, there are more SDPs in place than was known during deliberations over the 2025 reconciliation law.
  • The CMS estimates are through 2035. Most of the estimated reductions in federal spending on SDPs do not start until FY 2028. As a result, the period between 2026 and 2035 will have an additional year of substantive changes in SDP spending relative to earlier estimates.  In CMS’ year-by-year analysis, the estimated cuts to federal Medicaid spending from limiting SDPs are $81 billion in the year 2035, which would not have been included in the CBO analysis.

Beyond using different data and covering a different period, CMS provides estimates for some but not all specific provisions and policy decisions included in the rule. It is unknown how much the new provisions contribute to the cost difference because CMS did not itemize the effects of all decisions in the proposed rule. For example, one of the most significant decisions was to eliminate the option for states to use uniform rate increases in SDPs after the new limits are fully implemented. When combined with other policies (including the 2024 prohibition on separate payment terms), this change effectively eliminates the option for states to use SDPs to make supplemental payments in Medicaid managed care. The effects of this change interact with other policy changes (including changes to provider taxes) so it’s difficult to quantify how much this affected CMS’ estimates.

In some cases, the proposed rule describes how much certain decisions affected estimated spending reductions:

  • The biggest single change in dollar terms is the acceleration of grandfathering requirements which will bring SDPs into compliance with the new Medicare-related limits more quickly (estimated to increase the spending reduction by $17 billion over 10 years).
  • CMS estimated that extending the new limits on SDPs to services other than the four enumerated in the law would increase spending reductions by $3.5 billion over 10 years.

New limits on FFS payment rates could reduce federal spending by $1.5 billion over 10 years. CMS estimates that 25 states would have to amend state plans to come into compliance, and that the change would reduce federal Medicaid spending by $1.5 billion over 10 years. Although $1.5 billion seems small compared to the total reduction in federal Medicaid spending, the affected providers account for much smaller shares of overall Medicaid spending. As a result, there could be major implications for affected services in affected states.

This work was supported in part by Arnold Ventures. KFF maintains full editorial control over all of its policy analysis, polling, and journalism activities.

Appendix Figure: Timeline of SDP Policy Changes

Appendix Figure 1
News Release

Federal Medicaid Spending Through State Directed Payments Nears $100 Billion Annually Across 41 States, With New Limits Set to Reduce Funding to States  

KFF analysis shows hospitals have the most spending through state directed payments

Published: Jun 15, 2026

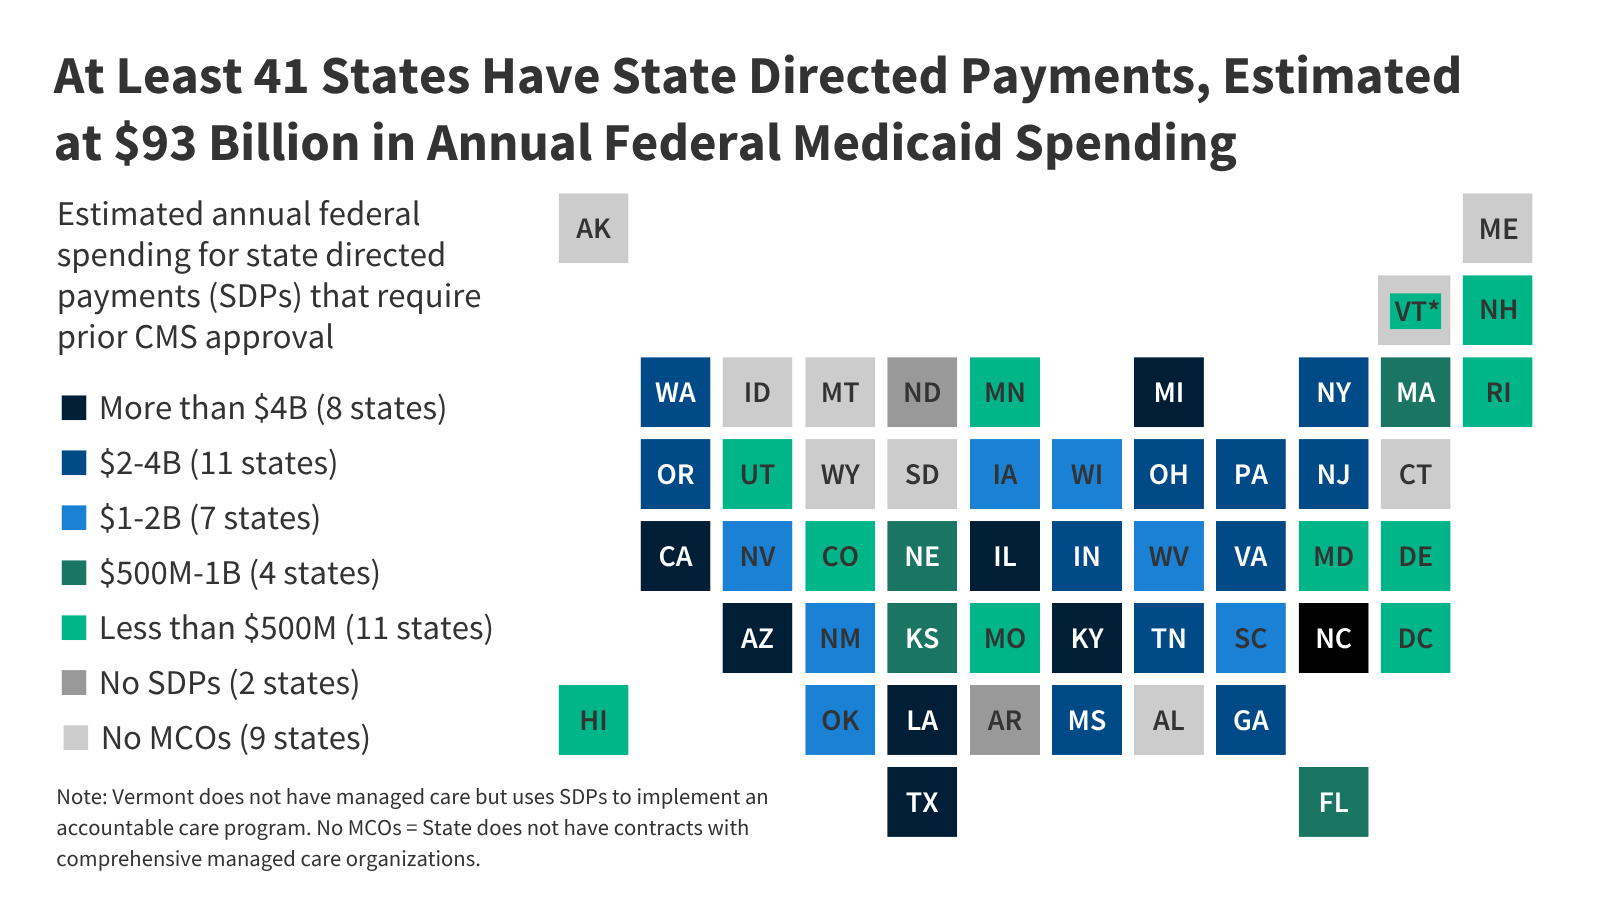
Forty states and DC currently receive $93 billion in annual federal Medicaid spending through state directed payments (SDPs) and may be at risk due to forthcoming limits on these payments, according to new KFF estimates. Annual federal spending on SDPs is highest in California (an estimated $10.6 billion)—followed by Texas ($6.3 billion), North Carolina ($5.2 billion), and Illinois ($5.1 billion). 

Map shows the estimated annual federal spending for state directed payments (SDPs) that require prior CMS approval. At Least 41 States Have State Directed Payments, Estimated at $93 Billion in Annual Federal Medicaid Spending.

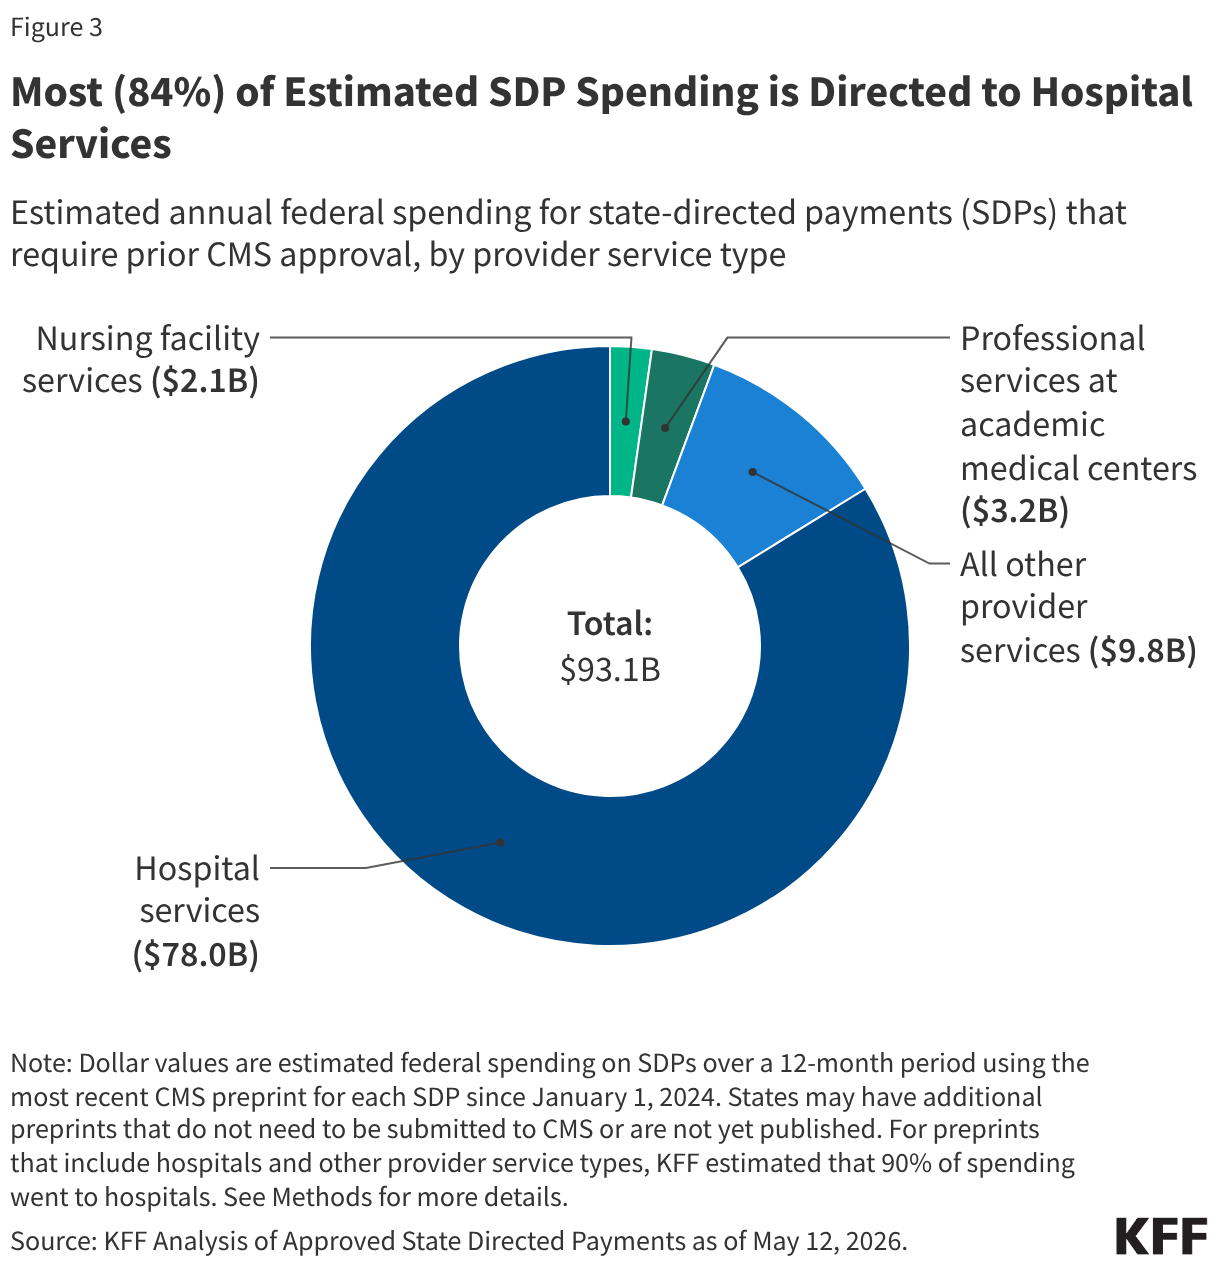
The vast majority of federal SDP spending (84%) covers hospital services, totaling an estimated $78 billion annually. Professional services at academic medical centers ($3.2 billion) and nursing facility services ($2.1 billion) account for the next-largest shares of federal SDP spending each year.

First established in 2016, SDPs allow states to direct how managed care organizations pay for services. They may take a variety of forms but most commonly require the managed care organization to make supplemental payments and specify a total payment rate. KFF estimates that 84% of SDP spending is currently benchmarked to commercial (or private) rates, which are notably higher than Medicare rates.

CMS started approving SDPs that linked payments to commercial rates in 2018 because the higher rates were seen as helpful to attracting a broader provider network and ensuring robust access to care. In 2024, a rule on Medicaid managed care codified the payment limit for SDPs at average commercial rates but also spurred additional spending on them as states began pegging more SDPs to the average commercial rates.

Just over a year later, the 2025 reconciliation law established new limits on SDPs, capping payment rates at or near Medicare levels instead of average commercial rates. These new limits will reduce payment rates for Medicaid services in affected states, with the largest effects expected to be on hospitals since they account for the majority of SDP spending. In May, the Centers for Medicare and Medicaid Services (CMS) issued a proposed rule that would expand the scope of the law’s limits on SDPs, according to KFF’s explainer on the policy changes.

CMS estimates that SDP-related changes in both the reconciliation law and the proposed rule would reduce federal Medicaid spending by $510 billion between 2026 and 2035, with effects increasing in size each year.

How states and providers will respond to the new payment limits remains uncertain. States have limited options for offsetting the federal cuts because of other changes to Medicaid financing from the reconciliation law, including new restrictions on provider taxes.

The stakes are particularly high for financially vulnerable hospitals, which are more likely to include safety net providers that primarily serve Medicaid enrollees. Some hospitals could face pressure to close or reduce services, especially if uncompensated care increases because people lose Medicaid or coverage through the ACA marketplaces.

Spending on Medicaid State Directed Payments Before New Limits Take Effect

Authors: Alice Burns, Scott Hulver, Jessica Mathers, Robin Rudowitz, and Patrick Drake
Published: Jun 15, 2026

Editor’s note: Figure 3 and the corresponding text was corrected on August 7, 2026 to fix a data error.

The 2025 reconciliation law reduced federal Medicaid spending by an estimated $911 billion from 2025 through 2034, some of which stems from new restrictions on Medicaid state directed payments (SDPs) for hospital and other health care services. While states are generally prohibited from directing how managed care organizations (MCOs) pay for care, states can implement SDPs that require MCOs to increase rates or set minimum rates for specified Medicaid services. In authorizing SDPs, the Centers for Medicare and Medicaid Services (CMS) aimed to help states improve access to care and provider participation. Many states that contract with MCOs use SDPs to make uniform rate increases that function like supplemental payments in fee-for-service (FFS) Medicaid. This issue brief analyzes Medicaid spending by state on SDPs that require prior CMS approval to better understand the use of SDPs before new limits in the reconciliation law take effect. A companion issue brief provides more details about the forthcoming changes.

Using a sample of SDPs estimated to currently be in effect, the analysis includes 305 preprints from 41 states, from SDPs that were publicly available and approved from January 1, 2024 through May 12, 2026. Preprints are application forms which document how states direct Medicaid managed care plans to pay providers using SDPs. Preprints are the only national source of data on SDPs but are limited because there are gaps in data provided by the preprints (see Box 1 and Methods for more details).

KFF’s estimates of spending on SDPs are consistent with CMS’ estimates in the May 2026 proposed rule on SDPs. However, KFF estimates provide state-level data and other information not included in the proposed rule, use the most recently approved preprint for each SDP (instead of providing year-by-year estimates and projections), and include SDPs that were approved between January and May 2026 (which are not included in CMS’ analysis). This analysis finds that:

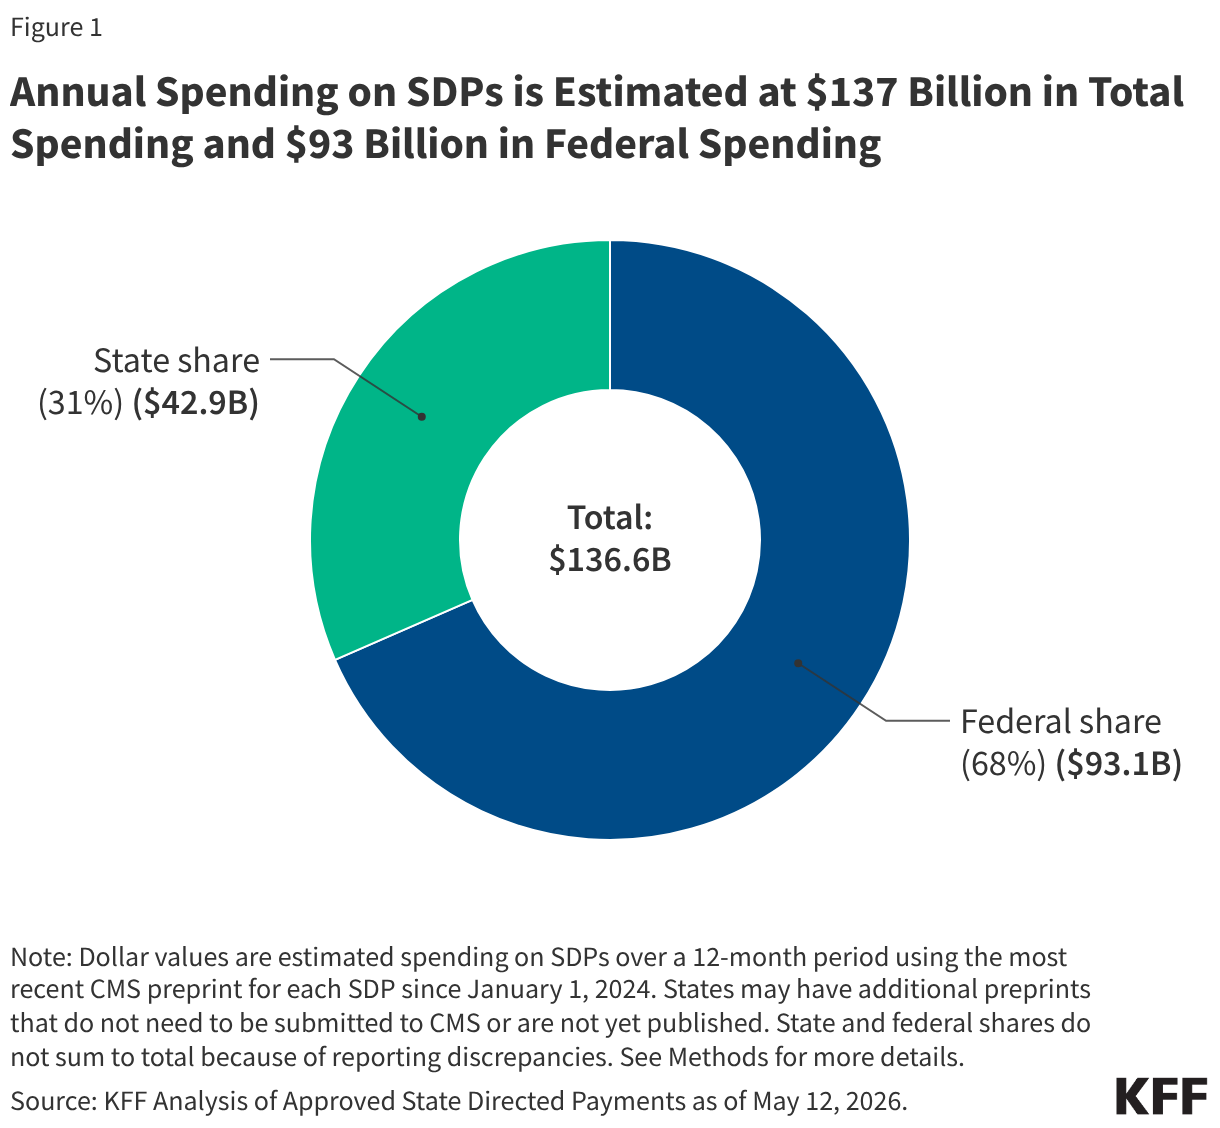
  • KFF estimates that annual spending on SDPs is $137 billion in total spending and $93 billion in federal spending.
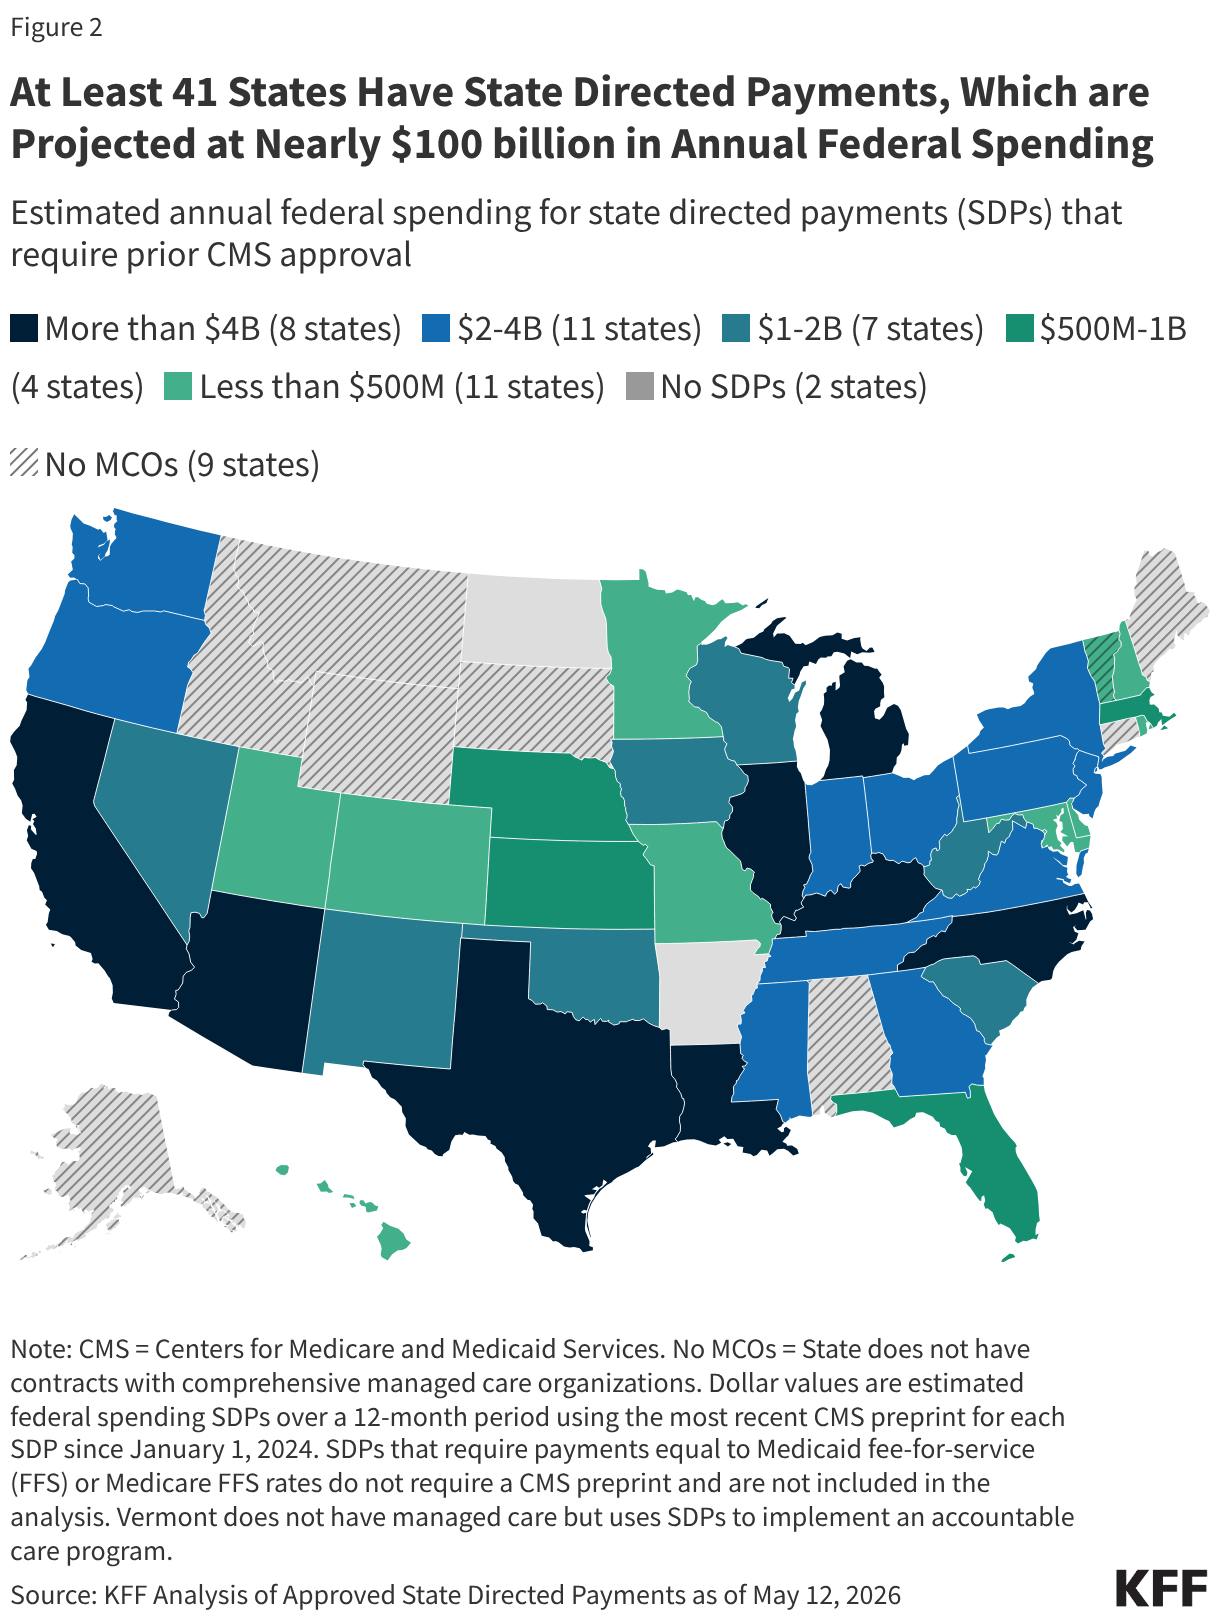
  • There are 41 states with SDPs in place (including the District of Columbia, which is hereafter referred to as a state), but the number, structure, and financial impact vary.
  • Most (84%) of estimated SDP spending is for hospital services.
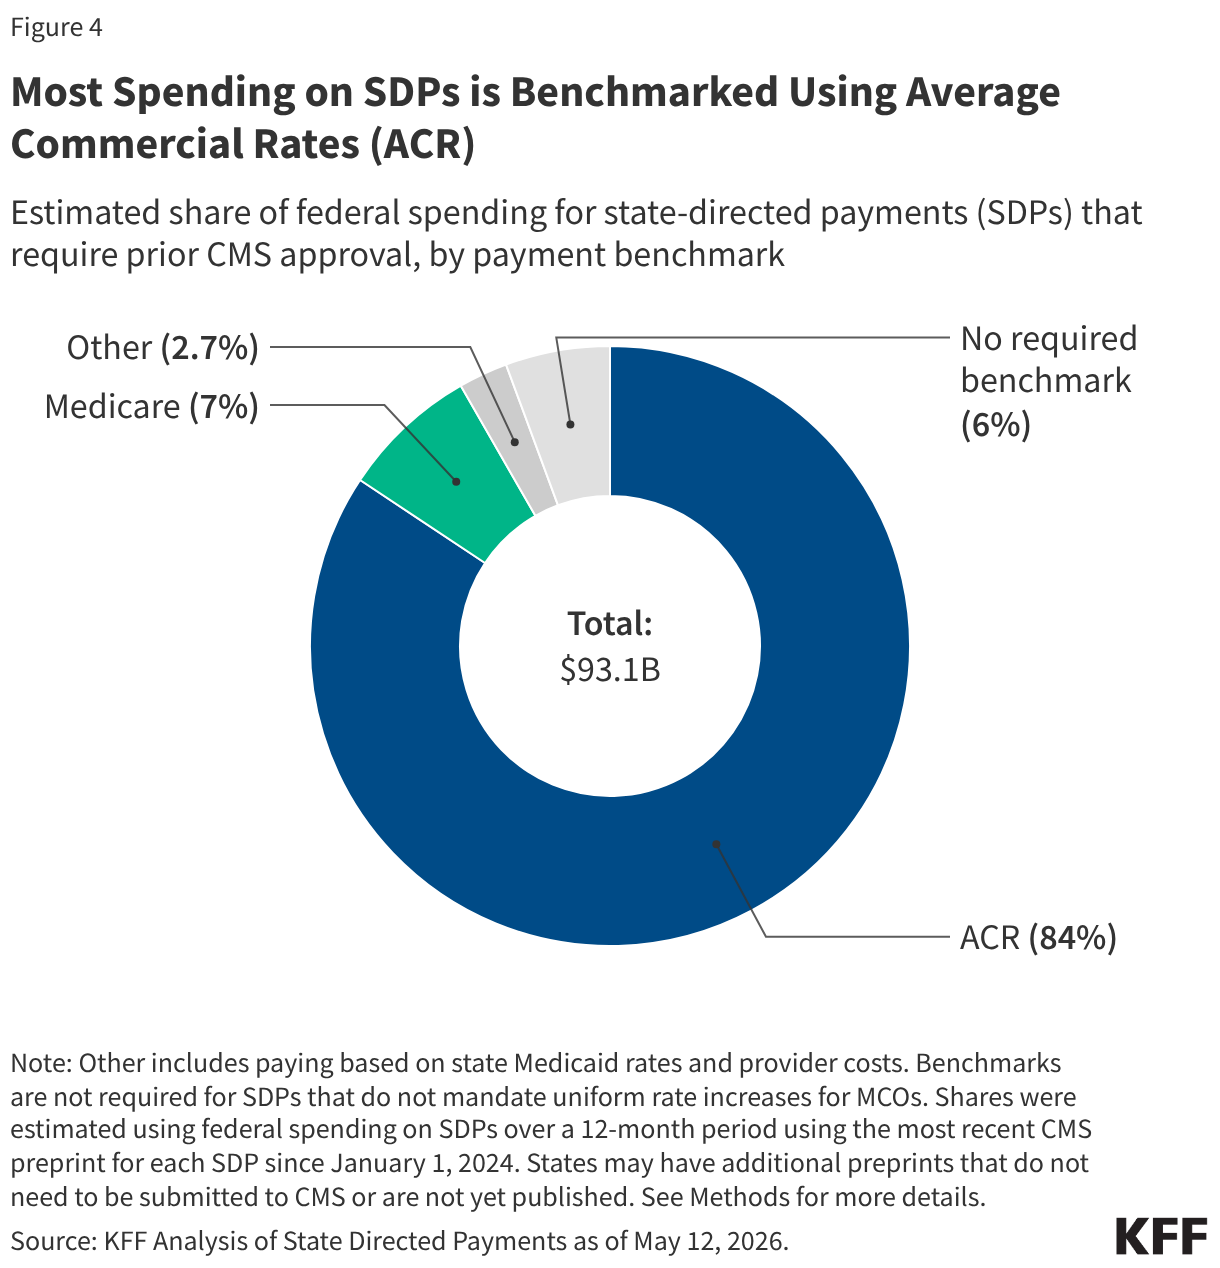
  • Most (84%) of estimated SDP spending is from SDPs that use commercial (private) payment rates as a basis for MCO payments, but data on specific payment levels are often not publicly available.

Much remains unknown about how forthcoming policy changes for SDPs will affect states, providers, and Medicaid enrollees, but data about existing SDPs highlights states and services for which changes could be most substantial.

Box 1. Gaps in Data Available to Analyze State Directed Payments (SDPs)

There are major gaps in the data available to analyze state directed payments (SDPs), which come from “preprints” (documents states submit to CMS outlining how SDPs will work and projecting future spending.) Regulations governing SDPs specify which types of payments require prior approval from CMS and which do not, and the information available through the preprints. Missing information stems from the following lack of certain information and exceptions to reporting requirements governing preprints (see Methods for how KFF handled missing information in the estimates).

  • When states require MCOs to use the state’s FFS payment rates or Medicare FFS payment rates as a basis for payment, they do not have to obtain prior approval from CMS or submit a preprint file to obtain that approval. (Preprints are required if payment rates use a Medicaid or Medicare benchmark but not the exact FFS payment rates.) It is unknown how many states have SDPs that equal FFS Medicaid or Medicare rates. Since the exemption for Medicare rates was only established in a 2024 rule (see Appendix Figure), some SDPs that use Medicare rates still show up in publicly available preprints.
  • Preprints include states’ projected estimates of what they will spend in the future as approved by CMS, but there is no source of information about what states spent. CMS issued guidance in March 2026 specifying that states must start reporting paid amounts in the Transformed Medicaid Statistical Information System (T-MSIS) by September 2026. It is unclear how comprehensive those data will be—most states currently do not report other types of supplemental payments in T-MSIS.
  • For preprints that span multiple types of services, states are not required to specify the projected spending by type of service.
  • States may provide some information in an addendum to the preprint rather than in the publicly available preprint form, and CMS has not published many preprint addendums, resulting in additional missing information. Some of the information that is most frequently placed in addendums relates to states’ specific payment rates and the details around how the state share of SDP spending is financed. For example, among 139 preprints in this analysis that included payments for hospital services (estimated at $80.3 billion in federal spending), the specific payment rate was missing or incomplete for 38 preprints (estimated at $41.4 billion in federal spending).

How much spending currently flows through SDPs?

Using a sample of preprints estimated to be currently in effect, KFF estimates that Medicaid is spending about $137 billion per year through SDPs. Based on states’ projected spending in the preprints, the federal government pays an estimated 68% ($93 billion) of the total, and the remainder is paid through the state share of SDP financing. The federal and state shares of financing are determined using the standard formulas for Medicaid financing and reflect the state’s federal matching assistance percentage, along with adjustments for some services and eligibility groups for which the federal government pays a higher rate. The state share of financing may come from a variety of sources including state general fund revenues, provider taxes, and intergovernmental transfers.

Annual Spending on SDPs is Estimated at 7 Billion in Total Spending and  Billion in Federal Spending (Donut Chart)

Financing for SDPs is often complex, and providers may pay for part of the state share of spending through provider taxes and intergovernmental transfers. States may finance the state share of Medicaid spending through provider taxes and intergovernmental transfers (such as transfers from public hospitals), which means those payments are not new revenues for the providers receiving them. In the proposed rule on SDPs, CMS reports that among current SDPs with payment rates above Medicare rates:

  • 40% are financed wholly or in part by intergovernmental transfers,
  • 27% are financed wholly or in part by provider taxes, and
  • 14% are financed wholly or in part by both intergovernmental transfers and provider taxes.

Combined, 81% of those SDPs are financed wholly or in part by intergovernmental transfers and provider taxes. In such cases, it is difficult to determine the amount of new revenues for health care providers. For that reason, KFF’s analysis focuses on changes in federal spending rather than changes in total spending.

How many states have publicly available SDPs?

Nearly all states with comprehensive managed care in Medicaid are estimated to use state directed payments, but the number, structure, and financial impact of these payments vary. Of the 42 states that contract with MCOs, all but two states (Arkansas and North Dakota) have approved SDPs that are estimated to still be in effect. (Arkansas has two approved SDPs for the 2022 rating period, but none have been approved since.)

Vermont does not contract with comprehensive, risk-based MCOs but does have an SDP to implement an accountable care organization program that is transitioning providers to value-based payments through Medicaid. Under the accountable care model, provider groups contract with state Medicaid agencies to assume accountability for the costs and quality of care. The Accountable Care Organization distributes payments to contracted providers in the way comprehensive MCOs pay contracted providers. In essence, the SDP functions similarly but is directing payments through an accountable care organization instead of through an MCO.

The number of SDPs and dollars spent through SDPs varies by state:

  • New Jersey and Ohio have the largest number of SDPs (28 and 20 respectively), while two states (Minnesota and West Virginia) and DC have one SDP each (data not shown).
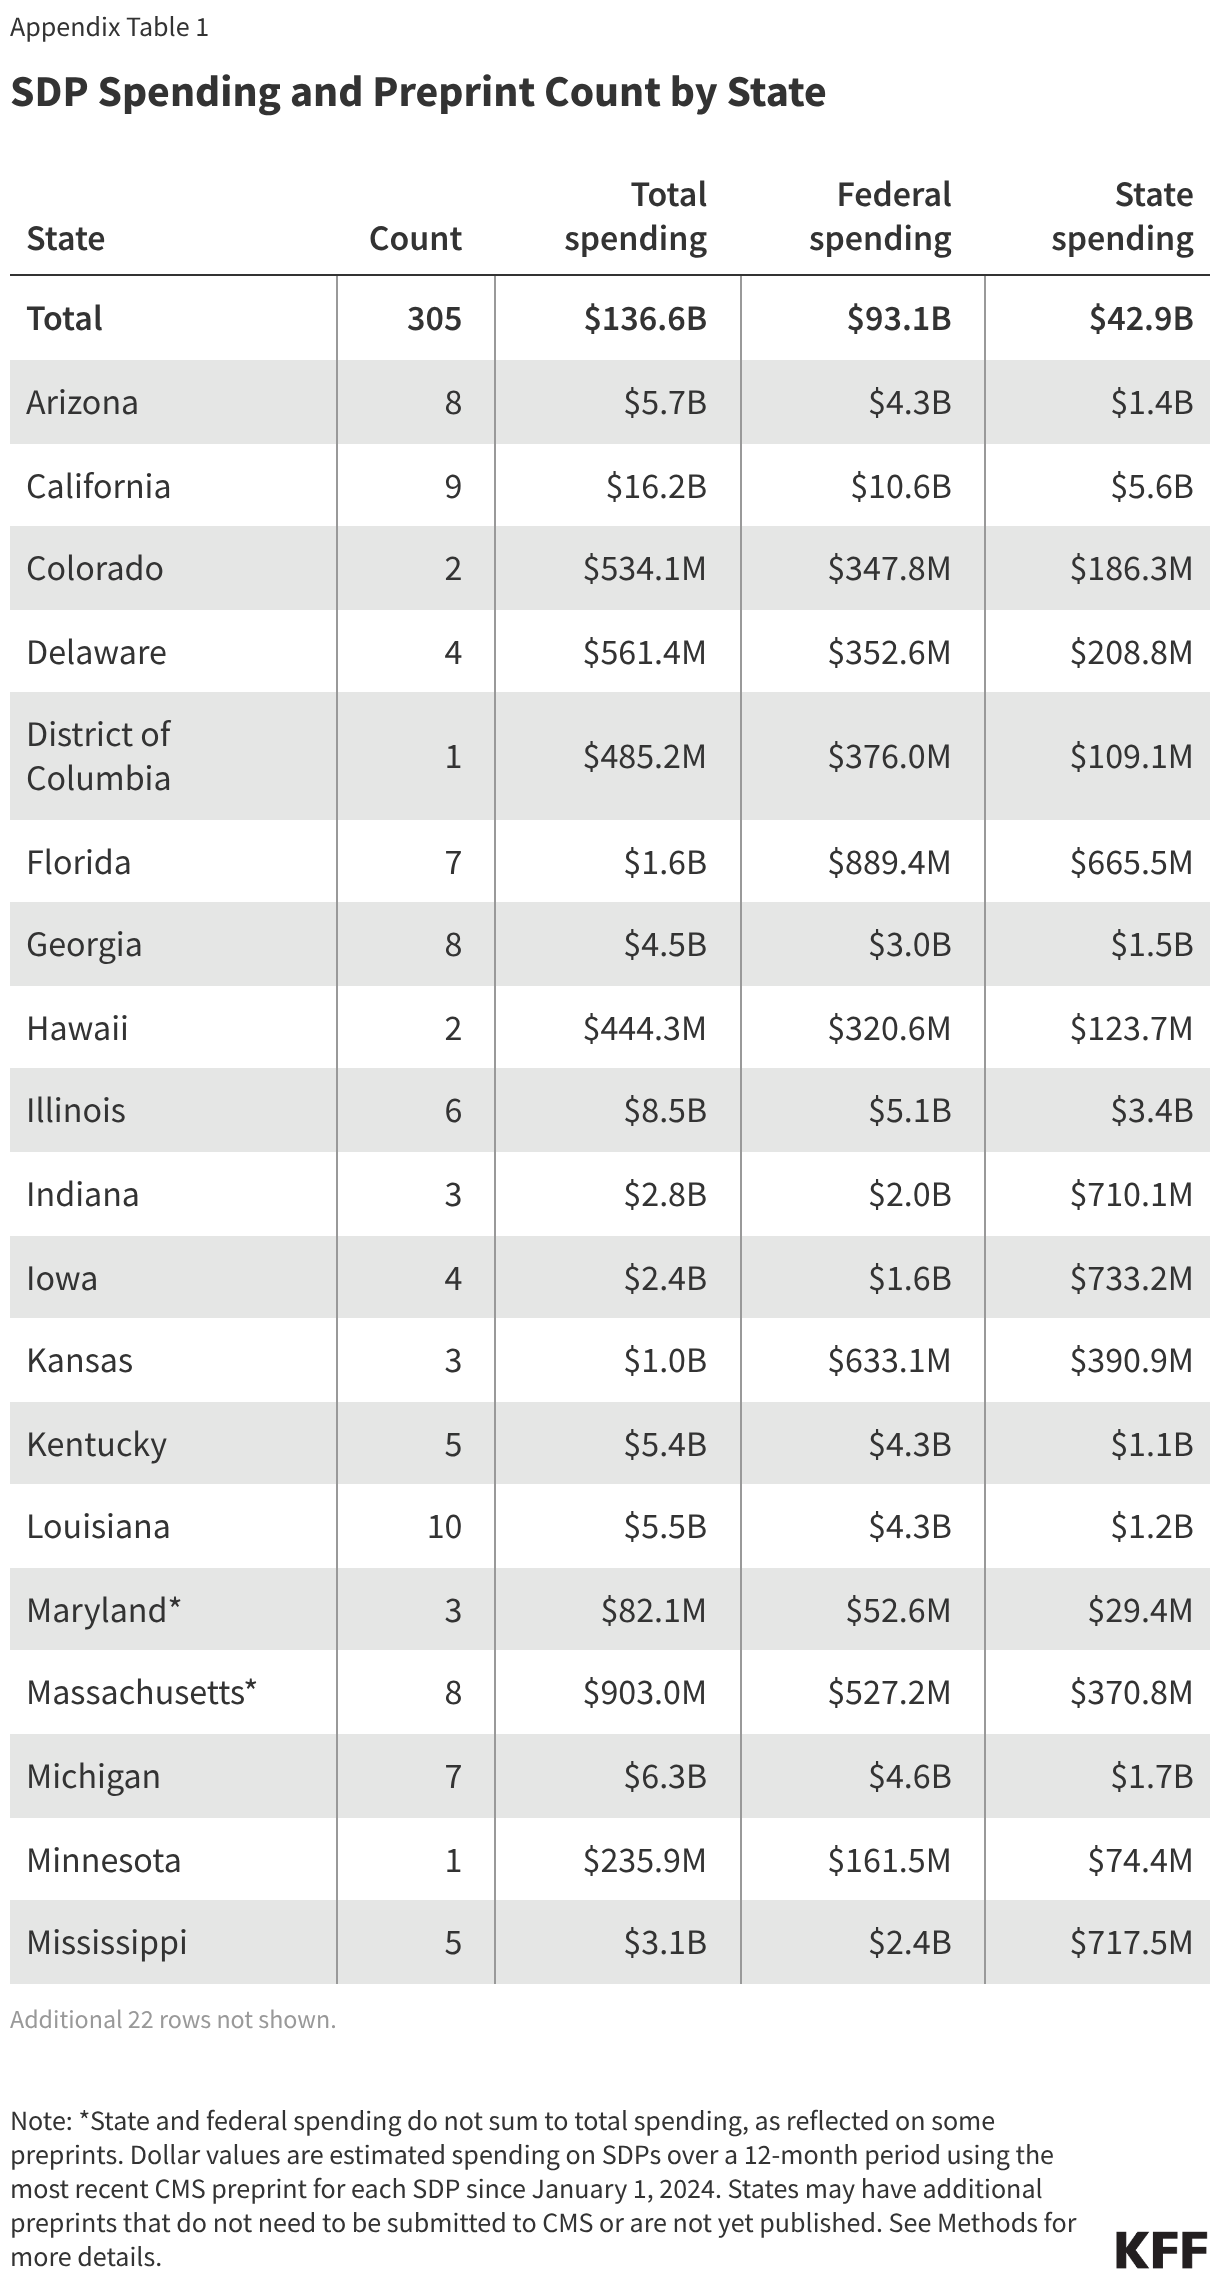
  • California has the highest projected federal SDP spending ($10.6 billion), followed by Texas ($6.3 billion), North Carolina ($5.2 billion), and Illinois ($5.1 billion).

Vermont has the lowest projected federal SDP spending ($12.4 million), followed by Maryland ($52.6 million), Missouri ($145 million), and Minnesota ($161 million). Although this analysis focuses on trends in federal spending, patterns are similar when looking at total spending (Appendix Table 1). All 10 states with the highest federal spending also are in the top 10 states for total spending. Many—but not all—of these SDPs could be affected by the new requirements for SDPs in the 2025 reconciliation law.  

At Least 41 States Have State Directed Payments, Which are Projected at Nearly 0 billion in Annual Federal Spending (Choropleth map)

How are SDPs used across provider types?

An estimated 84% of federal dollars spent through SDPs that require CMS approval pay for hospital services (Figure 3). Of $93 billion in annual projected federal SDP spending, an estimated $78.0 billion (84%) is directed to hospital services. (The share of total spending that pays for hospital services is the same as the share of federal spending.) Professional services at academic medical centers ($3.2 billion) and nursing facility services ($2.2 billion) comprise the next largest shares of federal SDP spending. Although most spending is from SDPs exclusively targeting hospital services, many SDPs include spending for multiple service types and do not specify how much of the total spending is for each service, which creates uncertainty in the estimates (see Methods).

The largest number of SDPs also pay for hospital services, although 64 SDPs are directed to multiple service types, including hospitals. Specifically, of the 305 preprints included in this analysis, 107 were exclusively for hospital services. The next most frequent services were behavioral health services (20 SDPs), professional services at academic medical centers (18), and nursing facility services (17) (data not shown). The remaining preprints were directed exclusively to other services, or to combinations of services.

Most (84%) of Estimated SDP Spending is Directed to Hospital Services (Donut Chart)

What types of payment rates do existing SDPs require of MCOs?

Most spending (84%) comes from SDPs that use average commercial rates as a benchmark, which likely reflects the federal requirements that determine which SDPs require a preprint. The share of spending for SDPs that use average commercial rates is high relative to the share of preprints that use average commercial rates: Nearly two-thirds (65%) of preprints are benchmarked to average commercial rates. The dominance of average commercial rates in the publicly available preprint data likely reflects the fact that when benchmarks equal FFS Medicare or Medicaid rates, no preprint is required. Only a small share of spending is from SDPs that do not require a benchmark.

Most Spending on SDPs is Benchmarked Using Average Commercial Rates (ACR) (Donut Chart)

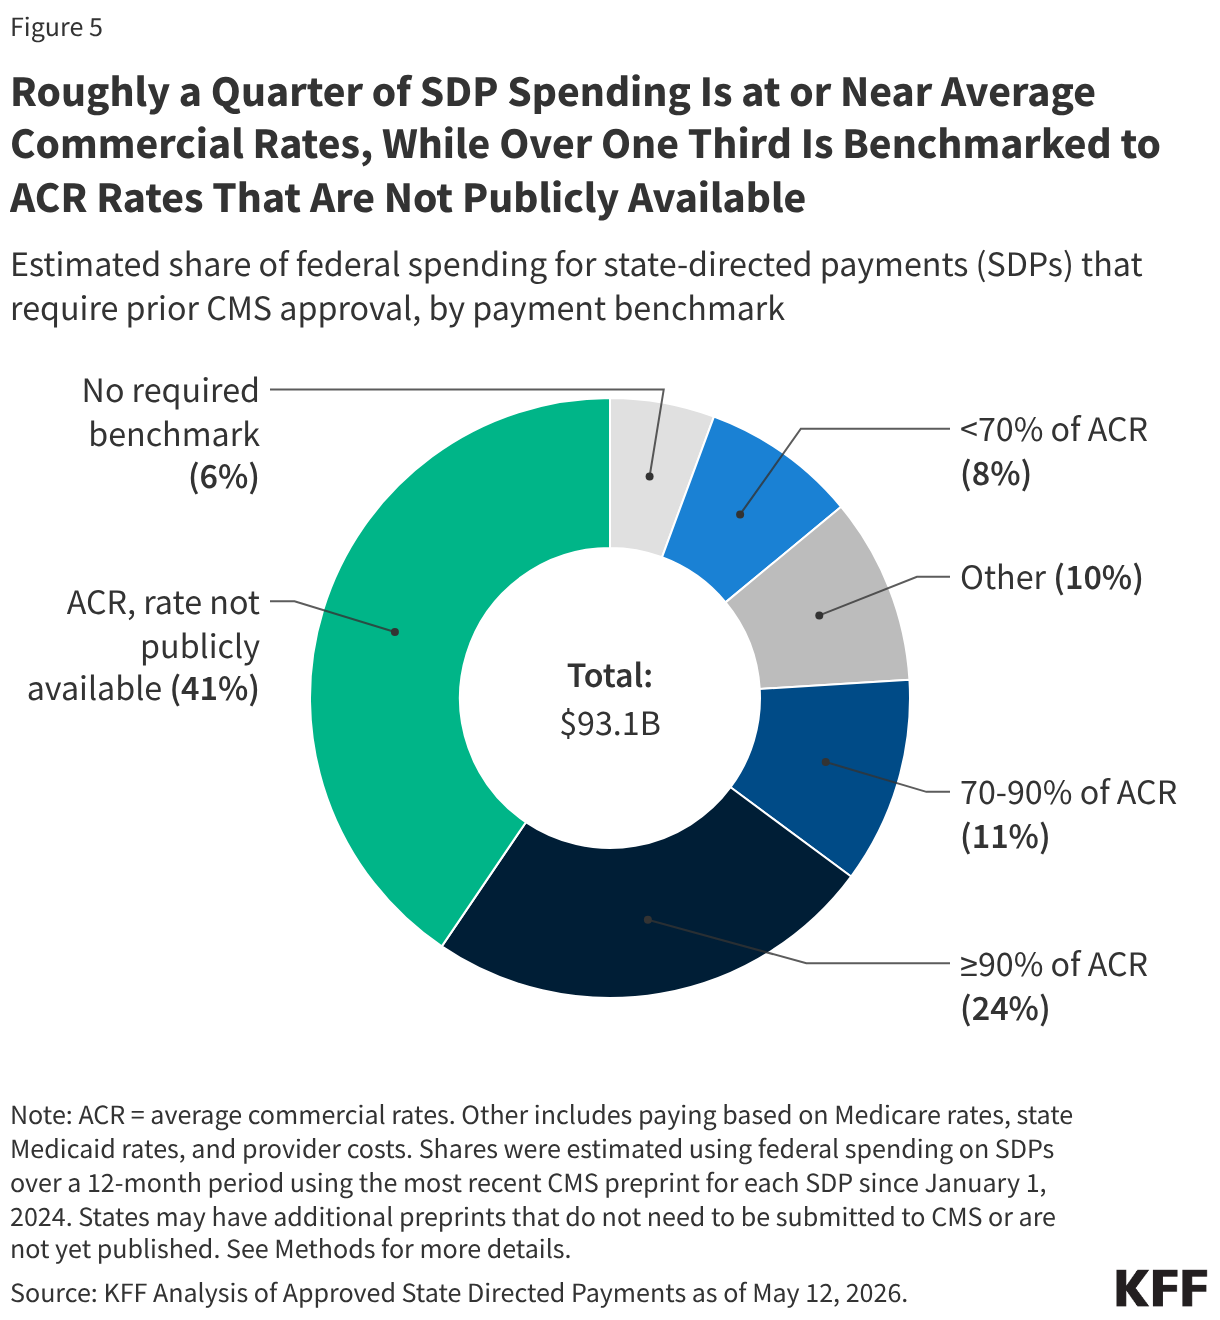
Roughly a quarter of SDP spending ($23 billion) is paid at or above 90% of average commercial rates, while over one third ($38 billion) is benchmarked to ACR rates that are not publicly available. An additional $10 billion is paid at 70%–90% of average commercial rates. Among the SDPs that do not use ACR as a benchmark, missing payment rates are somewhat less common. Among SDPs that use Medicare rates as a benchmark, just over half result in total payment rates greater than what Medicare pays. (Other SDPs that use Medicare rates as a benchmark may pay at or below Medicare.)

Roughly a Quarter of SDP Spending Is at or Near Average Commercial Rates, While Over One Third Is Benchmarked to ACR Rates That Are Not Publicly Available (Donut Chart)

This work was supported in part by Arnold Ventures. KFF maintains full editorial control over all of its policy analysis, polling, and journalism activities.

Patrick Drake, an independent consultant, contributed to the analysis of SDP data.

KFF appreciates the contributions of external reviewers who provided comments on earlier versions of this analysis.

Methods

Data source: This analysis uses data available from the list of approved state directed payment preprints published by the Centers for Medicare and Medicaid Services (CMS) as of May 12, 2026. The approved state directed payment (SDP) preprints are PDF versions of forms that are completed by states and approved by CMS. States are required to seek approval using such a preprint for any SDP that requires managed care organizations (MCOs) to pay for services at any rate other than fee-for-service (FFS) Medicare or Medicaid rates. The approved preprints are often posted online 6–12 months after their start date, although some approved preprints are posted online much later.

KFF developed a Python script to download the available PDFs, extract relevant data from them, and standardize certain fields. Each preprint was turned into one row in a spreadsheet. Data from tables within the preprint were extracted and converted into separate tables in KFF’s data file with each row in the preprint table converted into a row in the spreadsheet table.

SDP preprint inclusion criteria: KFF included all SDPs in the analysis with a rating period start date of January 1, 2024 onwards for the 50 states and Washington DC (hereafter referred to as a state). Puerto Rico was the only territory that had published SDPs, which were excluded. In each case, KFF only kept the most recent preprint for any given SDP. For example, if an SDP had an initial approval in 2024 and then renewals in 2025 and 2026, KFF would only include the 2026 renewal in the final dataset. Out of the 305 preprints included in this analysis, 24 (totaling $8.8 billion in federal spending) ended in calendar year 2024.

A small number of SDP preprints were excluded due to file formatting or data validity issues. Specifically:

  • Data from five preprints excluded from this sample were encoded differently, so the data could not programmatically be extracted into the dataset, and were therefore excluded from the analysis (two from New Hampshire, one from Ohio, and two from Florida, totaling $89 million in federal spending for one year).
  • Data from preprints that had obvious data quality issues were excluded from this sample.  For instance, two were from Illinois (which projected total annual spending of more than $100 billion) while one from Minnesota did not report spending data in the preprint.

KFF also reviewed all preprints with end dates prior to July 1, 2025, and excluded preprints for the following reasons.

  • The preprint was likely funded from COVID-19 relief dollars (including the increased federal funding for home care from the American Rescue Plan Act) and so unlikely to still be in place.
  • The preprint was likely combined into a different preprint when renewed or was otherwise renamed when renewed.
  • The preprint ended in 2024, and online research suggests that the payment was discontinued.

See Methods Table 1 for a list of the inclusion criteria, the counts of preprints after each criterion was applied, and the federal spending for preprints that were retained at each stage.

Calculating total spending on SDPs: This analysis used the states’ projected total, federal, and state spending from the preprint. Most preprints are for a one-year period but some are for longer or shorter periods. In such cases, KFF adjusted the data to be a one-year equivalent. When preprints were for periods shorter than 12 months, dollars were scaled up (e.g., if the preprint was for 6 months, the spending was multiplied by two) and for preprints that were for periods longer than 12 months, spending was scaled down (e.g., retaining two-thirds of spending if the preprint extended for 18 months).

KFF also manually reviewed the federal spending numbers because some states reported them as percentages and others reported them as dollar amounts. Manual review ensured the Python script had adequately handled the different reporting structures.

In most cases, the state and federal shares equaled the total share, but in 8 states, this was not always the case (see Appendix Table 1).

Calculating SDP spending by service type: For preprints that made payments for multiple service types (which accounted for $32.6 billion in federal spending), spending was apportioned across service types.

  • For SDPs directed to hospital and non-hospital services, 90% of spending was allocated to hospital services. Remaining dollars were apportioned equally among any other service types.
  • For SDPs directed to both inpatient and outpatient hospital services, 68% of hospital spending was allocated to inpatient services and 32% was allocated to outpatient services. This assumption does not affect the estimates of spending by service type but is relevant for calculating the amount of spending by benchmark rate.
  • For SDPs that did not direct any spending to hospital services, spending was allocated equally among named services.

Apportioning spending across service types is difficult and KFF used a variety of sources to approach developing the most realistic assumptions feasible. KFF analyzed data on Medicaid spending including CMS-64 spending by service type, data on Medicaid spending by service type from the National Health Expenditures, the Congressional Budget Office Medicaid baseline, and existing studies on hospital payment policies such as those from the Medicaid and CHIP Payment and Access Commission (MACPAC). All of those data points suggest that the vast majority of SDP spending pays for hospital services, and $53.1 out of the $60.5 billion in federal spending from preprints directed to a single provider type went to hospital services. KFF also strove to use an assumption that resulted in estimates of hospital SDP spending that are similar to what could be expected on the basis of other data and research as described above.

When identifying the service types in the preprints, the Python script attempted to align service types between preprint Table 2 (which specifies payment rates for sets of providers) and preprint question 20 (a checklist of services included in the SDP). In many cases, this alignment involved some uncertainty, requiring manual review and classification of service types.

Identifying benchmarks for MCO payments: The most common type of SDPs requires MCOs to make payments that are on top of the regular base payment rate (as opposed to limiting or replacing the negotiated rate). In such cases, payments are measured using a “benchmark” or standardized rate to compare the MCO rates to other payment rates such as those of Medicaid FFS, Medicare FFS, or the average among commercial payers (“average commercial rates”). Among the 305 preprints in this sample (accounting for $93.1 billion in federal spending), 264 preprints are required to report a benchmark (accounting for $87.9 billion in federal spending). KFF used the Python script to identify the applicable benchmark type from the preprint, but also manually reviewed the data since states sometimes used inconsistent terminology to report the same benchmarks.

Identifying payment levels: To identify how current payment rates align with the new limits on SDPs in the reconciliation law, KFF first needed to identify payment levels in the preprints. The level is specified as a percentage of the benchmark (e.g., 90% of average commercial rates or 140% of Medicare rates). Both types of payments were pulled from Table 2 when available.  Payment rates for inpatient and outpatient hospital services were tracked separately with each row in Table 2 when applicable.

Methods Table 1

Analysis StepCount of PreprintsFederal Spending Among Preprints (billion $)Analysis Step
Preprints listed on CMS’s website as of May 12, 20261,038 


All preprints pulled from CMS website987246.4Some links are broken or duplicates
Preprints in time period and states570 
166.1
 
Includes the most recent preprint for each state directed payment (SDP) from January 2024 onwards for the 50 states and DC
Most recent SDP submission or renewal35899.6


Preprints without data quality issues35299.6KFF dropped preprints that were missing information about the start date, end date, spending amounts, etc.
Preprints manually reviewed and dropped30593.1KFF dropped preprints from older years that were subsumed into newer preprints and those that were temporary policies started during the COVID-19 pandemic

Appendix Table: States’ Number of and Spending on SDPs

SDP Spending and Preprint Count by State (Table)

How Medicare Advantage Rebates Disadvantage Medicare’s Stand-Alone Drug Plan Market

Medicare Advantage Rebates Undermine Competition with Stand-Alone Drug Plans by Lowering Medicare Advantage Drug Plan Premiums

Published: Jun 11, 2026

The Medicare Part D prescription drug benefit was designed to offer Medicare beneficiaries the choice of drug coverage from either stand-alone prescription drug plans (PDPs) for people in traditional Medicare or Medicare Advantage prescription drug plans (MA-PDs) that offer both medical and drug benefits, with plans competing on premiums, coverage, and cost sharing. Increasingly, however, PDPs and MA-PDs are competing on uneven terms, in part because the payment system for Medicare Advantage plans enables MA-PDs to lower Part D premiums or reduce Part D cost sharing, making drug coverage from Medicare Advantage plans appear considerably cheaper, or even premium-free, to the beneficiary. The payment advantage for MA-PD sponsors makes it harder for PDP sponsors to compete on premiums, which may be especially challenging when all Part D plan sponsors are facing more cost pressures associated with a redesigned Part D benefit that shifted more costs onto plans and the loss of rebates for selected drugs under the Medicare Drug Price Negotiation program.

The federal government has recently taken steps to mitigate premium increases for Part D coverage, through both a provision in law capping annual growth in the base beneficiary premium to 6% for PDPs and MA-PDs and a temporary premium stabilization demonstration solely for PDPs. While these efforts have helped prevent an increase in the overall average PDP premium, the average premium for drug coverage remains significantly higher for PDPs than for MA-PDs. Recent years have also seen a decline in the average number of PDPs available to beneficiaries, which might make plan comparisons easier but might also make it harder to find an affordable plan that meets an individual’s unique needs. This reduction in the number of PDPs stands in sharp contrast to the MA-PD market where plan offerings have generally been increasing, though they have declined slightly over the past couple of years

This brief discusses the growing instability of the Part D stand-alone drug plan market and how the Medicare Advantage payment system makes it harder to maintain competitive and affordable options in the PDP market.

Takeaways

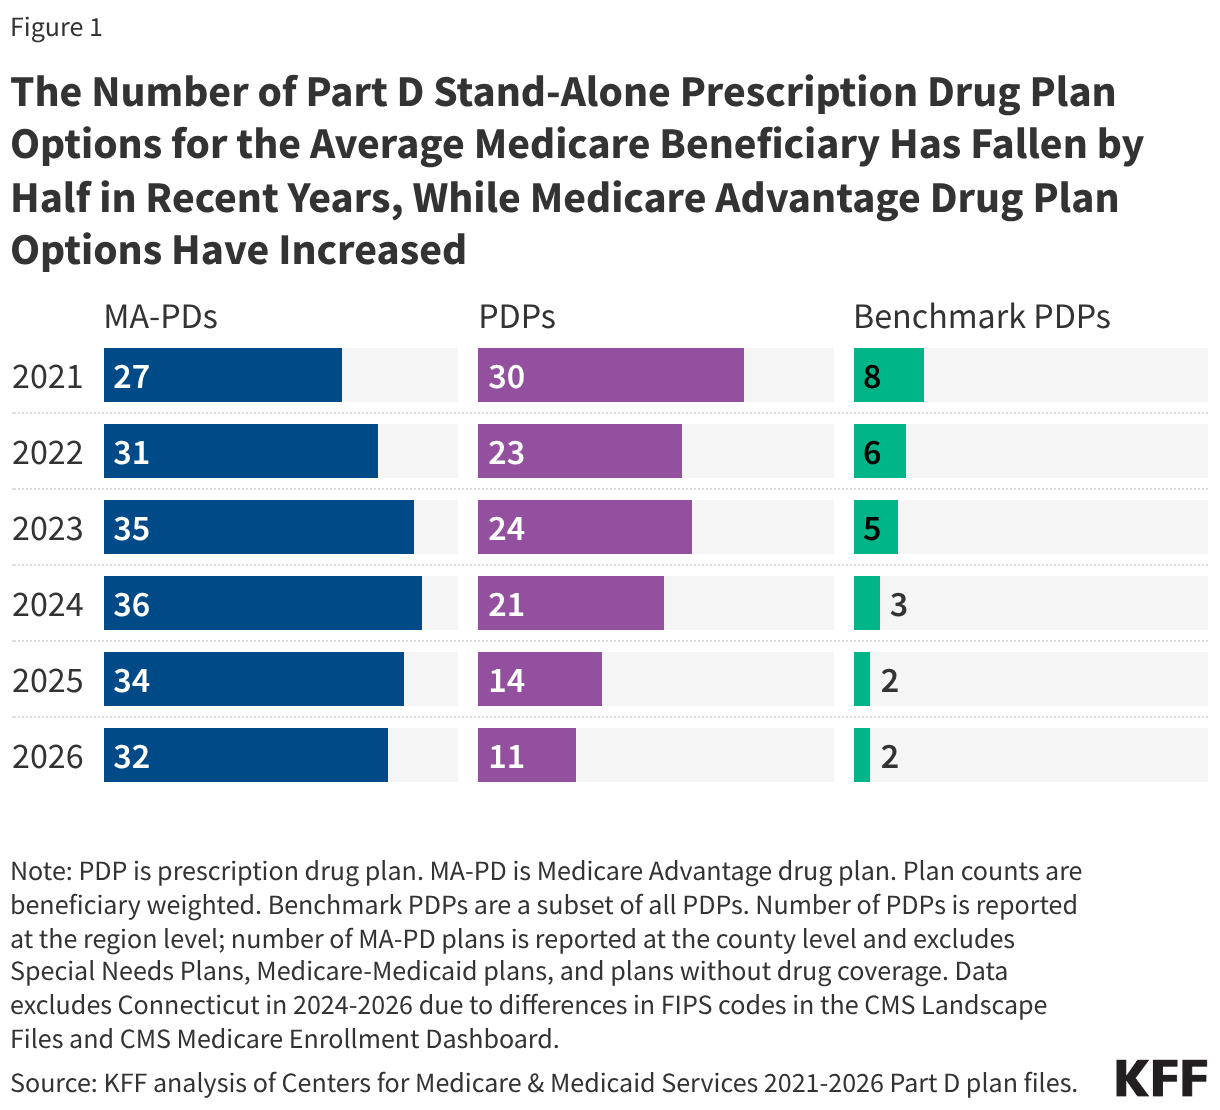
  • Reflecting shifts in Part D plan availability in recent years, the average Medicare beneficiary now has nearly three times more options for Part D coverage from MA-PDs than from PDPs (32 vs. 11), a substantial change from five years ago when the average beneficiary had 30 PDP options and 27 MA-PD options.
  • In 2026, MA-PD sponsors allocated over $600 in rebates per individual Medicare Advantage plan enrollee, or more than $50 per member per month, for Part D benefit enhancements and premium reductions. Due to rebate-financed Part D premium buydowns, most MA-PD enrollees are in plans charging no premium, including for drug coverage, in 2026.
  • PDP sponsors are also receiving additional temporary premium subsidies through the PDP Premium Stabilization Demonstration, established to prevent substantial PDP premium increases as a result of the Part D benefit redesign. The federal government is providing around $190 in annual premium subsidies per PDP enrollee under the stabilization demonstration in 2026, based on a projected $16 per member per month premium reduction.
  • Under a provision of the Inflation Reduction Act capping annual growth in the Part D base beneficiary premium to 6%, the federal government is providing a higher direct subsidy payment to both PDP and MA-PD plan sponsors to cover their basic Part D benefit costs, relative to what they would have received absent the 6% base premium cap, which helps absorb cost increases under the IRA’s Part D benefit redesign and mitigates premium increases for both PDP and MA-PD enrollees. The 6% base premium cap is projected to reduce the average premium by a similar amount in both markets in 2026.
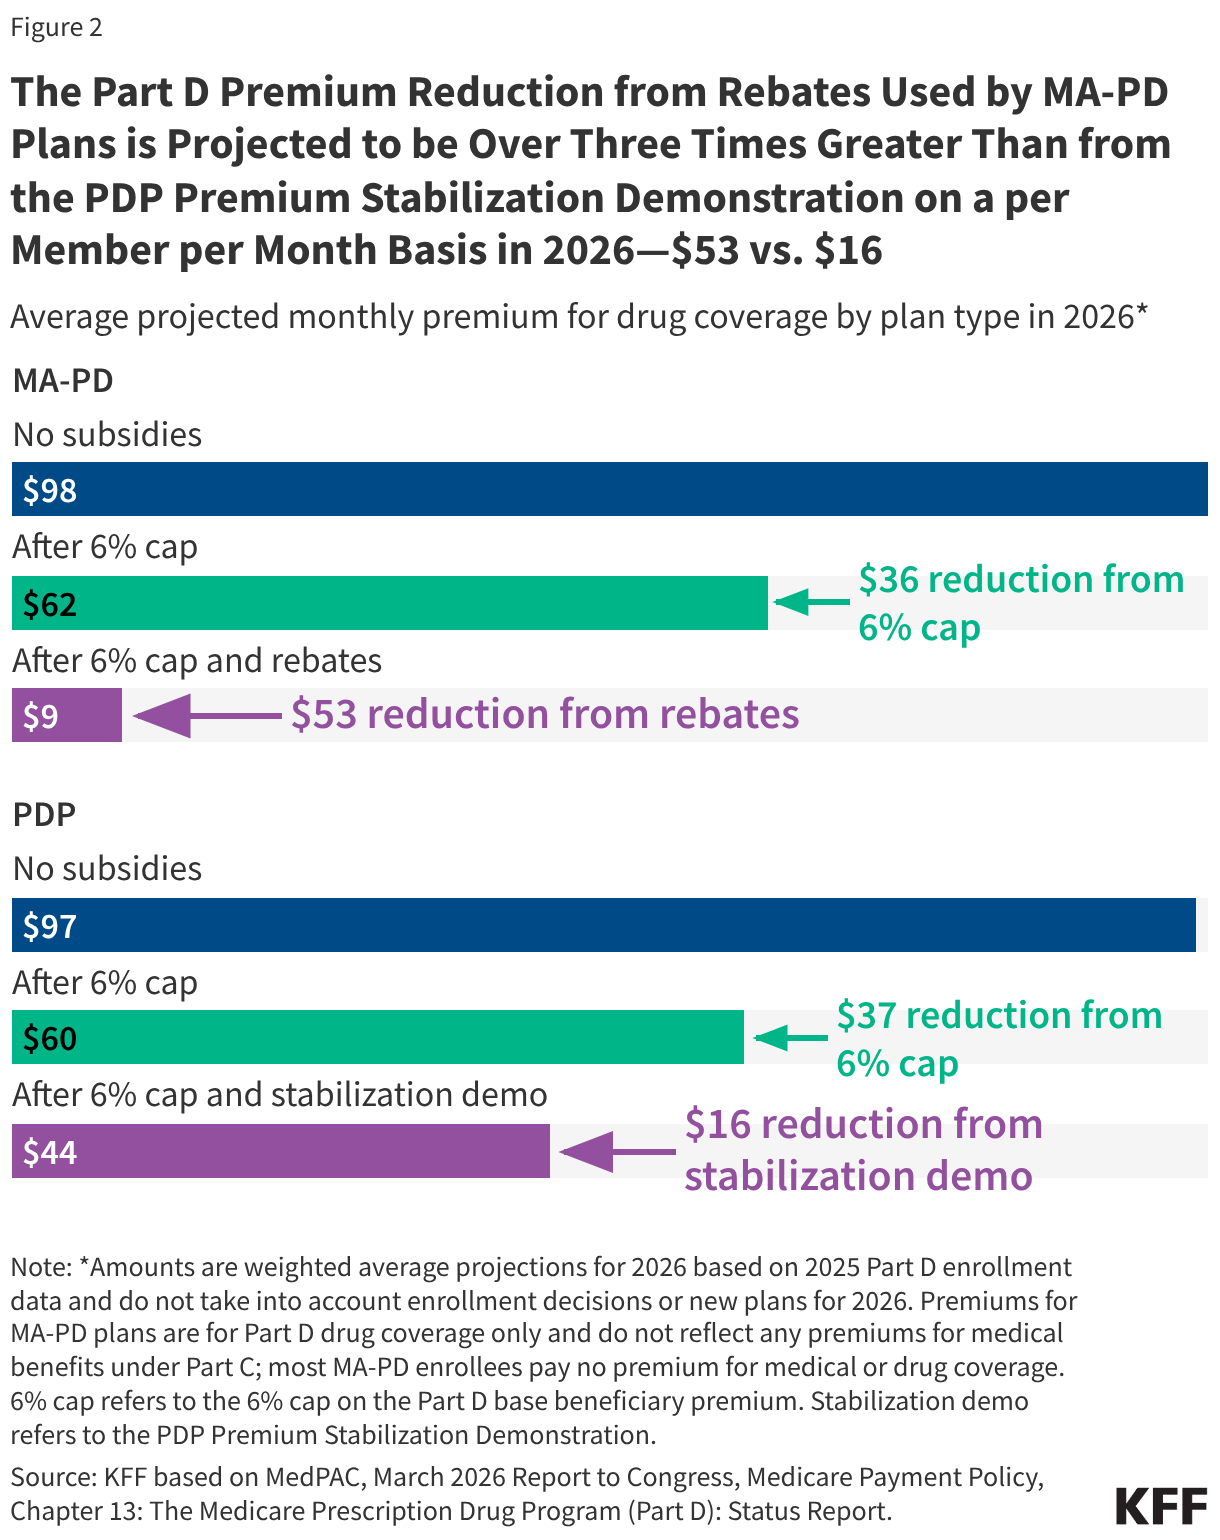
  • On a per member per month basis, the amount of rebates used by Medicare Advantage plans to buy down MA-PD Part D premiums in 2026 is projected to be over three times greater than the amount of premium subsidies to PDPs under the temporary premium stabilization demonstration—$53 for MA-PDs vs. $16 for PDPs. (These projections are based on 2025 Part D enrollment, not taking into account plan switching or new enrollment for 2026.)
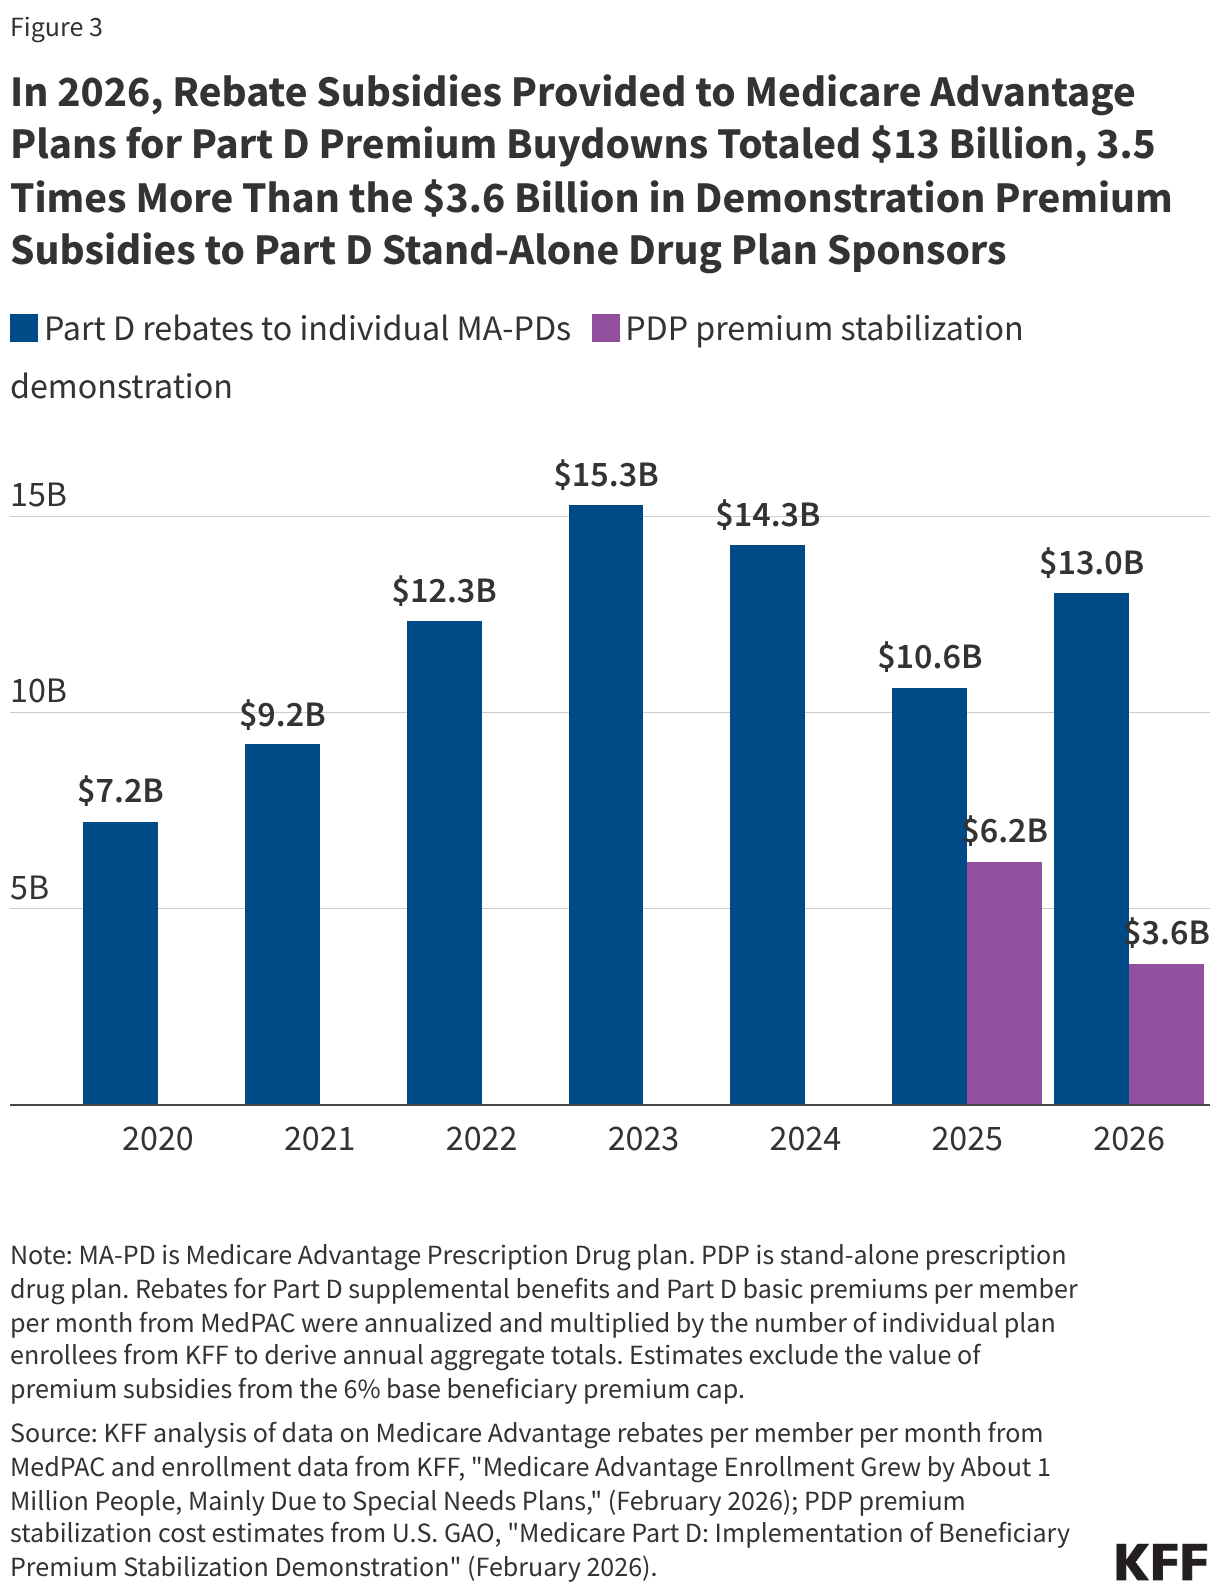
  • The total cost to the federal government of rebates to Medicare Advantage plans used for Part D premium buydowns is 3.5 times more than the amount of subsidies to PDP sponsors under the premium stabilization demonstration in 2026 ($13 billion versus $3.6 billion).

The PDP Market Has Been Shrinking in Recent Years

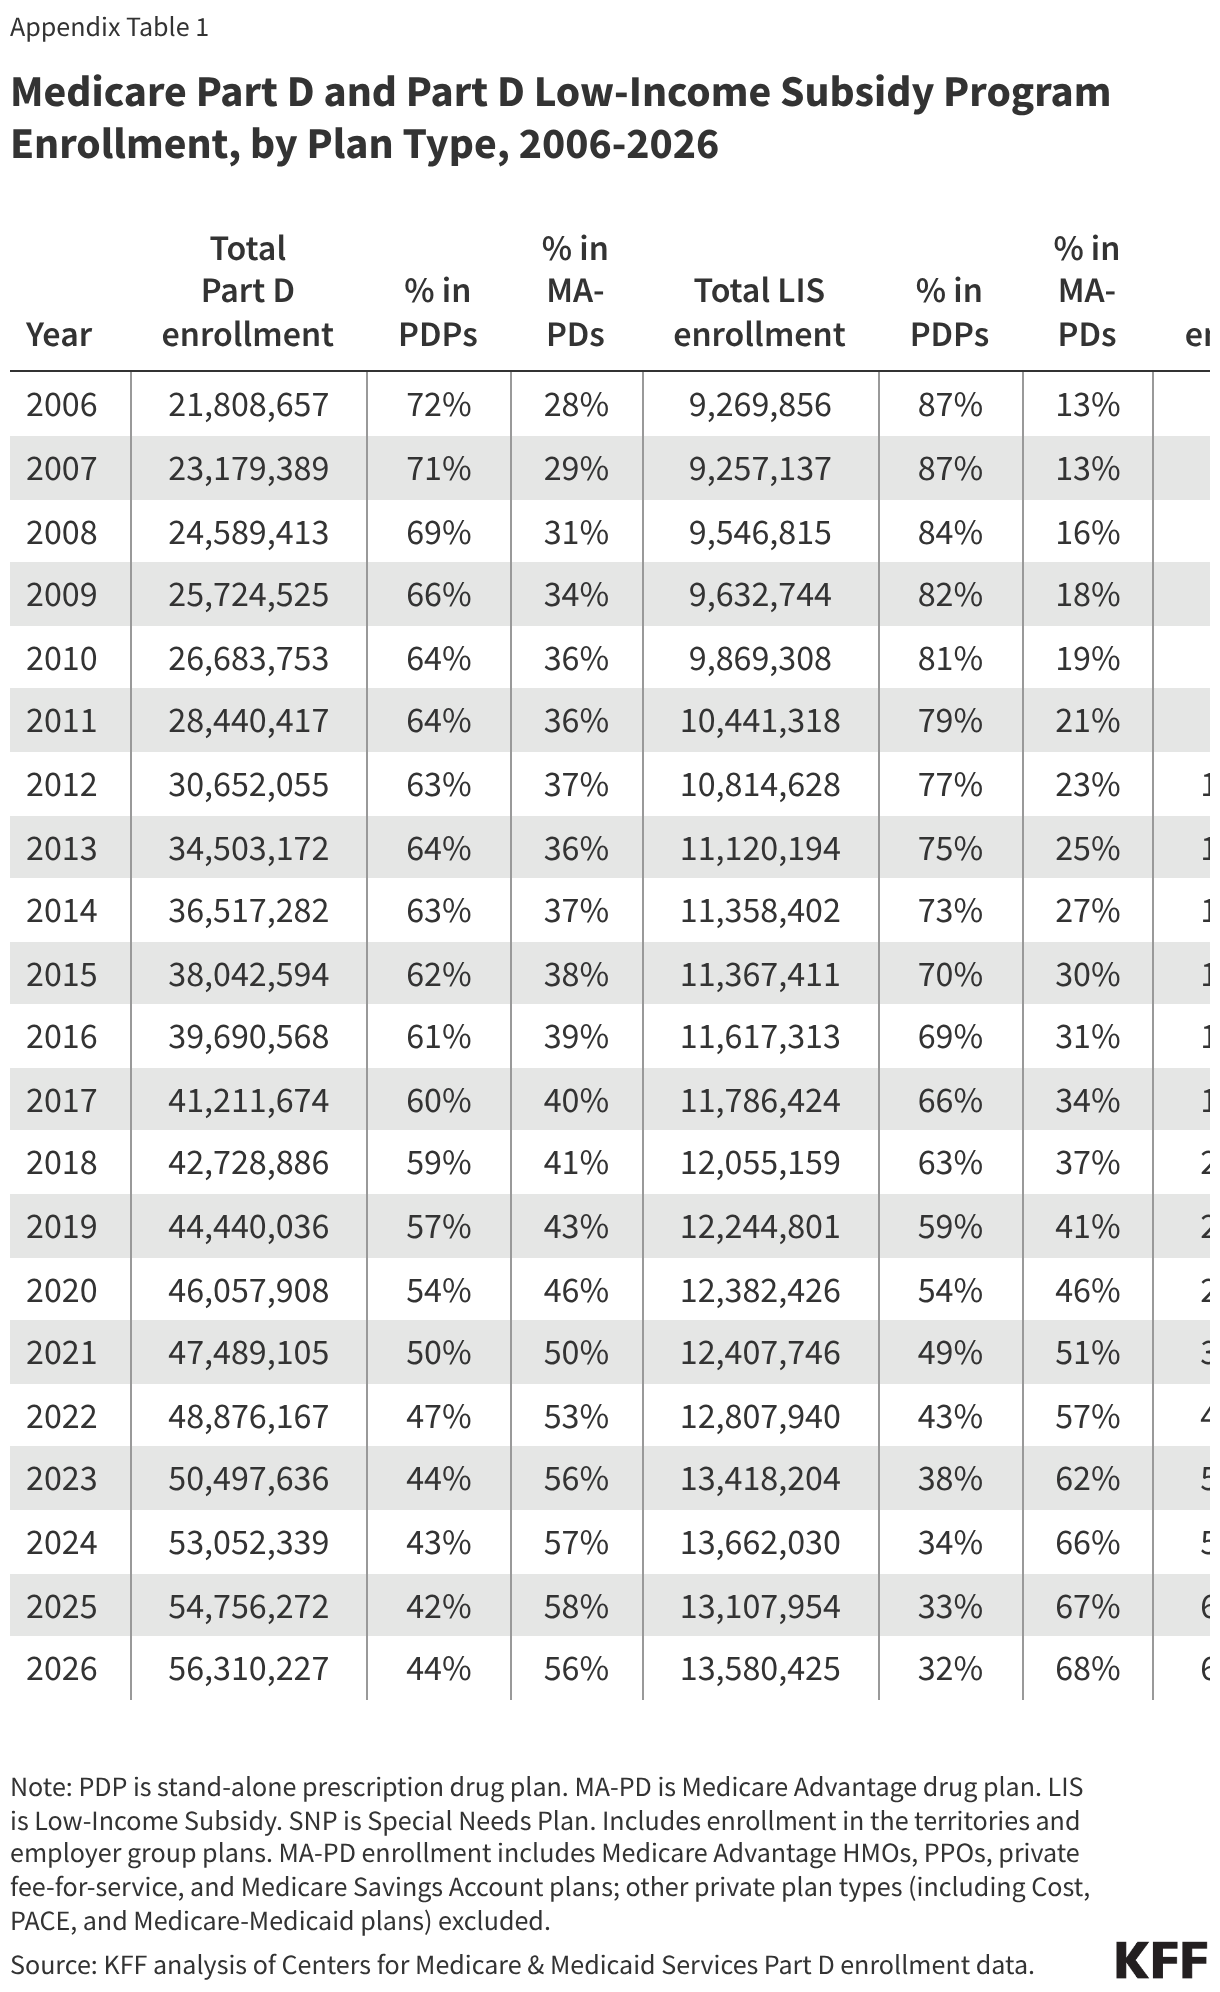
For Medicare beneficiaries who are enrolled in traditional Medicare, which is somewhat less than half of all people with Medicare, getting Medicare Part D prescription drug coverage means enrolling in a stand-alone PDP, a market that has been shrinking in recent years. Over the last five years, the number of PDPs available to the average beneficiary has decreased from 30 in 2021 to 11 in 2026, reflecting a decline in the total number of PDPs available around the country (Figure 1). By comparison, over this same period, the average number of Medicare Advantage drug plans (MA-PDs) increased from 27 to 32. The number of premium-free (“benchmark”) PDPs available to the average Medicare beneficiary who qualifies for the Part D Low-Income Subsidy (LIS) is even lower, decreasing from 8 benchmark PDPs in 2021 to 2 in 2026. This matters because for low-income Medicare beneficiaries who are eligible for the LIS, enrolling in certain PDPs provides the only guaranteed option for premium-free drug coverage and reduced cost sharing.

The Number of Part D Stand-Alone Prescription Drug Plan Options for the Average Medicare Beneficiary Has Fallen by Half in Recent Years, While Medicare Advantage Drug Plan Options Have Increased (Split Bars)

The Medicare Advantage Payment System Gives MA-PDs a Premium Advantage Compared to PDPs

One factor that has made the PDP market less competitive relative to MA-PDs is a payment system that gives sponsors of MA-PDs a clear advantage in terms of premiums. The Medicare Advantage payment system allows private insurers to retain a portion of the difference between their estimated costs for providing Medicare Part A and Part B services and the maximum Medicare Advantage payment rate. This portion of the federal payment to Medicare Advantage plans is called the “rebate” and it must be used by insurers to reduce the costs of benefits provided under the plan. In the absence of these payments, Medicare Advantage enrollees would face higher costs, including for Part D coverage. To the extent rebates are used to buy down Part D premiums or enhance Part D benefits, they provide a subsidy for Part D coverage to Medicare Advantage enrollees.

In 2026, Medicare Advantage plan sponsors are projected to allocate more than $600 in rebates per enrollee toward enhanced Part D coverage in individual MA-PDs, or just over $50 per member per month. Sponsors of individual MA-PDs use these federal rebates to subsidize Part D coverage by lowering or eliminating their Part D premiums and offering Part D supplemental benefits, including lower or no deductibles for drug coverage and lower cost sharing. Based on the 21 million enrollees in individual MA-PDs, the total amount of rebates from the federal government used for Part D buydowns is $13 billion in 2026.

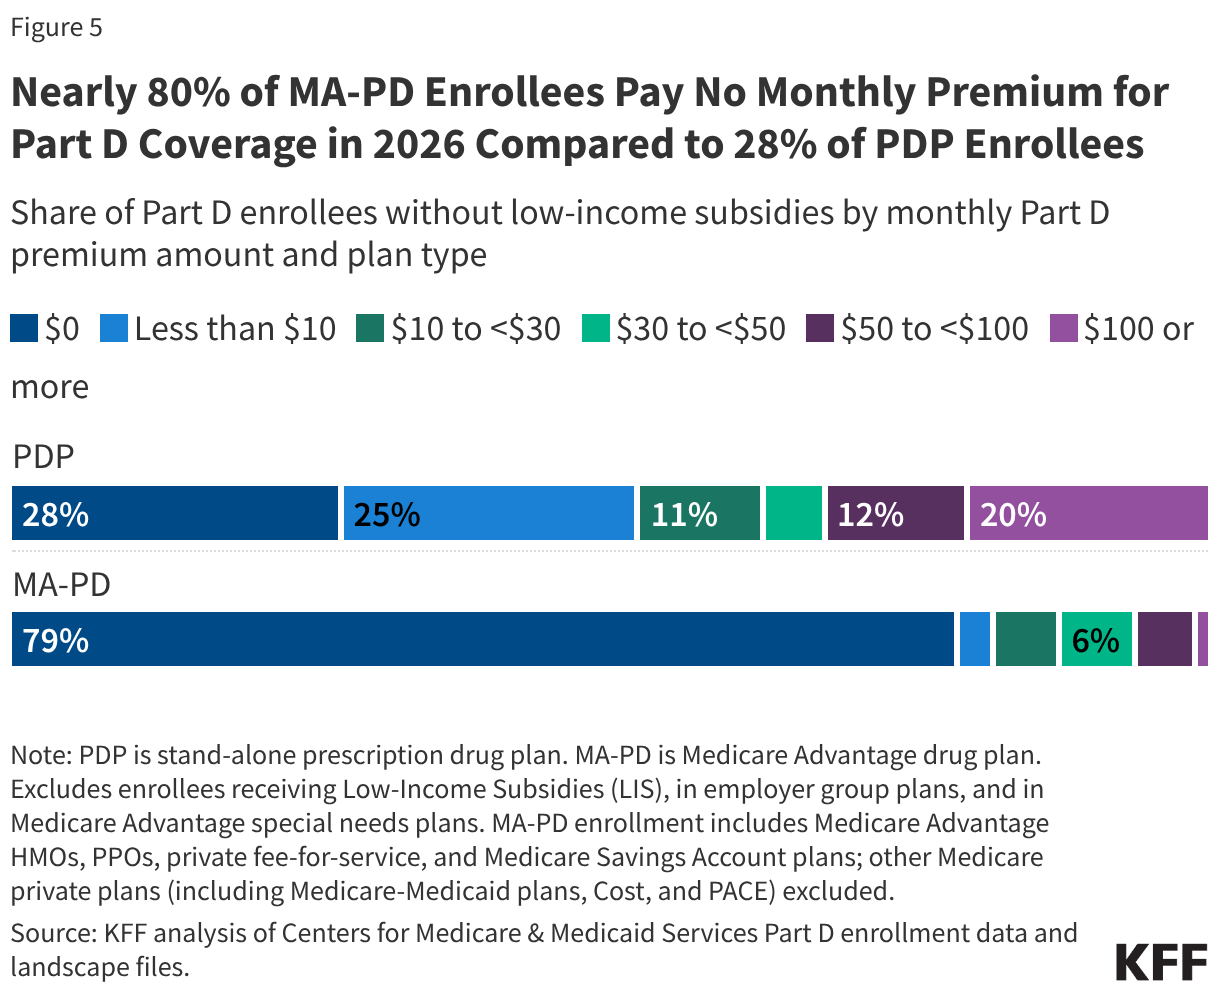
These rebate subsidies are unavailable to Part D sponsors for PDPs, which means that beneficiaries in traditional Medicare who get Medicare Part D coverage through a PDP typically face higher premiums for their drug coverage than MA-PD enrollees and have far fewer zero-premium options in the PDP market. In 2026, nearly 8 in 10 (79%) MA-PD enrollees in individual plans without low-income subsidies pay no monthly premium for Part D coverage compared to around 3 in 10 (28%) PDP enrollees. For the average Medicare beneficiary in 2026, 21 out of their 32 MA-PD options charge no premium for drug coverage, while 2 out of their 11 PDP options charge no premium.

PDP Sponsors Are Receiving Additional Temporary Premium Subsidies Through the PDP Premium Stabilization Demonstration

The voluntary PDP Premium Stabilization Demonstration, established in 2024 under the federal government’s Section 402 demonstration authority and intended to run for three years, provides additional premium subsidies to sponsors of PDPs to prevent substantial premium increases associated with the Part D benefit redesign. Under the Inflation Reduction Act, the Part D benefit was redesigned to include a new out-of-pocket drug spending cap for Part D enrollees and other changes that significantly shifted costs under the drug benefit from the federal government to Part D plan sponsors, with sponsors paying a larger share of costs above the out-of-pocket spending cap and potentially passing those higher costs along to beneficiaries through higher premiums. The premium stabilization demonstration was targeted to PDP sponsors only, because CMS reported large increases and greater variation in the bids submitted by Part D plan sponsors of PDPs than MA-PDs for drug coverage in 2025, indicating greater variability in the expected impact on basic benefit costs and premiums in the PDP market associated with benefit redesign and other drug pricing cost pressures. In 2026, the federal government is providing around $190 in annual premium subsidies per PDP enrollee under the demonstration, based on MedPAC’s projection of $16 in premium subsidies per member per month in 2026, for a total cost of $3.6 billion.

Both PDP and MA-PD Plan Sponsors Are Receiving Higher Direct Subsidy Payments for Part D Benefit Costs, Which Help Mitigate Premium Increases

The federal government is providing a higher direct subsidy payment to Part D plan sponsors resulting from a provision of the Inflation Reduction Act capping annual growth in the base beneficiary premium to 6%, which helps absorb cost increases under the Part D benefit redesign and also mitigates premium increases. Along with changes to the Part D benefit design and other drug pricing provisions, the IRA capped the increase in the Part D base beneficiary premium to 6%. The base premium is calculated as a share of average plan bids for basic Part D benefits submitted by both PDPs and MA-PDs. As a result of the 6% base premium cap, the federal government is providing a larger direct subsidy payment to both PDP and MA-PD sponsors to cover their basic Part D benefit costs, relative to the level of direct subsidies they would have received without the 6% cap. The cap also has the effect of reducing Part D premiums paid by both PDP and MA-PD enrollees relative to what they would have paid in the absence of the cap (although this 6% cap doesn’t apply to the individual premiums that plans charge). According to MedPAC, the 6% base premium cap is projected to reduce the average premium by a similar amount in both markets in 2026 (as described further below).

The Part D Premium Reduction from Rebates Used by MA-PD Plans is Projected to be Over Three Times Greater Than from the PDP Premium Stabilization Demonstration on a per Member per Month Basis in 2026—$53 vs. $16

Data from MedPAC shows the differential premium impact of the various subsidies provided by the federal government to PDP and MA-PD plan sponsors, with MA-PD premiums substantially lower than PDP premiums as a result. On a per member per month basis, the amount of rebates used by Medicare Advantage plans for Part D premium buydowns in 2026 is projected to be more than three times greater than the amount of subsidies provided to PDPs under the temporary stabilization demonstration—$53 for MA-PDs vs. $16 for PDPs. (MedPAC’s estimates are projections for average monthly premiums per member per month in 2026, based on 2025 enrollment and not accounting for plan switching or new enrollees for 2026.)

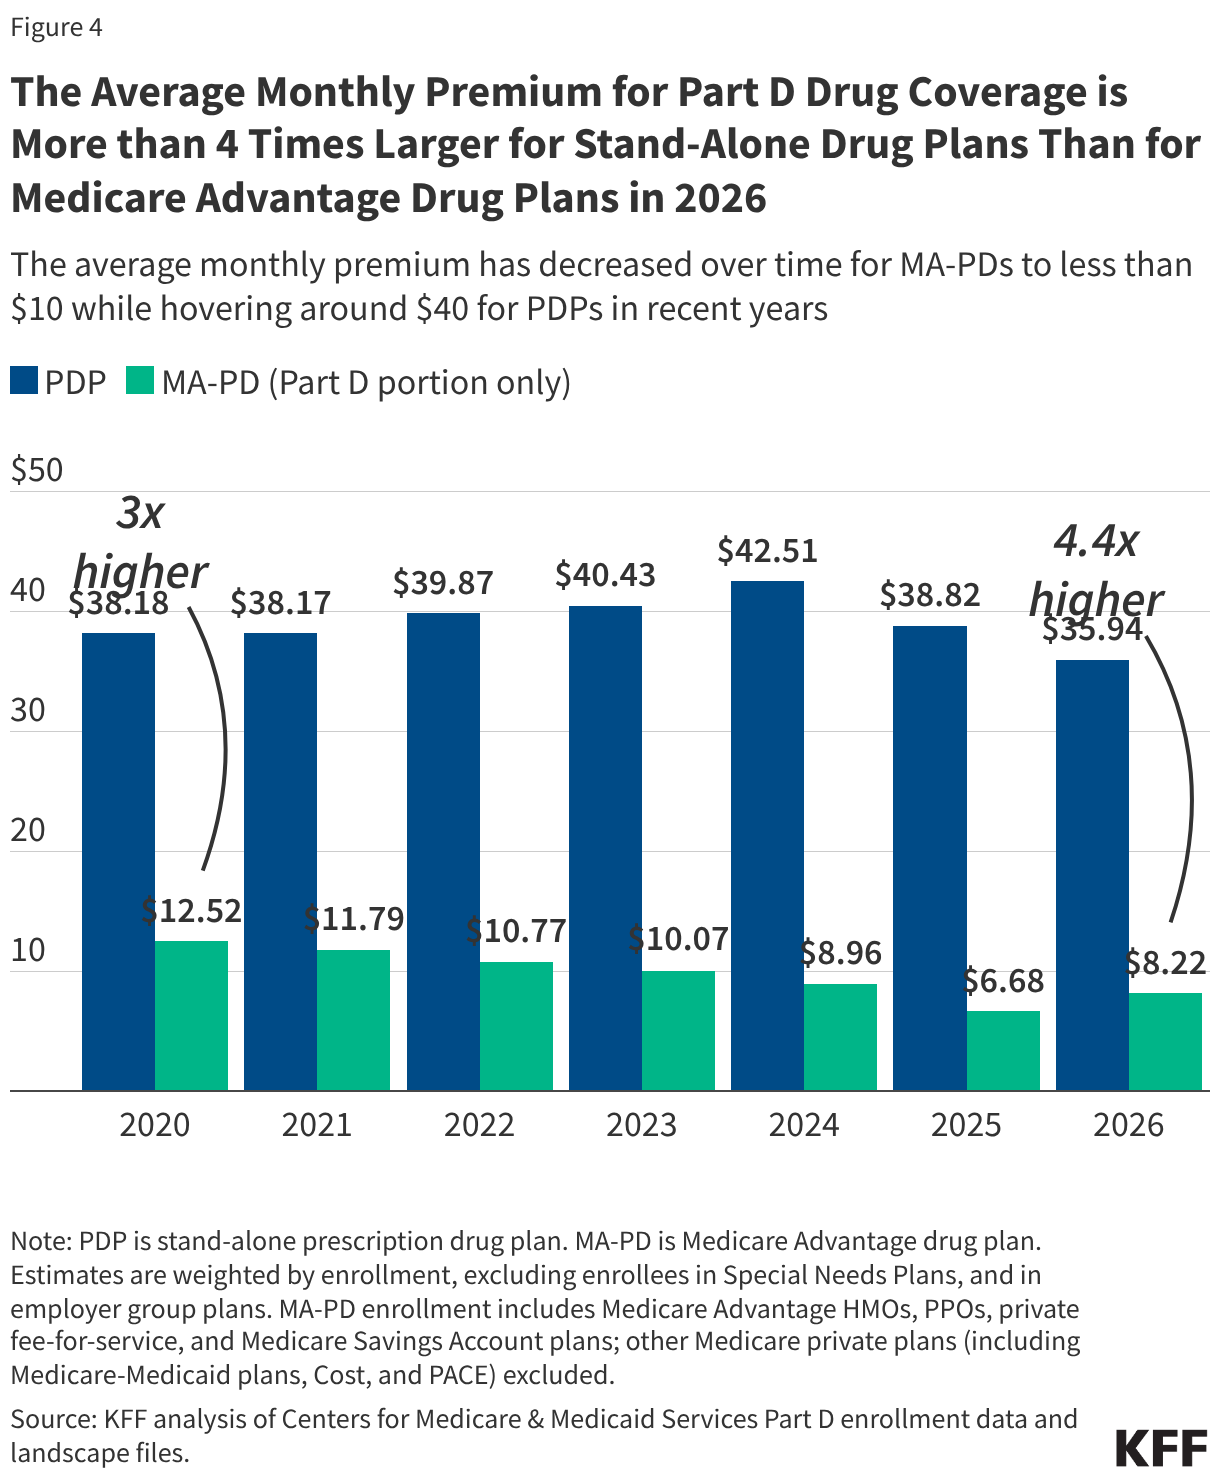
After premium subsidies from the 6% base beneficiary premium cap and rebates, the average monthly Part D premium for individual MA-PDs is projected to be $9 per month, compared to an average monthly premium of $44 per month for PDPs, after accounting for the 6% cap and the PDP premium stabilization subsidies (Figure 3). MedPAC’s estimates show that without these extra subsidies, average monthly premiums for MA-PDs and PDPs would be on par with each other in 2026 (with or without the 6% base beneficiary premium cap). (These estimates are MedPAC’s projections for average monthly premiums per member per month in 2026, based on 2025 enrollment and not accounting for new plans, plan changes during open enrollment, or new enrollees for 2026, and therefore differ from other estimates published recently in a separate KFF brief, which are based on March 2026 enrollment and take into account new plans, plan switching, and new enrollees for 2026.)

The Part D Premium Reduction from Rebates Used by MA-PD Plans is Projected to be Over Three Times Greater Than from the PDP Premium Stabilization Demonstration on a per Member per Month Basis in 2026— vs.  (Bar Chart)

For individual MA-PDs, the average monthly premium is projected to be $89 lower in 2026 than it would have been without the subsidies—from $98 per month to $9 per month. Rebate subsidies for Part D premium buydowns account for $53 of the premium reduction and subsidies from the 6% cap account for $36 of the reduction.

For PDPs, the average monthly premium is projected to be $53 lower in 2026 than it would have been without the additional subsidies—from $97 per month to $44 per month. Subsidies from the premium stabilization demonstration account for $16 of the premium reduction, while subsidies from the 6% cap account for $37 of the reduction.

The Total Amount of Medicare Advantage Rebates Used for Part D Premium Buydowns in 2026 is 3.5 Times Greater than Subsidies Provided Through the PDP Premium Stabilization Demonstration

The $13 billion in rebates provided by the federal government to individual Medicare Advantage plans used to buy down MA-PD Part D premiums in 2026 is 3.5 times larger than the $3.6 billion in premium subsidies to PDPs under the premium stabilization demonstration (Figure 2). According to GAO,the cost of the PDP premium stabilization demonstration for the first and second years of operation totaled $9.8 billion ($6.2 billion in 2025 and $3.6 billion in 2026). The cost of the demonstration was lower in 2026 than in 2025 because the Trump administration reduced the level of the premium subsidies provided to PDP sponsors in the second year of the demonstration. By comparison, rebates provided to individual Medicare Advantage plans used for Part D premium buydowns totaled $23.7 billion in 2025 and 2026 ($10.6 billion in 2025 and $13.0 billion in 2026). Between 2020 and 2026, rebates to Medicare Advantage plans to offer enhanced Part D benefits, including premium buydowns, totaled $82.2 billion. (These estimates exclude the aggregate cost of extra direct subsidies provided under the 6% base beneficiary premium cap, but this subsidy is applied equally across all plans.)

In 2026, Rebate Subsidies Provided to Medicare Advantage Plans for Part D Premium Buydowns Totaled  Billion, 3.5 Times More Than the .6 Billion in Demonstration Premium Subsidies to Part D Stand-Alone Drug Plan Sponsors (Grouped column chart)

A continuation of recent trends in the Part D market—fewer PDPs coupled with higher average premiums for PDPs than MA-PDs—could diminish the ability of Medicare beneficiaries in traditional Medicare to find PDPs at a comparatively affordable price, especially for those with modest incomes, which could make enrollment in Medicare Advantage more likely. Although there are some low-premium PDP options in 2026, roughly half of PDP enrollees are in plans charging $10 or more per month and 20% are paying $100 per month or more in 2026. The choice to enroll in a PDP versus an MA-PD plan comes with tradeoffs that extend beyond prescription drug coverage. While Medicare Advantage plans typically charge zero premium beyond the standard Part B premium and offer extra benefits beyond what is covered under traditional Medicare, they also have more limited provider networks and greater use of prior authorization than in traditional Medicare. Greater financial pressure on Part D plan sponsors that results in additional PDP withdrawals could also further reduce premium-free benchmark PDP options for low-income Medicare beneficiaries. Overall, instability in the PDP market has larger implications for the viability of traditional Medicare as an option for beneficiaries nationwide, but especially for beneficiaries who live in rural areas, who are more likely to be enrolled in traditional Medicare and rely more on drug coverage from PDPs than Medicare Advantage plans.

This work was supported in part by Arnold Ventures. KFF maintains full editorial control over all of its policy analysis, polling, and journalism activities.

Medicare Part D Enrollment, Premiums, and Cost Sharing in 2026

Authors: Juliette Cubanski and Anthony Damico
Published: Jun 11, 2026

The Medicare Part D program provides an outpatient prescription drug benefit to 56 million older adults and people with long-term disabilities in Medicare who enroll in private plans, including stand-alone prescription drug plans (PDPs) to supplement traditional Medicare and Medicare Advantage prescription drug plans (MA-PDs) that include drug coverage and other Medicare-covered benefits. This brief analyzes Medicare Part D enrollment and costs in 2026 and trends over time, based on data from the Centers for Medicare & Medicaid Services (CMS).

  • Enrollment in Medicare Part D stand-alone PDPs increased for 2026 to 24.9 million, up from 23.2 million in 2025, mainly due to growth in employer group plans. But Medicare Advantage continues to be the primary source of Part D drug coverage for people with Medicare, with 31.4 million enrollees. Enrollment in the Part D Low-Income Subsidy (LIS) increased in 2026, from 13.1 million to 13.6 million, offsetting a similarly sized decrease in enrollment in 2025.
  • Overall, Part D enrollment is concentrated in a handful of large plan sponsors, with the top 5 firms (UnitedHealth, Humana, Centene, CVS Health, and Health Care Service Corporation) covering nearly three-fourths of Part D enrollees. Centene is the top firm in the PDP market, with more than one-third (35%) of all PDP enrollees, while UnitedHealth is the top firm in the MA-PD market, with 26% of all MA-PD enrollees.
  • The temporary Part D premium stabilization demonstration for stand-alone PDPs continues to work as intended to help stabilize PDP premiums. The average monthly premium for Part D coverage decreased for PDPs in 2026 (from $39 to $36), while increasing modestly for MA-PDs (from $7 to $8). The average monthly premium for Part D coverage in 2026 is more than 4 times higher for PDPs than for MA-PDs, with most MA-PD enrollees in zero-premium plans, which reflects the ability of Medicare Advantage plan sponsors to reduce their Part D premiums using rebates that are not available to PDP sponsors. Nearly 8 in 10 MA-PD enrollees without low-income subsidies pay no monthly premium for Part D coverage in 2026 (not including premiums they may pay for medical benefits), compared to around 3 in 10 PDP enrollees in zero-premium plans.
  • Cost pressures for Part D plan sponsors under the redesigned Part D benefit are likely one factor in higher costs being passed along to both PDP and MA-PD enrollees in the form of higher deductibles and greater use of coinsurance. In 2026, most Part D enrollees pay either the standard $615 Part D deductible or a partial amount. The share of MA-PD enrollees in a plan that charges a deductible for drug coverage in 2026 is 82%, a sharp increase from 2024 when 23% of MA-PD enrollees were in a plan charging a drug deductible. The share of Part D enrollees in a plan charging no drug deductible decreased between 2025 and 2026, from 40% to 18% among MA-PD enrollees and from 15% to 4% among PDP enrollees.
  • Median cost-sharing amounts for covered drugs across different formulary tiers are the same or similar in PDPs and MA-PDs in 2026, but there is some variation in the share of PDPs and MA-PDs charging flat dollar copayments versus coinsurance (a percentage of the drug’s price) for preferred brands and non-preferred drugs. Virtually all PDP enrollees pay coinsurance for preferred brands (97%) and non-preferred drugs (100%), compared to 56% and 89% of MA-PD enrollees. But the use of coinsurance has increased on MA-PD formularies compared to 2025, when 27% of MA-PD enrollees faced coinsurance for preferred brands and 56% faced coinsurance for non-preferred drugs.

The number of Medicare Part D enrollees in stand-alone prescription drug plans increased in 2026, but enrollment remains higher in Medicare Advantage drug plans

More than half (56%) of all Part D enrollees in 2026 are in Medicare Advantage drug plans, continuing a trend of increasing enrollment in Medicare Advantage (Figure 1). At the same time, the overall number of PDP enrollees increased for the third year in a row and is up by 1.7 million since 2025, with most of the growth in employer group PDPs. The modest reduction in overall MA-PD enrollment between 2025 and 2026 (from 31.6 million to 31.4 million) reflects a shift in enrollment among employer group plan enrollees from group MA-PD plans to group MA-only plans with separate PDPs. (These enrollment trends are discussed in greater details in a separate KFF analysis, “Analyzing Changes in Medicare Part D Enrollment for 2026.”)

Medicare Part D Enrollment in Stand-Alone Prescription Drug Plans Increased in 2026, But Enrollment Remains Higher in Medicare Advantage Drug Plans (Stacked Bars)

An even larger share of Part D Low-Income Subsidy enrollees is in Medicare Advantage drug plans than Part D enrollees overall

The Medicare Part D Low-Income Subsidy (LIS) provides financial assistance with drug plan premiums and cost sharing for low-income enrollees. More than two-thirds (68%) of LIS enrollees—9.3 million out of 13.6 million—are enrolled in Medicare Advantage drug plans in 2026 (Figure 2). Nearly half of all LIS enrollees (6.7 million or 49%) are enrolled in Medicare Advantage Special Needs Plans (SNPs), nearly all of whom are in plans designed specifically for dual-eligible individuals (Appendix Table 1). LIS enrollment in MA-PDs has increased over time in tandem with overall enrollment of Medicare beneficiaries in Medicare Advantage plans generally and SNPs specifically.

Part D LIS enrollment overall increased modestly by 0.5 million in 2026, from 13.1 million to 13.6 million, offsetting a similar decrease in LIS enrollment in 2025. This decrease was likely due to Medicaid disenrollment among dual-eligible individuals that stemmed from the unwinding of the Medicaid continuous enrollment provision in place during the COVID-19 pandemic. Medicare beneficiaries with Medicaid coverage (dual-eligible individuals) automatically qualify for LIS, meaning a loss of Medicaid coverage would lead to a loss in LIS unless eligible individuals apply and enroll separately.

More Than Two-Thirds of Beneficiaries Receiving the Part D Low-Income Subsidy Are Enrolled in Medicare Advantage Drug Plans 2026 (Stacked Bars)

Five firms cover nearly three-fourths of Part D enrollees in 2026

Part D enrollment is concentrated in a handful of top plan sponsors, with 5 firms covering 74% of all Part D enrollees in 2026, or 41.9 million out of 56.3 million enrollees (Table 1). One in 5 enrollees (11.8 million) are in Part D plans sponsored by UnitedHealth, including both stand-alone PDPs and MA-PDs, followed by Humana and Centene, each with around 10 million enrollees across both types of Part D plans.

Centene is the top firm in the PDP market, with more than one-third (35%) of all PDP enrollees, followed by CVS Health (16%) and UnitedHealth (15%). UnitedHealth is the top firm in the MA-PD market, with 26% of all MA-PD enrollees, followed by Humana (20%) and CVS Health (10%).

Five Firms Cover Nearly Three-fourths of Part D Enrollees in 2026 (Table)

More than 6 million PDP enrollees—one-third of the total—are enrolled in the lowest-premium PDP in 2026

Among the 10 national PDPs available in 2026, the PDP with the lowest average monthly premium—Wellcare Value Script, at just under $6—has attracted a substantial share of all PDP enrollees, with one-third of PDP enrollees in non-group plans (6.1 million) (Figure 3). Between 2025 and 2026, Wellcare Value Script gained 1.1 million PDP enrollees, as several other national PDPs experienced smaller increases and some PDPs lost enrollment (Appendix Table 2).

More Than 6 Million PDP Enrollees - One-Third of the Total - Are In the Lowest-Premium PDP in 2026 (Split Bars)

The number and share of LIS enrollees in national PDPs vary considerably, which is related to the fact that only 1 of these 10 plans (Wellcare Classic) is a benchmark PDP in all 34 PDP regions, meaning it is available to all Part D enrollees receiving LIS for no premium (4 other PDPs are benchmark plans in some but not all regions) (Appendix Table 3). A majority of all enrollees in Wellcare Classic (82% or 2.2 million) are receiving LIS, along with 60% of enrollees (0.7 million) in HealthSpring Assurance Rx, a benchmark plan in 11 regions, and 36% of enrollees (0.4 million) in Humana Basic Rx Plan, a benchmark plan in 30 regions. In contrast, only 3% of the 6.1 million enrollees in Wellcare Value Script are LIS enrollees; despite its low average premium, this is an enhanced PDP and therefore does not qualify to be a benchmark plan.

Overall, 14% (0.6 million) of the 4.2 million PDP enrollees receiving LIS in 2026 (excluding those in employer group plans) are enrolled in non-benchmark PDPs. LIS enrollees in non-benchmark plans are required to pay a portion of the plan’s premium for the cost of basic benefits that exceeds the LIS benchmark amount in their region or if their plan charges a premium for enhanced benefits.

The average monthly premium decreased for PDPs in 2026, but the premium for Part D coverage is still substantially higher for PDPs than for MA-PDs

The temporary Part D premium stabilization demonstration for stand-alone PDPs established by the Biden administration in 2024 and renewed for a second year by the Trump administration in 2025 continues to work as intended to help stabilize PDP premiums, with the average monthly PDP premium decreasing 7% between 2025 and 2026, from $39 to $36. This is despite monthly premium increases in some PDPs of up to $50, the maximum increase allowed in 2026 for plans participating in the premium stabilization demonstration.

On average, PDP enrollees continue to pay substantially more each month for their Part D drug coverage than enrollees in MA-PDs. The $36 average monthly PDP premium is more than 4 times higher than the $8 average monthly premium for drug coverage in MA-PDs (weighted by enrollment) (Figure 4). (The total average premium for MA-PDs, including all Medicare-covered benefits, is $15 per month in 2026.) The weighted average MA-PD premium for Part D coverage increased modestly between 2025 and 2026 (up from $7 to $8). (These estimates are based on enrollment in March 2026 and factor in new plans for 2026, plan changes during open enrollment, and new enrollees, and therefore differ from other estimates published in a separate KFF brief, which are based on MedPAC’s projection of average monthly Part D premiums in 2026 using 2025 enrollment and not factoring in new plans, plan switching, or new enrollees.)

The average premium for drug coverage in MA-PDs is heavily weighted by zero-premium plans because MA-PD sponsors can use rebate dollars from Medicare payments to lower or eliminate their Part D premiums. Rebates to Medicare Advantage plans have tripled since 2015 and now exceed $2,600 per year per beneficiary. 

The Average Monthly Premium for Part D Drug Coverage is More than 4 Times Larger for Stand-Alone Drug Plans Than for Medicare Advantage Drug Plans in 2026 (Grouped column chart)

Within the PDP market, average monthly premiums vary by the generosity of Part D coverage offered by a given plan—namely, whether they are basic or enhanced plans, and the amount of the drug deductible. Enhanced Part D plans offer a more generous benefit than basic plans through lower cost sharing, a lower (or no) drug deductible, or better formulary coverage. In 2026, 58% of PDP enrollees (10.8 million) are in enhanced PDPs, and they face an average monthly premium of $39, 27% higher than the average $31 premium faced by the 42% of PDP enrollees (7.8 million) in basic plans. Only 4% of PDP enrollees are in a plan charging zero deductible, but they face an average monthly premium of $127, while the 78% of PDP enrollees in a plan charging the standard $615 deductible face an average monthly premium of $22. Among MA-PD enrollees, there is considerably less variation in monthly premiums by these measures of plan generosity, which reflects both the large share of MA-PD enrollees in zero premium plans (as described below) and the fact that 94% of MA-PD enrollees are in enhanced plans.

Nearly 8 in 10 MA-PD enrollees without low-income subsidies pay no monthly premium for Part D coverage, while around 3 in 10 PDP enrollees pay no premium

Nearly 80% of MA-PD enrollees without low-income subsidies (79% or 14.3 million) pay no monthly premium for Part D coverage in 2026, compared to 28% of PDP enrollees without LIS (4.0 million) (Figure 5). For the average Medicare beneficiary in 2026, 21 out of their 32 MA-PD options charge no premium for drug coverage, while 2 out of their 11 PDP options charge no premium.

Nearly 80% of MA-PD Enrollees Pay No Monthly Premium for Part D Coverage in 2026 Compared to 28% of PDP Enrollees (Stacked Bars)

Of the 4.0 million non-LIS PDP enrollees paying zero premium, 62% (2.5 million) were enrolled in Wellcare Value Script, which was available for zero premium in 14 out of 34 PDP regions, 10% (0.4 million) in Humana Basic Rx, which was available for zero premium in 21 regions, and another 10% in Humana Value Rx, available for zero premium in 5 regions.

While 79% of non-LIS MA-PD enrollees pay no premium for drug coverage, among the 21% who do, the average monthly premium for drug coverage is $40 per month. Among the 72% of PDP enrollees who pay a monthly premium, their average monthly premium is $57.

Roughly one-third of PDP enrollees without LIS (35%, or 5.1 million) pay premiums above zero but less than $30 per month, but 1 in 5 (20%, or 2.9 million) pay at least $100 per month for their Part D plan (Figure 6). In contrast, less than 1% of non-LIS MA-PD enrollees pay $100 per month or more in Part D premiums.

The share of MA-PD enrollees in a plan with a drug deductible has increased substantially since 2024; in 2026, most Part D enrollees pay either the standard $615 Part D deductible or a partial amount

Increasing cost pressures for Part D plan sponsors under the redesigned Part D benefit are a likely factor in higher costs being passed along to both PDP and MA-PD enrollees in the form of higher deductibles and greater use of coinsurance (as described below). Among MA-PD enrollees, 82% (16.8 million) are in a plan that charges a deductible for drug coverage in 2026 – a sharp increase from 2024 when 23% of MA-PD enrollees were in a plan charging a deductible (increasing to 60% in 2025) (Figure 6). In 2026, 25% of MA-PD enrollees are in a plan that charges the standard deductible of $615 (up from 3% in 2024 and 12% in 2025) and 57% face a partial deductible. The share of MA-PD enrollees in a plan charging no drug deductible has fallen from 77% in 2024 to 18% in 2026.

There have been comparatively fewer changes in the distribution of PDP enrollees facing different drug deductible levels since 2024. Nearly all PDP enrollees (96% or 18 million) are in a plan that charges a drug deductible in 2026, including more than three-fourths (78%) in a plan that charges the standard deductible of $615 and 18% facing a partial deductible. The share of PDP enrollees facing no drug deductible in 2026 has fallen to 4%, down from 15% in 2025 and 13% in 2024. (These estimates include Part D enrollees receiving Low-Income Subsidies, who do not pay a deductible regardless of whether their plan charges one.)

The Share of MA-PD Enrollees in a Plan with a Drug Deductible Has Increased Substantially Since 2024; In 2026, Most Part D Enrollees Pay Either the Standard 5 Part D Deductible or a Partial Amount (Stacked Bars)

The weighted average drug deductible has increased substantially for MA-PD enrollees since 2024. In 2026, the average Part D deductible is $371 in MA-PDs, up 63% since 2025 ($228) and 481% since 2024 ($64) (Figure 7). For PDP enrollees, the weighted average Part D deductible has increased more gradually but has remained higher than the average Part D deductible for MA-PD enrollees. In 2026, the average Part D deductible is $544, up 11% since 2025 ($491) and 23% since 2024 ($425).

The Weighted Average Part D Deductible Has Increased Substantially for MA-PD Enrollees Since 2024, While Increasing More Gradually, But at a Higher Level, Among PDP Enrollees (Line chart)

In 2026, more Part D enrollees overall face coinsurance rather than copayments for preferred brands and non-preferred drugs

As in previous years, Part D enrollees face low copayments for generic drugs and higher cost-sharing amounts for preferred brands, non-preferred drugs, and specialty drugs regardless of whether they are in PDPs or MA-PDs (Figure 8). Median cost-sharing amounts for drugs covered on preferred generic, generic, and preferred brand tiers are the same or similar in PDPs and MA-PDs, but there is some variation in the share of PDPs and MA-PDs charging flat dollar copayments versus coinsurance (a percentage of the drug’s price) for preferred brands and non-preferred drugs.

Virtually all PDP enrollees pay coinsurance for preferred brands (97%) and non-preferred drugs (100%); among MA-PD enrollees, these shares are 56% and 89%, respectively. However, these rates have increased compared to 2025, when 27% of MA-PD enrollees faced coinsurance for preferred brands and 56% faced coinsurance for non-preferred drugs. The median coinsurance rate for preferred brands is 25% in PDPs and 21% in MA-PDs, and for non-preferred drugs, 34% in PDPs and 38% in MA-PDs.

Median coinsurance for specialty tier drugs (those that cost over $950 in 2026) is higher for MA-PD enrollees than PDP enrollees—28% vs. 25%. Plans that waive some or all of the standard deductible, which most MA-PDs do, are permitted to set the specialty tier coinsurance rate above 25%.

These cost-sharing amounts apply when beneficiaries fill prescriptions in the initial coverage phase of the Part D benefit. Under a provision in the Inflation Reduction Act, beneficiaries no longer face cost sharing in the catastrophic coverage phase of the Part D benefit. In 2026, Medicare beneficiaries pay no more than $2,100 out of pocket for prescription drugs covered under Part D.

Median Cost-Sharing Requirements are Similar Across PDPs and MA-PDs (Split Bars)

Among the 10 PDPs offered in most or all PDP regions, most charge $0 for preferred generics but only 1 PDP charges flat copayments for preferred brands and all charge coinsurance for non-preferred drugs

Part D enrollees in 8 of the 10 national or near-national PDPs face a median copayment of $0 for preferred generics, while median copays for drugs on the standard generic tier range from $0 to $10 (Figure 9). For preferred brands, 9 of the 10 PDPs charge coinsurance, with median amounts ranging from 17% to 25%, and only 1 national PDP (Humana Premier Rx) charges a copay. All 10 national or near-national PDPs charge coinsurance for non-preferred drugs, ranging from 29% to 50% at the median, and coinsurance for specialty tier drugs ranging from 25% to 33%.

Among the 10 PDPs Offered In Most or All PDP Regions in 2026, Most Charge alt=
Medicare Part D and Part D Low-Income Subsidy Program Enrollment, by Plan Type, 2006-2026 (Table)
Enrollment and Premiums for Medicare Part D Stand-Alone Prescription Drug Plans Offered in Most or All 34 PDP Regions in 2025 and 2026 (Table)
Enrollment in Medicare Part D Stand-Alone Prescription Drug Plans Offered in Most or All PDP Regions in 2026, By Low-Income Subsidy Status (Table)

How Has Insurer Participation in the ACA Marketplaces Changed in 2026?

Authors: Jared Ortaliza, Justin Lo, Matt McGough, and Cynthia Cox
Published: Jun 11, 2026

Editorial Note

This brief was updated on June 22, 2026 to correct insurer counts for Minnesota.

For the first time since the enhanced premium tax credits were introduced in 2021, insurer participation in the ACA Marketplaces has gone down. This drop follows the expiration of the enhanced premium tax credits at the end of 2025 and is primarily driven by the exit of Aetna CVS from 17 states as well as exits from other insurers. While the average number of insurers per state offering plans in the Marketplaces in 2026 is lower than in the years after the enhanced premium tax credits were established, more insurers are now offering plans than were before the enhanced tax credits.  

Key Findings

  • The average number of issuers offering plans in the ACA Marketplaces has declined from a record high of 9.6 issuers per state in 2025 to 9.0 issuers per state in 2026.
  • In total, 19 states experienced a net decrease in the number of issuers offering ACA Marketplace plans.
  • 1 in 3 counties has fewer participating ACA insurers than last year. In 165 counties, only one issuer is offering plans on the ACA Marketplace, up from 93 counties in 2025.

Insurer Participation

National Level

Figure 1

Nationally, average insurer participation in the ACA Marketplaces has decreased from the record high of 9.6 insurers per state in 2025 to 9.0 insurers per state in 2026. This decrease follows the nationwide departure of CVS from the Exchanges and marks the first time since 2018 that the average number of insurers in the ACA Marketplaces has gone down. Insurer participation on the ACA Marketplaces fell in 2017 with the exit of UnitedHealthcare from most states. In 2018, following several attempts to repeal the ACA in Congress as well as changes to enforcement of the individual mandate and payments for cost-sharing reductions, many more insurers exited or scaled back their participation. As the Marketplace stabilized in the following years, participation in the ACA Marketplaces steadily grew with some insurers returning to the Marketplace and several others expanding their footprints.

One factor that contributes to the number of insurers participating in the Marketplaces is the number of people with coverage. After the introduction of the enhanced premium tax credits in 2021, enrollment in the Marketplaces reached new records. In line with this trend, the number of insurers offering plans in the ACA Marketplaces increased significantly in 2022. Data shows that after the expiration of the enhanced premium tax credits, 2026 Open Enrollment Period sign-ups declined by over one million people relative to last year; and the number of people who pay to maintain and “effectuate” their coverage will likely decline throughout the year. KFF estimates that average effectuated enrollment in the Marketplaces could decline by about five million people from 2025 to 2026.

ACA Marketplace enrollment declines affect the size of the potential market for insurers and, potentially, the risk pool—to the extent that healthier than average enrollees are more likely to drop coverage. As people leave the Marketplace, insurers may reassess the profitability of their Marketplace participation and more may decide to pull out in the future, either fully or in select states. Several insurers have already announced departures for the 2027 plan year. KFF’s Insurer Participation Tracker maps announced insurer exits and entries for 2027.

State Level

On Average, 9 Insurers Participate in Each State's ACA Marketplace (Choropleth map)

The five states with the most insurers offering plans in their ACA Marketplaces in 2026 are Texas (15), New York (12), California (11), Florida (11), and Wisconsin (11). Going into 2026, most states had the same number of issuers participating in their Marketplaces as in 2025.

In 19 states, the number of insurers offering ACA Marketplace plans in 2026 is lower than in 2025. Illinois and Michigan saw the greatest net decrease in the number of carriers, with three fewer insurers participating in their Marketplaces than in 2025. This decrease resulted from insurers exiting the Marketplace or being acquired by another insurer, reducing the overall number operating in a state. In Minnesota, Medica began administering UCare plans after the latter entered receivership.

Four states (Alabama, Iowa, Louisiana, and Washington) experienced a net increase of one insurer. For example, Oscar Health newly joined the Exchange in Alabama and Elevance Health (doing business as Wellpoint) began offering plans in Washington.

The most prominent insurer in the Marketplace is UnitedHealth, which offers Marketplace plans in 30 states. Some of the other major players currently in the Marketplace include Centene Corporation (29 states), Oscar Health (20 states), Elevance Health (18 states), Molina Healthcare (14 states), Cigna Health (11 states), and Kaiser (10 states). CVS, which ran Aetna plans in the ACA Marketplaces, was a significant insurer participating in the ACA Marketplaces in 2025. Before leaving the Marketplace for plan year 2026, CVS Aetna offered plans in 17 states.

Some of the aforementioned insurers are among those with the largest number of enrollees in the individual market (the vast majority of which was made up of people in the Marketplace in 2025). For example, in 2024, 18% of people in the individual market were enrolled in a plan offered by the Centene Corporation and 8% of individual market enrollees were in a plan offered by CVS.

County Level

Figure 3

Even if an insurer remains in a state, it may significantly change its footprint from year to year. Insurers adjust their footprints by expanding into some counties or withdrawing from others. For example, UnitedHealth scaled back its footprint in Kansas from 87% of counties in 2025 to 33% in 2026, and in South Carolina from 72% of counties in 2025 to 37% in 2026. However, it also expanded its service area in Oklahoma, offering plans in 74% of counties in 2026, up from 18% in 2025. Another major player in the ACA Marketplaces, Centene Corporation, went from offering plans in all counties in North Carolina in 2025 to 63% of counties in 2026. This decrease is driven by the exit of WellCare (a subsidiary of Centene) from the North Carolina Marketplace starting in 2026. In Iowa, Centene’s footprint increased from 33% to 59% of its counties going from 2025 to 2026.

165 Counties Have Only One Insurer Offering Plans in the ACA Marketplace (Choropleth map)

In 2026, 1 in 3 counties saw a decrease in the number of insurers participating in the Marketplaces. The counties that experienced the greatest number of insurers leaving were in Wisconsin, which saw two insurers (Chorus Community Health Plan and Molina Healthcare) exiting the ACA Marketplace entirely as well as shrinking presence of others (namely, CareSource and University Health Care and Gundersen Lutheran). Some counties in North Carolina and Michigan also experienced significant declines in the number of participating insurers, with as many as three carriers leaving counties starting in 2026.

In total, 165 counties have only one insurer offering plans in the ACA Marketplaces in 2026. For 90 of these counties, this is a result of insurers not offering plans in that county anymore starting in 2026. For the remaining 75 one insurer counties, the number of carriers offering plans remains the same as in 2025.

There Are 490 Counties Where There Are More ACA Marketplace Insurers Offering Silver Plans Than Bronze Plans (Choropleth map)

Issuers do not always offer bronze plans. By law, every ACA Marketplace insurer must offer at least one silver and gold plan wherever they sell coverage. In 2026, there were 490 counties (predominantly located in New Mexico, Indiana, Mississippi, New Jersey, Texas, and South Carolina) where some participating insurers decided not to offer bronze plans. In these places, the selection of plans for consumers who wish to decrease their premium payments by buying a lower coverage metal level may be reduced. However, for 433 of these 490 counties, at least two insurers offer bronze plans.

Methods

The Qualified Health Plan Individual Medical Landscape File and Robert Wood Johnson Foundation (RWJF) HIX Compare file were used to determine the number of insurers participating in states using the federal platform and state-based Exchanges, respectively. HIOS IDs from these files were mapped to the 2024 MR Submission Template Header to determine the NAIC Code for each insurer, which was then joined with 2025 data from Mark Farrah Associates’ Enrollment by Segment Exhibit (downloaded December 9, 2025) to identify the parent company associated with each insurer. In cases when a parent company is not successfully identified through the MR Submission Template Header and the Enrollment by Segment Exhibit, additional work was done to identify and manually assign either the NAIC code or parent company name for each plan.  Insurer in this analysis refers to parent company, irrespective of the name under which it does business across states.

The following manual additions/changes were also made:

  • Data for New York was adjusted to include Anthem Blue Cross and Blue Shield HP, Anthem Blue Cross HP, and Independent Health.
  • Bronze plans identified to be in San Juan County, Washington after combining the RWJF datasets together were removed.
  • The parent company for UCare Plans in Minnesota in 2026 was changed to Medica to reflect Medica's acquisition of UCare's individual market contracts.

HIX Compare insurer plan availability is reported by rating area—which may contain multiple counties—in conjunction with insurer participation reported by county. County-level insurer counts of plans in state-based Marketplaces may consequently be overstated when the insurer does not offer a given plan in a county but offers other plans in the same county, notably for plans of a given metal level. Although plan availability can vary within a county (such as by ZIP code), a plan is considered as available if offered anywhere in the county.

Appendix

Appendix Figure 1

VOLUME 48

Rare or Unverified Outcomes Shape Vaccine Safety and Gender Care Debates


Highlights

Two recent federal actions, including a memo about alleged COVID-19 vaccine deaths and settlements creating a “detransition clinic,” show how official actions can present uncertain or uncommon outcomes as representative and lend credibility to narratives that go beyond what evidence supports.


Recent Developments

Official Actions Elevate Uncertain or Uncommon Outcomes in Debates Over Vaccine Safety and Gender-Affirming Care

Official actions can elevate unverified or uncommon outcomes in ways that shape public perceptions beyond what evidence suggests. Two developments show how such actions can lend weight to narratives not borne out by evidence, one by overstating a causal link not supported by data, and the other by creating an institution based on a premise research does not support.

FDA Analysis of Pediatric Deaths After COVID Vaccination Shows Weaker Link Than Officials Claimed

A small number of unverified reports became the basis for a claim of definitive, widespread harm when, last November, then-FDA vaccine chief Vinay Prasad told agency staff in an internal memo that at least 10 children had died “after and because of” receiving a COVID-19 vaccine, using that claim to argue for changes to vaccine approval and oversight.

The underlying analysis made public last month, however, found no deaths definitively linked to COVID-19 vaccination. The FDA reviewed 96 reports of child deaths submitted to the Vaccine Adverse Event Reporting System (VAERS) through August 2025. Using WHO criteria and reviews of medical records and death certificates, officials concluded that none were “certain” to be linked to vaccination. Five were classified as “possible” and two as “probable,” but the report notes alternative explanations could not be ruled out. Most cases involved myocarditis, a rare heart inflammation that can also be caused by common infections, including COVID-19 itself.

The original memo presented preliminary findings with a certainty the underlying data did not support and did not reflect the limitations of VAERS, which is not intended to establish causality. The communication of vaccine safety information may be especially consequential at a time when confidence in COVID-19 vaccine safety remains lower than confidence in other childhood vaccines: KFF’s January Tracking Poll on Health Information and Trust found that eight in ten (81%) adults expressed confidence in the safety of MMR vaccines for children, compared to fewer than half (48%) who said the same about COVID-19 vaccines, though views of the COVID-19 vaccines are largely partisan.

Settlements Create “Detransition Clinic” Amid Narratives That Overstate Transition Regret

New efforts related to gender-affirming care for minors have presented cases of “detransition” or transition regret as representative of broader outcomes or a pattern of harm, though research finds both to be uncommon outcomes. Claims about “irreversible harm” often rely on inflated statistics, anecdotal stories, or misleading characterizations of surgeries for minors, which are rare and generally not recommended for younger adolescents. While some transgender people do choose to detransition, specialized clinics are not required to support this care.

Legal settlements reached last month between Texas Children’s Hospital, the Texas attorney general, and the U.S. Department of Justice may implicitly reinforce those narratives by creating what state officials called the country’s first “detransition clinic,” a facility for patients who want to stop or reverse a gender transition. The creation of such a clinic contrasts with research about gender-affirming care in practice. Many youth transition by making easily reversible social changes, like changes in clothing, names, or pronouns. Among transgender people who pursue medical transition, detransition is uncommon and transition regret rates are low. Many who do detransition cite pressure and discrimination rather than regret or a change in gender identity. Major medical associations continue to support gender-affirming care for minors when delivered carefully and with clinical oversight.

By creating a dedicated clinic, the settlements may reinforce narratives that frame regret and detransition as common outcomes. Additionally, DOJ’s involvement adds to the pressure providers have experienced in the face of a range of administration actions aimed at limiting this care, with effects potentially extending beyond Texas. At least 40 health care institutions have walked back such services since January 2025, generally citing external pressure rather than concerns about safety or effectiveness.

Why It Matters: When unrepresentative or unconfirmed cases are presented through official channels as representative of broader patterns of harm, they can appear to carry a credibility that the underlying evidence does not support.


What We’re Watching

Public Health Officials Are Tailoring Measles Vaccination Communication Strategies to Local Contexts Amid Declining Institutional Trust

As the ongoing measles outbreak surpasses 2,030 confirmed cases nationwide this year as of June 4, state health officials are adapting their communication strategies in response to declining trust in public health institutions and vaccines. In Utah, which has seen more than 600 cases since the outbreak began, officials have pursued a strategy of what they call “coordinated autonomy.” State health officials say they are coordinating with local health departments and trusted community figures like religious leaders to carry vaccine messaging, while deliberately avoiding a standardized state-wide response. This decentralized approach that relies on localized decision-making and voluntary behavior was shaped by post-COVID-19 pandemic distrust. According to reporting, Utah officials anticipate that a more coordinated response could backfire in communities where trust in government public health authorities has eroded. In practice, this has meant local health departments tailoring their own outreach. In southwest Utah, for example, officials have used weekly radio spots, press releases, and direct outreach to religious leaders, and focused messaging on asking residents who suspected they had measles to call before visiting a clinic.

Some other states with recent outbreaks, including South Carolina, rolled out a more state-wide, top-down public health response. Top-down approaches typically involve large-scale coordinated campaigns, and in South Carolina, this included mobile clinics, quarantine of unvaccinated individuals exposed to the virus, and structured briefings, alongside community outreach. These measures, while still more targeted than a broad COVID-style response, relied more on statewide coordination and a centralized approach. Cases in Utah have declined and South Carolina’s outbreak has been declared over, but whether and how much the different strategies contributed to those trends is difficult to assess.

The difference in approach represents a broader challenge in public health and vaccine communication that the current low-trust environment has made more difficult to navigate. Community-based approaches, particularly those relying on trusted local messengers, have shown effectiveness at building vaccine confidence in previous outbreaks, especially when messengers adapt to specific community concerns. Top-down approaches have also shown effectiveness at the population level. Research shows these approaches are particularly effective when barriers to vaccination are primarily about access or awareness and when existing infrastructure, like school vaccine requirements and established provider-patient relationships, provides a foundation for outreach. They may be less effective, though, in reaching strongly hesitant or polarized populations. Evidence on what strategies are most effective in the current low-trust environment remains limited.

Why It Matters: As research evolves, the strategies that work in one community may not work in another, and understanding what drives those differences is increasingly relevant to how outbreaks are managed.

Polling Insights: KFF polling has found that public trust in both federal health agencies and state government officials to provide reliable vaccine information has declined since the beginning of the COVID-19 pandemic. Prior KFF polling has also found that trust in state officials for vaccine information varies depending on whether people share the same political party as their state leadership. Democrats living in states with Democratic governors were more likely than Democrats in Republican-governed states to express trust in their state officials for vaccine information (66% v. 42%), as were Republicans living in states with Republican governors compared to Republicans in Democratic-governed states (47% v. 27%). This interplay of partisanship and trust may further impact how the public responds to public health communication strategies on the state and local level.

Split bar chart showing trust in state officials to provide reliable information about vaccines among Democrats and Republicans.

Knowledge Gaps About STIs and STI Prevention Persist

More than 2.2 million cases of chlamydia, gonorrhea, and syphilis were reported nationwide in 2024, 13% higher than a decade ago. Accurate understanding of how sexually transmitted infections (STIs) spread and which can be prevented may help address these rates, but a poll from the Annenberg Public Policy Center shows persistent gaps in knowledge and some enduring misconceptions about common STIs.

Most Americans understand the basics of how STIs spread, correctly identifying common transmission routes, though 1 in 5 (20%) incorrectly said sitting on a toilet seat was a risk. Knowledge about which STIs can be prevented through vaccination was more uneven. Awareness was highest for human papillomavirus (HPV), with 68% correctly identifying that a vaccine exists, though 14% incorrectly said it would lead teenagers to engage in risky sexual behavior. Less than half (42%) were aware that mpox was vaccine-preventable, and for infections with no available vaccine, like HIV and genital herpes, at least half were unsure or incorrectly believed vaccines existed.

Why It Matters: These gaps in public knowledge may contribute to vaccination decisions, even for infections where vaccines are available and recommended. The KFF/The Washington Post Survey of Parents, for example, found that about one in five (19%) parents of children under age 9 (who are not yet eligible for the HPV vaccine) said they would “probably not” or “definitely not” vaccinate their child for HPV, and another one in five (22%) were not sure. In open-ended responses, some parents who said they would not vaccinate their child for HPV cited concerns that the vaccine is associated with unsafe sexual behavior, while others cited concerns over side effects and safety.


AI & Emerging Technology

Researchers Explore Whether AI Can Help Build Resistance to False Health Claims

As about one-third of adults now turn to AI chatbots and other AI tools for health information, researchers are examining both the risks AI poses for the information environment and ways it might be used to counter false health claims. One line of research draws on “cognitive inoculation,” exposing people to weakened forms of misleading claims before they encounter them. The approach can function similarly to a vaccine by helping build resilience to false claims.

A study published this spring tests whether AI can extend that approach through personalized conversation, which has historically been harder to deliver at scale. Researchers built a chatbot to guide users through structured conversations about health-related misconceptions, including about binge drinking and the link between physical activity and mental health. The chatbot presented itself as a believer of these misconceptions and guided users to find evidence refuting them. Researchers compared the chatbot against reading an educational essay and writing refutations of common misconceptions, finding that the chatbot outperformed both alternatives in helping participants maintain confidence in accurate beliefs after exposure to a false claim.

AI is often discussed as a vector for false health claims, but this study offers an early signal that it may also help counter them. The small sample size and narrow focus make the findings difficult to generalize, and more research is needed before drawing broader conclusions.

About The Health Information and Trust Initiative: the Health Information and Trust Initiative is a KFF program aimed at tracking health misinformation in the U.S., analyzing its impact on the American people, and mobilizing media to address the problem. Our goal is to be of service to everyone working on health misinformation, strengthen efforts to counter misinformation, and build trust. 


View all KFF Monitors

The Monitor is a report from KFF’s Health Information and Trust initiative that focuses on recent developments in health information. It’s free and published twice a month.

Sign up to receive KFF Monitor
email updates


Support for the Health Information and Trust initiative is provided by the Robert Wood Johnson Foundation (RWJF). The views expressed do not necessarily reflect the views of RWJF and KFF maintains full editorial control over all of its policy analysis, polling, and journalism activities. The data shared in the Monitor is sourced through media monitoring research conducted by KFF.

House Appropriations Committee Releases FY 2027 Labor, Health and Human Services, Education, and Related Agencies (Labor HHS) Appropriations Bill & Accompanying Report

Published: Jun 10, 2026

The House Appropriations Committee released its Fiscal Year 2027 Labor, Health and Human Services, Education, and Related Agencies (Labor HHS) appropriations bill on June 4, 2026 and accompanying explanatory report on June 8, 2026.

While most U.S. global health funding is provided to the State Department through a separate appropriations bill (see the KFF budget summary on this funding here), the Labor HHS appropriations bill includes funding for global health programs at the Centers for Disease Control and Prevention (CDC) as well as funding for global health research activities at the National Institutes of Health (NIH). Total global health funding at CDC and NIH through the Labor HHS bill is not yet known, as funding for some programs (i.e. global HIV/AIDS and malaria research) at NIH is determined at the agency level rather than specified by Congress in annual appropriations bills. Funding for global health in the Labor HHS bill remained flat compared to the FY 2026 level as follows:

  • CDC: Funding for global health programs at CDC totals $693 million, flat compared to the FY 2026 enacted level. This total includes funding provided for parasitic diseases and malaria, which the House bill moved to CDC’s Center for Emerging and Zoonotic Infectious Diseases but is included in the total here for comparison purposes. Within CDC, funding for polio and global public health protection were maintained at the FY 2026 level, and all other program areas (global HIV/AIDS, global tuberculosis, measles and other vaccine preventable diseases) were consolidated into the newly established “Global Emerging Infectious Diseases” line. The House report also directs “continued coordination with the State Department’s Bureau of Global Health Security and Diplomacy” on the implementation of the President’s Emergency Plan for AIDS Relief (PEPFAR) and other global health programs, “provides funding to be programmed by the CDC Director to sustain in-country health security capacities with international partners,” as well as “directs CDC to prioritize existing CDC international staffing, and to provide a briefing to the Committee not later than 90 days after enactment of this Act on the status of its engagement with the Department of State, the agency’s current global health workforce capacity, overseas staffing footprint, and plans to bolster core global health security and infectious disease response capabilities.”
  • NIH: Funding for global health research activities at the Fogarty International Center (FIC) at NIH totals $95 million, the same level as the FY 2026 enacted amount.

In addition, Section 235 under the Labor HHS section of the bill specifically states that funding “shall be for the budget activities, and in the amounts specified in the table under each such heading in the report accompanying this Act” instructing the administration to provide the amounts for the areas specified.

See the table below for additional details on global health funding. See other budget summaries and the KFF budget tracker for details on historical annual appropriations for global health programs.

KFF Analysis of Global Health Funding in the FY 2027 House Labor, Health and Human Services, Education, and Related Agencies (Labor HHS) Appropriations Bill & Accompanying Report (Table)