Medicaid Program Integrity: Tracking State-Specific and Nationwide Federal Action

Published: Jun 25, 2026

The Trump Administration and Congress continue to focus on rooting out fraud, waste, and abuse in federal programs, including Medicaid. Those efforts include 50-state initiatives and targeted actions that focus on issues in specific states. Given the quickly evolving Medicaid program integrity landscape, this page tracks emerging developments in the federal government’s approach to program integrity in Medicaid, along with the implications of those actions for different states. For more detailed analyses and context, see ‘Related Resources’ in Section 2.

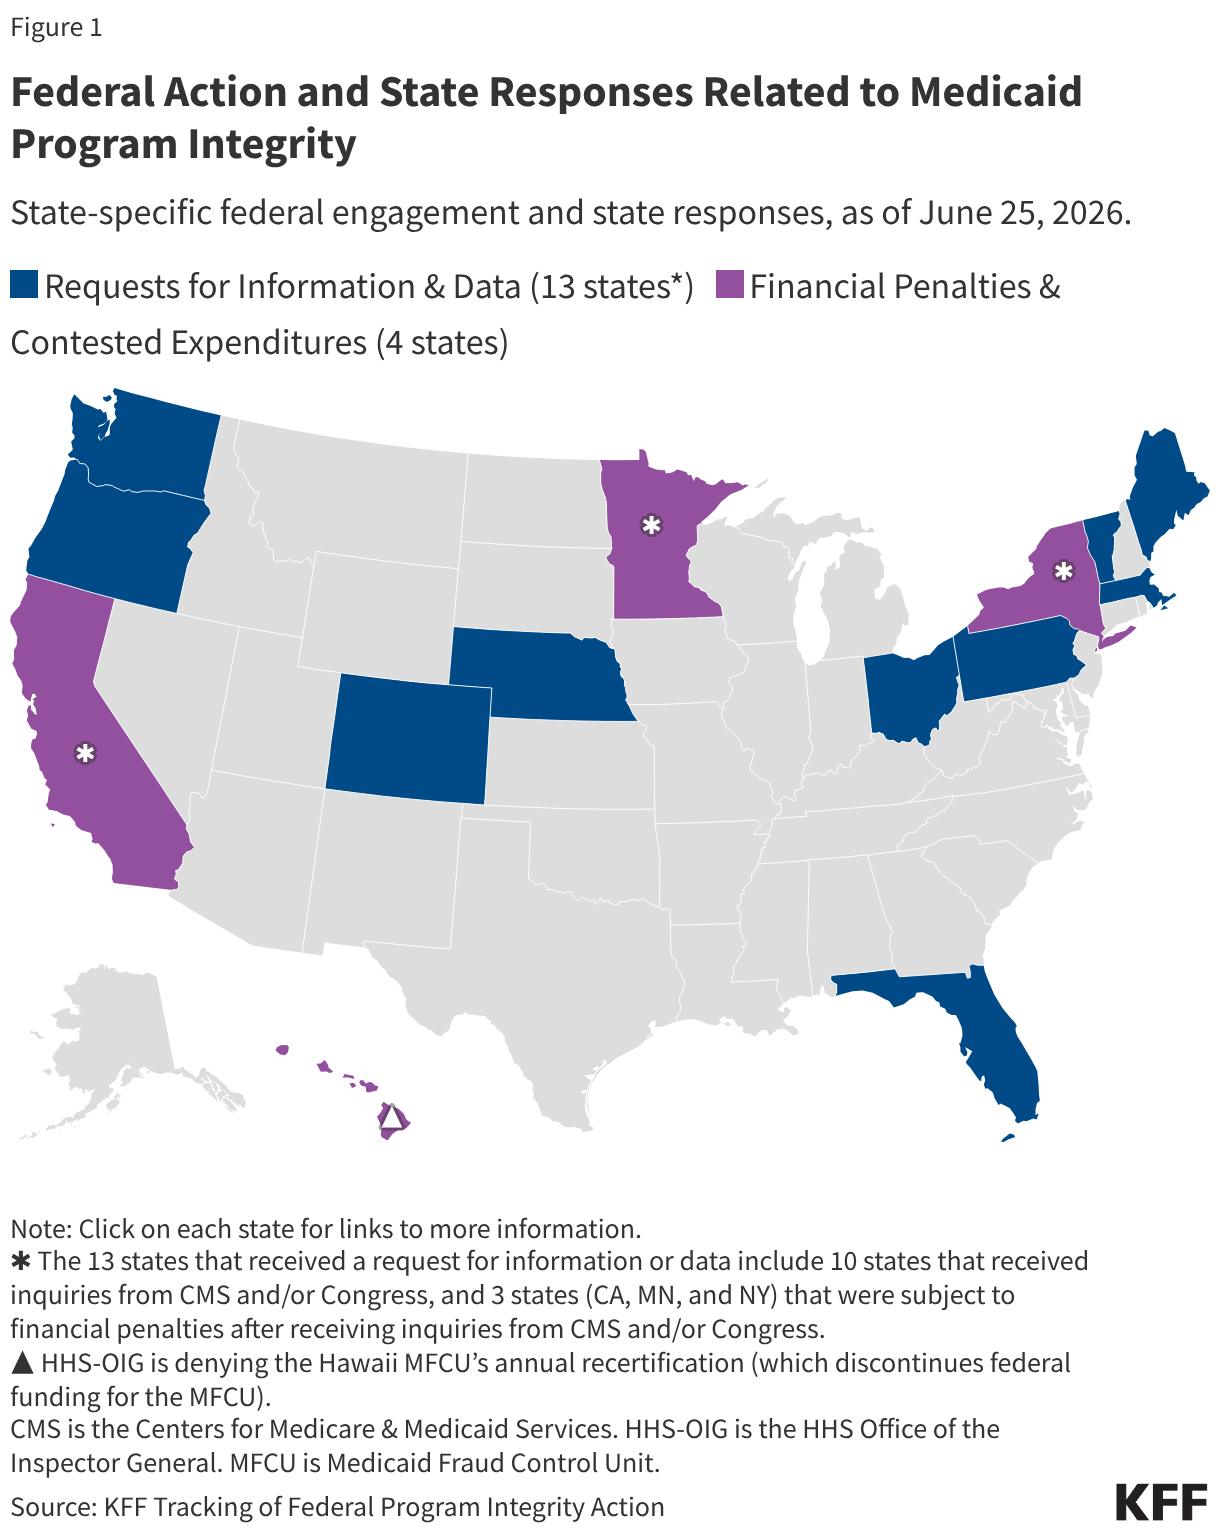
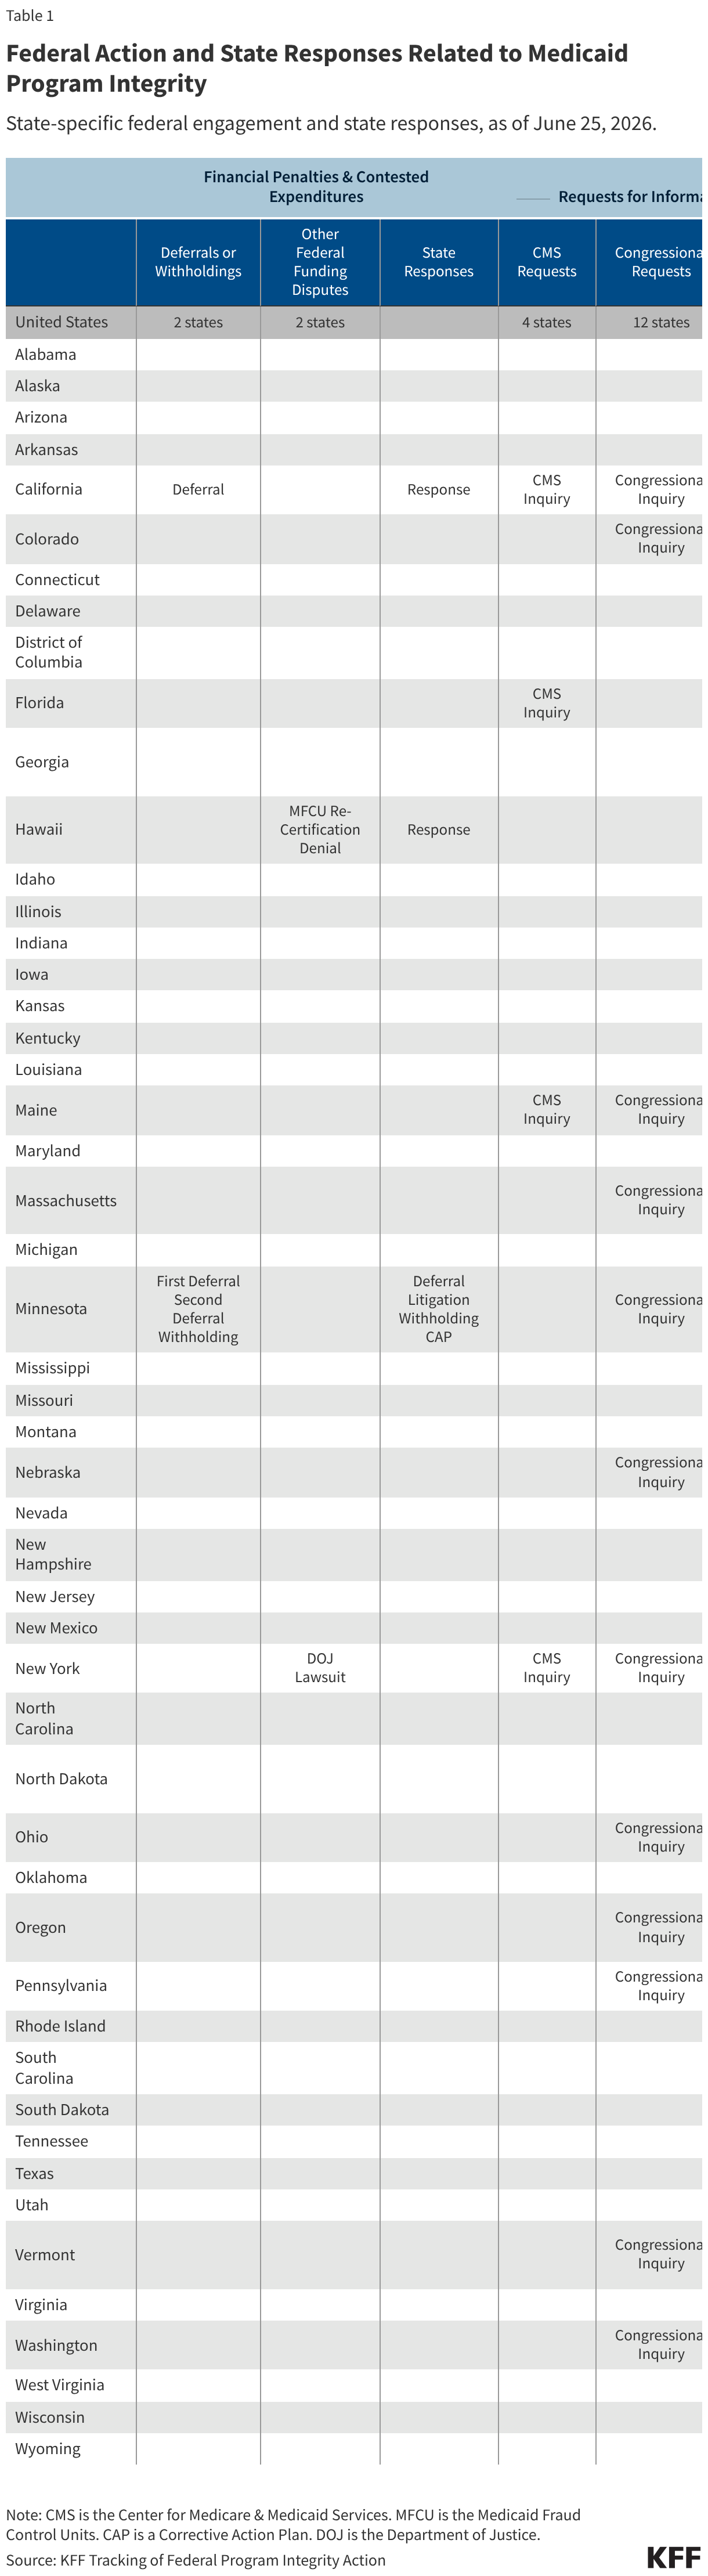
This page tracks the federal government’s 50-state initiatives and targeted actions focused on Medicaid program integrity (Figure 1 and Table 1). The map and tracker include federal actions towards states and exclude actions towards providers (such as those governing providers’ ability to participate in Medicaid and civil or criminal charges).

The following federal actions are included when materials are publicly available, along with states’ publicly available responses:

  • Financial penalties and contested expenditures including:
    • Notices of potential or actual withholding, deferrals, or disallowances of federal funding expressly tied to program integrity concerns; and
    • Other federal Medicaid funding in dispute (e.g., Health and Human Services (HHS)-Office of the Inspector General (OIG) funding for Medicaid Fraud Control Units or Department of Justice (DOJ)-contested state Medicaid program expenses).
  • Requests for state information and state responses, including formal inquiries, probes, or other materials that investigate specific state Medicaid programs or require states to respond with new information or an action plan.

The figure and table exclude the following actions:

  • Routine deferrals/disallowances (i.e., deferrals/disallowances only for longstanding disputed Medicaid claims and/or are not identified by CMS as expressly tied to concerns about fraud/waste/abuse);
  • HHS-OIG audits that are initiated as part of planned work and are more narrow or targeted in scope, and/or are not expressly tied to broader concerns about fraud/waste/abuse;
  • Routine DOJ proceedings (i.e., proceedings which target specific instances of fraud/waste/abuse against a Medicaid program but do not name a state Medicaid official as party to the case nor tie state claims for federal Medicaid funds to a case outcome); and
  • State or federal actions that do not have publicly available documentation (i.e., actions that may be referenced or announced in reporting or on social media but without documentation from federal or state governments).
Federal Action and State Responses Related to Medicaid Program Integrity (Choropleth map)
Federal Action and State Responses Related to Medicaid Program Integrity (Table)

Key Facts About Medicare Spending Trends and Projections from the 2026 Medicare Trustees Report

Published: Jun 24, 2026

On June 9, 2026, the Medicare Trustees issued the annual report on the financial status of the Medicare program for 2026. The Trustees highlighted that the Medicare Part A trust fund is projected to be depleted in 2033, the same year but one quarter earlier than last year’s projection. In addition to discussing the status of the Part A trust fund, the report also provides substantial additional details on federal spending for Medicare Part B and Part D benefits, the distribution of spending for traditional Medicare and Medicare Advantage, and revenue sources for Medicare, along with updated spending and revenue projections and a detailed discussion of factors that have contributed to changes in the program’s financial outlook. This brief provides an overview of key trends in Medicare spending and spending growth, as well as the impact of these trends on out-of-pocket costs for Medicare beneficiaries and Medicare program solvency, as projected by the Medicare Trustees.

Physician Services and Other Outpatient Services Account for Roughly Half of Total Medicare Benefits Spending

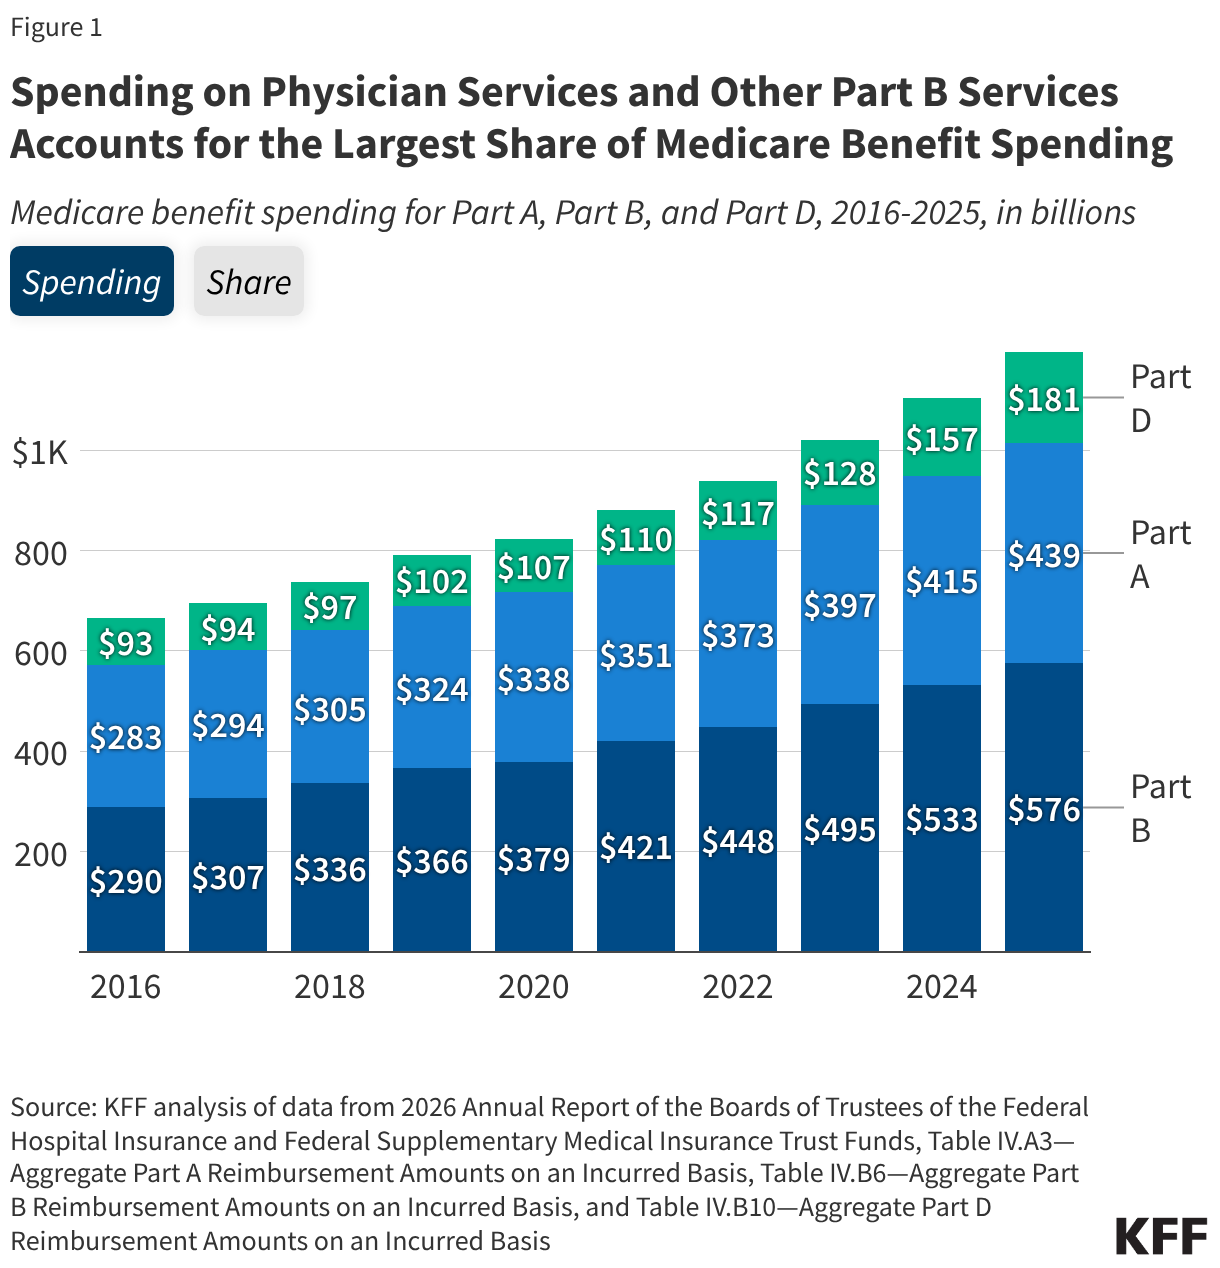
In 2025, Medicare benefit payments totaled $1.2 trillion, up from $666 billion a decade earlier (Figure 1). Spending on Part B services (including physician services, outpatient services, and physician-administered drugs) accounts for the largest share of Medicare benefit spending (48% in 2025), as it has since 2015. In contrast, spending on Part A services (including inpatient hospital services, skilled nursing facility services, and hospice care) has declined as a share of Medicare benefit spending (from 43% in 2016 to 37% in 2025). Over time, this decline has been driven in part by a shift of some services from inpatient to outpatient settings reflecting changes in practice patterns, along with increases in spending on services covered under Part B, including high-cost physician-administered drugs. Spending on Part D prescription drugs has accounted for a relatively constant share of Medicare benefit spending for much of the past decade (12-13%) but rose to 15% in 2025 and is projected to continue growing in the coming years.

Spending on Physician Services and Other Part B Services Accounts for the Largest Share of Medicare Benefit Spending (Stacked column chart)

Spending on Part A and Part B Benefits in Traditional Medicare Was $481 Billion in 2025

Looking at spending by type of service in traditional Medicare, the single largest category of benefit spending in 2025 was for inpatient hospital services covered under Part A (spending by type of service for Medicare Advantage enrollees is unavailable). Although a relatively small share of beneficiaries use inpatient hospital services, these services accounted for roughly one-third of total benefit spending in traditional Medicare ($159 billion or 33%), followed by outpatient hospital services covered under Part B ($76 billion or 16%) (Figure 2). This means that combined spending on hospital services (both inpatient and outpatient) accounted for nearly half of spending on Part A and Part B benefits in traditional Medicare in 2025. Services covered under the Medicare Part B physician fee schedule accounted for $71 billion (15%), and the remaining $174 billion (36%) consisted of payments for all other Part A and Part B services, including physician-administered drugs (8%), skilled nursing facility services (6%), and hospice care (6%), among others.

Figure 2

Spending on the Medicare Part D Prescription Drug Benefit is Projected to be Significantly Higher Over the Coming Decade Compared to Last Year’s Projections

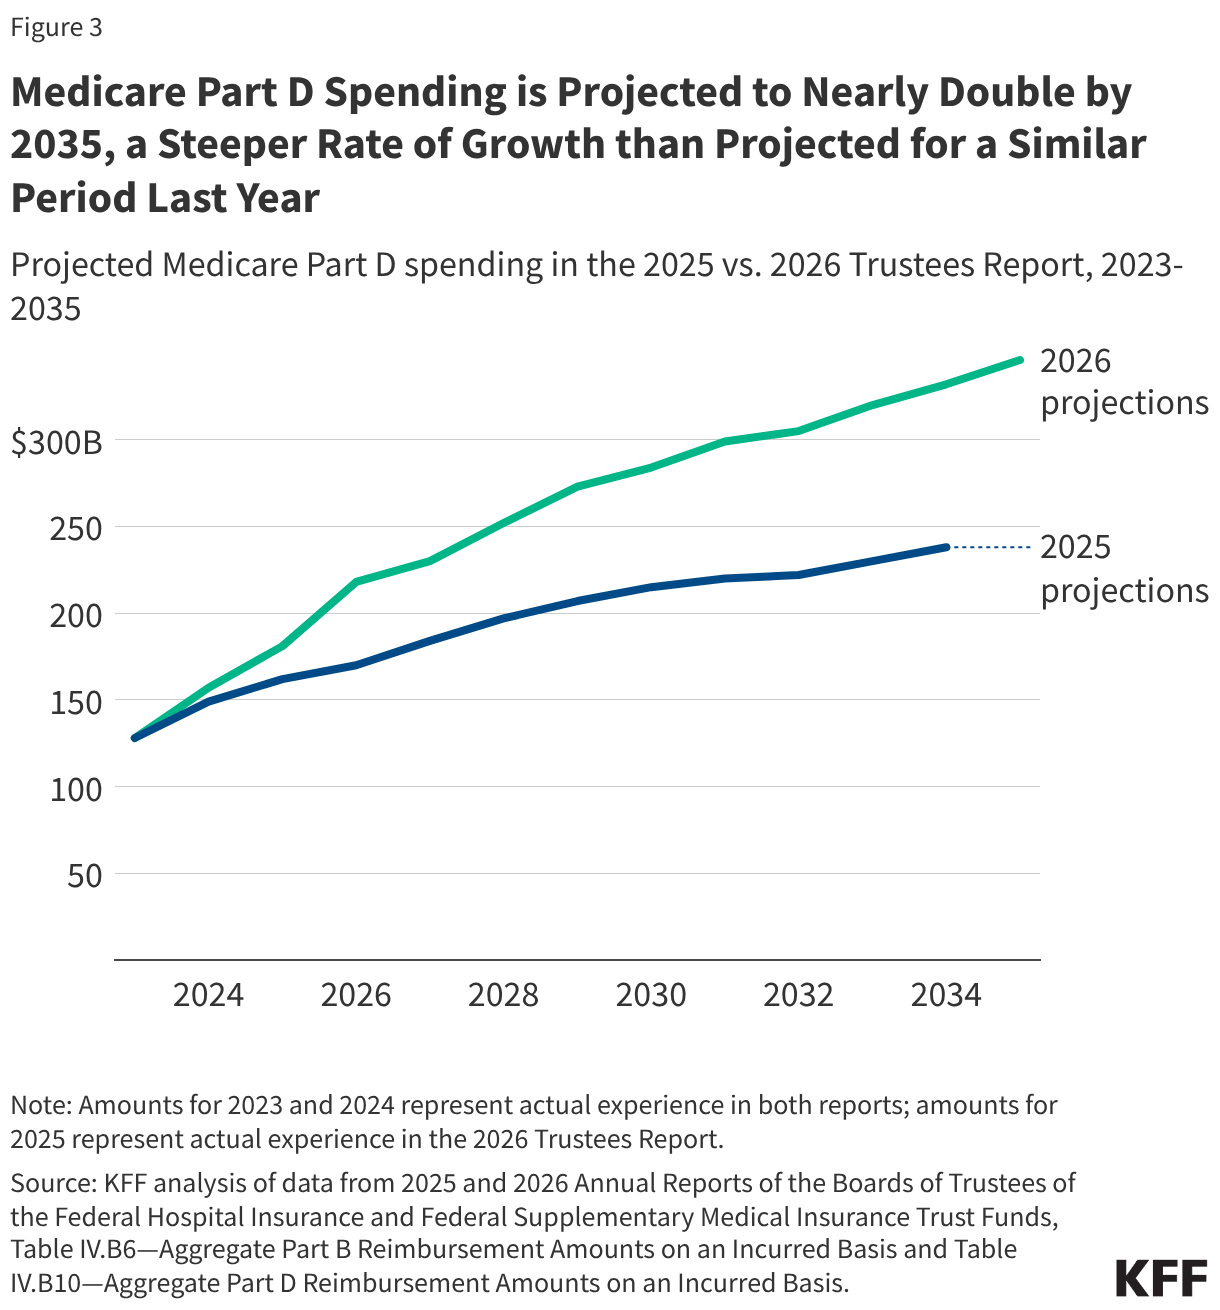
The Medicare Trustees currently project that Medicare Part D spending will nearly double from 2025 ($181 billion) to 2035 ($346 billion), representing an average annual growth rate of 6.7% compared to the 4.8% that was projected for a similar period last year (Figure 3). The Trustees indicate that higher spending projections for Part D in the 2026 report are due to increased use of GLP-1s and other high-cost specialty drugs. The Trustees also point to other factors that have contributed to changes in Part D spending in recent years, including the pharmacy price concessions policy that lowers point-of-sale prices for beneficiaries but reduces rebate revenue to Part D plans, which leads to higher federal Part D spending; the exemption of more orphan drugs from drug price negotiation in the 2025 budget reconciliation bill (H.R. 1), which will lower federal savings from negotiation; and the redesigned Part D benefit that improved the generosity of coverage while shifting more liability onto plans and increased the level of federal subsidies for coverage. These higher spending trends are offset somewhat by the effect of drug price negotiations and inflation rebates established by the Inflation Reduction Act.

Medicare Part D Spending is Projected to Nearly Double by 2035, a Steeper Rate of Growth than Projected for a Similar Period Last Year (Line chart)

Spending on Medicare Advantage was $534 Billion in 2025, Over Half (53%) of Total Medicare Program Spending

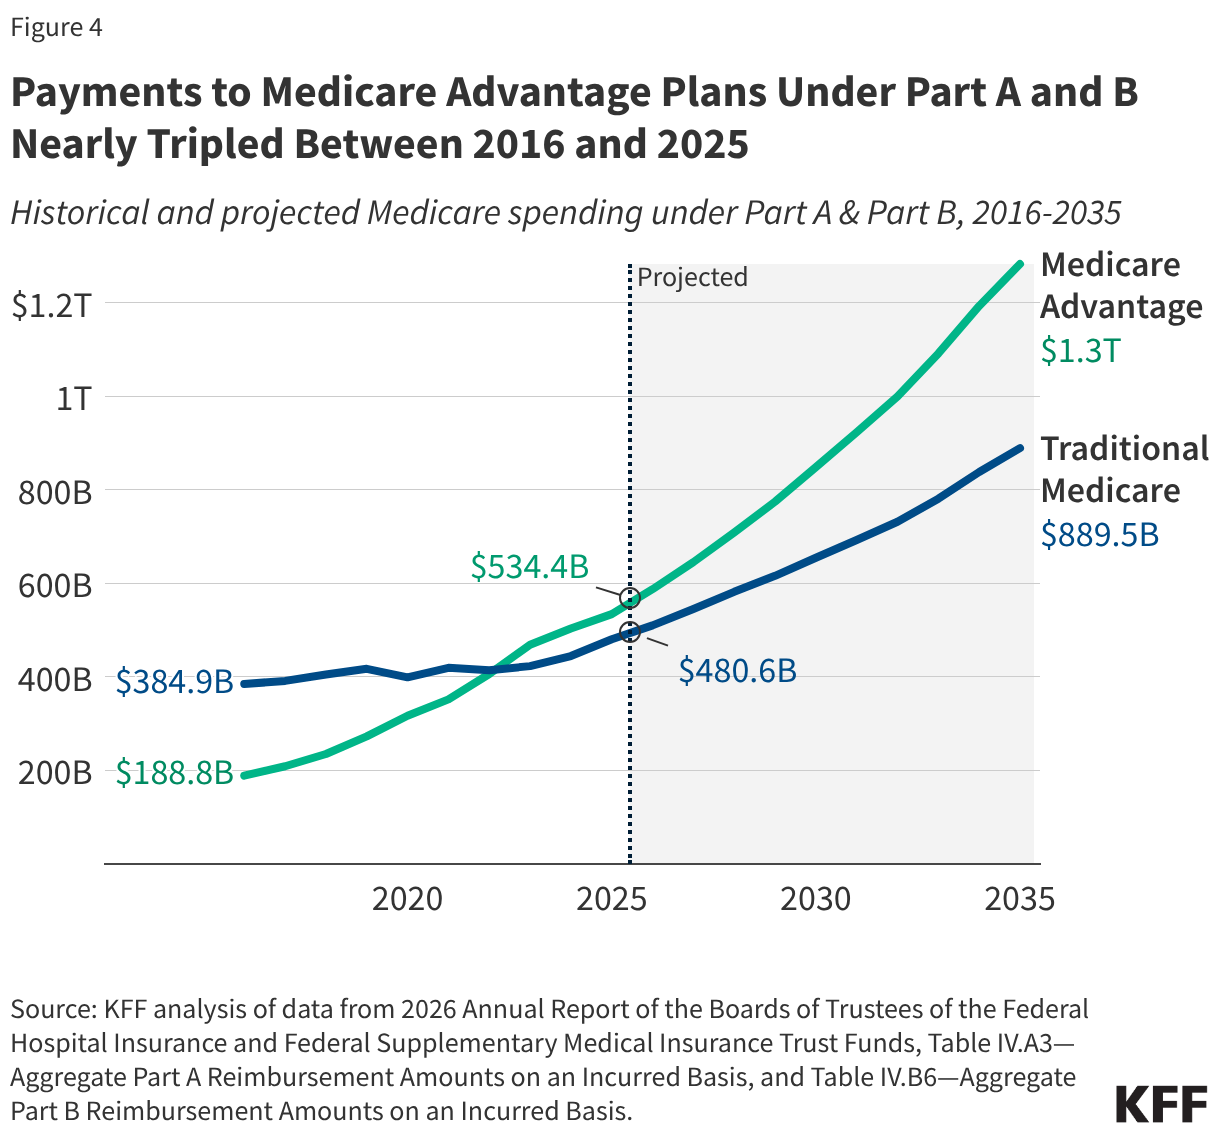
Payments to Medicare Advantage plans under Medicare Part A and Part B nearly tripled as a share of total Part A and Part B spending between 2016 and 2025 (from $189 billion to $534 billion), including payments for the cost of Part A and Part B services, as well as rebates, which must be used to reduce cost sharing, pay for extra benefits, or buy down the Part B and/or Part D premium (Figure 4). This growth is partly due to increased enrollment in Medicare Advantage plans, which rose from 33% to 54% of all eligible beneficiaries over this same period. At the same time, Medicare pays an estimated 14% more per enrollee in Medicare Advantage than it would if the same beneficiary were covered by traditional Medicare, resulting in $76 billion in additional Medicare spending in 2026. Those higher payments largely reflect the impact of higher coding intensity and favorable selection into Medicare Advantage. Growth in Medicare Advantage spending is projected to continue into the next decade, with payments to Medicare Advantage plans under for Part A and B benefits projected to increase to $1.3 trillion in 2035, or 59% of total Part A and Part B spending.

Payments to Medicare Advantage Plans Under Part A and B Nearly Tripled Between 2016 and 2025 (Line chart)

The Medicare Part A Trust Fund is Projected to be Depleted in 2033, Seven Years from Now

The depletion of the reserves in the Medicare Hospital Insurance (Part A) trust fund, which pays for inpatient hospital, skilled nursing facility, home health, and other Part A services, is projected to occur in the second quarter of 2033, based on the latest projections from the Medicare Trustees (Figure 5). This is one quarter earlier than the projection in last year’s report. According to the Medicare Trustees, the earlier depletion date is primarily the result of updated estimates of Social Security tax revenue (one source of Part A funding) that are lower than previously projected due to changes in the 2025 budget reconciliation bill (H.R. 1). If the reserves in the Part A trust fund are fully depleted, Medicare would not have sufficient funds to cover Part A benefit spending for the full year without additional revenues or reductions in spending on benefits or payments to providers.

Figure 5

Projected Increases in Medicare Spending Will Lead to Higher Medicare Premiums and Cost-Sharing Requirements

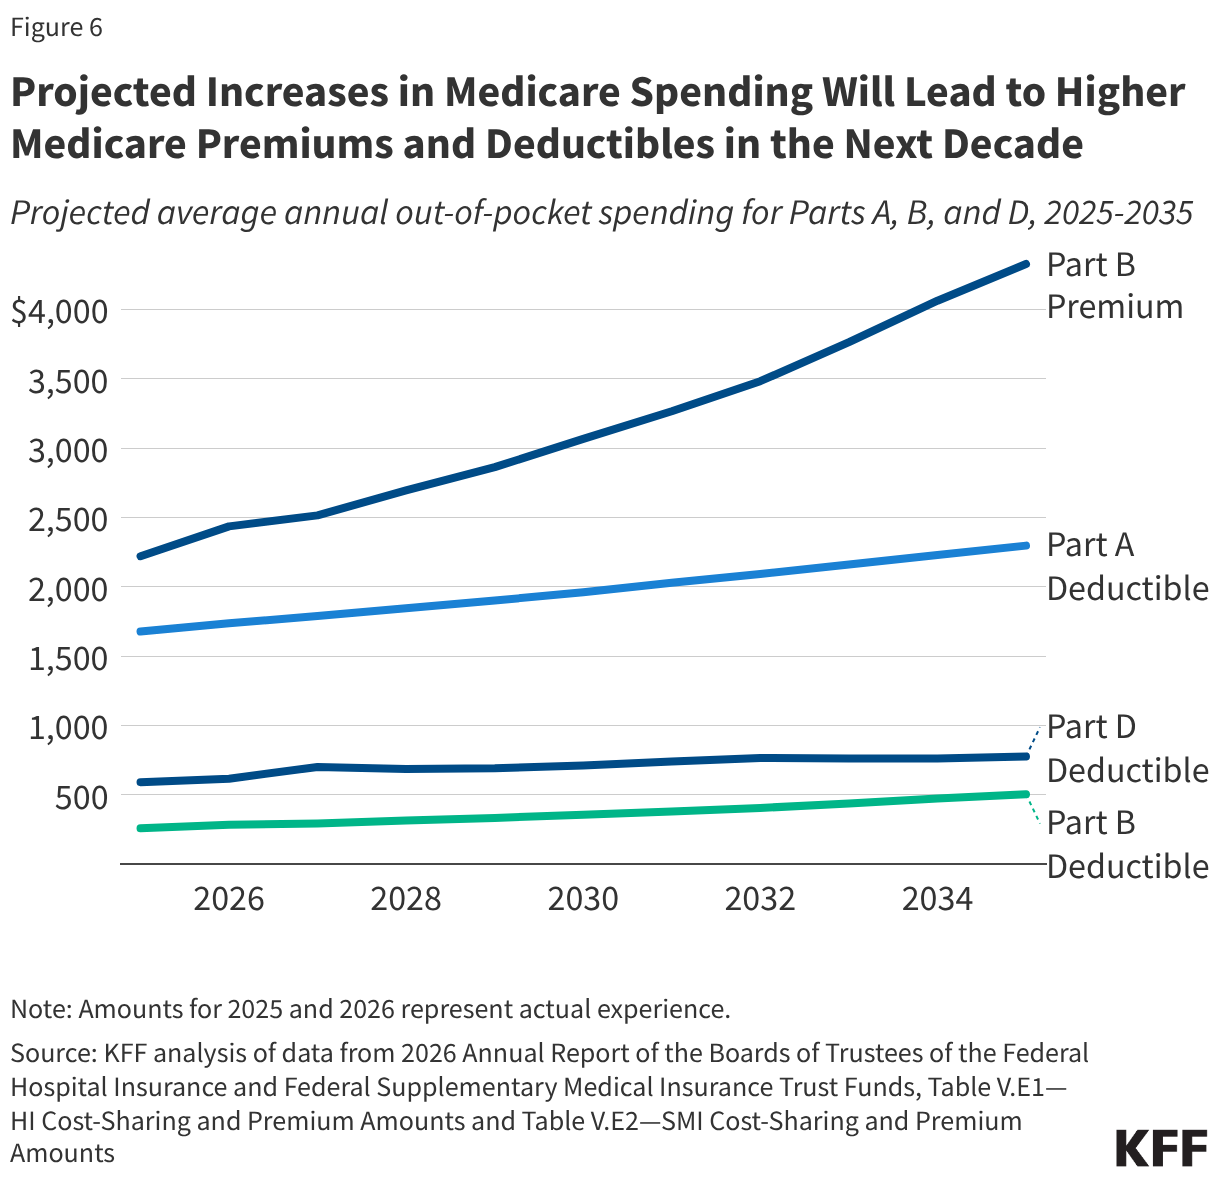
Medicare’s premium and cost-sharing requirements are determined annually based on expected growth in Medicare benefit costs for the coming year (though the exact approach to determining these amounts is different in each part). For 2027, the Trustees project that the monthly Part B premium will increase from $203 to $210 (3.3%), after increasing from $185 to $203 between 2025 and 2026 (9.7%). Likewise, the Part A hospital deductible is projected to increase from $1,736 to $1,788, and the Part D deductible from $283 to $292 in 2027. Further increases are estimated for the duration of the 10-year projection period in the 2026 Trustees report (Figure 6). These amounts may not reflect the costs that all beneficiaries face, particularly enrollees in Medicare Advantage plans, where cost sharing is generally different from the standard cost-sharing requirements for traditional Medicare beneficiaries. In 2024, seven million Medicare beneficiaries spent more than 10% of their income on the Part B premium alone. Increases in Medicare premiums and other out-of-pocket costs may represent a growing burden for many beneficiaries if income growth does not keep pace.

Projected Increases in Medicare Spending Will Lead to Higher Medicare Premiums and Deductibles in the Next Decade (Line chart)

U.S. Global Health Legislation Tracker

Published: Jun 23, 2026

This tracker provides a listing of global health-related legislation being considered by the 119th Congress (Jan. 3, 2025 – Jan. 3, 2027). Currently, there are more than 50 pieces of legislation related to global health. They address topics ranging from global health security to reproductive health to the World Health Organization (WHO). Sometimes a bill may address broader topics, but this tracker focuses on the global health aspects of the legislation.

The tracker includes the bill title, sponsor(s), current status, and topic, as well as a short description of its global health-related provisions. The tracker includes bills only; resolutions are not included. Legislation is listed in alphabetical order by short title. In certain cases, identical bills have been introduced in both chambers of Congress (often referred to as companion bills). For example, the Global Health, Empowerment and Rights Act and the WHO is Accountable Act were each introduced in both chambers. Such companion bills are listed separately in the tracker.

The tracker will be updated periodically.

Global Health Legislation During the 119th Congress
(as of June 17, 2026) (Table)

The Medical Frailty Exemption from Medicaid Work Requirements: Key Takeaways from the CMS Interim Final Rule

Published: Jun 23, 2026

On June 1, 2026, the Centers for Medicare and Medicaid Services (CMS) issued a long-anticipated interim final rule that will guide state implementation of Medicaid work requirements. The 2025 reconciliation law requires 44 states to condition Medicaid eligibility for adults in the Affordable Care Act (ACA) Medicaid expansion group and enrollees in certain waiver programs, including in non-expansion states (Georgia, Tennessee, and Wisconsin), on meeting work requirements starting January 1, 2027, or sooner at state option. The law specifies mandatory exemptions, including individuals who are “medically frail.” Given the abbreviated implementation timeline, states had tentatively moved forward with key decisions over how to implement the medical frailty exemption even as they waited for formal guidance from CMS.

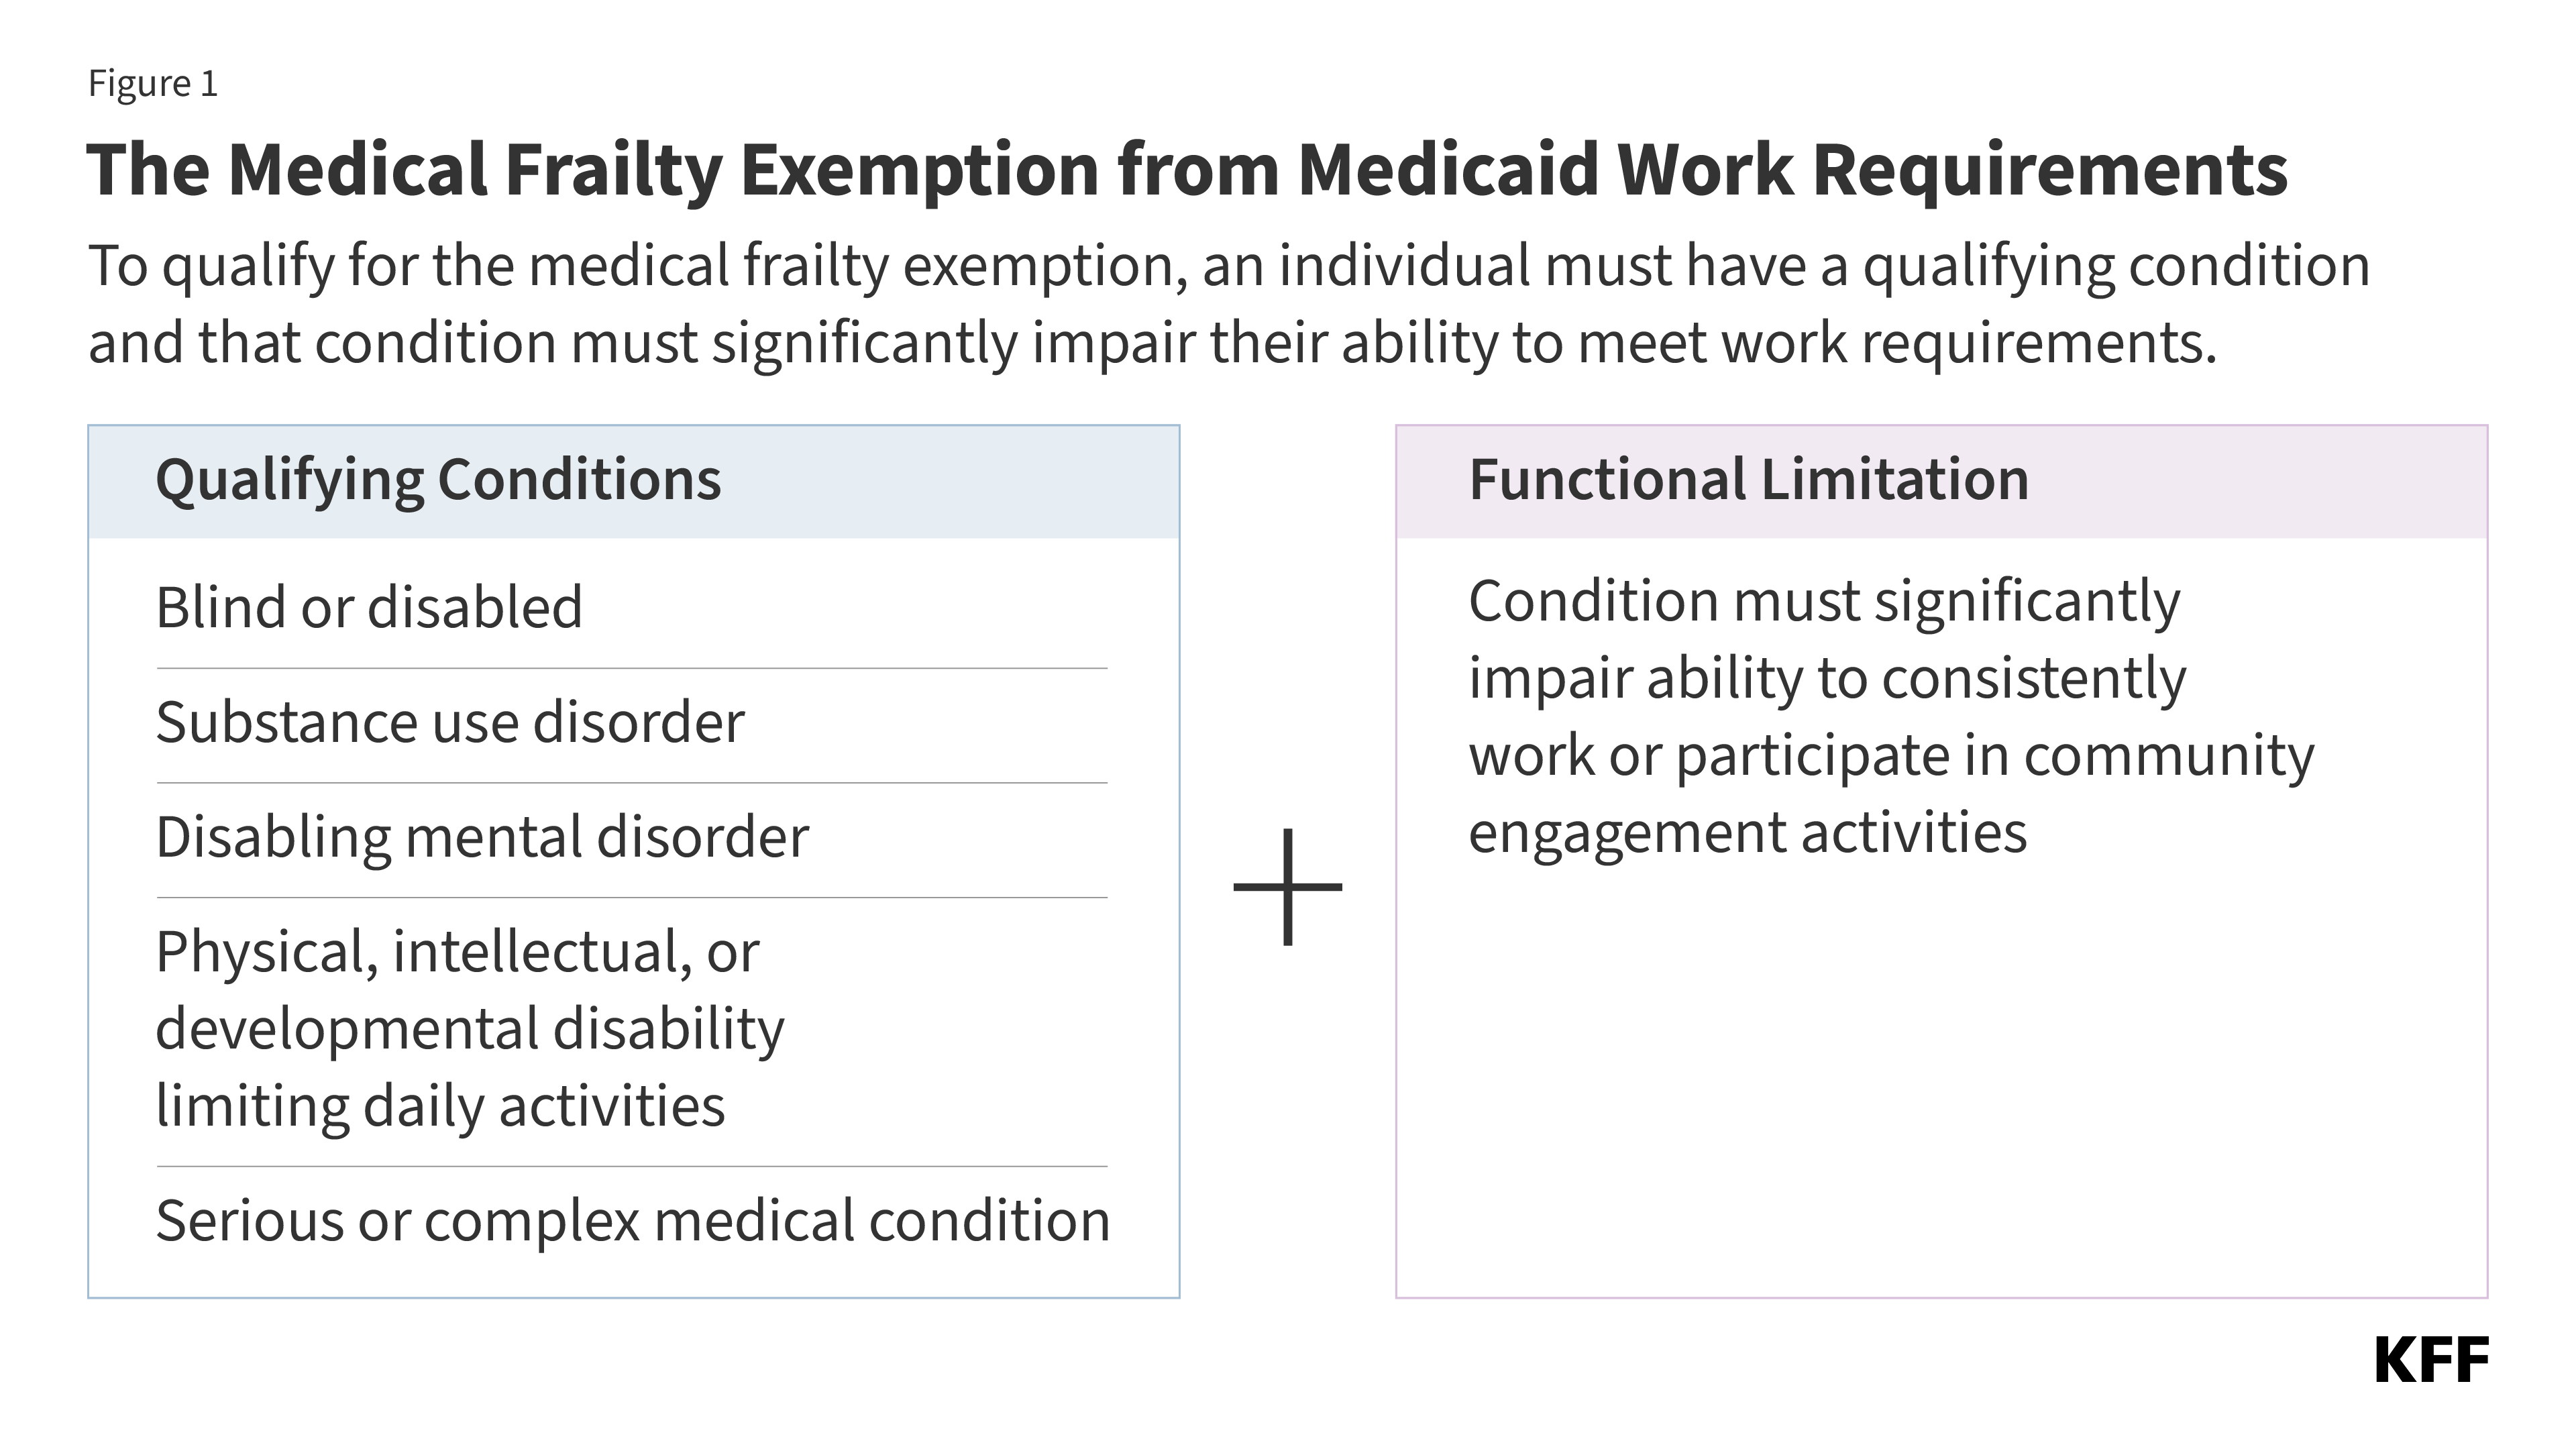
Significantly, the rule adopts a restrictive definition of medical frailty that differs from states’ early expectations and ties medical frailty to an individual’s ability to meet the community engagement requirements, including work or volunteer activities. The 2025 law specifies the medically frail exemption includes five categories of individuals who: are blind or disabled; have a physical, intellectual, or developmental disability that limits their ability to perform one or more activities of daily living (ADL); have a substance use disorder; have a “disabling” mental disorder; or have a “serious or complex” medical condition. The new rule requires states to consider not just whether the individual falls into one of the five categories described in the statute, but also whether the individual’s condition impairs their ability to engage in community engagement activities (including but not limited to work). States will likely need to pivot from earlier implementation plans and approaches to accommodate the new guidance.

States were already facing challenges in preparing to implement complex new requirements by January 1, 2027 and the provisions in the rule will amplify operational challenges, with added risks for states due to the potential for audits and financial penalties. The rule also may increase barriers for individuals to obtaining and maintaining coverage, leading to more people falling through the cracks and becoming uninsured. In addition, more complicated definitions of medical frailty may be difficult for states to explain as they conduct outreach with enrollees and potential applicants. This brief describes the new guidance and potential challenges states will face in operationalizing this exemption.

How Does the Interim Final Rule Define Medical Frailty?

For all categories of medical frailty, states are expected to develop a list of diagnosis and other codes to identify people who could potentially qualify for the exemption. States will be required to create lists of conditions that could potentially qualify someone as medically frail (generally in the form of health care code sets), which they must revise on a regular basis to reflect implementation experiences. CMS notes that the lists states use will be auditable, and if states are found to have determined an individual to be medically frail with little to no support for the conclusion that their physical, mental, or other behavioral health condition significantly impairs their ability to comply with the community engagement requirement, states would not be in compliance with the regulation and could be subject to financial penalties.

The rule relies heavily on existing definitions for the five medically frail categories and generally provides little additional clarification to help states develop the list of conditions for each category. In the rule, CMS said it did not believe it would be appropriate to include an exhaustive list of conditions in regulation, although they did provide examples of conditions across the various categories that could reasonably be expected to cause an individual to be medically frail. The rule acknowledges multiple existing definitions for several categories and ultimately defers to states the exact process of capturing individuals in these groups, explaining it “would be incredibly difficult to set one standard.” Notable details in the new rule include:

  • In the case of individuals with an SUD, the rule clarifies that the medical frailty category applies regardless of whether they are in an active treatment program but does not include individuals who have been in active recovery for 5 or more years.
  • For those with a serious or complex medical condition, the rule provides a new definition that requires a severe level of acuity for a condition to be considered serious or complex, which stands in contrast to other conceptions of “serious or complex” medical conditions that include individuals for whom maintaining access to health coverage is necessary to protect against serious health consequences if treatment is interrupted.

For all five categories, the rule makes clear that states must consider both if an individual’s condition meets the medical frailty definition and also if it significantly impairs their ability to work or engage in qualifying activities (Figure 1).

How Does the CMS Guidance Direct States to Verify Medical Frailty?

States are required to use claims and encounter data from the preceding 12 months to verify medical frailty status before requesting information from the individual; however, it will be difficult to use claims data alone to verify an individual’s ability to work. To ease the burden on individuals, the law directs states to use available information “where possible” to verify compliance with Medicaid work activities or exemption status, without requiring additional documentation from individuals. States are required to use claims or encounter data from the preceding 12 months as a data source. States are told they cannot consider information older than 12 months as this information “may not reflect the individual’s current condition.” The rule also encourages states to incorporate concise, plain language screening questions for use at application and renewal to identify individuals who may be medically frail. The rule is explicit that diagnosis alone cannot be used to verify medical frailty (because states must also consider whether an individual is sufficiently impaired from being able to work), limiting the ability of states to verify medical frailty on an ex parte (i.e., automatic) basis.

The rule does not provide details on criteria states should use for measuring severity of conditions or ability to meet new requirements. The rule only provides high-level examples of processes states may adopt to verify that an individual’s condition impairs their ability to work, such as algorithms that use administrative claims data to assign acuity scores, or using lists of qualifying diagnosis codes combined with utilization and other data. States may need to use combinations of data such as utilization data (e.g., hospitalizations), prescription drug data, and durable medical equipment (DME) prescription data. These approaches require states to implement even more complicated systems changes within the next six months that they were not anticipating based on earlier informal guidance. In addition, while these examples suggest states may be able to use acuity as a proxy for an individual’s ability to work, the rule is not clear on how states are expected to make these determinations. With the potential for audit, states may struggle to operationalize the medical frailty exemption in a way that protects them from financial penalty and minimizes administrative burden, without denying coverage to individuals who should qualify for the exemption.

Data limitations make it likely that medical frailty determinations will not be automated for many individuals. Examples of limitations include lack of data on file for new applicants and recent enrollees, or providers not consistently coding conditions or not using codes identified by the state. Certain individuals, such as those with functional limitations or behavioral health conditions, may also be more difficult to identify using claims data. States are also not provided with clear guidance on how to assess whether an individual is able to work or engage in community engagement activities, including what type of work activities states must consider. The more individualized the required assessment is, the more difficult it will be for states to auto-exempt individuals using data.

While states may need to rely on confirmation from treating providers to verify medical frailty conditions and ability to participate in community engagement activities, the rule offers little information on what information states need to collect from providers. States choosing to accept provider documentation are told that lists of who they choose to be allowable practitioner types must be shared with CMS if requested as part of oversight and data monitoring activities. Relying on provider confirmation could increase administrative burden (on the clinical workforce, individuals, and states), particularly for providers that treat large shares of Medicaid patients. Relying on providers or eligibility workers to determine whether an individual is able to work will likely require a subjective decision and could raise ethical concerns among providers. New Hampshire had previously implemented work requirements with a requirement that individuals needed to be deemed unable to work by providers to qualify for an exemption; enrollees with physical and behavioral health problems struggled when applying for exemptions, often because primary care providers resisted signing forms declaring that their patients were unable to work. Research also shows that physician attitudes to assisting patients who request exemptions from work requirements can vary substantially. In addition, because providers receive Medicaid payments and, therefore, have an interest in their patients maintaining health coverage, requesting information from them to confirm a medical frailty exemption could raise conflict of interest issues.

While states are permitted to use self-attestation to verify medical frailty, the rule limits reliance on self-attestation starting in January 2028. Given the limitations of existing data sources and the difficulty of identifying whether an individual is medically frail, accepting self-attestation of medical status or ability to work could relieve the administrative burden for states as well as applicants and enrollees. Acknowledging data limitations states face particularly for new applicants, the rule allows states to accept self-attestation throughout 2027 in cases where there is no reliable information available to the state. However, starting January 1, 2028, states may only accept self-attestation of medical frailty status one time during an individual’s enrollment period. States would then be expected to verify individuals using available data or require documentation or other information from individuals for future renewals.

The rule requires states to verify medically frail exemption status at least every 12 months. States must reverify medical frailty even for people whose health condition or disability status is unlikely to change every 12 months; however, the rule gives states the option to reverify medical frailty more frequently (such as at each 6-month renewal period). For states that elect to verify compliance between regular renewals (e.g., quarterly), the rule specifies that individuals identified as specified excluded individuals during their most recent verification, including those who meet medical frailty exemptions, are not subject to more frequent verifications.

The Business of Health with Chip Kahn

Is AI (Still) Biased? 

June 23, 2026

Video

Audio

About this Episode


Episode 9, AI Series: In this episode, Dr. Ziad Obermeyer joins Chip to talk about AI bias in patient management, including how far the health care industry has come since his groundbreaking research that revealed alarming biases in a widely used algorithm that underestimated the health needs of Black patients. The discussion emphasizes that while AI can analyze data with remarkable precision, it is the context surrounding that data that ultimately determines its efficacy, usefulness, and fairness. Dr. Obermeyer is an emergency department physician, researcher, co-founder of Nightingale Open Science and Dandelion, and associate professor at the UC Berkeley School of Public Health and the College of Computing, Data Science, and Society. 

The Host


Headshot photo of Chip Kahn wearing a navy blue suit with a red tie, red pendant on lapel, and glasses.

Sr. Visiting Fellow

Charles N. Kahn III is a senior visiting fellow at KFF. He is also a visiting senior fellow at the American Enterprise Institute and a nonresident senior scholar at the University of Southern California’s Schaeffer Center for Health Policy & Economics. He serves as co-chair of the international Future of Health collaborative.

Guest


Blue Cross of California Distinguished Associate Professor of Health Policy and Management, UC Berkeley School of Public Health

Dr. Ziad Obermeyer is Associate Professor and Blue Cross of California Distinguished Professor in UC Berkeley’s School of Public Health and College of Computing, Data Science, and Society. His work, grounded in clinical practice, uses AI and data to improve clinical decisions, accelerate medical discovery, and bring computational innovations into patient care. His research on algorithmic bias has influenced hospital AI practices worldwide and informed public accountability efforts. He co-founded Nightingale Open Science and Dandelion and is a Chan–Zuckerberg Biohub Investigator and a Research Associate at the National Bureau of Economic Research. A Harvard Medical School faculty member and McKinsey consultant, he was named to TIME Magazine’s 100 most influential people in AI.  


SERIES

This weekly podcast features insightful conversations between host Chip Kahn and his guests, who discuss the business of health care, connecting the dots between the health care business, policy, and patients.

The podcast’s first series on AI in health care illuminates how AI is changing health care, and features guests who are deploying this technology, managing its consequences, and designing policy around it.

The Role of Immigrants in the U.S. Health Care Workforce

Published: Jun 18, 2026

Introduction

The Trump administration has made policy changes to restrict immigration into the U.S., including efforts to end Temporary Protected Status (TPS) designations for many countries, pauses and restrictions on the issuance of new visas, and significantly increased immigration enforcement. These actions could have negative implications for the U.S. workforce, which includes significant shares of immigrant workers, particularly in certain industries including health care. Immigrant workers include naturalized citizens as well as noncitizens, including lawfully present and undocumented immigrants.

This issue brief provides data on immigrants’ role in the U.S. workforce, including in health care and other key industries, based on KFF analysis of Current Population Survey (CPS) basic monthly data and American Community Survey (ACS) one-year data for U.S. workers 18 years and older by citizenship status. Key takeaways from this analysis include:

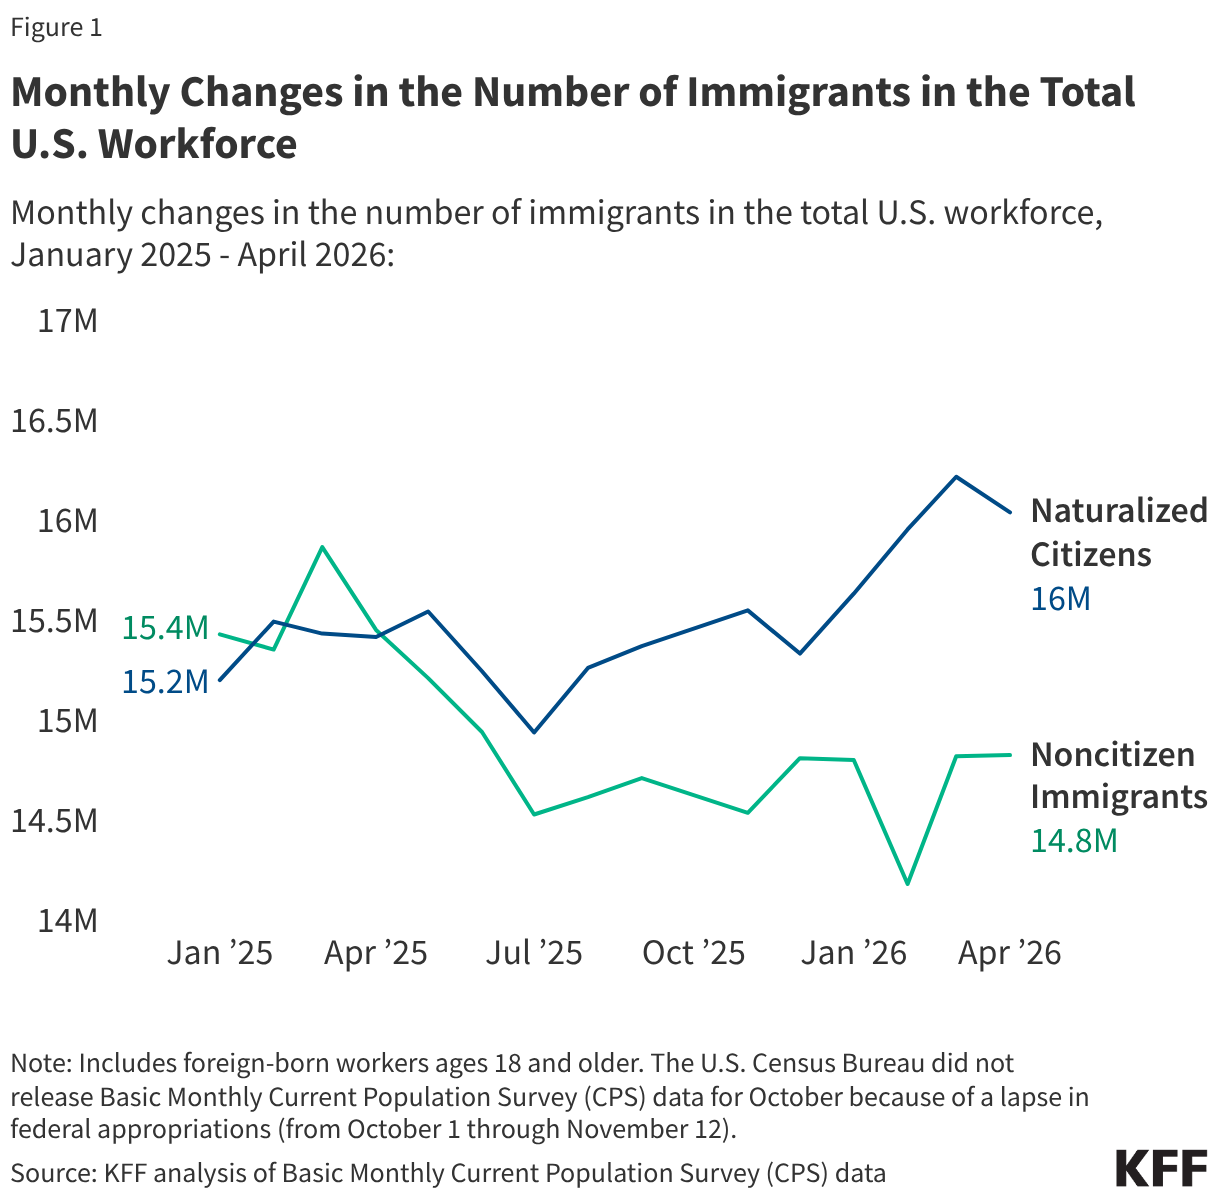
While the total number of immigrant workers in the U.S. held largely steady between January 2025 and April 2026, the number of noncitizen immigrant workers declined by about 600,000, or 4%, from 15.4 million to 14.8 million. This was offset by an increase in the number of naturalized citizen workers of over 800,000, or about 6%, from about 15.2 to 16.0 million. The number of U.S.-born workers increased by about 1% between January 2025 and April 2026 (125.6 to 126.7 million). Within the health care industry, there was an overall increase of 1% or about 130,000 workers from 19.4 to 19.6 million, which reflected increases among U.S-born (16.0 to 16.1 million) and noncitizen immigrant workers (961,000 to 1.2 million) that offset a decline among naturalized citizen workers (2.5 million to 2.3 million).

Immigrants accounted for about one in five (19%) or close to 31 million of the total U.S. workforce as of 2024. Within health care, immigrants accounted for 17% of the workforce, including 28% of physicians and surgeons and 30% of direct care workers in long-term settings. In hospitals, immigrants accounted for similar shares of clinical staff and non-clinical staff and played a particularly large role as physicians and surgeons (30%). Top countries of origin for immigrant health care industry workers include Philippines (12%), Mexico (11%) and India (7%). In hospitals, immigrants also play an outsized role in certain non-clinical occupations, including building cleaning and maintenance workers (29%). Immigrants, particularly noncitizen immigrants, also accounted for disproportionate shares of agriculture (33%); construction (26%); and food services, maintenance, and personal care service workers (23%).

Continued reductions in the number of immigrants could impact the U.S. economy and key industries, especially as the 65 and older population in the U.S. grows and there are fewer replacement workers available. Reduced immigrant participation in the health care workforce, including the long-term care workforce, could exacerbate existing worker shortages and negatively impact the health and well-being of Americans.

While the total number of immigrant workers in the U.S. held largely steady between January 2025 and April 2026, the number of noncitizen immigrant workers declined by about 600,000 or 4% from 15.4 million to 14.8 million. This was offset by an increase in the number of naturalized citizen workers of over 800,000, or about 6%, from about 15.2 to 16.0 million. The number of U.S.-born workers increased by about 1% between January 2025 and April 2026 (125.6 to 126.7 million). Within the health care industry, there was an overall increase of 1% or about 130,000 workers from 19.4 to 19.6 million, which reflected increases among U.S-born (16.0 to 16.1 million) and noncitizen immigrant workers (961,000 to 1.2 million) that offset a decline among naturalized citizen workers (2.5 million to 2.3 million).

Monthly Changes in the Number of Immigrants in the Total U.S. Workforce (Line chart)

Immigrants’ Role in the U.S. Health Care Workforce

Changes in the immigrant workforce may have important implications given the role that immigrants play, particularly in certain industries including health care.

Immigrants account for about one in five workers in the U.S. As of 2024, immigrants accounted for about 19%, or close to 31 million, of the total U.S. workforce over age 18 based on KFF analysis of ACS data. Naturalized citizens accounted for roughly 10% of workers and noncitizen immigrants accounted for another 9% of total workers.

Within health care, immigrants make up about one in six workers overall and account for even larger shares of physicians and surgeons and direct care workers in long-term settings. Immigrants accounted for 17%, or about 3.3 million, of the health care workforce overall and about three in ten physicians and surgeons (28%) and direct care workers in long-term care settings (30%) (Figure 2). Among physicians and surgeons, 22% were naturalized citizens and 7% were noncitizen immigrants. Among direct long-term care workers, 18% were naturalized citizens and 12% were noncitizen immigrants.
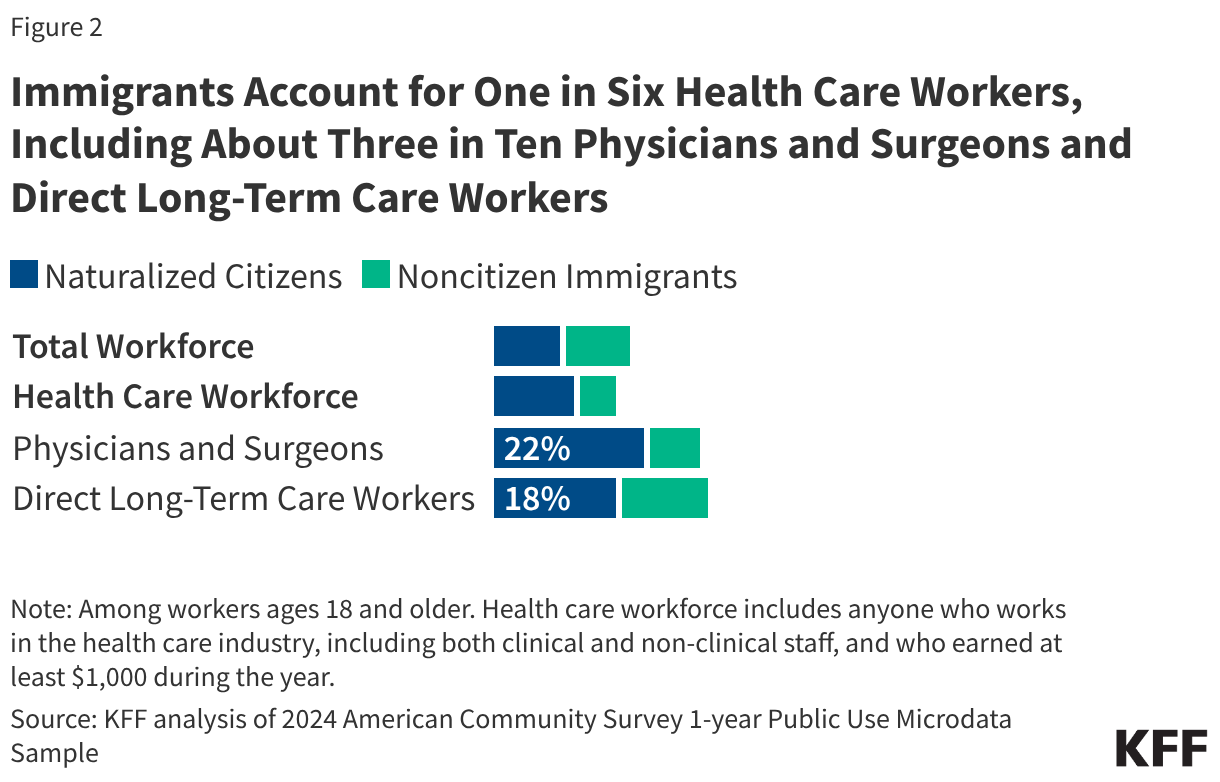
Immigrants Account for One in Six Health Care Workers, Including About Three in Ten Physicians and Surgeons and Direct Long-Term Care Workers (Stacked Bars)

Three in ten immigrant health care workers are from Philippines (12%), Mexico (11%) or India (7%) (Figure 3).  China, Jamaica, Cuba, and Haiti contribute another 4% each of immigrant health care workers. Among immigrant physicians and surgeons, one in five (21%) are from India, 6% from China, 5% each from Canada and Pakistan, and 4% are from Philippines. Among immigrant direct long-term care workers, one in seven (14%) are from Mexico, 7% each are from Dominican Republic and Philippines, and 6% each are from Jamaica, China, and Haiti.
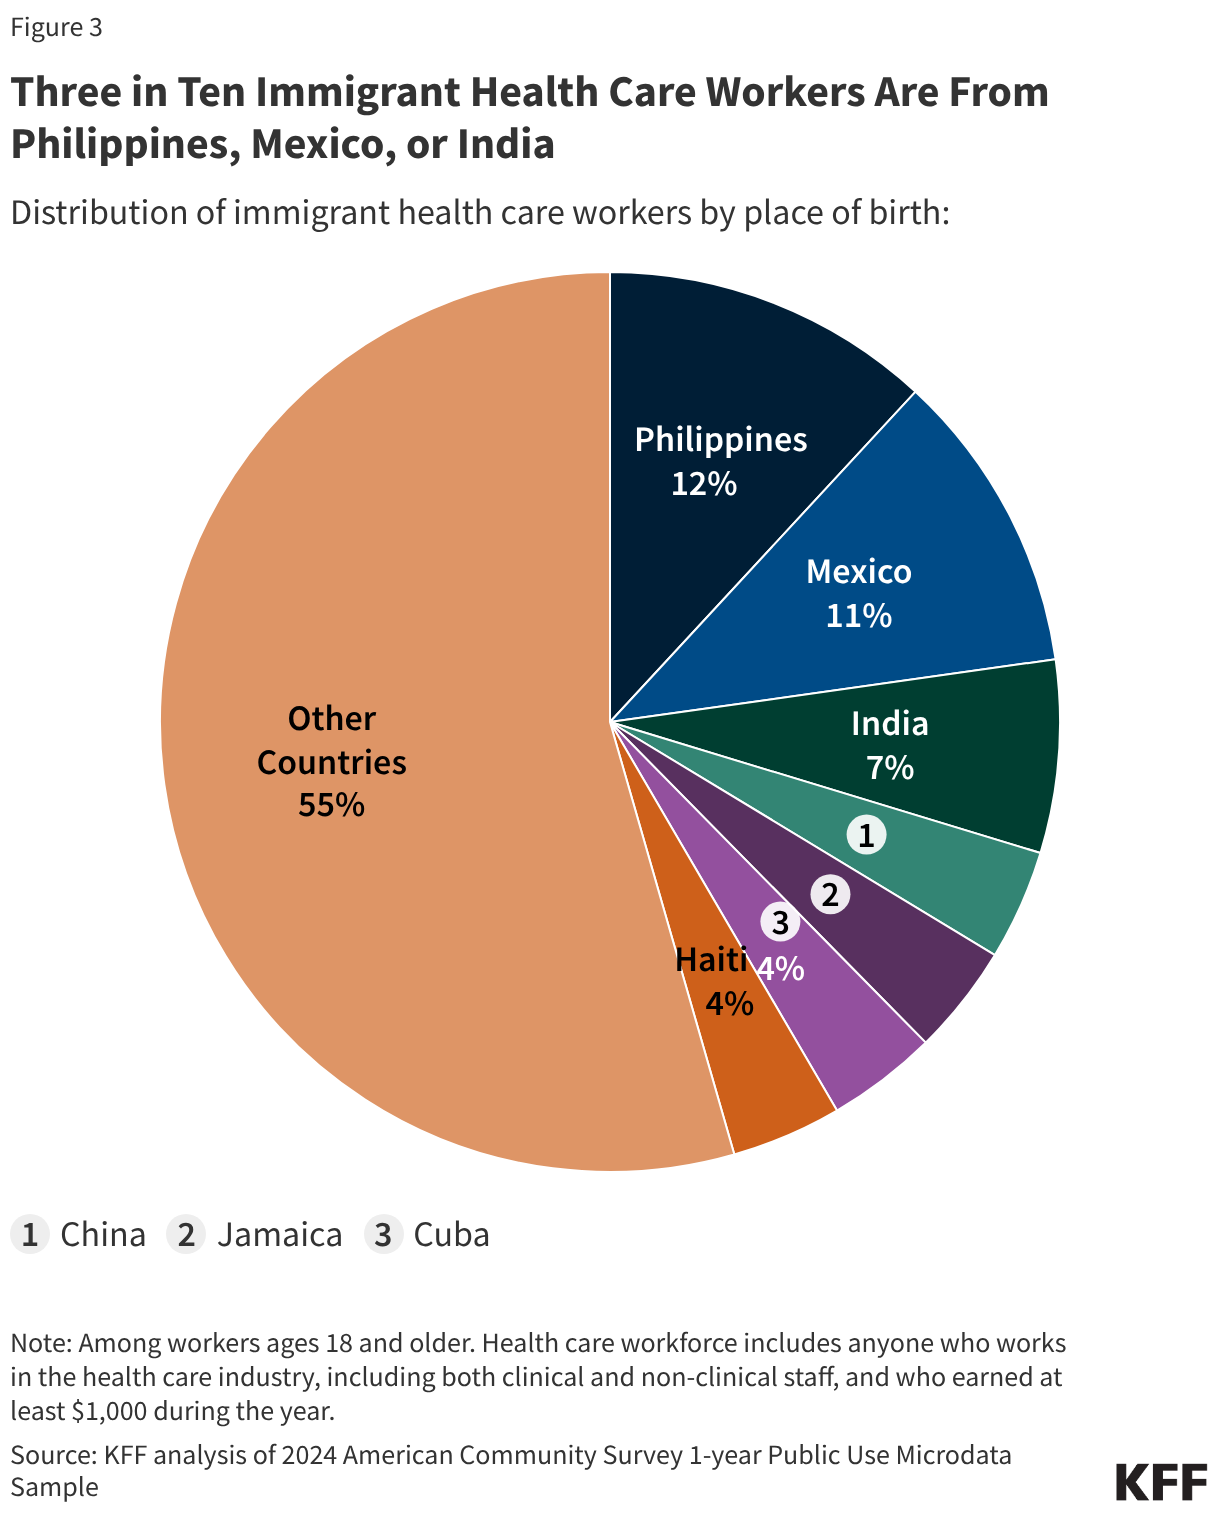
Three in Ten Immigrant Health Care Workers Are From Philippines, Mexico, or India (Pie Chart)

In hospitals, immigrants accounted for one in six (17%), or about 1.4 million, workers as of 2024. This includes 12% of hospital workers who are naturalized citizens and 5% who are noncitizen immigrants (Figure 4). Immigrants made up similar shares of clinical (17%) and non-clinical (15%) workers in U.S. hospitals. Clinical workers include physicians, surgeons, nurses, etc., and non-clinical workers include office workers, food service workers, cleaning and maintenance workers, and other non-clinical workers. Among immigrant hospital workers, 16% are from Philippines, 9% are from Mexico, 8% are from India, and 4% each are from China and Jamaica.
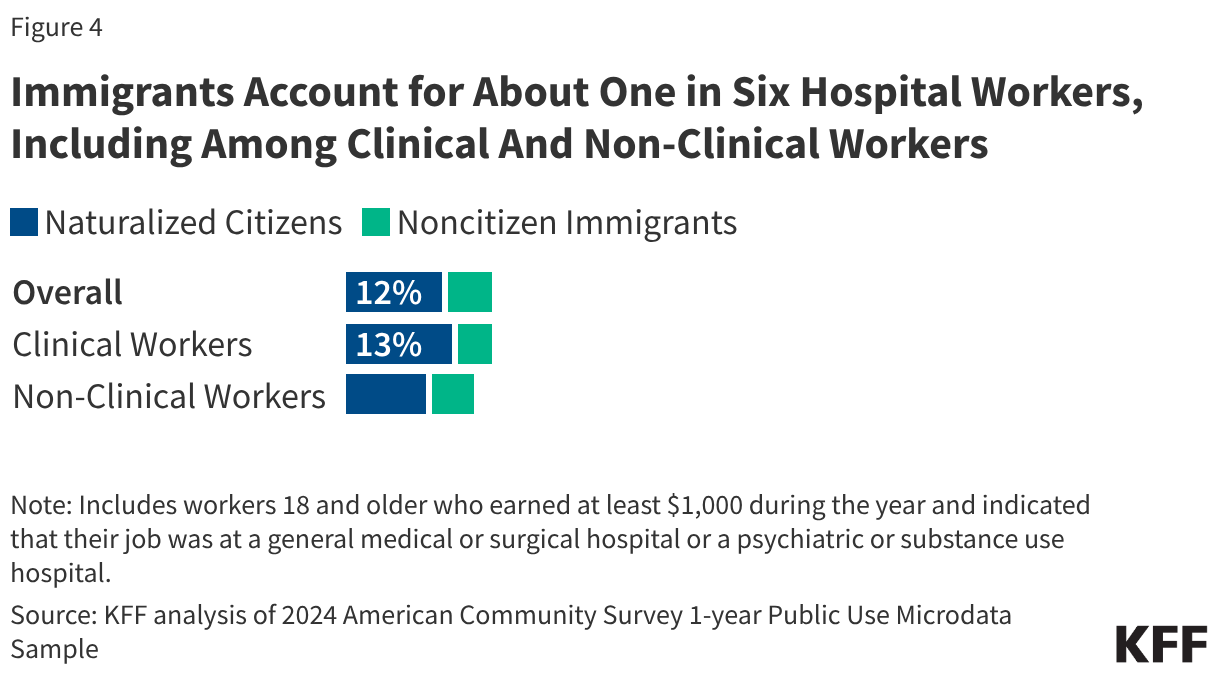
Immigrants Account for About One in Six Hospital Workers, Including Among Clinical And Non-Clinical Workers (Stacked Bars)

Within hospitals, immigrants made up three in ten (30%) physicians (Figure 5). This includes over one in five (21%) who are naturalized citizens and another 9% who are noncitizen immigrants. Immigrants also made up over one in five (22%) nursing assistants, about one in six registered nurses (17%), and about one in seven technicians (15%) and nurse practitioners and midwives (14%) at U.S. hospitals. Immigrants also play an outsized role in certain non-clinical occupations in hospitals, such as building cleaning and maintenance workers.
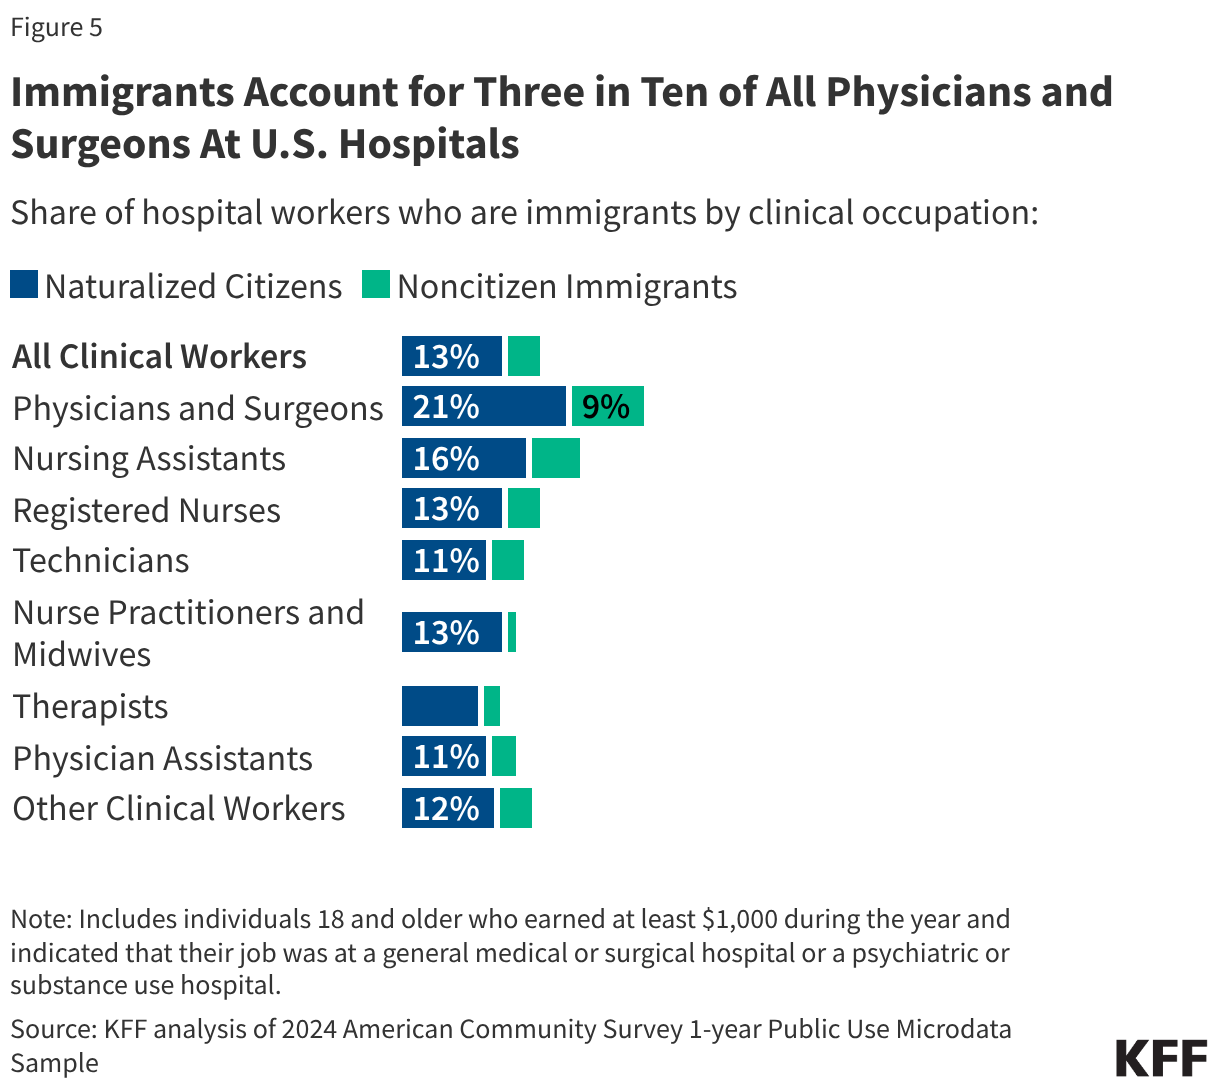
Immigrants Account for Three in Ten of All Physicians and Surgeons At U.S. Hospitals (Stacked Bars)

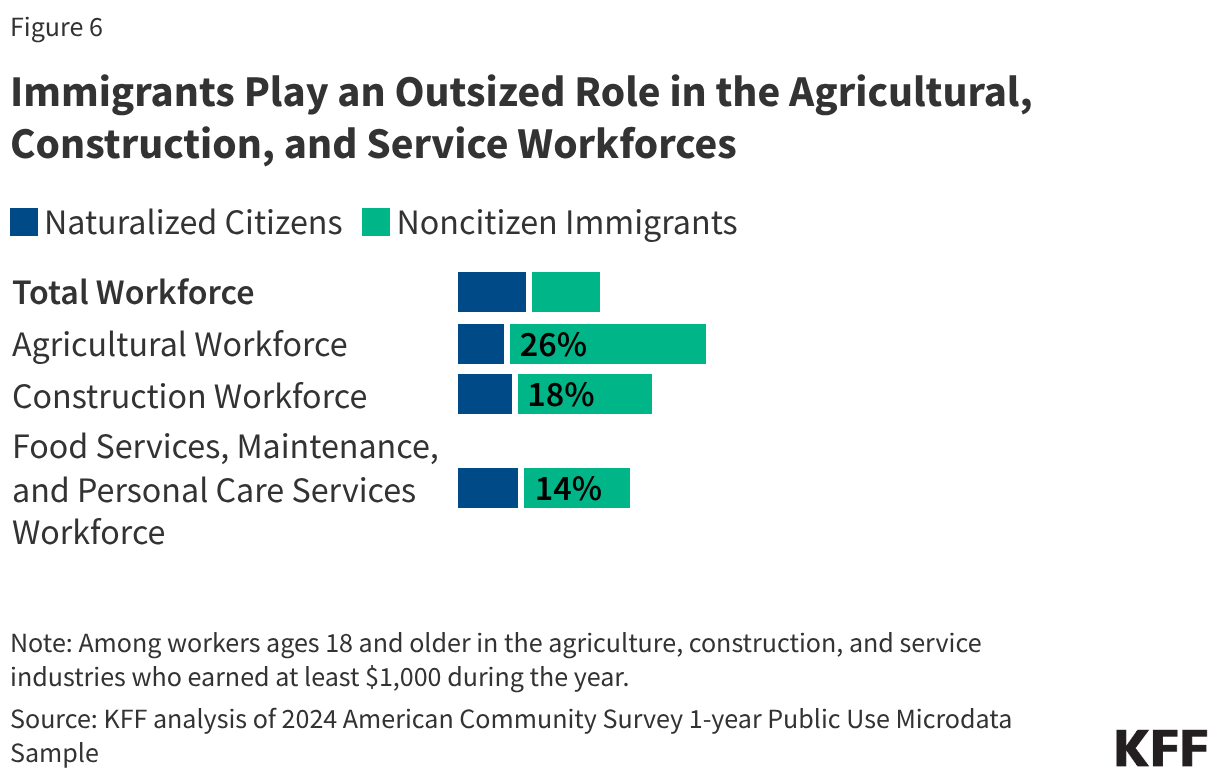
Immigrants, particularly noncitizen immigrants, also play an outsized role in other key industries including agriculture, construction, and service. As of 2024, immigrants made up one in three (33%) agricultural workers, of whom 26% were noncitizen immigrants and 7% were naturalized citizens; about a quarter of (26%) construction workers, of whom 18% were noncitizen immigrants and 8% were naturalized citizens; and about a quarter (23%) of food services, maintenance, and personal care service workers, of whom 14% were noncitizen immigrants and 9% were naturalized citizens (Figure 6).

Immigrants Play an Outsized Role in the Agricultural, Construction, and Service Workforces (Stacked Bars)

Methods

Data sources: This brief is based on KFF analysis of federal survey data, namely the Basic Monthly Current Population Survey (CPS) and the American Community Survey 1-year Public Use Microdata Sample. These surveys are nationally representative household surveys conducted by the U.S. Census Bureau. While Basic Monthly CPS data are available on a monthly basis, ACS PUMS data are available on a yearly basis. Basic Monthly CPS data have a significantly smaller sample size than yearly ACS and yearly CPS data. Due to the smaller sample size, results may be more sensitive to potential decreases in survey participation among immigrants due to immigration-related fears.

Identifying citizenship status: Naturalized citizens are those who indicate becoming a U.S. citizen by naturalization; and noncitizen immigrants are those who say that they are not a U.S. citizen. Noncitizen immigrants include lawfully present and undocumented immigrants.

Identifying workers across different industries: Health care, agriculture, construction, and service workers are identified as individuals 18 years of age or older who report working either full-time or part-time in one of the aforementioned industries and who earned at least $1,000 during the year. Industries are classified based on Census codes that correspond with the North American Industry Classification System (NAICS). Codes 0170 through 0290 correspond to the agriculture industry; 0770 corresponds to the construction industry; 7970 through 8290 correspond to the health care industry; and 8680 through 9070 correspond to the food services, maintenance, and personal care services industries.

Identifying hospital and direct long-term care workers: Hospital workers are individuals 18 years or older who report working either full-time or part-time and indicate that their job was at a general medical or surgical hospital or a psychiatric or substance use hospital and who earned at least $1,000 during the year. Direct long-term care workers are individuals 18 years or older who report working either full-time or part-time, earned at least $1,000 during the year, and whose occupation is home health aide, personal care aide, or nursing assistant and who indicate working in home health care, nursing care facilities, residential care facilities, or individual and family services.
Poll Finding

KFF Tracking Poll on Health Information and Trust: Use of Social Media and AI For Health Information and Advice

Published: Jun 17, 2026

Key Takeaways

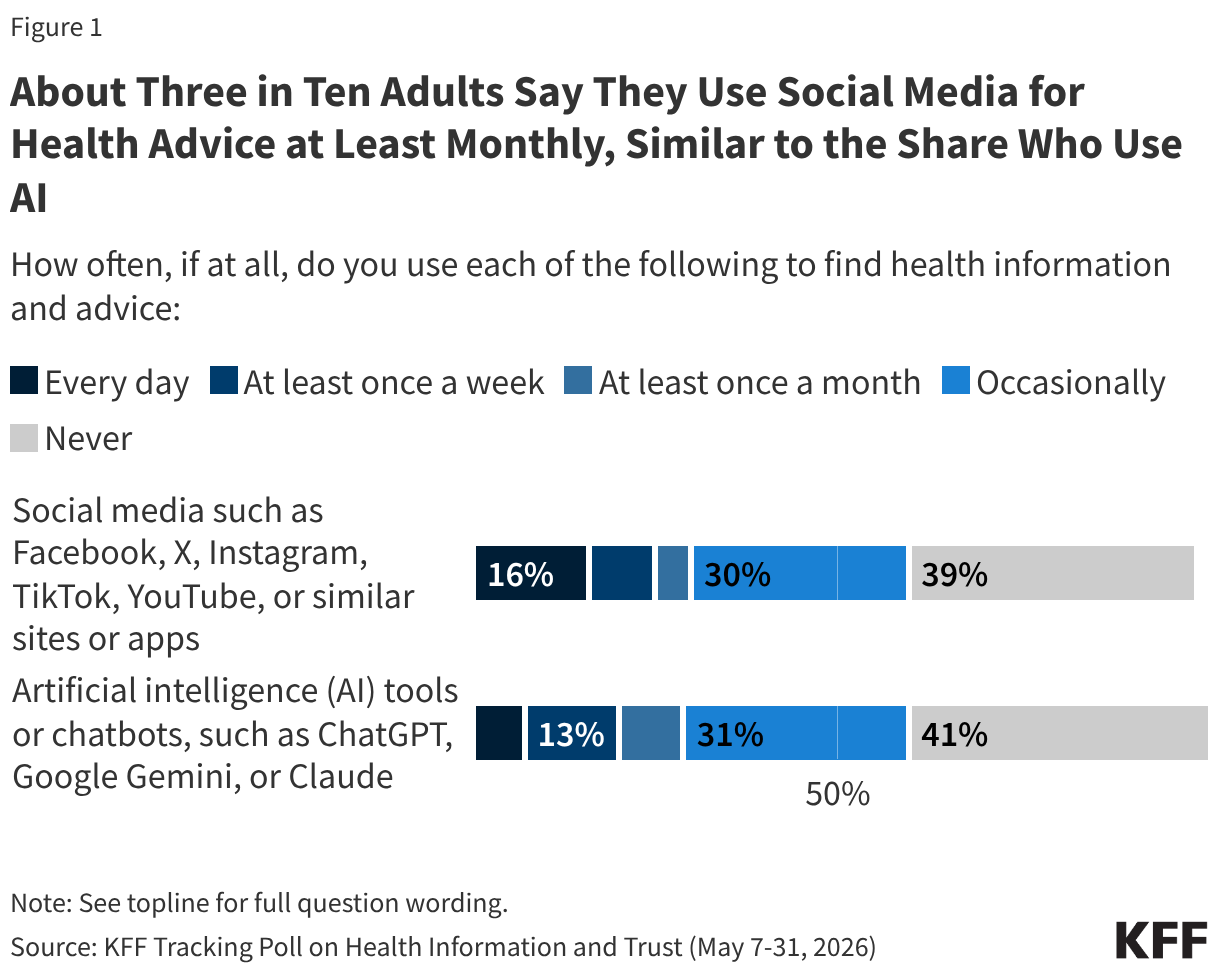
  • Adults in the U.S. are turning to social media and AI to advise them on health issues. KFF’s latest Tracking Poll on Health Information and Trust finds three in ten adults (31%) using social media at least monthly for health information and advice. This is similar to the share (29%) who now say they use AI tools or chatbots for health information monthly, a number that has nearly doubled in the past two years – up from roughly one in six (17%). Still, majorities say they either “never” or only “occasionally” use AI tools (71%) or social media (69%) for health information.
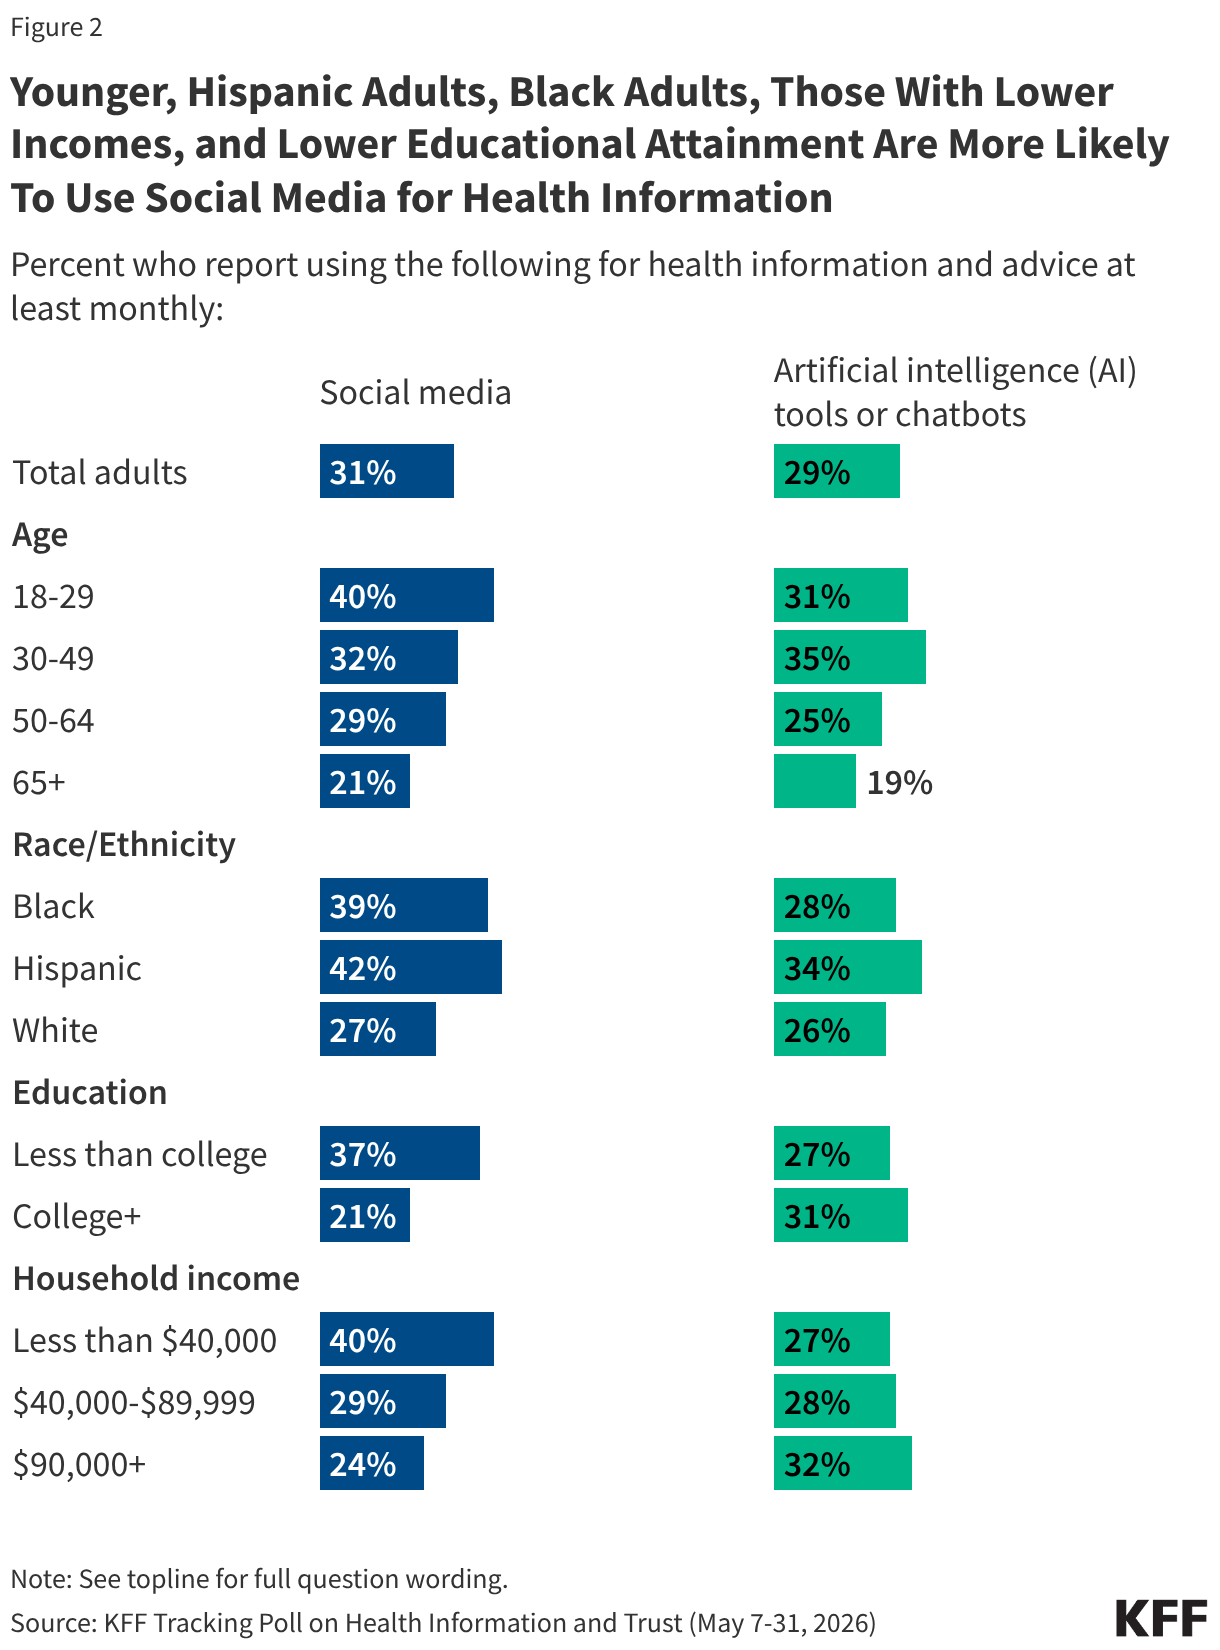
  • Although some people turn to both social media and AI for health information, the two audiences are demographically distinct. While younger adults are more likely than older adults to use social media and AI for health information, the youngest cohort is much more likely to rely on social media while 30 to 49 year olds are more likely to turn to AI. Additionally, social media tends to attract lower-income adults, while AI use is more common among those with higher incomes or more advanced education. Hispanic adults stand out as notable adopters of both platforms for health information, unlike White adults, who are less likely to use either as a source of information.
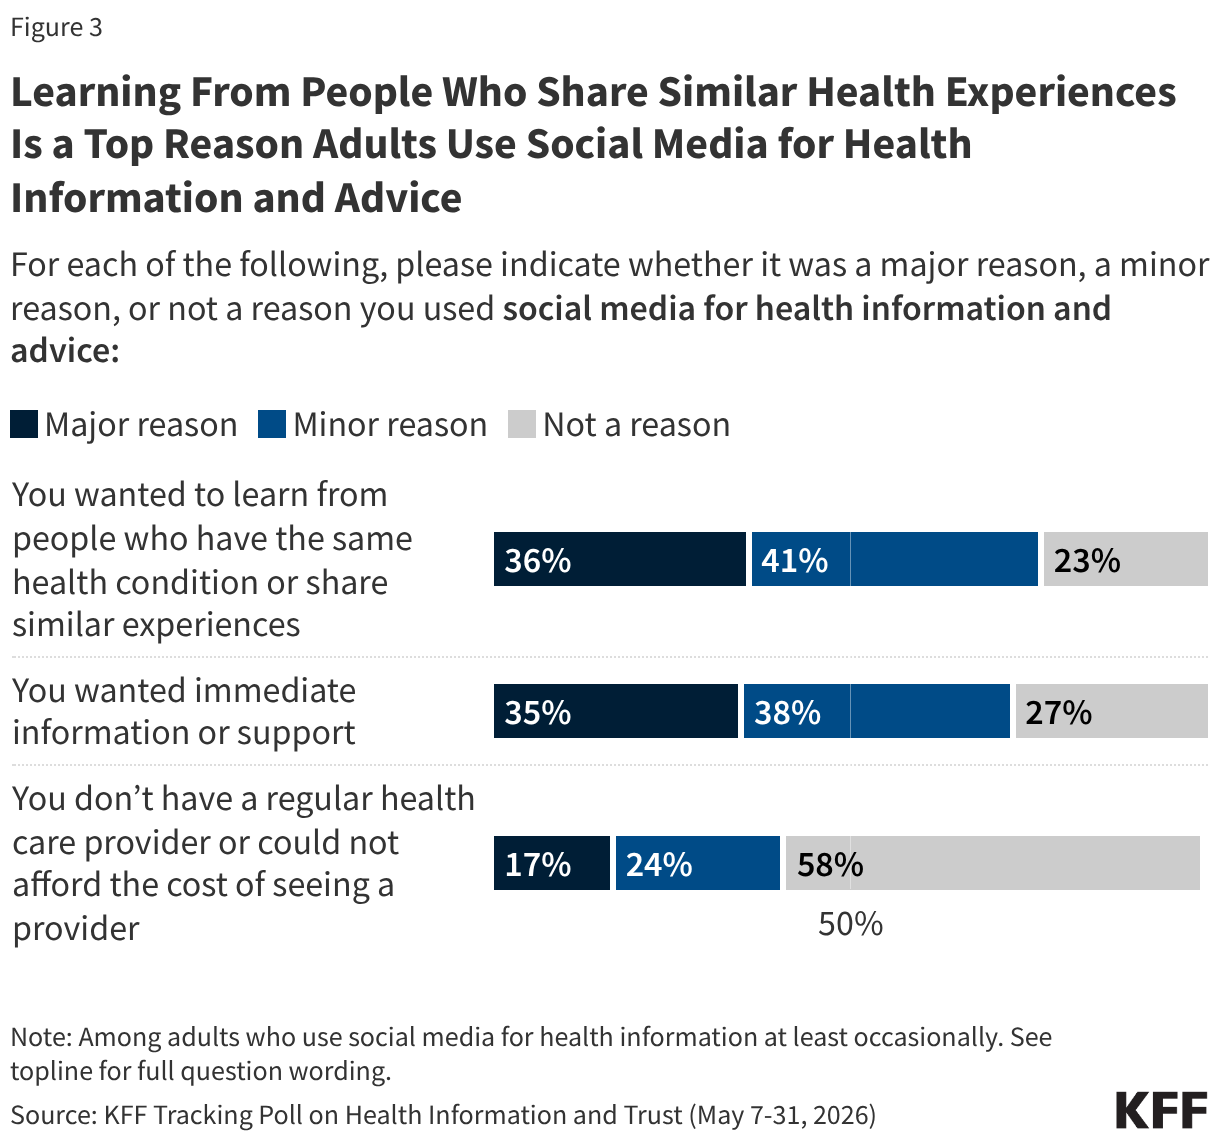
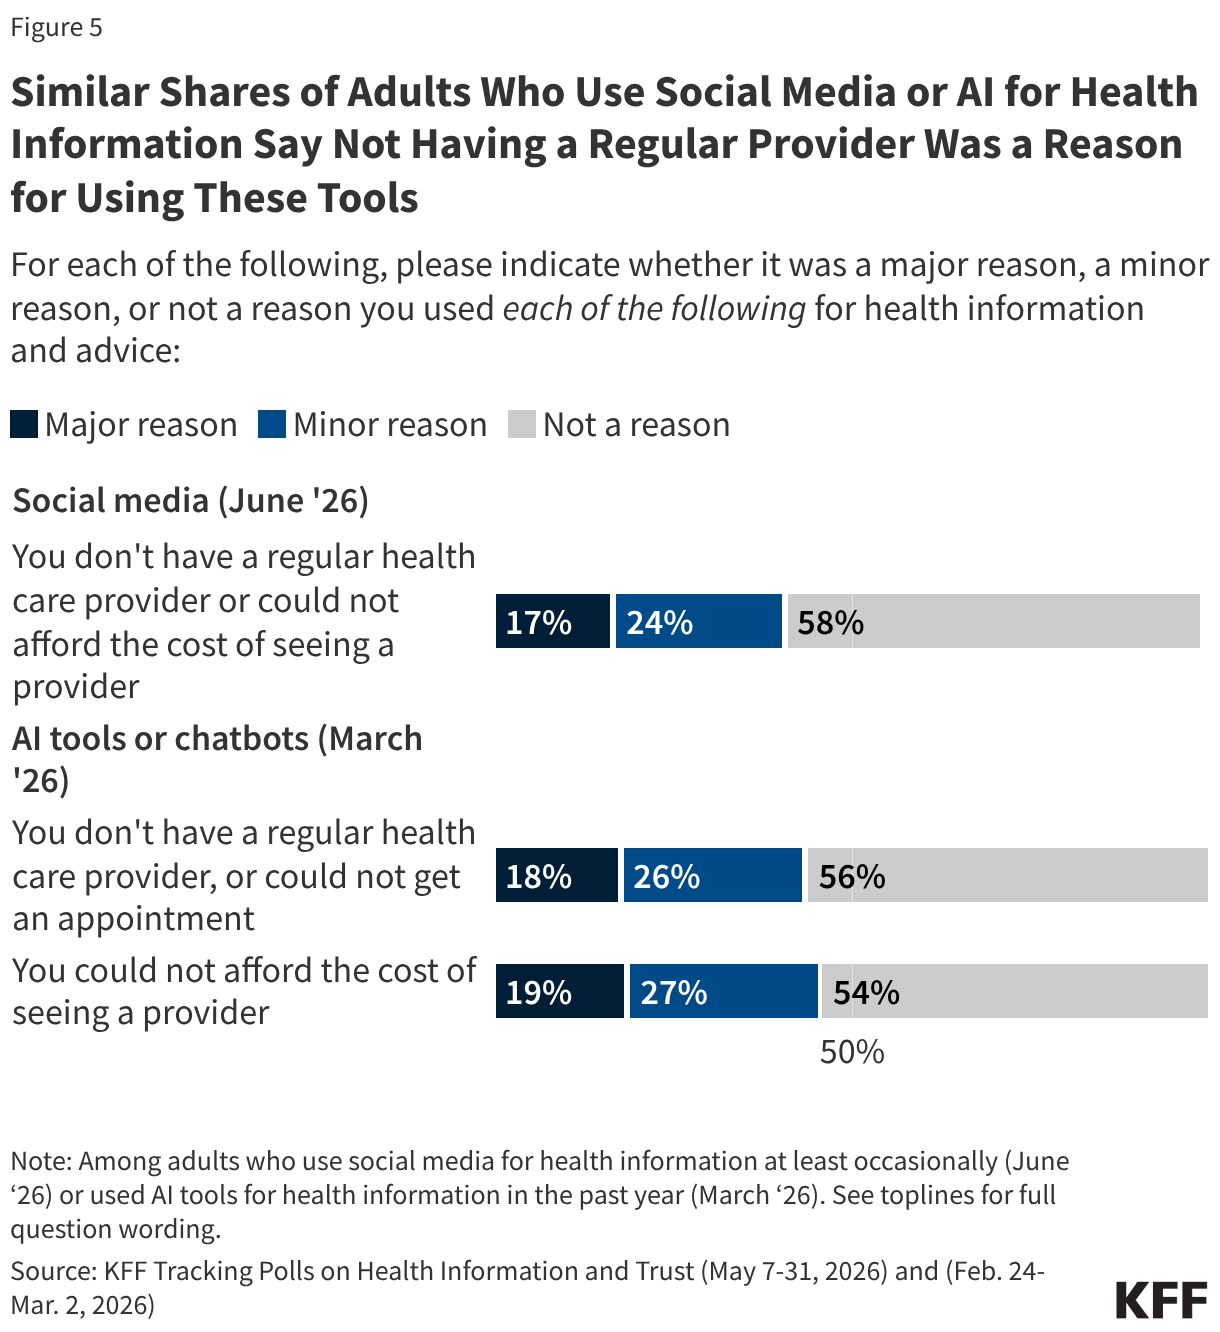
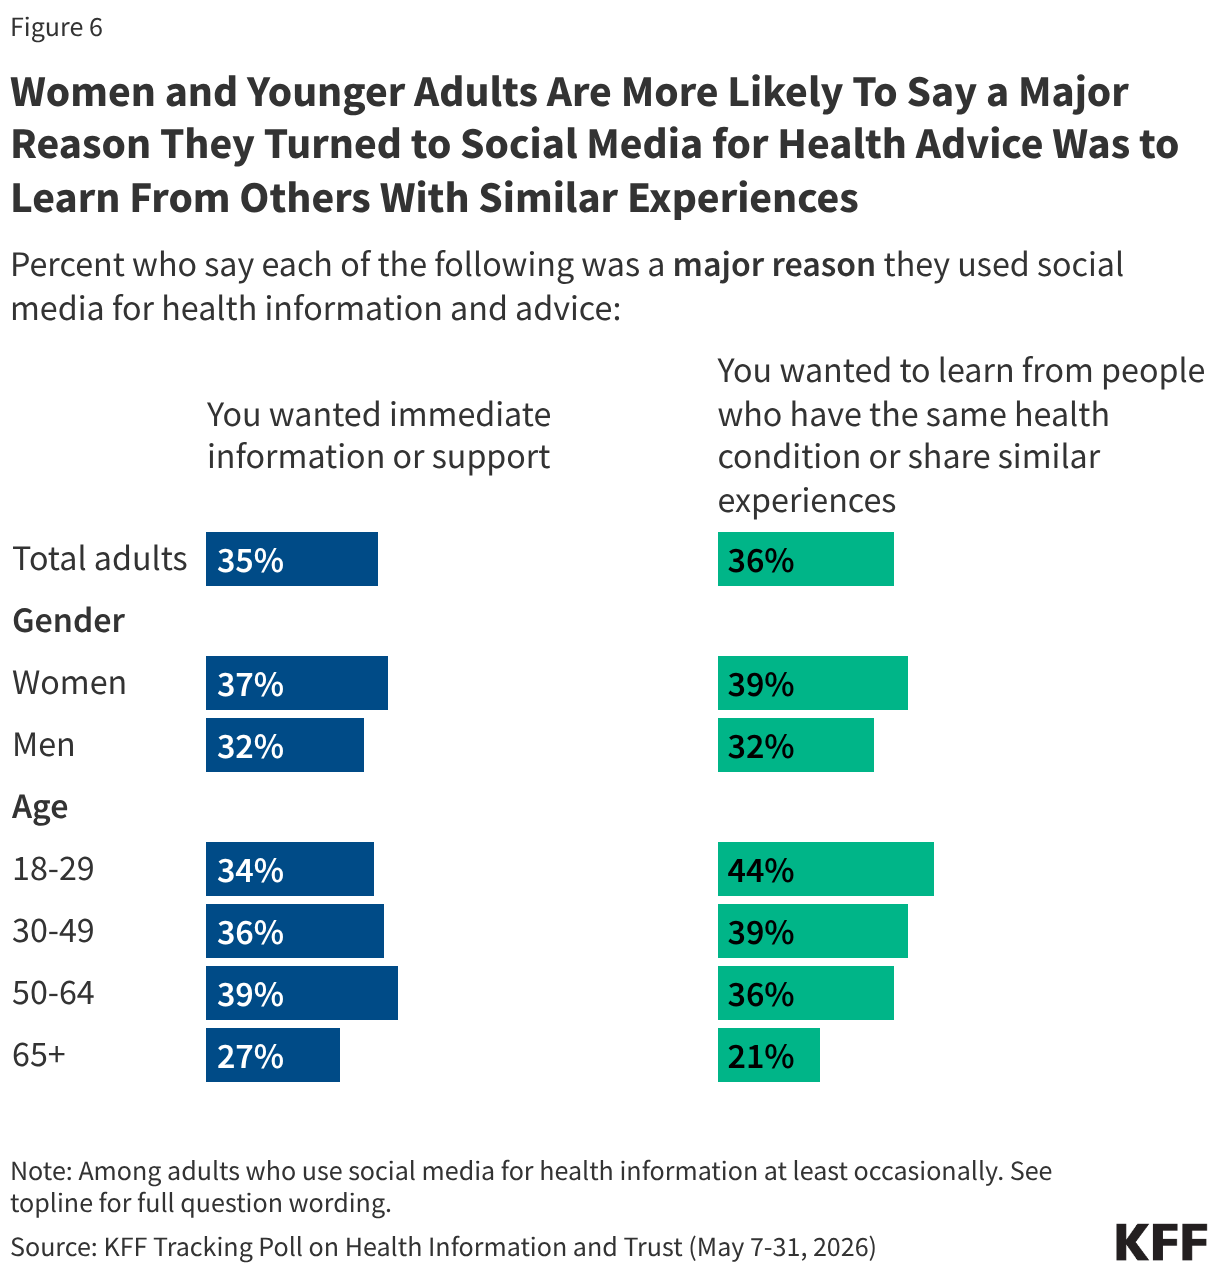
  • Need for community and immediacy of information drives use of social media for health information and advice. Over a third of those who use social media for health information and advice report that wanting to learn from people with the same health condition or similar experiences is a “major reason” (36%) they turned to social media. A similar share (35%) say it is because they want immediate information or support. While fewer (17%) say that not having a regular health care provider or not being able to afford the cost is a “major reason” for turning to social media, that number rises to a third among adults without insurance and LGBT adults. Notably, similar shares say not being able to afford the cost of seeing a provider (19%) or not having a regular health care provider (18%) are both a “major reason” why they used AI tools for health information in KFF’s March 2026 Tracking Poll on Health Information and Trust as said the same for a reason why they used social media in this poll.
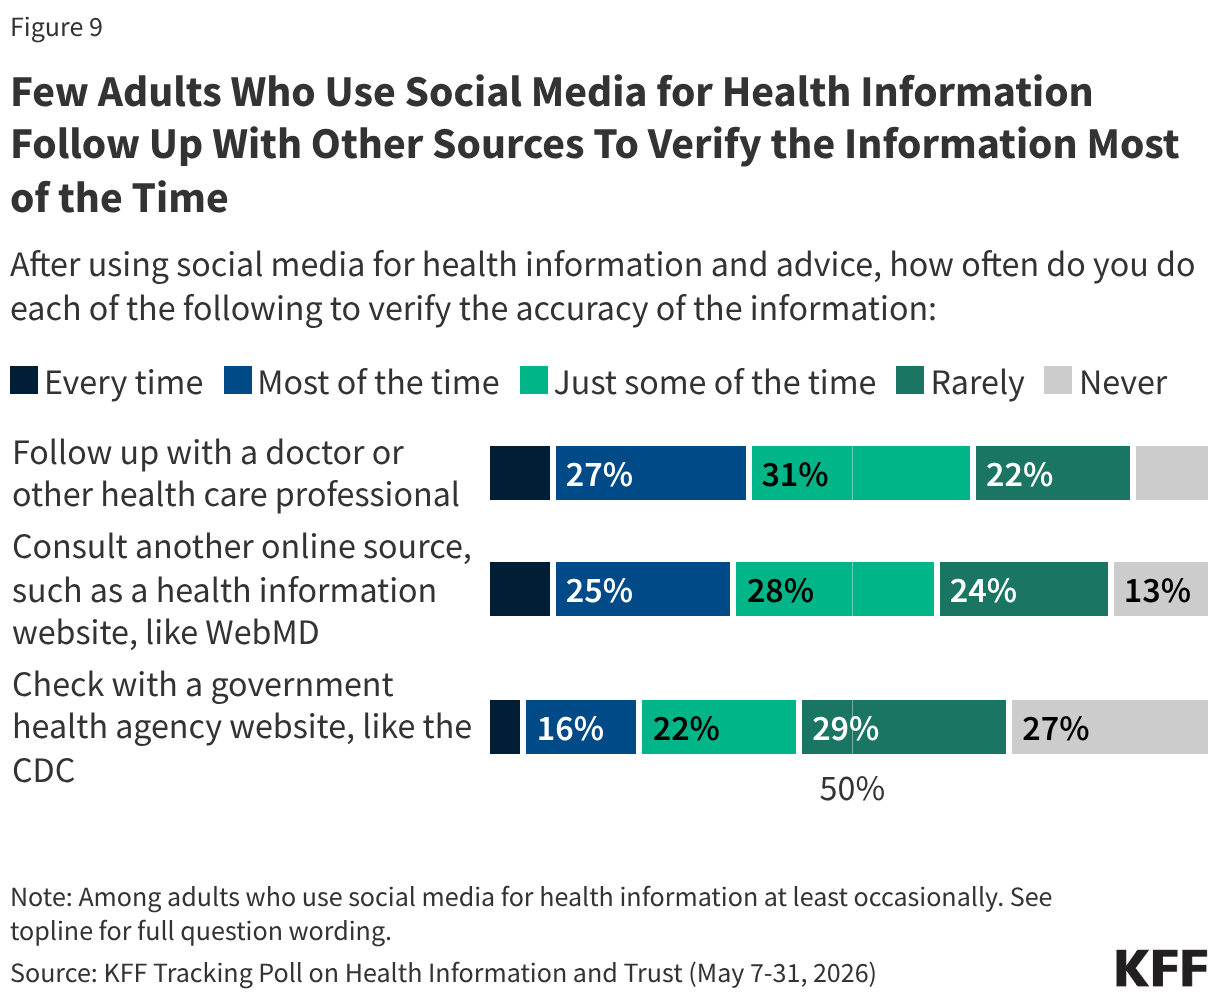
  • The majority of social media and AI users are confident in their ability to parse true or false information, which is perhaps why few take steps to validate the information either from a doctor or some other source. Less than four in ten adults who use social media for health information follow up with a doctor at least most of the time (36%), consult another online source like WebMD (35%), or check with health agency websites, like the CDC (21%).

Social Media and AI Use for Health Information

Three in ten adults report using social media for health information or advice at least once a month. This includes about one in six (16%) who say they use it “every day.” Similarly, three in ten (29%) adults now say they use artificial intelligence (AI) tools or chatbots like ChatGPT, Google Gemini, or Claude for health information and advice monthly, nearly doubling in the past two years, up from roughly one in six (17%) in June 2024. Though they provide health information in different ways, the growing use of these technologies suggests that adults are looking beyond traditional health care sources. Still, a majority of the public say they either “never” or only “occasionally” use AI tools (71%) or social media (69%) for this.
Stacked bar chart showing how often people report using social media or AI tools for health information and advice.

Younger adults (ages 18 to 29), Hispanic adults, Black adults, and those with lower incomes are among the most likely groups to use social media for health information. About four in ten Hispanic adults (42%), those with incomes of $40,000 or less a year (40%), adults under the age of 30 (40%), and Black adults (39%) say they use social media for health information at least monthly.

On the other hand, AI use for health information is common among the youngest cohort (ages 18 to 29) as well as those ages 30 to 49. While those with lower levels of education and income are more likely to go to social media for health information, there is less variation with reliance on AI with about three in ten across income and education groups reporting using it at least monthly. Notably, larger shares of Hispanic adults report using both social media and AI for health information, compared to White adults.

Split bar chart showing the percent of people who report using social media or AI tools for health information and advice at least monthly. Results by total adults, age, race/ethnicity, education, and household income.

Reasons for Using Social Media

People report using social media for health information for a variety of different reasons. Among those who use social media for health information and advice (60% of total adults), over a third (36%) say that wanting to learn from people who have the same health condition or share similar experiences is a “major reason” why. A similar share (35%) says a “major reason” was wanting immediate information or support. Fewer (17%) say that not having a regular health care provider or not being able to afford the cost of seeing a provider is a “major reason” why they turned to social media for health information, though about four in ten (42%) say that it is a reason.

Stacked bar chart showing the percent of people who selected wanting to learn from others, wanting immediate information, and not having a regular health care provider as a reason for using social media to find health information and advice.

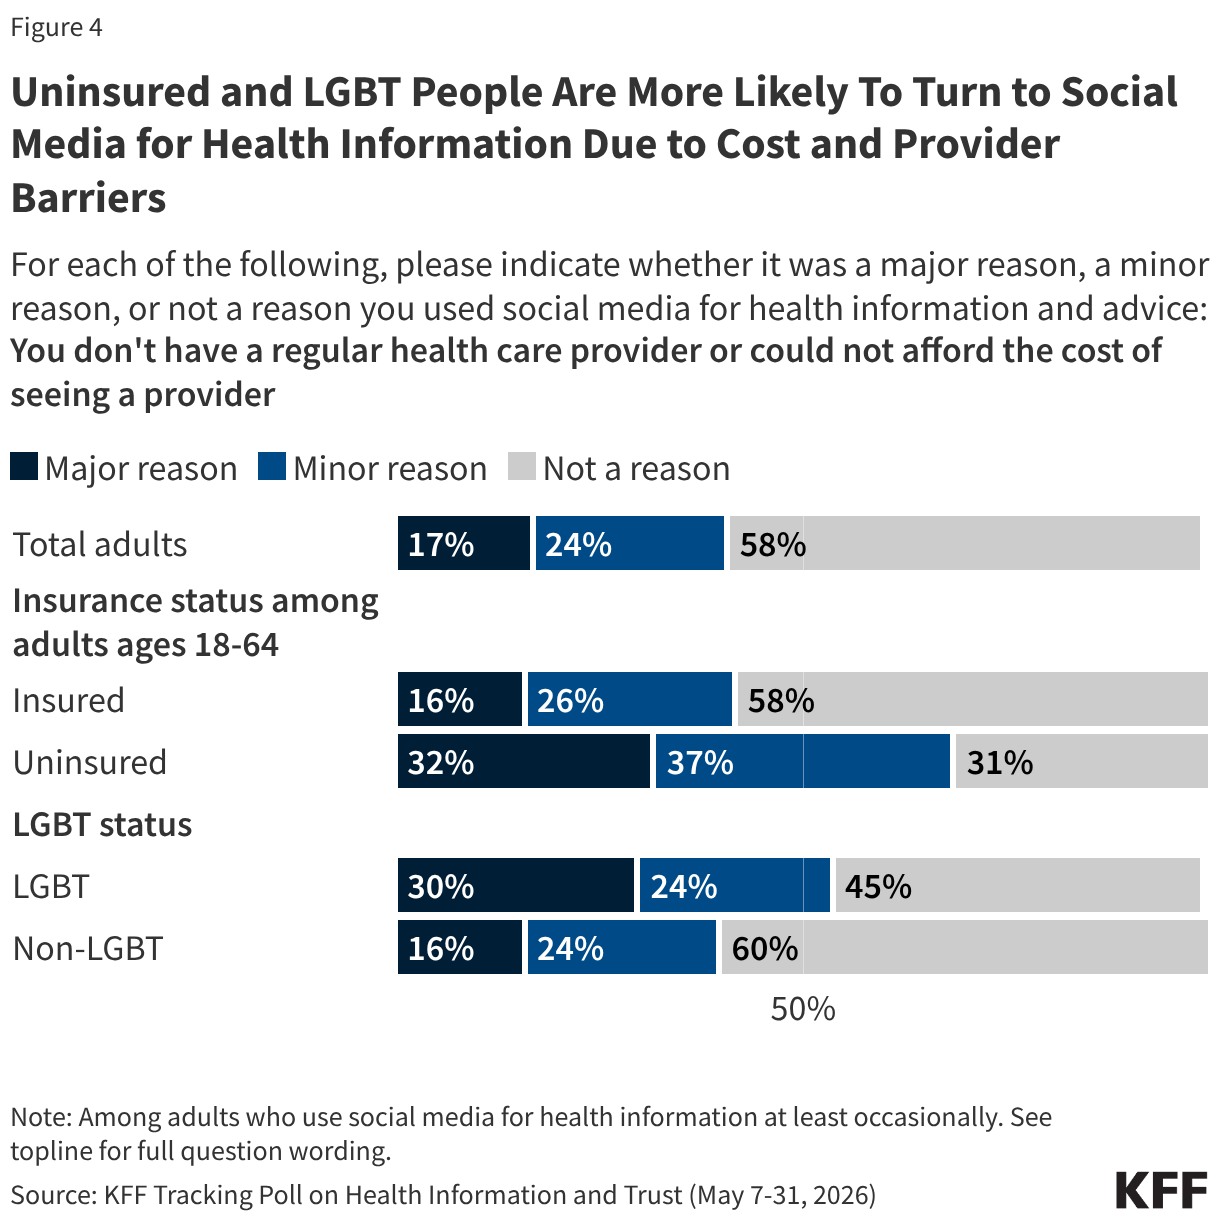
The use of social media for health information and advice because of a lack of a regular health care provider or not being able to afford the cost is higher among groups that have historically had a harder time accessing health care. Among social media users, roughly three in ten uninsured adults (32%) say this was a “major reason” and another four in ten (37%) say it is a “minor reason” they turned to social media. Adults with lower incomes are more likely than those with higher incomes to report that not having a regular provider is a “major reason” for using social media for health information, with a quarter of those with an income of less than $40,000 a year saying so, compared to two in ten (19%) of those with an income of $40,000 to $89,999, and less than one in ten (6%) of those with a yearly income of $90,000 or more. LGBT adults are also more likely to say this is a reason they used social media, with three in ten LGBT adults reporting this was a “major reason” and a quarter (24%) saying it’s a “minor reason.” LGBT adults are also more likely to have lower incomes generally, possibly explaining some of the access issues they report, though they may lack a provider due to stigma and discrimination related issues.  
Additionally, larger shares of Hispanic adults (29%) and Black adults (23%) report that not having a regular provider is a “major reason” for seeking advice through social media than White adults (12%).

Stacked bar chart showing the percent of people who said not having a regular health care provider was a reason for using social media to find health information and advice.

Notably, similar shares said not being able to afford the cost of seeing a provider (19%) or not having a regular health care provider (18%) were both a “major reason” why they used AI tools for health information in KFF’s March 2026 Tracking Poll on Health Information and Trust as said the same for a reason why they used social mediain this poll (17%).

Stacked bar chart showing the percent of adults who said not having a regular health care provider, or being unable to afford or get an appointment with one, was a major reason, minor reason, or not a reason they used social media or AI tools for health information and advice.

Women are more likely than men to say that they wanted to learn from people who have the same health condition or shared similar experiences (39% of women v. 32% of men). Young adults under the age of 30 are also among the most likely to say wanting to learn from people with the same condition or experiences is a “major reason” why they sought out health information on social media (44% of those ages 18 to 29 v. 21% of those ages 65 and older).

Split bar chart showing the percentage of adults who said wanting immediate information or support and wanting to learn from people with similar health conditions or experiences, was a major reason they used social media for health information and advice, broken down by total adults, gender, and age group.

Confidence in Discerning True or False Information

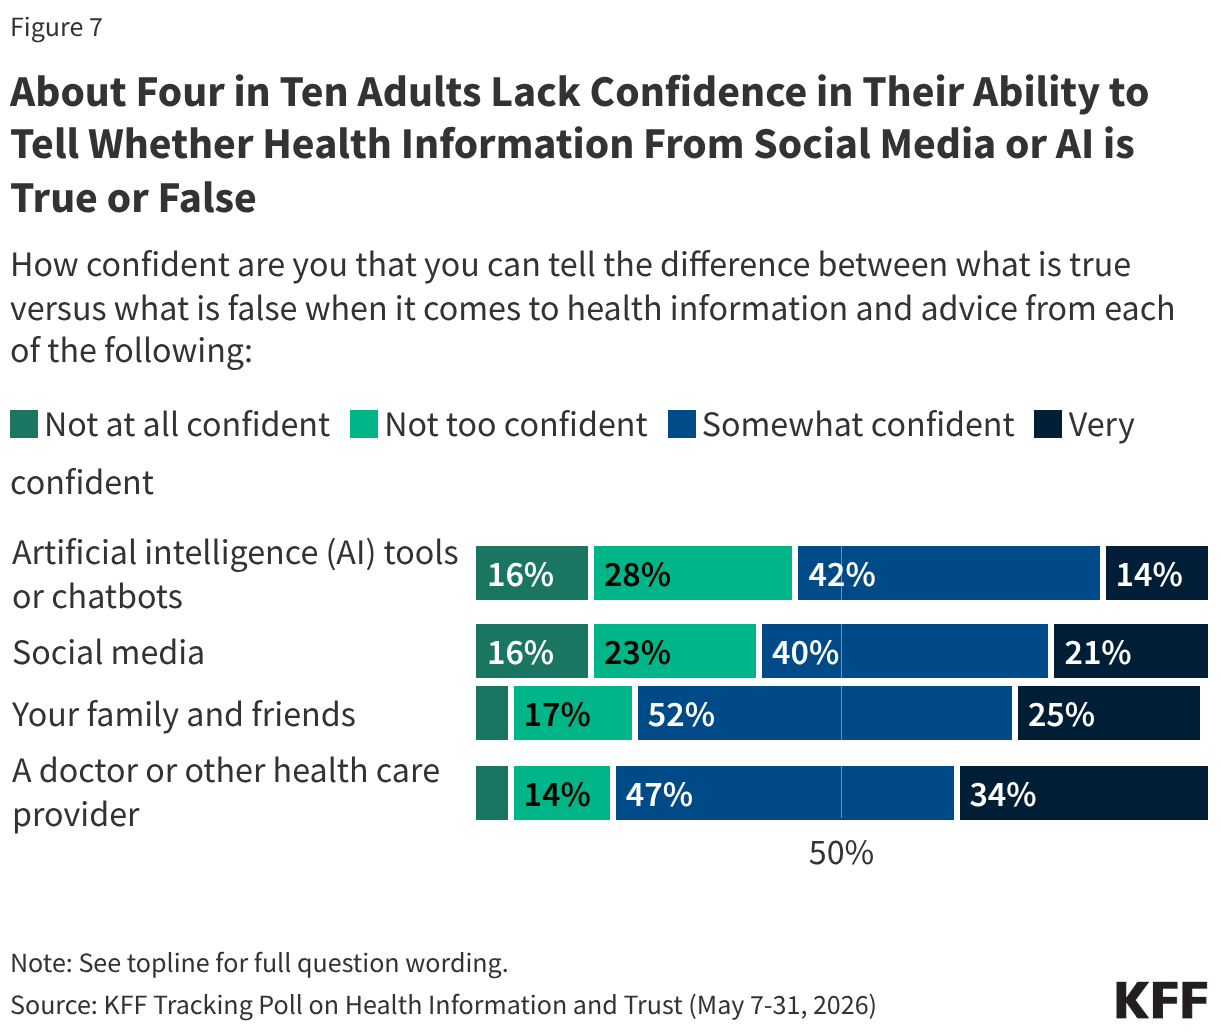
Slim majorities of adults say they are confident in their ability to tell what is true or false when it comes to health information from social media (61%) or AI chatbots (56%). In fact, roughly four in ten adults overall say they are “not too” or “not at all” confident in their ability to tell whether health information from AI chatbots (44%) or social media (39%) is true or false. Larger shares are confident when the information comes from more personal sources, with eight in ten saying they are confident they can parse information from a doctor or other health care provider (80%) or their family and friends (77%).

Stacked bar chart showing the percent of adults who said they are not at all confident, not too confident, somewhat confident, or very confident that they can tell true from false health information and advice from AI tools or chatbots, social media, family and friends, and a doctor or health care provider.

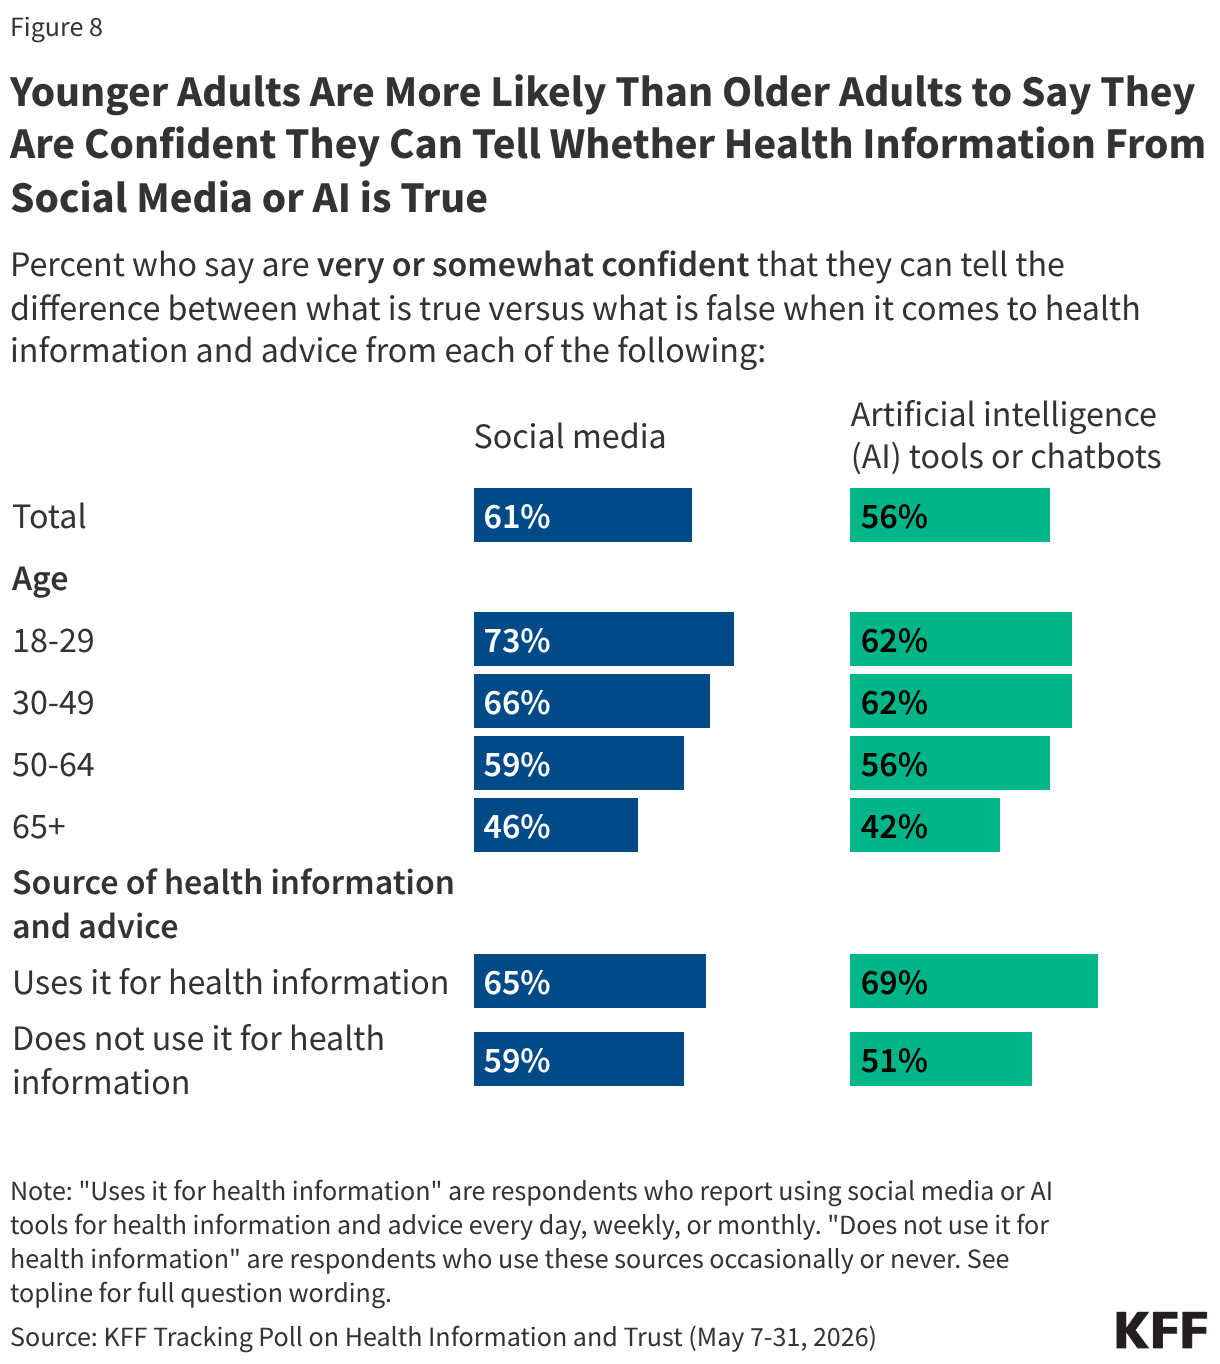
Younger adults are more likely to express confidence in their ability to tell whether health advice is true or false on both social media and AI tools or chatbots than their older counterparts. In addition to young adults, adults with a college degree or higher education and those with incomes of $90,000 or more a year are more likely than their counterparts to say they are confident they can tell the difference between true and false health information from social media and AI chatbots.
People who use AI for health advice are more likely than those who do not use it to be confident in their ability to discern what is true when using these tools. However, the difference is less pronounced when it comes to social media. Roughly seven in ten (69%) of those who use AI at least monthly are confident in being able to decipher the truth from that source, compared to half (51%) of those who use AI for health information “occasionally” or “never.” Similarly, a slightly larger share of those who use social media at least monthly say they can tell what is true or not from the health information they find on social media – around two-thirds (65%), compared to six in ten (59%) who don’t use social media for health information.

KFF’s March 2026 Tracking Poll on Health Information and Trust found that trust in AI for reliable health information was largely predicated on use, with most users saying they trust AI for health information compared to few non-users.

Grouped bar chart showing the percentage of adults who say they are very or somewhat confident they can tell true from false health information from social media and from AI tools or chatbots, broken down by total adults, age group, and whether they use each source for health information.

Following Up With Other Sources

While not every health-related social media query requires a follow-up with a doctor or health care professional, few of those who seek health information on social media say they regularly consult any other source for information. Roughly a third of adults who use social media for health information and advice say they followed up with a doctor or other health care professional (36%) “every time” or “most of the time” to verify the accuracy of the information they see on social media. A similar share (35%) say they consulted another online source, such as health websites, like WebMD after using social media for information, and an even smaller share (21%) say they checked with health agency websites, like the CDC, “every” or “most of the time” after using social media for health information and advice in order to verify the accuracy of the information.

In fact, a majority of social media users say they either “some of the time,” “rarely,” or “never” followed up with a health care provider (64%), consulted another online source (65%), or checked a government health agency website (78%) after using social media for health information.

Stacked bar chart showing how often adults who use social media for health information follow up to verify accuracy, ranging from every time to never, across three verification methods: following up with a doctor or health professional, consulting another online source, and checking a government health agency website.

This KFF Tracking Poll on Health Information and Trust was designed and analyzed by public opinion researchers at KFF. The survey was conducted May 7 – 31, 2026, online and by telephone among a nationally representative sample of 2,480 U.S. adults in English (2,407) and Spanish (73).

The sample includes 1,977 who were reached through an address-based sample (ABS) and completed the survey online (1,819) or over the phone (158). An additional 503 respondents were reached through a random digit dial telephone (RDD) sample of prepaid (pay-as-you-go) cell phone numbers. Among this prepaid cell phone component, 223 were interviewed by phone and 280 were invited to the web survey via short message service (SMS). Marketing Systems Groups (MSG) provided both the ABS and RDD samples. All fieldwork was managed by SSRS of Glen Mills, PA; sampling design and weighting was done in collaboration with KFF.

Both the ABS and RDD sample frames included disproportionate stratification aimed at reaching Hispanic and non-Hispanic Black respondents. The ABS was also stratified based on model-based prediction of household-members’ party identification (Republican, Democratic, or independent).

Respondents received a $15 incentive for their participation, with interviews completed by phone receiving a mailed check and web respondents receiving an electronic gift card incentive.

In order to ensure data quality, cases were removed if they failed two or more quality checks: (1) attention check questions in the online version of the questionnaire, (2) had over 30% item nonresponse, or (3) had a length less than one quarter of the mean length by mode. Likewise, cases that were reached through ABS who reported a living in a different state than the sampled address were removed for quality assurance. Based on this criterion, 39 cases were removed.

The combined ABS and cell phone samples were weighted to match the sample’s demographics to the national U.S. adult population using data from the Census Bureau’s 2025 Current Population Survey (CPS). The combined sample was weighted by gender by age, gender by education, age by education, race/ethnicity by education, education, race, census region, population density, frequency of internet usage, recalled 2024 vote by quintiles of the county-level 2024 vote share. The weights also take into account differences in the probability of selection for each sample type (ABS and prepaid cell phone). This includes adjustment for the sample design and geographic stratification of the samples, and within household probability of selection. The population density benchmark was from the 2026 Claritas Pop-Facts Premier. The internet frequency benchmarks was from the 2025 National Public Opinion Reference Survey (NPORS) data. The county-level 2024 vote share was from CNN-provided file of 2024 election results by county

The margin of sampling error including the design effect for the full sample is plus or minus 3 percentage points. Numbers of respondents and margins of sampling error for key subgroups are shown in the table below. For results based on other subgroups, the margin of sampling error may be higher. Sample sizes and margins of sampling error for other subgroups are available by request. Sampling error is only one of many potential sources of error and there may be other unmeasured error in this or any other public opinion poll. The following questions included in this survey were designed, analyzed, and paid for by KFF. The demographic questions included in this study were developed and funded jointly by CNN and KFF, with each organization having independent editorial control over its portion of the survey. KFF Public Opinion and Survey Research is a charter member of the Transparency Initiative of the American Association for Public Opinion Research.

GroupN (unweighted)M.O.S.E.
Total2,480± 3 percentage points
Race/Ethnicity 
White, non-Hispanic1,355± 3 percentage points
Black, non-Hispanic435± 6 percentage points
Hispanic420± 7 percentage points
Age  
18-29399± 7 percentage points
30-49888± 4 percentage points
50-64590± 5 percentage points
65+556± 6 percentage points
Party ID  
Democrats774± 5 percentage points
Independents876± 5 percentage points
Republicans607± 5 percentage points

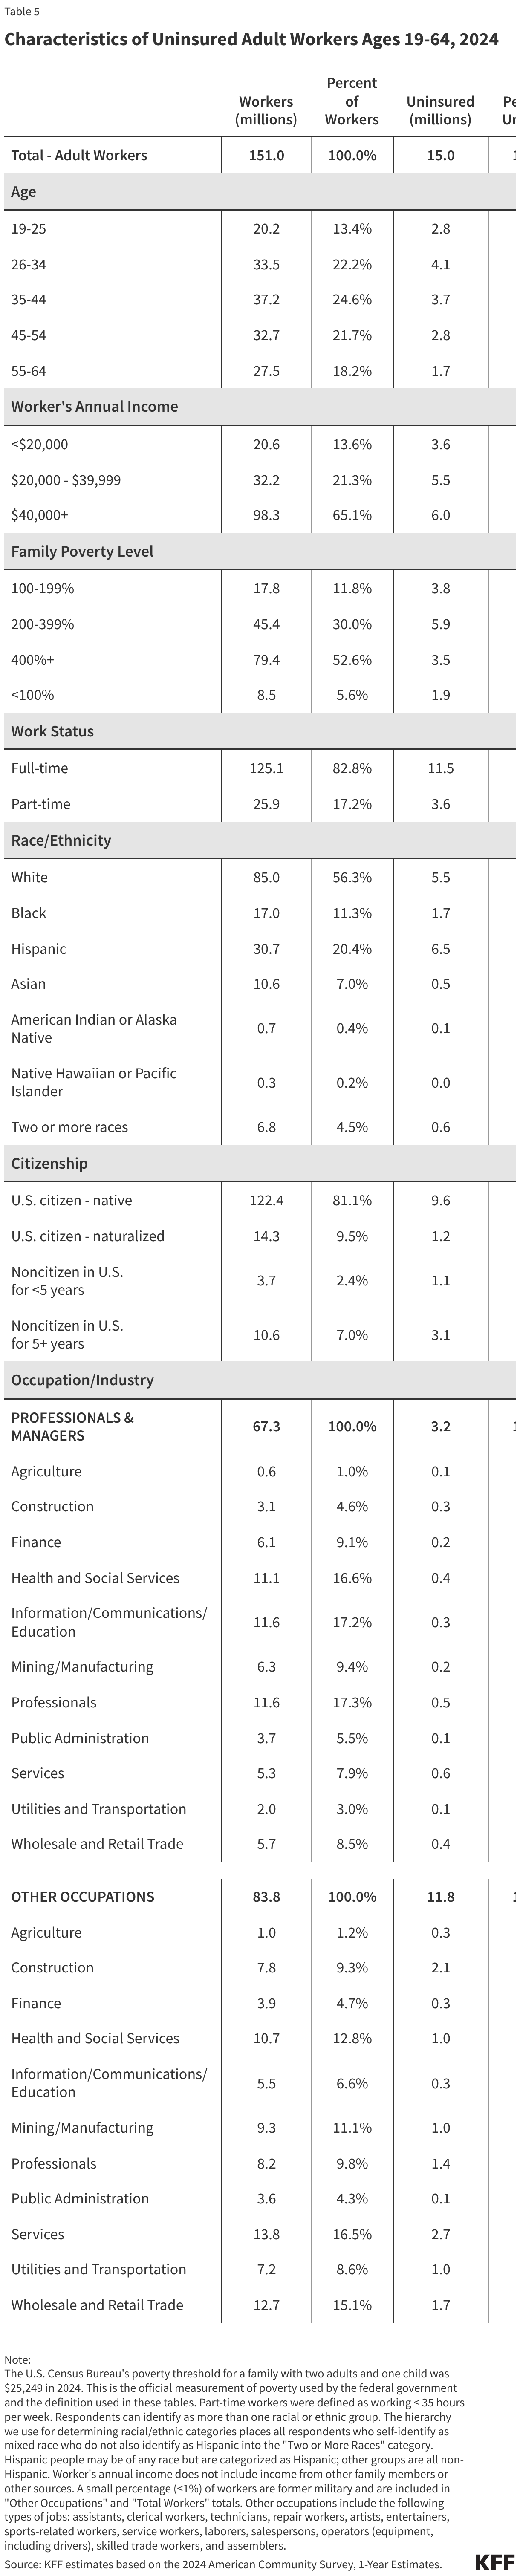
Key Facts about the Uninsured Population

Authors:

Published: June 16, 2026

This brief was updated on June 16, 2026 to reflect a change in coverage gap estimates.

Executive Summary

Introduction

Copy link to Introduction

The high cost of private insurance and limited availability of public coverage for some individuals with low income—particularly in states that have not expanded Medicaid under the Affordable Care Act (ACA)—continued to leave millions of people without health coverage in 2024. Our fragmented and complex health insurance system also means some people fall through the cracks of coverage when they experience a change in circumstances. The end of continuous enrollment in Medicaid also affected health coverage trends in 2024. Starting in April 2023, states resumed disenrolling Medicaid enrollees, a process known as Medicaid unwinding, after a period of continuous enrollment during the pandemic. Nearly all states had completed renewals to verify eligibility for the program for all enrollees by the end of 2024, leading to the disenrollment of millions of Medicaid enrollees. Most individuals losing Medicaid do not have access to affordable job-based coverage, and while many transitioned to subsidized coverage through the Marketplace, even with enhanced Marketplace subsidies still in place during 2024, coverage was unaffordable for some. These coverage transitions and losses contributed to the first increase in the uninsured rate since 2019.

The number of people who are uninsured is expected to continue to increase in coming years because of changes to Medicaid and the ACA Marketplace included in the 2025 reconciliation law, the expiration of the Marketplace enhanced premium tax credits, and other administrative actions.  The Congressional Budget Office (CBO) projects that over 14 million more people will be uninsured in 2034 due to the combined effects of the Medicaid and Marketplace eligibility changes included in the reconciliation law and the expiration of the enhanced Marketplace subsidies. In addition to these potential coverage losses, the Trump administration’s increased immigration enforcement activities and policy changes are likely to have a broad chilling effect that could cause lawfully present immigrants who remain eligible to decide to disenroll or not enroll themselves or their children in health coverage programs. This anticipated coverage loss will have implications for access to care and financial stability among those losing coverage and could lead to a worsening of disparities in health outcomes.

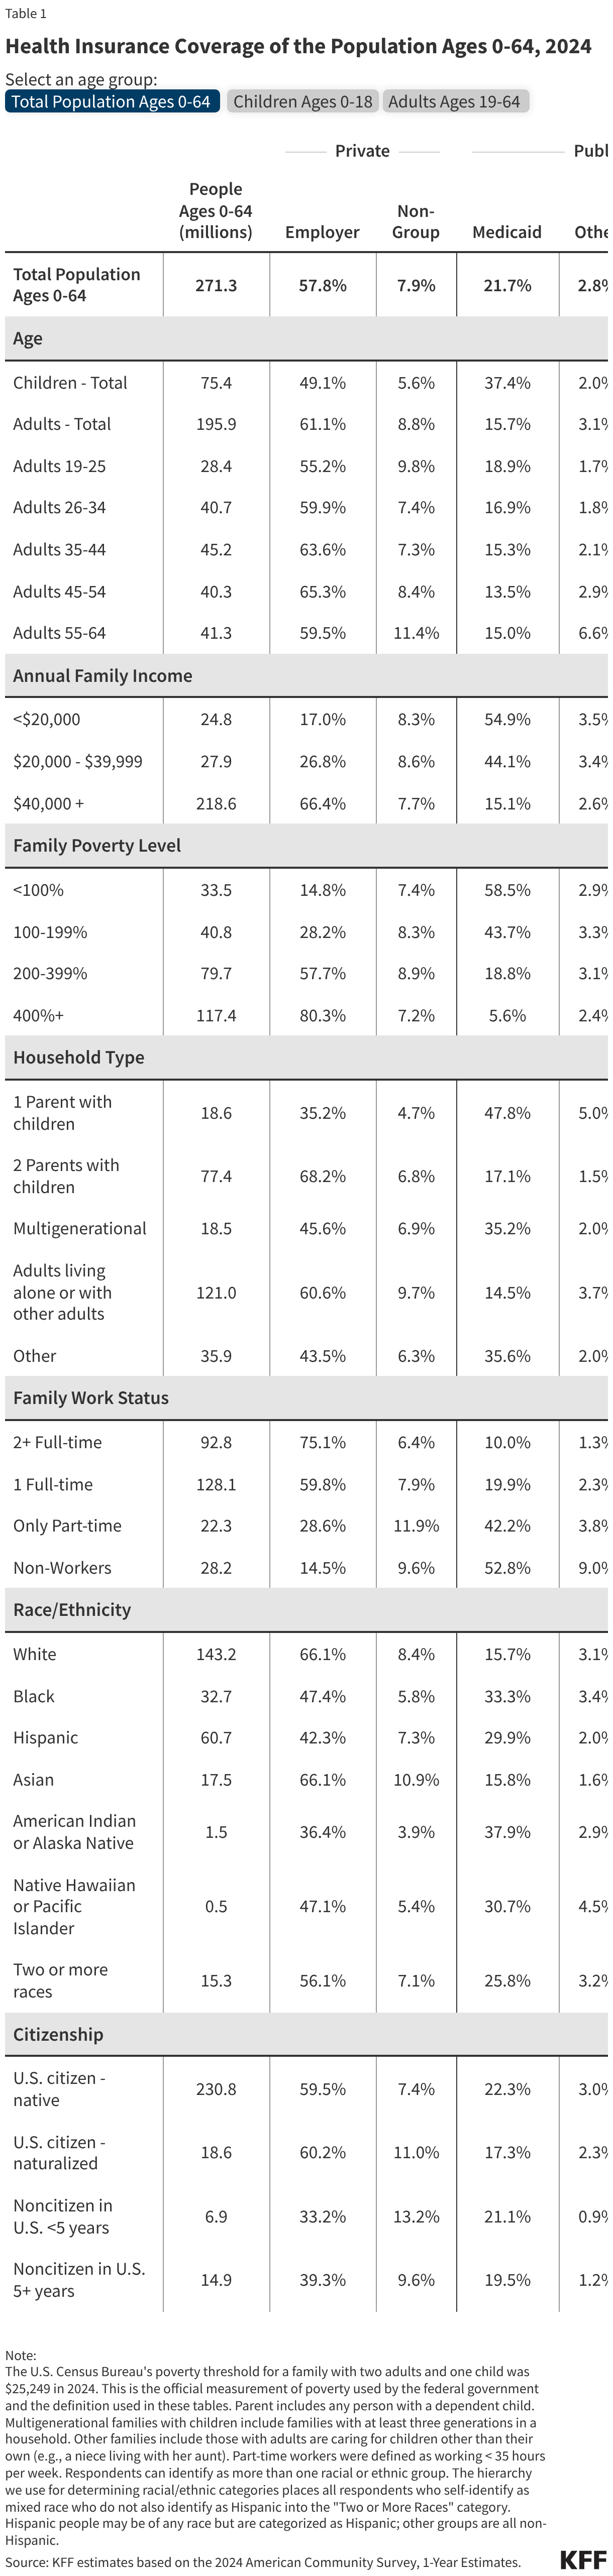
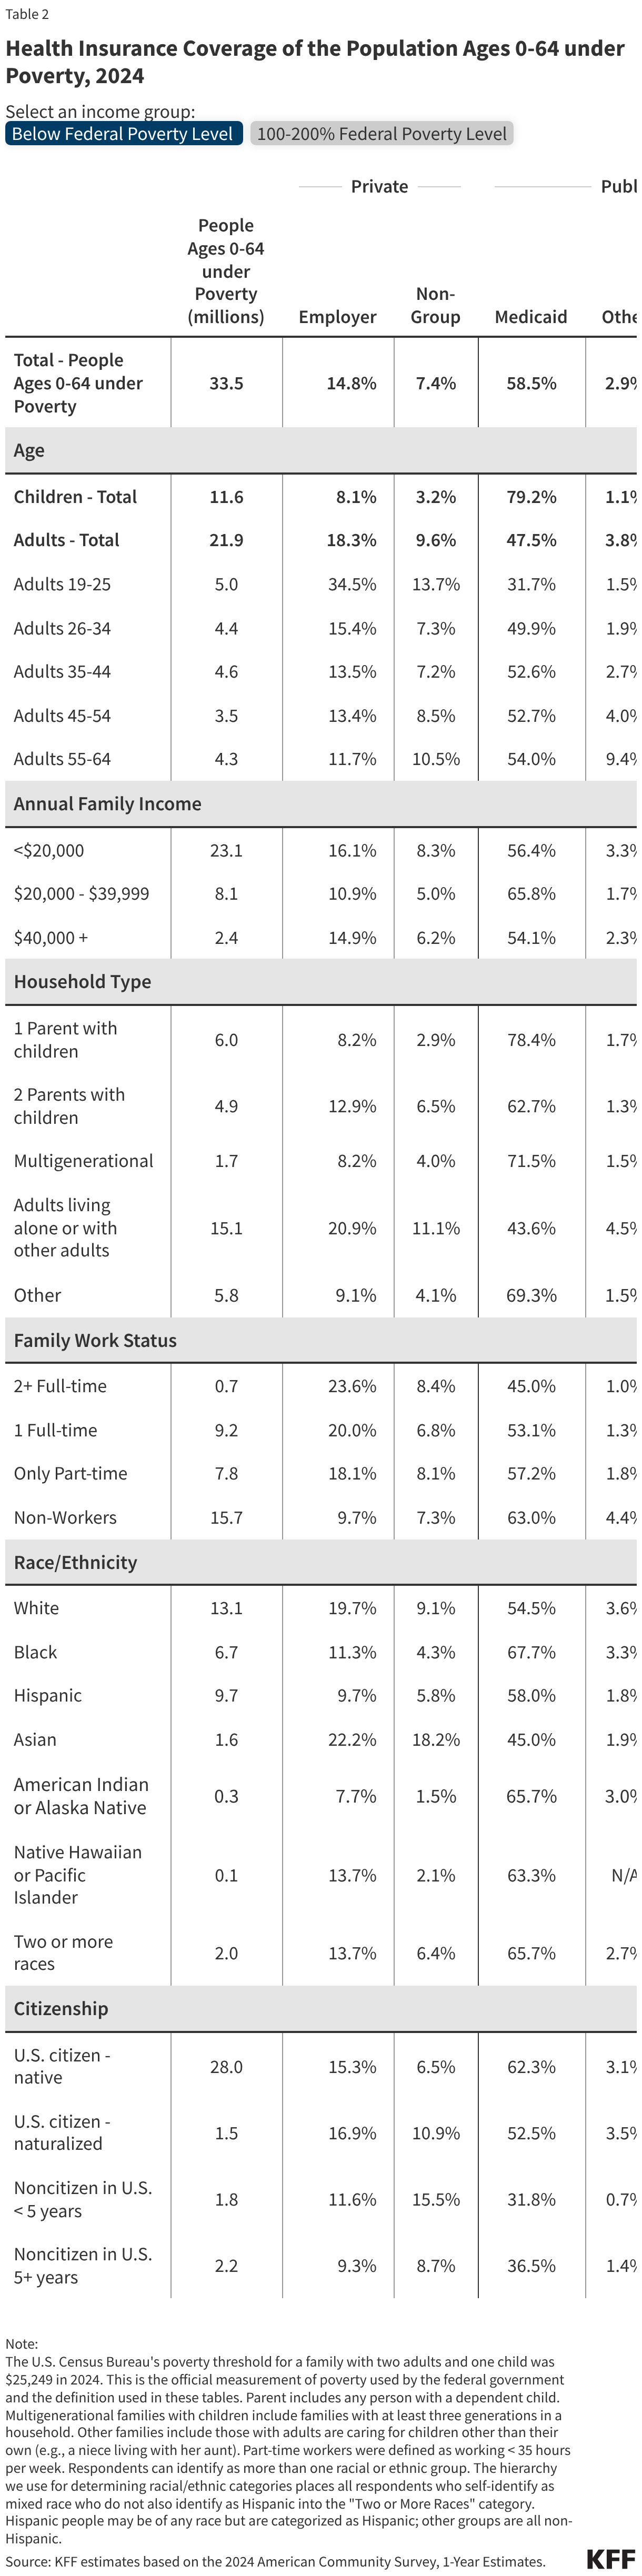
This issue brief describes trends in health coverage through 2024, examines the characteristics of the uninsured population ages 0-64, and summarizes the access and financial implications of not having coverage. Using data from the American Community Survey (ACS), this analysis examines changes in health coverage from 2023 to 2024. The analysis focuses on coverage among people ages 0-64 since Medicare offers near universal coverage for the elderly, with just 491,000, or less than 1%, of people over age 65 uninsured. 

Key Takeaways

Copy link to Key Takeaways
How many people are uninsured?

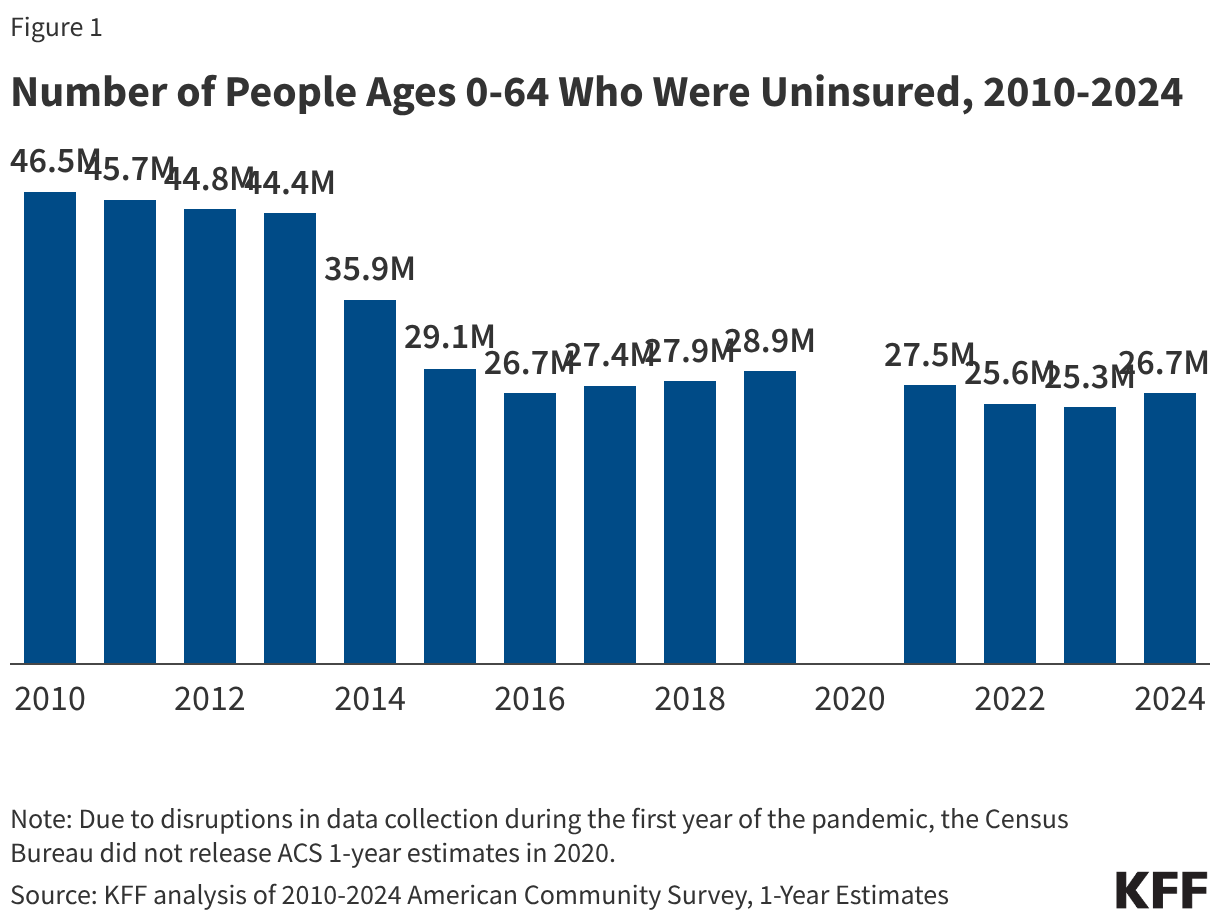
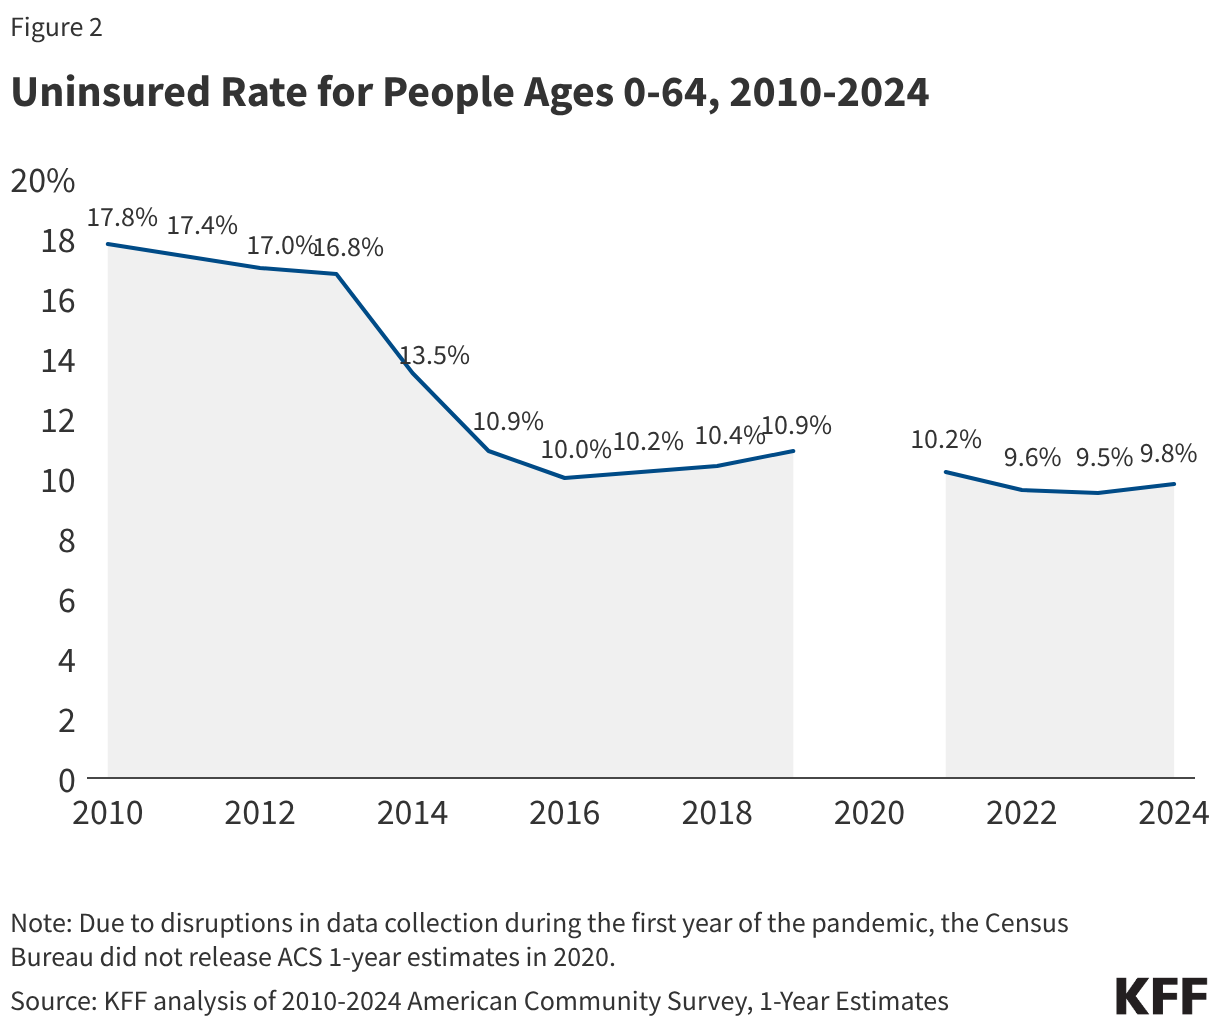
For the first time since 2019, the number of people without health coverage and the uninsured rate increased in 2024. The total number of people ages 0-64 without health coverage increased by more than 1.3 million to 26.7 million in 2024, and the uninsured rate for the population under age 65 increased from 9.5% to 9.8%.

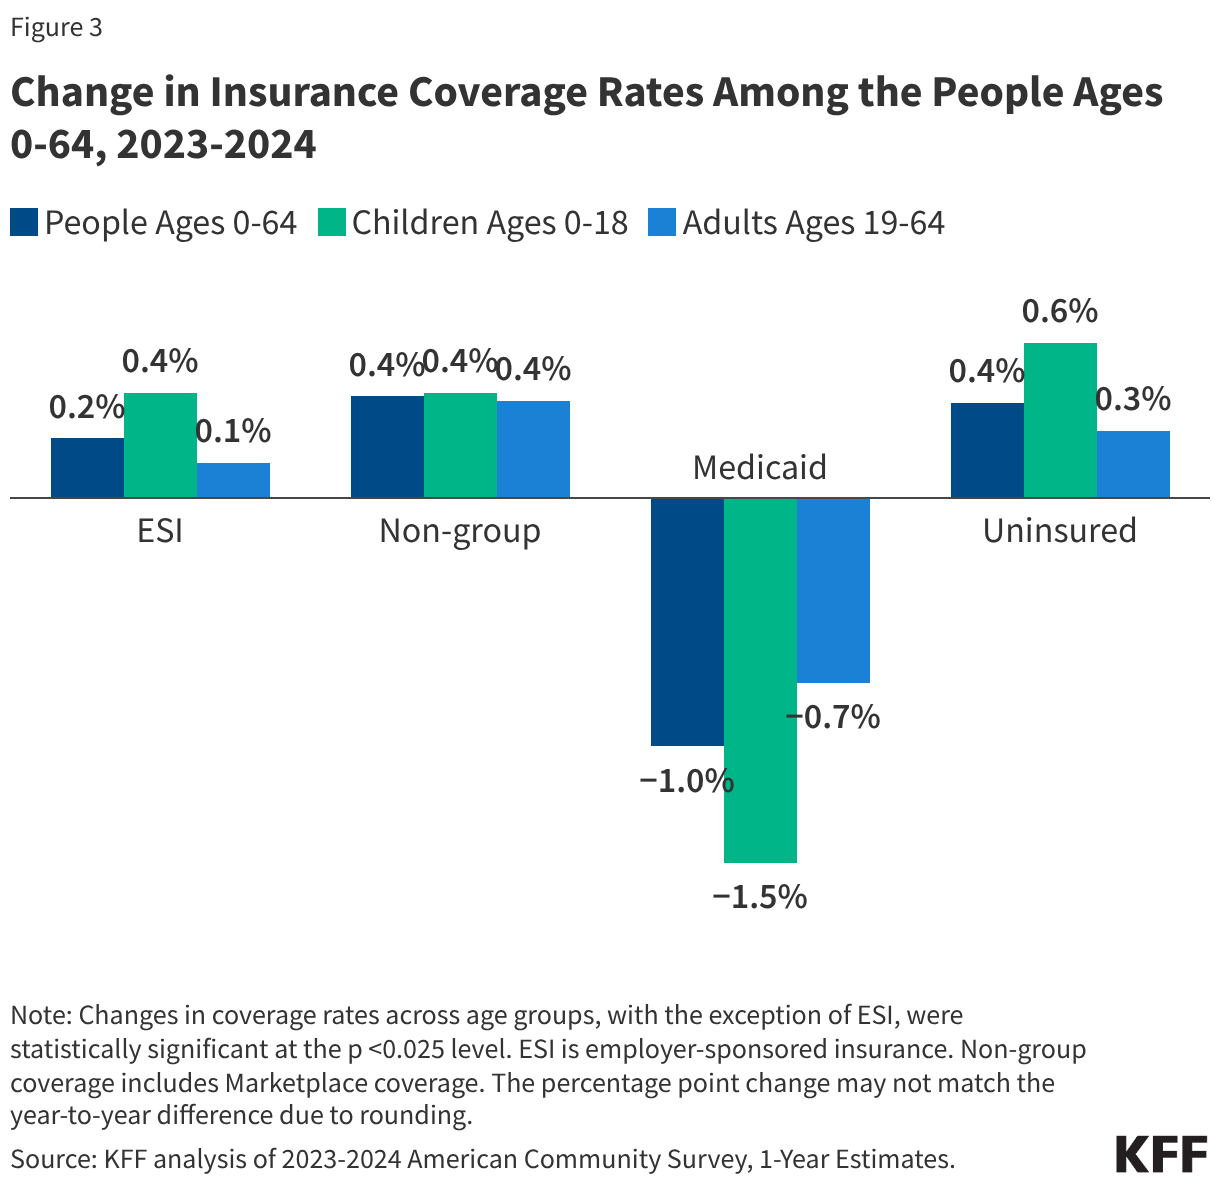
A decline in Medicaid coverage drove the increase in the uninsured rate in 2024. While non-group coverage, including ACA Marketplace coverage, increased from 2023 to 2024, the increase did not fully offset the drop in Medicaid coverage from 2023 to 2024 among both adults and children.

Who is uninsured?

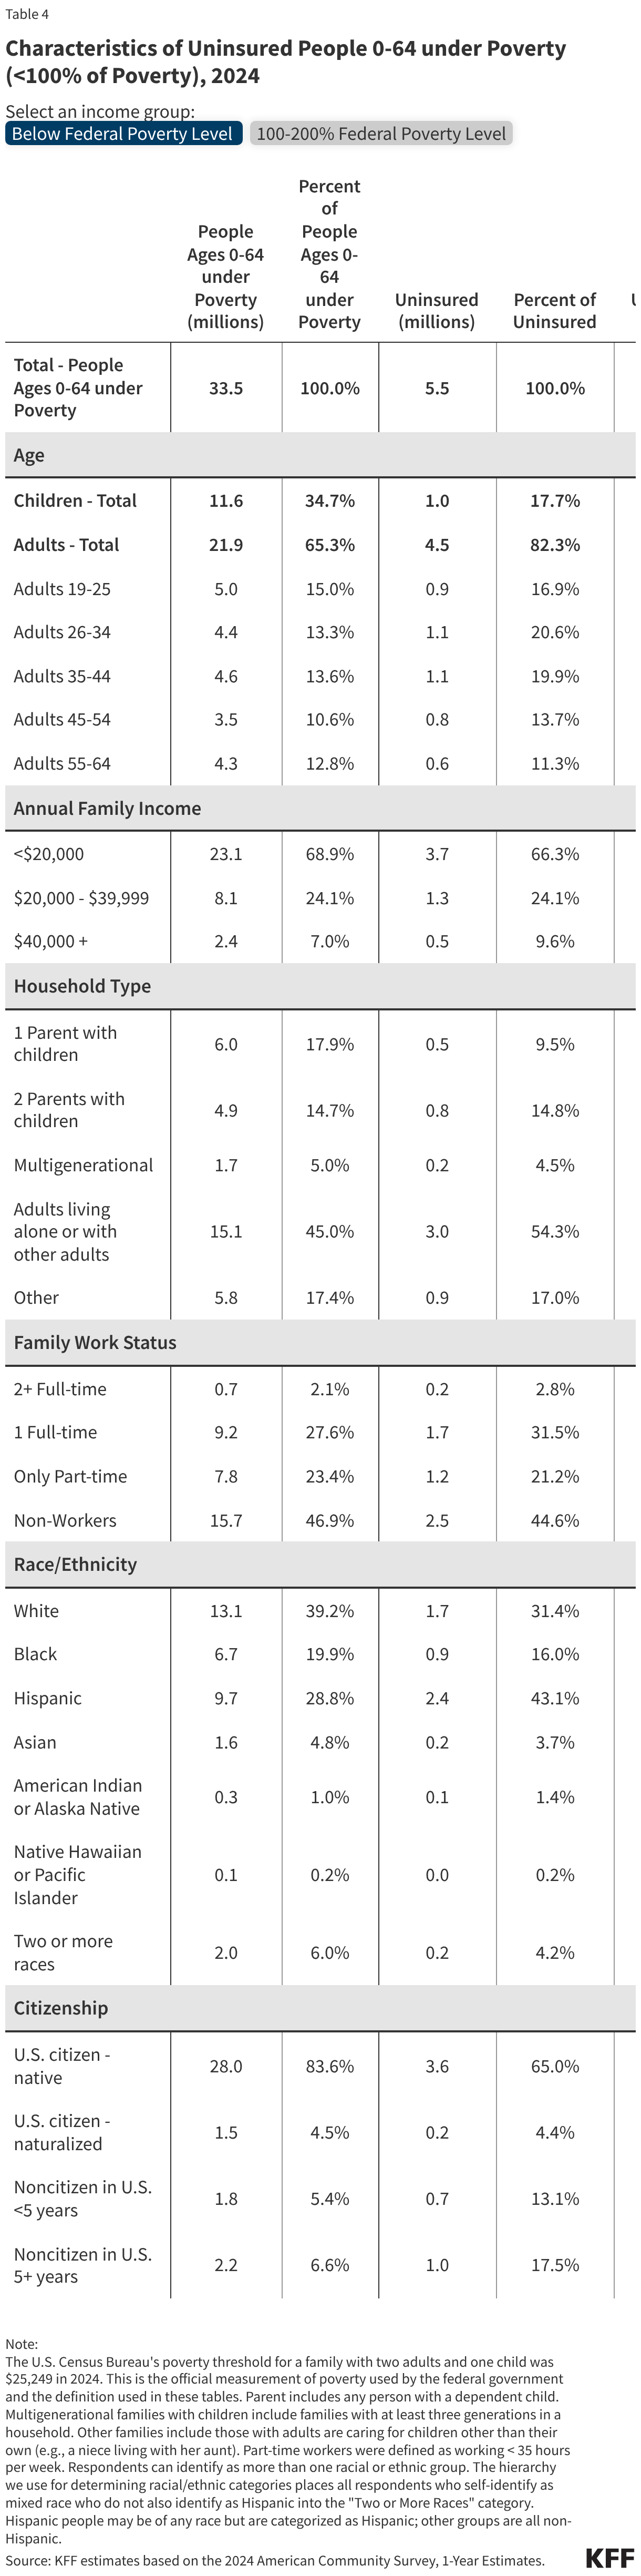
In 2024, over eight in ten people who are uninsured were in low-income families (80.1%) and had at least one worker in the family (85.1%), and over six in ten were people of color (63.7%). Reflecting the more limited availability of public coverage in some states, adults ages 19-64 are more likely to be uninsured than children (11.3% vs. 5.9%). Despite coverage gains across groups over time, American Indian or Alaska Native, Hispanic, Black, and Native Hawaiian or Pacific Islander people were more likely to be uninsured than White and Asian people. 

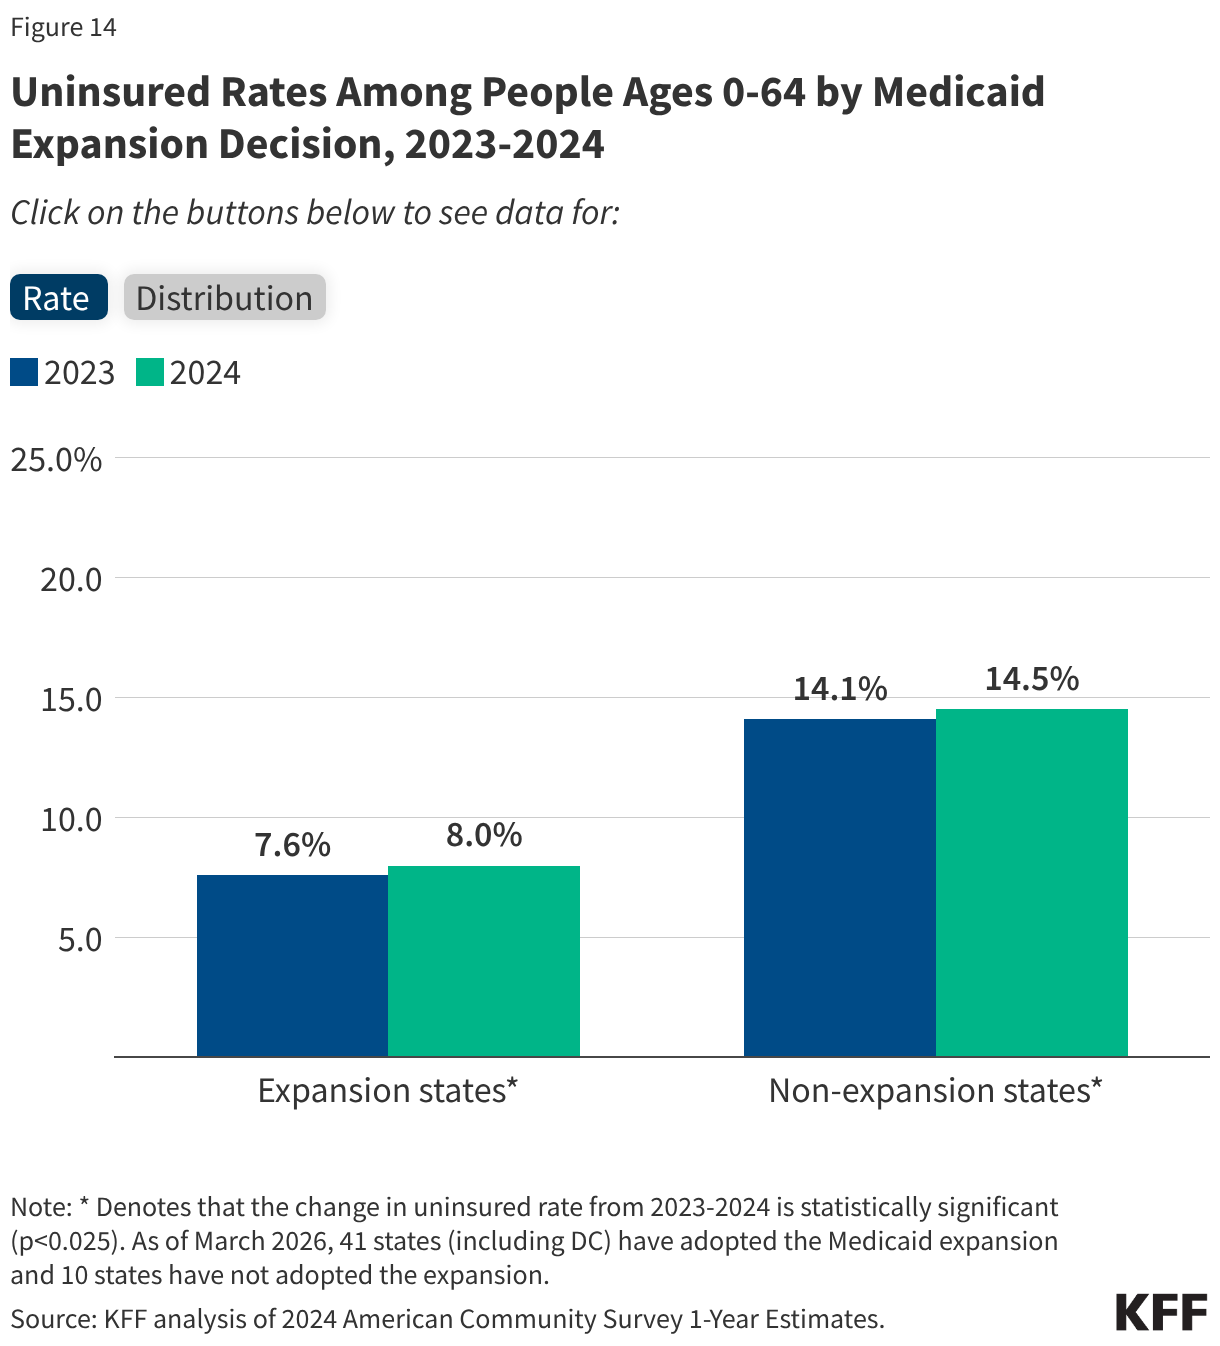
A disproportionate share of uninsured individuals under age 65 (42%) live in the ten states that have not expanded Medicaid. Individuals living in non-expansion states are nearly twice as likely as those in expansion states to be uninsured; the uninsured rate in non-expansion states was 14.5% compared to 8.0% in expansion states.

Why are people uninsured? 

The high cost of insurance is the main reason many people are uninsured. In 2024, 61.7% of uninsured adults ages 18-64 said they were uninsured because coverage is not affordable. Many uninsured people do not have access to coverage through a job, and some people, particularly poor adults in states that have not expanded Medicaid, remain ineligible for public coverage. Among uninsured adults who were working, 71% were not offered or were not eligible for coverage from their employer in 2024.

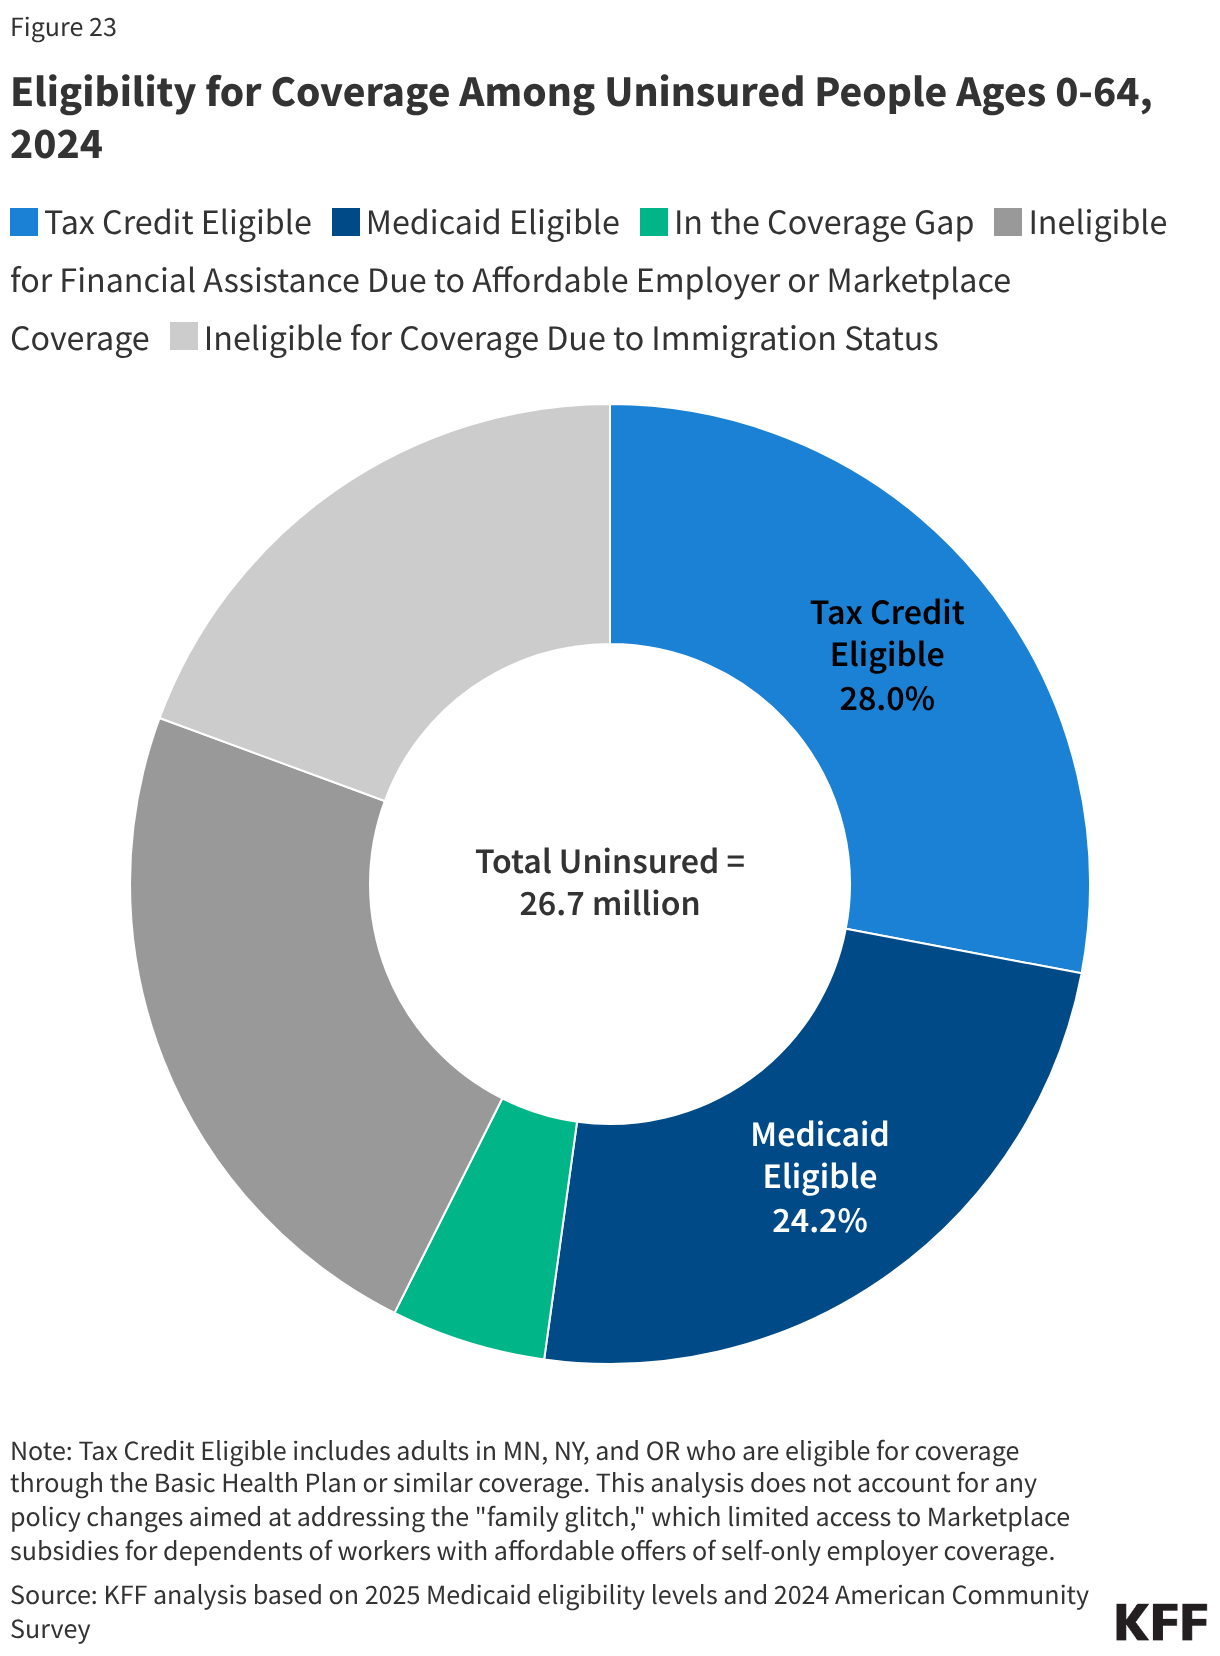
About half (52.2%) of people who are uninsured may be eligible for Medicaid or subsidized coverage in the Marketplace. However, they may not be aware of these coverage options or may face barriers to enrolling. In addition, with the expiration of the enhanced premium tax credits, Marketplace coverage has gotten more expensive and may be unaffordable for some.

How does not having coverage affect health care access?  

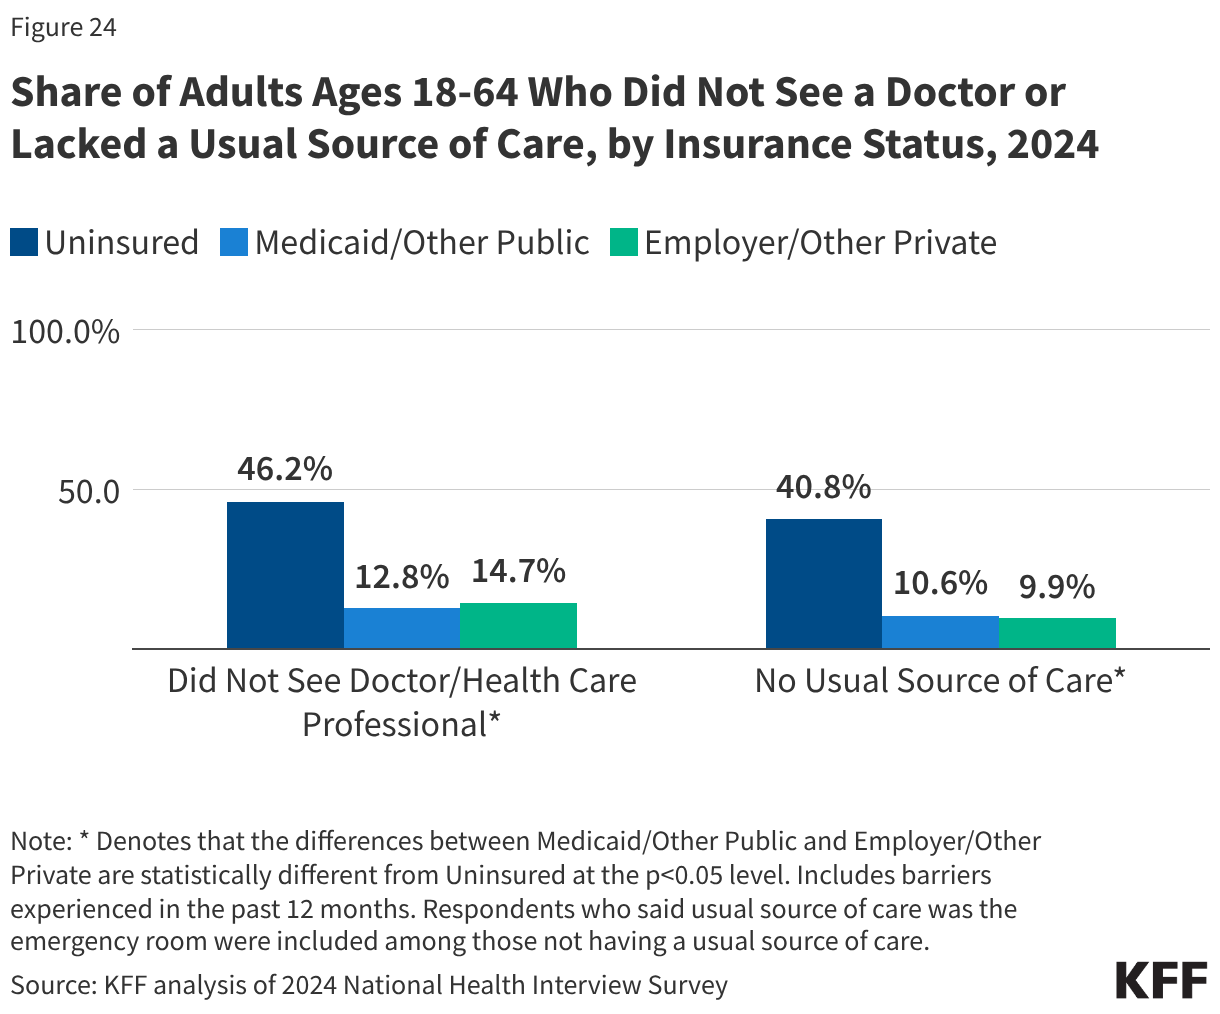
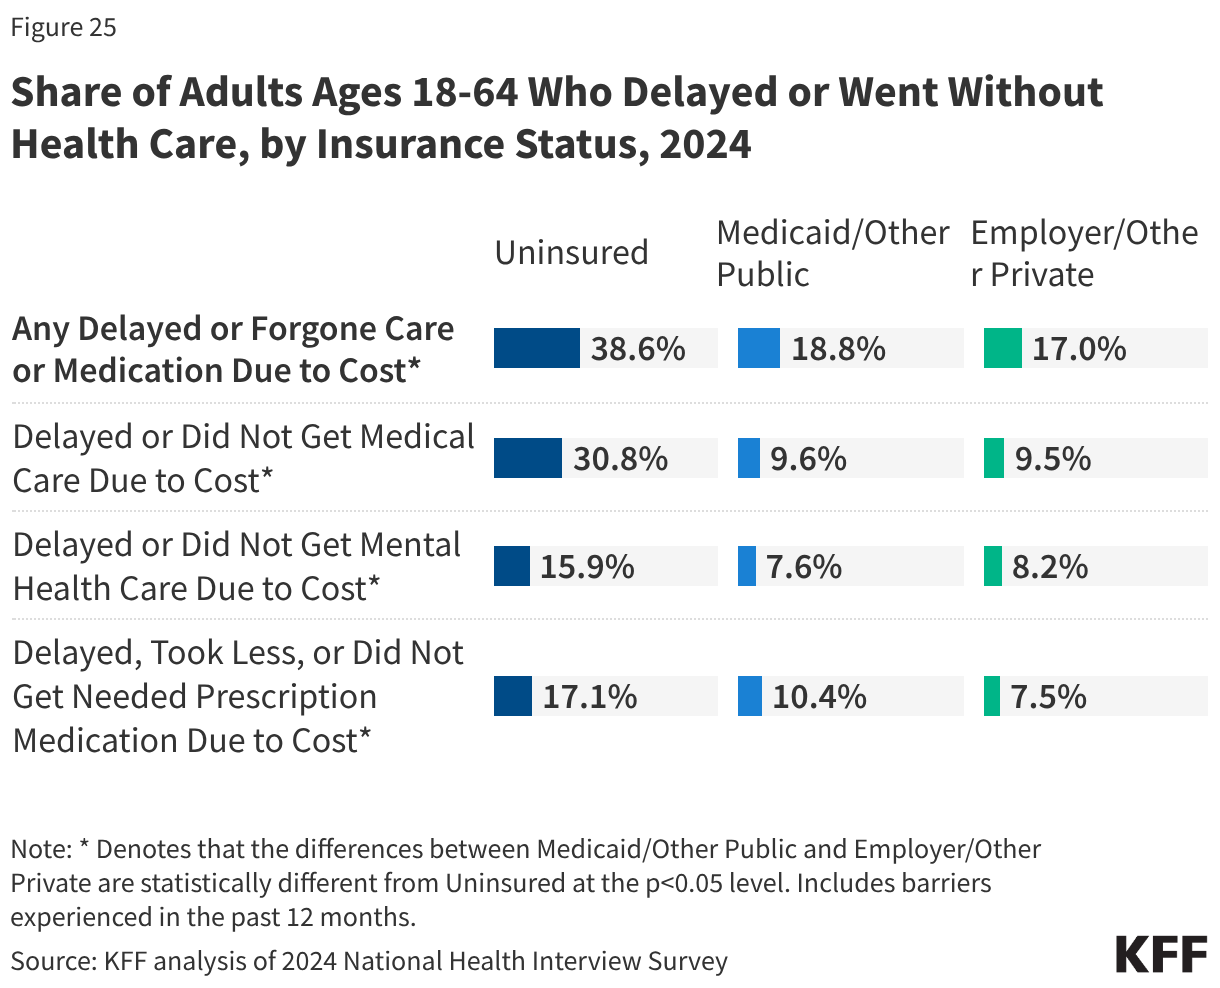
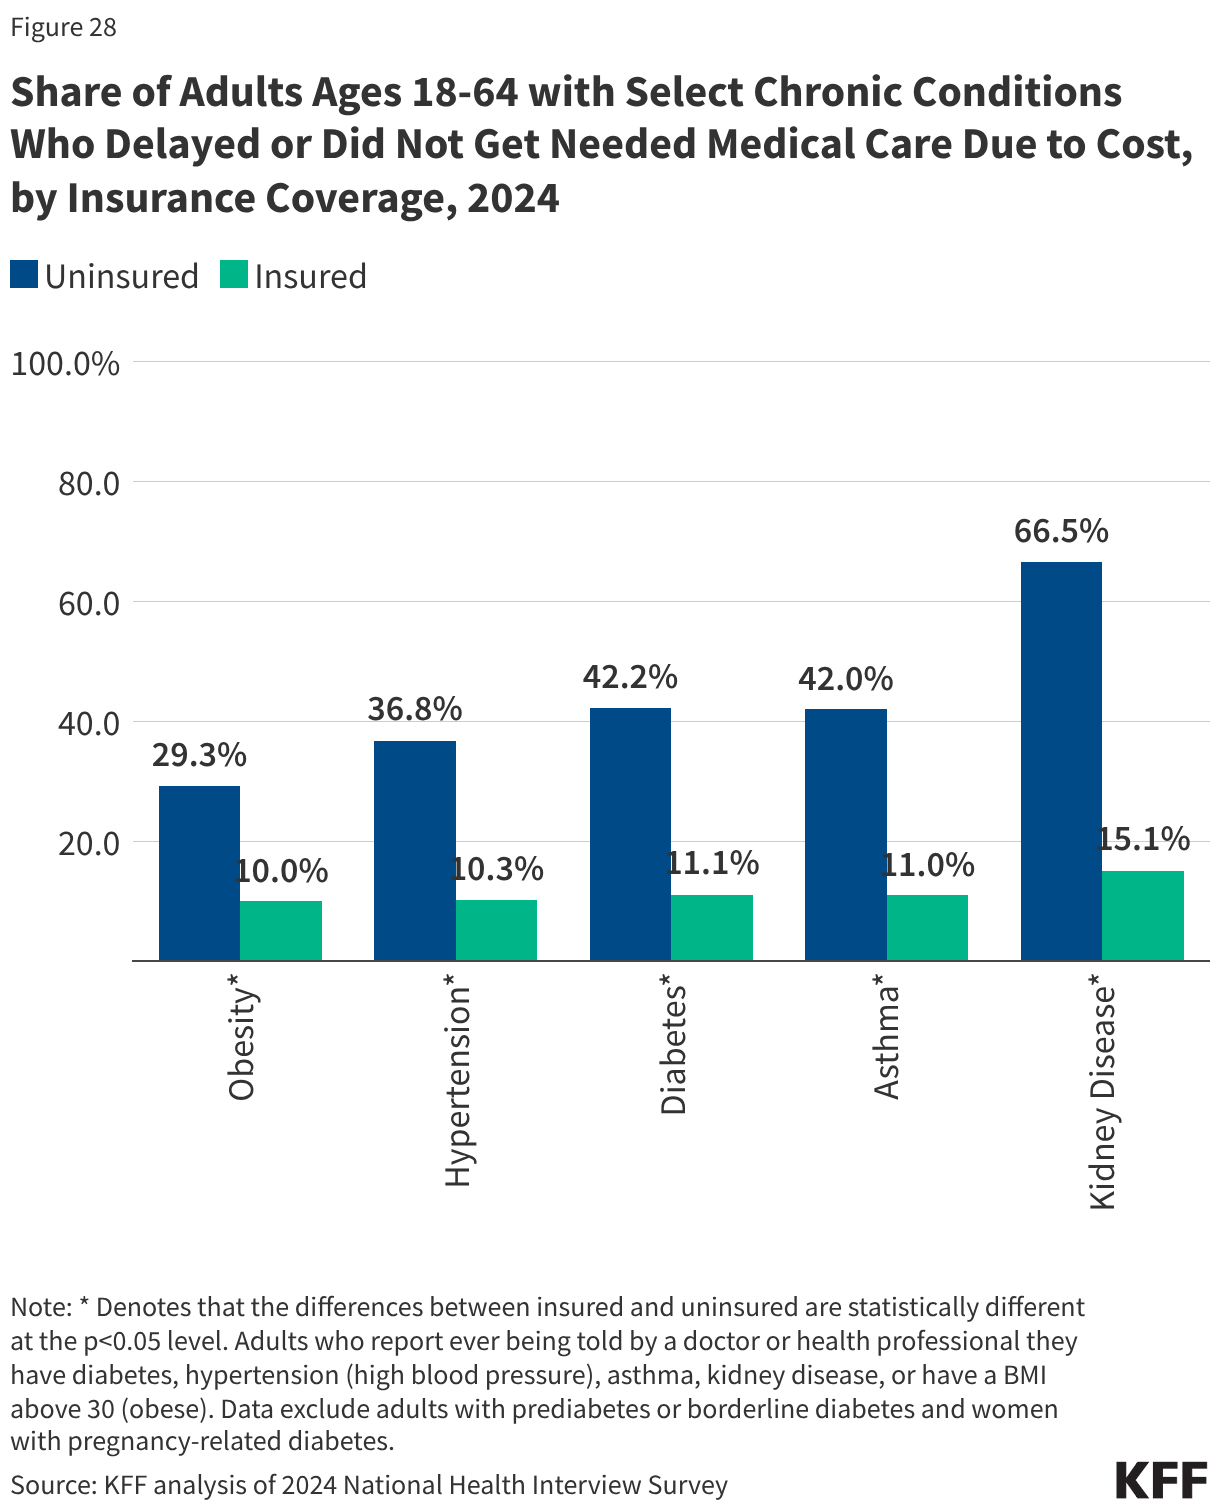
People without insurance coverage are less likely to access care and more likely to delay or forgo care because of costs. In 2024, nearly four in ten uninsured adults (38.6%) reported delaying, skipping, or not getting needed care or medication due to cost, more than twice the share of adults with private coverage (17.0%) and those with public coverage (18.8%).  Among adults with chronic health conditions who need ongoing medical management, those without insurance coverage were three to four times more likely to delay or forgo needed medical care due to cost than adults with the same condition who were insured. Research demonstrates that gaining health insurance, particularly through Medicaid, improves access to care, utilization of services, and reduces mortality.

What are the financial implications of being uninsured? 

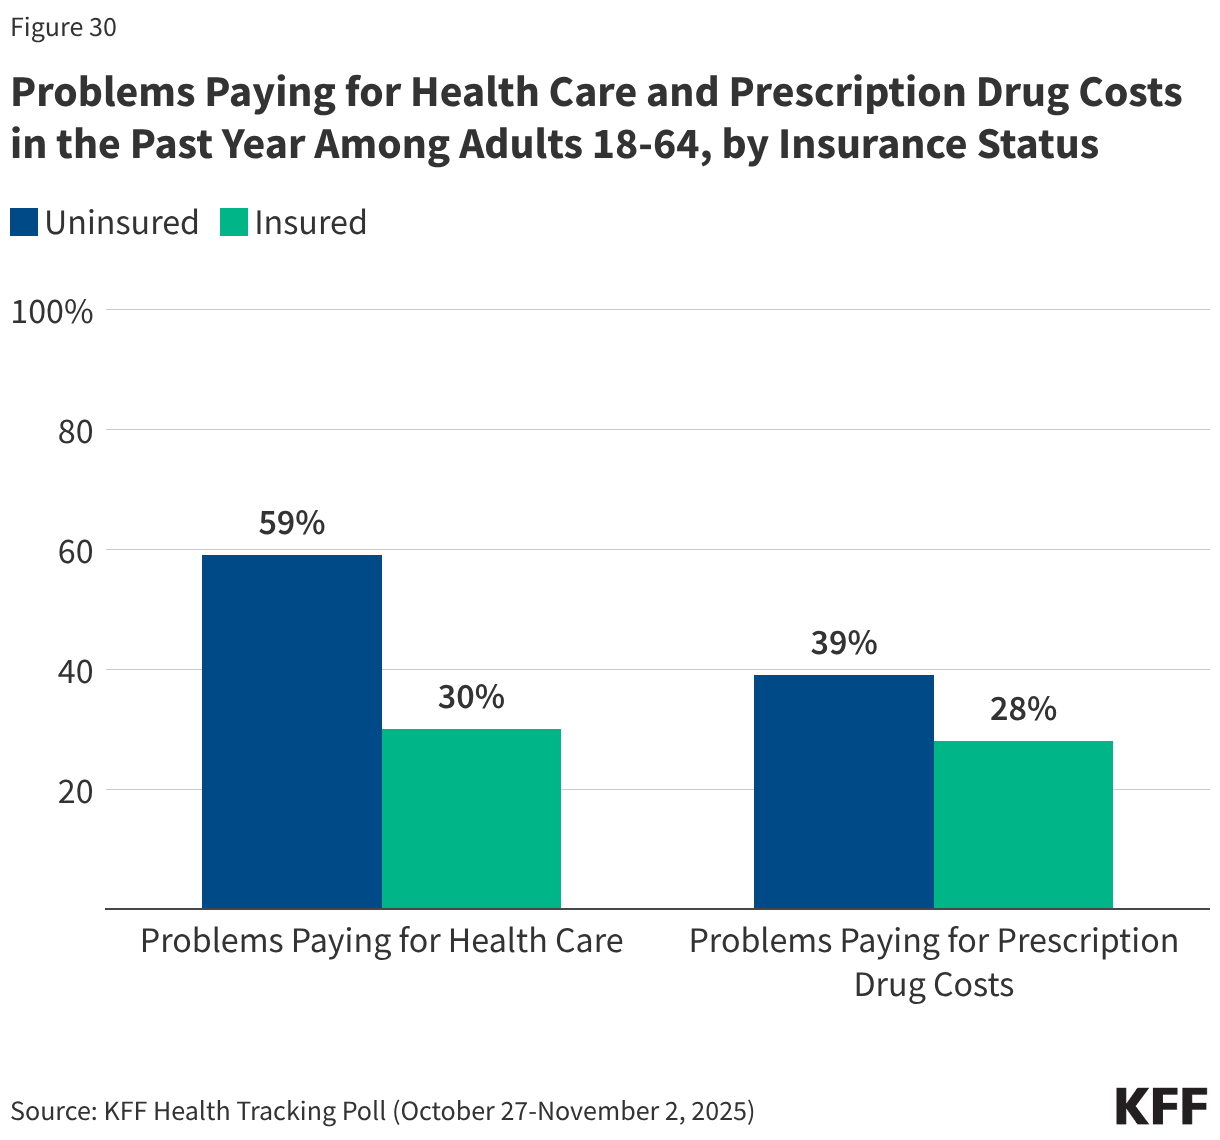
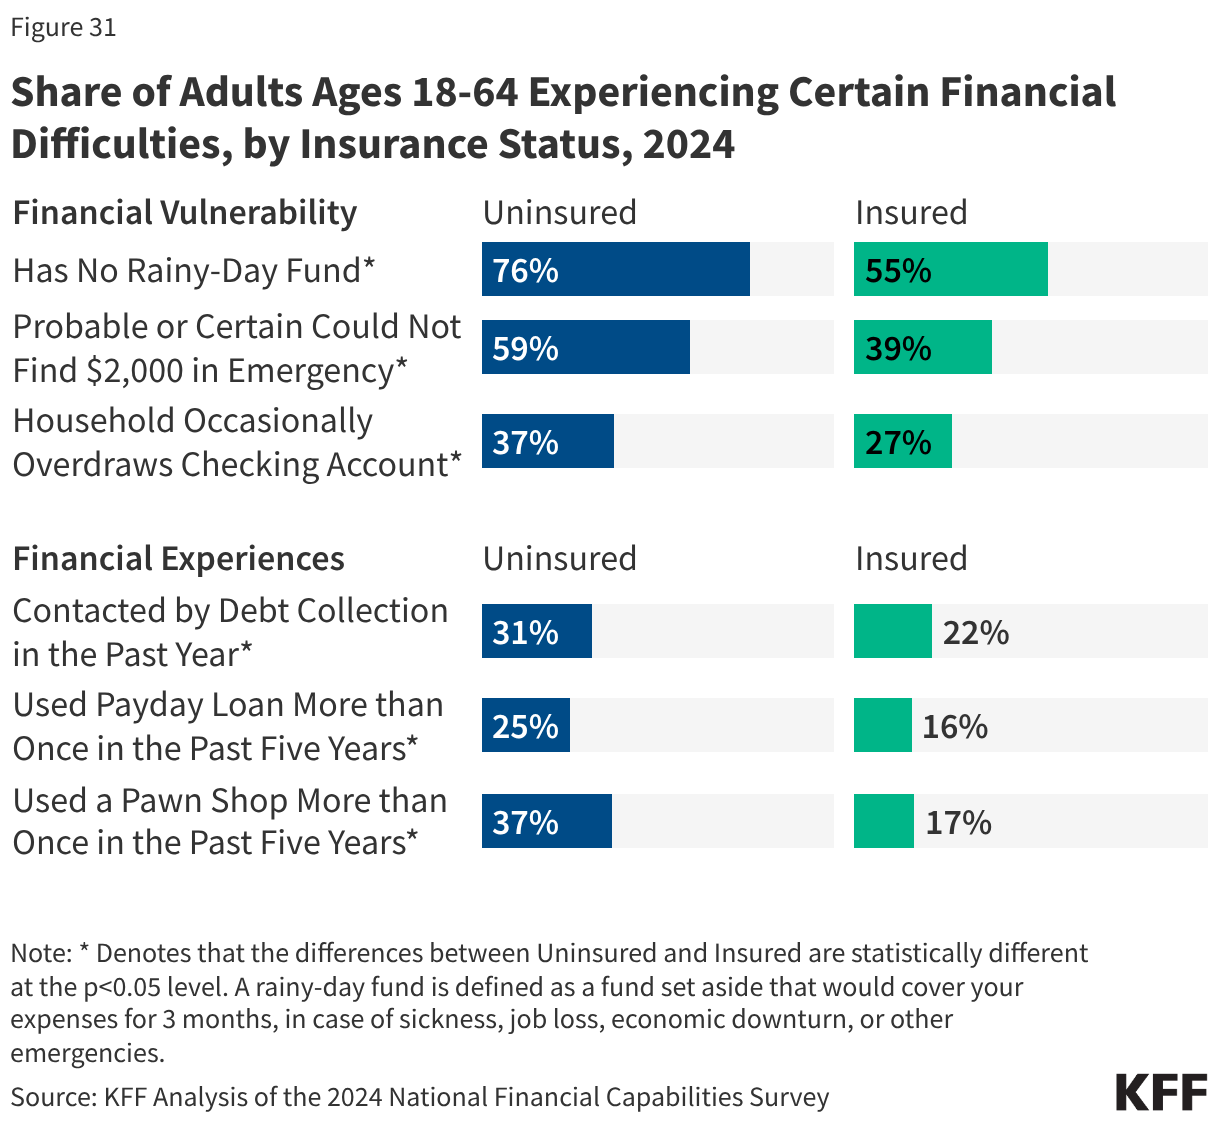
Uninsured adults are nearly twice as likely as insured adults to have difficulty paying health care costs. Nearly six in ten (59%) uninsured adults said they or someone living with them had problems paying for health care compared to 30% of insured adults. People who are uninsured are also more likely to experience measures of financial distress, including overdrawing their checking account, having been contacted by a debt collection agency, and having used pay day loans.

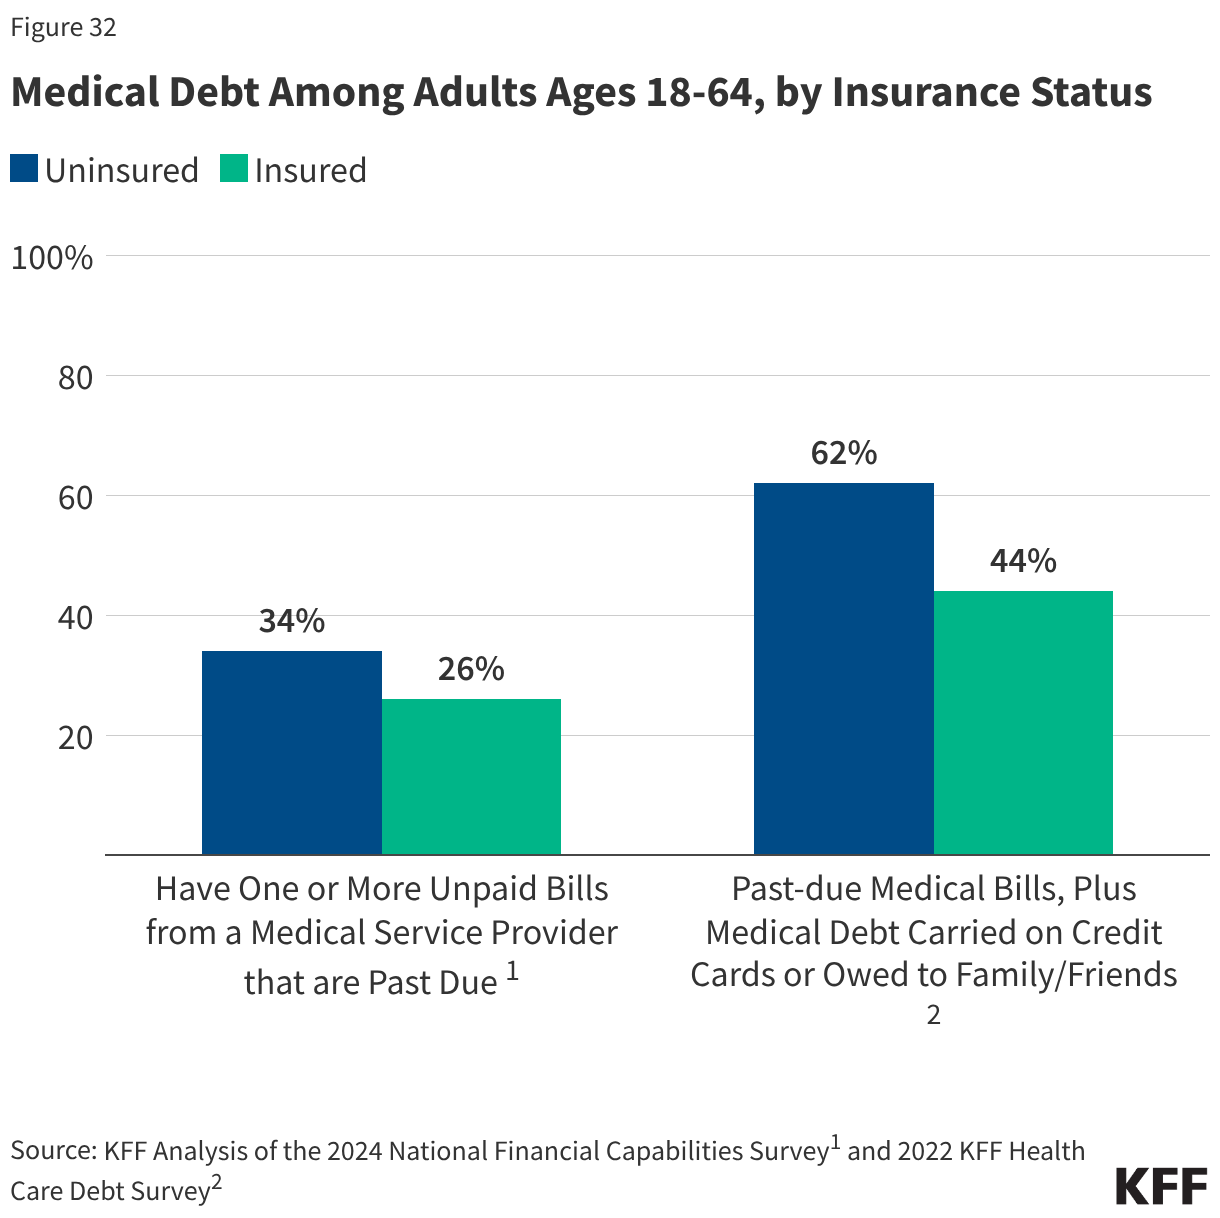
Unaffordable medical bills can lead to medical debt, particularly for uninsured adults. More than six in ten (62%) uninsured adults reported having health care debt compared to over four in ten (44%) insured adults. Uninsured adults are more likely to face negative consequences due to health care debt, such as using up savings, having difficulty paying other living expenses, or borrowing money.

Characteristics of the Uninsured Population

Age

Copy link to Age

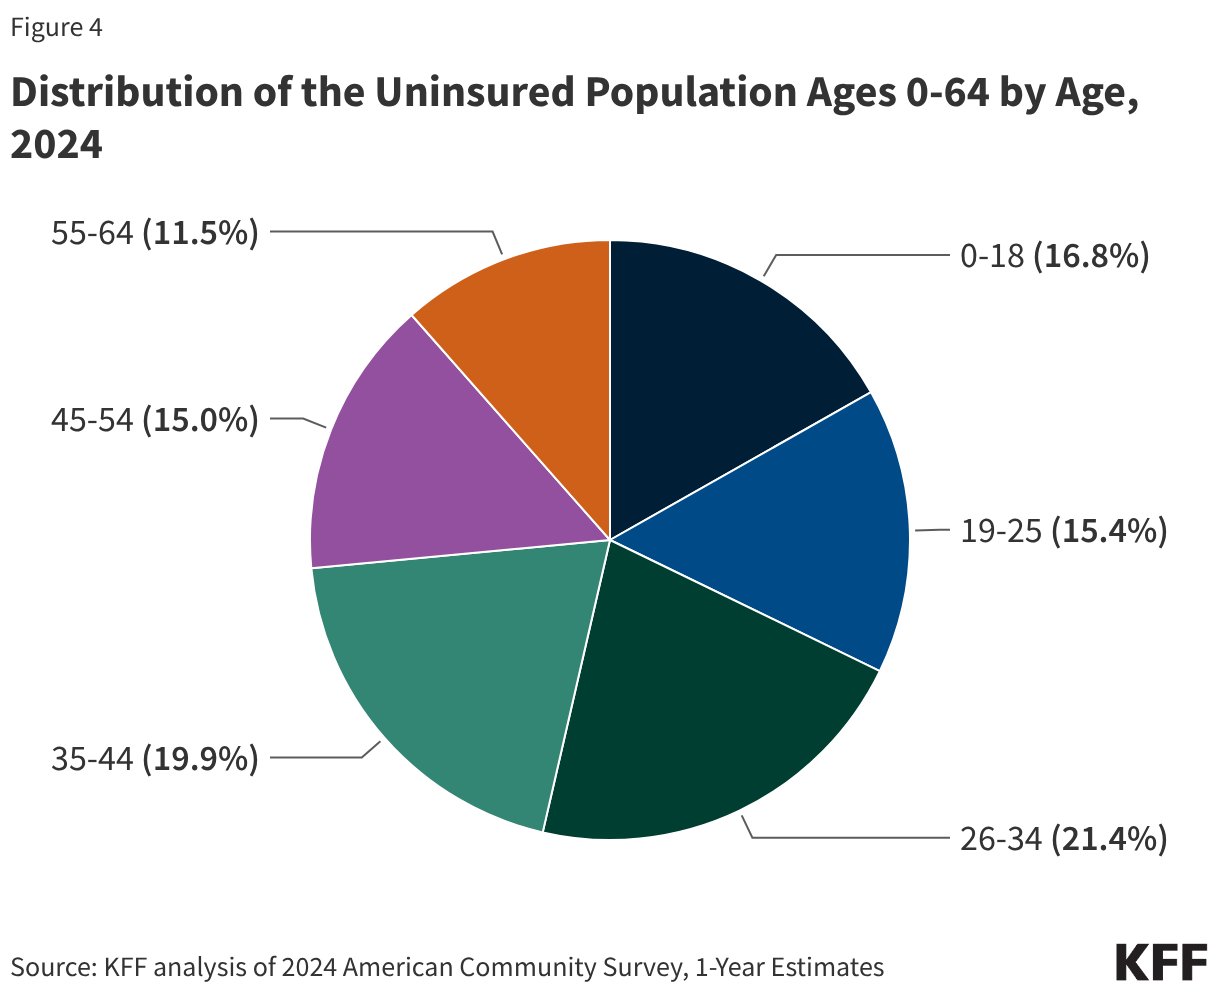
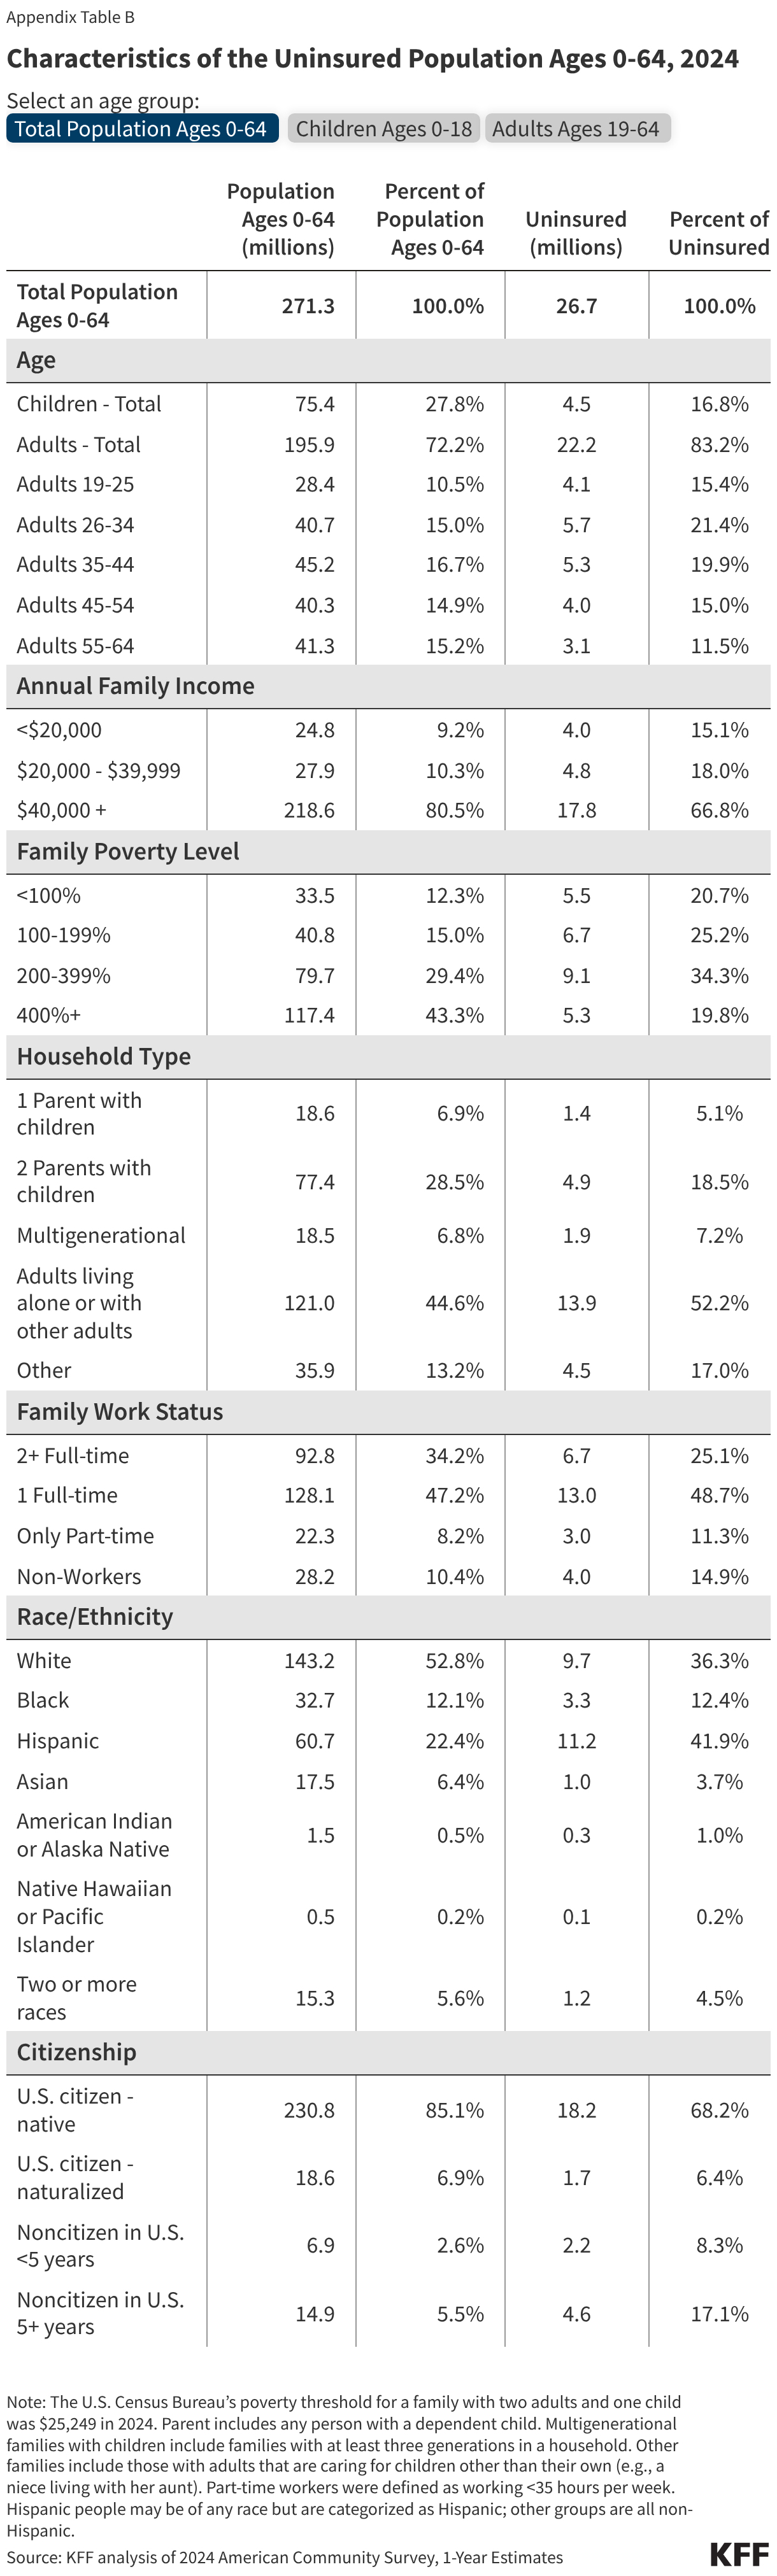
Over eight in ten (83.2%) individuals who were uninsured in 2024 were adults while 16.8% were children. Adults ages 19-44 make up more than half (56.7%) of the uninsured population under age 65. About one in four (26.5%) people who are uninsured are between the ages of 45-64 (Figure 4).

Distribution of the Uninsured Population Ages 0-64 by Age, 2024 (Pie Chart)

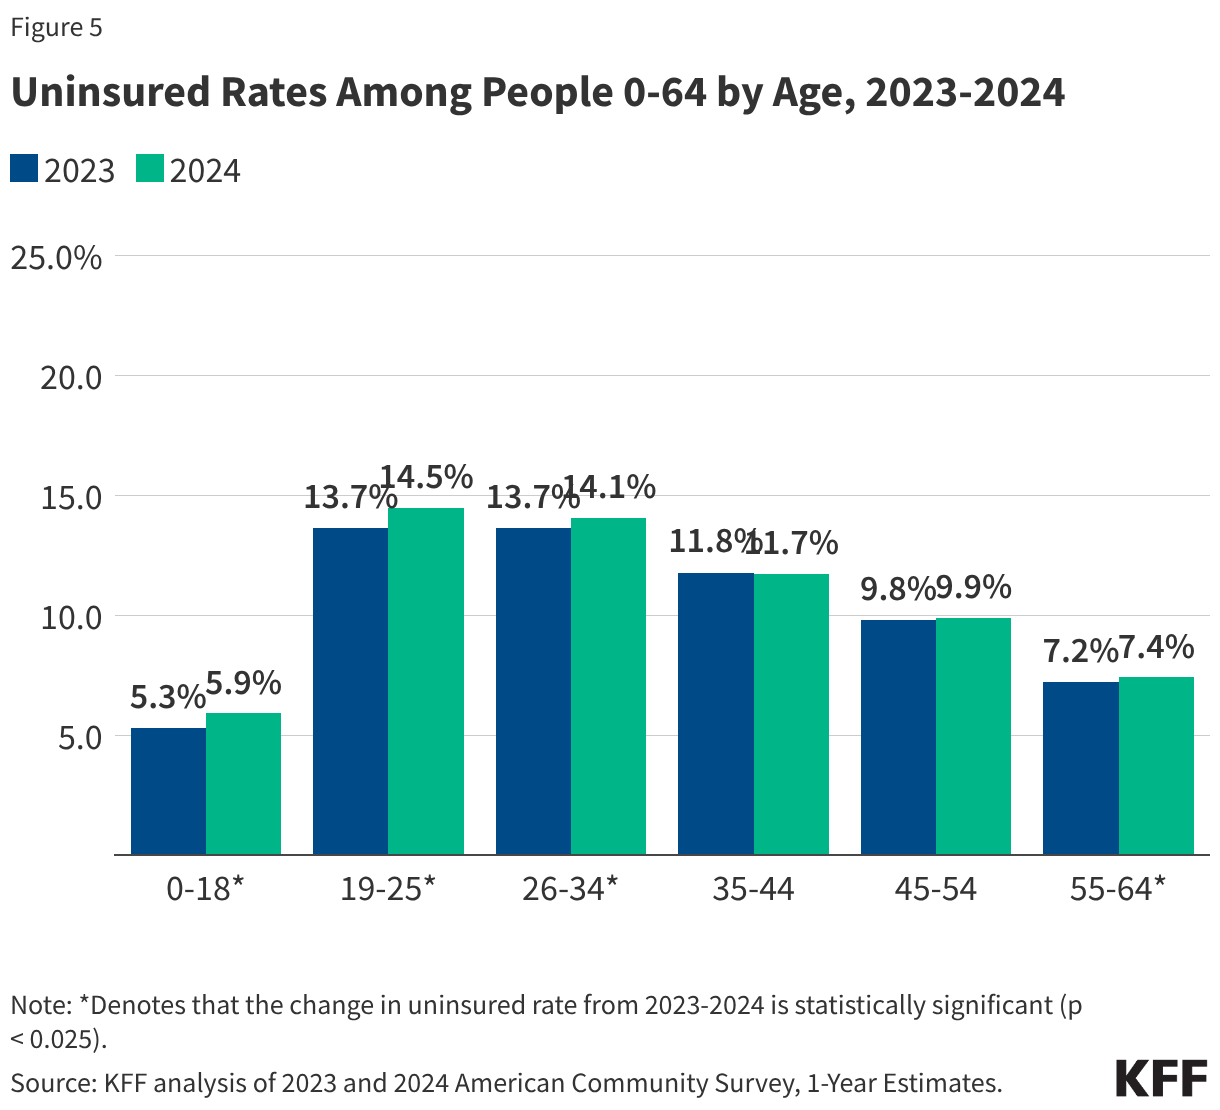
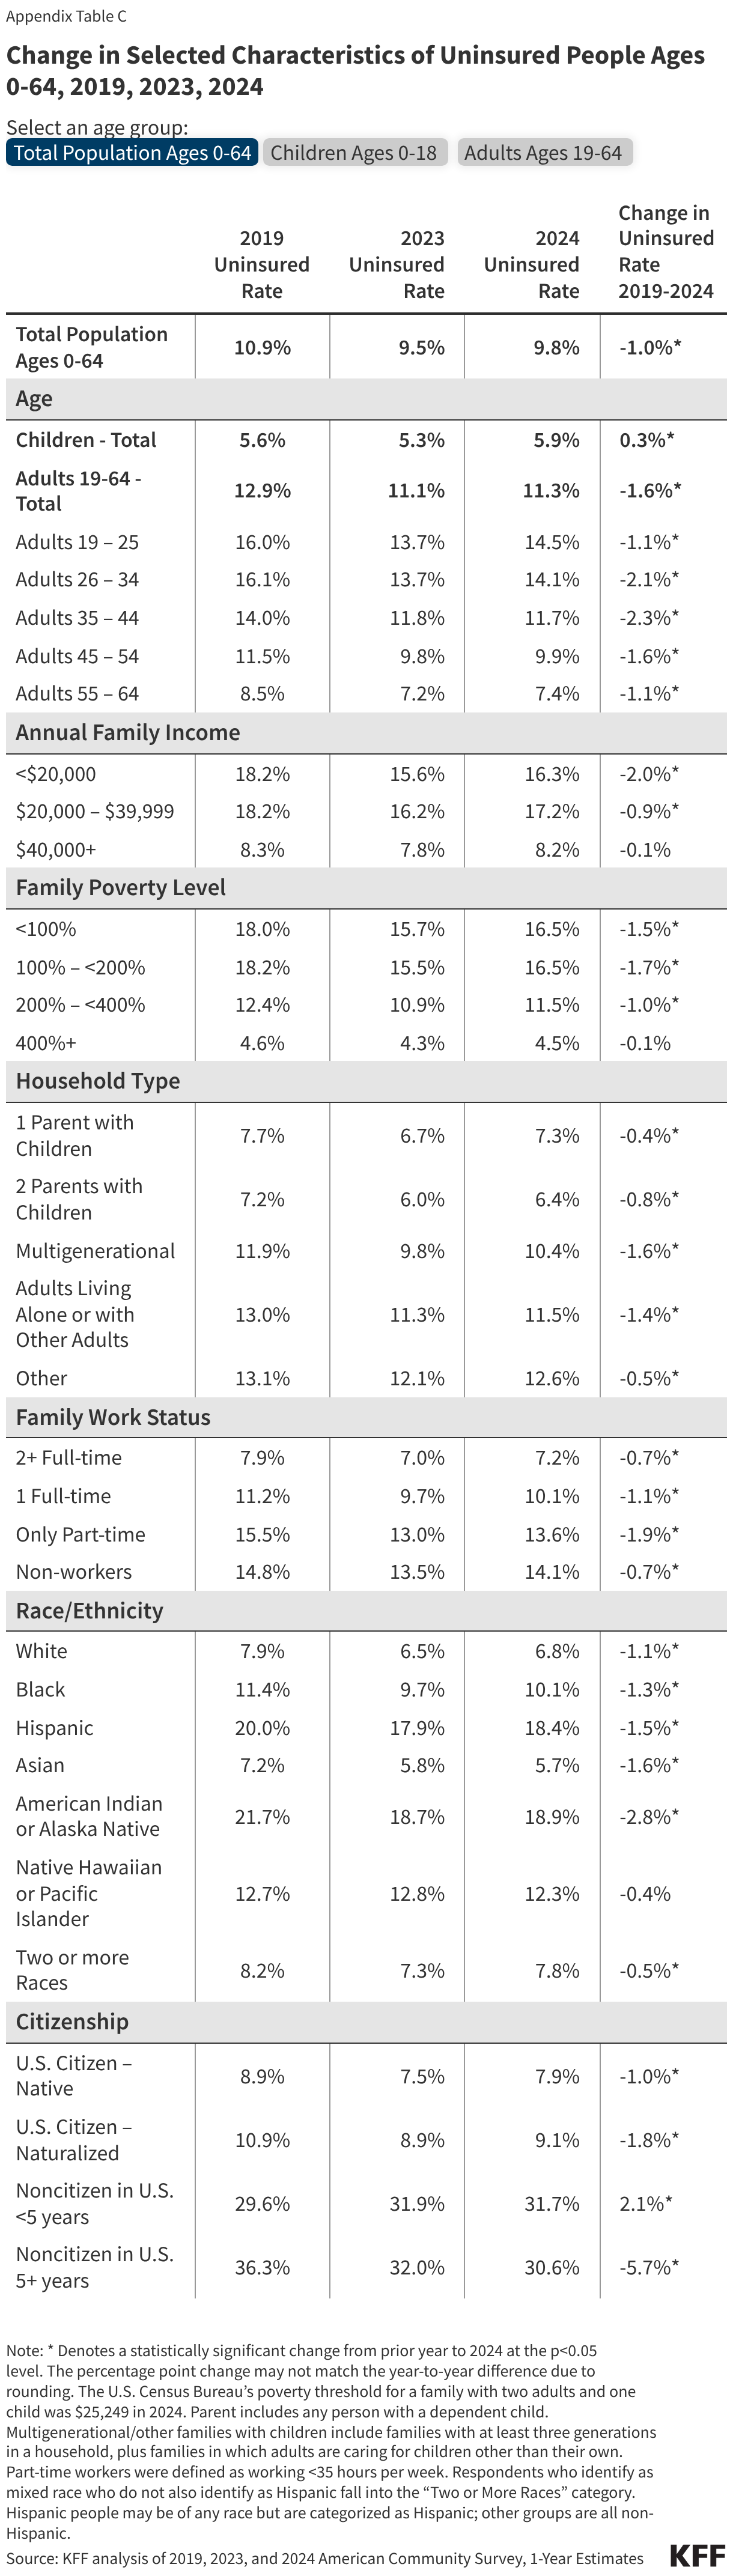
Adults are more likely to be uninsured than children. The uninsured rate for adults ages 19-64 was 11.3%, nearly twice the rate of 5.9% for children. The lower uninsured rate for children reflects, in part, broader eligibility for Medicaid and CHIP for children. As children age out of eligibility, uninsured rates rise sharply to 14.5% for young adults ages 19-25 and remain high for adults ages 26-34 (14.1%) as 26-year-olds lose coverage under their parent’s health plan. Uninsured rates begin to fall for adults starting at age 35 and are lowest for adults ages 55-64 at 7.4% (Figure 5). The increase in the uninsured rate from 2023 to 2024 was largest for children and young adults. The uninsured rate for children increased by 0.6 percentage points from 2023 to 2024, and the rate for young adults ages 19-25 increased by 0.8 percentage points. Adults ages 26-34 and those ages 55-64 experienced smaller increases (0.4 and 0.2 percentage points, respectively) while the uninsured rates for adults ages 35-44 and 45-54 did not change.

Uninsured Rates Among People 0-64 by Age, 2023-2024 (Grouped column chart)

Family Income

Copy link to Family Income

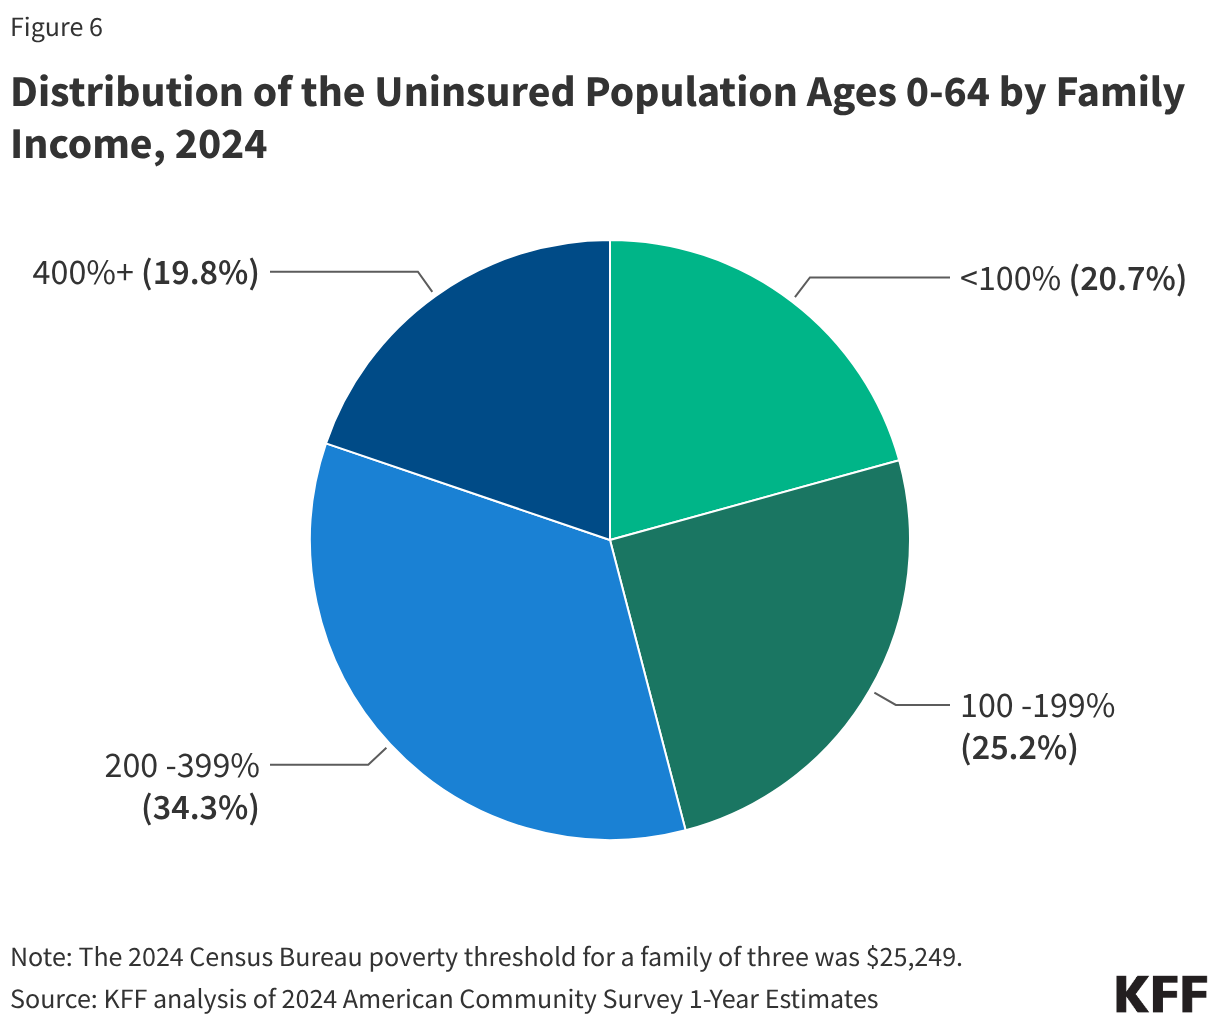
Eight in ten (80.2%) uninsured people under age 65 in 2024 were in families with incomes below 400% of the federal poverty level (FPL). Nearly half (45.9%) had incomes below 200% FPL while over one-third (34.3%) had family income between 200% and 399% FPL (Figure 6).

Distribution of the Uninsured Population Ages 0-64 by Family Income, 2024 (Pie Chart)

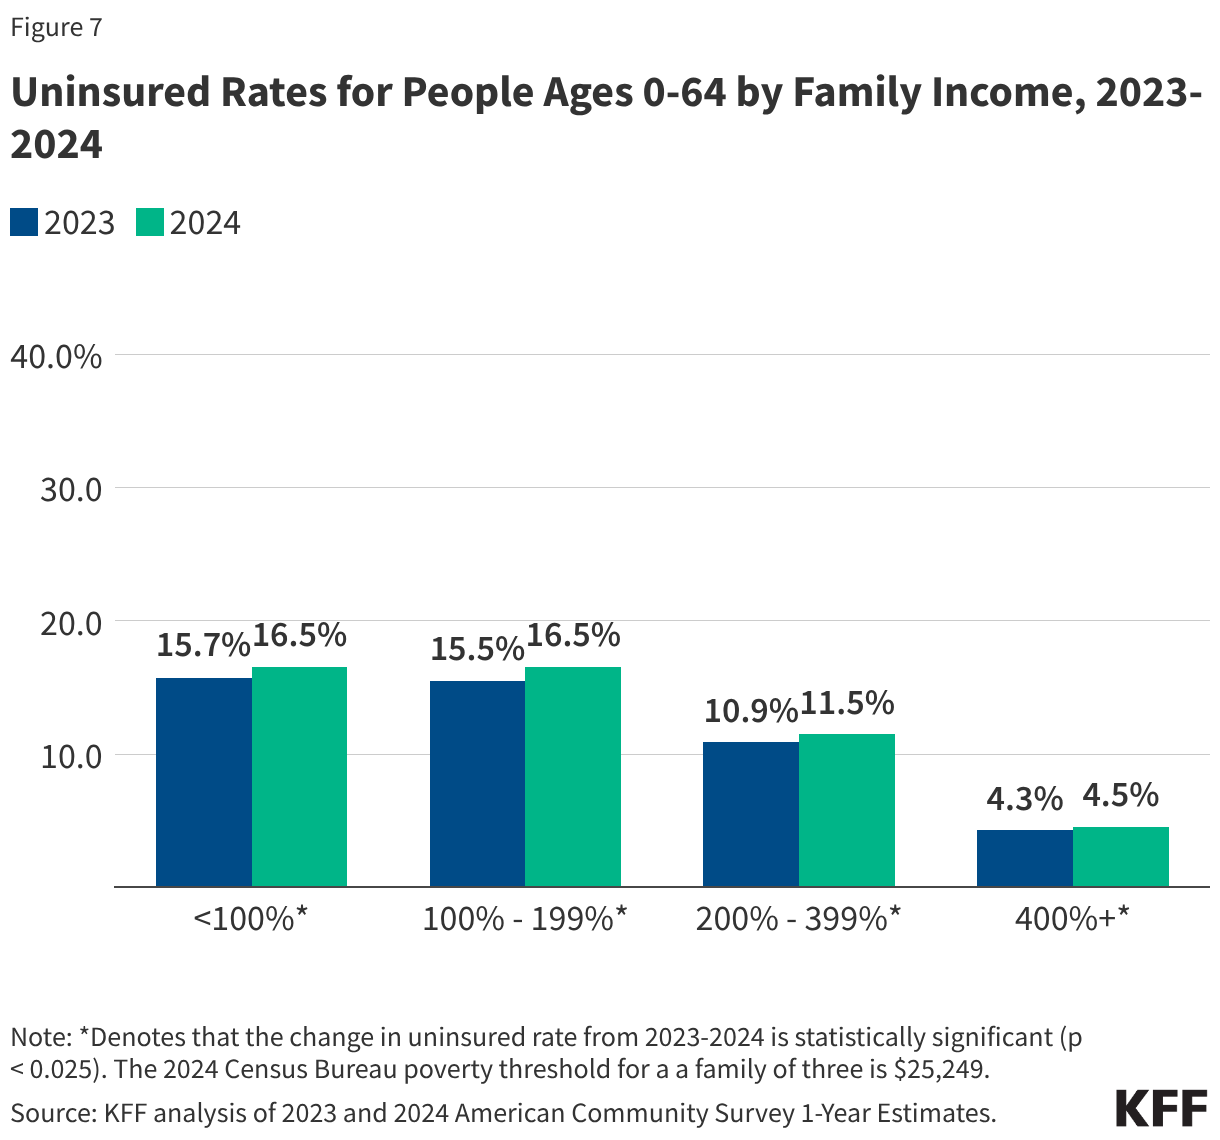
Individuals with incomes below 200% of the federal poverty level (FPL) are significantly more likely to be uninsured than those with higher income. One in six (16.5%) individuals under age 65 living in poverty and those in low-income families (incomes 100%-199% FPL) were uninsured in 2024 compared to fewer than one in twenty (4.5%) with incomes above 400% FPL (Figure 7).  Just over one in ten (11.5%) individuals with incomes from 200%-399% FPL were uninsured. While uninsured rates increased for families at all income levels, families with low income and those in poverty saw the largest increases. From 2023 to 2024, the uninsured rate for people ages 0-64 in families with incomes between 100-200% of the federal poverty level (FPL) increased from 15.5% to 16.5%, and the uninsured rate for families living in poverty also increased to 16.5% in 2024 from 15.7% in 2023.

Uninsured Rates for People Ages 0-64 by Family Income, 2023-2024 (Grouped column chart)

Family Work Status

Copy link to Family Work Status

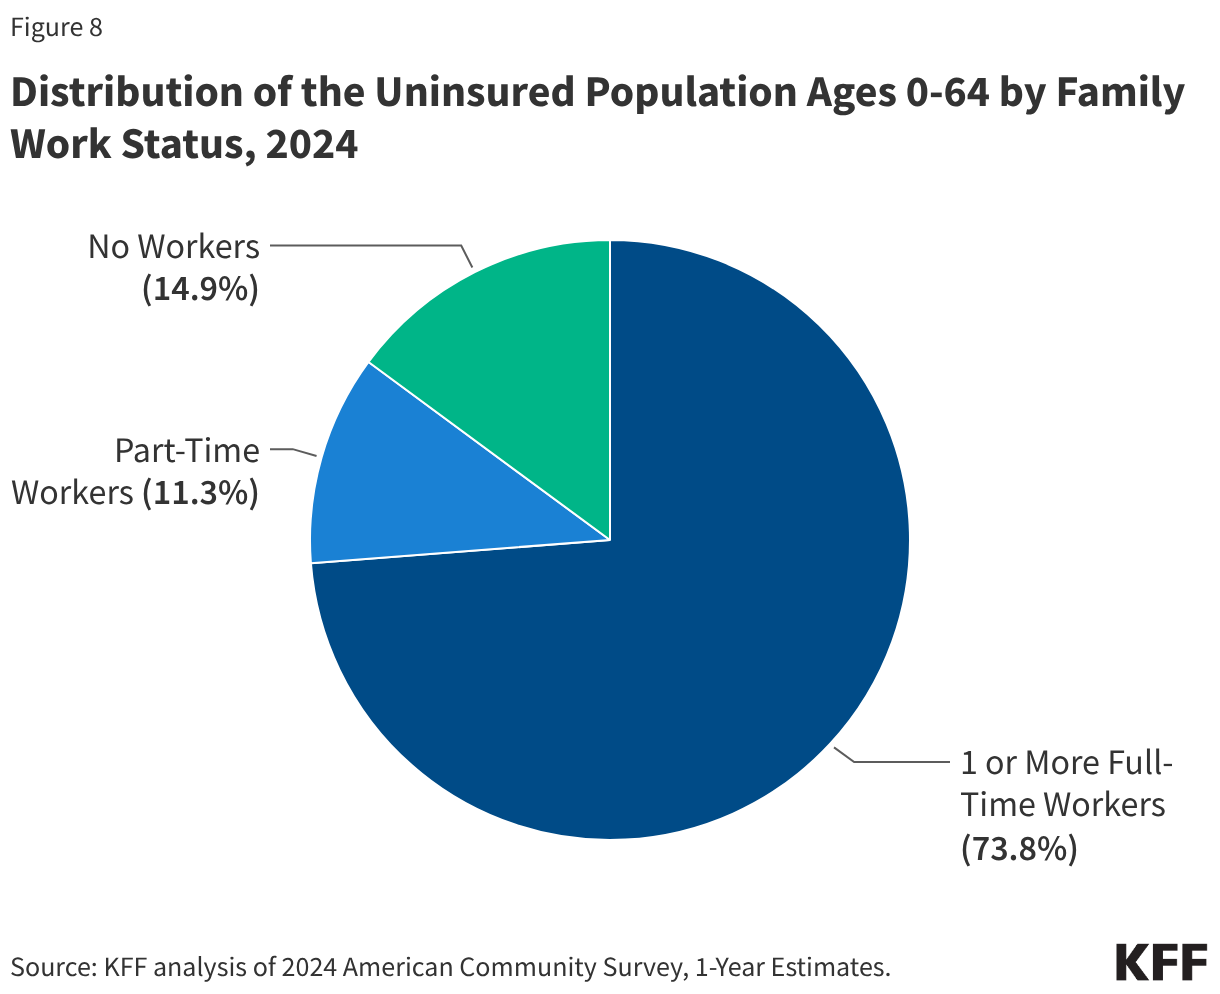
In 2024, most (85.1%) uninsured individuals lived in working families. Of the total uninsured population ages 0 to 64, nearly three in four (73.8%) had at least one full-time worker in their family, and 11.3% had a part-time worker in their family (Figure 8). Less than 15% of uninsured individuals were in families with no workers.

Distribution of the Uninsured Population Ages 0-64 by Family Work Status, 2024 (Pie Chart)

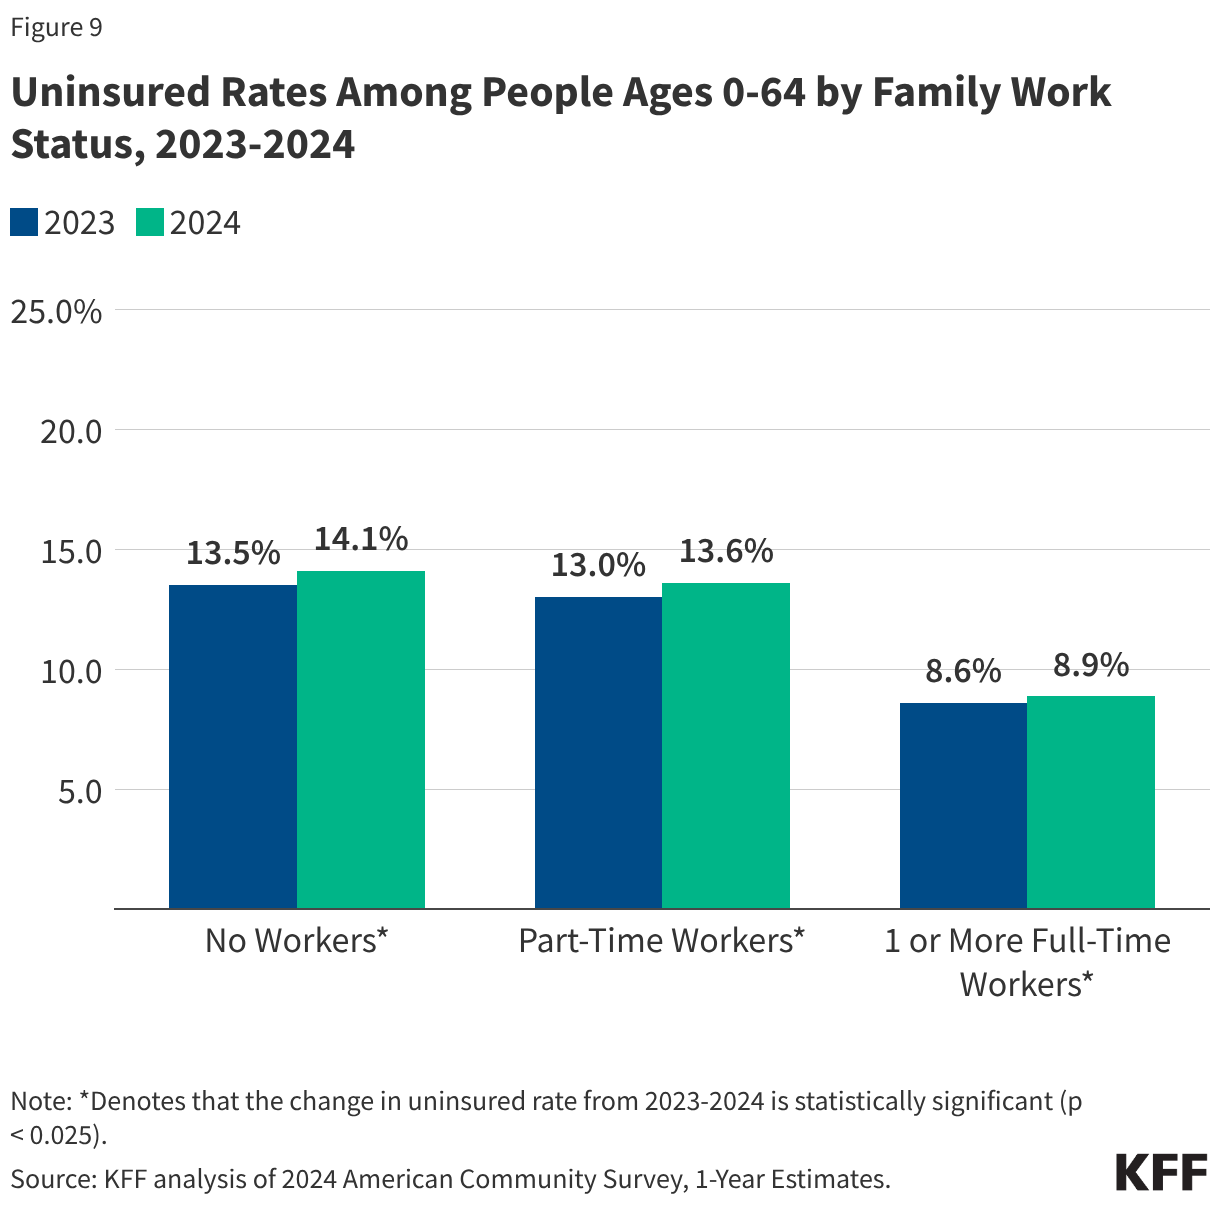
Because health insurance is tied to employment for many people in the U.S., individuals living in families with no workers or only part-time workers are more likely to be uninsured than individuals with full-time workers in the family. Individuals ages 0-64 in families with no workers or only part-time workers were nearly twice as likely to be uninsured (14.1% and 13.6% respectively) as individuals in families with multiple full-time workers (8.9%) (Figure 9). But working alone does not ensure access to health coverage. Over one in ten (10.1%) individuals in families with one full-time worker were uninsured in 2024. Although the uninsured rate increased for individuals in families with at least one full-time worker, the increases were larger for individuals in families with only part-time workers and those in families with no workers.

Uninsured Rates Among People Ages 0-64 by Family Work Status, 2023-2024 (Grouped column chart)

Race and Ethnicity

Copy link to Race and Ethnicity

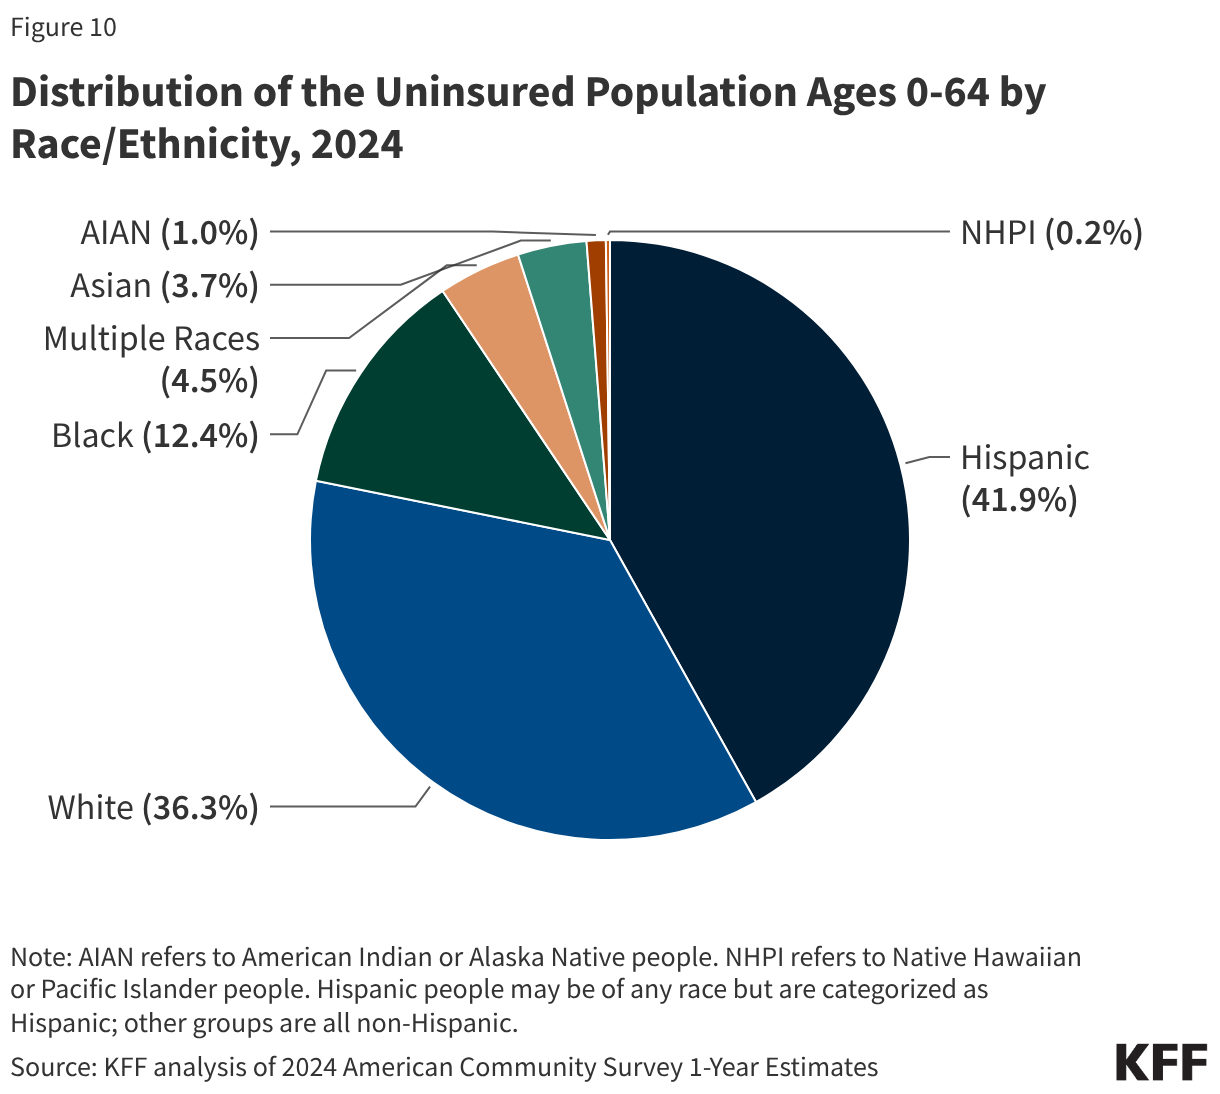
Nearly two-thirds (63.7%) of those without insurance in 2024 were people of color. Over four in ten (41.9%) uninsured people were Hispanic in 2024, while 12.4% were Black people and 3.7% were Asian people. American Indian or Alaska Native (AIAN) and Native Hawaiian or Pacific Islander (NHPI) people made up smaller shares, accounting for 1% and 0.2% of the uninsured population, respectively. White people comprised 36.3% of people who lacked insurance coverage in 2024 (Figure 10).

Distribution of the Uninsured Population Ages 0-64 by Race/Ethnicity, 2024 (Pie Chart)

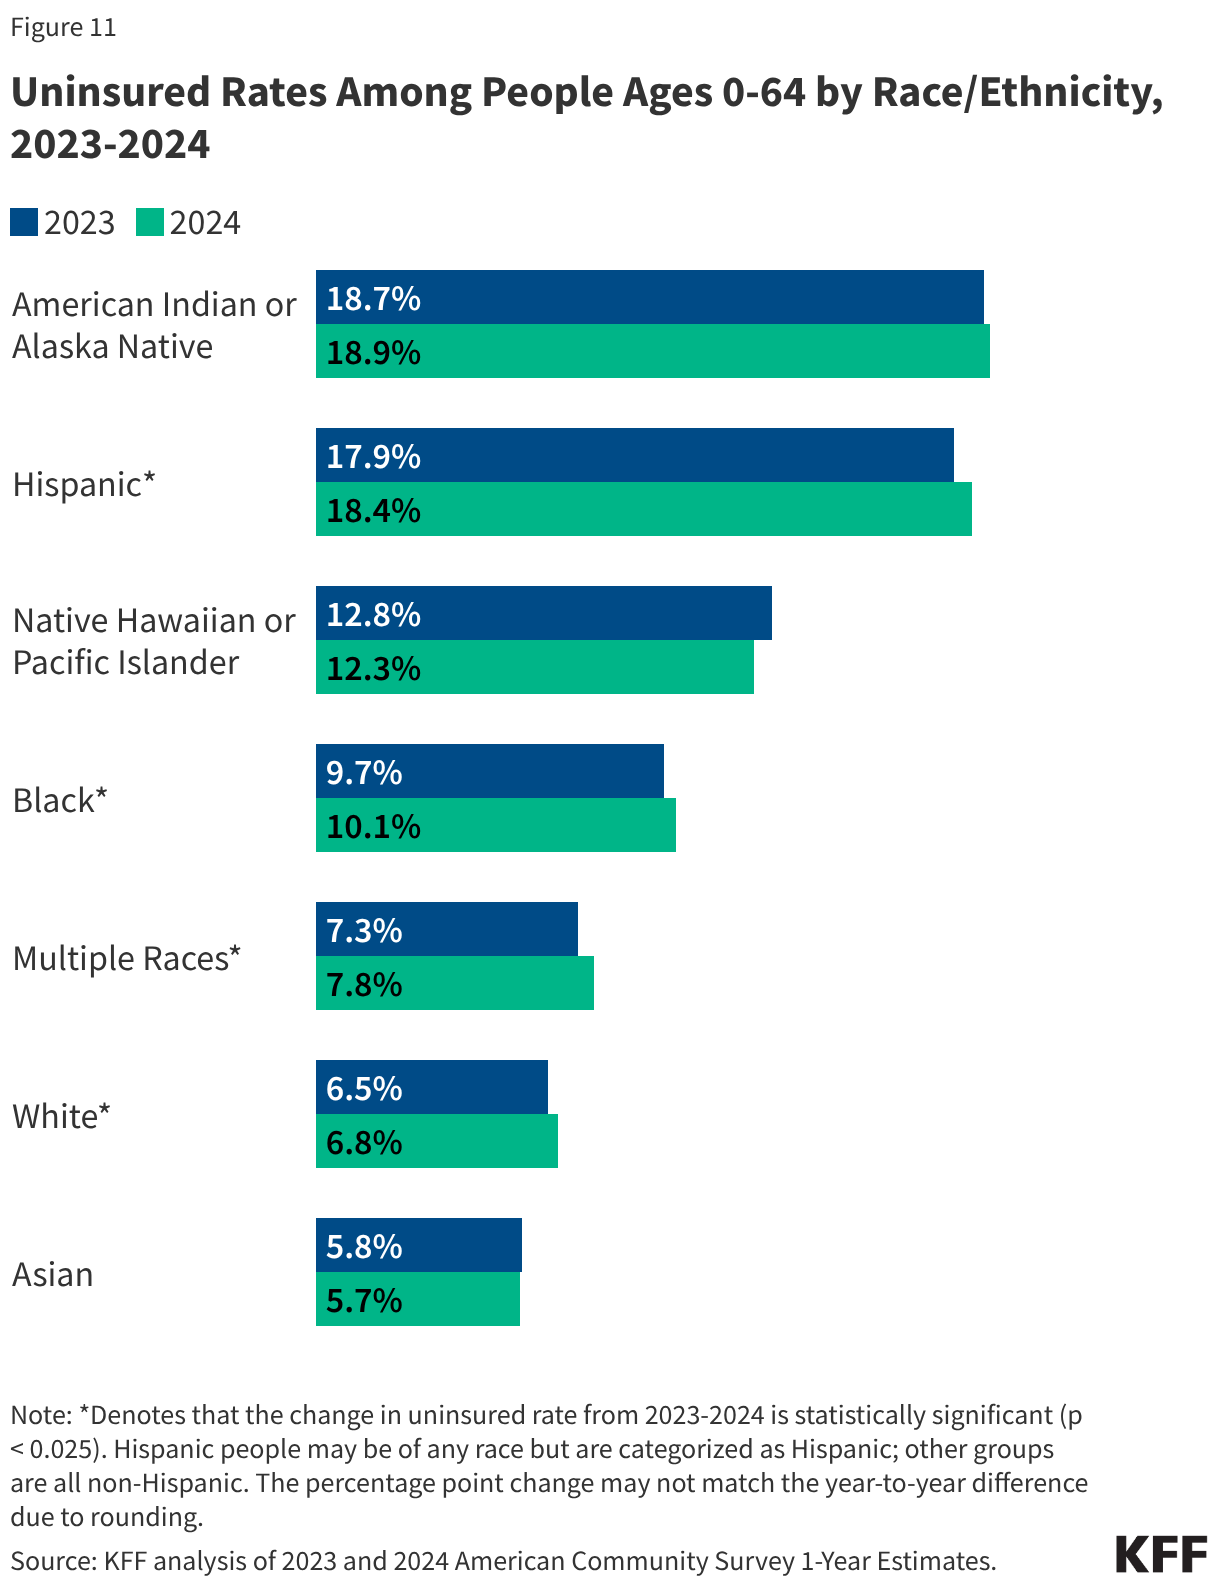
Reflecting ongoing disparities in health coverage, Hispanic, Black, AIAN, and NHPI people are more likely to be uninsured than White people. In 2024, AIAN and Hispanic people had the highest uninsured rates (18.9% and 18.4%, respectively). These rates were more than two and a half times the rate for White people (6.8%). The uninsured rates for Black people (10.1%) and NHPI (12.3%) were also higher than the rate for White people (Figure 11). Asian individuals under age 65 had the lowest uninsured rate at 5.7%. Hispanic and Black people ages 0-64 experienced the largest increases in uninsured rates in 2024, increasing 0.5 and 0.4 percentage points respectively from 2023. The uninsured rate for White people increased from 6.5% in 2023 to 6.8% in 2024, while the rates for American Indian or Alaska Native, Asian, and Native Hawaiian or Pacific Islander people did not change.

Uninsured Rates Among People Ages 0-64 by Race/Ethnicity, 2023-2024 (Grouped Bars)

Citizenship

Copy link to Citizenship

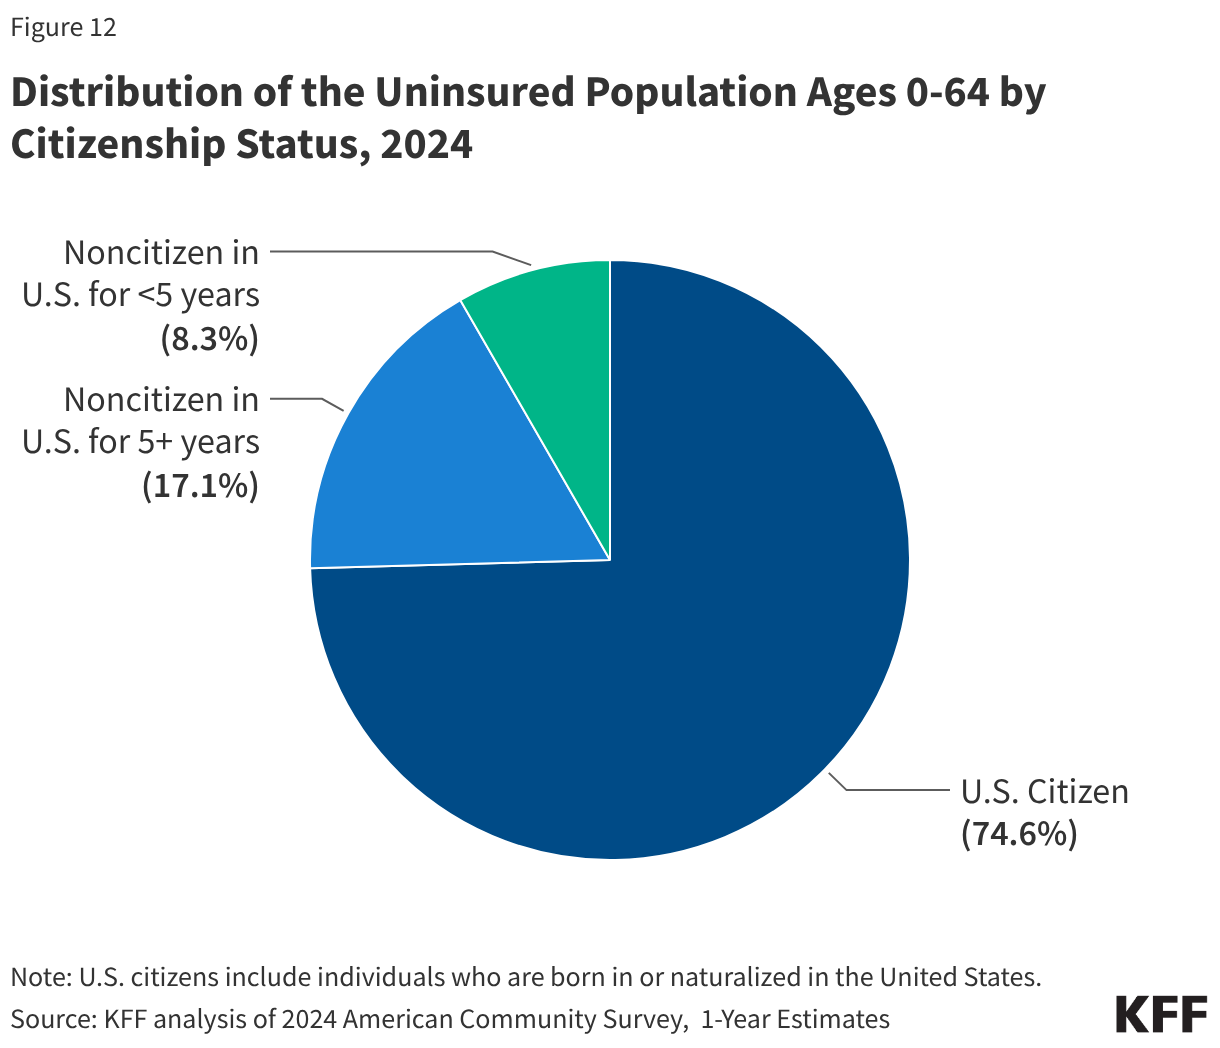
Most uninsured individuals ages 0-64 (74.6%) were U.S. citizens, while a quarter were noncitizens in 2024. About 8% of uninsured individuals were recent immigrants who have lived in the U.S. for less than 5 years while 17.1% were immigrants who have been in the U.S. for more than five years (Figure 12). An even greater share of uninsured children were U.S. citizens (85.2%), while 14.8% were noncitizens (Appendix Table B).

Distribution of the Uninsured Population Ages 0-64 by Citizenship Status, 2024 (Pie Chart)

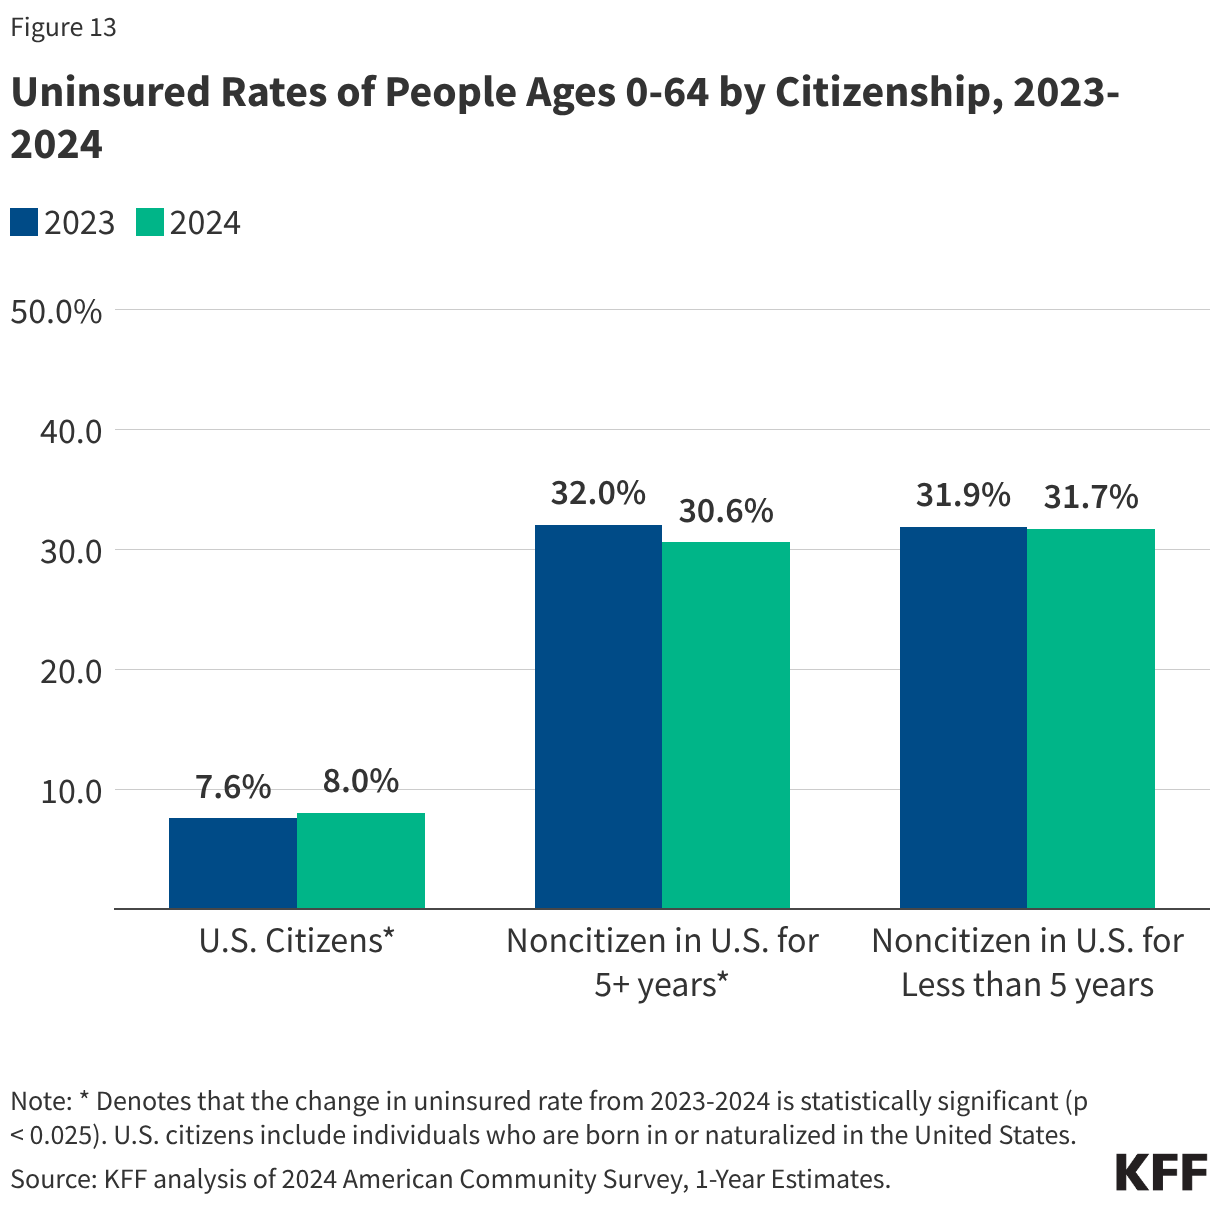
Noncitizens are more likely than citizens to be uninsured. Nearly one-third of noncitizen immigrants were uninsured in 2024, including 31.7% of those who have been in the U.S. for less than five years and 30.6% of those who have lived in the U.S. for more than five years. By comparison, the uninsured rate for U.S.-born and naturalized citizens was 8.0% in 2024 (Figure 13). The uninsured rate increased for U.S. citizens and decreased for noncitizens who have in the U.S. for five years or more, though noncitizens remain more than 3.5 times more likely to be uninsured than citizens overall. 

Uninsured Rates of People Ages 0-64 by Citizenship, 2023-2024 (Grouped column chart)

State Residency

Copy link to State Residency

Although most states have adopted the ACA Medicaid expansion, a disproportionate share of uninsured people under age 65 live in states that have not expanded Medicaid. As of 2024, 41 states including DC had expanded Medicaid to cover adults with incomes up to 138% FPL ($20,782 for an individual in 2024). In 2024, about four in ten (42.0%) uninsured people ages 0-64 lived in the ten non-expansion states, including states with large uninsured populations such as Texas and Florida, while nearly six in ten (58.0%) lived in states that expanded Medicaid (Figure 14).  Individuals living in non-expansion states are more likely to be uninsured than those living in expansion states. In 2024, the uninsured rate in non-expansion states (14.5%) was nearly twice the rate in expansion states (8.0%) (Figure 14). 

Uninsured Rates Among People Ages 0-64 by Medicaid Expansion Decision, 2023-2024 (Grouped column chart)

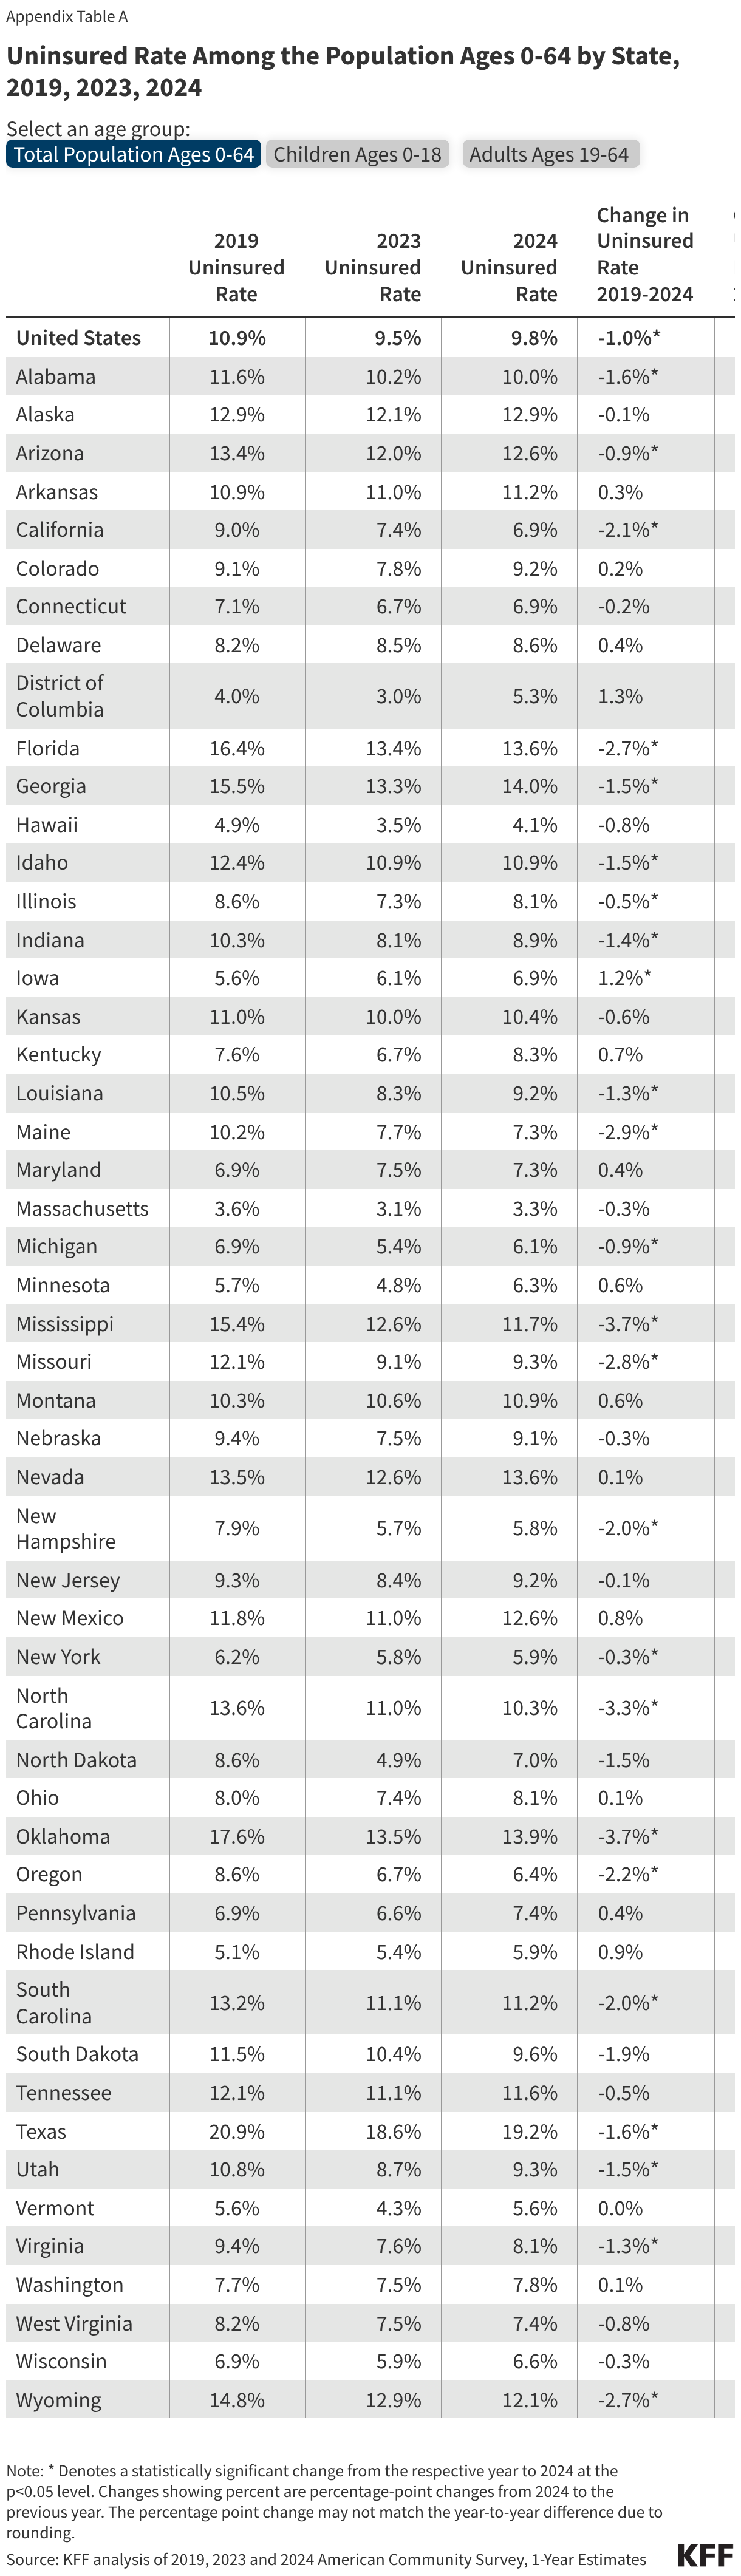
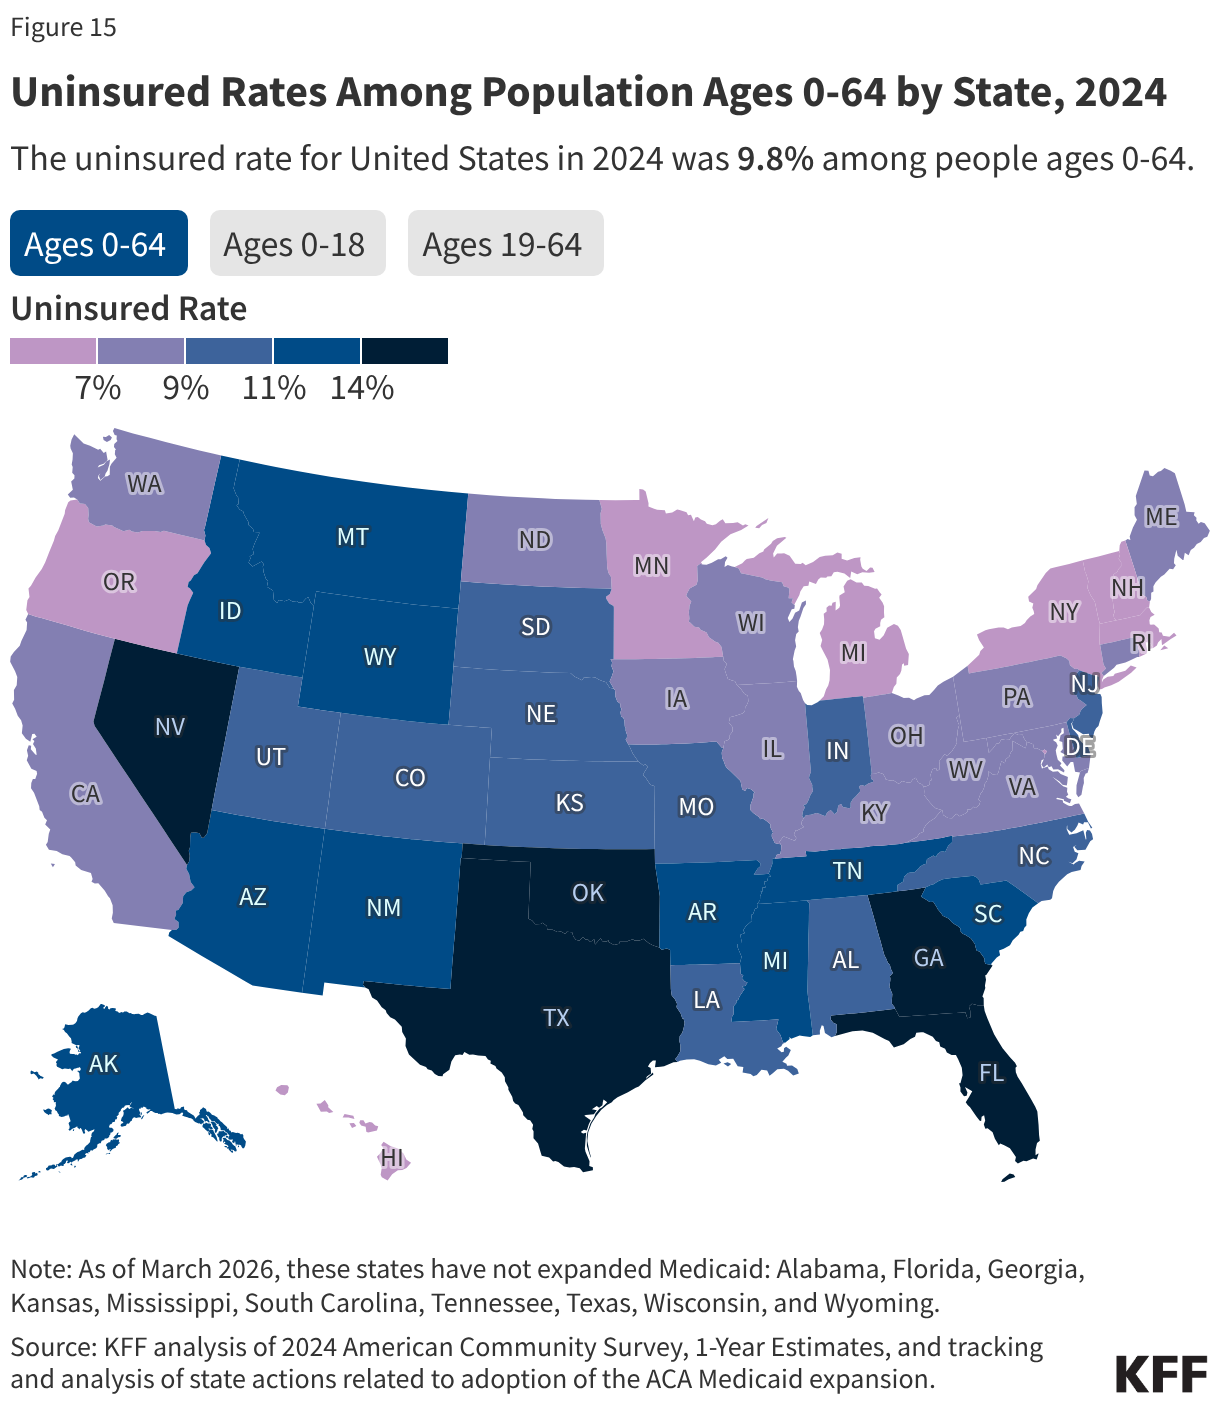
Uninsured rates vary across states. Texas had the highest uninsured rate at 19.2%, nearly double the national rate of 9.8%, while Massachusetts had the lowest rate at 3.3% (Figure 15). The variation in uninsured rates across states reflects differences in per capita income, access to employer coverage, and eligibility for public coverage.

Uninsured Rates Among Population Ages 0-64 by State, 2024 (Choropleth map)

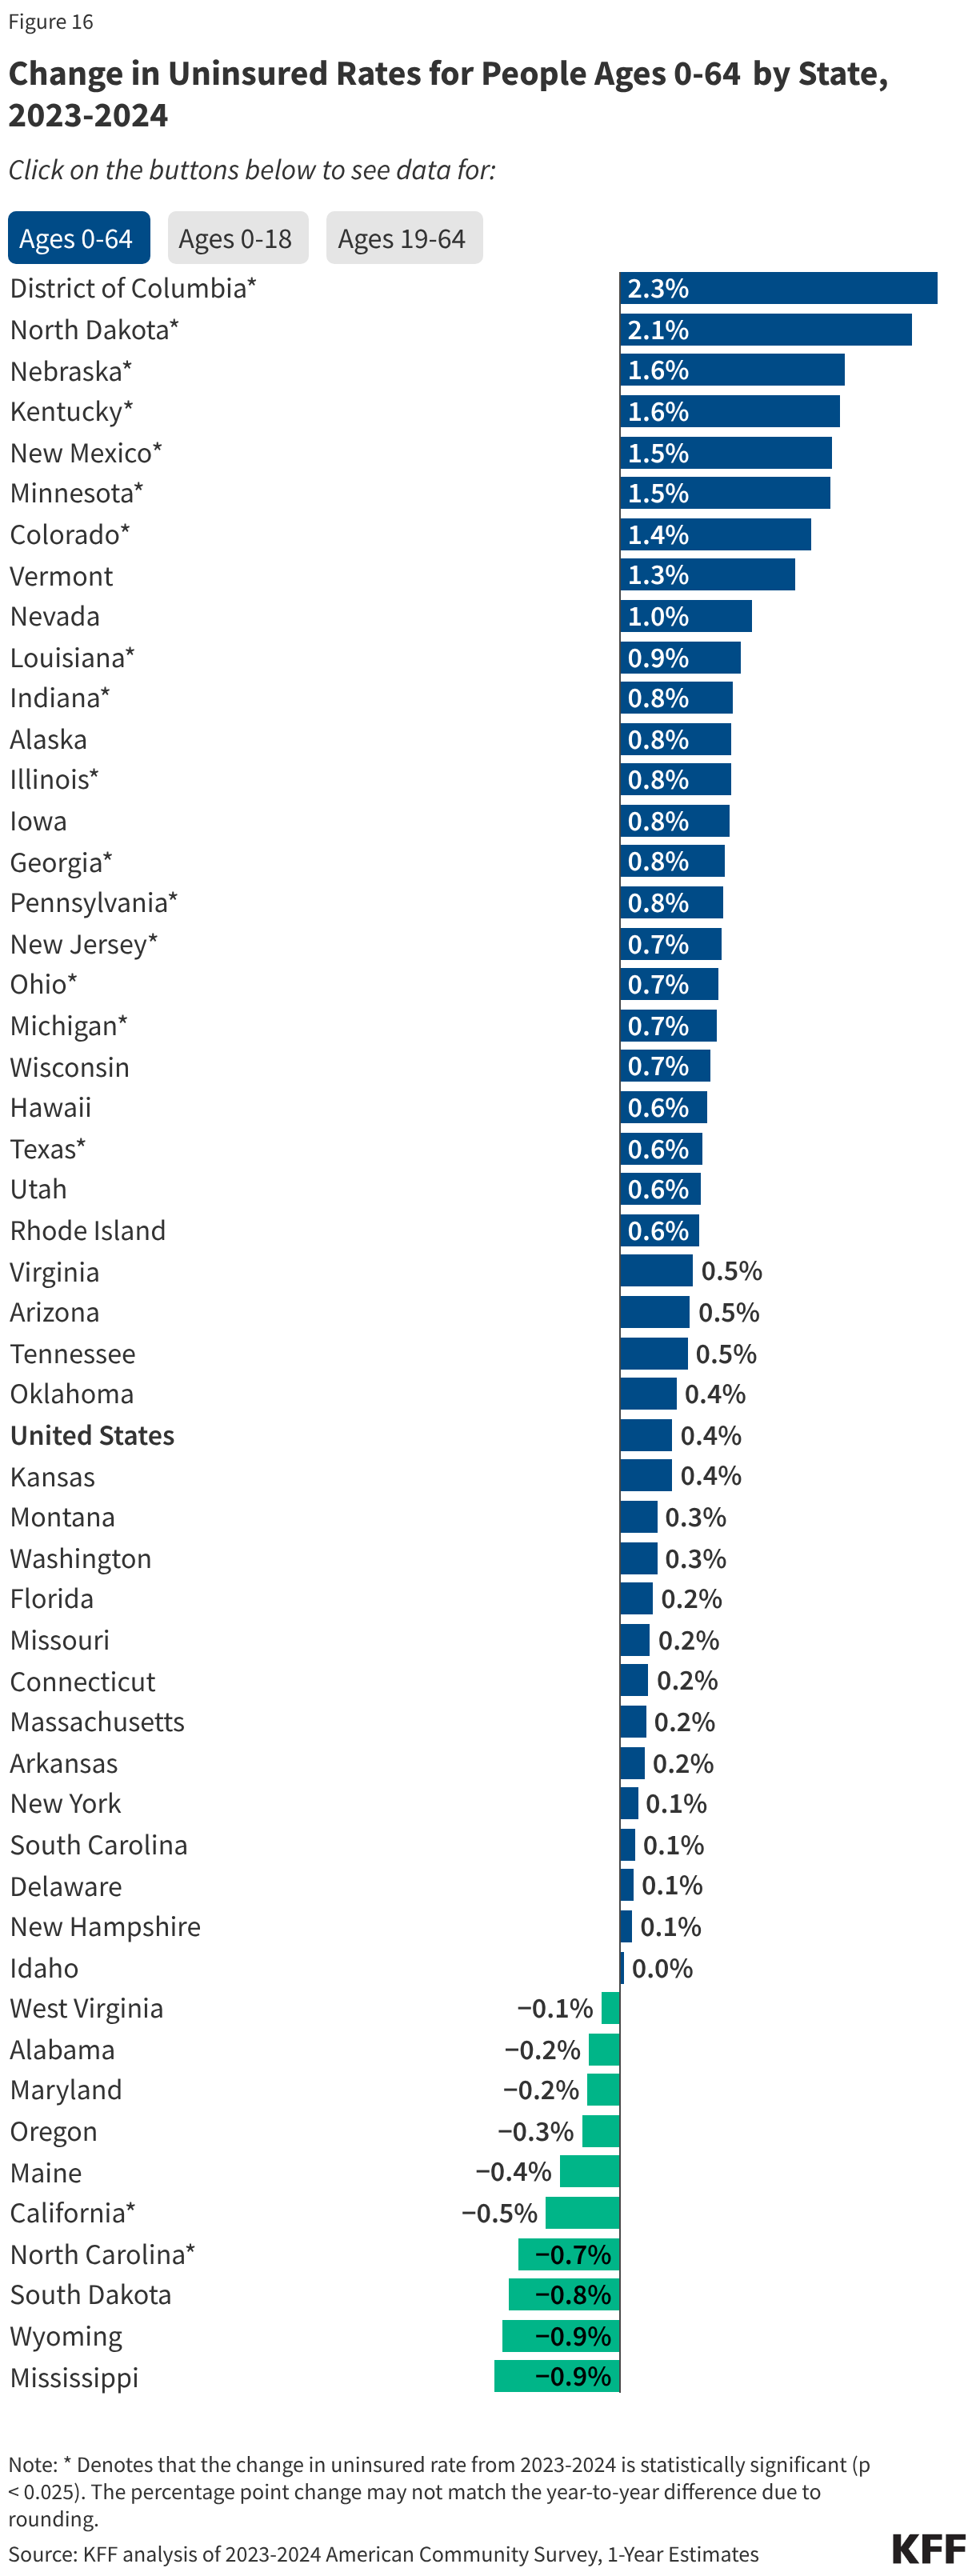
From 2023 to 2024, the uninsured rate for the population ages 0 to 64 increased in 16 states including DC and decreased in two states, California and North Carolina. The District of Columbia and North Dakota saw the largest increases in the uninsured rate for the population under age 65, though the rates remain below the national average in both states (Figure 16). The uninsured rate for children ages 0-18 increased in nine states (Colorado, Florida, Georgia, Kansas, Kentucky, Minnesota, Missouri, Oklahoma, Texas), while the uninsured rate for adults ages 19-64 increased in DC and fourteen states (Colorado, Illinois, Indiana, Kentucky, Louisiana, Michigan, Minnesota, Nebraska, New Jersey, New Mexico, North Dakota, Ohio, Pennsylvania, and Wisconsin) but declined in three states (California, Mississippi, and North Carolina). In three states (Colorado, Kentucky, and Minnesota), the uninsured rates increased for both children and adults ages 19-64.  

Change in Uninsured Rates for People Ages 0-64  by State,  2023-2024 (Bar Chart)

Length of Uninsurance

Copy link to Length of Uninsurance

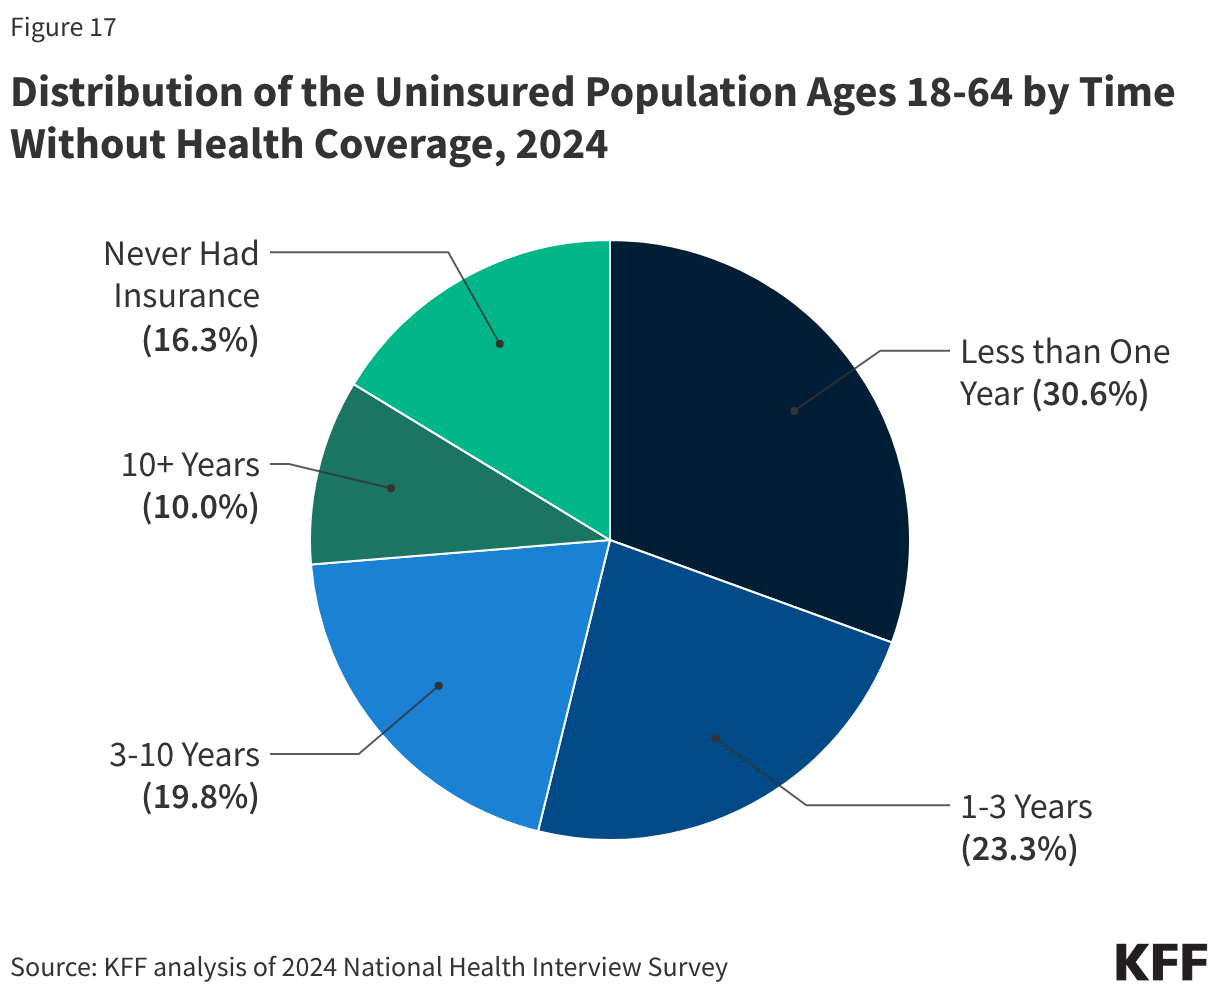
Most uninsured adults have been without health coverage for more than a year. Nearly seven in ten (69.4%) adults who were uninsured in 2024 had gone without health coverage for more than a year, including over a quarter who had been uninsured for ten or more years (10%) or had never been insured (16.3%) (Figure 17). People who have been without coverage for long periods may be particularly hard to reach through outreach and enrollment efforts. Just three in ten uninsured adults (30.6%) reported lacking coverage for less than one year. People who lacked insurance for less than one year may have experienced a short-term gap in coverage because of a job change or a change in income that resulted in the loss of employer-based coverage or Medicaid.

Distribution of the Uninsured Population Ages 18-64 by Time Without Health Coverage, 2024 (Pie Chart)

Barriers to Obtaining Health Care Coverage

Reasons for Being Uninsured

Copy link to Reasons for Being Uninsured

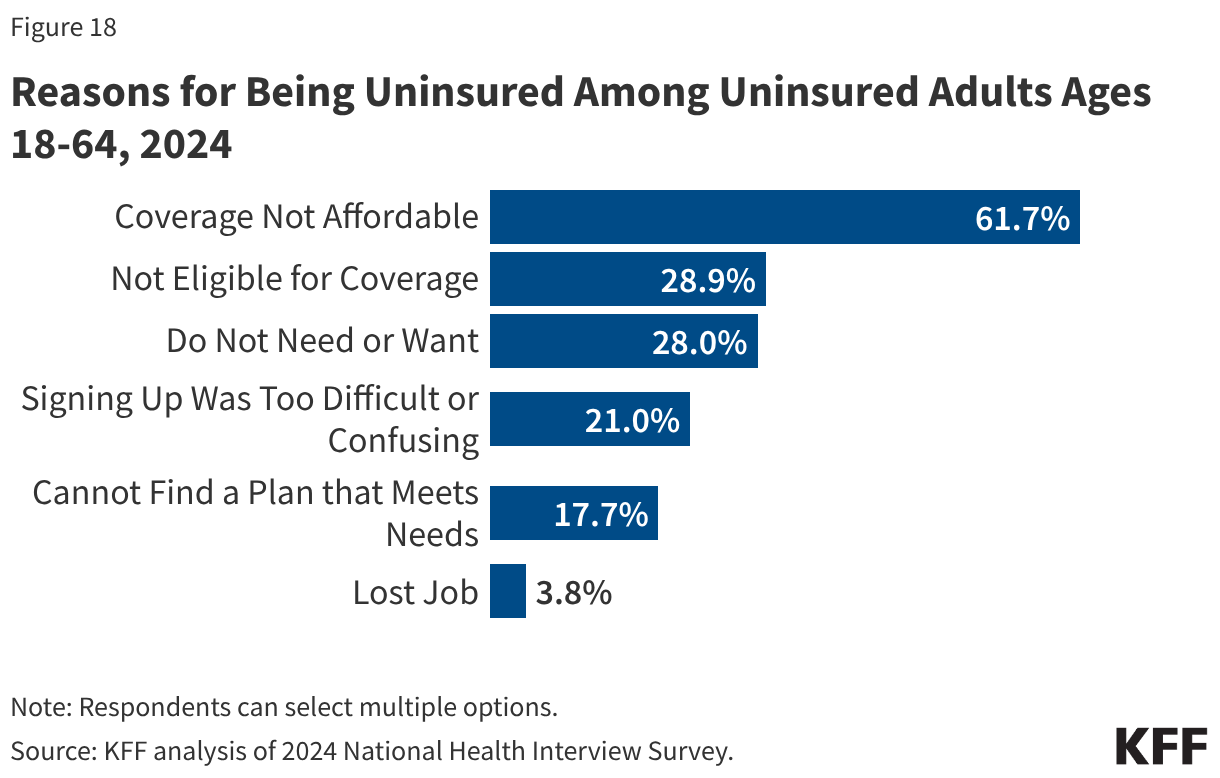
Inability to afford coverage is the most commonly cited reason for being uninsured. In 2024, 61.7% of uninsured adults ages 18-64 said they were uninsured because coverage is not affordable (Figure 18). Uninsured adults faced other barriers to obtaining coverage, including not being eligible for coverage (28.9%) and having difficulty signing up for coverage (21.0%). Over a quarter (28.0%) said they did not need or want coverage. 

Reasons for Being Uninsured Among Uninsured Adults Ages 18-64, 2024 (Bar Chart)

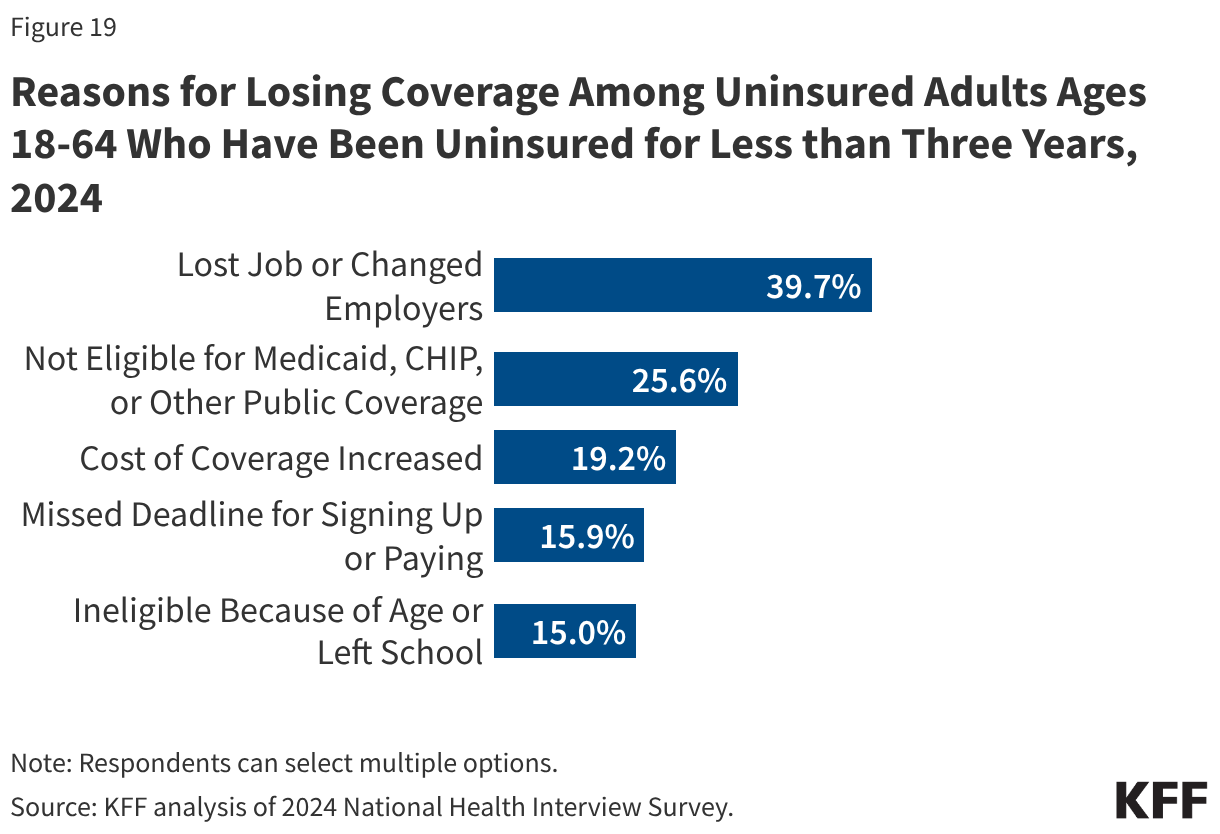
Losing a job or eligibility for public coverage can lead to people becoming uninsured. In 2024, 39.7% of adults who had not had health insurance in the last three years said they were uninsured because they lost their job or changed employers (Figure 19), and about a quarter (25.6%) said they lost coverage because they were no longer eligible for Medicaid, CHIP, or other public coverage. Other reasons for losing coverage included the cost of coverage increased (19.2%), missed the deadline for signing up or paying for coverage (15.9%), or lost eligibility due to age or leaving school (15.0%). 

Reasons for Losing Coverage Among Uninsured Adults Ages 18-64 Who Have Been Uninsured for Less than Three Years, 2024 (Bar Chart)

Barriers to Job-Based Coverage

Copy link to Barriers to Job-Based Coverage

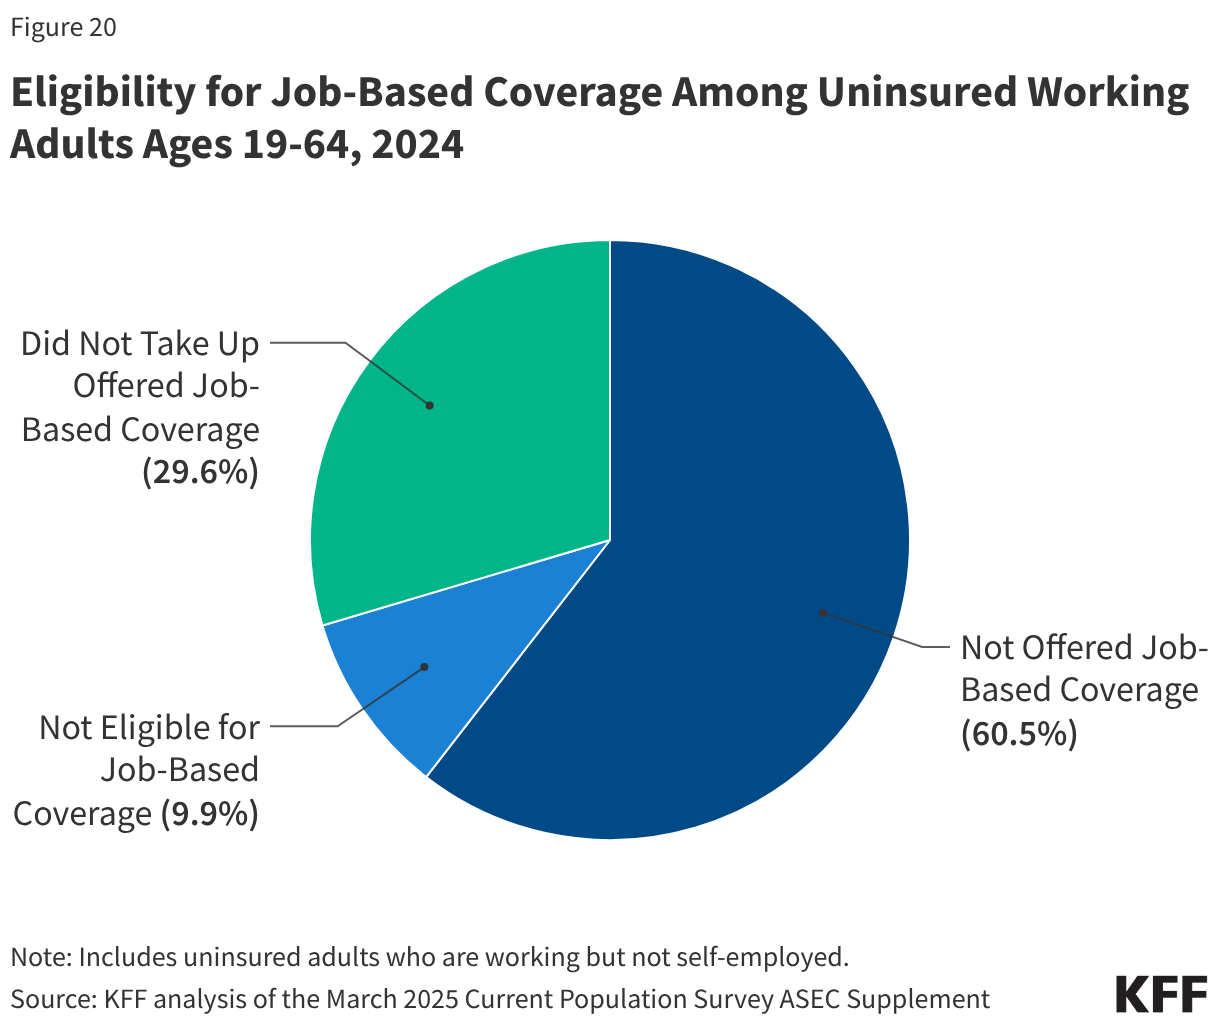
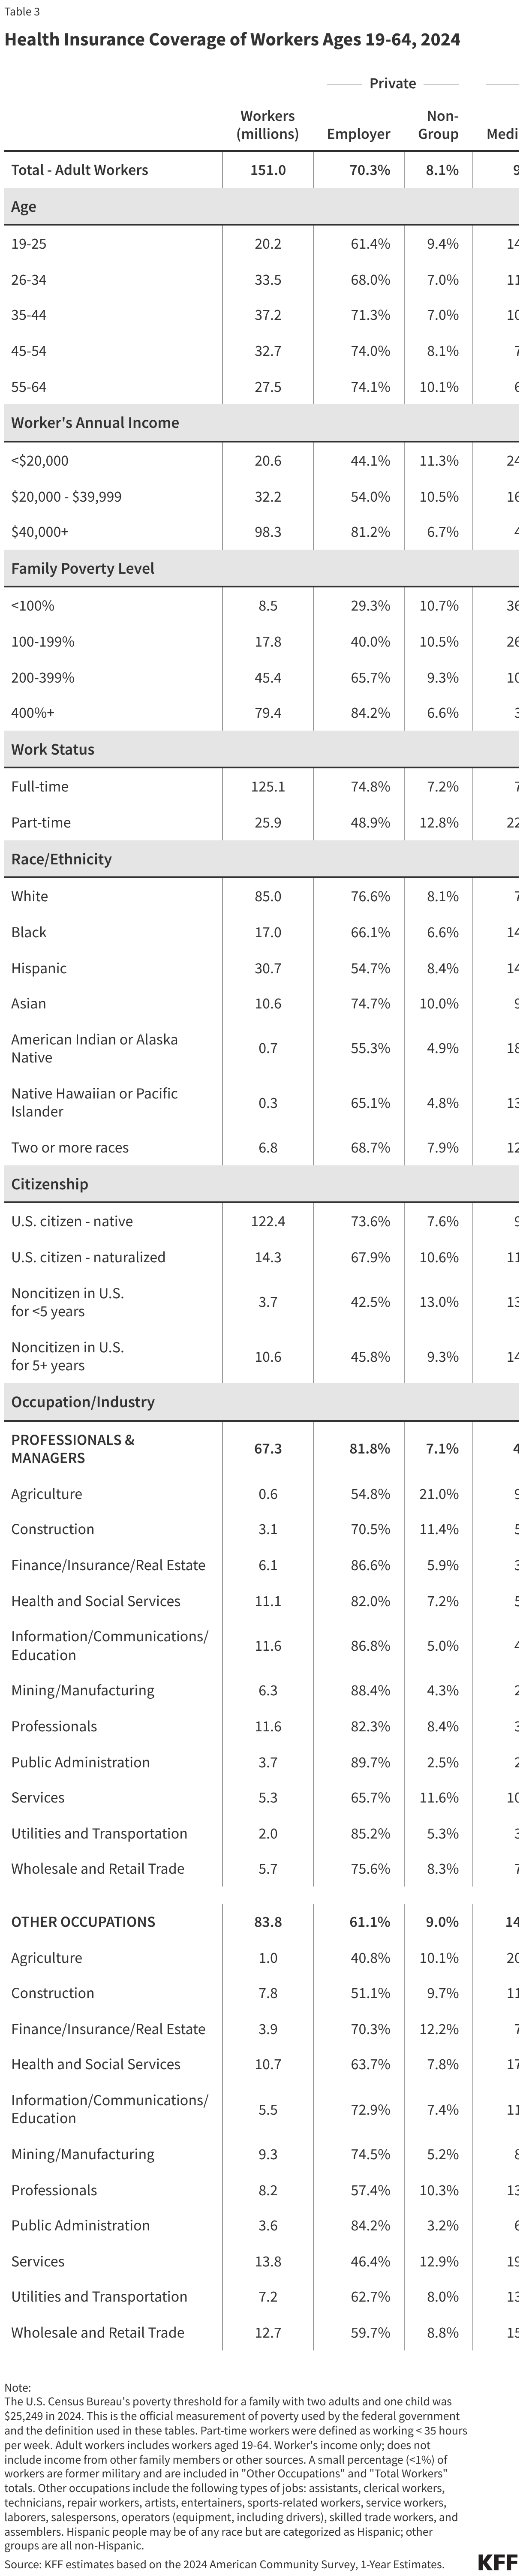
Not all workers have access to coverage through their job. In 2024, about 70% of uninsured adults who were working did not have access to health insurance through their employer. Six in ten (60.5%) uninsured adult workers worked for an employer that did not offer health insurance to its employees (Figure 20). A smaller share (9.9%) worked for an offering employer but were not eligible, often because they worked part-time or were a temporary or contract employee. 

Eligibility for Job-Based Coverage Among Uninsured Working Adults Ages 19-64, 2024 (Pie Chart)

Among uninsured workers who are offered coverage by their employers, cost is often a barrier to taking up the offer. From 2015 to 2025, total premiums for family coverage increased by 53%, outpacing wage growth, and the worker’s share increased by 37%. Low-income families with employer-based coverage spend a significantly higher share of their income toward premiums and out-of-pocket medical expenses compared to those with income above 200% FPL. Particularly among people working for small employers, premium contributions for dependents can be unaffordable. 

Limits on Medicaid Eligibility

Copy link to Limits on Medicaid Eligibility

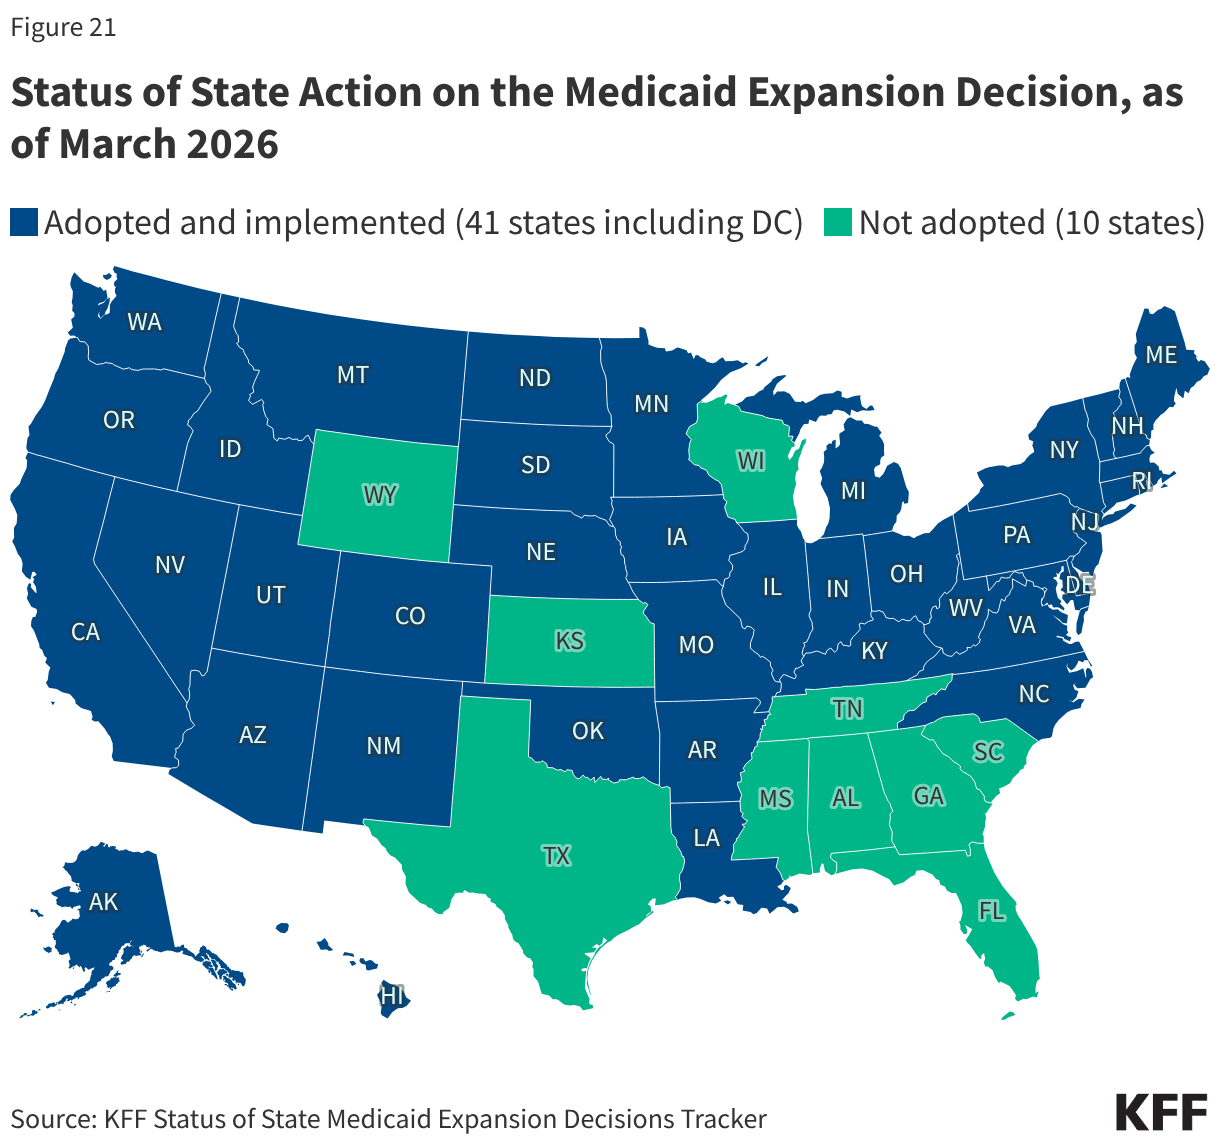
Medicaid eligibility varies across states, and eligibility for adults is limited in states that have not expanded Medicaid. As of March 2026, 41 states including DC had adopted the ACA Medicaid expansion (Figure 21). Two states implemented the expansion in 2023—South Dakota in July and North Carolina in December. In states that have not expanded Medicaid, the median eligibility level for parents is just 33% FPL, and adults without dependent children are ineligible in most cases. Additionally, in non-expansion states, millions of poor uninsured adults fall into a “coverage gap” because they earn too much to qualify for Medicaid but not enough to qualify for Marketplace premium tax credits. The 2025 reconciliation law makes changes to Medicaid eligibility for expansion adults by imposing new work requirements and more frequent eligibility determinations starting in January 2027.

Status of State Action on the Medicaid Expansion Decision, as of March 2026 (Choropleth map)

Barriers to Coverage for Immigrants

Copy link to Barriers to Coverage for Immigrants

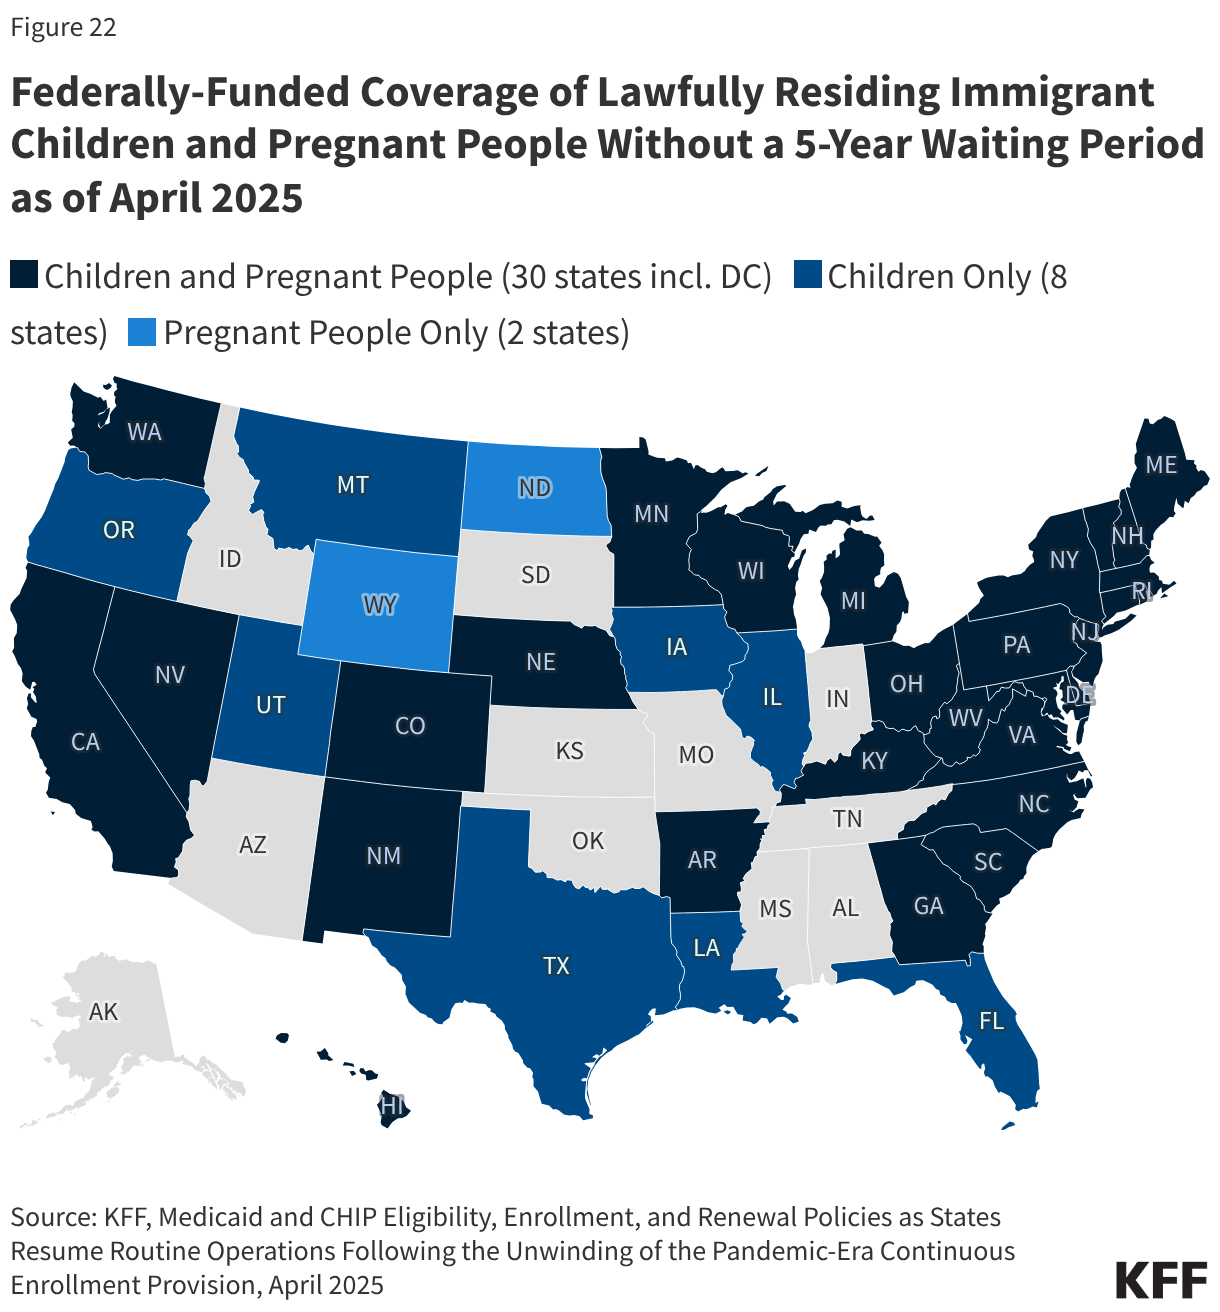
Immigrants face barriers to eligibility for public programs. Many lawfully present immigrants must meet a five-year waiting period after receiving “qualified” immigration status before they can enroll in Medicaid if they meet other eligibility criteria. States have the option to cover eligible lawfully present children and pregnant people without a waiting period, and as of April 2025, 38 states including DC have elected the option for children, and 32 states including DC have taken up the option for pregnant individuals (Figure 22). Undocumented immigrants are ineligible for federally funded coverage, including Medicaid or Marketplace coverage. Some states provide fully state-funded coverage to some groups of immigrants who are not eligible for federal coverage due to their immigration status but meet other eligibility requirements such as income.  The 2025 reconciliation law imposes new restrictions on immigrant eligibility for Medicaid and ACA Marketplace premium tax credits with some of the changes starting in 2026.

Federally-Funded Coverage of Lawfully Residing Immigrant Children and Pregnant People Without a 5-Year Waiting Period as of April 2025 (Choropleth map)

Eligibility for ACA Coverage Among Uninsured

Copy link to Eligibility for ACA Coverage Among Uninsured

About half of the people who are uninsured may be eligible for financial assistance available under the ACA. Just over half (52.9% or 14.1 million) of uninsured individuals in 2024 were estimated to be eligible for financial assistance either through Medicaid or through subsidized Marketplace coverage (Figure 23). However, the remaining half of the uninsured population (47.1% or 12.6 million) were likely ineligible for free or subsidized coverage because their state did not expand Medicaid, their immigration status made them ineligible, or they were deemed to have access to an affordable Marketplace plan or employer coverage offer. 

Eligibility for Coverage Among Uninsured People Ages 0-64, 2024 (Donut Chart)

Barriers to Accessing Care for People Who Are Uninsured

Barriers to Care for Uninsured Adults

Copy link to Barriers to Care for Uninsured Adults

Uninsured adults are less likely than insured adults to have a usual place of care or to have seen a doctor in the past year. In 2024, nearly half (46.2%) of uninsured adults ages 18-64 reported not seeing a doctor or health care professional in the past 12 months compared to 14.7% with private insurance and 12.8% with public coverage. A main barrier to accessing care among uninsured adults is that many (40.8%) do not have a regular place to go when they are sick or need medical advice (Figure 24).

Share of Adults Ages 18-64 Who Did Not See a Doctor or Lacked a Usual Source of Care, by Insurance Status, 2024 (Grouped column chart)

Uninsured adults are much more likely than their insured counterparts to delay or forgo needed care because of cost. In 2024, nearly four in ten uninsured adults (38.6%) reported delaying, skipping, or not getting needed care or medication due to cost, more than twice the share of adults with private coverage (17.0%) and those with public coverage (18.8%) (Figure 25). For many uninsured individuals, skipping or forgoing care can lead to worse health.  According to a KFF survey that found higher percentages of both uninsured and insured people delaying or forgoing needed care due to cost than reported above, four in ten uninsured adults (42.0%) reported that their health got worse after skipping or postponing care due to cost.

Share of Adults Ages 18-64 Who Delayed or Went Without Health Care, by Insurance Status, 2024 (Split Bars)

Barriers to Care for Uninsured Children

Copy link to Barriers to Care for Uninsured Children

Compared to children with insurance coverage, uninsured children are less connected to the health care system. In 2024, about one in five (22.6%) uninsured children reported not seeing a doctor or health care professional in the past 12 months compared to 4.1% with private insurance and 4.0% with public coverage. Nearly a quarter (24.4%) of uninsured children did not have a regular place to go when they are sick or need medical advice (Figure 26).

Share of Children Who Did Not See a Doctor or Lacked a Usual Source of Care, by Insurance Status, 2024 (Grouped column chart)

Uninsured children are also more likely than those with private insurance or public insurance to go without needed care due to cost. While children are less likely than adults to report not getting care, children without health coverage face greater access barriers than those with health coverage. In 2024, nearly one in six uninsured children (16.0%) reported delaying, skipping, or not getting needed care or medication due to cost compared to 3.3% of children with private coverage and 3.8% of children with public coverage (Figure 27). 

Share of Children Ages 0-17 Who Delayed or Went Without Health Care, by Insurance Status, 2024 (Split Bars)

Access to Care Among Uninsured Adults with Chronic Conditions

Copy link to Access to Care Among Uninsured Adults with Chronic Conditions

Uninsured individuals are less likely than those with insurance to receive services to treat chronic conditions. Among adults with chronic health conditions who need ongoing medical management, those without insurance coverage were three to four times more likely to delay or forgo needed medical care due to cost than adults with the same condition who were insured. For example, in 2024, over four in ten (42.2%) uninsured adults with diabetes delayed or did not get needed medical care because of cost compared to 11.1% of insured adults (Figure 28). Beyond forgoing needed care, many uninsured adults live with conditions that have never been diagnosed because they are less likely to see a health professional regularly. Gaining insurance is associated with higher rates of chronic condition diagnosis, demonstrating that many uninsured individuals live with undiagnosed chronic conditions due to their lack of access to care. People without health coverage are more likely to be hospitalized for avoidable health problems and to experience declines in their overall health as a consequence of having undiagnosed conditions and a lower likelihood of receiving preventive and chronic disease management care. When they are hospitalized, uninsured people receive fewer diagnostic and therapeutic services and also have higher mortality rates than those with insurance. 

Share of Adults Ages 18-64 with Select Chronic Conditions Who Delayed or Did Not Get Needed Medical Care Due to Cost, by Insurance Coverage, 2024 (Grouped column chart)

Research demonstrates that gaining health insurance improves access to health care considerably and diminishes the adverse effects of having been uninsured.review of research on the effects of the ACA Medicaid expansion finds that expansion led to positive effects on access to care, utilization of services, the affordability of care, and financial security among the low-income population. Medicaid expansion is also associated with increased early-stage diagnosis rates for cancer, lower rates of cardiovascular mortality, and increased odds of tobacco cessation.  Evidence also indicates that gaining health coverage through the Medicaid expansion saves lives. One recent study found a 2.5% reduction in mortality among low-income adults in Medicaid expansion states and concluded that Medicaid expansion reduced the risk of death by 21% among new enrollees, saving an estimated 27,000 lives from 2010-2022.

Access to Charity Care

Copy link to Access to Charity Care

While some uninsured individuals may be eligible for free or discounted health care services, not all uninsured individuals are able to access charity care programs. Public hospitals, community clinics and health centers, and local providers that serve underserved communities provide a crucial health care safety net for uninsured people. However, safety net providers have limited resources and service capacity, and not all uninsured people have geographic access to a safety net provider. Hospital charity care programs provide free or discounted services to eligible patients who are unable to afford their care, though eligibility criteria vary across hospitals. Not all eligible patients benefit from these programs because they may not be aware that charity care is available or do not think they are eligible. They may also have difficulty completing an application or may choose not to apply.

While charity care programs help uninsured patients afford care, they can strain hospital finances. Charity care as a percent of expenses varies widely across hospitals. Hospital charity care costs are generally higher in states that have not expanded Medicaid, which also generally have higher uninsured rates (Figure 29). Moreover, research indicates that Medicaid expansion is associated with reductions in uncompensated care costs and improved financial performance for rural hospitals and other providers.

Charity Care Costs in 2023 Were Generally Higher in States That Had Not Expanded Medicaid (Scatter Plot)

Financial Implications of Being Uninsured

Unaffordable Medical Bills 

Copy link to Unaffordable Medical Bills 

Adults who are uninsured are more likely to report difficulty paying for health care costs than adults with insurance coverage.  While affording health care costs can be challenging regardless of insurance status, uninsured adults are nearly twice as likely as insured adults to say that affording health care costs is difficult (82% vs. 42%). When it comes to paying health care costs, about six in ten (59%) uninsured adults said they or someone living with them had problems compared to 30% of insured adults, and about four in ten (39%) uninsured adults said that they or someone living with them had problems paying for prescription drug costs specifically compared to 28% of insured adults (Figure 30).  

Problems Paying for Health Care  and Prescription Drug Costs in the Past Year Among Adults 18-64, by Insurance Status (Grouped column chart)

Financial Insecurity

Copy link to Financial Insecurity

People who are uninsured are more likely to experience measures of financial distress, including overdrawing their checking account, having been contacted by a debt collection agency, and having used pay day loans. Because adults who are uninsured are more likely to have lower income than those with insurance, they are also more financially vulnerable. Almost six in ten (59%) uninsured adults ages 18-64 report that it is probable or certain that they could not find $2,000 if an unexpected need, such as a medical emergency, arose in the next month compared to four in ten (39%) insured adults (Figure 31). Adults who are uninsured also have more difficulty paying their bills. About three in ten (31%) reported being contacted by debt collection in the past year, and one quarter said they used payday loans in the past five years compared to 22% and 16% of insured adults, respectively.

Share of Adults Ages 18-64 Experiencing Certain Financial Difficulties, by Insurance Status, 2024 (Split Bars)

Research suggests that gaining health coverage improves the affordability of care and financial security among the low-income population. Multiple studies of the ACA found declines in trouble paying medical bills and reductions in medical debt in expansion states relative to non-expansion states.  More recent research found that Medicaid expansion decreased catastrophic health expenditures and was associated with greater increases in income among low-income individuals. 

Medical Debt

Copy link to Medical Debt

Medical bills can quickly translate into medical debt for people who are uninsured as many have low or moderate incomes and have little, if any, savings.  Unaffordable medical bills can lead to medical debt, particularly for uninsured adults.  More than one third (34%) of uninsured adults under age 65 have medical debt, meaning they have one or more unpaid bills from a medical service provider that are past due, compared to 26% of insured adults under age 65 (Figure 32). Using a broader definition of medical debt, which includes health care debt on credit cards or owed to family members, more than six in ten (62%) uninsured adults under age 65 report having health care debt compared to over four in ten (44%) insured adults under age 65. Uninsured adults are more likely to face negative consequences due to health care debt, such as using up savings, having difficulty paying other living expenses, or borrowing money.   

Medical Debt Among Adults Ages 18-64, by Insurance Status (Grouped column chart)

Appendix and Supplemental Tables

Appendix Tables

Copy link to Appendix Tables
Uninsured Rate Among the Population Ages 0-64 by State, 2019, 2023, 2024 (Table)
Characteristics of the Uninsured Population Ages 0-64, 2024 (Table)
Change in Selected Characteristics of Uninsured People Ages 0-64, 2019, 2023, 2024 (Table)

Supplemental Tables

Copy link to Supplemental Tables
Health Insurance Coverage of the Population Ages 0-64, 2024 (Table)
Health Insurance Coverage of the Population Ages 0-64 under Poverty, 2024 (Table)
Health Insurance Coverage of Workers Ages 19-64, 2024 (Table)
Characteristics of Uninsured People 0-64 under Poverty (<100% of Poverty), 2024 (Table)
Characteristics of Uninsured Adult Workers Ages 19-64, 2024 (Table)

Out-of-Pocket Costs for Long-Acting Reversible Contraception Among Individuals Enrolled in Employer Sponsored Insurance Plans

Published: Jun 16, 2026

Despite the Affordable Care Act (ACA) requiring contraceptives to be covered without cost-sharing, many privately insured long-acting reversible contraceptives (LARC) users still face out-of-pocket expenses. In this analysis, published in the journal Contraception, KFF’s Linda Li, Brittni Frederiksen, and Alina Salganicoff look at intrauterine device (IUD) and contraceptive implant insertion-related costs among privately insured individuals to better understand why patients are experiencing unexpected expenses for what should be fully covered contraceptive services under the ACA.

Using the 2023 Merative MarketScan Commercial Claims and Encounter Database, a national sample of healthcare claims for people enrolled in employer sponsored insurance plans, the researchers estimated out-of-pocket costs for 98,916 IUD and 30,259 implant insertion encounters among females ages 15-49.

State Choices, Unequal Access: Policies Shaping Reproductive Health Care Across the United States

Published: Jun 16, 2026

Authored by KFF’s Alina Salganicoff, Ivette Gomez, and Usha Ranji, this article for The Milbank Quarterly examines how state policies create varying levels of access to reproductive healthcare services (including contraceptive care, abortion, and maternity care), affecting coverage, availability, and costs.