Unwinding the PHE: What We Can Learn From Pre-Pandemic Enrollment Patterns

Authors: Bradley Corallo, Robin Rudowitz, and Jennifer Tolbert
Published: May 10, 2022

Executive Summary

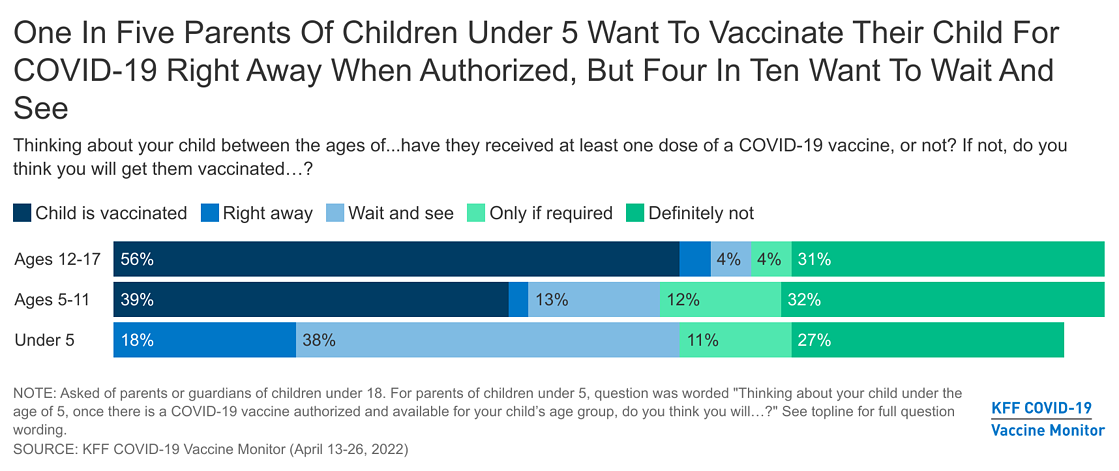
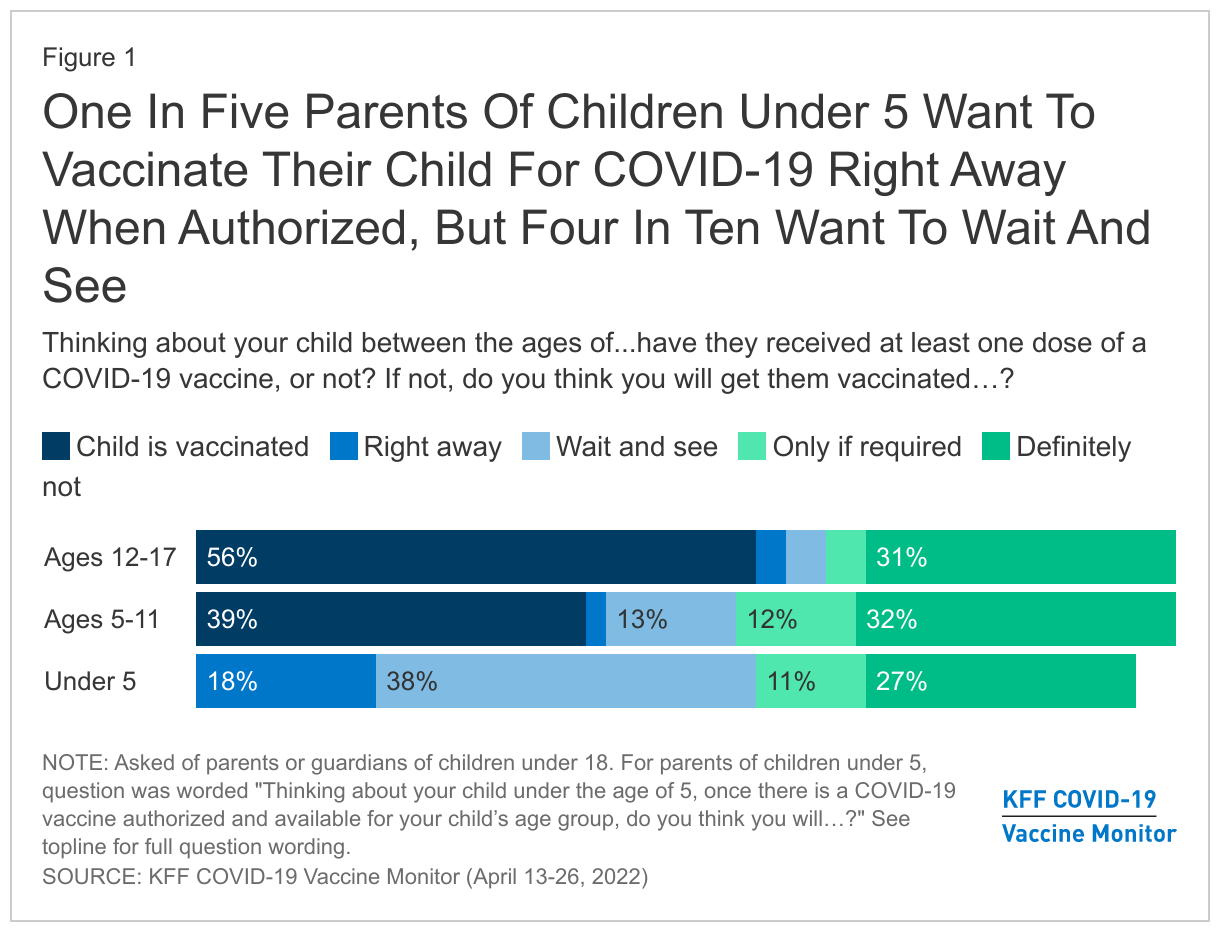
The Families First Coronavirus Response Act (FFCRA), passed during the coronavirus pandemic, includes a Medicaid continuous enrollment requirement that prohibits states from disenrolling people from Medicaid in exchange for additional federal funds. The continuous enrollment requirement has prevented coverage loss and churn (moving off and then back on to coverage) among enrollees during pandemic and, along with other factors, has contributed to the substantial enrollment growth in Medicaid. From February 2020 to January 2022, total Medicaid/CHIP enrollment has increased by 15.7 million enrollees (22.1%). The continuous enrollment requirement will last until the end of the month in which with national public health emergency (PHE) ends. Currently, the PHE is in effect through mid-July 2022 and, at this time, it is expected that the continuous enrollment requirement will end August 1, 2022. The Biden administration has said it will give states 60 days’ notice before the PHE ends, and so if state are not notified by mid-May, the PHE will likely be extended further.

To help inform the current policy discussion and better understand the factors that contribute to Medicaid enrollment changes, this brief examines typical enrollment patterns for Medicaid and CHIP1  and uses 2018 Medicaid claims data to gain insight into the effects of the continuous enrollment requirements by eligibility group. Overall, we find that:

  • Roughly 2% of Medicaid enrollees come on or leave the program in an average month, although there is variation across eligibility groups.
  • A policy to require continuous enrollment would result in sharp reductions in monthly disenrollment rates and would also reduce monthly enrollment rates due to reductions in churn.
  • Based on data from 2018, the effect of continuous coverage would have greater impact on enrollment for children and non-elderly adults as they are more likely to experience higher rates of churn or income fluctuations affecting eligibility.

These findings from the simulation may help explain how the current continuous enrollment requirement may have contributed to Medicaid enrollment increases and what may happen with the unwinding of the PHE. A description of the data and methods underlying this analysis is in the Methods section at the end of the brief.

What factors contribute to enrollment changes over time?

Medicaid enrollment is driven by several factors, including economic conditions and policy choices. Medicaid is a countercyclical program, meaning that typically during economic downturns, more people qualify and enroll in Medicaid. Economic downturns were the primary driver of Medicaid enrollment growth in the 2001 recession and again during the Great Recession beginning in 2007. Medicaid enrollment also reflects policy changes. For example, Medicaid enrollment growth peaked in FY 2015 due to implementation of the Affordable Care Act (ACA) coverage expansions. Also, prior to the pandemic, enrollment declined in FY 2018 and FY 2019 and was relatively flat in FY 2020 before increasing sharply in 2021.

Enrollment trends reflect the net effect of people coming onto the program as well as people leaving the program. People typically enroll or disenroll from coverage for three main reasons:

  • Change in income (for example, a drop in income may make someone newly eligible, while an increase in income may make someone ineligible for Medicaid);
  • Change in circumstance other than income (for example, children may age out of coverage, people may move to another state or die); and
  • Barriers to renewing coverage that are not based on ongoing eligibility but may result in disenrollment (for example, forms to renew coverage may be confusing or someone may miss a deadline resulting in disenrollment).

It is often difficult to understand the relative magnitude of each of these factors in contributing to net enrollment changes over time.

What do data show about enrollment patterns?

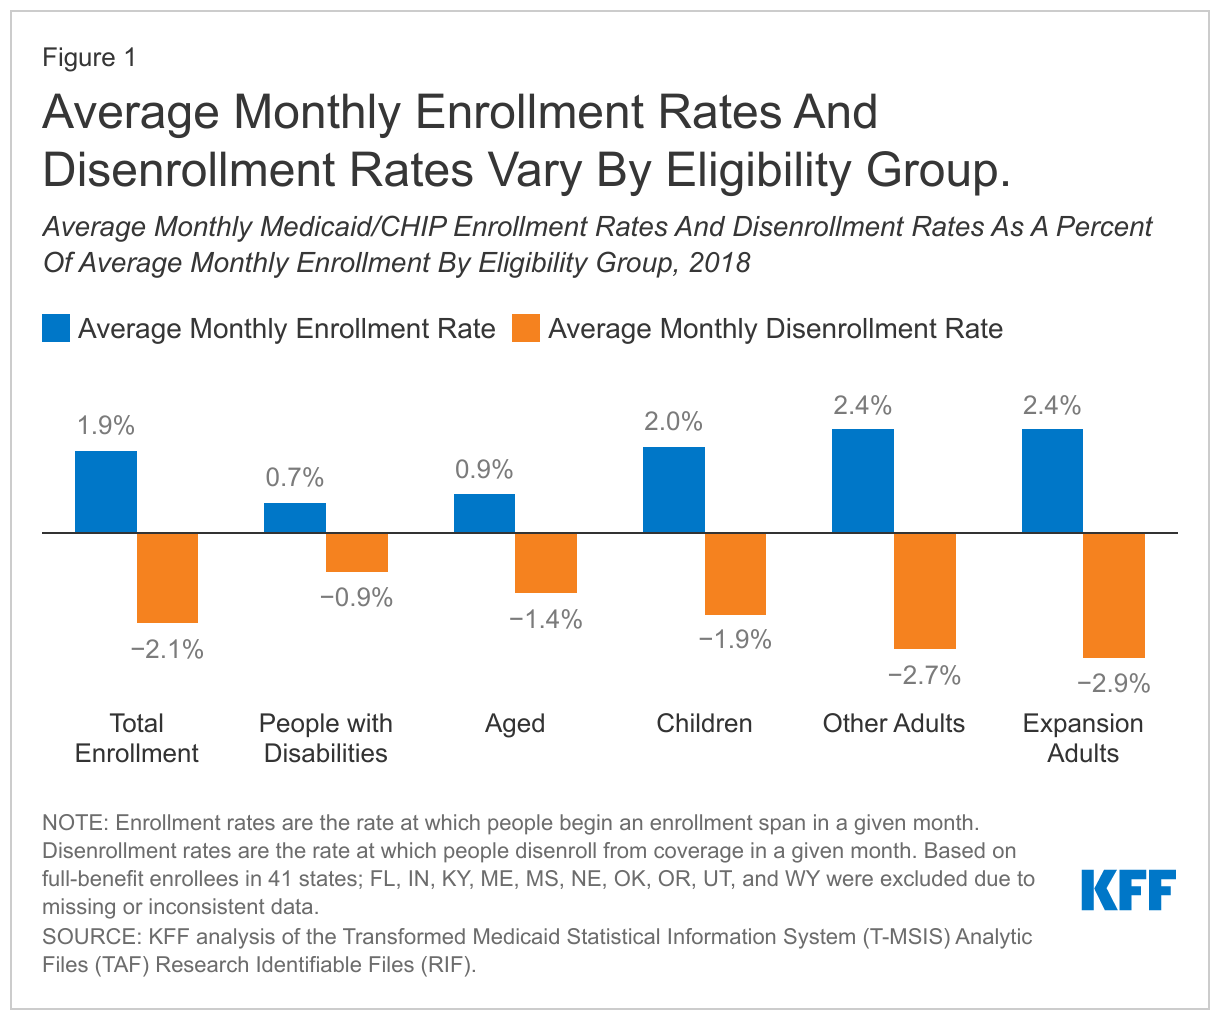
In general, data show that about as many people enroll in Medicaid in a given month as disenroll, with small differences leading to changes in net monthly enrollment. In 2018, the average monthly disenrollment rate was 2.1% while the monthly enrollment rate (people beginning an enrollment span) was 1.9%, which resulted in a net monthly enrollment decline of 0.2% (Figure 1). Earlier research attributed this enrollment decline to a robust economy and to policies and processes in place that may have boosted disenrollment, such as more frequent checks on income or barriers to renewing coverage. At the same time, our analysis of data for other recent years showed similar patterns (approximately 2% of enrollees coming on or off the program each month), with the difference in monthly new enrollment and disenrollment rates leading to an overall increase or decrease in enrollment. As noted above, we expect patterns would have been different (with much higher enrollment rates relative to disenrollment rates) during the Great Recession and after the implementation of the ACA.

Average monthly enrollment and disenrollment rates vary by eligibility group (Figure 1). In 2018, both enrollment and disenrollment rates for elderly enrollees and enrollees with a disability were lower than rates for children and adults. In other words, in a given month, fewer elderly and disabled enrollees were entering and leaving the program relative to total enrollment in those groups compared to children and non-elderly adults. The elevated enrollment rates and disenrollment rates among children and adults reflect that they are more likely to experience income fluctuations affecting eligibility and also leading to higher rates of churn.

Average Monthly Enrollment Rates And Disenrollment Rates Vary By Eligibility Group

Not all enrollment and disenrollment reflects people newly entering or permanently leaving Medicaid. Another analysis that examined churn within Medicaid shows that, among people enrolled in 2018, approximately 10% experienced a gap in enrollment of less than a year. This suggests that the enrollment in each month reflects individuals who had been enrolled, then disenrolled, and then were re-enrolling after a gap in Medicaid coverage, as well as those who were newly eligible. Similarly, disenrollments in each month reflect some people who may re-enroll in Medicaid after a short gap, as well as those who transitioned from Medicaid to other coverage or become uninsured. As noted above, children and non-elderly adults experience the highest rates of churn compared to people with disabilities or enrollees ages 65 and over.

What happens to enrollment patterns under a continuous enrollment requirement?

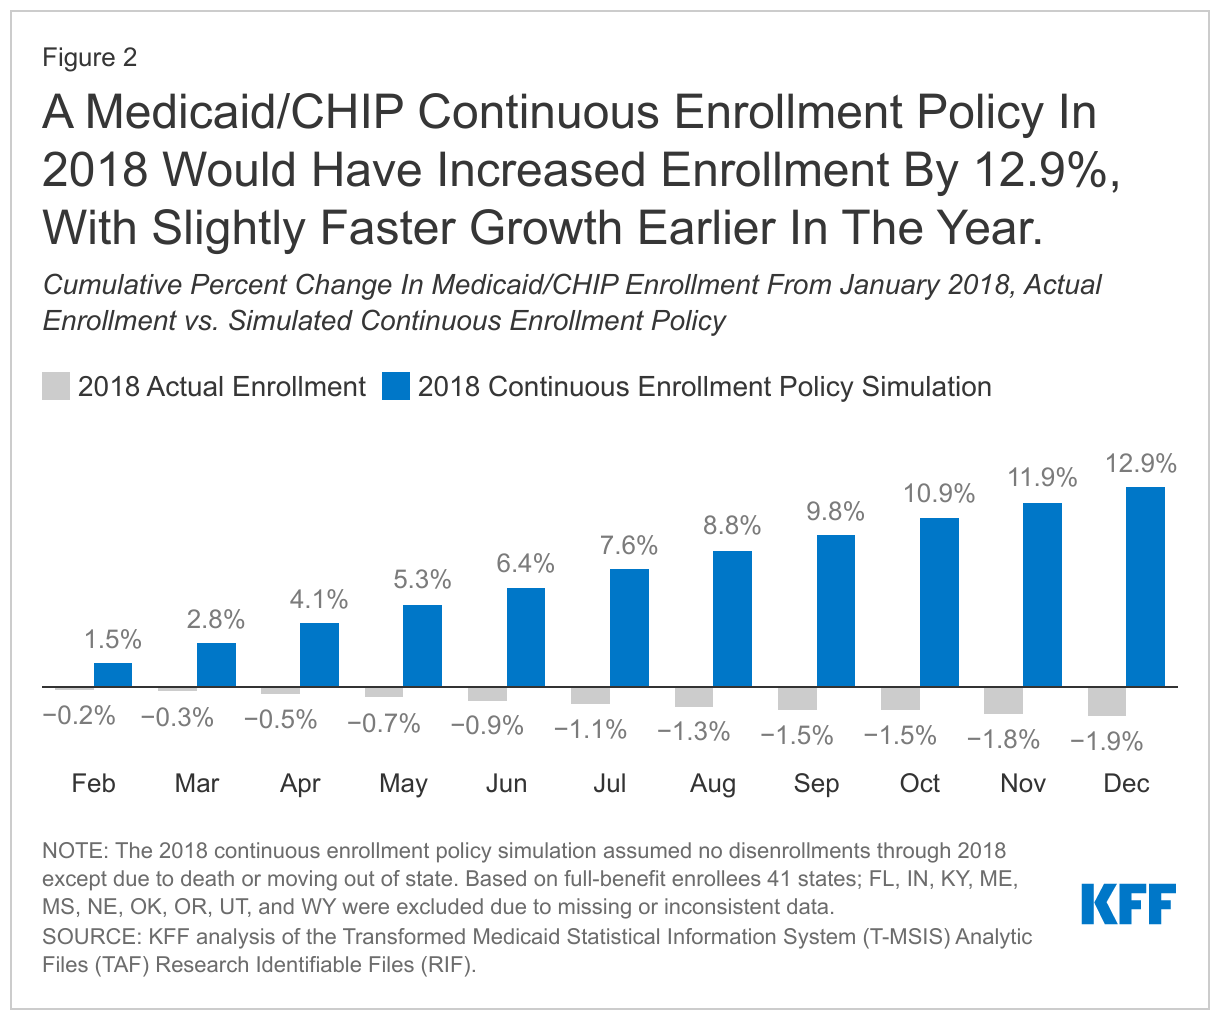
To help understand the effects of the current Medicaid continuous enrollment policy, we examined what would have happened if there were a similar policy prohibiting disenrollment in place in 2018. Halting disenrollment (except for enrollees who were disenrolled due to a move out of state or death) lowered the average monthly disenrollment rate compared to actual 2018 (0.2% vs. 2.1%, respectively). Halting disenrollments in the simulation also lowered the average enrollment rate compared to actual 2018 (1.4% vs. 1.9%, respectively) due to eliminating churn. Over the course of the year, the simulated continuous enrollment policy resulted in a net increase in enrollment (12.9%, Figure 2) from January to December 2018 compared to the slight decrease in enrollment observed in actual 2018 (-1.9%). When looking at the monthly enrollment changes, the first few months of the simulation experienced slightly faster growth than the later months.

A Medicaid/CHIP Continuous Enrollment Policy In 2018 Would Have Increased Enrollment By 12.9%, With Slightly Faster Growth Earlier In The Year

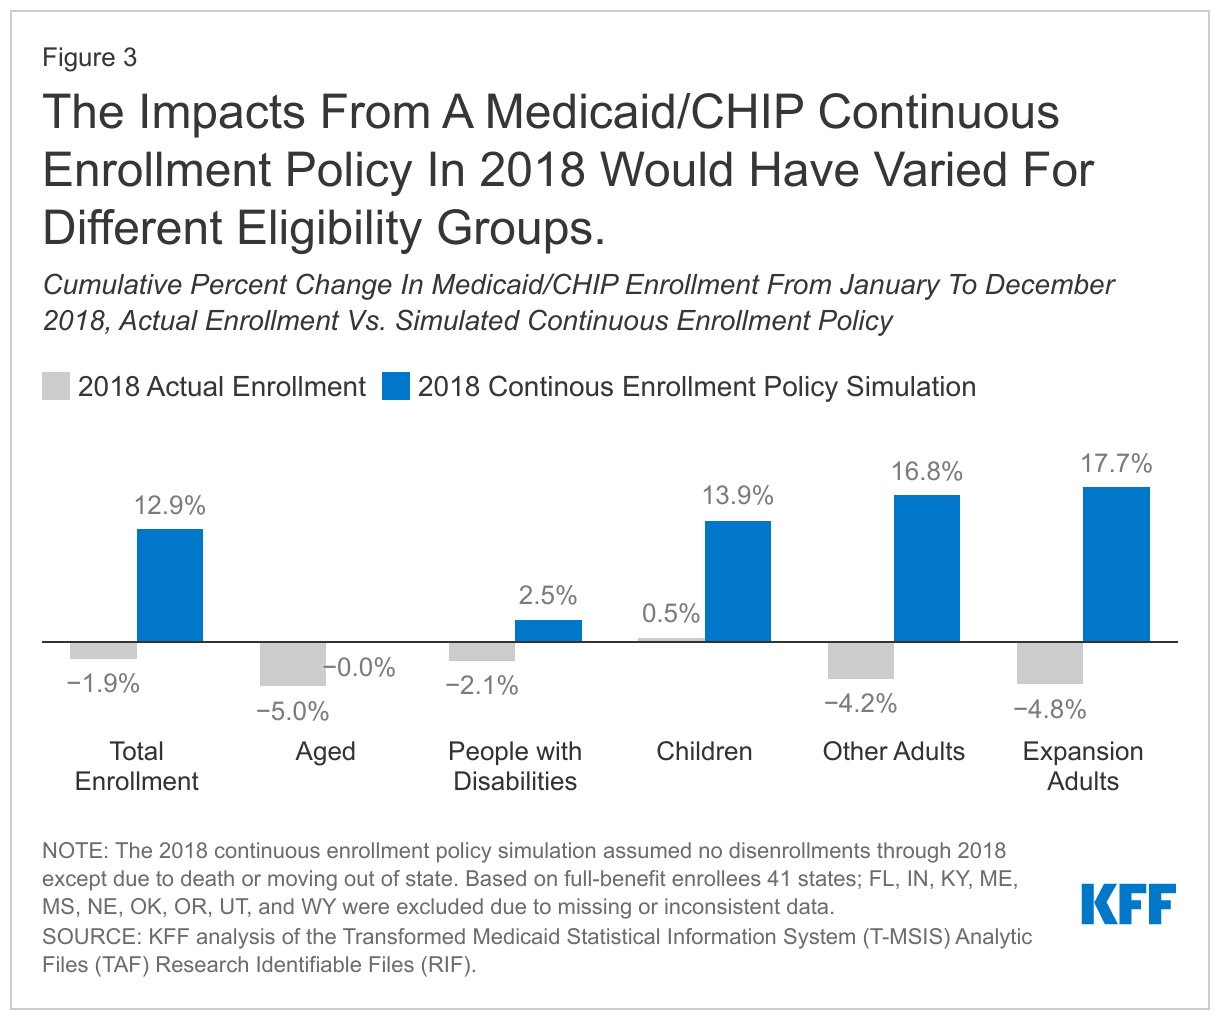
The simulated continuous enrollment policy led to much higher enrollment growth for children and non-elderly adults compared to people with disabilities and those ages 65 and older (Figure 3). This result was also expected, as these groups typically have higher turn-over (i.e., greater disenrollment and enrollment rates) and so they would experience bigger effects from a policy to stop disenrollment.

The Impacts From A Medicaid/CHIP Continuous Enrollment Policy In 2018 Would Have Varied For Different Eligibility Groups

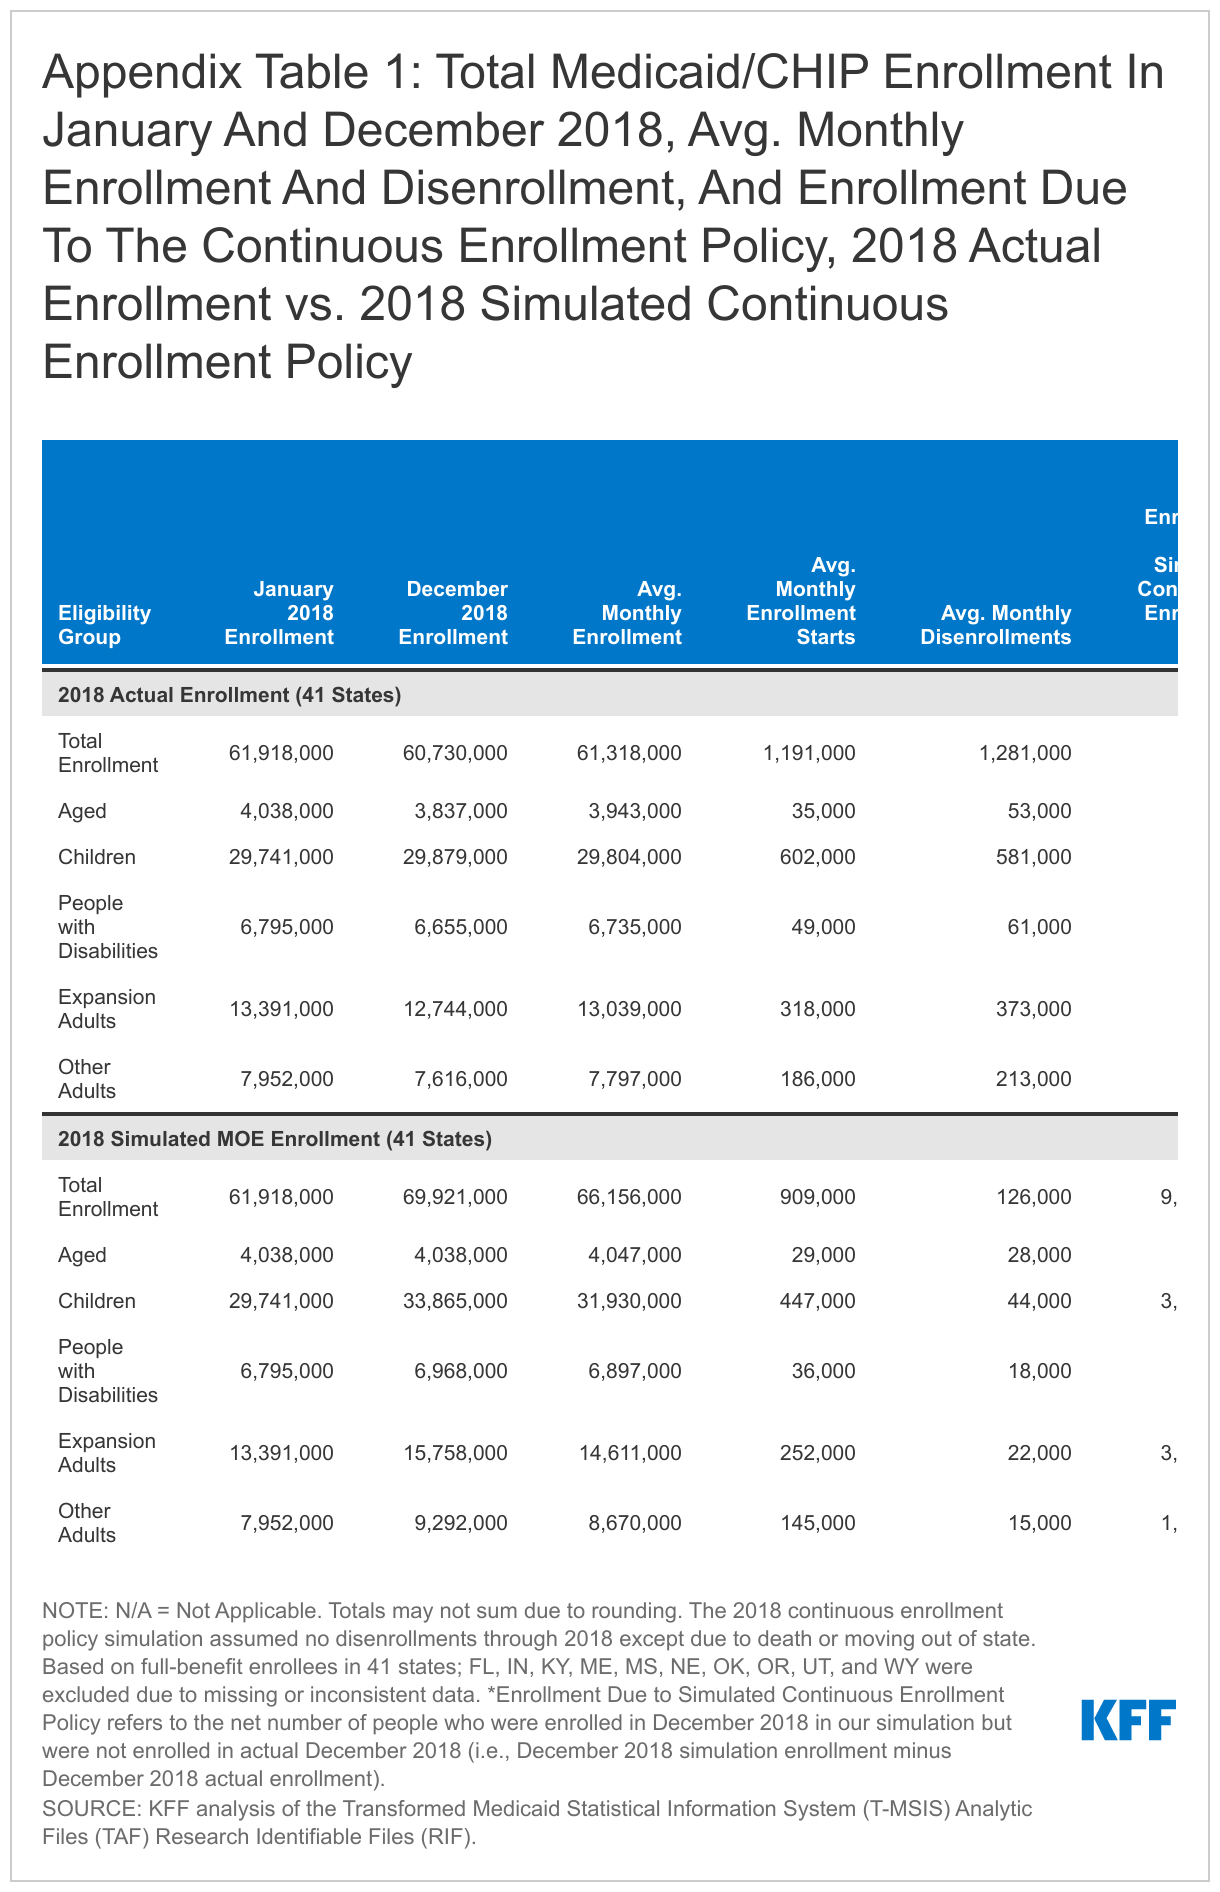
Children and expansion adults accounted for 76% of the enrollment change due to the simulated continuous enrollment policy for 2018 (Appendix Table 1). These findings are as of December 2018, or after 12 months of the simulated continuous enrollment policy. While the total number of enrollees are not complete because we exclude 10 states from the analysis, we estimate that actual enrollment declined by 1.2 million or 1.9% in 2018 for the 41 states included in our analysis. Under the simulated continuous enrollment policy, enrollment would have increased by 8.0 million or 12.9%. The net change would be an increase of 9.2 million in enrollment. We estimate that, of this net growth, children account for 43% of this net change and expansion adults make up 33% of the change. Other non-elderly adults not enrolled through the Medicaid expansion made up 18% of the net change. These three eligibility groups represent the largest share of total Medicaid/CHIP enrollment2  and also experienced higher average monthly enrollment and disenrollment rates in actual 2018. People with disabilities made up 3% of enrollment due to this net enrollment growth and people ages 65 and older made up 2%.

What to watch going forward?

Understanding historic enrollment patterns and the effects of a simulated policy to halt disenrollment in 2018 can help inform the current continuous enrollment requirement in place. Key findings suggest that, first, halting disenrollment has a significant effect on overall enrollment growth. Second, growth may be steeper when the policy is first put into place, but growth rates may slow as a result of lower churn. Third, the policy would have a significantly disproportionate effect on children and non-elderly adults relative to people with disabilities and those ages 65 and older. Finally, the simulated growth patterns reflect recent experience with Medicaid growth. We observed steep growth in Medicaid enrollment in calendar year 2020 when the continuous coverage policy was put into effect but, similar to the simulation, observed growth rates have slowed over time.

Overall growth rates may be harder to compare given the sharp differences in economic conditions in 2018 compared to recent experience. The fact that observed growth rates from February 2020 through January 2021 showed 13.5% growth, slightly higher than the one-year results of the simulation (12.9%), suggest that much of current growth is attributable to the continuous coverage rather than new enrollment. The economic effects of the COVID-19 recession are complex. Unlike prior recessions that resulted in large shifts in income and losses of employer coverage, this recession largely affected low-wage workers who may have already been eligible for Medicaid.

Finally, as the PHE expires and states are able to resume more routine renewals and disenrollments, our analysis (in addition to current enrollment reports) shows that a large share of non-elderly adults and children could be at risk of losing coverage, even if many continue to be eligible. Efforts to conduct outreach, education and provide enrollment assistance can help ensure that those who remain eligible are able to retain coverage and those who are no longer eligible can transition to other sources of coverage. The Centers for Medicare and Medicaid Services (CMS) released new guidance in March 2022 emphasizing continuity of coverage for enrollees after the end of the continuous enrollment requirement, and the guidance also extended the timeline for states to complete all redeterminations after the continuous enrollment requirement ends from 12 to 14 months (states will still need to initiate all redeterminations within 12 months). However, a recent survey of state officials shows that, as of January 2022, many states had not made key decisions about how to handle the resumption of disenrollments after the end of the PHE. State policy choices about how to prioritize pending eligibility actions, engage with stakeholders, conduct outreach to enrollees, and provide enrollment assistance will have important implications for the continuity of coverage for millions of Medicaid enrollees, especially non-elderly adults and children.

The authors thank former KFF Vice President Rachel Garfield for her role in writing this report and technical assistance with the analysis.

Methods

Data Source and Linkage

Our analysis is based on the Transformed Medicaid Statistical Information System (T-MSIS) Analytical Files (TAF) Research Identifiable Files (RIF). We include beneficiaries who were enrolled at any point in 2018. We use the 2018 Demographic Eligibility (DE) Base file to determine eligibility pathway based on last-best eligibility data. We draw enrollment dates from the 2017-2019 DE Dates files. Our analysis uses enrollment dates from 2017 and 2019 so that we are able to identify people who were enrolled from December 2017 into January 2018, as well as December 2018 into January 2019. Data for 2019 are from the preliminary version of the T-MSIS RIF. All other DE Base and DE Dates files are final versions (Release 1).

State Exclusion Criteria

We use 41 states in our analysis. We excluded 10 states (FL, IN, KY, ME, MS, NE, OK, OR, UT, and WY) due to missing or inconsistent data based on state-level information available at the DQ Atlas as well as our own analysis We relied on data quality assessments from DQ Atlas to exclude states that have a “medium concern”, “high concern”, or “unusable” data quality assessment for: (1) the average monthly Medicaid/CHIP enrollment compared to an external enrollment benchmark (Medicaid/CHIP Performance Indicator Data) (excluded five states (IN, KY, ME, MS, NE)); (2) the average length of enrollment gaps, and (3) the percent of beneficiaries with overlapping Medicaid and S-CHIP enrollment spans (no states were excluded based on measures 2 or 3). We further excluded states based on: (4) the percent of beneficiaries missing an eligibility group code (threshold of >=10%, excluded OR); (5) the percent of beneficiaries with only one enrollment span (threshold of >=99.5, excluded FL, KY, and WY); and (6) the percent of beneficiaries with three or more enrollment spans in a year (threshold of >=5%, excluded OK). Notably, our exclusion criteria related to the number of enrollment spans in a year (measures 5 and 6) are less restrictive than that in the DQ Atlas because we did not want to make assumptions about the number of enrollment spans in our analysis, but did want to remove extreme cases that are the most likely to represent inaccurate enrollment dates.

Beneficiary Linking, Eligibility Classification, and Exclusion

We linked individuals across years using BENE_ID, which are unique enrollee identifiers created by the Chronic Conditions Warehouse and are recommended for use when combining data for multiple years. We also use BENE_ID to link the DE Base and DE Dates files. We assigned restricted benefit status and eligibility group code using a last-best approach for 2018, which assigns eligibility based on the most recent eligibility code in 2018. We classified eligibility groups using a hierarchy that first checked if the eligibility group code was missing, then checked for medically needy eligibility, disability (under age 65), and expansion adult. Any enrollees in the DE Base file that had a non-missing eligibility code and had not been assigned an eligibility group through this hierarchy were then were assigned by age to children (ages 20 and under), adults (ages 21 to 64), and aged (ages 65 and over).

The 2018 DE Base files for 41 states in our analysis contained 74.0 million observations coded as full-benefit after removing a small number of “dummy” records that represent enrollees who have claims data but no eligibility data provided by the states. We removed observations missing eligibility codes (151,000 observations), people qualifying through a medically needy pathway (1.5 million observations), people missing a BENE_ID for linking files (953,000 observations), and people with duplicated BENE_ID (102,000 observations). After merging with the DE Dates files, there were less than 3,000 enrollees who did not have a matching BENE_ID in the DE Dates and DE Base files and were dropped from the final sample. Our final sample included 71.3 million unduplicated, full-benefit enrollees.

The DE Dates files provide a start and end date for every enrollment span in our time period. However, the earliest start date in any DE Date file in January 1st of that year, and the latest end date is December 31st of that year. Using the 2017 and 2019 DE Dates files, linked by BENE_ID, we were able to identify people who started enrollment spans in January 2018 (versus people who were continuously enrolled from December 2017) and people who disenrolled in December 2018 (versus people who were continuously enrolled into January 2019). Before calculating monthly enrollment and disenrollment rates, we merged all overlapping and contiguous enrollment spans for enrollees, which we defined as enrollment spans that are separated by one day or less. For example, if a person has two enrollment spans with an end date and a start date that are one day apart (i.e., the person disenrolled and re-enrolled the next day), we considered these spans to be contiguous and merged them into one enrollment span. After merging overlapping and contiguous enrollment spans, we counted the number of enrollment starts and disenrollments in a month (the enrollment and disenrollment rates). Enrollment counts are de-duplicated counts of people enrolled at any point in the month. Average monthly net change in enrollment is the average of monthly enrollment change from January 2018 to December 2018.

Simulating A Continuous Enrollment Policy

To simulate a continuous enrollment policy in 2018, we assume that no one is disenrolled from Medicaid and CHIP except in cases of death or moving to a different state. We used the 2018 DE Base file to identify death dates. We used the 2018 and 2019 DE Bases files to identify people who moved states and then re-enrolled in Medicaid and CHIP (and used BENE_ID for linking files). Notably, we do not have information about why a person was disenrolled or length of time before they enrolled in another state (we only can see that they were enrolled in another state after disenrollment). In total, there were 1.5 million people disenrolled in the simulation due to death or moving out of state.

After accounting for death and moving, we de-duplicated enrollees with multiple spans in 2018. We then used each enrollee’s earliest enrollment date in 2018 (or, if continuously enrolled from 2017, kept the date from 2017), and extended coverage through the year unless the enrollee had a death date or “move out” date. Finally, using this simulated sample, we calculated monthly enrollment rates, disenrollment rates, and total enrollment as described above.

Our simulation has important differences from the current continuous enrollment requirement under the FFCRA. First, our simulation applies to Medicaid and CHIP; however, while the current continuous enrollment requirement under the FFCRA does not apply to separate CHIP programs. In total, 3.6% of enrollees in our sample were only enrolled in separate CHIP programs throughout 2018 (and never enrolled in Medicaid through the year). Additionally, our simulation does not match the economic conditions of the pandemic, and the simulation does not account for other related factors such as elevated death rates or state or federal policy actions facilitating enrollment in Medicaid, CHIP, or Marketplace coverage.

Appendix

Appendix Table 1: Total Medicaid/CHIP Enrollment In January And December 2018, Avg. Monthly Enrollment And Disenrollment Rates, And Enrollment Due To The Continuous Enrollment Policy, 2018 Actual Enrollment vs. 2018 Simulated Continuous Enrollment Policy
  1. Our simulation of a continuous enrollment policy in 2018 applies to both Medicaid and the Children’s Health Insurance Program (CHIP). Although the continuous coverage policy under the FFCRA does not apply to separate CHIP programs, it does apply to CHIP Medicaid expansion programs. See the Methods section for more details on the simulation. ↩︎
  2. January 2018 enrollment was the same in the simulation analysis and in actual 2018. The share of total full-benefit Medicaid/CHIP enrollment for each eligibility group in January 2018 were as follows: children (48%), expansion adults (22%), other adults (13%), people with disabilities (11%), and individuals ages 65 and older (7%). See Appendix Table 1 for enrollment counts. ↩︎

Assessing PEPFAR’s Impact: Analysis of Maternal and Child Health Spillover Effects in PEPFAR Countries

Authors: Jennifer Kates, Gary Gaumer, William Crown, Dhwani Hariharan, and Allyala Nandakumar
Published: May 9, 2022

Issue Brief

Key Findings

PEPFAR, the U.S. global HIV program and largest commitment by any nation to address a single disease, was designed as a vertical, singularly-focused, global HIV initiative. While credited with helping to change the trajectory of the global HIV epidemic, some have argued that PEPFAR, and other vertical initiatives, risk “crowding out” other health investments, potentially resulting in worse, non-HIV-related health outcomes, while others have argued the opposite. In our recent analysis, which looked over the full course of the program, we found that PEPFAR was associated with large, significant declines in overall mortality in countries that received its support, suggesting a positive spillover effect of the program beyond HIV. Here, we look at seven maternal and child health measures to further assess this relationship. PEPFAR’s potential impact in this area is plausible, given its investment in the health workforce, laboratory services, and other aspects of health systems strengthening, estimated to total more than $1 billion per year, and its increased emphasis on reaching women where they receive prenatal care and seek immunizations and other services for their children.  We analyze the change in these measures in 90 PEPFAR recipient countries between 2004-2018 compared to similar low- and middle-income countries. Our main findings are as follows:

  • PEPFAR was associated with significant, positive improvement in six of the seven maternal and child health measures assessed.
  • Specifically, PEPFAR countries experienced large, significant reductions in both maternal and child mortality, relative to what would have been expected in PEPFAR’s absence, over the course of the program. The child mortality rate was reduced by 35% and the maternal mortality rate was reduced by 25%. These effects were strongest where PEPFAR engages in more intensive planning and programming and invests more funding.
  • PEPFAR countries also experienced significant increases in childhood immunization rates in three areas – measles immunization (a 9% increase), DPT immunization (11%), and Hepatitis B immunization (8%) – and an increase in the percent of newborns protected against tetanus because their mothers were immunized against the disease (7%).
  • There was no significant association found between PEPFAR and the prevalence of anemia among women of reproductive age.
  • Taken together, these findings add to the evidence base that PEPFAR has had positive health spillover effects beyond just HIV, with no negative, “crowding-out” effects. As policymakers and others consider the future of the program, these findings can help to inform their discussions about how PEPFAR can best continue to reach HIV goals and contribute to broader health gains.

Introduction

PEPFAR, the U.S. global HIV program and largest commitment by any nation to address a single disease, was designed as a vertical, singularly-focused, global HIV initiative. In many countries, PEPFAR funding represents the largest external health investment of any donor, and often surpasses domestic HIV spending.1  While credited with saving millions of lives and helping to change the trajectory of the global HIV epidemic, some have argued that PEPFAR, and other vertical initiatives, could risk “crowding out”, or displacing, other health investments and efforts, potentially resulting in worse, non-HIV-related health outcomes.2   Others have argued that PEPFAR’s investments over time contribute to the broader health system.3   In both cases, most of the literature is from a decade or more ago. In our recent analysis4 , we examined PEPFAR’s impact through 2018 and found that it was associated with large, significant declines in overall mortality, suggesting a positive spillover effect beyond HIV. Here, working with researchers at Brandeis University, we use a quasi-experimental design to look at seven maternal and child health measures to further assess whether there were other health spillover effects, either positive or negative, in PEPFAR countries over this period.

Maternal and child health is an important area to examine. First, prior studies of PEPFAR’s association with such measures have found mixed results.5  Second, poor maternal and child health outcomes have presented ongoing challenges, concurrent with HIV, in low and middle income countries. Lastly, improving maternal and child health is a main target of the Sustainable Development Goals and of the U.S. government’s global health efforts.6  If PEPFAR is shown to have positive spillover effects on maternal and child health, it would suggest that HIV investments have yielded bigger dividends and that the program has served as a wider platform. However, if negative spillover effects are detected, it would suggest that PEPFAR investments may have worked at cross-purposes with these other health areas, diverting resources with detrimental results.

While PEPFAR does not directly fund non-HIV specific maternal and child health services, its potential impact in the area of maternal and child health is plausible given its significant investments in the health workforce, laboratory services, and other aspects of health systems strengthening, estimated to total more than $1 billion per year.7   Indeed, attention to the importance of strengthening the underlying health systems in the countries in which it works was specified in its original authorizing legislation8  and its first Congressionally-mandated strategy.9   This emphasis has been enhanced over time, particularly starting with PEPFAR’s 2008 reauthorization.10 ,11   Its current guidance to countries, used to prepare their annual programmatic and budgeting plans, states that “Plans should ensure that PEPFAR’s actions are supporting enduring public health systems and capabilities. That is, people and systems that serve the PEPFAR mission, but are trained and designed to be resilient public health assets for a long-term public health response to HIV, which can be adapted for responses to other public health threats and emergencies.”12   In addition, as part of PEPFAR’s effort to address HIV among women, particularly pregnant women, and children, it has increasingly emphasized reaching women where they receive prenatal care and seek immunizations and other services for their children, and on integrating services.13 ,14   Guidance provided to countries as early as 2006, for example, included the importance of providing routine childhood immunizations to children with HIV and stated that PEPFAR funds could be used for linking to immunization programs and referral and follow-up for immunization15  and country guidance has continued to encourage such linkages.

Box: Outcome Measures

1. Child mortality rate2. Maternal mortality ratio3. Measles immunization4. DPT immunizations5. HepB3 immunizations6. Newborns protected against tetanus7. Prevalence of anemia among women of reproductive age

For this analysis, we identified seven maternal and child health outcome measures16  (see Box). These measures were chosen because they represent global health target areas and because sufficient data were available for analysis. We used a difference-in-difference, quasi-experimental design to analyze the change in each measure in 90 PEPFAR countries between 2004, the first year in which PEPFAR funding began, and 2018, compared to a comparison group of 67 low- and middle-income countries. We tested several model specifications. Our final model specification controls for numerous baseline variables that may also be expected to influence the health outcomes examined and which help to make the non-PEPFAR group more comparable to the PEPFAR group. However, despite the strengths of the difference-in-difference model design, it is still possible that there may be other, unobservable ways in which comparison countries differed from PEPFAR countries, which could account for our results. (See methodology for more detail).

Findings

Between 2004 and 2018, PEPFAR was associated with significant, positive improvement in six of the seven maternal and child health measures assessed. These include both mortality measures and all but one immunization measure. There was no evidence of any negative, spillover effect.

The largest effects of PEPFAR’s investments were found in reductions in the child mortality rate. The child mortality rate was 34.7% lower in PEPFAR countries compared to what would have been expected if PEPFAR had been absent. These effects were greater in countries with more intensive planning and programming through the PEPFAR “COP” process17 , which are also countries with greater investment. Because we did not assess the independent effect of PEPFAR spending in COP countries, it is unclear if mortality declines were due to greater spending, more intensive planning and programming, or some combination of both. (See Figure 1 and Tables 5-6).

Figure 1: Percent Change in Child and Maternal Mortality Rates in PEPFAR Countries, 2004-2017/18*

The maternal mortality rate also declined significantly in PEPFAR countries, though not as steeply. Between 2004 and 2017 (the most recent year for which maternal mortality data were available), the maternal mortality rate was 24.6% lower than would have been expected. As with child mortality, these effects were greater18  in countries with more intensive planning and greater PEPFAR investment (see Figure 1 and Tables 5-6).

PEPFAR was also associated with significant improvements in childhood immunization rates in three areas – measles; diphtheria, tetanus, and pertussis (DPT); and Hepatitis B – and with increased protection against newborn tetanus.  In each of these areas, PEPFAR countries saw greater increases in immunization against disease than would have been expected in PEPFAR’s absence.  Measles immunization rates among children increased by 9%, DPT immunization by 11.3%, and Hepatitis B immunization by 8.4%. In addition, the percent of newborns protected against neonatal tetanus because their mothers were immunized against the disease increased by 6.9% (see Figure 2 and Tables 5-6). Spending intensity and planning, however, were not consistently correlated with greater increases or significantly different from what would have been expected.

Figure 2: Percent Change in Childhood Immunizations and Protection Against Newborn Tetanus in PEPFAR Countries, 2004-2018

PEPFAR was not associated with the final measure of maternal and child health assessed. The prevalence of anemia among women of reproductive age did decrease but this decline was not significant (see Tables 5-6).

Implications

These findings, which cover a longer time period than prior studies, add to the evidence base that PEPFAR has had positive health spillover effects, beyond just HIV. Our findings are particularly strong for child and maternal mortality, some of which likely capture reductions in HIV-related mortality itself but extend beyond these. For example, HIV accounted for 5.1% of the estimated 4 million child deaths in sub-Saharan Africa in 2003, compared to 1.6% of the estimated 2.8 million child deaths in 2018, a drop that would not fully drive the overall decline in child mortality.19   Similarly, HIV, which is not considered to be a direct cause of maternal mortality, was estimated to have accounted for 6.4% of maternal deaths in sub-Saharan Africa between 2003 and 2009.20   Beyond mortality, significant improvements were also found in several immunizations that protect children from disease.  Additionally, we find no evidence of any negative, “crowding-out” effect of PEPFAR in maternal and child health.

Still, it is important to note that despite the strengths of the model design used here, it is possible that there may be other, unobservable ways in which comparison countries differed from PEPFAR countries, which could account for our results. Future analysis could seek to explore other factors that may contribute to these findings. It could also further explore the multiple and complex pathways that may help to explain the relationships between PEPFAR support and improved maternal and child health outcomes, and examine the change in other non-HIV specific health measures in PEPFAR countries over time.

Taken together, these findings indicate that U.S. investments in PEPFAR, which have altered the trajectory of the HIV epidemic, saving millions of lives, have also paid significant dividends beyond HIV alone. As policymakers and others consider the future of the program, these findings can help to inform their discussions about how PEPFAR can best continue to reach HIV goals and contribute to broader health gains.

Methods

We used a difference-in-difference21 , quasi-experimental design to estimate a “treatment effect” (PEPFAR), compared to a group without the intervention (the counterfactual). The difference-in-difference design compares the before and after change in outcomes for the treatment group to the before and after change in outcomes for the comparison group. We constructed a panel data set for 157 low- and middle- income countries between 1990 and 2018. Our PEPFAR group included 90 countries that had received PEPFAR support (between 2004 and 2018). Our comparison group included 67 low- and middle-income countries that had not received any PEPFAR support or had received minimal PEPFAR support (<$1M over the period or <$.05 per capita) between 2004 and 2018.  The pre-intervention period was 1990 to 2003 and post intervention period was 2004 to 2018 for all measures except maternal mortality (2000-2003 and 2004-2017) and prevalence of anemia among women of reproductive age (1990-2003 and 2004-2016), due to data limitations.  Data on PEPFAR spending by country were obtained from the U.S. government’s https://foreignassistance.gov/ database and represent U.S. fiscal year disbursements; data for other measures were obtained from the World Bank’s World Development Indicator database and the Institute for Health Metrics and Evaluation (IHME), unless otherwise noted. Our outcomes of interest, their definitions, and sources are listed in Table 1. Baseline variables and sources are listed in Table 2.

Table 1: Outcome Variables
VariableDefinition
1. Child mortality rateProbability of a child dying between birth and 5 years of age, per 1,000 live births.
2. Maternal mortality ratioNumber of women who die from pregnancy-related causes while pregnant or within 42 days of pregnancy termination per 100,000 live births
3. Measles immunizationPercent of children ages 12-23 months who received the measles vaccination
4. DPT immunizationsPercent of children ages 12-23 months who received DPT vaccinations (3 doses)
5. HepB3 immunizationsPercent of children ages 12-23 months who received hepatitis B vaccinations (3 doses)
6. Newborns protected against tetanusPercentage of births by women of child-bearing age who are immunized against tetanus
7. Prevalence of anemia among women of reproductive agePrevalence of anemia among women of reproductive age (% of women ages 15-49)
Source:  World Bank, WDI, https://datatopics.worldbank.org/world-development-indicators/
Table 2: Baseline Variables, 2004
VariableData Source
1. GDP per capita (constant USD)WDI, https://datatopics.worldbank.org/world-development-indicators/
2. Recipient of U.S. HIV funding prior to 2004 (dummy variable)USAID, https://foreignassistance.gov/
3. Total populationUnited Nations, Department of Economic and Social Affairs, Population Division (2019). World Population Prospects 2019, Online Edition. Rev, https://population.un.org/wpp/
4. Life expectancy at birth (years)WDI, https://datatopics.worldbank.org/world-development-indicators/
5. Total fertility rate (births per woman)WDI, https://datatopics.worldbank.org/world-development-indicators/
6. Percent urban population (of total population)WDI, https://datatopics.worldbank.org/world-development-indicators/
7. School enrollment, secondary (% gross)WDI, https://datatopics.worldbank.org/world-development-indicators/
8. WB country income classificationWorld Bank, https://datahelpdesk.worldbank.org/knowledgebase/articles/906519-world-bank-country-and-lending-groups
9. HIV prevalence (% of population ages 15-49)WDI, https://datatopics.worldbank.org/world-development-indicators/ (from UNAIDS); The Global Burden of Disease Collaborative Network, Global Burden of Disease Study 2019 (GBD 2019) Results. Seattle, United States: Institute for Health Metrics and Evaluation (IHME), 2020, http://ghdx.healthdata.org/gbd-results-tool.
10. Per capita donor spending on health (non-PEPFAR) (constant $)OECD Creditor Reporting System database, https://stats.oecd.org/Index.aspx?DataSetCode=crs1
11. Per capita domestic health spending, government and private, PPP (current $)WDI, https://datatopics.worldbank.org/world-development-indicators/
12. Measles prevalence in under 5 population (measles immunization models only)IHME, http://ghdx.healthdata.org/gbd-results-tool
13. Diphtheria prevalence in under 5 population (DPT immunization models only)IHME, http://ghdx.healthdata.org/gbd-results-tool
14. Whooping cough prevalence in under 5 population (DPT immunization models only)IHME, http://ghdx.healthdata.org/gbd-results-tool
15. Tetanus prevalence in under 5 population (DPT immunization models only)IHME, http://ghdx.healthdata.org/gbd-results-tool
16. Hepatitis B prevalence in under 5 population (HepB3 immunization models only)IHME, http://ghdx.healthdata.org/gbd-results-tool

We explored several difference-in-difference model specifications, compared to an unadjusted model (see Table 3). Each specification controlled for numerous baseline variables that may be expected to influence the outcome of interest to help make the non-PEPFAR group more comparable to the PEPFAR group. Baseline means for outcome variables are provided in Table 4. Final results are presented in Tables 5-6 and are from model specification #3, and significance is only reported in the analysis for results at the p<0.001 level. Other model specifications generally produced similar results, with the exception of one model that included other donor spending on health as an annual variable; this may be due to the potential confounding of this measure with PEPFAR spending itself. The appendix provides trend data for each outcome variable in PEPFAR and comparison countries over the full study period.

Table 3: Model Specifications
ModelDifference-in Difference Specification
1Unadjusted model
2Includes baseline variables 1-9 (and an additional baseline variable for disease incidence, 12-16, depending on outcome measure)
3Includes baseline variables 1-11 (and an additional baseline variable for disease incidence, 12-16, depending on outcome measure)
4Includes baseline variables 1-9 (and an additional baseline variable for disease prevalence, 12-16, depending on outcome measure) and yearly per capita donor spending on health (non-PEPFAR) by all donors

Despite the strengths of the difference-in-difference design, there are limitations to this approach. While we adjusted for numerous baseline factors that could be correlated with our outcomes of interest, there may be other, unobservable factors that are not captured here. Similarly, while our baseline factors are also intended to adjust for selection bias, there may be other ways in which comparison countries differed from PEPFAR countries (and factors which influenced which countries received PEPFAR support), which could bias the estimates.

Table 4: Baseline Means, PEPFAR Countries, 2004
Outcome MeasureAll PEPFAR countriesCOP countriesNon-COP countriesHigh spendingMedium spendingLow spending
Child Mortality Rate78.997.968.999.571.865.4
Maternal Mortality Rate409.8497.5363.7519.6345.5364.4
Measles Immunization77.574.579.172.979.979.7
DPT Immunizations78.074.279.974.880.179.0
Hepatitis B Immunizations79.174.481.780.778.378.5
Anemia among women of reproductive age37.039.036.038.636.336.2
Newborns protected against tetanus75.775.675.875.178.374.2
Table 5: Estimates of PEPFAR’s Impact by Measure, 2004-2018 (Percent change from Mean)
Outcome MeasureAll PEPFAR countriesCOP countriesNon-COP countriesHigh spendingMedium spendingLow spending
Child Mortality Rate-34.7%***-36.4%***-33.6%***-40.5%***-30.4%***-32.4%***
Maternal Mortality Rate-24.6%***-26.3%***-23.5%***-26.1%***-29.0%***-18.9%***
Measles Immunization9.0%***10.0%***8.3%***9.5%***6.7%***10.8%***
DPT Immunizations11.3%***11.2%***11.1%***12.5%***8.7%***12.8%***
Hepatitis B Immunizations8.4%***18.3%***4.5%*9.8%**7.5%**6.9%*
Anemia among women of reproductive age-2.8%-4.1%*-2.1%-5.7%**-2.0%-0.7%
Newborns protected against tetanus6.9%***4.9%*8.4%***7.1%**6.3%**7.3%**
***p < 0.001   **p < 0.01 *p < 0.05
Table 6: Estimates of PEPFAR’s Impact by Measure, 2004-2018(Percentage point difference-in-difference from means; standard errors in parentheses)
Outcome MeasureAll PEPFAR countriesCOP countriesNon-COP countriesHigh spendingMedium spendingLow spending
Child Mortality Rate-27.383***-35.668***-23.168***-40.243***-21.807***-21.179***
(1.424)(1.694)(1.426)(1.898)(1.835)(1.855)
Maternal Mortality Rate-100.742***-130.898***-85.399***-135.678***-100.044***-68.936***
(15.131)(13.809)(15.927)(20.151)(19.495)(19.701)
Measles Immunization6.946***7.462***6.560***6.947***5.339***8.571***
(0.748)(0.894)(0.772)(1.006)(0.984)(0.983)
DPT Immunizations8.810***8.693***8.889***9.350***6.999***10.113***
(0.705)(0.830)(0.729)(0.946)(0.925)(0.925)
Hepatitis B Immunizations6.667***13.641***3.638*7.875**5.901**5.385*
(1.545)(2.102)(1.674)(2.436)(2.011)(2.220)
Anemia among women of repro. age-1.023-1.581*-0.740-2.184**-0.724-0.252
(0.550)(0.702)(0.556)(0.736)(0.712)(0.720)
Newborns protected against tetanus5.240***3.736*6.393***5.338**4.921**5.398**
(1.300)(1.472)(1.403)(1.534)(1.653)(1.606)
***p < 0.001   **p < 0.01 *p < 0.05

Jen Kates is with KFF. Gary Gaumer, William Crown, Dhwani Hariharan, and Allyala Nandakumar are with Brandeis University.

Appendix

Figure A1: Child Mortality Rate,1990-2018, PEPFAR and Comparison Countries
Figure A2: Maternal Mortality Rate, 2000-2017, PEPFAR and Comparison Countries
Figure A3: Measles Immunization,1990-2018, PEPFAR and Comparison Countries
Figure A4: DPT Immunizations,1990-2018, PEPFAR and Comparison Countries
Figure A5: Hep B Immunizations,1990-2018, PEPFAR and Comparison Countries
Figure A6: Newborns Protected Against Tentanus,1990-2018, PEPFAR and Comparison Countries

Endnotes

  1. State Department, PEPFAR Global Stakeholders Briefing, November 23, 2021. ↩︎
  2. See, for example: Shiffman J, “Has donor prioritization of HIV/AIDS displaced aid for other health issues?” Health Policy Plan, 2008 Mar, 23(2): 95-100; Lordan G, Tang KK, Carmignani F, “Has HIV/AIDS displaced other health funding priorities? Evidence from a new dataset of development aid for health,” Soc Sci Med, 2011 Aug, 73(3): 351-355; Barbiero VK, “Fulfilling the PEPFAR mandate: a more equitable use of PEPFAR resources across global health”, Glob Health Sci Pract, 2013 Nov 14,1(3): 289-293. ↩︎
  3. See, for example: Embrey M, Hoos D, Quick J, “How AIDS funding strengthens health systems: progress in pharmaceutical management”, J Acquir Immune Defic Syndr, 2009 Nov, 52 Suppl 1: S34-37. Walensky RP, Kuritzkes DR, “The impact of the President’s Emergency Plan for AIDS Relief (PEPFAR) beyond HIV and why it remains essential”, Clin Infect Dis, 2010 Jan 15, 50(2): 272-275; Rasschaert F, Pirard M, Philips MP, Atun R, Wouters E, Assefa Y, Criel B, Schouten EJ, Van Damme W, “Positive spill-over effects of ART scale up on wider health systems development: evidence from Ethiopia and Malawi”, J Int AIDS Soc, 2011 Jul 6,14 Suppl 1: S3. Bendavid E, Holmes CB, Bhattacharya J, Miller G, “HIV Development Assistance and Adult Mortality in Africa”, JAMA, 2012, 307(19): 2060-2067. ↩︎
  4. Kates J, Nandakumar A, Gaumer G, Hariharan D, Crown W , Wexler A, Oum S, Rouw A, Assessing PEPFAR’s Impact: Analysis of Mortality in PEPFAR Countries, KFF, 2021. Available at: https://modern.kff.org/global-health-policy/issue-brief/assessing-pepfars-impact-analysis-of-mortality-in-pepfar-countries/. ↩︎
  5. See, for example: Brugha R, Simbaya J, Walsh A, Dicker P, Ndubani P, “How HIV/AIDS scale-up has impacted on non-HIV priority services in Zambia”, BMC Public Health, 2010,10: 540; Kruk ME, Jakubowski A, Rabkin M, Elul B, Friedman M, El-Sadr W, “PEPFAR programs linked to more deliveries in health facilities by African women who are not infected with HIV”, Health Aff (Millwood), 2012 Jul 31(7): 1478-1488; Grépin KA, “HIV donor funding has both boosted and curbed the delivery of different non-HIV health services in sub-Saharan Africa”, Health Aff (Millwood), 2012 Jul 31(7):1406-1414; Luboga SA, Stover B, Lim TW, Makumbi F, Kiwanuka N, Lubega F, Ndizihiwe A, Mukooyo E, Hurley EK, Borse N, Wood A, Bernhardt J, Lohman N, Sheppard L, Barnhart S, Hagopian A, “Did PEPFAR investments result in health system strengthening? A retrospective longitudinal study measuring non-HIV health service utilization at the district level.” Health Policy Pla, 2016 Sep 31(7). ↩︎
  6. KFF, The U.S. Government and Global Maternal and Child Health Efforts, July 2021. Available at: https://modern.kff.org/global-health-policy/fact-sheet/the-u-s-government-and-global-maternal-and-child-health-efforts/ ↩︎
  7. PEPFAR, Leveraging American Rescue Plan Act Funding to Support HIV and COVID-19 Responses, January 2022. Available at: https://www.state.gov/wp-content/uploads/2022/01/PEPFAR-ARPA-Funding-Fact-Sheet_2022.pdf. ↩︎
  8. The program’s 2003 authorizing legislation states that the “magnitude and scope of the HIV/AIDS crisis demands a comprehensive, long-term, international response focused upon addressing the causes, reducing the spread, and ameliorating the consequences of the HIV/AIDS pandemic, including…. development of health care infrastructure and delivery systems through cooperative and coordinated public efforts and public and private partnerships”. See, Public Law 108–25—May 27, 2003, 117 STAT. 715. Available at: https://modern.kff.org/wp-content/uploads/2021/12/PEPFAR-Original-Legislation-2003-PL-108-25.pdf ↩︎
  9. The first strategy states that, “While mobilizing rapid scale-up for treatment availability, the Emergency Plan will also lay the foundation for sustainable high-quality treatment programs. This will be accomplished by: Strengthening national human resource capacity through health care worker recruitment and retention strategies, longer-term training, and technical assistance; Establishing, disseminating, and implementing treatment protocols; Developing the capacity of new partners; and Developing and strengthening health infrastructure.  See, President’s Emergency Plan for AIDS Relief: U.S. Five-Year Global AIDS Strategy, 2004. Available at: https://modern.kff.org/wp-content/uploads/2021/12/PEPFAR-Original-5-Year-Strategy-2004.pdf. ↩︎
  10. The 2008 reauthorization of PEPFAR added a new section on health systems strengthening. See, Public Law 110–293—JULY 30, 2008, section 204, 122 STAT. 2942. Available at: https://modern.kff.org/wp-content/uploads/2021/12/PEPFAR-Reauthorization-2008-PL-110-293.pdf. ↩︎
  11. State Department, PEPFAR 2009 Country Operational Guidance, May 2008. Available at: https://modern.kff.org/wp-content/uploads/2021/12/PEPFAR-FY2009-COP-Guidance-Final.pdf. ↩︎
  12. State Department, PEPFAR 2022 Country and Regional Operational Plan (COP/ROP) Guidance for all PEPFAR-Supported Countries, January 2022. Available at: https://www.state.gov/wp-content/uploads/2022/01/COP22-Guidance-Final_508-Compliant.pdf. ↩︎
  13. State Department, PEPFAR 2022 Country and Regional Operational Plan (COP/ROP) Guidance for all PEPFAR-Supported Countries, January 2022. Available at: https://www.state.gov/wp-content/uploads/2022/01/COP22-Guidance-Final_508-Compliant.pdf. ↩︎
  14. PEPFAR Solutions Platform, CFM: Improving mother-baby pair retention in integrated maternal and child health and HIV services in Eswatini, December 2018. Available at: https://www.pepfarsolutions.org/solutions/2018/12/19/cfm-improving-mother-baby-pair-retention-in-interated-maternal-and-child-health-and-hiv-services-in-eswatini?rq=eswatini. ↩︎
  15. State Department, Guidance for United States Government In-Country Staff and Implementing Partners for a Preventive Care Package for Children Aged 0-14 Years Old Born to HIV-Infected Mothers, #1, April 2006. Available at: https://web.archive.org/web/20070719203347/http://www.pepfar.gov/documents/organization/77005.pdf. ↩︎
  16. We examined two other maternal and child health measures for potential inclusion (receipt of prenatal care and modern contraceptive prevalence) but these did not meet the difference-in-difference parallel trend assumption (that in the absence of an intervention, the difference between the treatment and comparison group is constant over time) and therefore were not included in our final selection. ↩︎
  17. A subset of PEPFAR countries prepare annual Country Operational Plans (COPs). COPs are developed through a multi-stakeholder planning process, document planned investments and results, and serve as a basis for approval of final PEPFAR funding. ↩︎
  18. As measured by percentage point difference, see Table 6. ↩︎
  19. Analysis of data from the Institute for Health Metrics and Evaluation (IHME), GHDx, VizHub. Available at: https://vizhub.healthdata.org/gbd-compare/. Accessed February 17, 2022. ↩︎
  20. Say L, Chou D, Gemmill A, Tunçalp Ö, Moller AB, Daniels J, Gülmezoglu AM, Temmerman M, Alkema L. “Global causes of maternal death: a WHO systematic analysis.” Lancet Glob Health. 2014 Jun;2(6):e323-33. ↩︎
  21. Gertler, Paul J., Sebastian Martinez, Patrick Premand, Laura B. Rawlings, and Christel M. J. Vermeersch. 2016. Impact Evaluation in Practice, second edition. Washington, DC: Inter-American Development Bank and World Bank. Available at: https://openknowledge.worldbank.org/handle/10986/25030. ↩︎

2022 Changes to the Public Charge Inadmissibility Rule and the Implications for Health Care

Published: May 5, 2022

Introduction

Under longstanding immigration policy, federal officials can deny entry to the U.S. or adjustment to lawful permanent resident (LPR) status (i.e., a “green card”) to someone they determine to be a public charge. On September 9, 2022, the Biden Administration published new public charge inadmissibility regulations.1  that have largely codified 1999 field guidance governing public charge determinations and these regulations went into effect on December 23, 2022.2  The Biden Administration returned to use of this 1999 field guidance in March 2021, when it stopped applying public charge regulations implemented by the Trump Administration in 2019 that had newly considered the use of noncash assistance programs, including Medicaid, in public charge determinations.3 ,4  Under the final rule and the 1999 field guidance, the government will not consider use of noncash benefit programs, including Medicaid coverage, except for long-term institutionalization, when making public charge determinations. A primary stated aim of the final public charge rule is to address chilling effects of the 2019 rule that led many immigrant families, including citizen children in these families, to not seek assistance, including health coverage and care, for which they were eligible.5 ,6 ,7 

This brief provides an overview of the public charge rule and discusses its potential impacts for health coverage and care of immigrant families.

History of Public Charge Policies

The concept of denying entry to immigrants on the basis of becoming a “public charge” was first introduced into federal legislation as part of the Immigration Act of 1882, which was the first act to regulate immigration at the federal level.8  This Act permitted the government to prevent any person “unable to take care of himself or herself without becoming a public charge” from entering the country. A subsequent revised version of the Act allowed the government to deny entry to “paupers or persons likely to become a public charge,” and allowed the deportation of any who did become a public charge within a year. Certain immigrants, including refugees and asylees and other humanitarian immigrants, are exempt from public charge determinations under law.9  Immigration officials must consider, at a minimum, an individual’s age, health, family status, assets, resources, and financial status, and education and skills when making a public charge inadmissibility determination. However, federal legislation does not define who should be considered a public charge, leaving substantial discretion to immigration officials to make those determinations.

In 1999, the Department of Justice issued Field Guidance on Deportability and Inadmissibility on Public Charge Grounds. This field guidance defined a public charge as “an alien who has become or is likely to become primarily dependent on the federal government for subsistence as demonstrated by either (i) the receipt of public cash assistance for income maintenance or (ii) institutionalization for long-term care at government expense.“ In response to confusion about whether the use of Medicaid, the Children’s Health Insurance Program (CHIP), and other non-cash programs applied in public charge determinations, the guidance further clarified that immigration officers should not place any weight on the receipt of non-cash public benefits (other than institutionalization) with respect to determinations of admissibility or eligibility for adjustment to LPR status.

In 2019 the Trump Administration issued new regulations that broadened the scope of programs that the federal government would consider in public charge determinations to include previously excluded health, nutrition, and housing programs. The regulations also redefined a public charge as an “alien who receives one or more public benefits for more than 12 months in the aggregate within any 36-month period (such that, for instance, receipt of two benefits in one month counts as two months),” and defined public benefits to include federal, state, or local cash benefit programs for income maintenance and certain health, nutrition, and housing programs, including non-emergency Medicaid for non-pregnant adults, the Supplemental Nutrition Assistance Program (SNAP), and several housing programs. It also identified characteristics that would be considered as negative factors and heavily weighted negative factors that increase the likelihood of someone becoming a public charge, including prior receipt of public benefits (for more than 12 months within the prior 36 months) and having income below 125% of the federal poverty level (FPL) ($28,787 for a family of three as of 2022), as well as positive factors and heavily weighted positive factors that decrease the likelihood of someone becoming a public charge.

Impacts of the 2019 Trump Administration Changes

Research suggests that the 2019 Trump Administration changes to public charge policy and other immigration policy changes increased fears among immigrant families about participating in programs and seeking services, including health coverage and care.10  Although very few people subject to public charge determinations are eligible for the public programs listed in the 2019 rule due to the programs’ restrictions on eligibility for immigrants, the rule had much broader chilling effects on program participation across immigrant families.11  Fears and confusion related to the rule led to individuals forgoing enrollment in or disenrolling themselves and their children from programs. Prior KFF analysis estimated that the rule could lead to disenrollment of between 2.0 to 4.7 million Medicaid and CHIP enrollees who are noncitizens or citizens living in a family with a noncitizen if the rule led to disenrollment rates ranging from 15% to 35%. A 2021 KFF survey of Hispanic adults found that 1 in 4 potentially undocumented Hispanic adults and over 1 in 10 lawful permanent resident Hispanic adults reported that they or a family member did not participate in a government assistance program in the past three years  due to immigration-related fears (Figure 1).12  Similarly, a KFF survey of Asian community health center patients found that over 50% reported not having enough information about how recent immigration policy changes, including the public charge rule, impact them and their family, and 1 in 4 reported that they or a family member in their household avoided participating in a publicly-funded health, nutrition, or housing program in the past 12 months due to immigration-related fears.13 

One Quarter Of Potentially Undocumented Hispanic Adults Say They Or A Family Member Did Not Participate In An Assistance Program Due To Immigration Fears

Research also suggests that immigration-related fears have affected willingness to access COVID-19 vaccines. For example, KFF COVID-19 Vaccine Monitor survey data from May 2021 found that almost 4 in 10 unvaccinated Hispanic adults (rising to 58% of those who are potentially undocumented) said they were concerned that they may be required to provide a government-issued identification or Social Security number to get vaccinated and about one third (rising to 63% of the potentially undocumented) were concerned that getting the vaccine would negatively affect their own or a family member’s immigration status.

Overview of the 2022 Final Rule on Public Charge

The Biden Administration reversed the public charge policy changes implemented by the Trump Administration. Following an array of court actions challenging implementation of the 2019 Trump Administration changes to public charge policies, in March 2021, the Biden Administration filed motions asking the Supreme Court to dismiss the federal government’s appeal to maintain the rule and reinstated use of the 1999 field guidance to govern public charge determinations. It subsequently proposed a new public charge rule on February 24, 2022, which would largely codify the 1999 field guidance. The final rule was published on September 9, 2022 and went into effect on December 23, 2022.

A primary purpose of the 2022 public charge rule is to address the chilling effects of the 2019 rule on immigrant families’ participation in public programs, including Medicaid and CHIP. As mentioned in the preamble, “DHS believes that, in contrast to the 2019 Final Rule, this proposed rule would effectuate a more faithful interpretation of the statutory concept of ‘‘likely at any time to become a public charge’’; avoid unnecessary burdens on applicants, adjudicators, and benefits-granting agencies; and mitigate the possibility of widespread ‘‘chilling effects’’ with respect to individuals disenrolling or declining to enroll themselves or family members in public benefits programs for which they are eligible, especially by individuals who are not subject to the public charge ground of inadmissibility.” The preamble also discusses the 2019 rule’s chilling effects on immigrant families during the COVID-19 pandemic, contributing to ‘‘reduce[d] access to vaccines and other medical care, resulting in an increased risk of an outbreak of infectious disease among the general public,’’ which could perpetuate inequities in morbidity and mortality due to the pandemic.

The 2022 public charge rule returned to the 1999 public charge definition of someone who is likely to become primarily dependent on the federal government as demonstrated by the use of cash assistance programs for income maintenance or government-funded institutionalized long-term care, such as mental health or nursing home care (Table 1). Under the final rule, the federal government will only consider cash assistance programs, including Supplemental Security Income (SSI), Temporary Assistance for Needy Families, and state, local, and Tribal cash assistance to pay for basic needs such as rent, food, and utilities. It also will consider “long-term government assistance for institutionalization,” including that provided in a nursing home or mental health institution. Long-term institutionalization at government expense would be the only category of Medicaid-funded services to be considered in public charge determinations. The 2022 rule clarifies that “long-term institutionalization” excludes institutionalization for short periods for rehabilitation and institutionalization that violates federal discrimination laws (such as the Americans with Disabilities Act).14  The rule also specifies that it excludes receipt of home and community-based services, including those provided through Medicaid. Moreover, to mitigate chilling effects, the 2022 rule clarifies that applying for a public benefit, being approved for benefits in the future, assisting someone else to apply for benefits, or being in a household or family with someone who receives benefits would not constitute receipt of public benefits for consideration of public charge. This represents a change from the 1999 Field Guidance, which allowed for consideration of a noncitizen’s family’s reliance on public cash benefits as the sole means of support for the family.

The rule applies a forward-looking test to public charge determinations, where adjudicators predict whether a person could become a public charge in the future based on present factors including age, family status, income and resources, education, and health status. Under the 2022 rule, the aforementioned statutory minimum factors must be analyzed in their totality, and no single factor, other than the lack of a sufficient Affidavit of Support, when required, would control the decision. Under the 2019 rule, public charge determinations also were based on a totality of circumstances, but the rule further specified that certain factors should we weighted as negative or positive or heavily weighted negative or positive factors in determinations. For example, officials were directed to consider receiving public benefits for more than 12 months in a 36-month period as a heavily weighted negative factor. The 2022 rule eliminates this practice of separately defining each factor and assigning its weight, noting that, “each inadmissibility determination must be individualized and based on the evidence presented in the specific case, and the relative weight of each factor and associated evidence is necessarily determined by the presence or absence of specific facts. Consequently, the designation of some factors as always ‘‘heavily weighted’’ suggested a level of mathematical precision that would be unfounded and inconsistent with the long-standing standard of considering the totality of the individual’s circumstances.” In addition, under the 2022 public charge rule, U.S. Citizenship and Immigration Services officers are required to articulate a reason for every public charge determination.

Table 1: Public Charge Definition and Programs Considered Under 2019 Rule and 2022 Final Rule
2019 Rule2022 Final Rule
Public Charge DefinitionMore likely than not at any time in the future to receive one or more public benefits for more than 12 months in the aggregate within any 36-month period (such that, for instance, receipt of two benefits in one month counts as two months).Likely to become primarily dependent on the federal government as demonstrated by use of cash assistance programs or government-funded institutionalized long-term care.
Programs Considered in Public Charge Determinations
  • SSI
  • TANF
  • Federal, state, or local cash benefit programs for income maintenance
  • Non-emergency Medicaid for non-pregnant adults over age 21
  • SNAP food assistance
  • Housing assistance
  • SSI
  • TANF
  • State/local cash assistance programs
  • Long-term institutionalization at government expense (including Medicaid coverage for institutional services)
Heavily Weighted Negative Factors
  • Has received one or more public benefits for more than 12 months in the aggregate within the prior 36 months
  • Not a full-time student and is authorized to work, but is unable to demonstrate employment, recent employment, or a reasonable prospect of future employment
  • Has a medical condition that requires extensive treatment or institutionalization and is uninsured and does not have sufficient resources to pay for medical costs related to the condition
  • Previously found inadmissible or deportable on public charge grounds
Not specified. Statutory minimum factors (age, family status, health, education, income and resources) must be considered in their totality.
Heavily Weighted Positive Factors
  • Household has financial assets/resources of at least 250% of the FPL
  • Authorized to work or employed with an income of at least 250% of the FPL
  • Individual has private insurance that is not subsidized by Affordable Care Act tax credits

Implications

The Biden Administration's changes to public charge policies are intended to reduce fears of accessing programs, but it will likely require sustained community-level efforts to rebuild trust and reduce fears among families. Prior experience suggests that outreach and education from trusted members of the community will be important for helping to alleviate fears and that direct one-on-one assistance will be key for facilitating enrollment of eligible people into programs for which they and their children are eligible, including Medicaid and CHIP.15  The Biden Administration recently increased funding for Navigators to help eligible individuals enroll in Marketplace, Medicaid, and CHIP coverage with a focus on individuals with limited English proficiency (LEP), communities of color, and rural areas, which may facilitate increased enrollment of eligible individuals in immigrant families.16  However, broader multilingual outreach efforts focused on helping families understand the changes to the rule will also likely be important.

Even with community level outreach and enrollment efforts, some families may remain fearful and confused about the policy. For example, in earlier research, some families have expressed concerns that rules may change in the future. Moreover, some families may remain confused about the policy. In particular, the continued inclusion of long-term institutional care covered by Medicaid in public charge determinations prevents clear and simple messaging that all Medicaid coverage is excluded from public charge determinations. This consideration of long-term institutional care also disproportionately affects people with disabilities and older adults, who are more likely to use long-term institutionalization services.

Increased enrollment of eligible uninsured immigrants may help to close gaps in health coverage for immigrant families, but many uninsured immigrants remain ineligible for coverage. Overall, noncitizen immigrants are significantly more likely than citizens to be uninsured.17  In 2020, among the nonelderly population, 26% of lawfully present immigrants and about four in ten (42%) undocumented immigrants were uninsured compared to less than one in ten (8%) citizens. Moreover, among citizen children, those with at least one noncitizen parent were significantly more likely to be uninsured as those with citizen parents (10% vs. 4%). Most (81%) uninsured lawfully present immigrants are eligible for a coverage option under the ACA but are not enrolled, so facilitating enrollment of eligible individuals may help to narrow these coverage gaps. However, other immigrants, including undocumented immigrants, remain ineligible for federal health coverage options, and will continue to face increased challenges accessing health care.

  1. U.S. Citizenship and Immigration Services Department of Homeland Security (2022), “Public Charge Ground of Inadmissibility,” https://www.federalregister.gov/documents/2022/09/09/2022-18867/public-charge-ground-of-inadmissibility, accessed September 13, 2022. ↩︎
  2. Department of Justice (1999), “Field Guidance on Deportability and Inadmissibility on Public Charge Grounds, https://www.govinfo.gov/content/pkg/FR-1999-05-26/pdf/99-13202.pdf, accessed April 15, 2022. ↩︎
  3. U.S. Citizenship and Immigration Services Department of Homeland Security (2019), “Inadmissibility on Public Charge Grounds,” https://www.govinfo.gov/content/pkg/FR-2019-08-14/pdf/2019-17142.pdf, accessed April 15, 2022. ↩︎
  4. Kaiser Family Foundation (KFF) (2019), “Changes to “Public Charge” Inadmissibility Rule: Implications for Health and Health Coverage,” https://modern.kff.org/racial-equity-and-health-policy/fact-sheet/public-charge-policies-for-immigrants-implications-for-health-coverage/#:~:text=In%20August%202019%2C%20the%20Trump,entry%20into%20the%20U.S.%20or, accessed April 22, 2022. ↩︎
  5. Artiga, S., Garfield, R., & Damico, A. (2019), “Estimated Impacts of Final Public Charge Inadmissibility Rule on Immigrants and Medicaid Coverage,” https://modern.kff.org/report-section/estimated-impacts-of-final-public-charge-inadmissibility-rule-on-immigrants-and-medicaid-coverage-key-findings/, accessed April 15, 2022. ↩︎
  6. Artiga, S., Damico, A., & Garfield, R. (2019), “Potential Effects of Public Charge Changes on Health Coverage for Citizen Children,” https://modern.kff.org/racial-equity-and-health-policy/issue-brief/potential-effects-of-public-charge-changes-on-health-coverage-for-citizen-children/, accessed April 15, 2022. ↩︎
  7. Tolbert, J., Artiga, S., & Pham, O. (2019), “Impact of Shifting Immigration Policy on Medicaid Enrollment and Utilization of Care among Health Center Patients,” https://modern.kff.org/medicaid/issue-brief/impact-of-shifting-immigration-policy-on-medicaid-enrollment-and-utilization-of-care-among-health-center-patients/, accessed April 22, 2022. ↩︎
  8. University of California, Berkeley (2020), “The History of the Public Charge and Public Health,” https://pha.berkeley.edu/2020/12/29/the-history-of-the-public-charge-and-public-health/, accessed April 21, 2022. ↩︎
  9. U.S. Citizenship and Immigration Services (2021), “Public Charge Fact Sheet,” https://www.uscis.gov/archive/public-charge-fact-sheet, accessed April 22, 2022. ↩︎
  10. Artiga, S., & Ubri, P. (2017), “Living in an Immigrant Family in America: How Fear and Toxic Stress are Affecting Daily Life, Well-Being, & Health,” https://modern.kff.org/racial-equity-and-health-policy/issue-brief/living-in-an-immigrant-family-in-america-how-fear-and-toxic-stress-are-affecting-daily-life-well-being-health/, accessed April 22, 2022. ↩︎
  11. Migration Policy Institute (2020), “The Public-Charge Rule: Broad Impacts, But Few Will Be Denied Green Cards Based on Actual Benefits Use,” https://www.migrationpolicy.org/news/public-charge-denial-green-cards-benefits-use, accessed April 22, 2022. ↩︎
  12. Hamel, L., Artiga, S., Safarpour, A., Stokes, M., & Brodie, M. (2021), “KFF COVID-19 Vaccine Monitor: COVID-19 Vaccine Access, Information, and Experiences Among Hispanic Adults in the U.S.,” https://modern.kff.org/coronavirus-covid-19/poll-finding/kff-covid-19-vaccine-monitor-access-information-experiences-hispanic-adults/, accessed April 15, 2022. ↩︎
  13. Artiga, S., Hill, L., Corallo, B., & Tolbert, J. (2021), “Asian Immigrant Experiences with Racism, Immigration-Related Fears, and the COVID-19 Pandemic,” https://modern.kff.org/report-section/asian-immigrant-experiences-with-racism-immigration-related-fears-and-the-covid-19-pandemic-findings/, accessed April 15, 2022. ↩︎
  14. U.S. Citizenship and Immigration Services Department of Homeland Security (2022), “Public Charge Ground of Inadmissibility,” https://www.dhs.gov/sites/default/files/2022-02/22_0217_nprm-public-charge_0.pdf, accessed April 26, 2022. ↩︎
  15. Kaiser Family Foundation (KFF) (2011), “Connecting Eligible Immigrant Families to Health Coverage and Care: Key Lessons from Outreach and Enrollment Workers,” https://modern.kff.org/racial-equity-and-health-policy/issue-brief/connecting-eligible-immigrant-families-to-health-coverage/, accessed April 22, 2022. ↩︎
  16. Centers for Medicare and Medicaid Services (2021), “Biden-Harris Administration Quadruples the Number of Health Care Navigators Ahead of Healthcare.Gov Open Enrollment Period,” https://www.cms.gov/newsroom/press-releases/biden-harris-administration-quadruples-number-health-care-navigators-ahead-healthcaregov-open, accessed April 15, 2022. ↩︎
  17. Kaiser Family Foundation (KFF) (2022), “Health Coverage of Immigrants,” https://modern.kff.org/racial-equity-and-health-policy/fact-sheet/health-coverage-of-immigrants/#:~:text=In%202020%2C%20among%20the%20nonelderly,in%20ten%20(8%25)%20citizens., accessed April 15, 2022. ↩︎

Understanding Disparities and Discrimination Faced by Asian and NHOPI People

Author: Drishti Pillai
Published: May 5, 2022

Asian, Native Hawaiian, and Other Pacific Islander (NHOPI) people are a diverse and growing population in the United States. Asian people are the fastest-growing racial or ethnic group in the United States, with their population increasing 81% from 10.5 million to 18.9 million between 2000 and 2019.

Given the diversity of the population, broad data on Asian and NHOPI people often mask underlying disparities among subgroups of the population. For example, there is a nearly 8-fold difference in uninsured rates among Asian and NHOPI subgroups, ranging from 4% for Japanese people to 32% for Mongolian people. Uninsured rates also vary by citizenship status among Asian and NHOPI people, with noncitizens more likely to lack coverage across groups.

Data are also often missing to identify and address disparities. Enhancing data to better understand the experiences of Asian and NHOPI people is of particular importance at this time, given growing levels of racism and discrimination amid the COVID-19 pandemic, including a significant uptick in hate incidents against Asian and NHOPI people. A KFF survey of Asian community health center patients found that 1 in 3 respondents experienced more discrimination in 2021 than when the COVID-19 pandemic began and that many reported negative experiences due to their race or ethnicity, ranging from receiving poor service to being verbally or physically attacked.

Source

KFF analysis of 2019 American Community Survey 1-yr Public Use Microdata Sample, 2021 KFF survey of Asian community health center patients

Abortion at SCOTUS: Dobbs v. Jackson Women’s Health

Authors: Laurie Sobel, Amrutha Ramaswamy, and Alina Salganicoff
Published: May 4, 2022

Issue Brief

Updated as of July 7, 2022

The Supreme Court Overturned Roe v. Wade

On June 24, 2022, the Supreme Court issued its decision in Dobbs v, Jackson Women’s Health, overturning Roe v. Wade and Planned Parenthood v. Casey and eliminating the federal standard regarding abortion access. For the current status of abortion access in the United States and additional resources please see our abortion dashboard.

Abortion is among the most contentious issues in the country today. On December 1st, the Supreme Court will hear the first abortion case since Justice Amy Coney Barrett was seated and cemented a solid 6-3 conservative majority on the bench. The case under consideration, Thomas E. Dobbs, State Health Officer of the Mississippi Department of Health v. Jackson Women’s Health Organizationinvolves a Mississippi law banning all abortions over 15 weeks gestational age except in medical emergencies and in the case of severe fetal abnormality. In this case, Mississippi is asking the Court to overturn the long-standing precedent of Roe v. Wade. While the Supreme Court has considered other abortion cases involving state regulations, this is the first case that the high court has taken in which a state is directly asking the Court to overturn the constitutional right to abortion. This issue brief provides background on the legal challenges to the Mississippi law in the context of the Supreme Court abortion precedents, addresses the intersections with the litigation that has arisen from S.B. 8, the Texas 6-week abortion ban, and explains the potential outcomes and how they could impact access to abortion around the country.

Mississippi Law and Lower Court Decisions

In 2018, Mississippi enacted HB 1510, the Gestational Age Act, which bans all abortions after 15 weeks since the first day of the last menstrual period (LMP) except in medical emergencies and in cases of severe fetal abnormality, and without an exception for pregnancies resulting from rape or incest. Mississippi is asking the Court to allow states to ban abortions at a point much earlier than the current viability standard established by Roe v. Wade, a point where the pregnancy cannot survive outside of the pregnant person’s uterus, typically understood to be between 24 and 28 weeks of pregnancy. On March 19, 2018, the same day the Governor signed the bill, and when it was set to take effect, Jackson Women’s Health, the only abortion provider in Mississippi, challenged the law in federal court. The US District Court for the Southern District of Mississippi and then the 5th Circuit Court of Appeals both struck the law down as unconstitutional. The State then appealed to the Supreme Court, which accepted the case for review this term.

The Supreme Court accepted this case to review “whether all pre-viability prohibitions on elective abortions are unconstitutional.”

Mississippi is not contending that 15 weeks gestation is a point in pregnancy when a fetus is viable outside the womb, but rather is asking the Supreme Court to either overturn the constitutional right to abortion or to allow states to ban some pre-viability abortions if it does not “burden a substantial number of women.” Although Roe v. Wade does not permit states to ban pre-viability abortions, some state laws that have pre-viability bans later in pregnancy have not been challenged in court. For example, in 2014 Mississippi passed a law banning abortions at 20 weeks LMP with an exception for medical emergency and a fatal fetal anomaly. This law has not been challenged and is currently in effect. Jackson Women’s Health, the only abortion provider in Mississippi, only provides abortions up to 16 weeks. Sixteen states have laws banning abortion at 22 weeks in effect. None of these laws have been challenged. North Carolina’s law banning abortion after 20 weeks was challenged and struck down as unconstitutional by the 4th Circuit Court of Appeals.

Background on Previous Court Decisions on Abortion

To understand this case, it is important to review the Supreme Court’s prior decisions, particularly those that have resulted in the Court ruling on how an individual’s constitutional right to abortion is balanced with a state’s right to protect unborn life. In 1973, the Supreme Court’s Roe v. Wade decision established the constitutional right to abortion before the pregnancy is considered to be viable, that is, can survive outside of a pregnant person’s uterus. The Supreme Court has grappled with how to best balance a state’s legitimate interest in protecting the health of pregnant people, and the “potentiality of human life” with a person’s constitutional right to privacy, which includes the right to terminate a pregnancy. As a result of the Court’s decision in Roe, states have not been permitted to issue bans on abortion before viability.

Supreme Court’s Explanation of Undue Burden in Casey v. Planned Parenthood

“A finding of an undue burden is a shorthand for the conclusion that a state regulation has the purpose or effect of placing a substantial obstacle in the path of a woman seeking an abortion of a nonviable fetus. Under the current precedent, a statute with this purpose is invalid because the means chosen by the State to further the interest in potential life must be calculated to inform the woman’s free choice, not hinder it.”

However, the Supreme Court’s 1992 decision for Planned Parenthood v. Casey established the right of states to regulate abortion services before viability as long as the regulation does not place an “undue burden” on women seeking an abortion.

“Undue burden” is a shorthand used when a state regulation has been found to have the purpose or effect of placing a substantial obstacle in the path of a person seeking an abortion. The Casey Court stated that the proper standard is “whether in a large fraction of the cases in which [the restriction] is relevant, it will operate as a substantial obstacle to a woman’s choice to undergo an abortion.” This concept of the “large fraction of cases” was addressed and reinforced in the 2016 Supreme Court case Whole Woman’s Health v. Hellerstedt in which the denominator in the undue burden question was defined as “the number of [patients] for whom the restriction is an actual rather than irrelevant restriction.”

Since the Casey decision in 1992, many states have enacted a wide range of restrictions such as counseling, ultrasound and waiting period requirements, parental notification and consent requirements, restrictions on insurance coverage for abortion, and regulations specific to facilities and clinicians providing abortions. In Whole Woman’s Health, the Supreme Court clarified that abortion restrictions are only constitutional if they further a valid state interest and have benefits that outweigh the burdens placed on women seeking abortions. The benefits and burdens of the laws must be based on credible evidence. The Court emphasized that the previous standard established in Planned Parenthood of Southeastern PA. v. Casey “[u]necessary health regulations that have the purpose or effect of presenting a substantial obstacle to a woman seeking an abortion impose an undue burden on the right.”

The rule announced in Casey “requires that courts consider the burdens a law imposed on abortion access together with the benefits those laws confer.” However, in his concurrence in June Medical Services, Chief Justice Roberts signaled that the standard by which the Court will evaluate an undue burden is in flux. Chief Justice Roberts suggests that the Court should analyze the constitutionality of abortion laws by asking whether the law places a substantial obstacle in the path of a woman seeking an abortion, without balancing the burdens with the benefits of the law, as the Court did in Whole Woman’s Health. In future cases, under a new standard that does not review whether the state law in question yields any benefits, the Court may be willing to allow states to enact additional restrictions similar to admitting privileges, with no evidence that the restrictions benefit people seeking abortions, as long as the restriction does not place a substantial obstacle. In addition, the Court may disavow the precedent also set in Whole Woman’s Health that courts can look beyond the legislature’s declaration of benefit to women and review medical and scientific evidence about whether the law provides a benefit to women.

Mississippi is Asking the Supreme Court to Overturn the Constitutional Right to Abortion Established by Roe v. Wade

Mississippi contends that Roe and Casey were both decided incorrectly. As argued in Mississippi’s brief to the Supreme Court: “Roe and Casey have proven hopelessly unworkable. Heightened scrutiny of abortion restrictions has not promoted administrability or predictability. And heightened scrutiny of abortion laws can never serve those aims. Because the Constitution does not protect a right to abortion, it provides no guidance to courts on how to account for the interests in this context.”

Roe v. Wade established that states could ban abortion at viability

“With respect to the State’s important and legitimate interest in potential life, the “compelling” point is at viability. This is so because the fetus then presumably has the capability of meaningful life outside the mother’s womb. State regulation protective of fetal life after viability thus has both logical and biological justifications. If the State is interested in protecting fetal life after viability, it may go so far as to proscribe abortion during that period, except when it is necessary to preserve the life or health of the matter.”

Mississippi contends that the Court’s viability standard set in Roe v. Wade is unsatisfactory and does not allow the state to protect unborn life or maternal health. The state claims its interest in protecting potential life and women’s health is the same before and after viability, but the standard set in Roe prohibits it from protecting life before viability. Mississippi also contends that Roe is outdated: “[N]umerous laws enacted since Roe— addressing pregnancy discrimination, requiring leave time, assisting with childcare, and more—facilitate the ability of women to pursue both career success and a rich family life.” Furthermore, Mississippi argues abortion is not necessary for women to participate equally in economic life because contraception is widely available. However, as Jackson Women’s Health states in their brief, contraception is not universally available and is not fail-safe. “Further, many indicators of gender equality continue to lag behind the ideal Mississippi imagines. Pregnancy and caregiver discrimination persist and remain difficult to root out.”

Jackson Women’s Health contends that viability is the central principle in Roe and Casey and there is no basis for overruling the viability line. Mississippi’s argument “was raised in Casey, and the Court gave careful regard to the state’s asserted interests, including in fetal life. Having considered each of the state’s arguments, the Court reaffirmed that the viability line strikes a principled and workable balance between individual liberty and any countervailing government interests.” Under the legal principle of stare decisis, the Court is obligated to uphold precedents when there is no factual or legal basis to overrule them.

As an alternative to overturning the constitutional right to abortion, Mississippi is asking the Court to remove viability as the line for when abortion can be banned

Mississippi is asking the Court to allow states to ban abortions at a point much earlier than the current viability standard established by Roe v Wade, a point where the pregnancy cannot survive outside of the pregnant person’s uterus. While the undue burden standard established in Casey has been applied to abortion regulations, it has never been applied to pre-viability abortion bans. Mississippi is asking the Court to apply the undue burden standard in this case and conclude that the law is constitutional. Mississippi claims the 15-week ban does not impose a substantial obstacle to “a significant number of women” seeking abortions. Jackson Women’s Health, the only abortion provider in Mississippi, provides abortions up to 16 weeks. Mississippi cites that at most 4.5% of the women who obtain abortions from Jackson Women’s Health did so after 15 weeks gestation.

In their brief, Jackson Women’s Health contends that the “State’s brute number crunching is at odds with the recognition of constitutional rights in general. The very essence of a constitutional right is that the government cannot outright prohibit a certain subset of people no matter how small from exercising that right.” “For most of the tens of thousands of people each year who obtain an abortion after 15 weeks, however, accessing abortion care earlier is not possible. More than half of second-trimester abortion patients miss the window for a first-trimester abortion simply because of delays in recognizing or suspecting they are pregnant. Late recognition of pregnancy is especially common for young people, people using contraceptives, or people who are pregnant for the first time. Others who seek abortion in the second trimester do so because health conditions develop or worsen as the pregnancy progresses, or because of significant changes in their life over the course of their pregnancy. Second-trimester patients may also not seek abortion care earlier because they are taking time to consult with family or a health professional before making this deeply personal decision.”

If the Court adopts Mississippi’s contention that the undue burden standard can be applied to a pre-viability ban, and that the law is constitutional if does not impact a substantial number of people seeking abortions in Mississippi, the Court will need to estimate how many people the ban does impact. This estimate, however, could be derived in several different ways. In fact, the share of women in Mississippi who get abortions after 15 weeks is very likely an undercount of Mississippi residents who obtained abortions after 15 weeks. This is because there are no providers in Mississippi who offer abortion services after 16 weeks, and therefore must travel out of state to obtain their abortions. According to the CDC, many of the patients who obtain abortions in the states that border Mississippi –16% of abortions in Alabama and in Louisiana, and 19% of abortions in Tennessee — were obtained by out-of-state residents. If any of these patients came from Mississippi, they would not be reflected in the Mississippi abortion statistics.

Potential Outcomes

At stake is whether the Court will continue to uphold the standard it set with the Roe v Wade and Planned Parenthood v. Casey decisions. Over the years, subsequent rulings have expanded the ability of states to impose restrictions on pre-viability abortions, but this case could change the viability standard and permit states to ban some or all pre-viability abortions. If the Supreme Court allows the Mississippi law to stand, no matter the rationale they use to arrive at that decision, it will be effectively overturning Roe and Casey. While the Court may try to frame their ruling as in line with precedent, there is likely no way for the Court to uphold a state’s pre-viability ban without overruling years of precedent. Below we explain three possible outcomes of this case.

Figure 1: Abortion and SCOTUS: What might a conservative majority do to abortion rights?

First Possible Decision: The Court Overrules Roe v. Wade Allowing States to Ban All Abortions

If the Supreme Court overturns Roe v. Wade and allows states to ban or restrict abortion before viability, 17 states have laws that are intended to immediately ban abortion; four of these states have a law banning abortion on the books that predates Roe v. Wade and thirteen states have expressed the intent to limit abortion to the maximum extent permitted by federal law (Figure 2). Sixteen states and DC have laws protecting abortion access. Eight states (see Table 1) have State Supreme Court decisions recognizing the right to abortion under the state constitution. Three states (GA, OH and SC) have 6 week bans that courts have temporarily blocked but could become effective soon after a decision overruling Roe v. Wade. A Michigan judge has temporarily blocked the enforcement of the pre-Roe ban while litigation challenging it proceeds.

If the Supreme Court overturns Roe, then some of these states and others without laws might pass state laws banning pre-viability abortions. This would likely lead to a raft of new cases that would be challenged in the state courts. It would be up to the State Supreme Court to either re-affirm the previous decision that the state constitution protects abortion or overrule that decision.

19 States Would Effectively Ban Abortion if Roe v. Wade is Overturned

Second Possible Decision: The Court Overturns Roe v. Wade establishing a new standard for the circumstances in which states may ban pre-viability abortions

The Supreme Court has never evaluated a state ban on abortions pre-viability using the undue burden standard. If the Court establishes a new standard to evaluate an undue burden and does not allow for states to ban all abortions, the Court’s decision may open the door to new state gestational bans as well as new state regulations. This could create the need for the Court to establish the parameters for a fact-based inquiry for each state’s gestational ban to determine how many women seeking abortions would be burdened. If the Court only looks at the number of women who have successfully accessed abortion services in states with many abortion restrictions, they may be undercounting the number of women who sought abortion services and went out of state or were ultimately unable to obtain abortions. Depending on how the Court rules, we may see a flood of future cases make their way to the Supreme Court to try to test how early in pregnancy states can ban abortions in the absence of a full ban. Ten states have passed six-week bans, and two others have passed laws fully banning all abortions at conception.

Third Possible Decision: The Court Re-affirms Roe and Casey

While it is impossible to predict the outcome of a Supreme Court case, the Court appears unlikely to re-affirm Roe and Casey, given the 6 to 3 conservative majority. The Supreme Court’s willingness to hear this case, rather than affirming the lower court’s ruling without review, may signify that the Court is ready to modify the long-standing precedent that states may not ban abortions before viability. However, because only 4 justices need to vote to review a case, sometimes the Court will accept a case and then affirm the lower court’s decision.

There are other indications that the Court might be poised to change the abortion precedents. Most recently, in a 5-4 decision the Court refused to block a Texas law, effectively halting most abortion policies in the state, while the litigation challenging the Texas law works its way through the courts.

How does Texas SB8 relate to the Dobbs Case?

While the Dobbs case made its way to the Supreme Court through the usual appeal process and request for the Court to hear the case, the Court also issues emergency orders in what is called the “shadow docket.” In these situations, the Court does not hear an oral argument. In May of 2021, Texas enacted a law, effective September 1st, 2021, banning nearly all abortions after 6 weeks, deputizing individuals to enforce the law by suing any person that provides, or helps a person obtain an abortion after 6 weeks. Abortion clinics in Texas sued on the constitutionality of this law, and the case made its way to the 5th Circuit Court of Appeals, which refused to block the law. The clinics then brought an emergency request to the Supreme Court to block the law which the Court denied on procedural grounds. While the impact of the Court allowing the law to go into effect is that people in Texas cannot access abortion, the Court wrote: “this order is not based on any conclusion about the constitutionality of Texas’s law, and in no way limits other procedurally proper challenges to the Texas law, including in Texas state courts.” On October 22, 2021, the Court denied the request from the US Department of Justice to block the law. The Court heard oral argument on November 1, 2021 to consider the case brought by the Texas clinics challenging the unique enforcement provisions, and the ability of the Department of Justice to challenge the law, but not to consider the constitutionality of banning abortion pre-viability.

While there is much speculation about the Court’s decisions to allow the Texas law to take effect and remain in effect, even though it bans nearly all abortions, predicts the Court’s decision in Dobbs, the Court was not directly considering the constitutionality of pre-viability abortion bans as the Court will have to do in Dobbs.

Looking Ahead

The Supreme Court is hearing Dobbs at a time when state and federal actions have raised the stakes on the future of abortion access. In 2021, 19 states have enacted over 100 restrictions, including 12 abortion bans. People in Texas are effectively living in a post-Roe state where there is essentially no access to abortion. President Biden has endorsed, and the House of Representatives has passed The Women’s Health Protection Act. Although unlikely to secure enough votes to pass the US Senate, this law would statutorily protect a person’s ability to seek an abortion and a health care providers’ right to provide abortion. Access to safe legal abortions will likely increasingly depend on where you live. If the Supreme Court allows states to ban abortion pre-viability, then the national divide in access to abortion care will be intensified. The significance of this case and the possible ramifications has prompted a broad range of abortion rights advocates and opponents alike to weigh into whether the Court should overturn Roe by submitting amicus briefs. The Court’s decision is expected in June 2022, just 6 months before the Congressional mid-term election.

Table 1: State Policies and Court Decisions Regarding the Legal Status of Abortion

Table

State Laws on Abortion Protection/ Intent to Ban

State Policies and Court Decisions Regarding the Legal Status of Abortion
News Release

1 in 5 Parents of Children Under 5 Intend to Get Them a COVID-19 Vaccine Right Away Once Eligible; Most Say Approval Delays Have Not Shaken Their Confidence in Vaccine’s Safety and Effectiveness

Few Workers Feel Unsafe at Work, But Black, Hispanic and Low-Income Workers are Much Less Likely to Feel “Very Safe” and More Likely to Wear Masks on the Job

Published: May 4, 2022

About a Third of the Public Thinks the Nation is Facing a New COVID-19 Wave as Cases Rise

About a fifth (18%) of parents with children under age 5 say they intend to get their child vaccinated “right away” once federal regulators authorize its use for their child’s age group, the latest KFF COVID-19 Vaccine Monitor survey shows. Another 38% say they would want to “wait and see” how it works for other young children before getting their child vaccinated.

The survey was fielded just prior to news about Moderna’s request for the Food and Drug Administration (FDA) to authorize their vaccine’s use in children under 5. The results suggest that there would be an initial vaccination surge once approved, as occurred when other age groups first became eligible. Even so, significant shares of these parents are reluctant, with 27% saying they will “definitely not” get their child vaccinated and 11% saying they would do so “only if required” for school or daycare.

Earlier this year, the FDA delayed potential authorization of a vaccine for use in children under age 5 to wait for more data about its safety and effectiveness. Nearly two-thirds (64%) of parents with young children say the FDA’s delay has not affected their confidence in the safety the vaccines for this age group. Smaller shares say the delay made them more (22%) or less (13%) confident.

With COVID-19 restrictions fading from restaurants, retail stores and other venues, and many workers returning to their offices and job sites, most (88%) workers who work outside their homes say they feel either “very” (55%) or “somewhat” (33%) safe from COVID-19 while at their job sites.

There are big differences by race, ethnicity, and income. Much smaller shares of Black (31%) and Hispanic (48%) workers than White (63%) workers say they feel “very safe.” Similarly, workers with incomes under $40,000 annually are also less likely than those with higher incomes to say they feel “very safe” (41% vs. 57%).

While mask requirements fade in most settings, more than a third (38%) of workers say they wore a mask all or most of the time while indoors at their workplace in the past month, while 43% say they never wore one. In addition, 3 in 10 (30%) say that all or most of their co-workers regularly wear masks.

Most Black (64%) and Hispanic (52%) workers, and most of those with lower incomes (61%), say they wore a mask every or most of the time at work in the past 30 days. These workers are also more likely than their counterparts to say that all or most of their coworkers regularly wear masks too.

“America’s workers are trying to put the pandemic behind them, but that’s tougher for Black, Latino and low-income workers who are much less likely to feel very safe at work and are more likely to wear masks,” KFF President and CEO Drew Altman said.

There’s a similar pattern in the views of parents about the safety of their children’s schools.

Most (84%) parents say they feel their children are “very” (44%) or “somewhat” (40%) safe from COVID-19 while at school, though fewer Black and Hispanic parents (33%) than White parents (52%) say that they feel their child is “very safe.”

Three-quarters (75%) of parents now say their children’s schools do not have any mask requirements for students and staff, a major shift from the start of the school year in September when 69% of parents said their school required universal masking.

About four in ten parents (41%) say their child regularly wears a mask at school, either voluntarily or because their school requires it. Black and Hispanic parents are more than twice as likely as White parents to say their child usually wears a mask (70% vs. 26%).

About a Third of the Public Thinks the Nation is Facing a New COVID-19 Wave as Cases Rise

As COVID-19 cases have begun to rise nationally in recent weeks, a little more than a third (35%) of adults think there is a new wave of COVID-19 infections hitting the country. Most say either that there is not a new wave (50%) or that they aren’t sure if there is (14%).

People’s perceptions on this question seem to reflect their view of what is happening among their own family and friends. Most (62%) say that they have seen fewer cases in the past 30 days among people than know. Half (51%) also say that the people they know who got COVID-19 recently are experiencing less severe symptoms than those infected in previous waves.

Vaccination and Booster Rates for Adults and Eligible Children Are Little Changed So Far This Year

The latest survey shows that vaccination and booster rates among adults and eligible children have leveled off.

Among adults, three quarters (75%) say they have been vaccinated, and nearly half (47%) received a booster dose (representing about 73% of those adults likely eligible to receive a booster). These numbers are little changed since February.

While previous Vaccine Monitor surveys found White adults were more likely than Black and Hispanic adults to report having received a booster, the newest survey shows similar shares of Black (47%), Hispanic (43%), and White (48%) adults now report receiving a booster.

Among vaccinated adults who have not received a booster shot, half either say they will “definitely not” get one (23%) or will get one only if required (27%). Most who are eligible but have not gotten a booster say they feel they have sufficient protection from their initial vaccination or a prior infection.

Among parents of adolescent children (ages 12-17), more than half (56%) say their teen has gotten a vaccine. Among parents of children ages 5-11, nearly 4 in 10 (39%) say their child has gotten a vaccine. These shares are largely unchanged since earlier this year.

Other findings include:

  • When asked who people trust to provide reliable information about the COVID-19 vaccines, personal doctors top the list, with 85% of adults saying they trust their personal doctor at least a fair amount and 83% of parents saying they trust their child’s pediatrician at least that much. About two-thirds trust COVID-19 vaccine information from the U.S. Centers for Disease Control and Prevention (64%) or the FDA (62%), and about half of adults trust their state government officials (54%), Dr. Anthony Fauci (53%), and President Joe Biden (49%).
  • The public’s trust in President Biden, the FDA, the CDC, and Dr. Fauci for reliable COVID-19 information has declined over the past 17 months, especially among Republicans. For example, six in ten Republicans (62%) said they trusted the FDA in December 2020, compared 43% who say so now. Trust in these sources for vaccine information remains high among Democrats.
  • With a new omicron subvariant continuing to spread nationally, 61% of the public says that they and their families are “very prepared” for any future rise of cases, and two-thirds (66%) of employed adults say their workplace is very prepared. Slightly less than half of parents (45%) say their child’s school is very prepared for a rise in COVID-19 cases due to new variants.
  • In contrast, fewer report that their local area more generally is very prepared for a rise in COVID-19 cases (36%) or that the U.S. overall is very prepared (25%).

Designed and analyzed by public opinion researchers at KFF, the Vaccine Monitor survey was conducted from April 13-26, 2022, among a nationally representative random digit dial telephone sample of 1,889 adults, including an oversample of 501 Hispanic adults and 500 non-Hispanic Black adults. Interviews were conducted in English and Spanish by landline (212) and cell phone (1,677). The margin of sampling error is plus or minus 3 percentage points for the full sample. For results based on subgroups, the margin of sampling error may be higher.

The KFF COVID-19 Vaccine Monitor is an ongoing research project tracking the public’s attitudes and experiences with COVID-19 vaccinations. Using a combination of surveys and qualitative research, this project tracks the dynamic nature of public opinion as vaccine development and distribution unfold, including vaccine confidence and acceptance, information needs, trusted messengers and messages, as well as the public’s experiences with vaccination.

Poll Finding

KFF COVID-19 Vaccine Monitor: April 2022

Published: May 4, 2022

Findings

Key Findings

  • With news that Moderna has asked the FDA to authorize its COVID-19 vaccine for young children, the latest KFF COVID-19 Vaccine Monitor survey finds that about one in five parents of children under age 5 (18%) are eager to get their child vaccinated right away, while a larger share (38%) say they plan to wait a while to see how the vaccine is working for others. About four in ten parents of children under 5 are more reluctant to get their child vaccinated with 27% saying they will “definitely not” get their child vaccinated and 11% saying they will only do so if they are required. Just over half of parents of children in this age range say they do not have enough information about the vaccines’ safety and effectiveness for children under age 5.
  • With mask mandates being lifted in many places, most workers say they and their coworkers are not regularly wearing masks when indoors at work. Just under four in ten (38%) of those who work outside their home say they wore a mask every time or most of the time when indoors at their place of work in the past 30 days, and 43% say they never wore a mask at work in the past 30 days. Black workers (64%), Hispanic workers (52%), and those with lower incomes (61%) are more likely than their counterparts to report wearing masks at work at least most of the time.
  • Most workers (88%) say they feel at least “somewhat safe” from COVID-19 in the workplace. However, Black and Hispanic workers and those with lower incomes are less likely than their counterparts to say they feel “very safe” from COVID-19 at work.
  • While most parents (84%) feel their child is at least “somewhat safe” from COVID-19 at school, parents who are Black or Hispanic are less likely to feel their child is “very safe” than White parents (33% vs. 52%). Fewer than two in ten parents overall now say their child’s school has a mask requirement in place, down from seven in ten last September. Notably, Black and Hispanic parents are almost three times as likely as White parents to say their child usually wears a mask at school.
  • Uptake of both COVID-19 vaccines and booster doses appears to have leveled off, with three-quarters of adults reporting that they’ve received at least one dose of a vaccine (relatively unchanged since September 2021) and close to half reporting at least one booster dose (the same share as in February). While previous Vaccine Monitor surveys indicated that Black and Hispanic adults were lagging behind White adults in booster uptake, the latest survey finds that similar shares of Black, Hispanic, and White adults now report receiving a booster.
  • Prospects for further booster uptake are mixed, with half of those who are vaccinated but not boosted saying they will “definitely not” get a booster or get one only if required, and most of the eligible but unboosted population saying they feel they have sufficient protection from their initial vaccination or a prior infection.
  • With case rates beginning to rise again in the U.S., around a third of the public think there’s currently a new wave of COVID-19 hitting the country, while half say there is not a new wave, and the remainder are not sure. People’s perceptions about whether the country is experiencing a new wave of COVID-19 infections seem to reflect their view of what is happening among their own family and friends, with around six in ten reporting that among people they know, they’ve seen fewer COVID-19 cases in the past 30 days.
  • While most adults say their families and their employers are very prepared for future COVID-19 surges, fewer say the same about their local area or about the country overall. At the same time, when it comes to information about COVID-19 vaccines, people continue to trust personal sources like their own doctors and employers more than official sources like the CDC, FDA, or state governments. Trust in the CDC, FDA, Dr. Anthony Fauci, and President Biden as sources of reliable information on COVID-19 vaccines has declined since last summer, particularly among Republicans.

Parents’ Vaccination Intentions for Their Children

Though the FDA has still not authorized any COVID-19 vaccine for young children, Moderna recently announced that it has asked the FDA to authorize its vaccine for children under 6. Fielded prior to the Moderna announcement, the latest KFF COVID-19 Vaccine Monitor survey finds that one in five parents of children under 5 (18%) are eager to vaccinate their child and say they will do so right away once a COVID-19 vaccine is authorized for their age group. Almost four in ten parents of children under 5 say they want to “wait and see” before getting their young child vaccinated (38%). Another four in ten parents are more reluctant to get their young child vaccinated with 11% saying they will only do so if they are required and 27% saying they will “definitely not” get their child under 5 vaccinated for COVID-19.

Among parents of 5 to 11 year-olds, who have been eligible for vaccination since October, about four in ten (39%) say their child has gotten vaccinated while a large share say they will either only get their child vaccinated if they are required for school (12%) or say their child will definitely not get the COVID-19 vaccine (32%). Most parents of 12 to 17 year-olds say their teenager has been vaccinated (56%, fairly steady since January), while about three in ten (31%) say they will “definitely not” get their teen vaccinated and 4% say they will only do so if they are required.

One In Five Parents Of Children Under 5 Want To Vaccinate Their Child For COVID-19 Right Away When Authorized, But Four In Ten Want To Wait And See

Lack of available information may be a factor in parents’ reluctance to get their youngest children vaccinated right away. A majority of parents of children under five say they don’t have enough information about the safety and effectiveness of COVID-19 vaccines for children in this age group (56%). By contrast, most parents of older children feel better informed, with three-fourths of parents of teens and two-thirds of parents of kids ages 5-11 saying they have enough information about vaccine safety and effectiveness for their age group.

Most Parents Say They Don’t Have Enough Information About COVID-19 Vaccine Safety And Effectiveness For Children Under 5

Moderna’s application for emergency use authorization for its COVID-19 vaccine in young children comes on the heels of a previous delay by the FDA, which announced in February that it was waiting for more data on the effectiveness of a third dose before evaluating the Pfizer-BioNTech vaccine for this age group. Most parents of young children (64%) say the FDA’s delay in granting emergency use authorization for a COVID-19 vaccine for children under five has not affected their confidence in the safety of the vaccines for this age group. About one-fifth (22%) parents say the delay has made themmore confident” in the vaccine’s safety for young children, while around one in eight (13%) say it has made them “less confident.”

Most Parents Of Young Children Say FDA Delay In Authorization Has Not Changed Their Confidence In Vaccine Safety

COVID-19 And The Workplace

As many employees are returning to their offices or workplaces, and COVID-19 restrictions such as mask requirements are being lifted from restaurants, retail stores, and other venues, most workers say they feel at least somewhat safe from COVID-19 in their workplace. However, Black and Hispanic workers as well as those with lower incomes are less likely than their counterparts to report feeling “very safe” when they go to work.

Most workers with jobs outside the home say they feel at least somewhat safe from COVID-19 when they are at work, including over half who say they feel “very safe” (55%) and a third who feel “somewhat safe.”  Around one in ten say they feel “not too safe” (9%) or “not safe at all” (4%).

White workers are twice as likely as Black workers to say they feel “very safe” from COVID-19 when working outside the home (63% vs. 31%), with smaller shares of Hispanic workers (48%) than White workers saying they feel “very safe.” Across income groups, a majority of those with household incomes of $40,000 or more say they feel “very safe” (57%) compared to about four in ten (41%) of those with incomes of under $40,000 who say the same. Unvaccinated workers also report feeling “very safe” at work outside their house (71%) at higher rates than vaccinated workers (48%), likely due to difference in perceptions of COVID-19 as a risk.

Most Workers Feel At Least Somewhat Safe From COVID-19 At Work, But Lower-Income, Black, And Hispanic Workers Are Less Likely To Feel Very Safe

Vaccine Mandates In The Workplace

In January, following the Supreme Court’s ruling that blocked the policy, the Biden Administration withdrew its requirement for large employers to have workers get vaccinated for COVID-19 or be tested regularly. However, some workplaces have continued to mandate vaccines in the absence of federal policy. We find that four in ten workers say their employer is requiring on-site workers to be vaccinated for COVID-19, up from 29% in November 2021. This includes 9% of all workers who say their employer is requiring employees to have a COVID-19 booster in addition to their initial dose.

Among workers whose employer does not require on-site workers to be vaccinated for COVID-19, most (78%, or 45% of all workers) say they do not want their employer to have a vaccination requirement, while 20% of those without a requirement (11% of all workers) say they want their employer to require vaccination.

Majorities Black workers and Hispanic workers say they either have a vaccination requirement at work (45% of Black workers, 47% of Hispanic workers) or want their employer to add one (13% of Black workers, 10% of Hispanic workers), while around half of White employees (49%) don’t currently have a vaccine requirement and do not want a requirement. Among partisans, about two-thirds of Democrats and over half of independents either say their employer requires vaccines or they want their employer to require vaccines, while about seven in ten Republicans (69%) say they are not currently subject to such a requirement and do not want their employer to put one in place.

Four In Ten Workers Say They Are Required To Get Vaccinated, One In Ten Would Like To Be Required, And Another Four In Ten Don't Want A Requirement

Mask Usage In The Workplace

With mask mandates being lifted in many places, most workers say they and their coworkers are not regularly wearing masks at work. About one-quarter (24%) of those who work at least partially outside their home say they have worn a mask “every time” when indoors at work in the past 30 days, with another 14% reporting they wore a mask most of the time. About one in five workers (19%) say they wore a mask “some of the time” when indoors at work in the past 30 days, while 43% say they have “never” worn a mask indoors at work in the past 30 days. Three in ten say “all” or “most” of their coworkers regularly wear masks at work while 16% say some of their coworkers regularly wear a mask. About half of employees say “very few” (27%) or “none” (26%) of their coworkers regularly wear a mask at work.

Black workers and Hispanic workers, as well as workers with lower incomes, are more likely than others to say they and their coworkers are regularly wearing masks at work. For example, workers with household incomes of $40,000 or less are more than twice as likely as those with incomes of $90,000 or more to say they mostly wear masks at work (61% vs. 27%) and to say that most of their coworkers do (50% vs. 22%). Further, nearly two-thirds of Black workers (64%) and half of Hispanic workers (52%) say they wear a mask at work at least most of the time compared to three in ten White employees (31%).

There are partisan differences as well, with workers who identify as Democrats more than three times as likely as those who identify as Republicans to report wearing a mask at work (51% vs. 16%). And despite being at a higher risk for catching and spreading the virus, a smaller share of unvaccinated than vaccinated adults report regularly wearing a mask in the workplace (20% vs. 45%) or say most of their coworkers wear one (17% vs. 34%).

Lower-Income Workers, People Of Color, Democrats, And Vaccinated Workers More Likely To Report Wearing Masks At Work

COVID-19 And Schools

Though COVID-19 cases are again on the rise and some schools are reporting outbreaks among students and staff following spring break, most parents feel their children are at least “somewhat safe” from COVID-19 at school, and most feel their school is “doing about the right amount” to keep children safe.

Nearly half of parents with a child in school think their child is “very safe” (44%) from the risk of exposure to COVID-19 when they are at school and an additional 40% think their child is “somewhat safe”. However, parents who are Black or Hispanic are less likely than White parents to say they feel their child is “very safe” from COVID-19 when they are at school1 . Similarly, vaccinated parents are much less likely than unvaccinated parents to say they think their child is “very safe” (36% vs. 59%).

Additionally, seven in ten parents with a child enrolled in school say their child’s school is doing “about the right amount” to protect kids from COVID-19 at school. One in ten (11%) say their child’s school is doing “too much” while 18% feel their child’s school is “not doing enough” to protect kids from COVID-19 at school. There were no measured differences on how Black, Hispanic, and White parents assessed the job their child's school is doing.

Black And Hispanic Parents Are Less Likely Than White Parents To Feel Their Child Is Very Safe From COVID-19 At School

The February KFF Vaccine Monitor, following the peak of an omicron wave of COVID-19 cases, found that parents were largely divided on whether schools should have mask requirements for students and staff. The current Monitor finds that there has been a large shift in mask requirements in schools since the beginning of the school year. Three-quarters of parents now say they their child’s school does not have a mask requirement, compared to September 2021 when seven in ten parents (69%) said their child’s school required all students and staff to wear masks.

Marking A Major Shift From September 2021, Three-Quarters Of Parents Now Say Their Child's School Does Not Have Mask Requirements

About four in ten parents (41%) indicate their child regularly wears a mask at school – either because their school requires it or because it is something they do voluntarily. One in four (24%) say that all or most students in their child’s school are either subject to a mask requirement or wear masks regularly. Parents who are Black or Hispanic are more than twice as likely as White parents to say their child usually wears a mask (70% vs. 26%) and five times as likely to say that most other students at their child’s school wear masks (9% vs. 47%).

Black And Hispanic Parents Are More Likely Than White Parents To Say Their Child And Other Children At Their School Regularly Wear  Masks

The latest KFF COVID-19 Vaccine Monitor survey finds that three in four adults (75%) say they have gotten at least one dose of a COVID-19 vaccine, a share that continues to hold relatively steady since September 2021. A quarter of adults remain unvaccinated, including about one in six (17%) who say they definitely will not get the vaccine, a share that has not changed substantially in nearly 18 months of polling.

When it comes to demographic uptake of the COVID-19 vaccine, Democrats (92%), adults 65 and older (88%), college graduates (86%), and those with a serious health condition (85%) continue to report the highest rates of being vaccinated. Republicans (55%), those under age 65 without health insurance (56%), and White Evangelical Christians (57%) are among those with the lowest vaccination rates.

A Quarter Of Adults Remain Unvaccinated For COVID-19, Including One In Six Who Say They Will Definitely Not Get The Vaccine

Booster Doses Uptake And Intentions

COVID-19 vaccine booster uptake has also slowed considerably2 . About half of all adults (47%) now report they have received a booster dose, the same share who said so in February. One in four adults (26%) report being vaccinated for COVID-19 but have not gotten a booster, while a quarter (25%) say they are unvaccinated. Booster uptake differs substantially by age, with the highest rate of being boosted among adults 65 and older, who are more at risk for COVID-19 complications (70%). There is also a large gap by partisanship, with Democrats more than twice as likely as Republicans to report being vaccinated and boosted (68% vs. 31%).

Nearly Half Of Adults Say They Have Received A COVID-19 Booster Dose, With Large Divides By Partisanship And Age

Previous Vaccine Monitor surveys identified a potential racial gap in COVID-19 booster uptake, with White adults appearing to outpace Black and Hispanic adults in the share who reported being boosted. The latest survey finds that similar shares of Black, Hispanic, and White adults now report receiving a booster, whether looked at as a share of the total population or among those likely to be eligible for a booster.

Notably, though younger adults continue to lag older adults and Republicans lag Democrats in the share who say they have gotten a booster dose of a COVID-19 vaccine, among those likely eligible for a booster, majorities across age groups, racial and ethnic groups, and party identification say they have received a booster dose.

Seven In Ten Adults Eligible For A COVID-19 Booster Dose Have Received One

Among vaccinated adults who have not yet received a booster dose, half say they will only get it “if required” (27%) or say they will “definitely not” get a booster (23%). Three in ten (30%) say they plan to get an additional dose “as soon as they can,” while 18% say they want to “wait to see” before getting a booster dose of the COVID-19 Vaccine. Four in ten vaccinated Hispanic adults who have not yet gotten a booster say they want to get one “as soon as they can”, compared to 22% of vaccinated but not yet boosted White adults who say the same. Around three in ten (29%) vaccinated but not yet boosted Black adults say they’ll get a booster dose as soon as they can. Notably, about three in ten vaccinated White adults who are not yet boosted say they will “definitely not” get a booster dose (29%) and a further 29% say they will only do so if they are required.

Half Of Vaccinated Adults Who Have Not Received A Booster Say They Either Will Only Get One If Required, Or Say They Definitely Will Not Get A COVID-19 Booster
Reasons Why Some Vaccinated Adults Have Not Gotten A Booster

Adults who are eligible for a COVID-19 booster but have not yet received one cite a variety of reasons for not getting a booster. Chief among them is the view that they already have enough protection from either their initial vaccine doses or from a previous COVID-19 infection (56%). Other common reasons these booster-eligible adults say they have not yet gotten a booster include just not wanting to get it (45%), thinking boosters are ineffective because some vaccinated people are still getting infected (39%), and being too busy to go get the shot (33%). About three in ten cite not trusting the government or medical system (29%) or not believing the COVID-19 vaccines are safe (28%) as reasons for not getting a booster. Fewer cite other reasons like side effects from a previous dose (18%), they don’t like getting shots (15%), worries about missing work (8%), difficulties traveling to a vaccination site (7%), or worries about having to pay out of pocket (4%).

Feeling They Have Enough Protection And “Just Don’t Want To” Are Among Top Reasons For Not Getting A COVID-19 Booster

Perceptions Of Current Case Rates And Preparation For Future Waves

As COVID-19 cases are once again on the rise, a little more than a third (35%) of adults think there is a new wave of COVID-19 infections hitting the country. Half of adults say there is not a new wave of COVID-19 infections hitting the U.S. now and 14% are unsure if the country is in the midst of a new wave.

There are stark differences in partisan perceptions of the current state of COVID-19 infections as a slight majority of Democrats (53%) think that there is a new wave right now in the U.S., while seven in ten Republicans think there is not. Notably, almost three-quarters of unvaccinated adults (73%) do not think there is a new wave of COVID-19 infections in the U.S., consistent with prior surveys finding that unvaccinated adults tend to view the virus as less of a risk compared to those who are vaccinated.

Half Of Adults Do Not Think The U.S. Is In The Midst Of A New Wave Of COVID-19 Infections

People’s perceptions about whether the country is experiencing a new wave of COVID-19 infections seem to reflect their view of what is happening among their own family and friends. Around six in ten adults say that among the people they know, they have seen fewer COVID-19 cases in the past 30 days (62%) while two in ten say they have seen about the same number of cases (21%). Fewer than one in ten (6%) say they have seen more cases in the past 30 days among people they know. Additionally, around half of adults (51%) say that the people they know who have been infected with COVID-19 in the past 30 days are experiencing less severe symptoms than those infected in previous waves.

Preparedness For Future COVID-19 Waves

With a new omicron subvariant continuing to spread, six in ten adults (61%) say that they and their families are very prepared for any future rise of cases due to a new variant, and around two-thirds of employed adults say their workplace is very prepared (66%). Slightly less than half of parents (45%) say their child’s school is very prepared for a rise in COVID-19 cases due to new variants. However, around a third report that their local area more generally is very prepared for a rise in COVID-19 cases (36%).

In contrast to views of their personal level of preparation, fewer adults think the U.S. as a country is very prepared to deal with any future rise in cases due to a new variant of COVID-19. A quarter of adults say that the U.S. is very prepared to deal with any future rise in cases due to a new variant (25%), with 44% saying the country is somewhat prepared, and a quarter saying it is not too prepared (15%) or not prepared at all (11%).

Majorities Say Their Families And Workplaces Are Very Prepared For Future Rises In COVID-19 Cases Due To New Variants, Fewer Think The U.S. Or Their Local Area Are Very Prepared

Black and Hispanic adults and those with lower household incomes are less likely to say that they, their family, and their workplace are very prepared to deal with future COVID-19 cases. A larger share of White adults says they and their family are very prepared with any future rise in cases (65%) compared to Black (52%) and Hispanic adults (46%). In addition, larger shares of those with higher incomes say they and their family are very prepared (72% of those with a household income of $90,000 or more a year, compared to 55% of those with an income of less than $90,000). Similarly, White workers are more likely to say their workplace is very prepared (71%) than Black (48%) or Hispanic workers (56%).

Trust In COVID-19 Vaccine Information

When asked who people trust to provide reliable information about the COVID-19 vaccines, people’s own doctors, including pediatricians top the list, with 85% of adults saying they trust their personal doctor “a great deal” or “a fair amount.” Similarly, 83% of parents say they trust their child’s pediatrician to provide them with reliable information about the COVID-19 vaccines. Majorities of workers trust their employer (77%), insured adults trust their health insurance company (73%), and majorities trust their local public health department (68%) for this information. About two-thirds trust COVID-19 vaccine information from the CDC (64%) or the FDA (62%) and about half of adults trust their state government officials (54%), Dr. Anthony Fauci (53%), and President Joe Biden (49%).

With the exception of their own employers, there are stark partisan differences in trust with Republicans being less likely than Democrats to trust each of the other sources of COVID-19 vaccine information asked about in the survey. Indeed, Republicans are particularly less likely than their Democratic counterparts to trust federal and institutional sources of information.

Personal Doctors, Employers, And Health Insurance Companies Are Most Trusted For COVID-19 Vaccine Information, While Trust In Government Sources Divides Along Partisan Lines

The share who says they trust President Biden, the FDA, the CDC, and Dr. Fauci to provide reliable information on COVID-19 vaccines has declined since December 2020. Despite some criticism of how the FDA and CDC have handled vaccine rollout and messaging, trust among Democrats has remained high. However, among Republicans, the share who say they trust the FDA fell from a majority (62%) to about four in ten (43%). Similarly, the share of Republicans who trust the CDC at least a fair amount fell from a majority in December (57%) to four in ten (41%). The share of Republicans who trust Dr. Fauci for such information fell by roughly half between December 2020 and now, from 47% to 25%. In addition, trust in President Biden, already low among Republicans in December when he was President-elect, sank even further.

Trust In Government Sources For COVID-19 Vaccine Information Has Fallen, Particularly Among Republicans

The recent downward movement in Republicans’ level of trust in the CDC and Dr. Fauci on coronavirus is a continuation of a trend that began earlier in the pandemic. In April 2020, under a different Administration, large shares of both Democrats and Republicans said they had at least a fair amount of trust in the CDC and in Dr. Anthony Fauci to provide reliable information about coronavirus in general. By September 2020, the shares of Republicans who said they trusted both fell by more than 25 percentage points each. This trend has continued as the question shifted to ask about sources of information on COVID-19 vaccines.

Though Large Majorities Across Partisans Had Trust In The CDC And Dr. Fauci Early In The Pandemic, Republicans' Trust In Both Has Steadily Fallen

Methodology

This KFF COVID-19 Vaccine Monitor was designed and analyzed by public opinion researchers at the Kaiser Family Foundation (KFF). The survey was conducted April 13-26, 2022, among a nationally representative random digit dial telephone sample of 1,889 adults ages 18 and older (including interviews with 501 Hispanic adults and 500 non-Hispanic Black adults), living in the United States, including Alaska and Hawaii (note: persons without a telephone could not be included in the random selection process). Phone numbers used for this study were randomly generated from cell phone and landline sampling frames, with an overlapping frame design, and disproportionate stratification aimed at reaching Hispanic and non-Hispanic Black respondents as well as those living in areas with high rates of COVID-19 vaccine hesitancy. Stratification was based on incidence of the race/ethnicity subgroups and vaccine hesitancy within each frame. High hesitancy was defined as living in the top 25% of counties as far as the share of the population not intending to get vaccinated based on the U.S. Census Bureau’s Household Pulse Survey. The sample also included 115 respondents reached by calling back respondents that had previously completed an interview on the KFF Tracking poll at least nine months ago. Another 286 interviews were completed with respondents who had previously completed an interview on the SSRS Omnibus poll (and other RDD polls) and identified as Hispanic (n=122; including 51 in Spanish) or non-Hispanic Black (n=164). Computer-assisted telephone interviews conducted by landline (212) and cell phone (1,677; including 1,272 who had no landline telephone) were carried out in English and Spanish by SSRS of Glen Mills, PA. To efficiently obtain a sample of lower-income and non-White respondents, the sample also included an oversample of prepaid (pay-as-you-go) telephone numbers (25% of the cell phone sample consisted of prepaid numbers). Both the random digit dial landline and cell phone samples were provided by Marketing Systems Group (MSG). For the landline sample, respondents were selected by asking for the youngest adult male or female currently at home based on a random rotation. If no one of that gender was available, interviewers asked to speak with the youngest adult of the opposite gender. For the cell phone sample, interviews were conducted with the adult who answered the phone. KFF paid for all costs associated with the survey.

The combined landline and cell phone sample was weighted to balance the sample demographics to match estimates for the national population using data from the March 2021 U.S. Current Population Survey (CPS) on sex, age, education, race, Hispanic origin, region, and marital status, within race-groups, along with data from the 2010 Census on population density. The sample was also weighted to match current patterns of telephone use using data from the January-June 2021 National Health Interview Survey. The sample is also weighted to account for the possibility of partisan nonresponse based on three months of KFF national polls and this current survey. The weight takes into account the fact that respondents with both a landline and cell phone have a higher probability of selection in the combined sample and also adjusts for the household size for the landline sample, and design modifications, namely, the oversampling of potentially undocumented respondents and of prepaid cell phone numbers, as well as the likelihood of non-response for the recontacted sample. All statistical tests of significance account for the effect of weighting.

The margin of sampling error including the design effect for the full sample is plus or minus 3 percentage points. Numbers of respondents and margins of sampling error for key subgroups are shown in the table below. For results based on other subgroups, the margin of sampling error may be higher. Sample sizes and margins of sampling error for other subgroups are available by request. Sampling error is only one of many potential sources of error and there may be other unmeasured error in this or any other public opinion poll. Kaiser Family Foundation public opinion and survey research is a charter member of the Transparency Initiative of the American Association for Public Opinion Research.

This work was supported in part by grants from the Chan Zuckerberg Initiative DAF (an advised fund of Silicon Valley Community Foundation), the Ford Foundation, and the Molina Family Foundation. We value our funders. KFF maintains full editorial control over all of its policy analysis, polling, and journalism activities.

GroupN (unweighted)M.O.S.E.
Total1,889± 3 percentage points
COVID-19 vaccination status
Have gotten at least one dose of the COVID-19 vaccine1,449± 4 percentage points
Have not gotten the COVID-19 vaccine429± 7 percentage points
Race/Ethnicity
White, non-Hispanic754± 5 percentage points
Black, non-Hispanic500± 6 percentage points
Hispanic501± 5 percentage points
Parents
Total parents477± 7 percentage points
Parent with a child under age 5181± 11 percentage points
Parents with a child ages 5-11227± 10 percentage points
Parents with a child ages 12-17230± 9 percentage points
 
Party identification
Democrats650± 6 percentage points
Republicans349± 7 percentage points
Independents577± 6 percentage points

Notes for reading the topline:

  • Percentages may not always add up to 100 percent due to rounding.
  • Values less than 0.5 percent are indicated by an asterisk (*).
  • “Vol.” indicates a response was volunteered by the respondent, not offered as an explicit choice
  • Questions are presented in the order asked; question numbers may not be sequential.

All trends shown in this document come from KFF Health Tracking Polls or KFF COVID-19 Vaccine Monitors.

Endnotes

  1. Black and Hispanic parents were combined for analysis as separate sample sizes were too small for individual analysis. ↩︎
  2. Booster dose is in reference to the first booster dose after a full initial course of vaccination (3rd shot for those receiving the initial course of the Pfizer or Moderna vaccine, or 2nd shot for those receiving the Johnson & Johnson vaccine). This survey was fielded after the CDC announced eligibility for a second booster dose for some individuals but did not measure uptake of a second booster. ↩︎
News Release

Medicaid Work Requirements: What Happened under the Trump and Biden Administrations?

Published: May 3, 2022

In a new brief, KFF analysts explain and summarize the recent history of efforts to make work requirements a condition of eligibility for Medicaid in some states. Following years of administrative, political, and legal activity across two presidential administrations, recent Supreme Court action and skepticism about work requirements by the Biden administration signals a pause in efforts to reshape state Medicaid programs in this fashion.

The Trump Administration opened the door to such efforts by approving Section 1115 demonstration waivers that imposed mandatory work and reporting requirements as a condition of Medicaid eligibility. However, courts struck down many of these approvals. And the Supreme Court recently dismissed pending challenges in these cases, in part due to the Biden Administration’s earlier withdrawals of approved work requirement waivers in several states. Georgia has challenged the withdrawal of its work requirements in court, and an initial decision in the Georgia case is still pending.

Although few Medicaid work and reporting requirements were implemented due to litigation, state withdrawals, and/or pauses during the COVID-19 pandemic, KFF analysts find that available implementation data from Arkansas suggests that these requirements are confusing to enrollees and result in substantial Medicaid coverage losses, including among eligible individuals.

Future presidential administrations could revisit these waiver provisions. However, to survive legal challenges, the federal administrative record in any future approvals would likely have to support the conclusion that such waivers would further Medicaid program objectives, including promoting affordable health coverage for low-income people, our experts conclude.

The full analysis, and other data and analyses about Medicaid work requirements, are available on the Medicaid topic page of kff.org.

An Overview of Medicaid Work Requirements: What Happened Under the Trump and Biden Administrations?

Authors: Madeline Guth and MaryBeth Musumeci
Published: May 3, 2022

Issue Brief

The Trump Administration aimed to reshape the Medicaid program by newly approving Section 1115 demonstration waivers that imposed work and reporting requirements as a condition of Medicaid eligibility. However, courts struck down many of these approvals and the Supreme Court recently dismissed pending challenges in these cases. The Court dismissed pending litigation in Arkansas and New Hampshire due to the expiration of Arkansas’ waiver as well as the Biden Administration’s earlier withdrawals of these approved work requirement waivers. The Biden Administration had concluded that these provisions reduce coverage and thus do not promote the objectives of the Medicaid program. States could have appealed these withdrawal decisions to the HHS Departmental Appeals Board, and Georgia has challenged the withdrawal of its work requirements in court. An initial decision in the Georgia case is currently pending.

Although few Medicaid work and reporting requirements were implemented due to litigation, state withdrawals, and/or pauses during the COVID-19 pandemic, available implementation data from Arkansas suggests that these requirements were confusing to enrollees and result in substantial coverage loss, including among eligible individuals. This recent history of Medicaid work requirements illustrates the tensions between states, changing presidential administrations, and the courts. This issue brief answers key questions about these provisions:

  1. What is the history of Medicaid and work requirements?
  2. What do we know about the impacts of Medicaid work requirements?
  3. What is the current status and future of Medicaid work requirements?

Although the Biden Administration has concluded that it does not believe work requirements further Medicaid program objectives, a future presidential administration could revisit these waiver provisions. To survive an expected legal challenge, the administrative record in any future approvals would likely have to support the conclusion that such waivers would further Medicaid program objectives, including promoting affordable coverage for low income people.

What is the history of Medicaid and work requirements?

Prior to the Trump Administration, no states had received waiver approvals to condition Medicaid coverage on work and reporting requirements, and legislative attempts to incorporate work requirements into Medicaid statute failed. Policy arguments for and against Medicaid work requirements are grounded in views about whether Medicaid is akin to a public assistance program, like Temporary Assistance for Needy Families (TANF), or one that provides health insurance, in line with the Affordable Care Act (ACA) expansion of the program as one of several routes to increasing access to affordable health care for uninsured Americans. Adults who receive TANF cash assistance generally are required to participate in work, as one of the express purposes of TANF enumerated in statute is to “end the dependence of needy parents on government benefits by promoting job preparation, work, and marriage.” In contrast, Congress has not identified work as an objective for the Medicaid program. The ACA aimed to make Medicaid available to low-income adults through its Medicaid expansion, regardless of whether a person also met categorical eligibility requirements such as being pregnant, a parent, senior, or person with a disability. After implementation of the ACA’s Medicaid expansion, the Obama Administration signaled it would not approve state waiver requests to require work as a condition of Medicaid eligibility, concluding in its denial of Arizona’s request that work requirements “could undermine access to care and do not support the objectives of the [Medicaid] program.” In an effort to reframe Medicaid to a program akin to “public assistance”, unsuccessful Republican attempts to repeal and replace the ACA in 2017 proposed allowing states to require work as a condition of Medicaid eligibility.

In ways other than work requirements, Medicaid supports employment by providing affordable health coverage as well as voluntary employment referral and/or work support programs in some states. Research shows that being in poor health is associated with increased risk of job loss, while access to affordable health insurance has a positive effect on the ability to obtain and maintain employment. Medicaid coverage helps low-wage workers get care that enables them to remain healthy enough to work; across states enrollees report that this coverage helps them to manage chronic conditions and supports their ability to work jobs that may be physically demanding. While most Medicaid adults who qualify through non-disability pathways are already working, some states have launched initiatives to support employment for Medicaid enrollees without making employment a condition of eligibility. A couple of states (including AR and IN) have offered voluntary employment referral programs relying on general enrollee notices rather than targeted outreach. Other states (including LA, ME, and MT) have incorporated intensive targeted outreach and case management services into their voluntary work support programs.

In a departure from previous administrations, the Trump Administration encouraged and approved Section 1115 waivers that conditioned Medicaid coverage on meeting work and reporting requirements in 13 states (Figure 1). Under Section 1115 of the Social Security Act, the Secretary of HHS can allow states to use federal Medicaid funds in ways that federal rules do not otherwise allow, as long as the initiative is an “experimental, pilot, or demonstration project” that “is likely to assist in promoting the objectives of [the program].” In January 2018, CMS issued guidance inviting states to request Section 1115 waivers that impose work and reporting requirements (referred to as “community engagement”) as a condition of Medicaid eligibility for non-elderly, non-pregnant adult beneficiaries who are eligible on a basis other than disability. The guidance asserted that such provisions would promote program objectives by helping states “in their efforts to improve Medicaid enrollee health and well-being through incentivizing work and community engagement.” In contrast to voluntary work support programs discussed above, the guidance was explicit that state initiatives to condition Medicaid eligibility on meeting work and reporting requirements could not use federal Medicaid funds for supportive services to help people overcome barriers to work, such as childcare or transportation. The next day, CMS approved the first Medicaid work requirement in Kentucky’s waiver. In total, CMS under the Trump Administration approved waivers with work requirements in 13 states. Across states, work requirement waivers were generally similar in conditioning Medicaid coverage for certain adults on reported employment or other qualifying activities, with some variation in technical details. For example, waivers varied by:

  • population, with most applying to expansion adults, a couple applying to both expansion and traditional adults, such as low-income parents, in expansion states, and some later approvals applying to low-income parents and some limited other populations in non-expansion states;
  • exemptions, such as for older age or medical frailty (although the work requirement guidance excluded people who are eligible for Medicaid based on a disability, many Medicaid adults with disabilities do not receive SSI benefits and are eligible due to low income rather than disability status, so they would be subject to work requirements unless the state makes an exemption and they are able to successfully navigate the exemption process);
  • qualifying activities in addition to employment (such as education, community service, and job search or training);
  • number of hours of qualifying activities required per week or month and how to report these (such as through an online account); and
  • consequences for noncompliance (typically disenrollment, though two states (GA and SC) required compliance to be established prior to enrollment and one state (NE) conditioned access to certain benefits, rather than eligibility, on compliance with work requirements).

Of the 13 states that had approved work requirements, only Arkansas implemented such requirements with consequences for noncompliance. Other states that began implementation did not disenroll those who did not comply and instead paused implementation due to litigation and/or the COVID-19 pandemic. For state-level detail on these approved waivers as well as additional requests that were not approved by the end of the Trump Administration, see Figure 1 and Appendix Table 1. For more information on the timing of work requirement approvals, as well as subsequent legal challenges and withdrawals (as discussed in the section below), see Appendix Figure 1.

Section 1115 Work Requirement Waiver Requests and Approvals

What do we know about the impacts of Medicaid work requirements?

Research on the relationship between work and health, including experience with AFDC, TANF, and SNAP, suggest that the effects of work requirements on health and employment may be limited. In the 1990s, states used Section 1115 waivers in attempts to increase work among enrollees in the Aid to Families with Dependent Children (AFDC) program; however, an analysis suggested that a significant part of the AFDC targeted population faced obstacles to work including disability. Similarly, research finds that work requirements in TANF—the program that replaced AFDC—have had little impact on increasing employment over the long-term, as most TANF enrollees are either already working or face significant employment barriers that work requirements do not address. Studies also find that SNAP work requirements do not significantly increase employment but result in large reductions in SNAP participation. Finally, a review of research on the relationship between work and health found that although there is strong evidence of an association between unemployment and poorer health outcomes, there is limited evidence on the effect of employment on health.

As most Medicaid enrollees are already working or face barriers to work, work and reporting requirements may cause coverage loss among eligible enrollees without increasing employment. Prior to the pandemic, the majority (63%) of non-dual (i.e., not also enrolled in Medicare), non-SSI, nonelderly Medicaid adults were already working full or part-time. Among those not working, most were not working due to caregiving (12%), illness or disability (10%), or school attendance (7%). Many of these reasons would likely qualify as exemptions from work requirement policies in most states, leaving just 7% of Medicaid adults (who reported that they were retired, unable to find work, or were not working for another reason) to whom work requirement policies could be directed. A 2018 analysis suggests that if all states were to implement Medicaid work requirements, between 1.4 and 4.0 million Medicaid adults could lose coverage, with the majority of disenrollment occurring among individuals who comply with the requirements (i.e., are working enough hours to satisfy requirements) and remain eligible but lose coverage due to new administrative reporting burdens or red tape. Research suggests work requirements could have particular adverse effects on certain Medicaid populations, such as women, people with HIV, and adults with disabilities including those age 50 to 64. Finally, the one in four Medicaid enrollees living in homes with limited internet access may face particular challenges meeting work and reporting requirements, as many states disseminated information about these requirements online and/or required enrollees to report compliance online.

Available implementation data suggests that Medicaid work and reporting requirements were confusing to enrollees and result in substantial coverage loss, including among eligible individuals. As noted above, few states implemented approved Section 1115 waivers with work requirements due to litigation, state withdrawals, and/or the COVID-19 pandemic. However, Arkansas’ waiver was in effect from June 2018 through March 2019 (when it was set aside by a federal court), with evidence from this period suggesting that more than 18,000 people (about 25% of those subject to the requirement) lost coverage in 2018. While enrollees who lost coverage in 2018 could reapply for coverage in January 2019, the vast majority of those who lost coverage (89%) remained unenrolled in early 2019. Although Arkansas’s program included safeguards intended to protect coverage for people with disabilities and others who should not have been subject to the requirements from losing coverage (including “medically frail” and “good cause” exemptions and “reasonable accommodations” to assist with meeting the requirements), few people used these safeguard measures relative to the number who lost coverage. Among those who accessed “good cause” exemptions, the vast majority did so due to disability/other health issues or technical issues, primarily related to reporting. This difficulty with reporting underscores that Arkansas’ administrative processes presented barriers to eligible people retaining coverage including and beyond those with disabilities. Lack of computer literacy and internet access among enrollees created barriers to setting up online accounts as well as ongoing reporting. Research indicates that enrollees in Arkansas were unaware of or confused by the new work and reporting requirements, which did not provide an additional incentive to work beyond economic pressures.

What is the current status and future of Medicaid work requirements?

The Biden Administration began the process to withdraw Section 1115 work requirements in February 2021 and has since issued final withdrawals for all states that had approvals. CMS generally reserves the right to withdraw approved waiver authorities at any time it determines that these authorities are no longer in the public interest or promote Medicaid objectives. A January 2021 executive order from President Biden directed HHS to review waiver policies that may undermine Medicaid. CMS subsequently withdrew Medicaid work requirement waivers in all states that had approvals. These withdrawal letters cited evidence from Arkansas (described above) as well as additional data indicating that about 40% of those subject to work requirements (or 17,000 beneficiaries) in New Hampshire and 33% (or 80,000 beneficiaries) in Michigan were at risk of coverage loss, prior to implementation pauses. The letters also highlighted that job and income loss among the low-income population during the COVID-19 pandemic were likely to exacerbate the risks of coverage loss under work requirements. No states were implementing work requirements at the time of withdrawal, either due to the pandemic, litigation (see Appendix Table 2), or prior termination by the states themselves (see Figure 1).

Following the Biden Administration’s withdrawals, in April 2022 the Supreme Court dismissed pending appeals in cases that had found work requirement approvals unlawful.  Previously, in February 2020 a DC Circuit Court of Appeals panel affirmed in a unanimous opinion that the HHS Secretary’s approval of Medicaid work requirements in Arkansas was unlawful because the Secretary failed to consider the impact on coverage. The DC appeals court subsequently affirmed that the Secretary’s New Hampshire approval also was unlawful. Before leaving office, the Trump Administration asked the Supreme Court to reverse these appeals court decisions and the Court agreed to hear the cases in December 2020. However, following the Biden Administration’s withdrawals of the Arkansas and New Hampshire work requirements, in April 2021 the Supreme Court removed the cases from its oral argument calendar. In April 2022, the Biden Administration asked the Court to vacate the lower court decisions and dismiss the Arkansas case as moot (as that waiver had expired) and remand send the New Hampshire case back to HHS (as New Hampshire had not asked the Court to review the case involving its waiver). In April 2022, the Court granted this motion, effectively putting an end to the pending litigation. (For more information on work requirement litigation across states, see Appendix Table 2 and Figure 1.)

The Supreme Court’s dismissal does not preclude future presidential administrations from approving new Section 1115 work requirements. Each case challenging work requirements (see Appendix Table 2) has centered on the administrative record of the underlying waiver approvals under the Trump Administration, with courts finding that these approvals were unlawful because they were unsupported by the administrative records. Specifically, the courts found that the Secretary did not consider impacts on coverage contained in the administrative records. Although the Biden Administration has concluded that it does not believe work requirements further Medicaid program objectives, CMS under future presidential administrations could issue new guidance encouraging work requirement waivers and approve such waivers based on a different interpretation of program objectives—though these would likely face legal challenges. For example, although Arkansas removed its work requirement in its new waiver, the state noted that should federal law or regulations permit the use of a work requirement as a condition of eligibility in the future, it would seek to amend the demonstration accordingly. Separately, states had the opportunity to appeal the Biden Administration’s withdrawals of work requirement waivers to the HHS Departmental Appeals Board and Georgia has challenged the withdrawal of its work requirements (which would have been part of a limited coverage expansion) in court. Georgia’s challenge remains pending, with an initial decision expected later this summer.

Conclusion

As a health coverage program, Medicaid can support employment by providing health coverage and access to care and medications that enable people to work, and it can also provide voluntary employment referral and/or work support programs. In a departure from previous administrations, the Trump Administration encouraged and approved Section 1115 waivers that conditioned Medicaid coverage on meeting work and reporting requirements. Though few of these work requirements were implemented due to legal challenges, state withdrawals, and/or the COVID-19 pandemic, available data suggests that such requirements can result in substantial coverage loss, including among eligible individuals, as evidenced by the more than 18,000 individuals who lost coverage in seven months under Arkansas’ work and reporting requirement. Based in part on this data, the Biden Administration withdrew all approved work requirement waivers by the end of 2021; Georgia has since challenged the withdrawal of its work requirements in court. Following these withdrawals and the expiration of Arkansas’ waiver, the Supreme Court dismissed pending appeals in cases that had found work requirement approvals unlawful. Though the Court’s action does not preclude future presidential administrations from approving new Section 1115 work requirements, these would likely face legal challenges.

Appendix

Section 1115 Medicaid Work Requirements Timeline
Section 1115 Work Requirement Waiver Requests and Approvals
Litigation Challenging Section 1115 Medicaid Work Requirements
News Release

Abortion at the Supreme Court

Check Out New and Updated KFF Resources to Learn More About the Future of Abortion in the United States

Published: May 3, 2022

On May 2, news media reported a leaked draft of the Supreme Court majority decision for the Dobbs v. Jackson Women’s Health Organization, showing the Court plans to completely overturn Roe v. Wade. The draft opinion is not yet final and abortion remains legal nationwide for now. The final Court decision is expected late June.

Ahead of the final decision, you can find some KFF resources relevant to this Supreme Court case and abortion access:

Video: In Focus with KFF: What Happens if Roe v. Wade is Overturned? 

Issue Brief: State Actions to Protect and Expand Access to Abortion Services

  • This brief reviews the status of state actions to strengthen and guarantee abortion access to their residents, as well as to prepare for the likely increase in demand for abortion services in those states should the high court overturn the constitutional right to abortion established by Roe v. Wade.

Policy Watch: Employer Coverage of Travel Costs for Out-of-State Abortion

  • This Policy Watch gives an overview of employers offering to cover travel expenses for workers who need to go out of state for an abortion in the context of increasing restrictions on abortion around the country. We discuss who is offering these benefits, the implications for workers, and some of the legal and political concerns for employers.

Issue Brief: Abortion at SCOTUS: Dobbs v. Jackson Women’s Health 

  • This issue brief provides background on the legal challenges to the Mississippi law in the context of the Supreme Court abortion precedents, addresses the intersections with the litigation that has arisen from S.B. 8, the Texas 6-week abortion ban, and explains the potential outcomes and how they could impact access to abortion around the country.

Issue Brief: The Intersection of State and Federal Policies on Access to Medication Abortion Via Telehealth

  • This brief outlines the intersection of federal policy regarding dispensing medication abortion with state laws regulating the provision of abortion services and mifepristone dispensing via telehealth and considers the implications of the recent FDA change in different states.

Webinar Recording: Nov. 16 Web Briefing: Update on Women’s Health Policy

  • View a recent KFF briefing about issues that are central to women’s health and well-being, ranging from abortion to paid leave, that are being considered by the Supreme Court, Congress, and state policymakers.

Infographic: The Availability and Use of Medication Abortion Care

  • This infographic highlights data and policies regarding the availability and effectiveness of medication abortion in the United States. Medication abortion accounts for more than half (54%) of all abortions before nine weeks gestation in the U.S.

Infographic: Intersection of State Abortion Policy and Clinical Practice: June 2021 Update

  • This infographic updates a prior JAMA infographic that presents state policies related to abortion and their intersection with clinical practice. The graphic highlights state-level abortion specific policies, ranging from waiting period laws to medication abortion requirements.

Interactive: State Profiles for Women’s Health

  • Explore the latest national and state-specific data and policies on women’s health. Topics include health status, insurance and Medicaid coverage, use of preventive services, sexual health, maternal and infant health, and abortion policies. Many indicators provide state-level information for women of different racial and ethnic groups.