PrEP Access in the United States: The Role of Telehealth
Key Findings
Uptake of pre-exposure prophylaxis (PrEP)—a preventive medication that reduces the risk of acquiring HIV through sex and injection drug use, has been slow, despite its high efficacy and recommended use for those at risk. Furthermore, disparities in access and use exist along racial, ethnic, and gender lines. The Centers for Disease Control and Prevention (CDC) estimates that in 2020 about 300,800 people were prescribed PrEP, representing only 25% of those with an indicated need for the medication.1 The use of telehealth to provide PrEP and associated services (“tele-PrEP”) is a trend that began before the COVID-19 pandemic but we find it has increased for some providers along with the growing use of telehealth generally. However, little is known about the tele-PrEP environment. This brief provides an overview of the tele-PrEP landscape, including how PrEP services (e.g., initial consults, lab work, prescribing, and ongoing monitoring) are provided and factors that facilitate its provision as well as barriers that remain. It is based on in-depth interviews conducted at the end of 2021 with representatives from the major national telehealth companies (those serving all or large portions of the U.S.) providing tele-PrEP and other select tele-PrEP programs. We also highlight two-state run programs – California and Iowa – and four community-based clinics that offer tele-PrEP programs. Collectively, the organizations included in this analysis are estimated to provide tele-PrEP services to over ten thousand clients. Key findings are as follows:
- Tele-PrEP programs have different operational models and financing structures, each with implications for patient costs and company/program revenue. In some cases, services are offered for free to clients but more than half of private companies interviewed charge a fee. Some, but not all, work to enroll uninsured and underinsured patients in assistance programs or insurance coverage. Programs and companies generated revenue through fees charged to clients or organizations who contract with the private companies, by operating as both the pharmacy as well as the provider, and also through the 340B drug pricing program.
- About half of respondents reported conducting visits primarily or exclusively via live video (i.e. using synchronous methods), one primarily uses asynchronous methods (e.g., via text, email, or delayed chat instead of phone or video), and about half use a hybrid approach.
- Laboratory services, a central component to PrEP initiation and related on going care, and prescribing patterns also varied. For example, some respondents primarily used home lab collection kits while others referred patients to in-person labs. In some cases, this was based on client preference, and in others, in response to legal barriers. Likewise, some providers primarily offer generic PrEP while others tend to favor prescribing branded drugs, a choice that was typically tied to program design.
- Some programs are primarily focused on PrEP provision, while others offer additional select services, and some provide PrEP as part of a comprehensive clinical program. All programs have a process for connecting people who are diagnosed with HIV to care and either can treat other sexually transmitted infections (STIs) or have linkages to STI care.
- Respondents offered a range of reasons for providing tele-PrEP. While the private companies stood to earn a profit from their PrEP programs, the predominant reason given for offering this services across all respondents was to provide wider access to PrEP and some tied this objective to reaching the national goal of “ending the HIV epidemic.” For some, tele-PrEP was viewed as a way to address specific access barriers, including stigma associated with PrEP and structural challenges, such as getting time off work or transportation to appointments.
- Clients served were mostly cisgender men who have sex with men, and in their 20s and 30s. Among interviewees who provided estimates, between 23% and 55% of patient populations were people of color. Insurance coverage distribution ranged significantly by tele-PrEP provider. Collectively, the national tele-PrEP companies included in the analysis served clients in all states, with most clients located in California, Texas, Florida, Georgia, and New York.
- Factors that facilitated tele-PrEP provision included multi-state licensing, developing partnerships with community-based organizations, use of marketing, and assisting uninsured clients with insurance enrollments. Respondents’ opinions varied as to whether synchronous or asynchronous communication better facilitated provision of tele-PrEP. Barriers included the challenge of working with insurance companies and Medicaid, laws prohibiting some aspects of telehealth, and retention.
- A spotlight on tele-PrEP provision in California reveals a changing landscape in the state. For example, the state policy environment is evolving to prohibit the use of step-therapy, which usually requires patients try a lower cost or generic drug before a more expensive or brand drug, and prior authorization for PrEP in many cases and to promote the use of home lab collection. The state tele-PrEP program is also undergoing structural changes. The focus on California is noteworthy given the largest share of PrEP users in the U.S. hail from the state.
Taken together and given the number of clients being served via this modality, we find that tele-PrEP offers an additional or alternative avenue for accessing PrEP services. However, little is known about how effectively tele-PrEP can be used to increase access and adherence overall or address disparities in PrEP use and how the client experience of tele-PrEP compares to in-person PrEP services. And despite it’s potential, access challenges to PrEP through tele-health remain: some populations are still being left out, particularly women and people of color, insurance barriers persist, certain policies can hamper uptake (e.g. multi-state licensing and credentialing requirements, coverage of home lab collection, etc.), and knowledge gaps about PrEP among both providers and individuals remain.
Issue Brief
Background
First approved by the FDA in 2012, pre-exposure prophylaxis (PrEP) is a preventive antiretroviral medication that reduces the risk of acquiring HIV through sex by approximately 99% and through injection drug use by at least 74%. Given its high efficacy, PrEP is seen as a cornerstone of efforts to “end HIV,” including in the federal National HIV/AIDS Strategy (NHAS) and the Ending the HIV Epidemic Initiative (EHE). PrEP is recommended for HIV negative people at high risk for acquiring HIV through sex or injection drug use and requires both a medication and routine associated provider visits and labs (see Table 1: PrEP Medications and Associated Services).
| Table 1: PrEP Medications and Associated Services | |||
| Medications for PrEP and Availability at Time of Interviews | |||
| Brand Name | Generic Name (abbreviation) | Available at time of interviews | Formation |
| Truvada | Emtricitabine / Tenofovir (FTC/TDF) | Yes (brand and generic) | Pill |
| Descovy | Emtricitabine & Tenofovir Alafenamide (FTC/TAF) | Yes (brand only) | Pill |
| Apretude | Cabotegravir (CBG) | No | Injectable |
| Laboratory Screening and Visits for Oral PrEP* Initiating and Monitoring | |||
| Assessment and counseling | |||
| Assess for signs/symptoms of acute HIV (to ensure individual is HIV negative); assess and support adherence and HIV risk and risk-reduction behaviors; assess and manage adverse effects; conduct contraception/conception counseling as appropriate. Assessment includes reviewing recent higher risk behaviors and clinical presentation (see page 29 and Figure 2 in the guidelines referenced in this table). | |||
| Labs for Oral PrEP | |||
| |||
| Follow up visits | |||
| |||
| Source: U.S. Centers for Disease Control and Prevention: U.S. Public Health Service: Preexposure Prophylaxis for the Prevention of HIV Infection in the United States—2021 https://www.cdc.gov/hiv/pdf/risk/prep/cdc-hiv-prep-guidelines-2021.pdf*Visit and lab schedule is for oral PrEP only. Injectable PrEP was approved but not available at the time of the interviews. Details on labs and visits needed for injectable PrEP available at link above. | |||
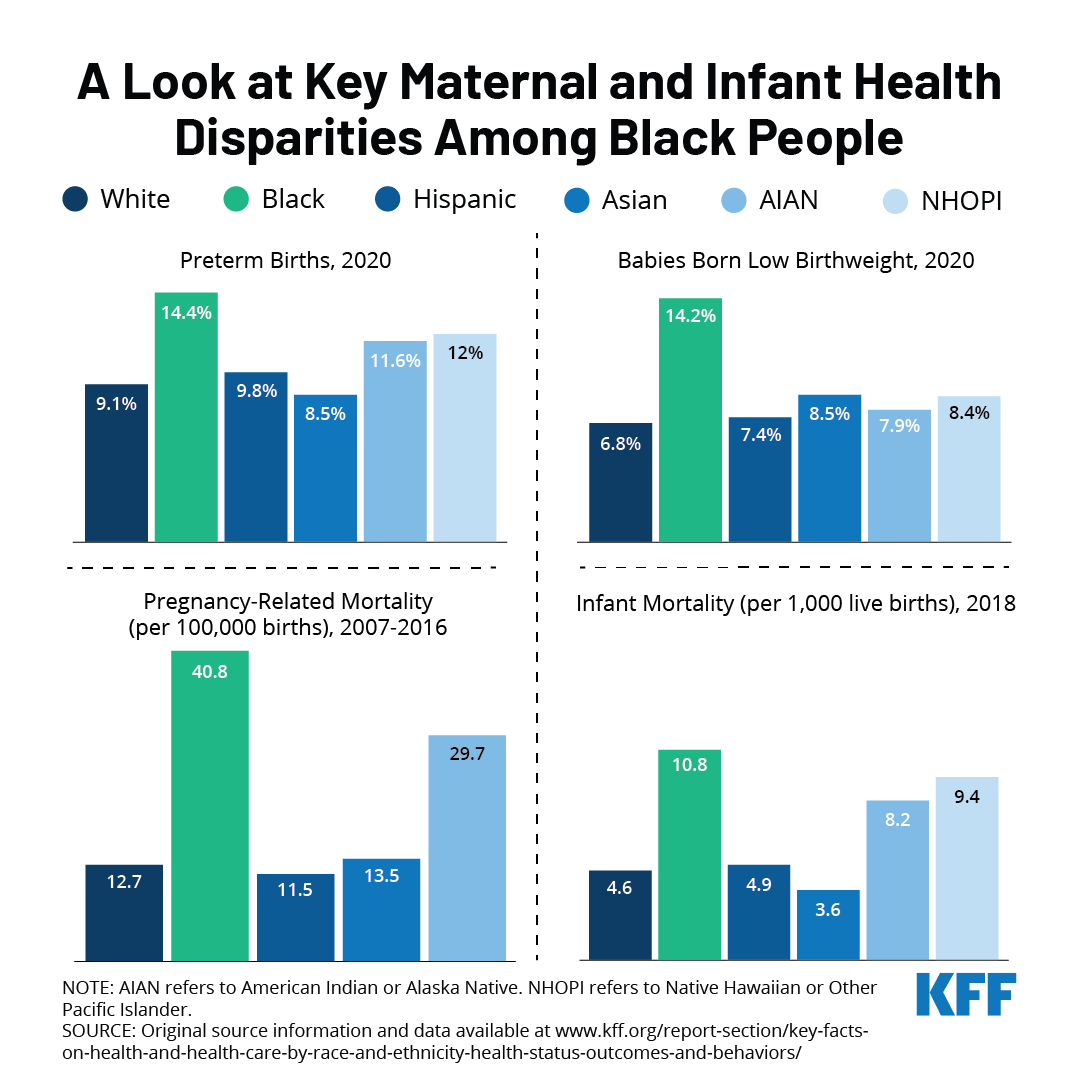
Several policy developments have occurred to help make PrEP more accessible. The CDC first recommended PrEP for certain high-risk groups in 2014. In 2019, the United States Preventive Services Task Force (USPSTF) issued its highest “A” grade recommendation for PrEP which, under the Affordable Care Act (ACA), means that most private health plans and Medicaid-expansion programs are required to cover PrEP without cost-sharing. In 2021, the government clarified that the USPSTF grade also covers PrEP services such as labs and provider visits (see Box on USPSTF). The federal government also launched the Ready, Set, PrEP program in 2019 to provide medication access to those without insurance. Despite these developments, PrEP uptake has been slow. Preliminary data shows that in 2020 just 25% (300,783) of the estimated 1.2 million people in the U.S. who have an indication for PrEP (i.e. those who have higher risk sexual or injection drug use experiences) were prescribed it2 and there are disparities in PrEP use along racial, ethnic, and gender lines. For instance, in 2019, Black or African American people accounted for an estimated 42% of new HIV infections but just 8% of PrEP prescriptions and for Latinos it was 29% and 14%, respectively.3 Likewise, in 2019 women accounted for an estimated 18% of new HIV infections but 9% of PrEP prescription.4
United States Preventive Services Task Force (USPSTF) PrEP Guidance
In 2019, the United States Preventive Services Task Force (USPSTF) issued its highest “A” grade recommendation for PrEP. As a result, most private health plans and Medicaid-expansion programs must cover the service without cost-sharing. However, questions surfaced about whether the recommendation included only the PrEP medication, or the services needed to support PrEP (e.g. provider visits, labs, etc.). Clarification came in July 2021 when federal guidance stated the “A” grade encompassed PrEP services such as HIV testing, STI testing, and PrEP specific office visits, among others. Awareness of and implementation of this policy change, however, is uneven. Some respondents were unaware of this policy development. Others were well versed in it, including those some who said that the change had been important for patient access and reduced costs and others who said that roll out has been uneven with some insurers still charging cost-sharing for these services.
A range of complex and interconnected issues affect PrEP access and utilization. While any provider with the prescribing authority can prescribe PrEP, many do not and some are not aware of it. Those seeking PrEP may not initiate conversations with providers due to stigma. Others might not have a regular provider or a provider competent in PrEP provision and PrEP awareness remains low among some groups with high indication. Actual and perceived costs may also be a barrier for some, particularly for those without health insurance. Additionally, the COVID-19 pandemic limited in-person health care access in certain cases, and made many people less comfortable accessing in-person health care.
The use of telehealth to provide PrEP and recommended services (or “tele-PrEP,”) without in person visits, began before the COVID-19 pandemic, but has increased because of the pandemic. Tele-PrEP may provide a new avenue for PrEP access, yet little is known about how these programs are organized and operationalized, and what the implications of relying on such an approach might be. Past research has largely focused on client experiences.
This project sought to better understand the current role of tele-PrEP in the PrEP landscape, including identifying factors that facilitate tele-PrEP provision and access, as well as barriers that remain. We conducted in-depth semi-structured interviews with individuals in leadership roles at organizations providing or supporting the provision of tele-PrEP across the U.S.
We focused primarily on the national tele-PrEP providers given their intent to provide PrEP via telehealth at the outset (vs. clinics which may provide tele-PrEP as a part of their offerings) and spoke to representatives in leadership positions (i.e. CEOs or tele-PrEP program managers/leaders) from five of the six5 national companies we identified as providing comprehensive access to PrEP (e.g., they facilitate both the medical care and the prescription). These companies were identified through online searches, review of lists of tele-PrEP companies from organizations such as PleasePrEPMe, and based on conversations with stakeholders. To enrich the analysis and provide points of comparison, we also spoke to representatives from four brick-and-mortar clinics with tele-PrEP services selected for regional diversity (one from California, one from New York City, and two from Southern states), and state health officials from California and Iowa about their state-run tele-PrEP programs (representing two of the five states that offer tele-PrEP services). These states were selected because in 2019, California had the highest number of PrEP users, highest HIV prevalence and the second highest HIV incidence and diagnoses. In addition, the tele-PrEP companies included in this study regularly cited California as their largest market. Iowa was selected because the state has been identified as a leader in the tele-PrEP space, with a robust program and the program commonly provides assistance to other states. We also spoke with a representative from a lab company providing home collection services to most major tele-PrEP companies. About one-fifth of this lab’s business comes from tele-PrEP services. In all, we interviewed 12 individuals. Additional background calls were held with other stakeholders who conduct research on PrEP, work in the pharmaceutical industry, and work on PrEP policy and advocacy. Interviews were transcribed and coded by a primary and secondary coder to achieve intercoder reliability using both a priori and emergent codes. Codes were then charted (i.e., coded text was organized in a grid with themes across the top and respondents along the left side to allow for cross-theme/respondent analysis), and finally they were analyzed. Respondent and organization names of private companies and clinics have been withheld throughout the report as interviews were conducted on condition of anonymity.
Findings
Respondent details
The 12 Tele-PrEP providers fell into four categories:
- National tele-health companies, some of which focused primarily on PrEP (5 companies)
- Tele-PrEP programs located within clinics or hospital systems (4 programs)
- State-run tele-PrEP programs: California and Iowa (2 programs)
- A laboratory company that among other services, provides most major tele-PrEP companies with home collection kits and lab services (1 company)
Among the private companies, three began serving PrEP clients just prior to the pandemic’s onset or during the pandemic, after a pre-pandemic planning period. Two of these initiated their services at least a year before the start of the pandemic, with the oldest program serving PrEP patients since 2016. None of the private companies and neither state program cited the pandemic as the reason for offering tele-PrEP. However, some clinic-based programs said that they started their tele-PrEP offerings in response to the pandemic (see section on the COVID-19 Pandemic).
Financing/business model
There were generally four financing models supporting tele-PrEP programs, each of which has implications for patient costs and company/program revenue:
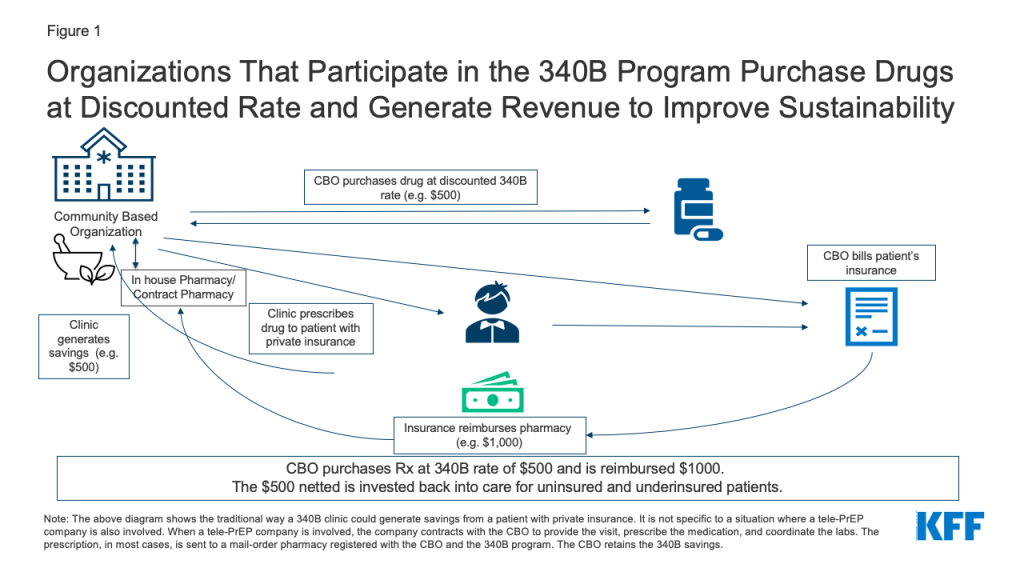
1. Clinic based tele-PrEP programs (4 respondents). Clinic based tele-PrEP programs are programs offered within another clinical setting, such as a hospital, a Federally Qualified Health Center (FQHC), or other type of brick-and-mortar clinic. The four clinic-based programs all accept insurance, including from private and public payers. One clinic-based provider requires patients to be seen at satellite clinics and uses telemedicine machines with video to connect with providers at a primary clinic location. The other respondents use more typical telehealth systems where the patient can be at a location of their choosing (e.g., in their home or car using a computer or smart phone). The satellite tele-PrEP provider charges a per visit fee for uninsured patients ($30) but no others do so. Two clinics have ways of covering costs for the uninsured, including by leveraging 340B savings (see Figure 1, description below, and box on the 340B program), utilizing pharmaceutical industry support for medication, and helping clients enroll in ACA health plans and Medicaid. Of these, one, a California based clinic, also relies on the state PrEP assistance program to cover labs, industry support for medications. One clinic located within a hospital system provides PrEP services to uninsured patients at a discounted rate and is exploring ways to connect with the hospital 340B program.
2. Standalone Tele-PrEP Companies (3 respondents). Three private tele-PrEP companies have stand-alone operations (i.e., they have no formal business relationship with brick-and-mortar clinics). All three charge a fee to clients. In two cases, the fee covers the cost of the medical service and PrEP management and insurance is billed for labs and medication. Of these, one has a lower fee ($15 for three months) but also acts as the pharmacy so generates revenue from both the fee and the dispensing of medication. The other has a higher fee ($15 per month + $59 every three months for the visit) but no direct relationship with a pharmacy so is generating revenue from the fee only. Fees associated with labs and medication are additional for clients of these companies. Both accept private insurance and cash paying clients and one takes Medicaid clients but only in four states (California, Texas, New York, and Illinois). The third company in this group runs on a cash only model, so does not take Medicaid or private insurance, and charges clients a monthly fee ($70-$100 per month depending on the labs ordered). The fee covers the PrEP medication (which is a generic), provider visits, use of the platform, and labs. While these companies do not waive or subsidize costs of labs or fees for the uninsured, one respondent said they will sometimes refer uninsured patients to a tele-health company connected to a Community-Based Organization (CBO) to get free access (see below on the tele-PrEP/CBO hybrid model).
3. Tele-PrEP Company-Community Based Organization (CBO) Hybrids (2 respondents). Two of the private tele-PrEP companies have business models centered around CBO partnerships. With both companies, each tele-PrEP patient is connected to and becomes a patient of a local CBO that participates in the 340B drug pricing program. Qualifying organizations (such as community health centers or STI clinics) that participate in the 340B program are able to purchase drugs at a discounted rate through their own or contract pharmacies. Private insurance typically reimburses for these drugs at a higher rate than the 340B purchase cost. By design, the difference between the drug cost and the reimbursement (or savings) is kept by the program to enhance access to care for patients. (See more detail in box on the 340B Drug Pricing Program and Figure 1). A patient is not required to enter a brick-and-mortar facility in order for a prescription to qualify through the program. However, the patient is required to meet the federal definition of a 340B-eligible patient.6 The tele-PrEP partner company manages clinical visits, labs, pharmacy interactions, and provides the telehealth platform and thus, the CBO may have no direct interaction with the patient. In most cases, and in order for this model to work as designed, the patient fills their PrEP prescription through a registered mail order 340B contract pharmacy associated with the CBO. In exchange, the CBO generates and retains the 340B savings from the prescription. 340B savings are not kept by the tele-PrEP companies. However, patients can opt to fill their prescription elsewhere. While CBOs can direct their own patients to the telehealth affiliate company, more commonly, patients contact the tele-PrEP company directly and are associated with the CBO on the back end. Patients are required to sign an acknowledgment that they are patients of that CBO when they enroll with the tele-PrEP company. The companies do not bill for the labs or the visit. In exchange for the service provided, the CBO pays the tele-PrEP company a fee (either monthly or quarterly) for managing the patient’s PrEP and related services. Neither company charges the patient a fee (see Table 3).
One company covers advertising costs with the fee charged to the CBO and the other has the CBO cover the cost on top of their fee.
Both companies reported they were beginning to enroll eligible uninsured clients into ACA marketplace plans, which allows them to generate 340B savings for these clients. This became more important to them following January 2022 changes to Gilead’s PrEP assistance program (PAP) for uninsured clients (Gilead manufactures both branded oral PrEP medications). In the past, the PAP reimbursed prescribers closer to list price for medications, effectively allowing these organizations to generate savings as they would through 340B, if the client had private insurance. The new PAP policy states that the company will reimburse organizations for only the amount paid per bottle of medication, a dispensing fee, and an administrative fee. Organizations in states that did not expand their Medicaid programs were especially worried about this change as they had higher rates of uninsured clients relying on the PAP. Plan enrollment provides a new way for CBOs to generate 340B savings from PrEP prescriptions by helping these clients become insured. Clients also benefit from gaining insurance for other known or unseen future health needs.
One of the state officials remarked on the challenges in setting up a statewide program and that, especially for states without the capacity to create a program from scratch, there could be value in developing such CBO hybrid programs which would negate the need for staffing or infrastructure.
The 340B Drug Pricing Program and PrEP
The Federal 340B Drug Pricing Program enables safety net health providers to make health services and prescription drugs more affordable for uninsured and underserved people. Section 340B of the Public Health Services Act requires pharmaceutical manufacturers participating in the Medicaid program (virtually all manufacturers) to provide outpatient drugs at significantly reduced prices to 340B “covered entities” (e.g. safety net hospitals, Title X clinics, Federally Qualified Health Centers, among others).
The program promotes access to out-patient prescription drugs and care, including PrEP, in two ways. First, the cost of the drugs is reduced so it is less expensive to treat uninsured and underinsured patients. Second, 340B entities who have purchased drugs at discounted rates can typically get reimbursed at a higher rate for patients with insurance and generate income from the difference. For example, if a 340B entity purchases a drug for $500 and is reimbursed $1,000 by an insurance company (via the in-house or contract pharmacy), the provider generates $500 in savings which is then invested back into the program, funding care for those in need and to “to stretch scarce federal resources” further.
One notable element of the 340B program is its prohibition against so-called “duplicate discounts.” Covered entities are statutorily prohibited from obtaining both a 340B discount and a Medicaid drug rebate discount for the same medication and must have systems in place to prevent this.
4. State Programs (California and Iowa). Both state programs work to maximize access and minimize cost-barriers for PrEP patients in their states. The California state tele-PrEP service is part of the state’s PrEP Assistance Program which provides PrEP access for people who are uninsured, under-insured, or need to use the services for confidentiality reasons (e.g. so parents or partners are not made aware of PrEP use through insurance paperwork). This program covers costs for visits and labs and relies on manufacturer assistance for medications for those without insurance. California’s state program previously contracted with a national telehealth company to provide tele-PrEP but recently shifted to contracting with three CBOs in the state to provide tele-PrEP services remotely throughout the state (see process and fundamentals). It is unclear how or if patients were notified of the change or whether there were patients to notify as uptake of the private run program is reported to have been low. The focus of this program is on the uninsured, but the state does allow insured patients to use the tele-PrEP services as long as the CBO is in-network with the individual’s insurance. While the tele-PrEP component is virtual, the program requires clients to register in person at an enrollment site, of which there are hundreds across the state, a challenge noted by some stakeholders. (For more detail on the California program see the “Spotlight on Tele-PrEP in California” box).
The Iowa program does not bill for the tele-PrEP service and visit, which are subsidized with 340B savings. Insurance (including public and private coverage) is used to cover labs and medications. If uninsured clients engage with the program, they are screened for coverage eligibility and assisted with enrollment, if eligible. The small (less than 10%) share that remain uninsured are helped through industry assistance programs for medications and the state Title X7 network for labs. Those using Title X network labs may face a $5-$10 fee that can be waived if it poses a hardship.
| Table 2: Fees Charged by Tele-PrEP Companies | |||
| CBO or Standalone Model | Fees | Other costs | Other detail |
| CBO | None | None | — |
| CBO | None | None | — |
| Standalone | Yes, $15 every three months | Labs and Medications covered by insurance | Company also acts as pharmacy (thus generating revenue in this role as well) |
| Standalone | Yes, $15 per month and $59 every three months for PrEP visit | Labs and Medications covered by insurance | — |
| Standalone | $70-$100 per month | None | Generic Rx provided at negotiated rate through contracted pharmacy |
Process and Fundamentals
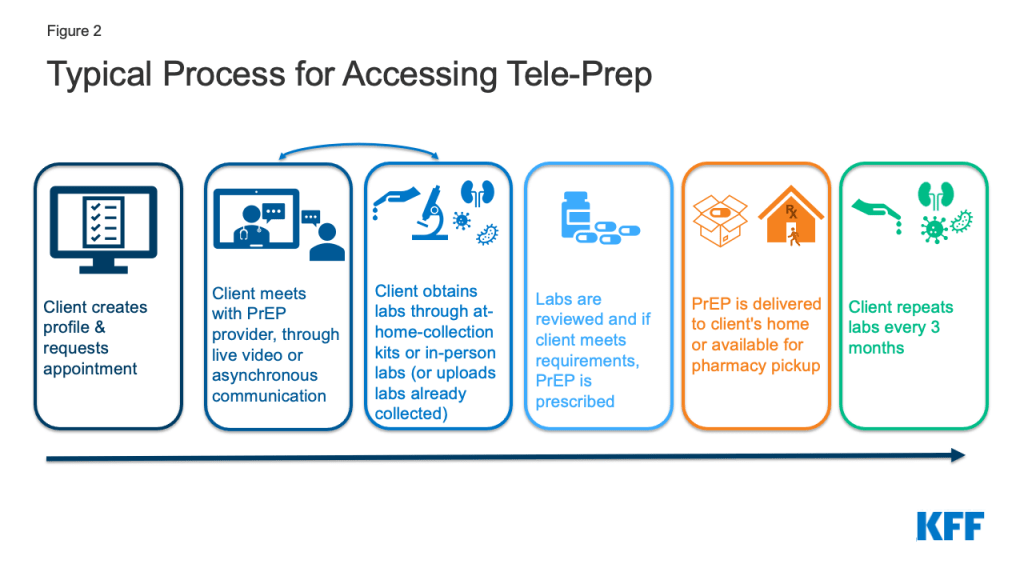
Tele-PrEP providers tended to follow a similar process. Most often, clients encounter their platforms, see a provider, obtain labs, receive a prescription after labs are reviewed, receive medication (either in person or by mail), and then three months later the process is repeated with another provider visit and certain labs. One exception is that clients of the California state tele-PrEP service have to enroll into the state program at in person PrEP Assistance Program enrollment sites. This in-person visit is administrative and not clinical in nature.
The telehealth systems used however, varied by provider:
- About half of respondents (6), including the Iowa state program, reported that PrEP visits are primarily or exclusively conducted using synchronous video – meaning that the patient and the provider see one another and are communicating in real time.
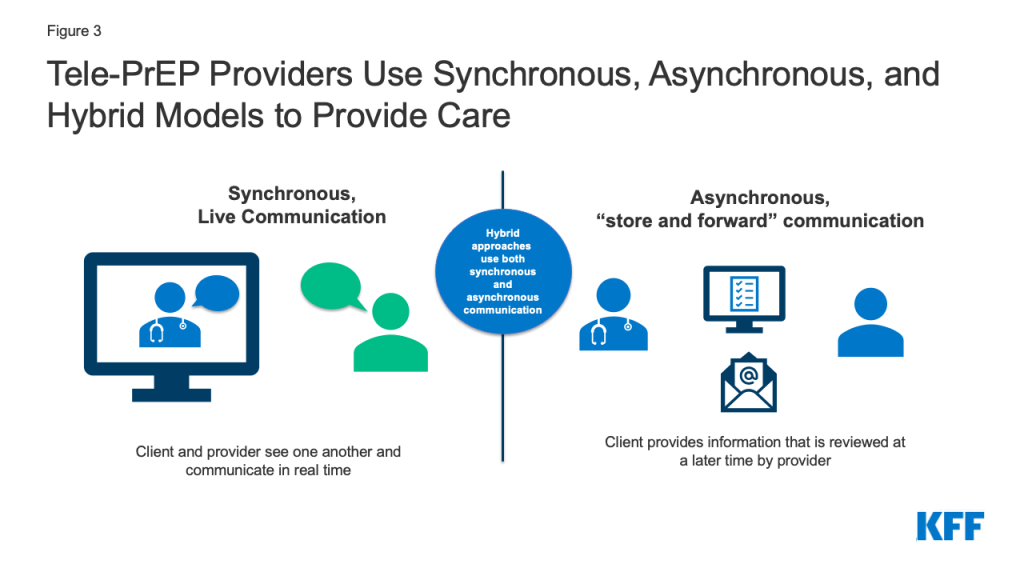
- At the time of the interviews, one (1) provider primarily relied on asynchronous communication (e.g. via text, email, or delayed chat instead of phone or video), but said they speak with clients who need additional support on the phone, including when delivering sensitive information, such as an HIV diagnosis. This provider also noted that as of January 1, 2022, they would be active in states requiring video or phone for telehealth and were ready to fill those requirements in those locations. As such, the provider is now still primarily providing asynchronous care but offers synchronous services as required by state law.
- Three (3) providers take a hybrid approach. These providers use synchronous video some of the time but also conduct communication asynchronously. Two of these providers typically use only limited synchronous video (e.g. once a year or for the first visit) and one allows the patient to decide whether they use video or asynchronous communications.
- One (1) provider with a brick-and-mortar clinic sees patients at satellite clinics using telemedicine machines with video to connect with providers at a primary clinic location.
- The California state program, previously contracted with a telehealth vendor using synchronous video to provide tele-PrEP services but recently brought services in-house and will rely on three community partners and a network of enrollment workers across the state to stand up the services. How services will be delivered will be determined by the systems the community partners already have in place.
Some respondents spoke of the value of at least occasional video visits, believing they could better engage with patients, but others believed patients generally preferred asynchronous communications.
| Table 3: Tele-PrEP Process/Approach Used by Respondents | |||
| Provider | Model | Primarily Synchronous, Asynchronous, Hybrid | Notes |
| Provider 1 | Private Company/CBO Hybrid | Hybrid | Video at least once per year, other times patient choice, general preference is asynchronous |
| Provider 2 | Private Company/ CBO Hybrid | Hybrid | First visit is video, then more automated/asynchronous |
| Provider 3 | Private Company | Asynchronous | Speaks with clients who need additional support on the phone |
| Provider 4 | Private Company | Synchronous | Always synchronous video |
| Provider 5 | Private Company | Hybrid | Patients can opt into a video visit. Most (about 60%) opt for asynchronous. |
| Provider 6 | Clinic Based | Synchronous | Always synchronous video |
| Provider 7 | Clinic Based | Synchronous | Always synchronous video |
| Provider 8 | Clinic Based | Synchronous | Always synchronous video |
| Provider 9 | Clinic Based/satellite program | Synchronous | Satellite program – patients at satellite clinics use telemedicine machines with video to connect with providers at a primary clinic location |
| Provider 11 | State Program (California) | Unclear now (previously synchronous video) | State uses 3 community providers and follows their preferred method of communicating, previously used a telehealth provider that primarily uses synchronous approaches |
| Provider 10 | State Program (Iowa) | Synchronous | Synchronous video is the program preference, occasionally reverts to phone if internet bandwidth fails |
LabORATORY SERVICES
The process for obtaining labs necessary for PrEP initiation and monitoring also varied with some respondents favoring home lab kits and others referring patients to in-person community-based labs and some offering both options. Half of the tele-PrEP providers send patients to community sites, such as Quest or LabCorp, regional hospital hubs, or county clinic locations to get labs drawn. The remainder use both at home and in-person labs to some extent. While some providers stated their clients are roughly split as to whether they use in-person or at home testing, others, especially private companies, primarily use home testing (some for 90%-98% of clients) and use in-person testing only when specifically requested. Most respondents use home collection kits from a single company. However, the Iowa state program, currently using in-person testing, is working to develop their own test kit. Currently, the Iowa Program largely sends clients to brick-and-mortar locations but has a few clients who order home collection kits and pay for those themselves. The tele-PrEP program California previously contracted with used in person labs. Now lab options would be specific to the practices at the contracted CBO.
There was some variation in the types of labs conducted as part of standard PrEP initiation and maintenance. Among those who provided details, all report conducting at a minimum testing for HIV, hepatitis B, and creatinine clearance. Just one provider used only these labs at baseline. Others typically also test for chlamydia, gonorrhea, and syphilis and many included hepatitis C as well. One provider stated that while they encourage the full suite of tests, if a patient refuses the other STI tests, they will prescribe PrEP with just an HIV and creatinine test.
Providers discussed the challenges and opportunities with home versus on-site labs. Respondents mentioned difficulty getting insurance coverage for labs using at home collection in many cases, which was one reason some primarily worked with large in-person national labs, like Quest and LabCorp. Some discussed the new California law, SB-306, which requires insurance coverage of home tests but is facing implementation challenges (see box on SB-306). Some providers identified home collection as a good option for 3-site (pharyngeal, rectal, and urine) testing for chlamydia and gonorrhea, noting that certain commercial labs do not offer 3-site testing and New York state prohibits 3-site collection at in person labs. Some also report that patients are more comfortable taking their own swabs at home. However, others expressed concern with the less precise dried blood spot syphilis assay typically used in the home collection kits which can detect only whether someone has ever had syphilis, not whether someone has an active syphilis infection. Two respondents primarily using in-person lab settings also mail 3-site self-collect kits to patients and noted their ability to take advantage of the best of both testing opportunities by using this hybrid approach.
An additional challenge in New York is that the state generally prohibits self-collection unless the diagnostic has approval from the state lab’s “Clinical Laboratory Evaluation Program.” Given this, most tele-PrEP companies require New York patients to obtain in person labs.
The respondent from a lab servicing tele-PrEP companies mentioned CDC’s updated PrEP guidelines, noting the recommended labs for PrEP provision now include HIV RNA testing alongside a 4th generation HIV test which could pose challenges for home collection due to its expense and because HIV RNA is not currently available for home test kits. Another possible future challenge for home collection identified by respondents is whether the Food and Drug Administration (FDA) will seek to take a larger regulatory role in the home test space in the future, which could make getting tests approved more challenging and disrupt the industry.
California Law SB-306 Requires Coverage of At-Home STI Testing Kits
A new policy in California aims to address some of the reimbursement issues for at-home (i.e. self-collection) lab tests in the state. On January 1, 2022, California law SB-306 went into effect requiring health plans to provide coverage for home test kits for HIV and other STIs (including laboratory costs for processing the kits) that are deemed medically necessary or appropriate and ordered directly by a health care provider or furnished through a standing order for patient use. However, several implementation issues are surfacing. 1) Coverage through the state Medicaid program is contingent upon the addition of codes specific to home test kits in the Current Procedural Terminology (CPT) or healthcare Common Procedure Coding System (HCPCS) which do not yet exist. 2) There have also been implementation challenges ensuring that private health plans follow the law and cover both the kit and lab costs. 3) The labs used by tele-PrEP companies may not be in network for health plans which also poses challenges for reimbursement. Advocates and industry are currently working to try and establish appropriate billing codes for these remote diagnostics where needed and address implementation issues. The new law does not apply to some employer-sponsored health plans that are regulated by the federal government.
Pharmacies
Tele-PrEP provider pharmacy arrangements also varied. While some providers left pharmacy decisions entirely up to patients, others were incentivized to promote a particular type of pharmacy access. Those with 340B relationships, either because of a CBO-hybrid model or because as a clinic they were a 340B covered entity, benefit when patients uses their own pharmacy or a contract pharmacy. One 340B provider with a brick-and-mortar clinic, said that they have been losing out on savings as patients have been using tele-health and filling prescriptions at local pharmacies rather than at the clinic’s 340B pharmacy, and are considering ways to recapture the savings. The two national tele-PrEP companies using the hybrid model prefer patients to use a specialty mail-order pharmacy associated with their operation and registered with the CBO and as a 340B pharmacy so that the CBO is able to capture 340B savings. A third tele-PrEP company with an in-house pharmacy benefits from patients using their mail order service as it is part of their business model. The telehealth company with a cash pay business model exclusively uses a contracted pharmacy to deliver generic PrEP at a negotiated discounted rate. Several, but not all, providers with a preferred pharmacy network mentioned that while they had a preference, patients were free to choose alternative arrangements. Among providers who left pharmacy decisions up to patients, all said patients tended to prefer brick-and-mortar local pharmacies to mail order. For some patients, mail-order may be convenient and beneficial but for others home delivery can present challenges related to stigma/discretion or not having a safe place to leave packages.
Prescribing
All respondents reported starting their clients with a one-month prescription. After the first month, if a patient’s insurance would cover it, most providers offer 90-day prescriptions, a prescribing technique sometimes called “multi-month prescribing” which can be used to improve adherence. Two tele-PrEP companies using the CBO hybrid model note that they face insurance limitations with “multi-month-prescribing” and so write monthly prescriptions. In these cases, insurance companies require multi-month prescriptions to be filled through the insurer company’s contracted specialty pharmacy directly which would not enable these companies to leverage 340B savings for the CBO.
Half of providers said they aim for same day or rapid starts on PrEP where possible but noted some timing challenges while waiting for initial labs, particularly for a negative HIV test. The Iowa state program receives referrals from other parts of the state public health system said that patients often come in already having had an HIV test which makes rapid starts easier. Multiple companies mentioned that if patients come in with labs that they have done elsewhere (e.g. at LabCorp or Quest), it allows them to do a “rapid start” and they will issue the prescription same day. Despite these efforts, several providers stated that in reality, the time between first contact with the patient to PrEP in hand tends to typically be five days to a few weeks.
Medication
At the time of the interviews there were two branded drugs on the market for PrEP, Truvada and Descovy, both available in pill form. While there are multiple generic versions of Truvada available, there is no generic option for Descovy. Branded Descovy and Truvada are both manufactured by the same company, Gilead. The newest PrEP drug, Apretude, manufactured by ViiV, given as an injection every two months (after an initial two-dose series the first month) was not available at the time of the interviews. However, respondents were asked how they were planning for its arrival (see box on “Planning for Long-Acting Injectable PrEP”).
| Table 4: Medications for PrEP Availability at Time of Interview | |||
| Brand Name | Generic Name (abbreviation) | Available at time of interviews | Formation |
| Truvada | Emtricitabine / Tenofovir (FTC/TDF) | Yes (brand and generic) | Pill |
| Descovy | Emtricitabine & Tenofovir Alafenamide (FTC/TAF) | Yes (brand only) | Pill |
| Apretude | Cabotegravir (CBG) | No | Injectable |
About half of providers said they offer a combination of branded and generic drugs. These providers said prescribing decisions are primarily based on insurance, followed by patient need. Some also discussed the role advertising plays in prescribing, particularly as Truvada went generic and Descovy gained FDA approval for PrEP and was marketed heavily in certain markets. They noted patients would come in asking for Descovy by name and some spoke of educating patients on the clinical and monetary value of staying on Truvada or its generic equivalent after patients approached them with requests for Descovy, having seen advertising for it. Some had patients come in already on Descovy and some providers did similar education on generics/Truvada if they did not believe Descovy was clinically indicated.
One respondent mentioned the benefits of California SB 159 to their company as it allows their providers to prescribe more freely. SB 159 requires private health insurance (except for employer based self-insured plans) to cover medications without step therapy, which usually requires patients try a lower cost or generic drug before a more expensive or brand drug, or prior authorization unless there is a generic equivalent. Similarly, they noted Texas SB 680 which also prohibits payers from overriding provider decisions in certain scenarios.
Two private tele-PrEP providers using the CBO hybrid model report that the majority of their patients are on branded drugs and largely on Descovy. One of which reported that 95% of patients are on brand drugs and the other that 75%-80% of clients are on brand drugs. They note that brand drugs and the 340B revenue that can be generated from them for CBOs form the base of their business model. Two other telehealth companies primarily or exclusively provide generic PrEP. One runs their own pharmacy in house, which they generate revenue from, and the other uses a cash pay model and has negotiated a discounted rate through their contracted pharmacy for a generic. Both discussed educating patients on the role of generics.
The California state program requires uninsured clients requesting Descovy or Truvada to go through the manufacturer assistance program, noting most clients get branded drugs through the assistance program, rather than a generic through the state program. The Iowa program, which does leverage the 340B program, prescribes both brands and generics.
Those associated with 340B entities believed generics coming to the market had impacted revenue somewhat but not to a significant degree, noting that for many clients, they were able to continue to fill brand prescriptions to generate savings.
Planning for Long-Acting Injectable PrEP
Apretude, the new long-acting injectable medication for PrEP, was approved by the FDA towards the end of the interviews conducted for this project but not yet available for patients. Respondents were asked whether they were planning to incorporate the option into their business model and the about the conversations they were having with their patients regarding the drug. Most were unsure of how a provider administered injectable fit into the tele-health landscape but were actively trying to assess opportunities. Those with connections to CBOs and programs located within brick-and-mortar clinics appeared further along in the thought process, but many questions and potential barriers remain. Tele-PrEP providers with other models were considering whether they could coordinate with pharmacies to deliver the medication, though they recognized that those pharmacies would have to stock the drug.
Respondents predicted that the new PrEP option would likely require prior authorizations by most payers and believed that this might mean additional workload for their staff. However, some noted that they already had a team experienced in dealing with prior authorizations who were well positioned to handle it.
One provider from a brick-and-mortar clinic looked back on their experiences with injectable HIV treatment, noting key challenges with that roll out that they hoped would not be replicated in the injectable PrEP space, but feared might be. These challenges largely centered on insurers covering the medication as a medical benefit and not pharmacy benefit which meant the clinic had to have the drug onsite (and purchase it in advance) and then bill the insurer after it was administered. There were significant delays in reimbursement, especially at first as claims were getting rejected for the expensive medications. They also worried about equity, not wanting to be in a position of only making the injectable option available to people who have certain types of insurance.
Others though, were more pessimistic at the idea of incorporating a provider administered injectable into the tele-PrEP space saying that “it is hard to inject people through the screen.” Providers in this group said they were updating provider education as they recognized patients would potentially be asking about the option.
Marketing
Respondents reported varied approaches to marketing which can play an important role in the growth of these programs. Private companies tend to place the most emphasis on advertising and commonly did so on dating apps aimed at men who have sex with men such as Grindr, Scruff, and Jack’d. Others, particularly those that have service lines beyond PrEP, advertise on sites like Tinder as well. These companies also use social media, including Facebook and Instagram, to advertise and generate content. Some also use Google ads. Two companies also report using influencers and hosting events/parties as forms of advertising, though one has said that this has slowed down given the pandemic. Beyond private companies, the Iowa program advertises using radio, Google ads, dating apps targeting men, and billboards in more rural areas and one clinic conducts social media advertising and develops YouTube videos. Another clinic receives referrals as a vetted PrEP provider promoted by their city health department which conducts advertising such as on the subway.
Other providers were not doing a lot of advertising and reported that most clients found out about their programs by word of mouth. Most in this group believe their programs might have higher uptake with more advertising. The California program for instance thought low uptake of their services may have been at least in part tied to limited advertising. One provider from a rural southern state expressed frustration with how difficult marketing has been for them due to a limited budget and barriers in trying to promote the tele-PrEP program through dating apps in a socially conservative state and clinical environment.
Support Services
Adherence support
Providers utilize different measures to encourage adherence and to ensure that patients get their labs and set up quarterly appointments. Some report those tools to encourage lab and visit maintenance are built into their platform, others send out a survey after three months to assess whether there are any important changes, and some rely on case managers, medical or physician assistant students, or pharmacists to promote lab and visit follow-ups and medication adherence and monitoring. The Iowa program explained they sometimes purchase adherence tools for those who need them such as key chain pill holders, travel pill cases, and timed bottle tops. Despite these efforts, challenges with adherence were common (see barriers section). However, some noted that adherence with PrEP is sometimes difficult to assess as it is not always clear if a patient has stopped PrEP but is still in need of it or stopped PrEP due to decreased risk, which would be clinically appropriate.
Linkage
Whether respondents can treat HIV or another STI detected through monitoring depends on the type of diagnosis and the infrastructure of the program. Most respondents report being able to treat STIs, such as chlamydia or gonorrhea, that require only a prescription pill. Of the two that did not, one is a CBO hybrid that refers individuals to its CBO partners, and the other is the Iowa state program which connects individuals to state disease intervention specialists. All report a process for connecting people who are diagnosed with HIV and other STIs to care. Some utilize existing CBO relationships and others describe a more manual process of connecting patients to HIV care. The degree of support offered in linkage for STI or HIV treatment appears to vary, while some respondents state only linking patients to local health departments or CBOs, others describe continuing to follow-up with the patient to ensure linkage and treatment was completed.
Some programs take care of patients diagnosed with HIV in-house, namely those connected to a hospital system or clinic, though three telehealth companies report they are seeking to expand service offerings into HIV care in the future. One telehealth company currently has a small HIV treatment and support cohort.
Other support services and linkages
Some respondents also reported providing other support and linkage services, including those related to mental health issues, substance use disorder treatment, and partner services. One telehealth company, the one with a small HIV care cohort, described a virtual support group for people with HIV which is open to those both within and outside of the cohort.
Financial and health insurance assistance
Most respondents enroll patients in pharmaceutical medication assistance or copay programs, as needed, including both the California and Iowa state programs. Most say they have used Gilead’s Advancing Access Program, designed for this purpose. A few have also used the federal Ready Set PrEP Program, which also provides free PrEP to uninsured people. The provider using the cash model does not use these programs and one small hospital-based program was unaware of them prior to the interview. In addition to PrEP specific assistance programs, several respondents report working to help enroll clients in insurance coverage for which they are eligible, including Medicaid but more often, ACA individual marketplace plans. ACA plan enrollment became more appealing after it was made clear the United States Preventive Services Task Force’s (USPSTF) “A” grade for PrEP means that most people with private insurance should have access to PrEP medication and services without cost-sharing (see box on USPSTF PrEP Guidance.)
Providers
Diverse types of clinicians staff tele-PrEP programs. In two cases, medical doctors lead all tele-PrEP work. In most cases, teams were led by either advanced practice nurses or pharmacists with one or a small number of supervising physicians. Two of the programs are fully led and staffed by advance practice nurses. In one case, the team was an even mix of advance practice nurses and doctors.
The tele-PrEP companies all provided services across multiple states and noted that having providers licensed in multiple states was important to their business model. Some saw their ability to facilitate multistate licensing for clinicians as a workplace incentive.
Providers are often supported by other staff such as navigators, counselors, and physician assistance to help with insurance enrollment, work on prior authorization or deal with other insurance issues. In most cases it is also this support staff work with patients on adherence, technical issues, and linkage to other care needs. Sometimes there is also coordination with other public health workers (see section on partnerships below).
Services
The services offered by tele-PrEP providers ranged from those focused exclusively on PrEP to those that provide PrEP within a broader array of services. (See Table 2.) Among those interviewed, two private companies and two hospital-based programs —limit their offerings to PrEP and related services. While the Iowa program is focused on PrEP, it provides linkages to other services. The California program has a list of allowable services that can be covered by the state program for uninsured clients. Two private companies offered PrEP alongside a few other select services. One company also offered contraception, STI testing and treatment (when not physician administered), post-exposure prophylaxis (PEP), acne services, anti-aging services, and migraine services. This company is the one with the small pilot HIV care and support cohort mentioned above. They are also exploring adding mental health, certain urgent care services (e.g. treatment for UTIs and yeast infections), and routine care in the future. The other company offering select services alongside PrEP, provides gender affirming hormone therapy (their specialty focus), erectile medication, and is looking to expand into virtual primary care, fertility, and behavioral health in the future. At the other end of the spectrum, PrEP is just one of a large range of comprehensive health services offered which was the case for one telehealth company and two clinic-based programs.
Among those providing more comprehensive services, the degree to which PrEP delivery was integrated into other care offerings varied. A respondent from one tele-PrEP company stated that while they have fairly comprehensive primary care offerings, their PrEP users tend to have low health needs and only use their PrEP services.
Some though, including the Iowa state program and one clinic, saw PrEP as integrated into their other services and/or as a way to get patients into primary care. Iowa saw potential in their stand-alone tele-PrEP program as being a “gateway” to other in-person health services.
| Table 5: Service Offerings Among Tele-PrEP Providers | ||
| PrEP Only | PrEP and Select Services Only(e.g. PrEP and a handful of other select services) | Comprehensive Service Offerings(e.g. PrEP and a broad range of primary care services) |
| 2 private companies (both hybrid companies with CBO connections) | 2 private companies(both standalone companies, not connected to CBOs) | 1 private company(a standalone companies, not connected to CBOs) |
| 2 clinical programs | — | 2 clinical programs |
| 2 state programs | — | — |
Why Tele-PrEP?
Interviewees offered a range of reasons for providing tele-PrEP that generally aligned with why they believed patients sought out these services. For many, providing wider access to PrEP was specifically the aim of their program and some tied this objective to reaching the goal of “ending the HIV epidemic.” Private companies, state programs, and clinics alike expressed this view. While private companies sought to profit from PrEP delivery, particularly those companies that only provided PrEP or provided PrEP alongside only a handful of other services, representatives generally still expressed a mission driven focus rather than a financial one.
In some cases, broadening access to PrEP through telehealth was viewed as a way to address specific barriers such as stigma, time off, and transportation, among others. Others saw providing telehealth services as a way to stay relevant in a changing health care landscape, while reaching an underserved population, particularly when the existing approaches were not working for certain groups. One clinical program started offering telehealth services, including tele-PrEP, in response to the pandemic (see section on COVID-19).
Who is being served?
Most respondents aim to serve a broad range of PrEP clients, but a few focus on specific communities. One of the tele-PrEP companies specializes in serving the LGBTQ+ community and one of the hospital clinics focuses on serving young people. An additional provider has a relationship with a residential substance use treatment facility and provides tele-PrEP services to that population. Except where noted, client demographics of PrEP users at national companies did not differ much from those in clinical or state programs.
Region
Of the five national tele-PrEP companies, three served clients in all 50 states and DC (at least one of which also served Puerto Rico). One served clients in about half of states and one served clients in about two-thirds of states; both of these companies report they are continuing to add states to their network. Several companies stated that the largest share of their clients came from California. Texas, Florida, Georgia, and New York. Respondents noted that the states where most clients originate from track with population density and HIV prevalence. Other respondents focus their services on a single state due to the location of a clinic or state program and are unable to serve those outside the state through telehealth due to policy restrictions.
PrEP providers generally stated that while most of their clients were from urban areas, they have rural clients as well and see tele-PrEP playing an especially important role for these individuals who may face more stigma or have fewer local options for accessing PrEP in-person. However, some reflected that while telehealth is often discussed as a way to reach those in rural settings, the need for telehealth crosses the urban-rural divide.
Spotlight on Tele-PrEP in California
This box provides a spotlight on tele-PrEP provision in California, including specific issues identified by respondents. We focus on California given that the state has the largest number of PrEP users in the U.S. and was identified by tele-PrEP companies in this study as their largest or among their largest market(s). Additionally, California’s PrEP policy environment is evolving due to changes in state legislation and changes within the tele-PrEP Program.
***
The California tele-PrEP program was launched in the fall of 2019 and is part of the state’s PrEP Assistance Program (PrEP-AP), which provides PrEP, PrEP related services (e.g. labs) and certain other allowable services (e.g. STI treatment). While the tele-PrEP piece of the program is provided through remote access, clients must first enroll in-person at one of several hundred enrollment sites throughout the state before they can qualify, a requirement which may pose a barrier to some clients. In addition, clients must re-enroll annually, since they need to be re-screened for eligibility. The program is largely geared towards uninsured clients, though those who are privately insured can also use it as long as the provider seen is in-network with the client’s insurance company. For those with coverage, the program can cover copays. However, there is less need for assistance with PrEP specific services given new USPSTF guidance requiring PrEP related services be covered without cost-sharing (see also, box on USPSTF and PrEP). In addition, the state will consider some program clients as uninsured for confidentiality reasons (e.g. so as not to disclose PrEP use to a parent or spouse) to promote access for these groups.
When created, the tele-PrEP element of the PrEP-AP program was outsourced to a national tele-health company offering synchronous tele-PrEP services and using brick-and-mortar labs (as opposed to at-home lab kits). Uptake of that program is reported to have been limited. While it is unclear why uptake was so limited, one explanation offered was that there had been little advertising. When the state’s contract with the company expired at the end of 2021, it was not renewed for undisclosed reasons.
As of January 2022, state tele-PrEP services are delivered by three California based community-based organizations (CBOs) through an arrangement with the state. It is unclear how or if patients were notified of the change in vendors or if there were any clients enrolled at the end of 2021 to notify. While the three CBOs are physically situated in three locations, they can see patients from across the state virtually and are loosely assigned to geographic regions (i.e. Northern, Central, and Southern California, and the Los Angeles area). How tele-PrEP is now delivered (e.g. synchronously or asynchronously) is based on the system for telehealth delivery already in place at the partner CBO. Similarly, whether at-home labs are offered is driven by CBO protocol as are the panel of labs run. Prescriptions must be picked up at a pharmacy contracted with Magellan, the state’s pharmacy benefits manager, though some pharmacies offer home delivery through other vendors. In general, generics are provided and if a client requests or requires a brand name, Truvada or Descovy, they must go through the manufacturer assistance program. Most clients get branded drugs through the industry assistance program rather than a generic through the state program.
In addition to the above-described models for the state’s tele-PrEP providers, the state PrEP-AP program also permitted their in-person PrEP providers to see PrEP clients virtually because of the COVID-19 pandemic.
One respondent providing tele-PrEP to young people in the state discussed the value of having access to a range of California based safety net payers and programs to help ensure robust and discrete access including Medicaid expansion, the Family PACT program, ACA enrollments, and the state PrEP-AP program. They contrasted this experience with states without Medicaid expansion and more limited support systems.
Key issues identified in the interviews as impacting tele-PrEP provision in the state of California are as follows:
- CA law SB-159 requires private health insurers (except for employer-based, self-insured plans) to cover medications without step therapy or prior authorization unless there is a generic equivalent. In the PrEP space this would mean providers are free to prescribe Descovy (which does not have a generic equivalent) without facing medication management barriers. One respondent from a tele-PrEP company noted this California law made prescribing Descovy easier in the state which happens to be their largest market.
- CA law SB-306 requires health plans to provide coverage for home collection kits for HIV and other STIs testing deemed medically necessary or appropriate and ordered according to the law, making home collection more affordable. This is an important step towards access as in other parts of the country, respondents noted it is difficult to get reimbursement for home collection kits. However, reimbursement challenges remain for implementing the policy in Medicaid due to a lack of procedural codes. Implementation barriers also exist for private health plans as some may not be covering both the kit and the lab costs. There may also be coverage challenges if the labs used by tele-PrEP providers are not in-network with client insurance plans. Solutions to this barrier are being explored by advocates and industry.
- Several private companies cited challenges with contracting with Medicaid as a reason they did not accept this form of coverage and one respondent specifically cited California as presenting particular challenges given its large number of Medicaid Managed Care Organizations. However, a separate respondent from a private company with similar concerns about the challenges in contracting with Medicaid stated that California is one of only handful of states where they do accept Medicaid clients and bill the program.
Numbers served
The number of PrEP clients being served varied significantly across respondents and not all provided a number or range. The national telehealth companies offering numbers each said they served thousands of clients. State and clinical programs tended to serve fewer clients, some with just 20 active clients. However, one clinical provider said that they served about one thousand clients exclusively through tele-PrEP, one thousand through their in-person option and an additional thousand patients though a hybrid of in-person PrEP and tele-PrEP. Collectively, the organizations included in this analysis are estimated to provide tele-PrEP services to over ten thousand clients.
Gender identity and Sexual Orientation
Respondents report primarily serving cisgender men, who typically made up about 90% or more of a patient population. Clients are largely LGBTQ+, though one respondent whose client population is 98% male said 19% do not identify as gay. Some said that the remaining share served were women and others said it was a mix of women and transgender clients. One respondent reported primarily serving transgender and nonbinary clients. The tele-PrEP provider with a satellite program had the largest share of women among their clients (25%) and believed that was possible because of the personal rapport they had built with these clients over time.
Race/ethnicity
Fewer than half of respondents were able to estimate the race/ethnicity makeup of their client population, though some said they plan to collect this data in the future. Among the four that provided specific estimates, between 23% and 55% of their patient populations were people of color. Most said this group primarily included Black and Hispanic people but one provider reported that 20-30% of their clients have Asian ethnicity. One national tele-PrEP company said that in California and Florida they primarily serve Latino people but in every other state White clients make up the largest racial/ethnic group of clients. Nationally, 61% of PrEP users were White in 2019 and there is higher unmet need for PrEP among people of color.
Age
Most providers report that their patients are typically in their 20s and 30s or gave an average or median age in the late 20s. A few said they also commonly served clients in their 40s. Most said that aside from these averages, they had clients in younger and older stages of life. One respondent’s clinical program serves only teens and young adults. Most respondents said that they were able to assist clients under 18 but had few or no clients in that age group. One respondent from a national company said they were not able to provide services to those under 18 due to policies at partner organizations.
Insurance
Insurance coverage distribution among clients ranged significantly by type of tele-PrEP provider and was tied closely to business models. Some private programs were cash pay or private insurance only, whereas others welcomed those who were uninsured or covered by Medicaid, typically clinics and some private companies. As noted earlier one private company only took Medicaid clients in handful of states (California, Texas, New York, and Illinois). Others treated those with Medicaid as uninsured rather than navigate those state programs. As noted, several programs report offering insurance enrollment assistance. The California program is generally for the uninsured population but a privately insured patient can use the services if one of the community partners is in their insurance network. The program will also treat some clients using the program for confidentiality reasons (e.g. so as not to disclose PrEP use to parents or a spouse) as uninsured. The Iowa program serves people with any type of insurance and most (about 70%) of clients have private coverage.
Facilitators
Respondents identified a variety of factors that support them in their ability to offer tele-PrEP or help patients stay engaged.
Staffing: Several respondents spoke of how their case management or support teams were essential to engaging clients, working through insurance barriers, enrolling clients in assistance programs, and insurance coverage and promoting retention. One respondent mentioned the importance of having a diverse group of clinicians that speak multiple languages. Another saw significant value in their program being staffed by pharmacists working at the top of their licensure.
Streamlining: Respondents discussed how the more they streamlined the process for patients, the easier it was for patients to engage. For example, when one organization launched their program, they would take full sexual history at enrollment, but moved away from the practice when they realized it deterred patients when asked to share that information upfront. Respondents also noted that it was important to see patients as soon as possible after they expressed interest and that the longer time between initial engagement and first appointment, the higher the probability of them not showing up to those appointments.
Partnerships: Several respondents spoke of formal and informal partnerships that made their programs more successful, including bringing in new PrEP patients and linking patients to services outside their programs. The Iowa program relies on linkages with their STI and HIV programs and their disease intervention specialists (DIS) who assess PrEP interest as standard procedure and provide referrals to the program. Two other programs (one clinic based and one private telehealth company) reported receiving referrals from the state. Others work with local Planned Parenthood or Title X providers to get labs for patients without insurance. One California provider also relies on wrap around support from the state family PACT program. Another provider running a hospital telehealth program gets support from an HIV specialty pharmacist in another program and receives patient referrals from a local substance use treatment center.
Other Facilitators Discussed Elsewhere in the Report
- Asynchronous/Synchronous models (respondents differed in their beliefs as to which was more of a facilitator, with some preferring a hybrid approach)
- Multi-state licensing for providers
- Marketing
- Insurance (ACA and Medicaid) Enrollment
- Multi-month prescribing
- USPSTF – “A” grade and subsequent guidance
- Rapid Starts (for PrEP and for people diagnosed with HIV)
- Using home labs for 3-site STI testing when not available at in-person settings
Barriers
Respondents also identified factors that made offering tele-PrEP or helping patients stay engaged more challenging.
Insurance: Issues related to working with insurance were the most frequently cited barriers. Respondents described reimbursement challenges for at-home self-collect labs with Medicaid and private insurance. Lack of billing codes for at-home self-collect tests has been especially challenging with respect to Medicaid and it appears not all private plans are reimbursing for both the test kit and the laboratory service. There are also challenges when the labs used for home collection are not in-network with insurance. Respondents also stated that some patients are still getting billed for labs and associated provider visits that should be covered without cost-sharing by their plans under USPSTF guidelines (see box on USPSTF guidelines). Finding ways to cover services for young privately insured patients who are still on their parents’ insurance but do not want to use their parents’ insurance for confidentiality reasons, was another barrier mentioned. Several respondents discussed that regulations around Medicaid were a barrier, including having to navigate state-by-state policies and low reimbursement rates. One respondent from a private company cited the large number of managed care organizations in the California Medicaid program as an example of how challenging contracting with Medicaid could be. Another private company takes Medicaid clients only in California, New York, Texas, and Illinois because contracting with Medicaid programs in all states would be too cumbersome. In fact, some companies considered Medicaid patients to be uninsured for the purposes of billing and reimbursement.
State Telehealth and Provider Credentialing Laws: Several respondents discussed limitations on provider credentialing that varied by state and one respondent mentioned there are some challenges with state regulations requiring oversight for physician assistants. Recruiting clinicians with multistate licenses also proved to be a barrier for some. One respondent mentioned that 12 states do not allow for asynchronous telehealth, which makes their asynchronous model of providing care through texting and e-mailing a challenge and will require them to adapt how they deliver tele-PrEP in those regions.
Tele-PrEP Uptake and Patient Awareness: A few of the smaller, clinically based providers had fairly low program uptake (i.e. fewer than 20 clients). These tended to be the providers that put less of an emphasis on advertising and without a significant presence in the HIV/LGBTQ+ community. The California state program also had low enrollment by the end of last year. One respondent stated that many patients are not aware that PrEP exists, especially women, or that they are unaware of where to get PrEP. This same respondent discussed difficulties in reaching the people through advertising.
Retention: Many respondents discussed challenges retaining patients, even after accounting for clinically appropriate attrition (e.g. a patient cycles off of PrEP because they are no longer at higher risk for HIV). One respondent explained that retention for women is more difficult than retention for men. A number of respondents had relatively high retention rates for one additional refill, but then found that patients dropped off afterwards. One respondent said patients typically stay for two or three months. Of the three respondents that shared longer term retention rates those ranged from 40%–“80% or 85%” which is comparable to rates reported for in-person PrEP. One respondent mentioned that while patients may appropriately go on a pause, some do not restart when they should or they may have exhausted their supply of meds and not have some on hand when they are ready to restart.
Other Barriers Discussed Elsewhere in the Report
- NY state has limitations on self-collection testing and does not permit in-person three-site chlamydia and gonorrhea testing at in-person labs
- Plans and pharmacies that have limitations around multi-month prescribing
- Changes to the Gilead assistance program – uninsured patients no longer generating 340B savings
- Knowledge limitations with assistance programs and USPSTF guidance, especially with smaller providers
- Private insurance non-compliance with federal guidance on USPSTF prohibiting cost-sharing for PrEP related services.
- CDC’s newest HIV screening recommendations include an HIV RNA testing which can be costly and is not currently available for home test kits
- Challenges with home testing for syphilis – may detect past infections
- Testing every three months for patients on PrEP can be seen as onerous
- Reaching women
The COVID-19 Pandemic
The COVID-19 pandemic provided opportunities for some of the larger tele-PrEP companies to expand and accelerate their tele-PrEP offerings. As noted earlier, none of the private companies or state programs attributed the pandemic with the reason for launching their tele-PrEP programs, but one clinical program started theirs in response to the pandemic. Also, in addition to the tele-PrEP program, the California PrEP-AP program allowed their typically in-person providers to see PrEP clients virtually during and because of the COVID-19 pandemic. Multiple respondents described the proliferation and shift to telehealth as the silver lining of the pandemic.
Respondents also explained how the COVID-19 pandemic shifted patients’ perspectives and preferences for care. One company explained that when PrEP clinics were closed early in the pandemic and patients could not get in for their labs or refills, they turned to tele-PrEP. Then when clinics reopened, clients decided they preferred tele-PrEP over going into the clinic.
However, other smaller programs or hospital-based programs, especially the program that provides satellite tele-PrEP services, did not see an increase in clients due to the pandemic. Some of these programs had to shift to focusing on COVID and tele-PrEP became less of a priority.
Conclusion
In this analysis, we provide a first look at the growing area of PrEP provision through telehealth. We find there is significant variation in how tele-PrEP providers run their programs, differences that may have implications for both patient access as well as long-term sustainability. For example, some programs are exclusively PrEP focused, free to patients, and rely on income generated from 340B savings to form their business model. Others offer a range of services beyond PrEP and charge clients a fee or generate additional revenue from their own pharmacy. Despite these differences, and although some stand to profit from their businesses, tele-PrEP providers have the common goal of broadening PrEP access through a new modality and believe they are solving access barriers to PrEP, for at least some clients. Respondents discussed policy areas that stand to bolster or limit the success of these programs. Policy areas that hamper tele-PrEP success include challenges with insurance coverage (e.g. lack of coverage for home lab collection, limitations on multi-month prescribing, non-compliance with the USPSTF guidance, etc.), laws that make interstate practice/licensing cumbersome with respect to conducting telehealth sessions, and barriers to self-collect labs. Policies and practices identified that bolster tele-PrEP include leveraging staff skill sets to aid in patient engagement, streamlining programs, developing partnerships, advertising, supporting multistate licensing for staff, ACA enrollment, and private plans that are adhering to new USPSTF PrEP guidelines. While few respondents started their programs in response to COVID-19, tele-PrEP providers largely agreed that their ability to promote and scale their programs has been enhanced because of a national shift embracing telehealth in response to the global pandemic. These findings suggest that tele-PrEP may offer an additional or alternative avenue for accessing PrEP services, which may be especially notable as efforts to “end HIV” in the US hinge, in part, on increased PrEP uptake.
| Table 6: Characteristics of Tele-PrEP Providers in the Study | |||||||
| Provider | Model | Primarily Synchronous, Asynchronous, Hybrid | Labs | Fees and Costs | Insurance | Pharmacy Preference | Rx Preferences |
| Provider 1 | Private Company/CBO Hybrid | Hybrid | 98% home collection and 2% use Quest or LabCorp. | None | 70% privately insured. Available to insured and uninsured people. Those with Medicaid and Medicare treated as uninsured. | Mail-order pharmacy associated with company and registered with CBO | 95% branded (mostly Descovy) and 5% generic |
| Provider 2 | Private Company/ CBO Hybrid | Hybrid | 90% home collection and 10% use Quest of LabCorp | None | 45% privately insured. Available to insured and uninsured people. Those with Medicaid and Medicare treated as uninsured. | Mail-order pharmacy associated with company and registered with CBO | 75%-80% branded (“lean Descovy”), 20%-25% generic |
| Provider 3 | Private Company | Asynchronous | Home collection kit unless insurance mandates commercial lab. | Fee: $15 every three months. Labs and Medications not covered by insurance. | Mostly private insurance, 7% cash pay. Medicaid patients accepted in Texas, New York, California and Illinois only. | Company pharmacy | 90% generics and 10% brand (typically when insurance driven or clinically appropriate) |
| Provider 4 | Private Company | Synchronous | Commercial labs, largely Quest and LabCorp. | Fee: $15 per month and $59 every three months for PrEP visit. Labs and Medications not covered by insurance | Private insurance and cash pay only. | Mostly brick-and-mortar. | Unknown |
| Provider 5 | Private Company | Hybrid | About half do home collection and half go to Quest. | Fee: $70-$100 per month inclusive of visit, lab, and Rx | None | Contracted pharmacy | All generics from preferred vendor. |
| Provider 6 | Clinic Based | Synchronous | All labs done in the community. | None for the uninsured.Costs for the insured relate to insurance (unclear about USPSTF implementation) | Mostly Medicaid; 30% private insurance; 5% Medicare; 10%-15% uninsured. | Benefits from using 340B pharmacy but most patients use commercial pharmacies | Mostly on generics or Truvada. |
| Provider 7 | Clinic Based | Synchronous | Most prefer commercial labs to home collection but will send 3-site collection kits to those who get other initial labs in person. | None for the uninsured. Insurance covers for others, team helps patient fight any cost-sharing (per USPSTF guidance.) | About half are privately insured, another about 20%- 30% are privately insured but can’t use it because it’s under their parents policies. | Most use brick-and-mortar pharmacies but “a lot are interested in mail-order.” | Mostly on generics or Truvada. |
| Provider 8 | Clinic Based | Synchronous | Community based, including at regional hospital hubs, exploring home collection option. | Reduced pricing for the uninsured through hospital uninsured program (60%-65% off). Insurance used for the others. | Available to those with any insurance and the uninsured. | Wherever convenient for patient. | Truvada, Descovy, Generics – guided by insurance. |
| Provider 9 | Clinic Based | Synchronous/Satellite | Mostly test in house at satellite locations. Some COVID home collection, but minimal. | $30 fee for uninsured patients. | Private and public insurance is accepted. The uninsured are seen for a fee. | In-house pharmacy. | Brand and generics prescribed. |
| Provider 10 | Iowa State Program | Synchronous | Largely going to brick-and-mortar. A few pay cash for home collection. Developing own home test kit. | No program fees, possible lab fee of $5-$10 for the uninsured that can be waived. | 70% private, 10% uninsured. | Preference their own pharmacy or partner pharmacy. | Brand and generics prescribed. |
| Provider 11 | California State Program | Unclear now (previously synchronous video) | Follows community partner protocol. | Follows community partner protocol but most clients receive in person labs. | Generally, for uninsured population but a privately insured patient can use the services if one of the community partners is in a network. Patients using the service for confidentiality reasons are treated as uninsured. | Preferred state pharmacy network. | Uninsured clients requesting Descovy or Truvada must go through the manufacturer assistance program. |
This work was supported in part by the California HIV/AIDS Policy Research Center (CHPRC) with APLA Health acting as fiscal intermediary.CHPRC/APLA Health also provided feedback on the final version of this report.
We value our funders. KFF maintains full editorial control over all of its policy analysis, polling, and journalism activities.
Endnotes
- Centers for Disease Control and Prevention’s (CDC) AtlasPlus https://www.cdc.gov/nchhstp/atlas/index.htm (Accessed April 20, 2022). ↩︎
- KFF analysis of data from the Centers for Disease Control and Prevention’s (CDC) AtlasPlus https://www.cdc.gov/nchhstp/atlas/index.htm (Accessed February 25, 2022). ↩︎
- KFF analysis of data from the Centers for Disease Control and Prevention’s (CDC) AtlasPlus https://www.cdc.gov/nchhstp/atlas/index.htm (Accessed April 6, 2022). ↩︎
- KFF analysis of data from the Centers for Disease Control and Prevention’s (CDC) AtlasPlus https://www.cdc.gov/nchhstp/atlas/index.htm (Accessed April 6, 2022). ↩︎
- The 6th company did not respond to repeated requests for interviews. We identified a 7th company that was not included in the initial sampling frame. ↩︎
- I.e. the 340B entity has a relationship with the patient and maintains the individua’s health records; the individual receives health services from a health professional employed by entity or under contact or other arrangement with the entity; the health services received are consistent the services for which grant funding or of FQHC status was provided. See https://www.hrsa.gov/sites/default/files/hrsa/opa/programrequirements/federalregisternotices/patientandentityeligibility102496.pdf ↩︎
- The Title X National Family Planning Program, administered by the U.S. Department of Health and Human Services (HHS), Office of Population Affairs (OPA), is the only federal program dedicated solely to supporting the delivery of family planning and related preventive health care. In return for federal support, the Title X program requires that its grantees meet very specific performance criteria. In addition to providing women, men, and teens with a broad range of contraceptive services and supplies and other preventive, screening, and treatment services, Title X grantee clinics must follow special federal confidentiality protections and are expected to adhere to national Quality Family Planning Guidelines (QFP). ↩︎