Experiences with Health Care Access, Cost, and Coverage: Findings from the 2022 KFF Women’s Health Survey
Report
Introduction
Women’s access to health care is shaped by a broad range of factors, including coverage and income, the availability of health care providers in their communities, and the affordability of care and health insurance.
The Affordable Care Act (ACA) has expanded pathways to affordable coverage to millions of women by broadening eligibility for Medicaid and providing subsidies to make individual health insurance coverage more affordable for those who do not have access to coverage through their employer. The ACA also contains provisions aimed at alleviating some of the financial barriers to health care; however, many women still face challenges with health care costs and medical bills, particularly those who are uninsured or have low incomes.
This report presents findings from the 2022 KFF Women’s Health Survey (WHS) on women’s health status, use of health care services, and costs. The WHS is a nationally representative survey of 5,145 self-identified women ages 18 to 64, conducted May 10 – June 7, 2022. See the Methodology for more details.
Summary of Findings
- The majority of women ages 18-64 report being in excellent, very good, or good health (82%); however, nearly one in five (18%) women describe their health as fair or poor, with substantial differences by sociodemographic characteristics.
- Half of women (49%) report having an ongoing health condition that requires regular monitoring, medical care, or medication and 18% report having a disability or chronic disease that keeps them from participating fully in work, school, housework, or other activities, with higher rates among older women. Ten percent of women with a disability or ongoing health condition do not have a regular doctor or health care provider.
- Nearly all women ages 18-64 (95%) have seen a doctor or health care provider in the past two years, but a smaller share has had a general check-up or well-woman visit (73%). Uninsured women are significantly less likely than insured women to have seen a provider or had a check-up in the past two years.
- Overall, women have more interactions with and connections to the health care system than men. Higher shares of women report having a usual source of care and have visited a health care provider in the past two years than men.
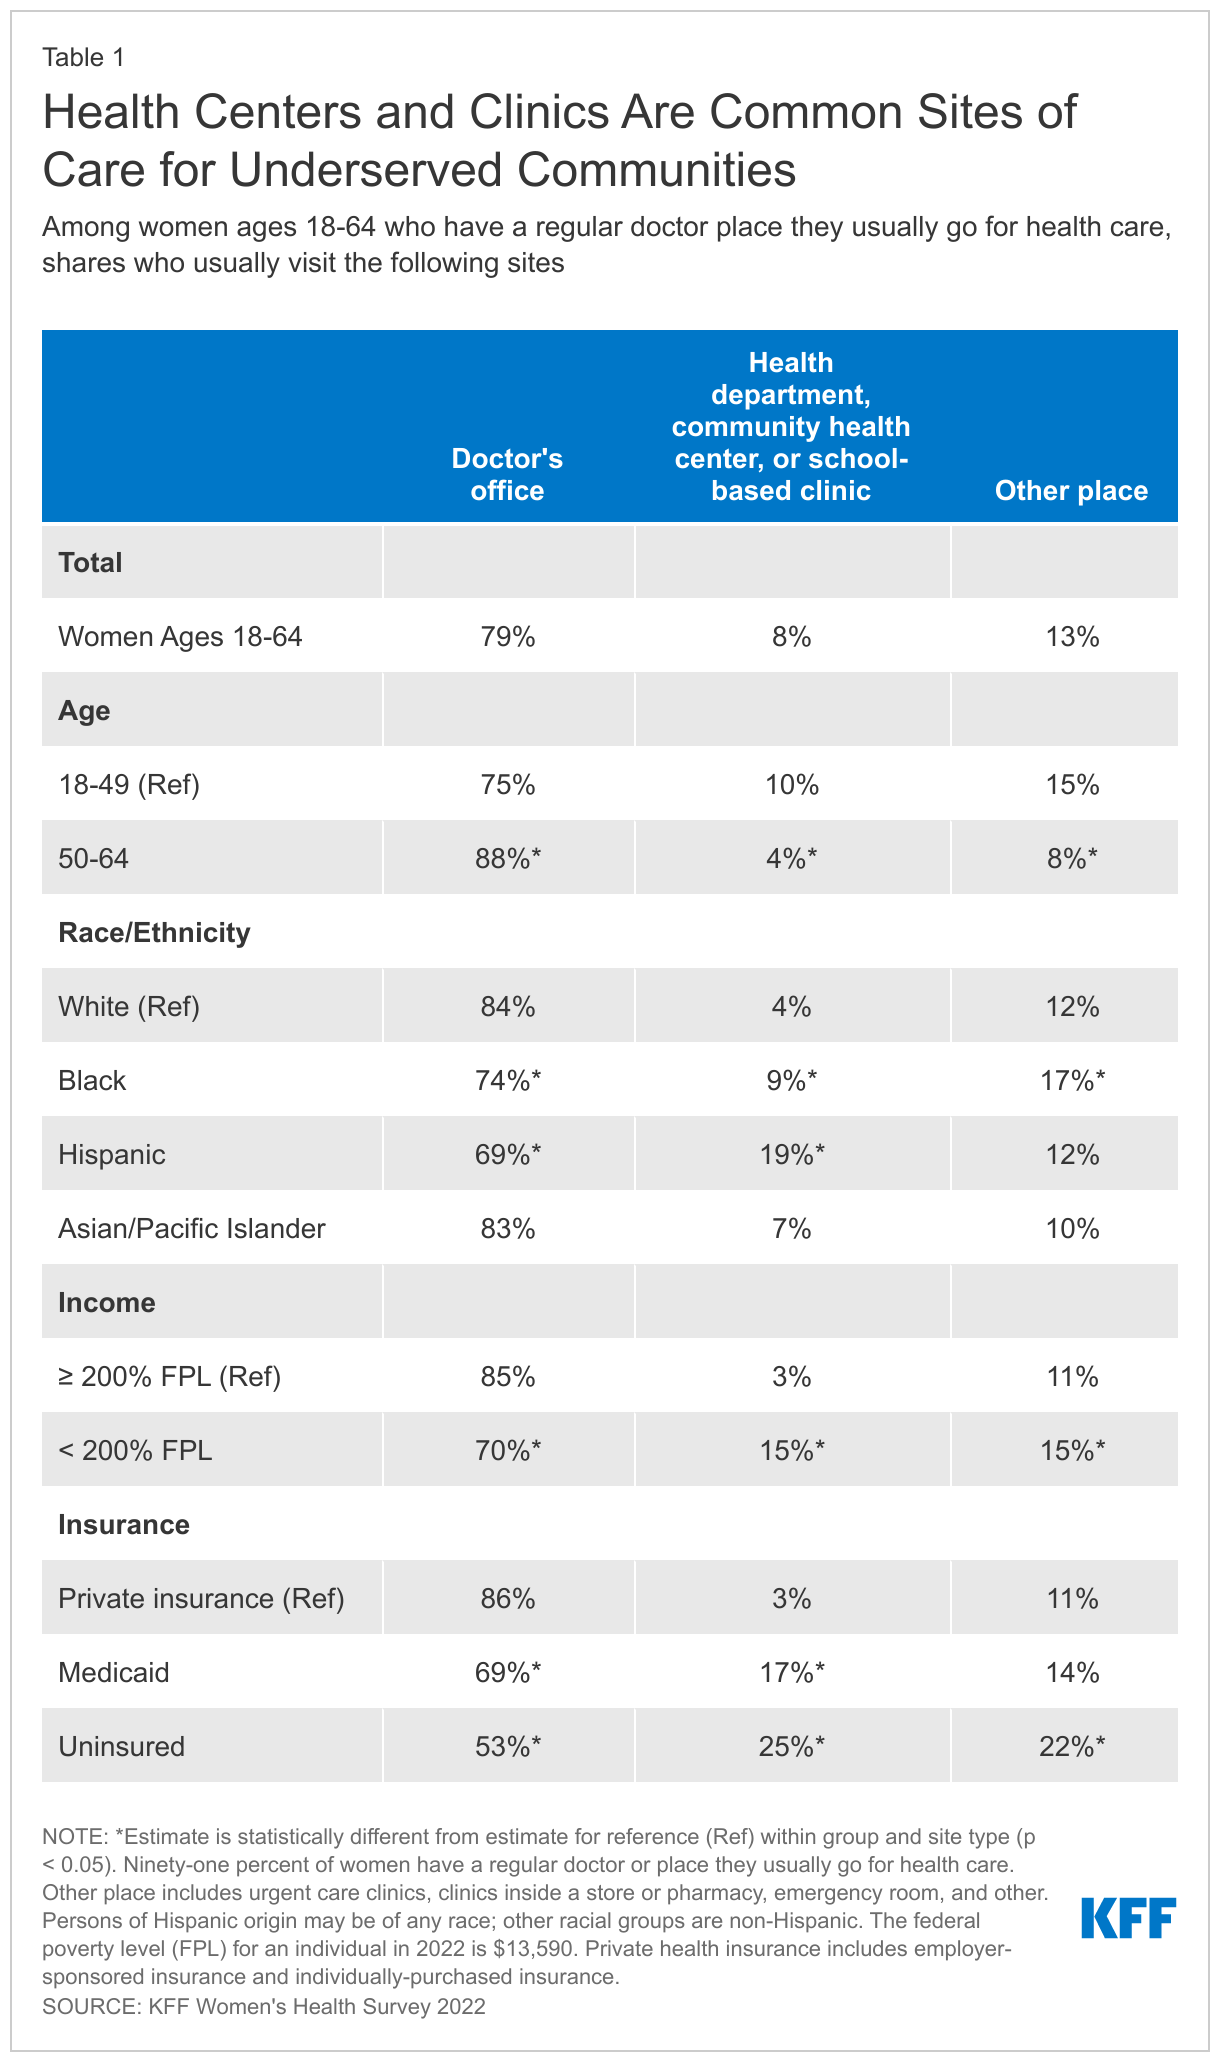
- Most women (79%) obtain their health care at doctors’ offices, but health centers and clinics are common sites of care for underserved populations. One in four (25%) uninsured women, one in five (19%) Hispanic women, and 17% of those with Medicaid usually visit health centers or clinics for their routine health care.
- Most women ages 18-64 (60%) say they have had a telemedicine visit in the past two years. Most (69%) rate the quality of care they received via telemedicine as comparable to in-person care. Annual check-ups, minor illnesses and injuries, and mental health services were the top reasons women accessed services via telemedicine.
- Many women with health insurance report experiencing limitations with their insurance in the past 12 months. One in five (21%) women with Medicaid say that their plan did not cover care they thought was covered, or paid less than expected, compared to one-third (34%) of women with employer-sponsored coverage.
- More than one in four (27%) women ages 18-64 report having had problems paying medical bills in the past 12 months compared to 23% of men.
- Among women experiencing problems with medical bills in the past year, more than half (52%) have had difficulty paying for basic necessities like food, heat, or housing because of the bills, including nearly seven in ten (68%) women with low incomes.
Health Status and Use of Prescription Medications
Health Status
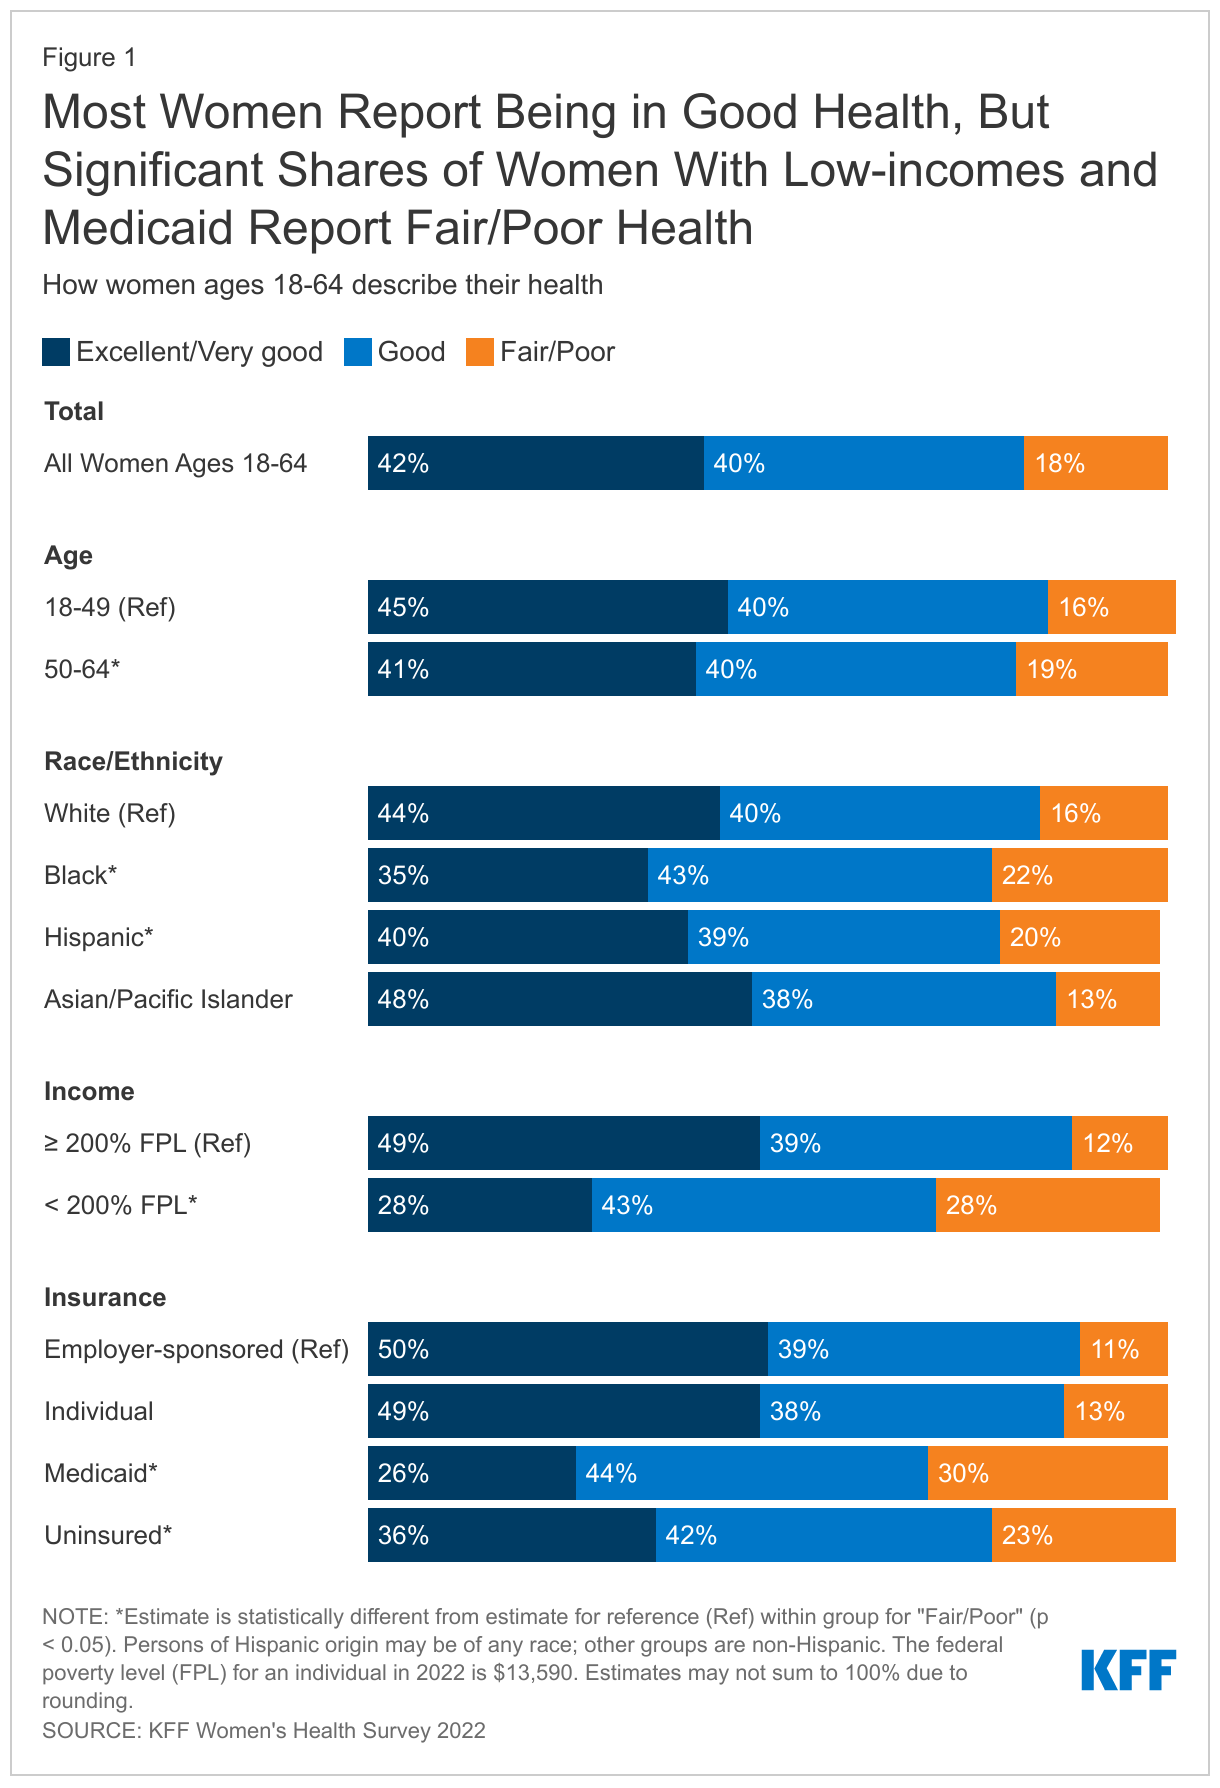
The majority of women ages 18-64 report being in good or excellent health, but substantial shares of women with low incomes and those with Medicaid describe their health as fair or poor.
Most women ages 18-64 (82%) rate their health as excellent, very good, or good; however, 18% of women describe their health as fair or poor, similar to other national estimates.
A higher share of women ages 36-49 (20%) and ages 50-64 (19%) rate their health as fair or poor than those ages 18-35 (16%) (Figure 1). A larger share of Black (22%) and Hispanic (20%) women report being in fair or poor health than White (16%) and Asian/Pacific Islander (13%) women. (Persons of Hispanic origin may be of any race; other groups are non-Hispanic.) Approximately three in ten women with low incomes (28%) and women with Medicaid coverage (30%) rate their health as fair or poor. (This survey defines low income as household income under 200% of the federal poverty level (FPL); higher income is 200% or more of the FPL. The federal poverty level (FPL) for an individual in 2022 is $13,590.) A higher share of women with Medicaid describes their health as fair or poor than women with employer-sponsored insurance (11%), individual insurance (13%), and the uninsured (23%).
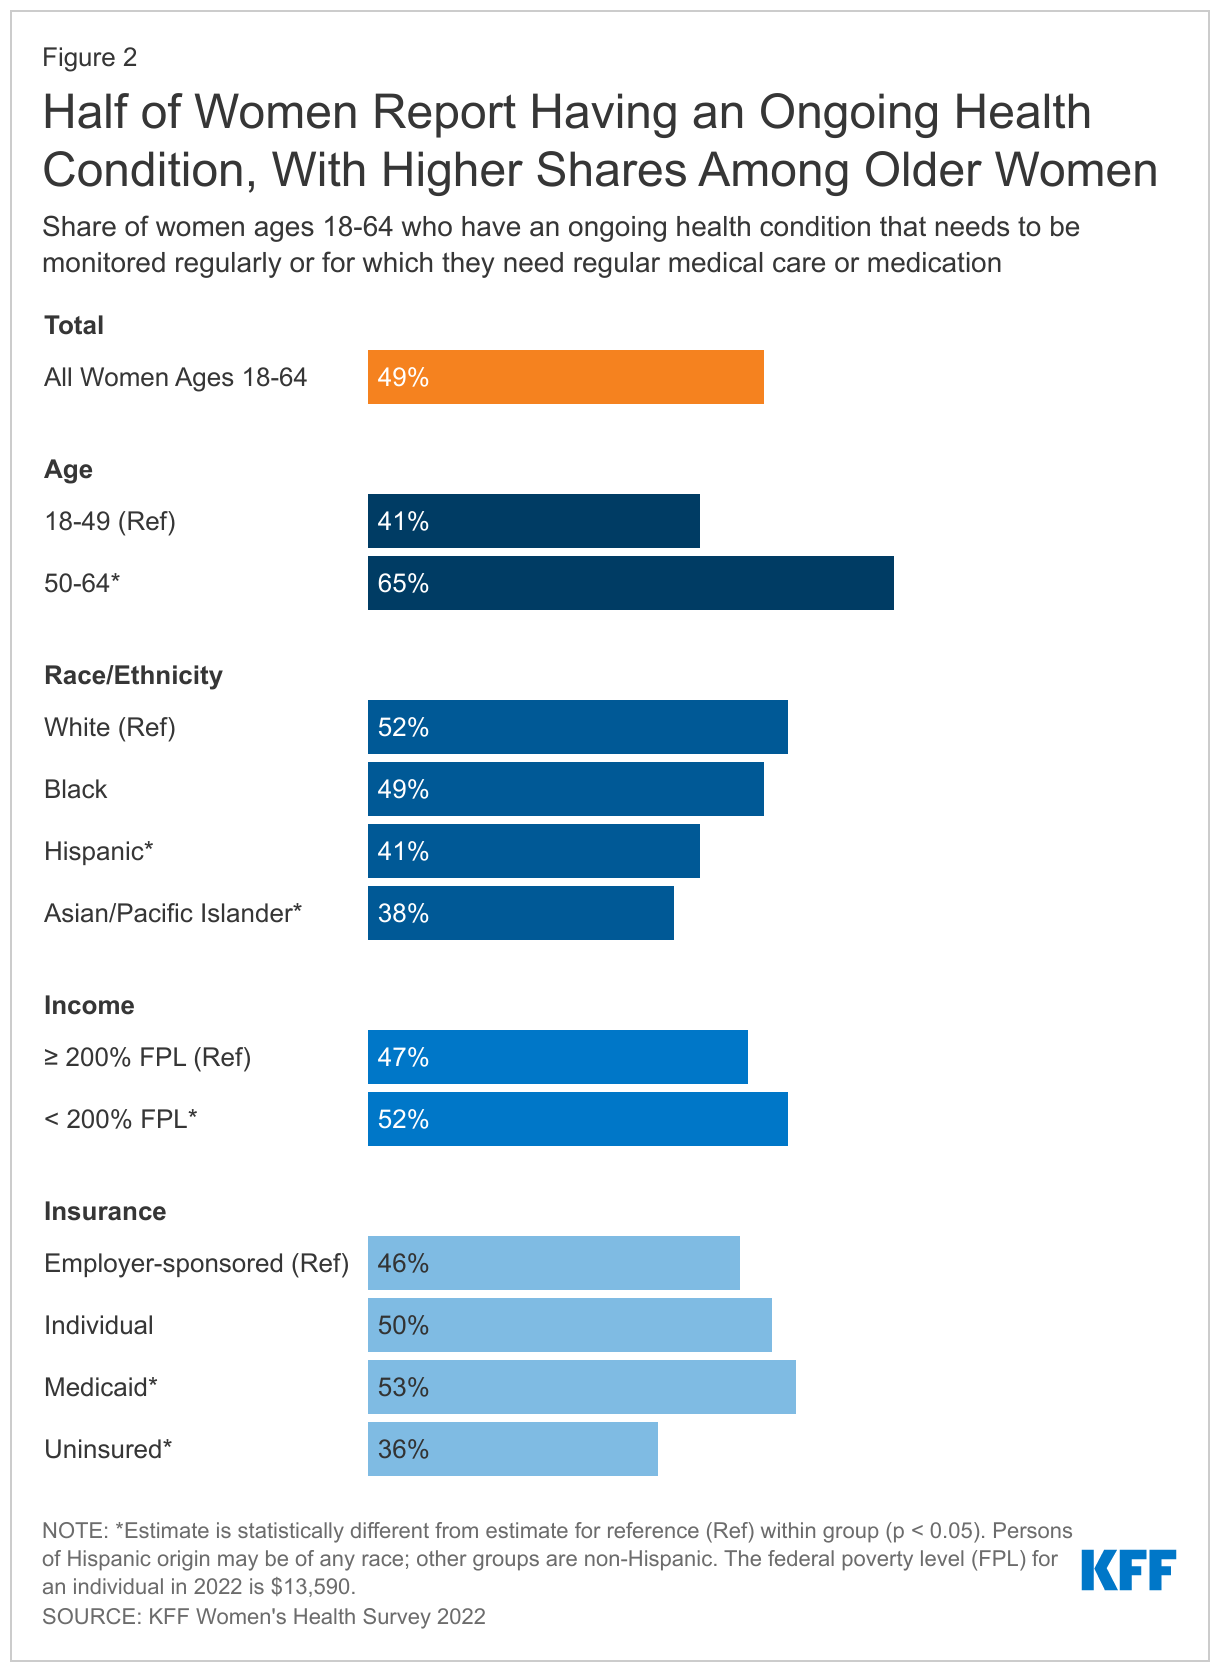
Many women are managing ongoing health conditions or living with disabilities that impact daily life.
Half (49%) of women ages 18-64 report that they have an ongoing health condition that requires regular monitoring, medical care, or medication (Figure 2). This rate increases with age, from 41% of women ages 18-49 to 65% of women ages 50-64. Smaller shares of Hispanic (41%) and Asian/Pacific Islander (38%) women report having an ongoing health condition than White (52%) and Black (49%) women. More women with employer-sponsored insurance (46%) report having an ongoing health condition requiring regular care than do uninsured women (36%). Women with Medicaid (53%) are more likely than those with employer-sponsored insurance or the uninsured to report having an ongoing condition.
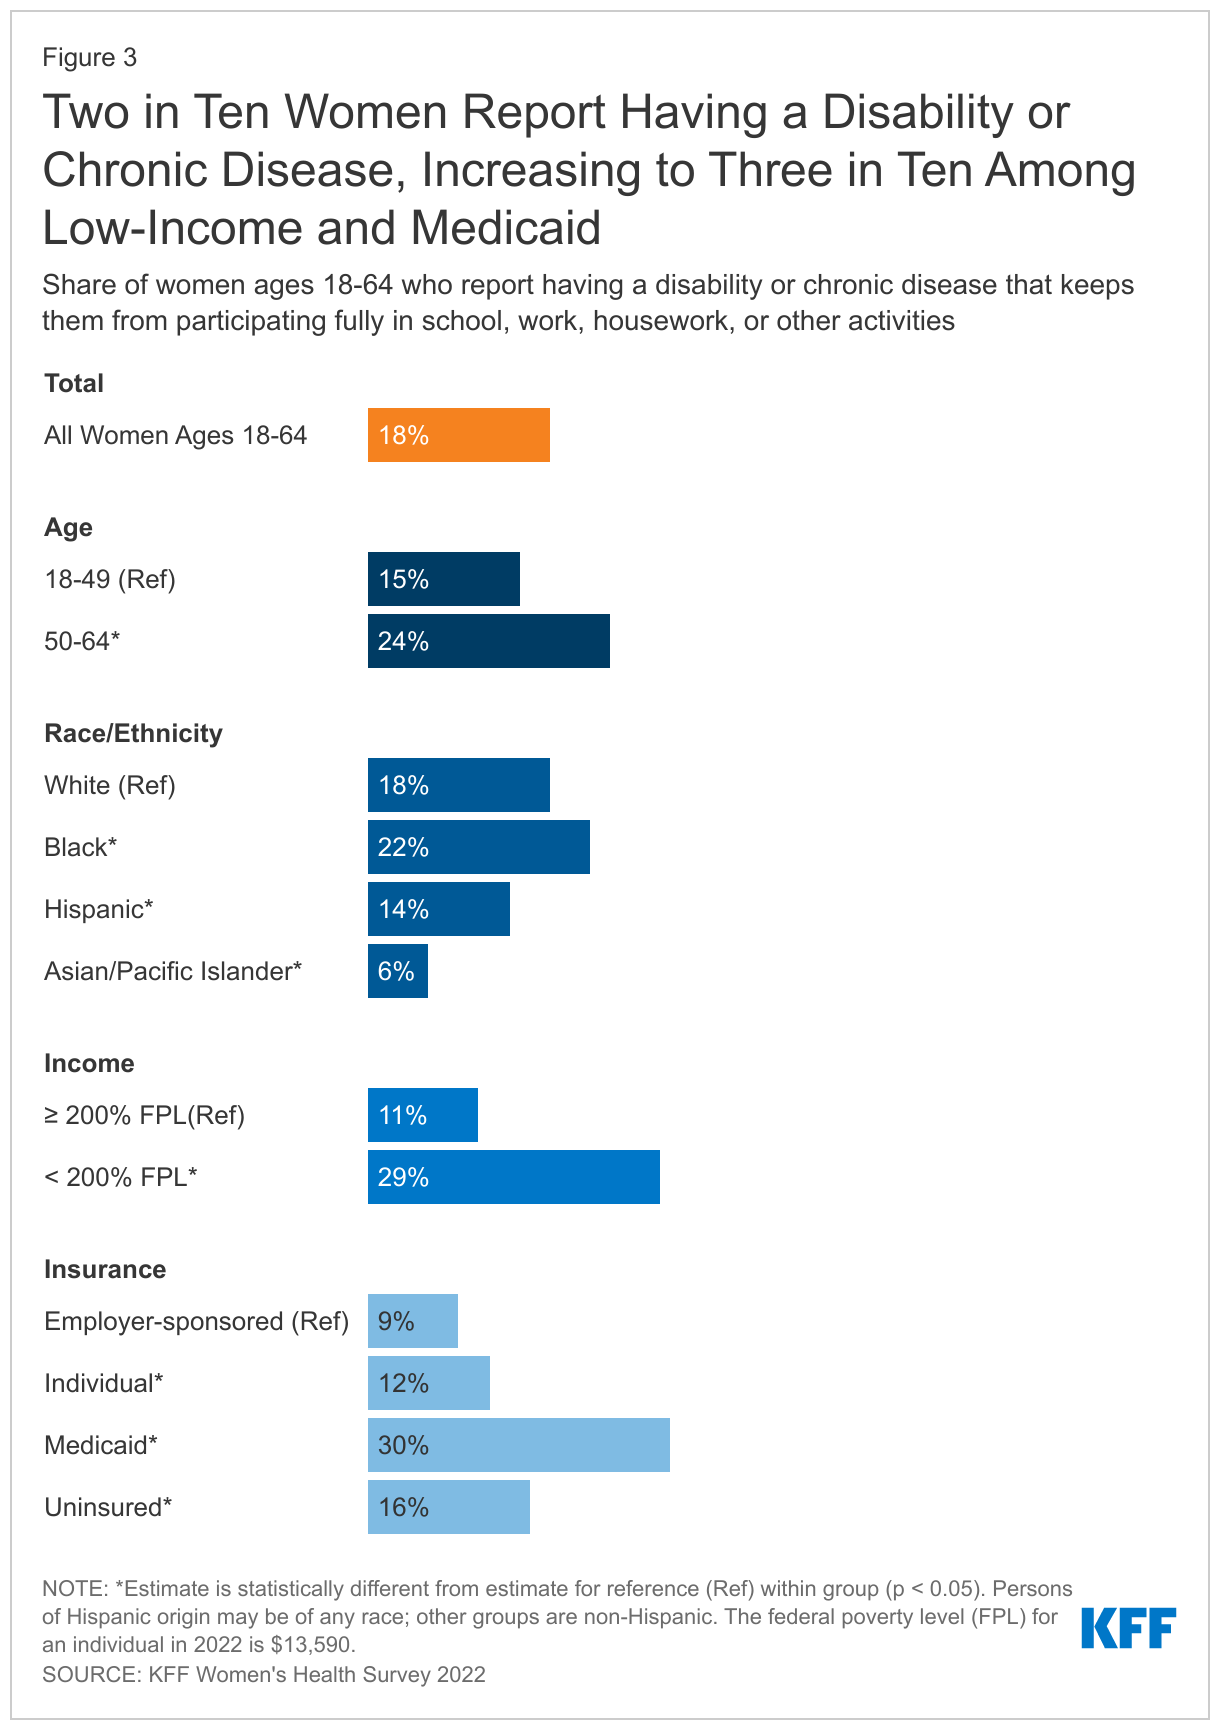
Eighteen percent of women ages 18-64 report having a disability or chronic disease that keeps them from participating fully in work, school, housework, or other activities (Figure 3). Women ages 50-64 are more likely than those ages 18-49 to report having a disability or chronic disease (24% vs. 15%). Lower shares of Hispanic (14%) and Asian/Pacific Islander (6%) women have a limiting disability or chronic condition than do White (18%) and Black (22%) women. Women with Medicaid coverage (30%) and those with low incomes (29%) are more likely than their counterparts to report having a disability or chronic disease.
Use of Prescription Medications
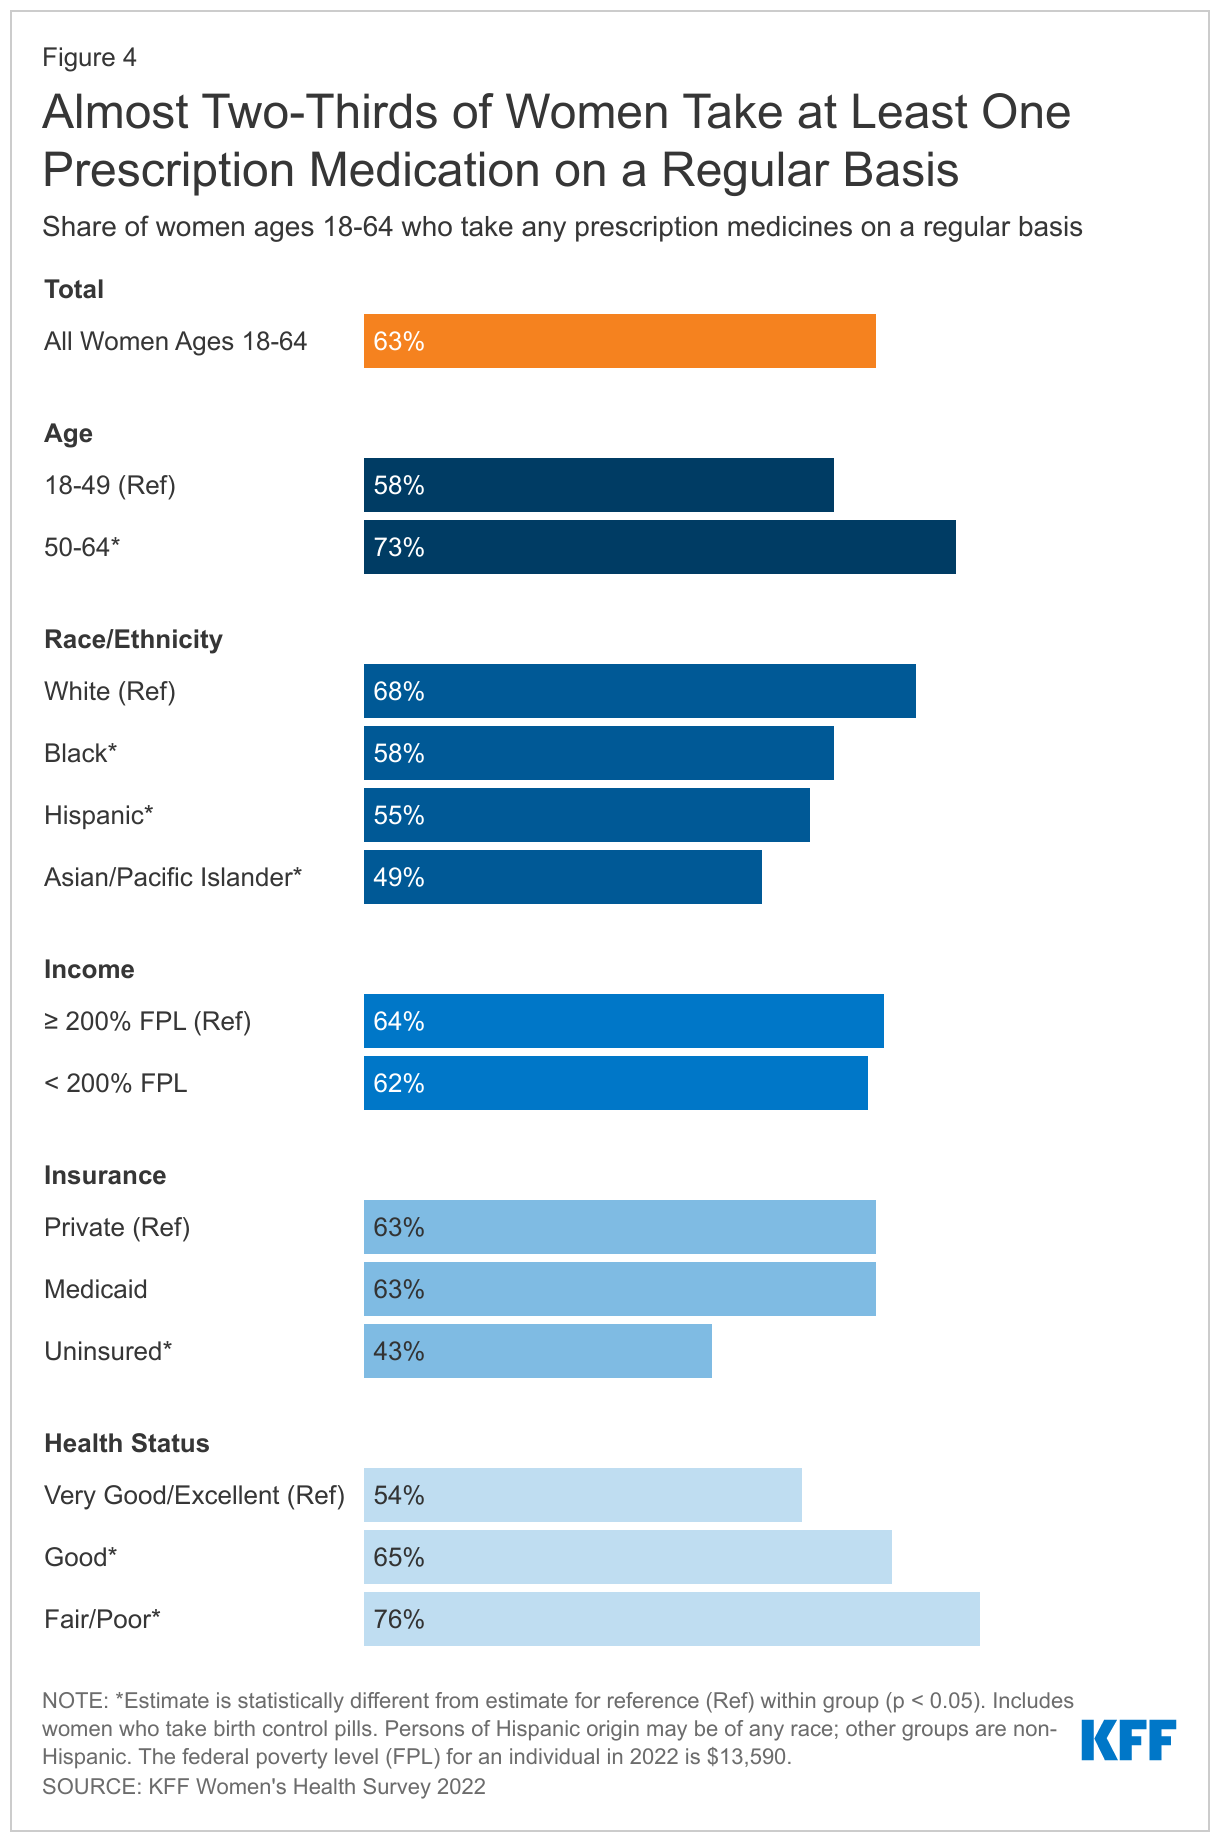
Almost two-thirds of women ages 18-64 take at least one prescription medication, including birth control pills, on a regular basis.
Women may take prescription medications to treat or manage chronic conditions and acute illnesses or to prevent pregnancy. Sixty-three percent of women report taking at least one prescription medicine, including birth control pills, on a regular basis (Figure 4).
Prescription medication use increases with age, with 58% of women ages 18-49 taking at least one on a regular basis compared to 73% of women ages 50-64. White women (68%) are more likely than Asian/Pacific Islander (49%), Hispanic (55%), and Black (58%) women to take a prescription medication on a regular basis. As may be expected, a higher share of women in fair or poor health report taking a prescription medication regularly than women in excellent or very good health (76% vs. 54%). Even though more uninsured women (23%) rate their health as fair or poor than insured women (17%), a higher share of insured women (65%) (data not shown) report taking take a prescription medication than uninsured women (43%). One explanation for this could be that uninsured women have less access to health care and affordable medications than those with insurance, which could result in lower use of prescription medications.
Differences Between Women and Men
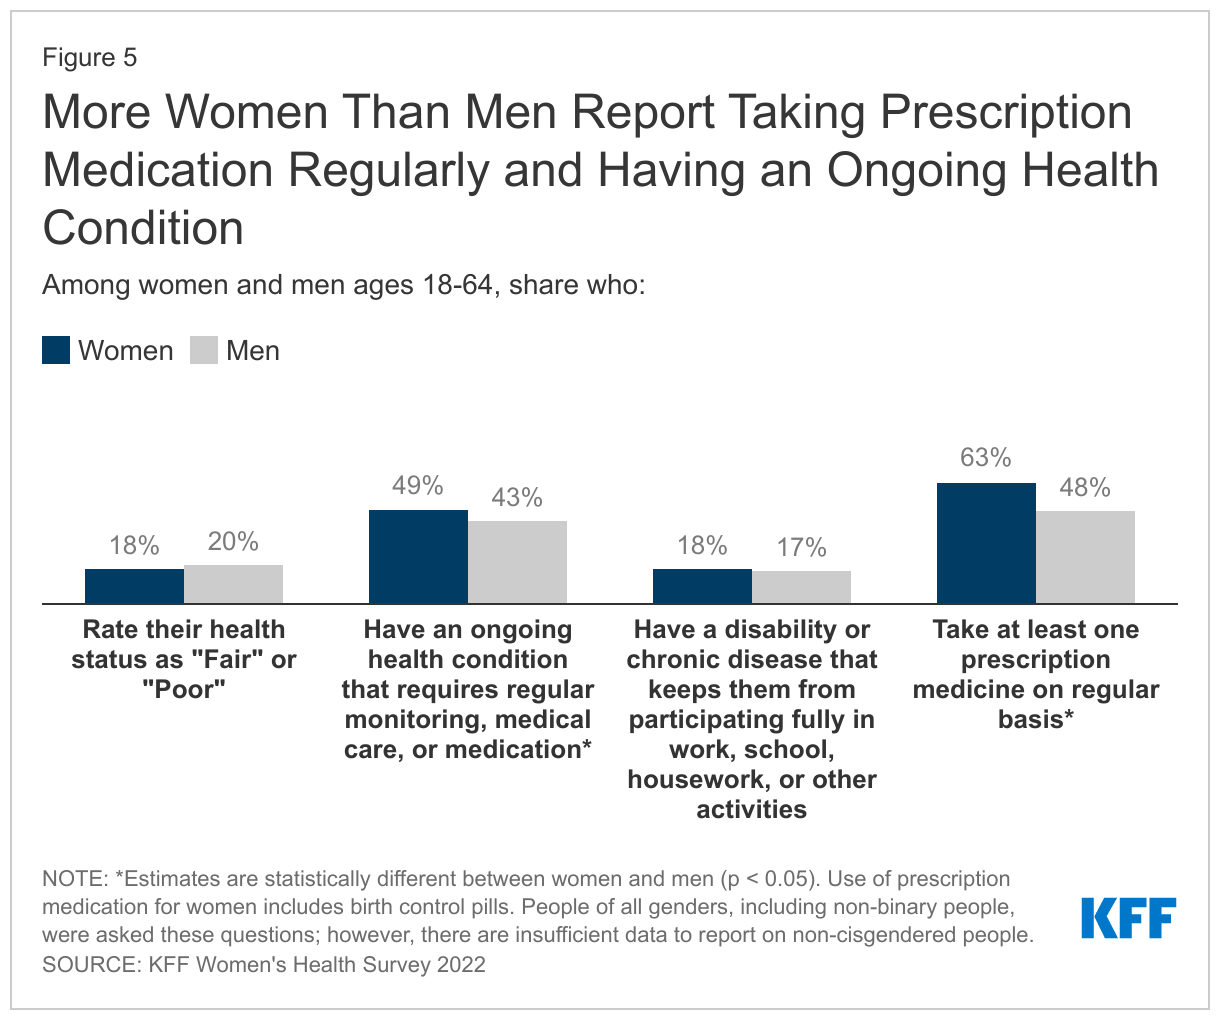
In measures of health status and prescription drug use, there are some differences and some similarities between women and men.
More women than men report having an ongoing health condition that requires regular monitoring, medical care, or medication (49% vs. 43%), or taking at least one prescription medication on a regular basis (63% vs. 48%) (Figure 5). The share of women and men who rate their health status as fair or poor is similar (18% and 20%, respectively), as is the share who report having a disability or chronic disease that keeps them from participating fully in work, school, housework, or other activities (18% and 17%, respectively). (People of all genders, including non-binary people, were asked these questions; however, there are insufficient data to report on non-cisgendered people.)
Accessing Health Care
Sources of Care
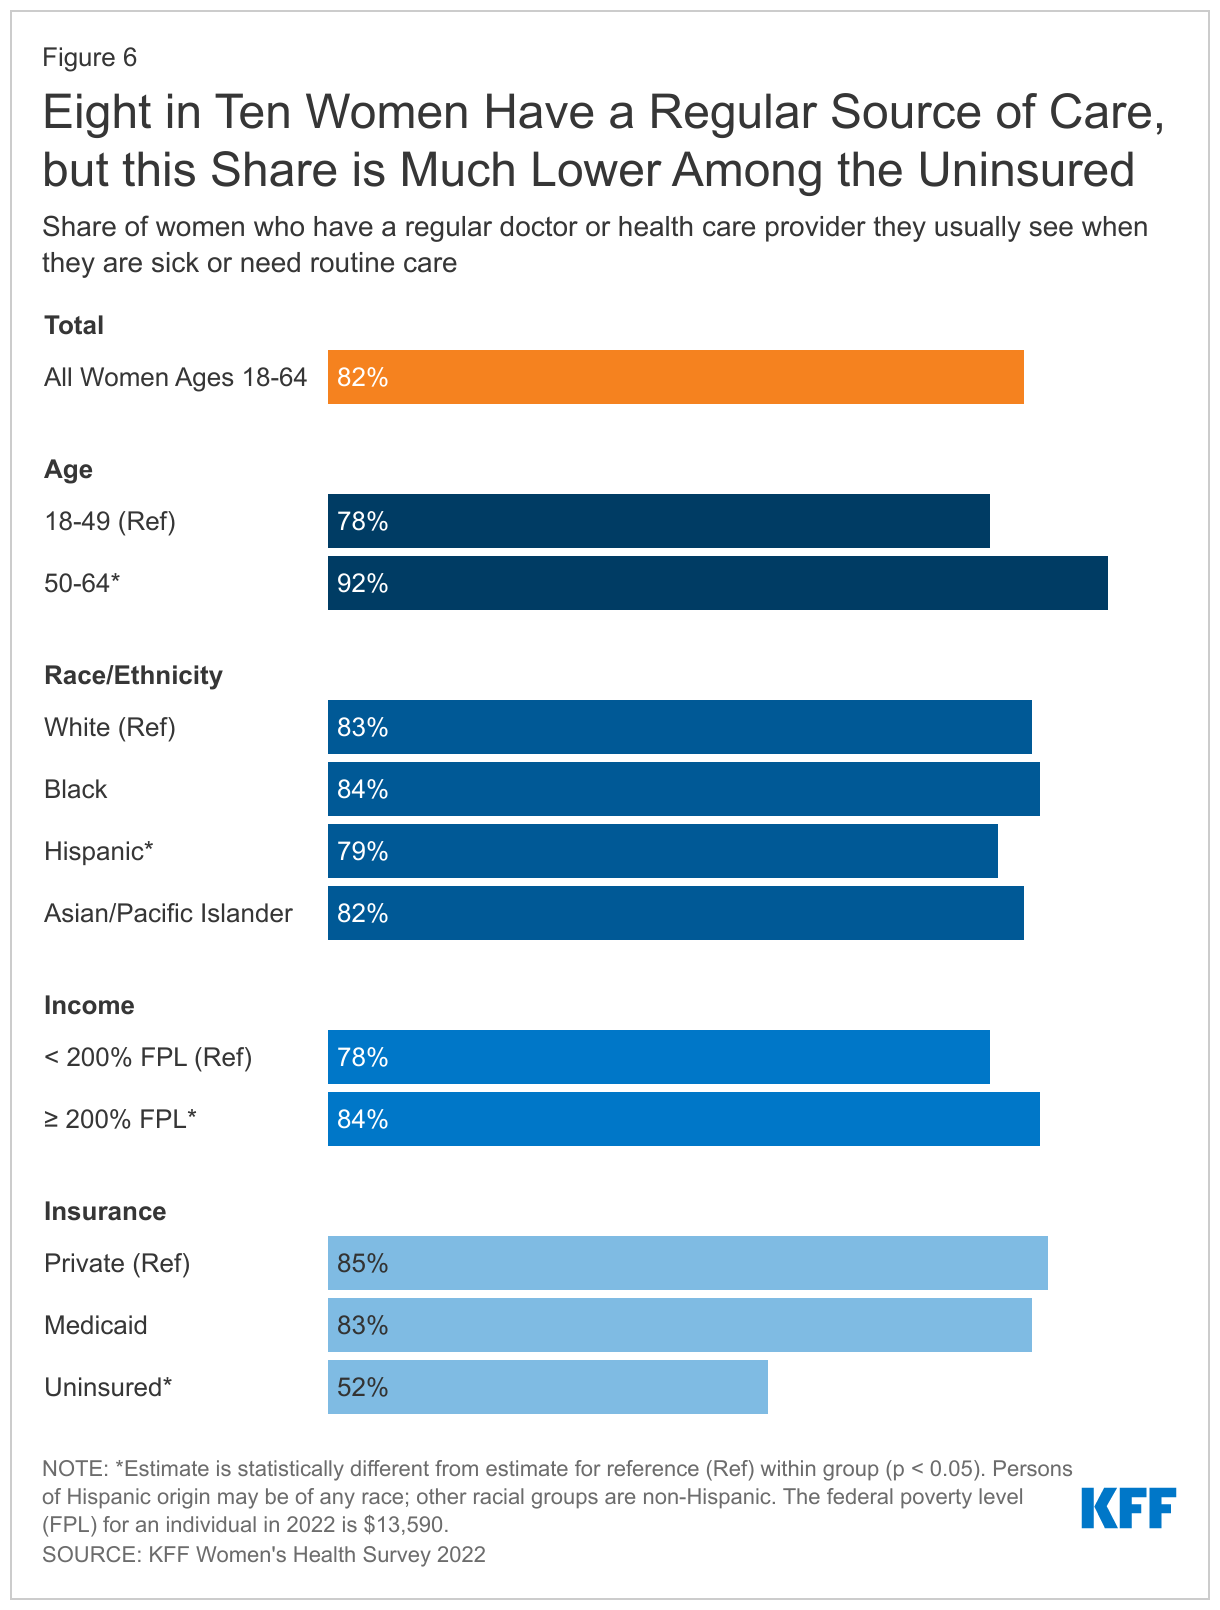
While the vast majority of women have a regular provider they turn to for routine care, only half of uninsured women have a usual source of care.
Having a usual source of health care is associated with increased use of preventive care and better health outcomes. Eighty-two percent of women have a regular doctor or health care provider they see when they are sick or need routine care. The share of women who have a regular provider increases with age (Figure 6). Hispanic women (79%) are slightly less likely than White (83%) and Black (84%) women to have a usual source of care. Fewer women who are uninsured (52%) and those with low incomes (79%) report having a usual source of care than their counterparts. Women who live in a state that expanded Medicaid are more likely to have a usual source of care than women in states that have not expanded Medicaid (83% vs. 79%) (data not shown). Ten percent of women with a disability or an ongoing health condition do not have a regular doctor or health care provider (data not shown).
Sites of Care
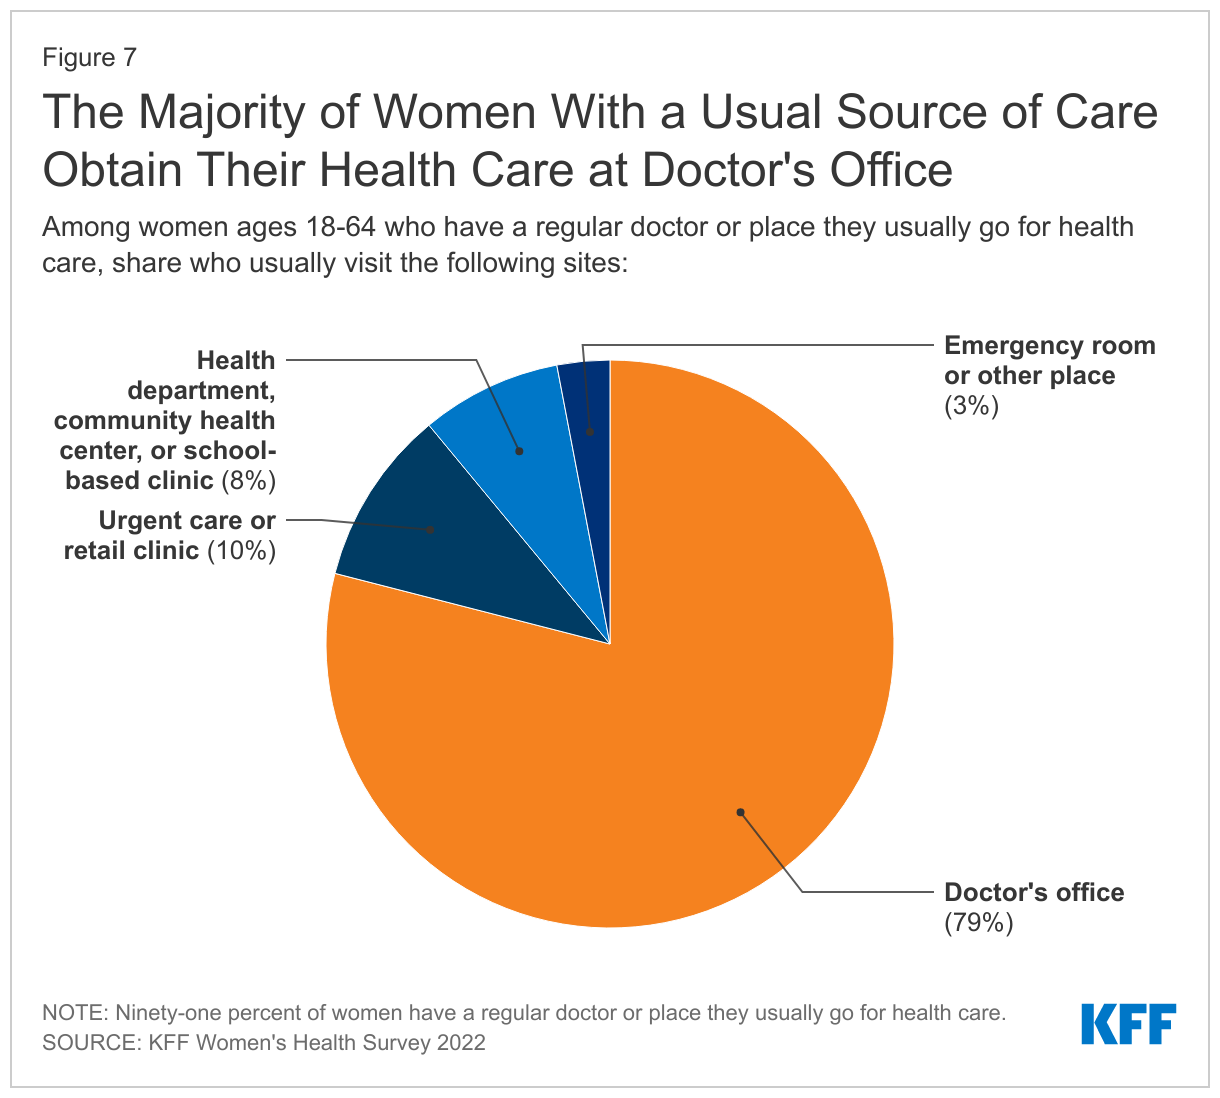
Most women obtain their health care at doctors’ offices, but health centers and clinics are common sites of care for underserved communities, particularly for uninsured women, those with Medicaid, and Hispanic women.
Eighty-two percent of women have a regular doctor or place they usually go for health care. Among them, eight in ten (79%) report that they usually obtain their care at a doctor’s office (Figure 7). Ten percent obtain care at an urgent care or retail clinic; 8% usually go to a health center or school-based clinic; and 3% cite the emergency room or some other place as their usual site of care.
More women ages 50-64 (88%), White (84%) and Asian/Pacific Islander (83%) women, women with higher incomes (85%), and those with private health insurance (86%) rely on an office-based physician for their regular care than their counterparts (Table 1). (Private health insurance includes employer-sponsored insurance and individually purchased insurance.) Health centers and clinics play a larger role as sites of care for women ages 18-49 (10%), Hispanic women (19%), women with low incomes (15%), those with Medicaid (17%), and uninsured women (25%) than their counterparts.
Check-ups
Regular provider visits give people an opportunity to talk with clinicians about a broad range of issues, including preventing illness, the role of lifestyle factors on health, and management of chronic illnesses. Under the Affordable Care Act, most health plans must cover at least one annual check-up/well-woman visit, which can include assessments of diet and physical activity, preconception care, and cancer screenings.
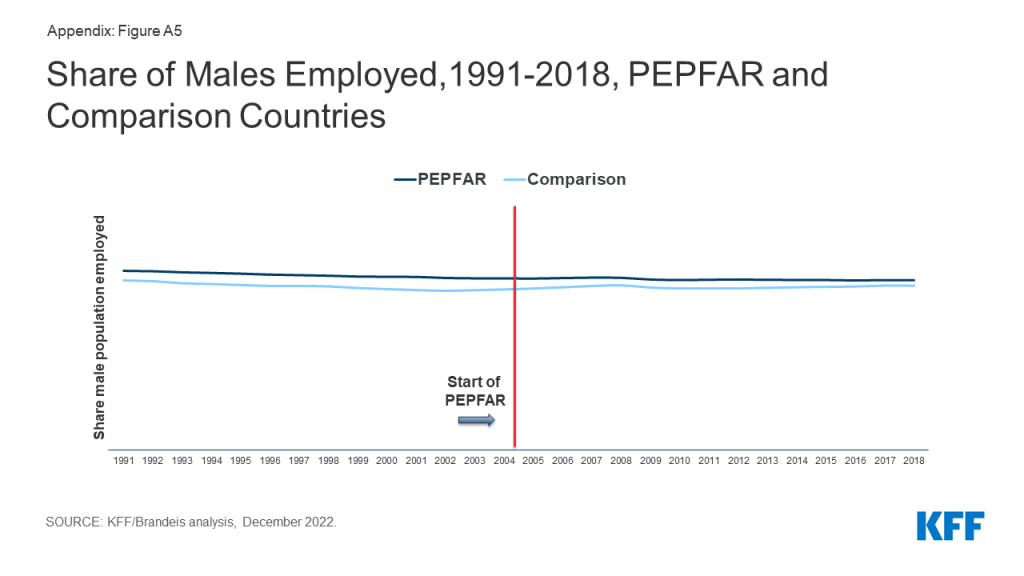
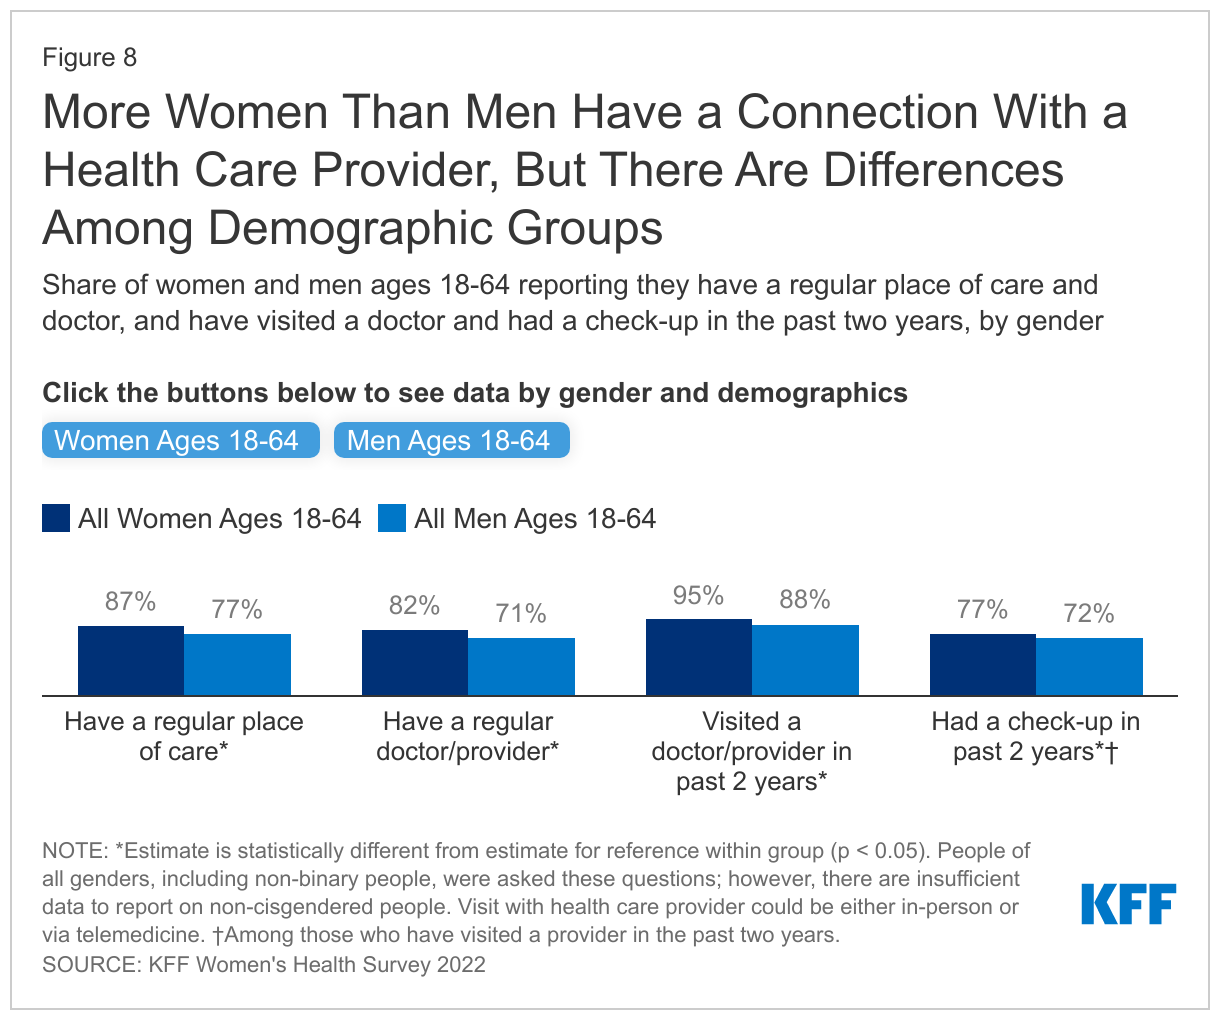
Overall, women have more interactions with and connections to the health care system than men. Higher shares of women than men report having a usual source of care and have visited a health care provider in the past two years.
Women are more likely than men to report having a regular place of care (87% vs. 77%) and a regular doctor or health care provider (82% vs. 71%) (Figure 8). Ninety-five percent of women say they have visited a health care provider in the past two years and among them, 77% have had a check-up, compared to 88% and 72% of men, respectively. (People of all genders, including non-binary people, were asked these questions; however, there are insufficient data to report on non-cisgendered people.)
While most women ages 18-64 have visited a doctor in the past two years and had a check-up, rates are lower among younger women and uninsured women.
Nearly all women (95%) have seen a doctor or health care provider in the past two years (Figure 8). However, fewer women ages 18-35 (92%), Hispanic (92%), and uninsured women (78%) have visited a doctor in the past two years than their counterparts.
Among women who have seen a health care provider in the past two years, more than three-quarters (77%) have had a general check-up/well-woman visit during that period. However, a smaller share of uninsured women (61%) and women with low incomes (74%) had a recent check-up than their counterparts. A smaller share of women ages 18-35 had a check-up than women ages 50-64 (72% vs. 85%), and more Black women than White women had one (83% vs. 77%).
Telemedicine
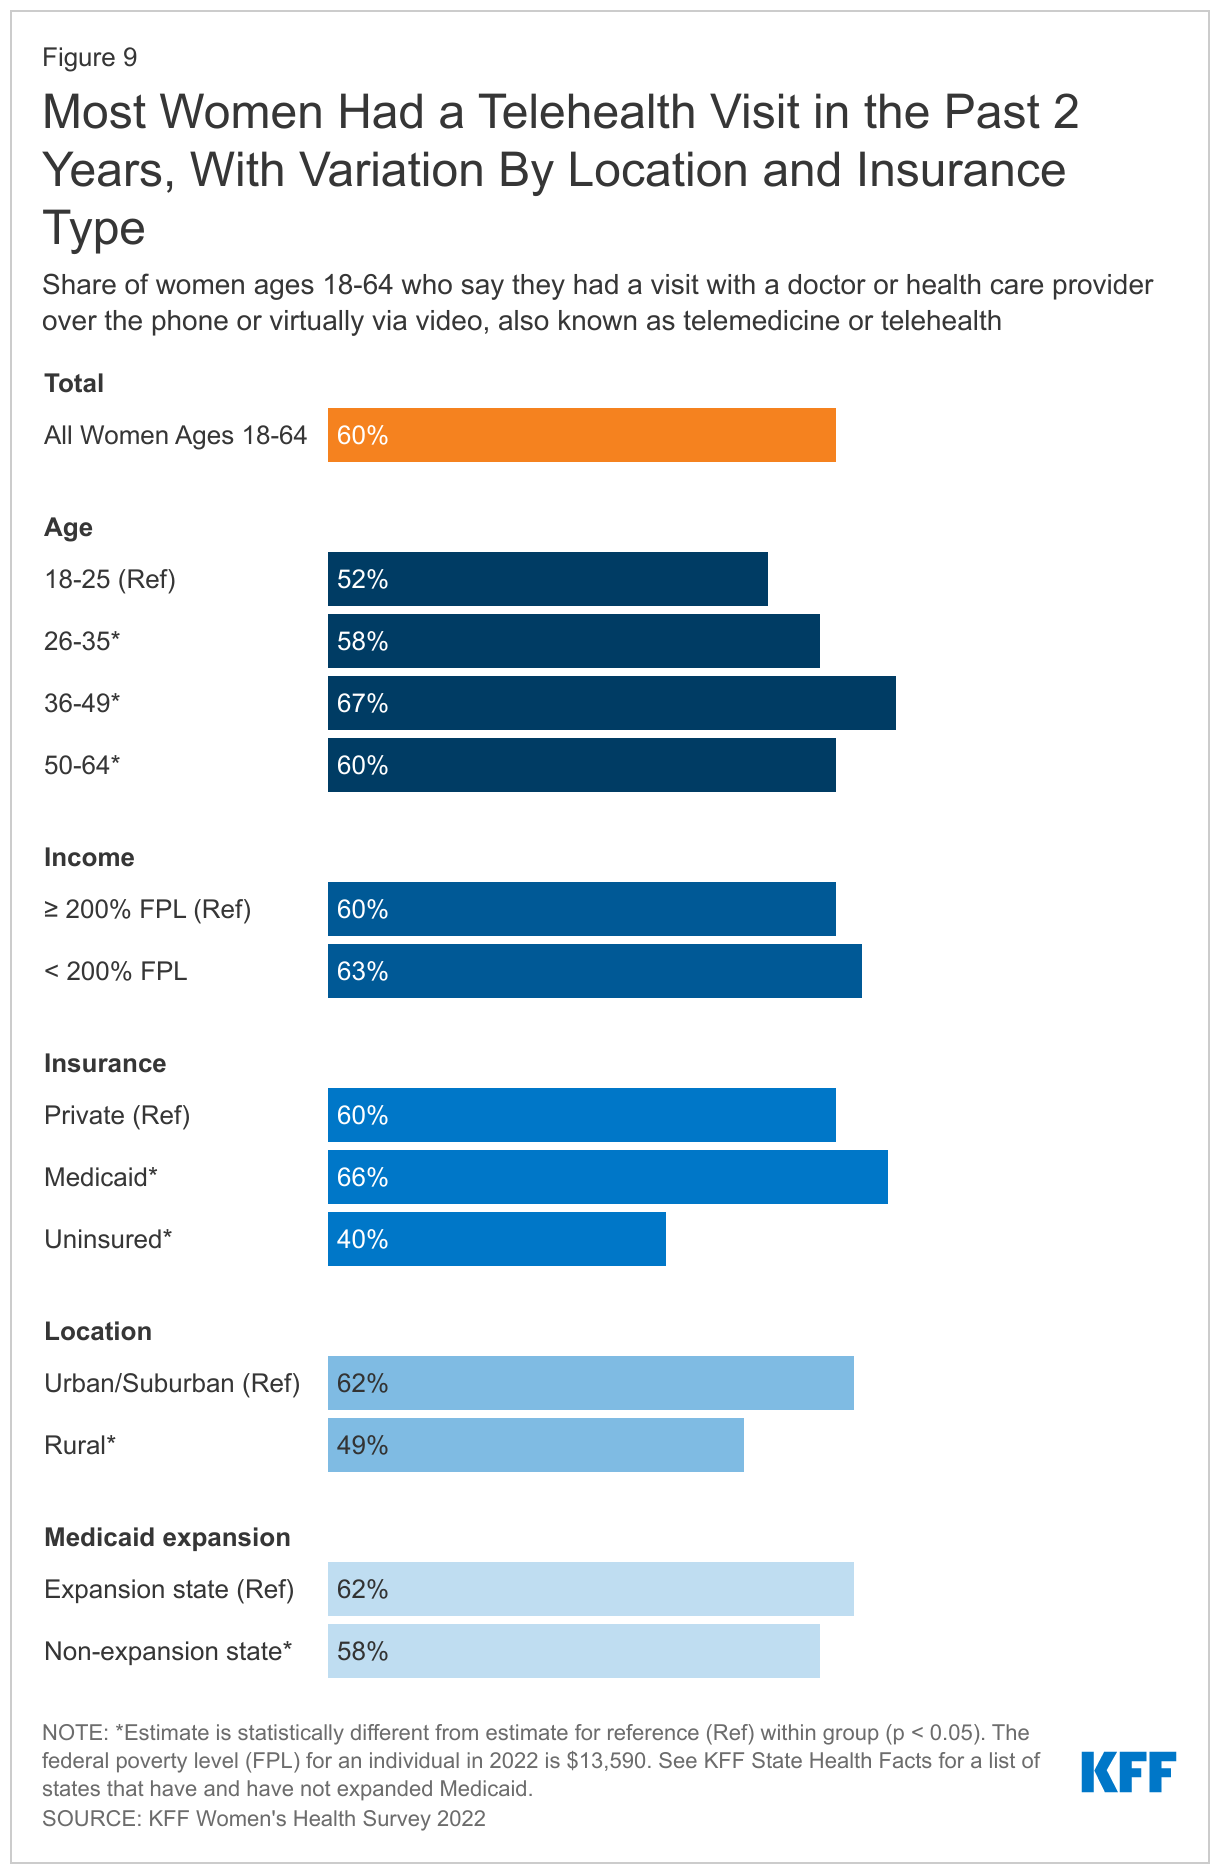
Two years into the pandemic, most women ages 18-64 (60%) say they have had a telehealth visit (Figure 9).
Smaller shares of younger women report having had a telehealth visit in the past two years and fewer than half of uninsured women say they have had one. Women living in rural areas are less likely than those living in urban areas to have had a telehealth visit with a health care provider (49% vs. 62%) in the past two years, a general trend that has been documented in other studies. This could be due, in part, to patient preferences as well as more limited access to reliable high-speed internet and technology among those living in rural areas than in urban/suburban areas, as has been documented by other research. Slightly fewer women living in Medicaid non-expansion states have had a telehealth visit than those in expansion states (58% vs. 62%). There were no statistically significant differences by race/ethnicity (data not shown).
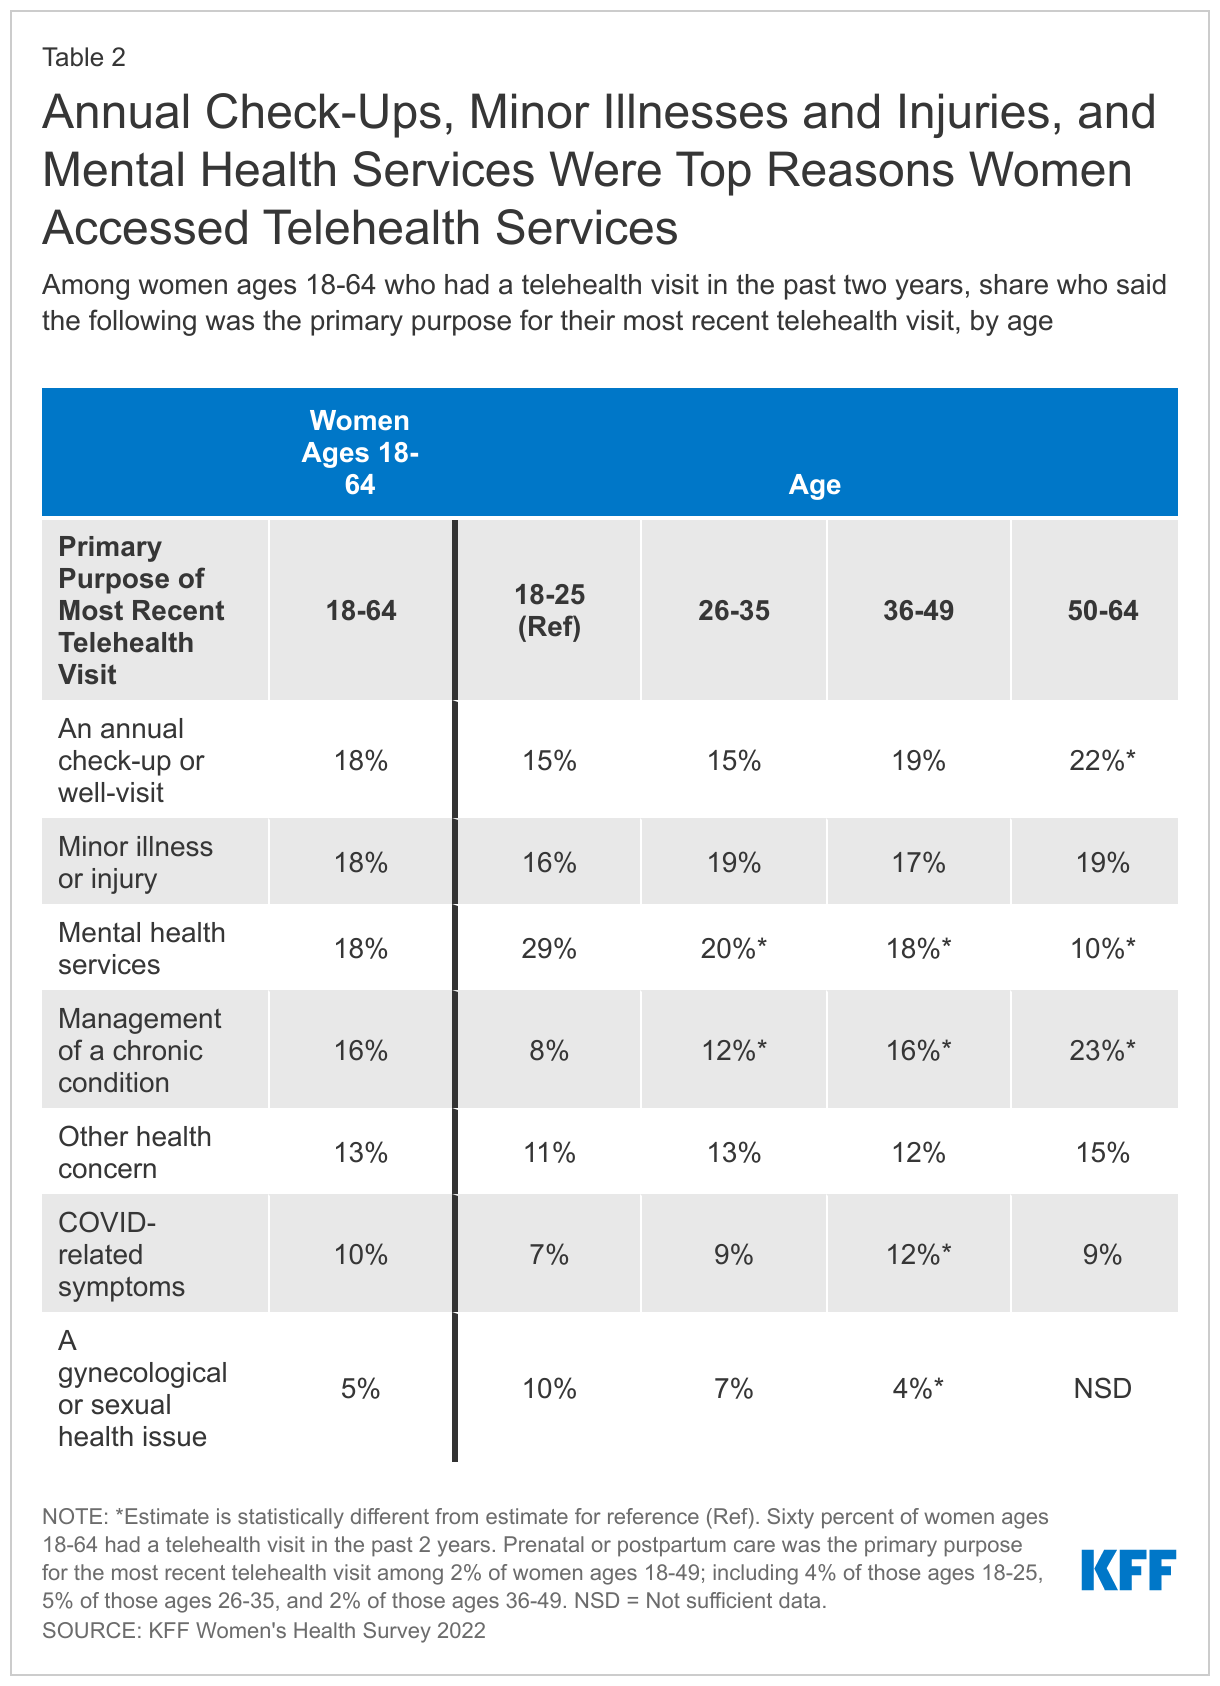
Among women ages 18-64 who had a telehealth visit in the past two years, nearly two in ten (18%) say the primary purpose for their visit was for an annual check-up or well-visit, minor illness or injury, or mental health services (Table 2). The next most common reasons included management of a chronic condition (16%), another health concern not listed (13%), COVID-related symptoms (10%), and gynecological or sexual health issues (5%).
Primary reasons for telehealth visits often vary by age. Among women ages 18-25 who had a telehealth visit in the past two years, three in ten (29%) say the primary purpose for their most recent telehealth visit was mental health services, compared to just 10% of women ages 50-64. Almost one-quarter (23%) of women ages 50-64 say their most recent telehealth visit was for management of a chronic condition, compared to 8% of women ages 18-25. Among women ages 18-49 who had a telehealth visit in the past two years, 2% say prenatal or postpartum care was the primary purpose for the most recent telehealth, including 2% of those ages 18-25, 4% of those ages 26-35, and 5% of those ages 36-49 (data not shown).
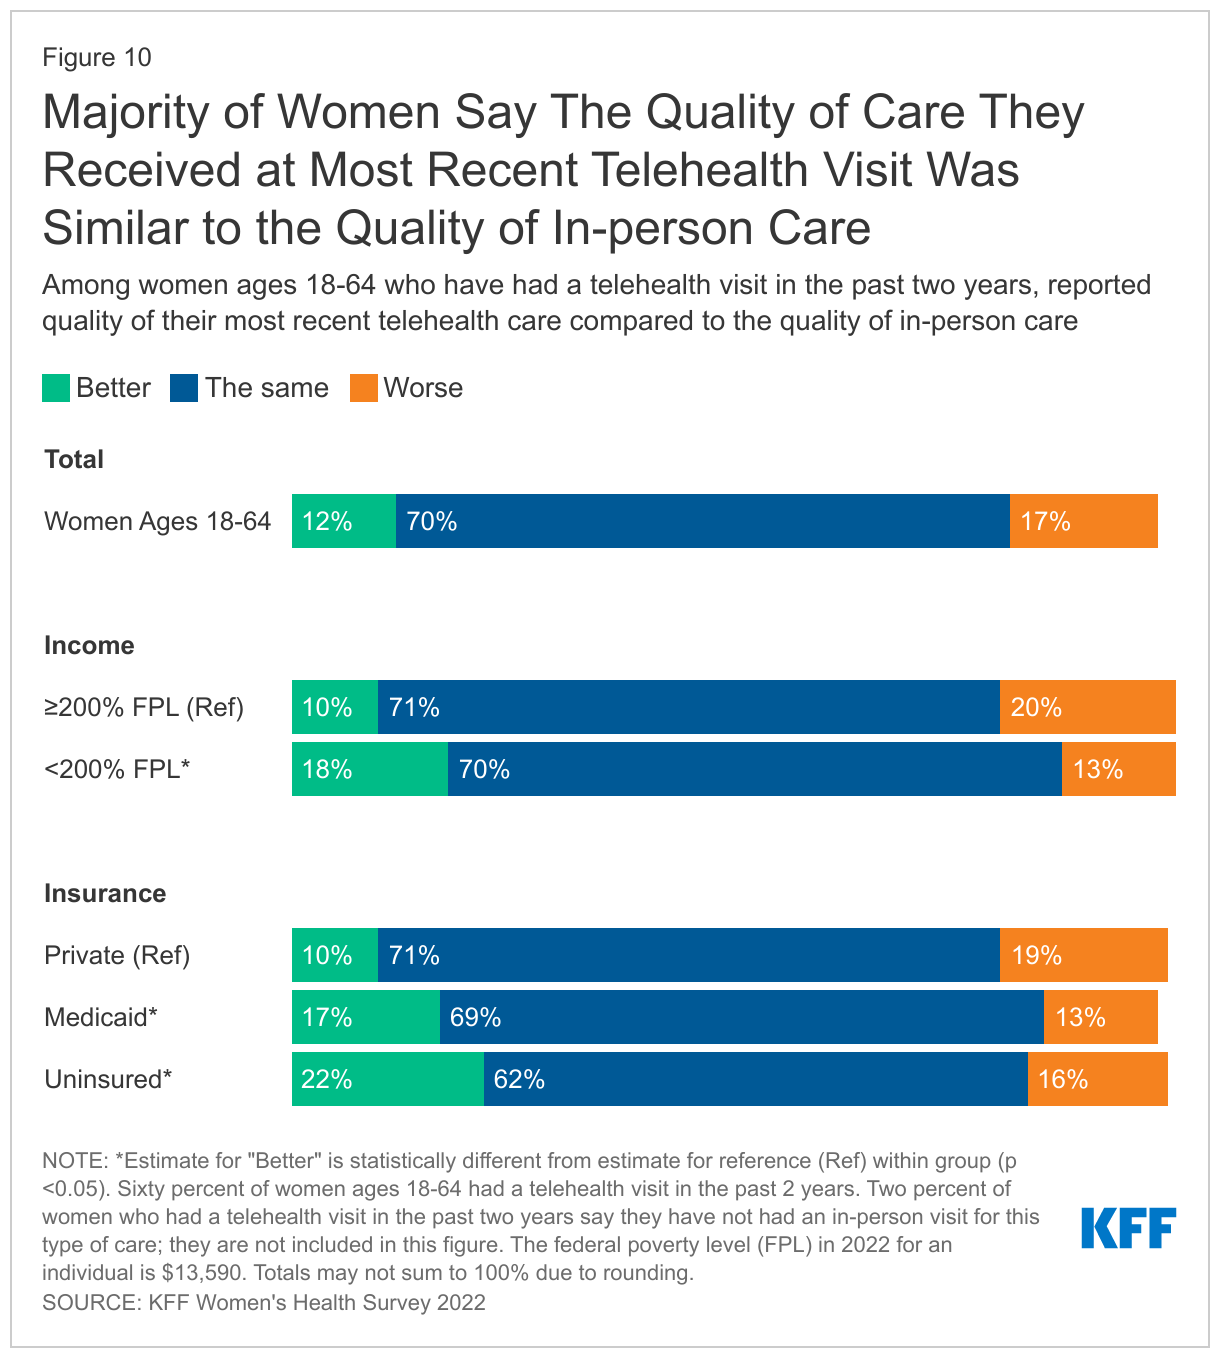
Most women (70%) say the quality of care they received at their most recent telehealth visit was similar to the quality of in-person care, with 12% saying their telehealth care was better and 17% saying it was worse than in-person care (Figure 10). Larger shares of women with low incomes (18%) and those who are uninsured (22%) say their telehealth care was better than in-person care than women with higher incomes (10%) and those with private insurance (10%). Two percent of women who had a telehealth visit in the past two years say they have not had an in-person visit for this type of care.
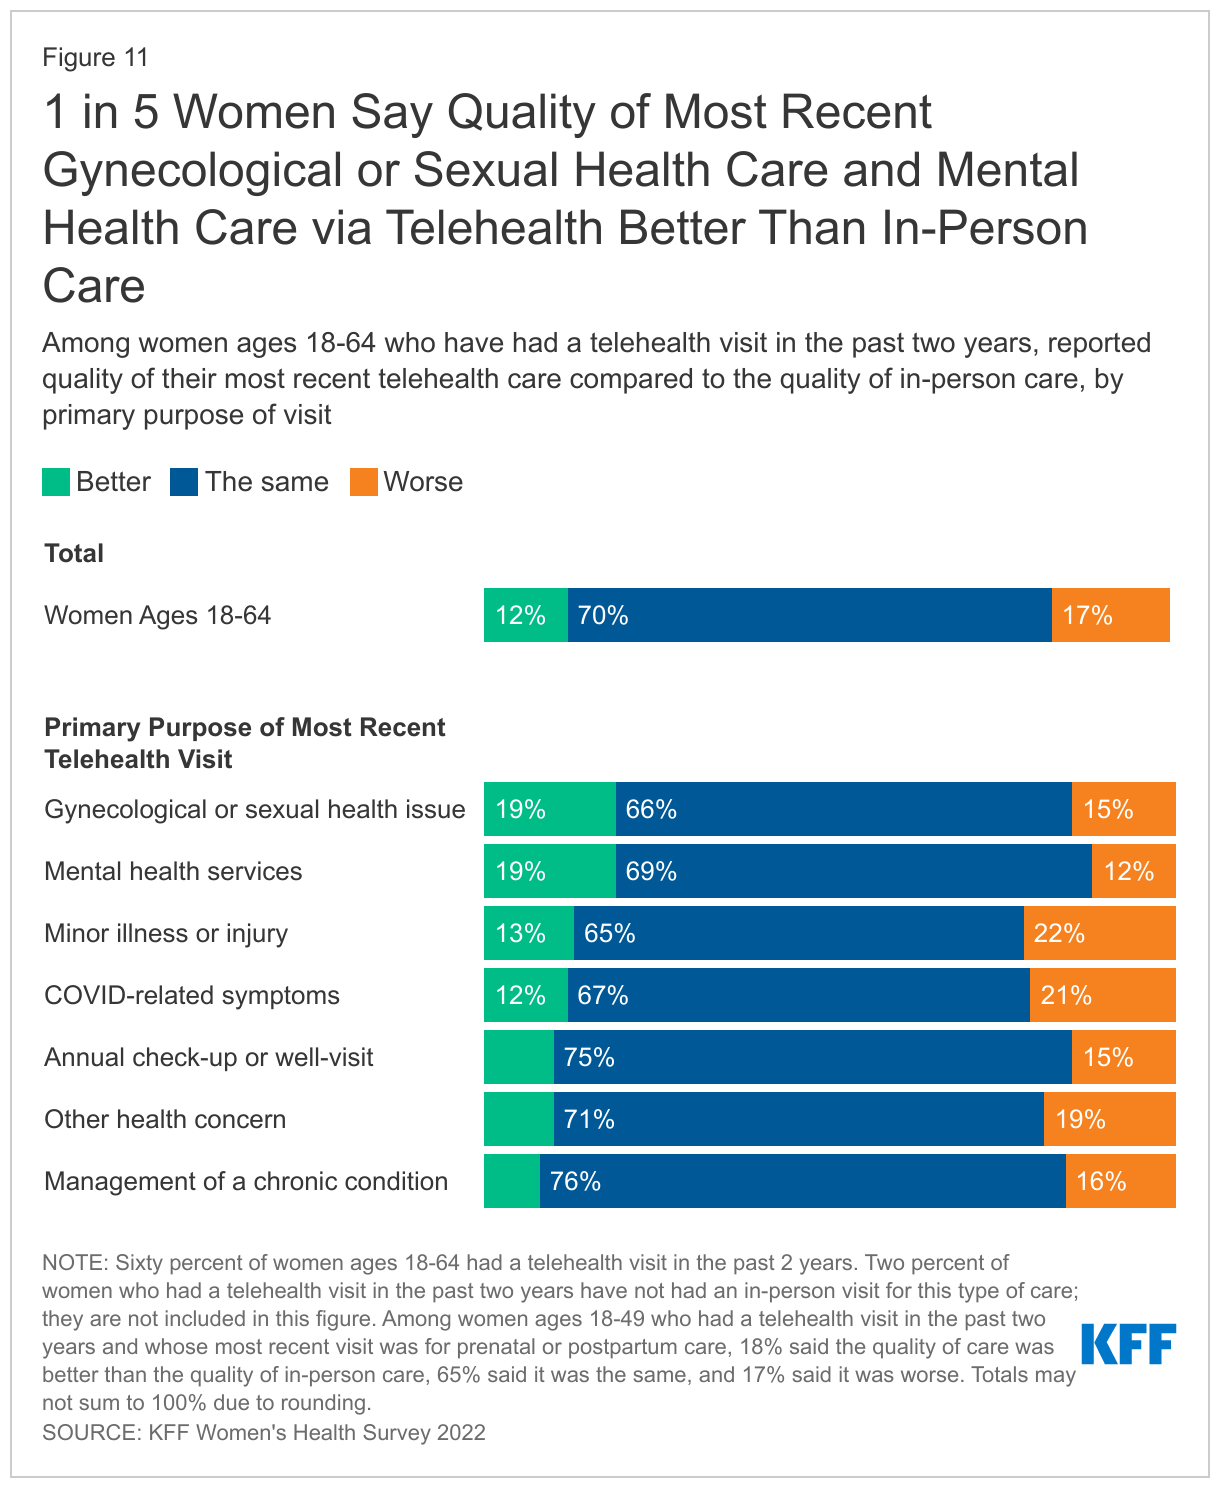
When looking at specific types of services provided via telehealth, one in five (19%) women receiving telehealth services for a gynecological or sexual health issue or mental health services say the care they received via telehealth was better than in-person care (Figure 11). Conversely, about one in five women say their telehealth care for treatment of minor illnesses and injuries (22%) and COVID-related symptoms (21%) was worse than in-person care. Among women ages 18-49 who had a telehealth visit in the past two years and whose most recent visit was for prenatal or postpartum care, 18% said the quality of care was better than the quality of in-person care, 65% said it was the same, and 17% said it was worse (data not shown).
Health Coverage and Costs
Insurance
More insured women than men report having experienced problems with their insurance covering needed health services or medications in the past 12 months.
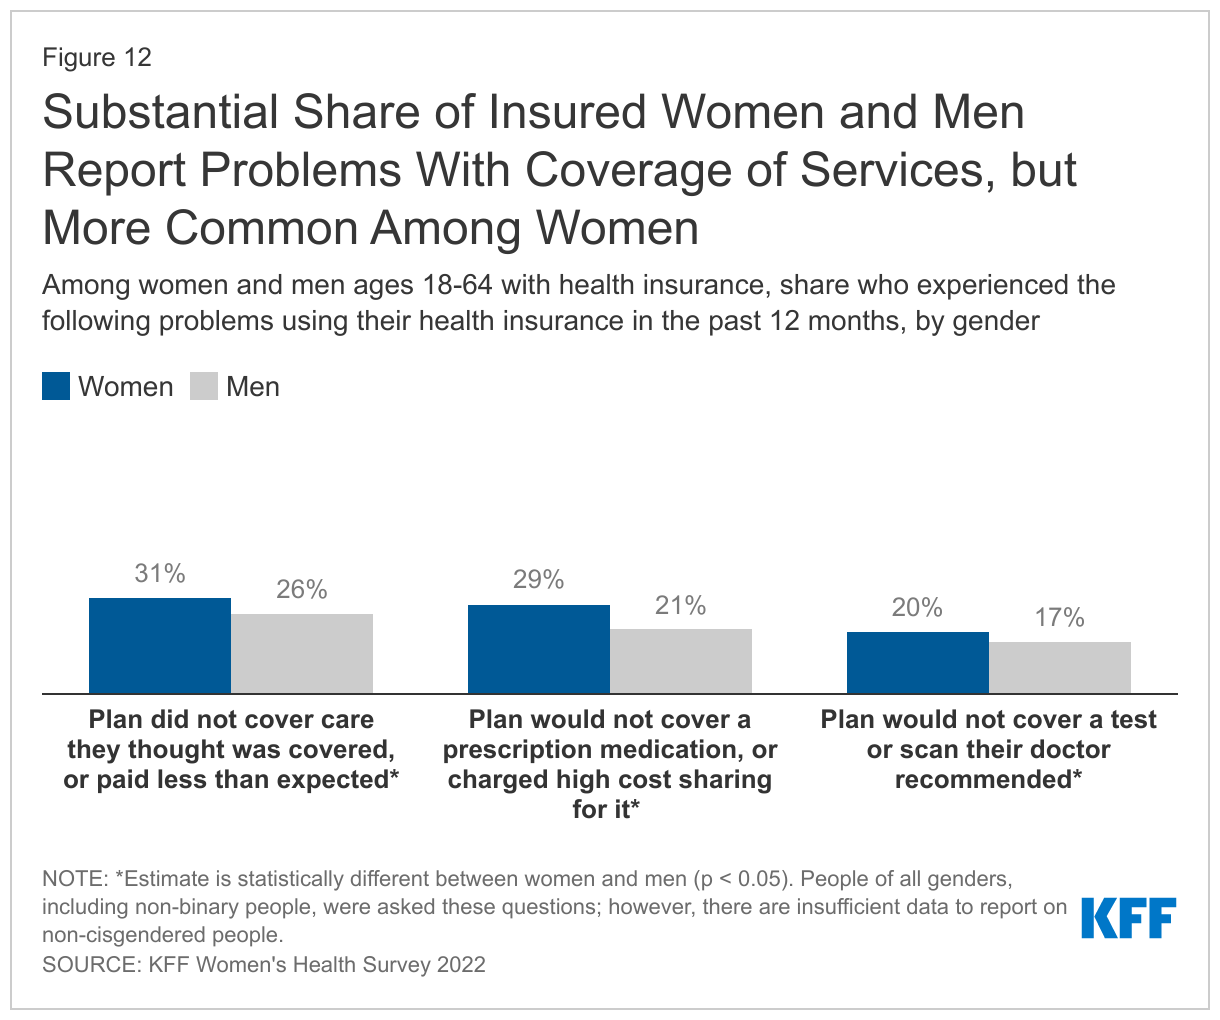
Thirty-one percent of women ages 18-64 with health coverage (employer-sponsored insurance, individual insurance, or Medicaid) report that in the past 12 months, they or a family member received care from a doctor, hospital, or lab they thought was covered, but their health plan did not cover the bill at all, or paid less than they expected, compared to 26% of men who say the same (Figure 12). More insured women than men say their plan would not cover a prescription medication or required a very expensive copay or coinsurance for it (29% vs. 21%). Women were slightly more likely than men to say that in the past 12 months, their plan would not cover a test or scan that their doctor recommended (20% vs. 17%).
These gender differences could be due to several factors, including that women are more likely than men to have visited a health care provider in the past two years, to take prescription medication on a regular basis, and to have an ongoing health condition that requires regular monitoring, medical care, or medication (see “Health Status and Use of Prescription Medications” section above).
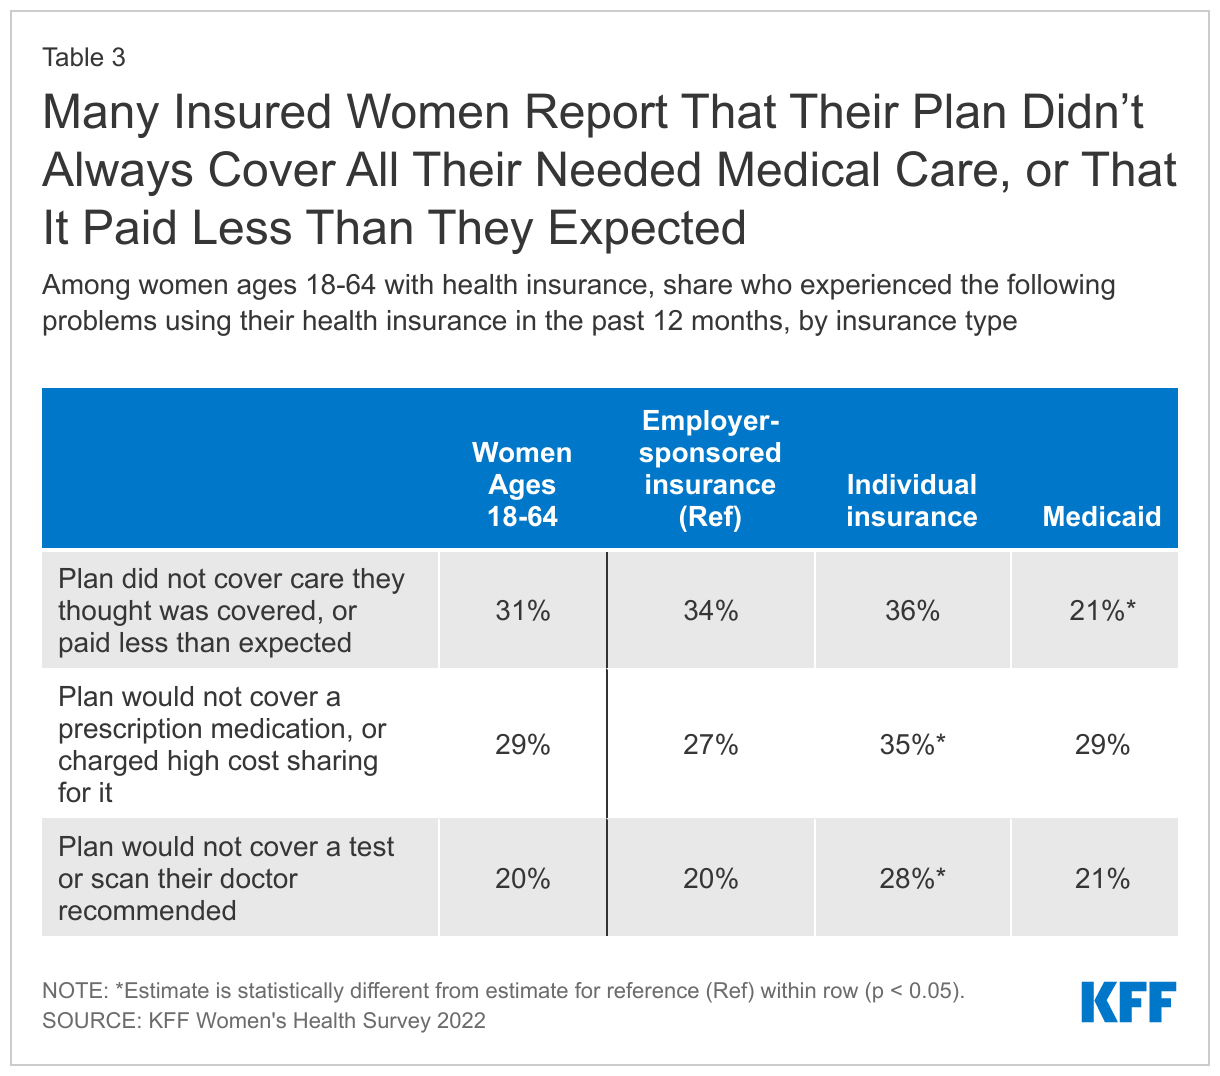
Some of these insurance coverage problems vary by type of insurance plan (Table 3).
For example, among women, more women with private insurance (individual or employer-sponsored plans) (34%) than women with Medicaid (21%) say their plan did not cover medical care they thought was covered, or paid less than expected, in the past 12 months. A higher share of women with individual coverage (35%) than women with employer-sponsored coverage (27%) or Medicaid (29%) say that their plan did not cover a prescription medication or required high cost sharing for it. Women with individual coverage (28%) are also more likely than women with employer-sponsored coverage (20%) or Medicaid (21%) to report their plan did not cover a test or scan their doctor recommended in the past 12 months.
Insurance companies sometimes deny coverage of prescription medications or require large co-payments, but many women are not aware that they can appeal coverage decisions.
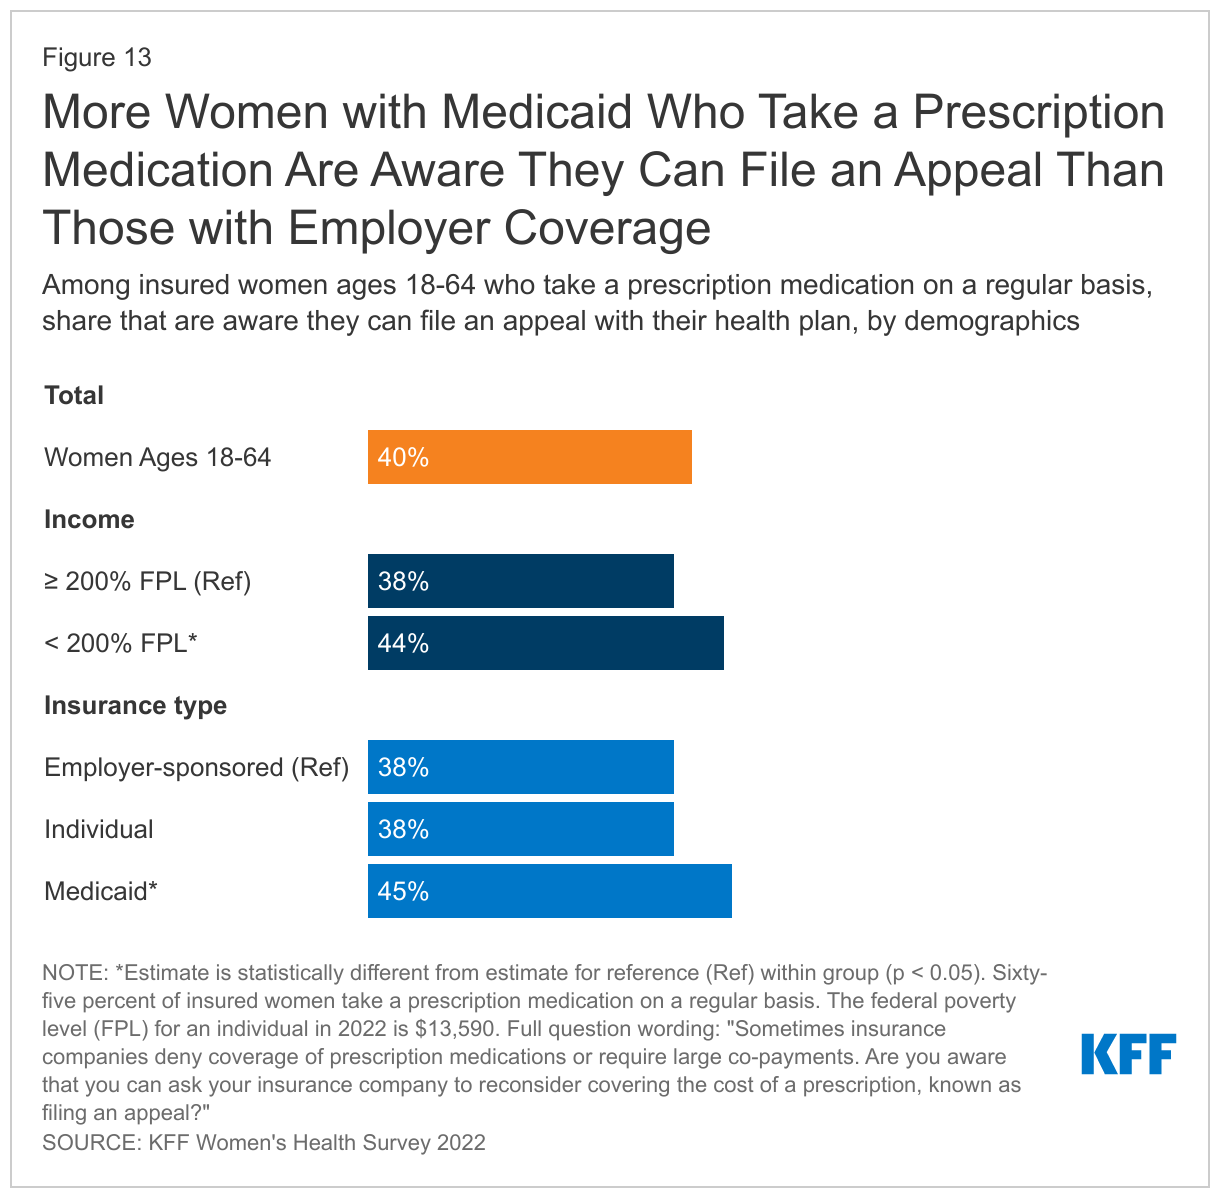
The ACA requires that most private health insurance plans have an appeals process for coverage determinations and claims. State Medicaid programs are also required by federal law to have an appeals process. Among the 65% of insured women who take a prescription medication on a regular basis, only four in ten (40%) are aware that they can ask their insurance company to reconsider covering the cost of a prescription, known as filing an appeal (Figure 13).
Knowledge of this option varies by income level and insurance type. More low-income women with insurance who take a prescription medication are aware that they can file an appeal with their health plan than higher-income women (44% vs. 38%). Women with Medicaid are also more likely than those with employer-sponsored insurance to know that this is an option (45% vs. 38%).
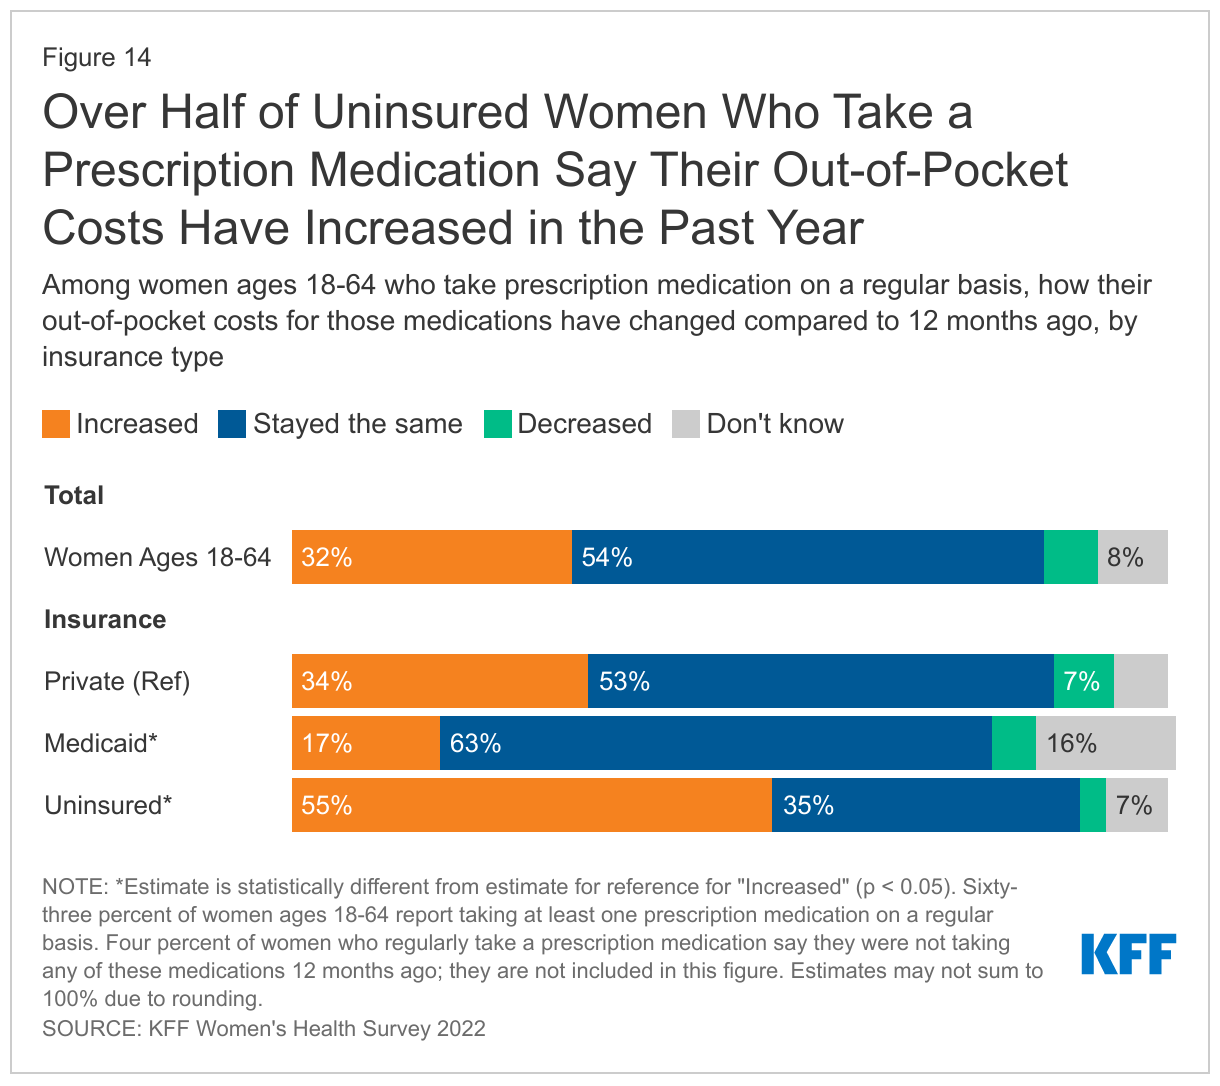
Many women who take a prescription medication say their out-of-pocket costs for those medications have increased over the past year.
Among the nearly two-thirds (63%) of women ages 18-64 who take a prescription medication on a regular basis, almost one-third (32%) say their out-of-pocket costs for those medications have increased compared to 12 months ago (Figure 14). Over half (54%) say their out-of-pocket costs have stayed the same, 6% say their costs have decreased, and 8% say they do not know.
Changes in out-of-pocket costs vary by type of insurance coverage. Fifty-five percent of women who are uninsured and who take a prescription medication say that their costs have increased compared to 12 months ago, compared to 34% of women with private insurance and 17% of those with Medicaid. Most women with private insurance (53%) and Medicaid (63%) say that their out-of-pockets costs for their prescription medications has not changed in the past year. Notably, twice as many women with Medicaid (16%) who take a prescription medication say they do not know how their out-of-pocket costs for those medications has changed, compared to 8% of all women. (Four percent say they were not taking any of these medications 12 months ago; they are not included in this analysis.)
Medical Bills
While the ACA has addressed some financial barriers to accessing health care, many women, including those with insurance, still report problems paying medical bills. Some women incur significant medical expenses because of an unexpected diagnosis such as cancer, or an illness or injury that limits their ability to work and earn income to pay off bills. Costly medical bills can also arise after receiving care from an out-of-network provider, commonly referred to as surprise medical bills. (The No Surprises Act, which took effect in January 2022, establishes new federal protections against surprise medical bills.)
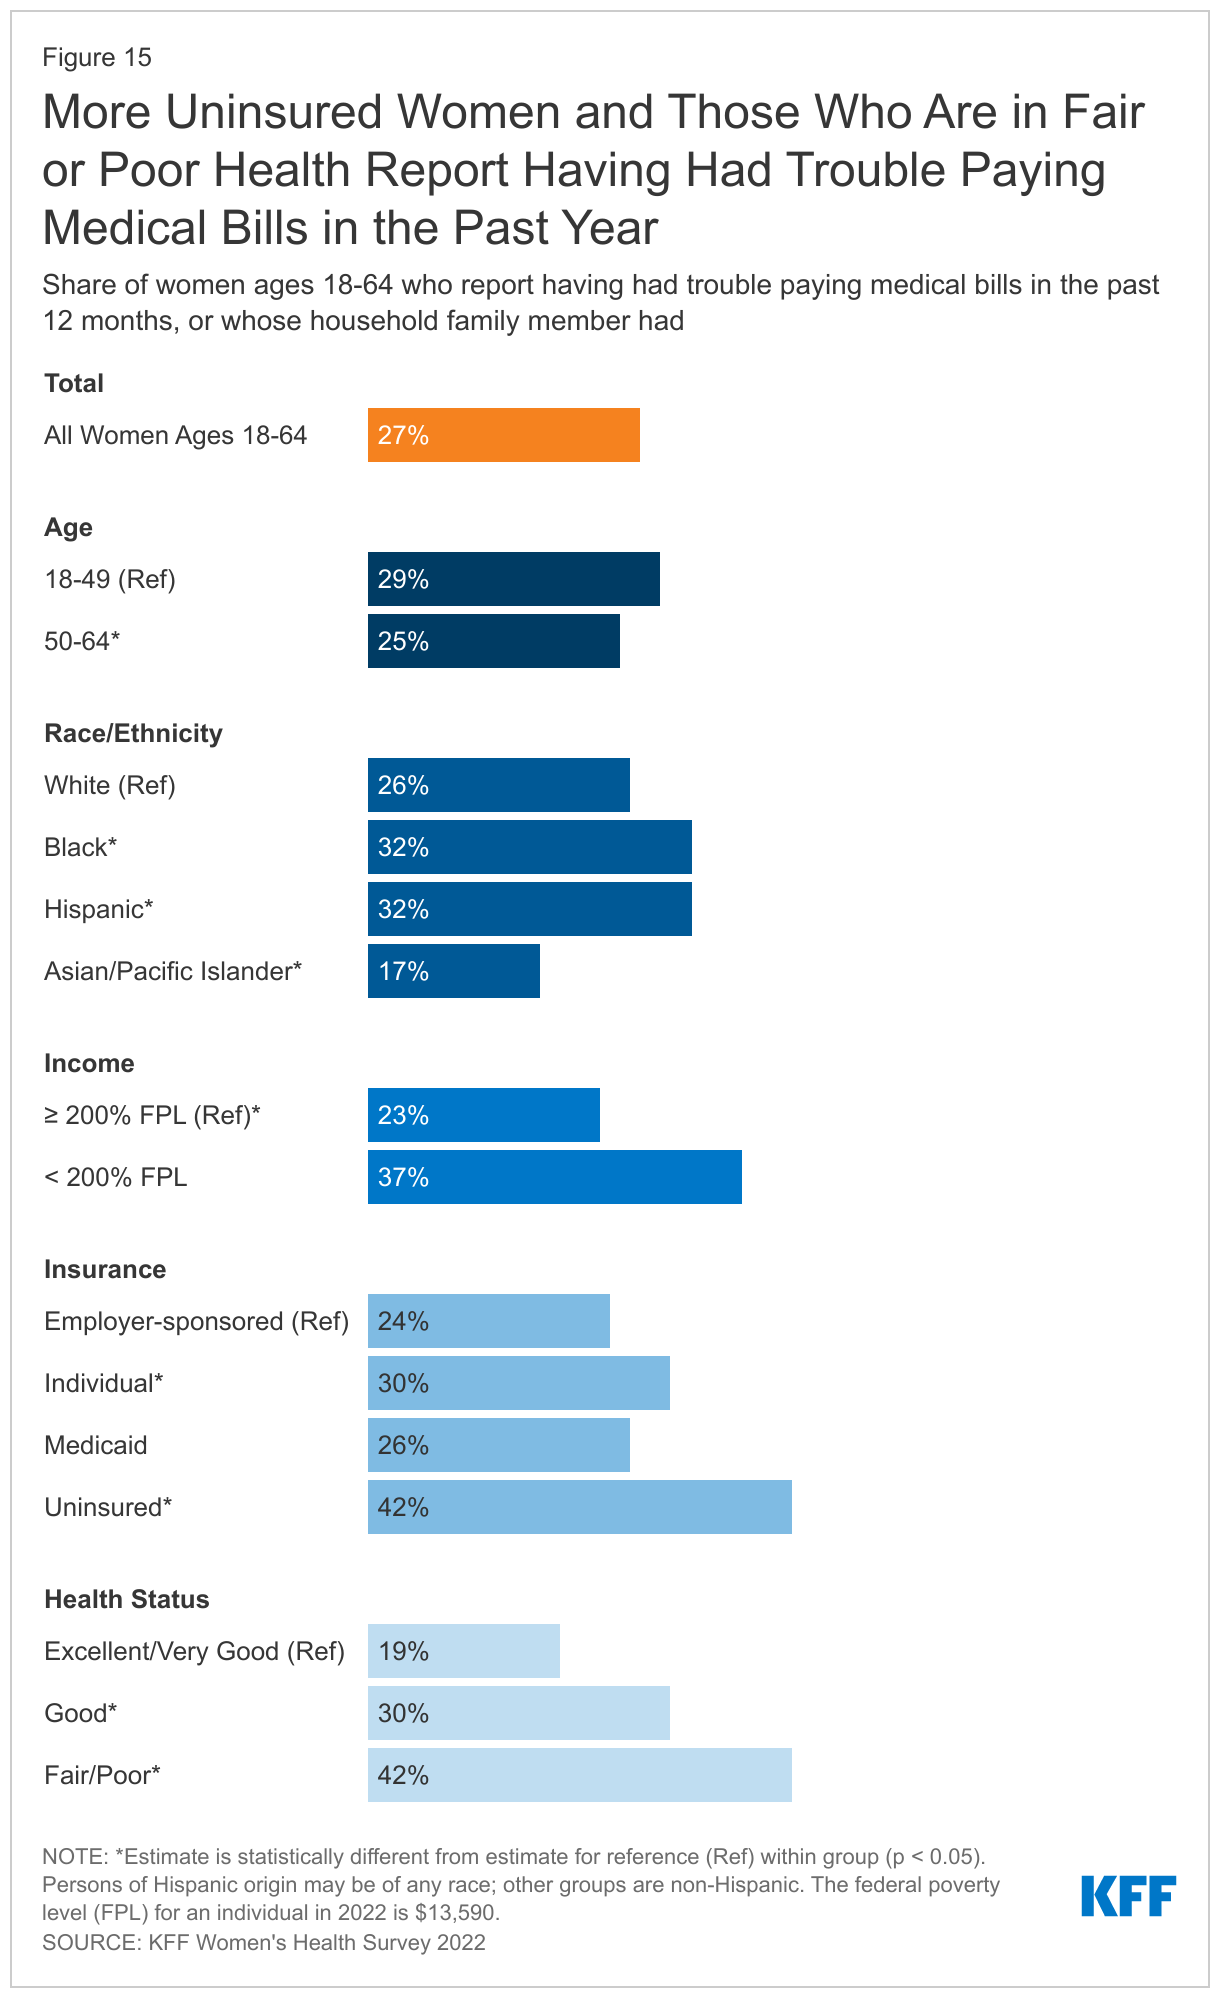
More than one in four women ages 18-64 report having had problems paying medical bills in the past year, with higher rates among uninsured women and women in poorer health. (Poorer health refers to those who report being in fair or poor health.)
Twenty-seven percent of women report that they or a household family member has had problems paying medical bills in the past 12 months, a slight increase from 2020 (24%). Problems paying medical bills are more common among women than men (23%).
Outstanding medical bills are more common among uninsured and women with low incomes and those in poorer health (Figure 15). This includes more than two in five (42%) uninsured women and women in poorer health, and almost two in five women with low incomes (37%). Approximately one-third of women who live in states that did not expand Medicaid (34%), Black (32%) and Hispanic women (32%) also report having trouble paying medical bills in the past 12 months. Women who live Medicaid expansion states are less likely than those in non-expansion states to have had trouble paying medical bills (data not shown). More women with children report problems paying medical bills in the past 12 months than do women without children (32% vs. 25%).
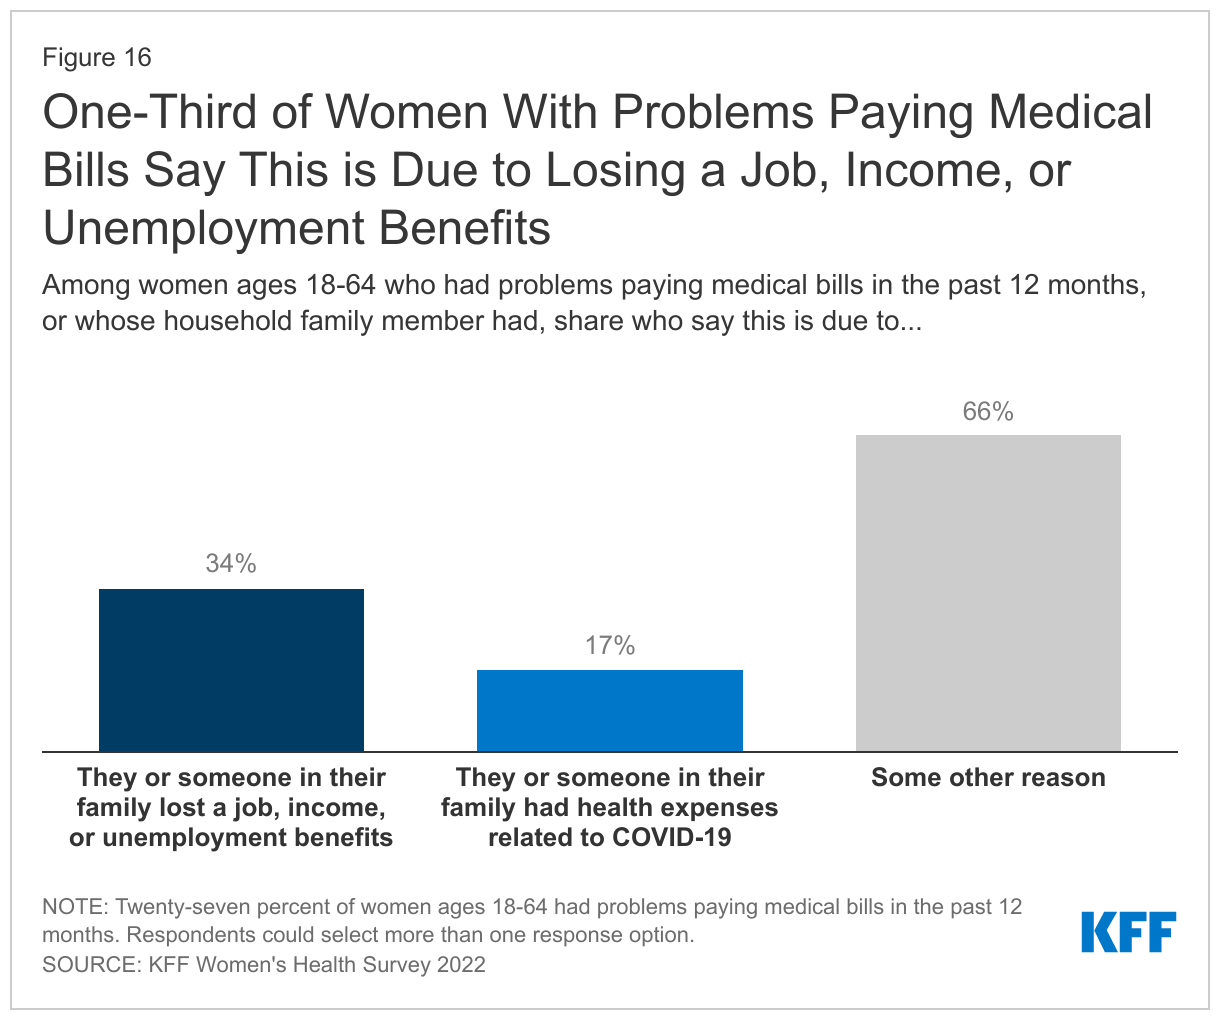
Among women who report having had problems paying medical bills in the past 12 months, one-third (34%) say it was because they or someone in their family lost a job, income, or unemployment benefits. Seventeen percent say it was because they or someone in their family had health expenses related to COVID-19. The majority (66%) of women who say they have had trouble paying medical bills in the past 12 months report that it is due to some other reason (Figure 16).
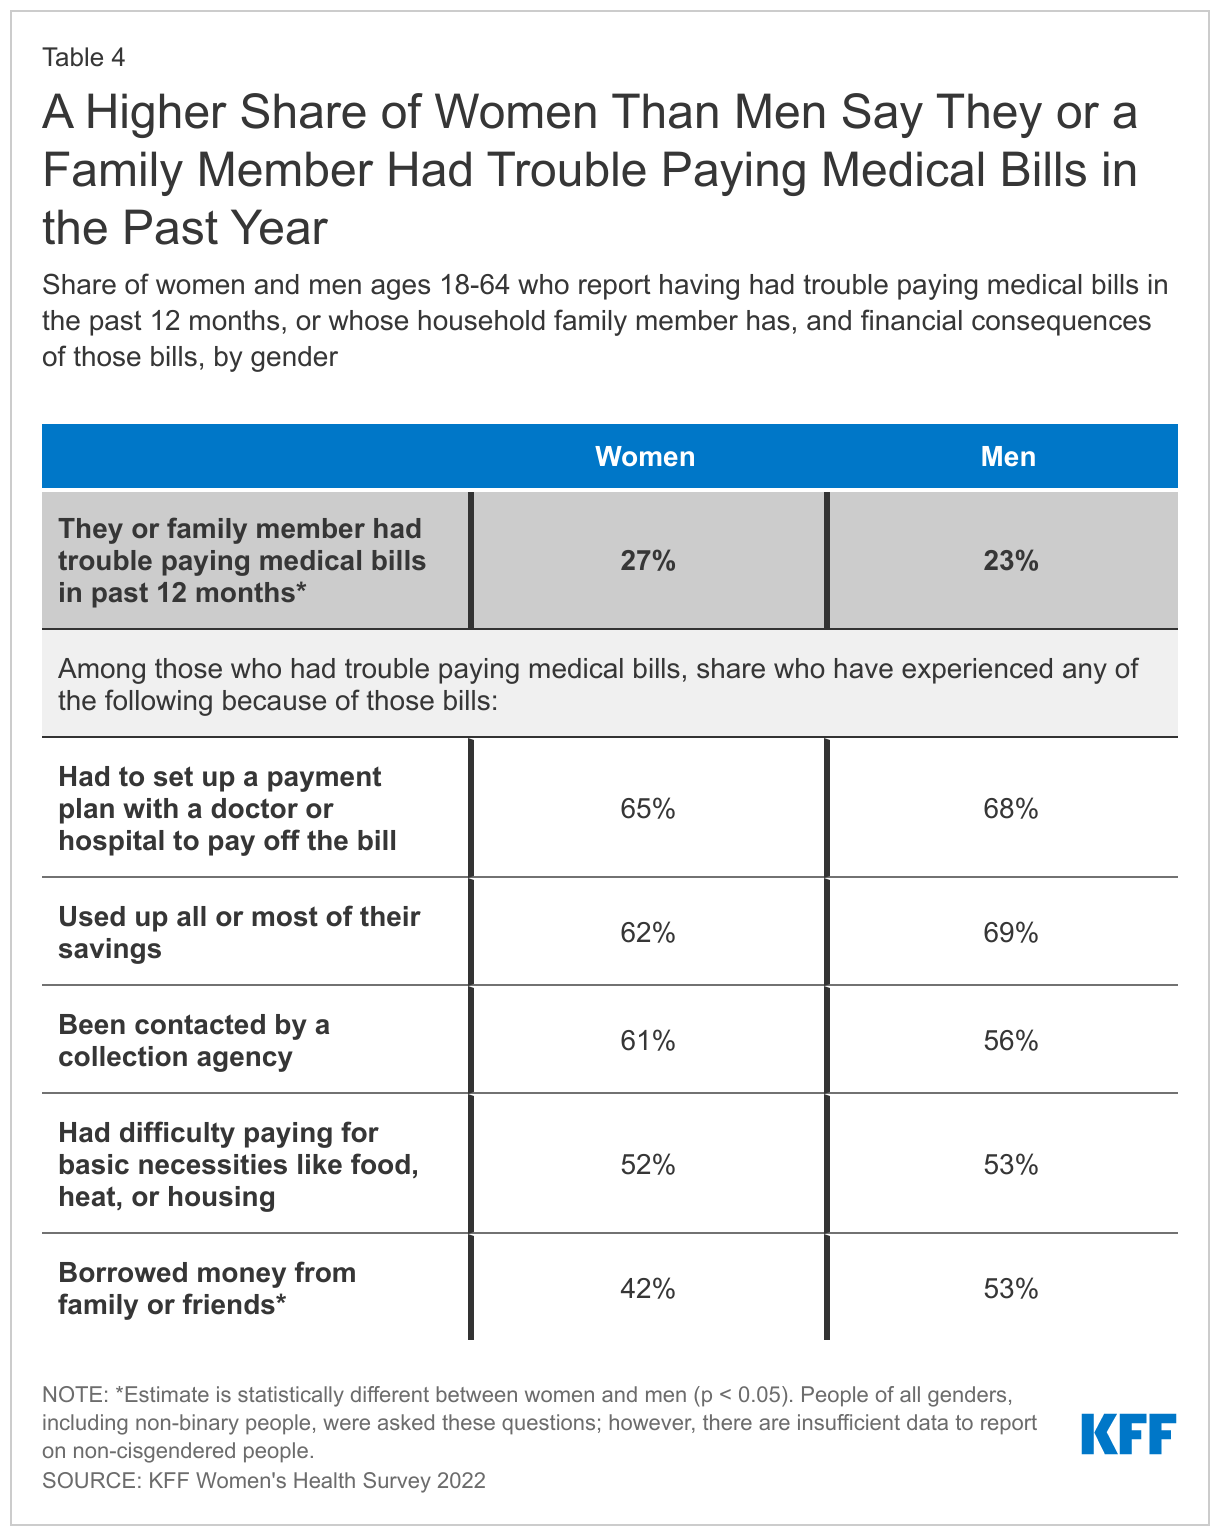
Medical bills can have serious consequences for people’s financial well-being and ability to afford basic necessities. Although more women than men report having problems paying medical bills in the past 12 months, women and men experience financial consequences because of the bills at similar rates.
Among the 27% of women and 23% of men who have had problems paying medical bills in the past 12 months, similar shares have had to set up a payment plan to pay off the bill (65% of women and 68% of men); used up all or most of their savings (62% of women and 69% of men); been contacted by a collection agency (61% of women and 56% of men); and had difficulty paying for basic necessities (52% of women and 53% of men) (Table 4). However, a higher share of men than women with recent problems paying medical bills report borrowing money from family or friends (53% vs. 42%).
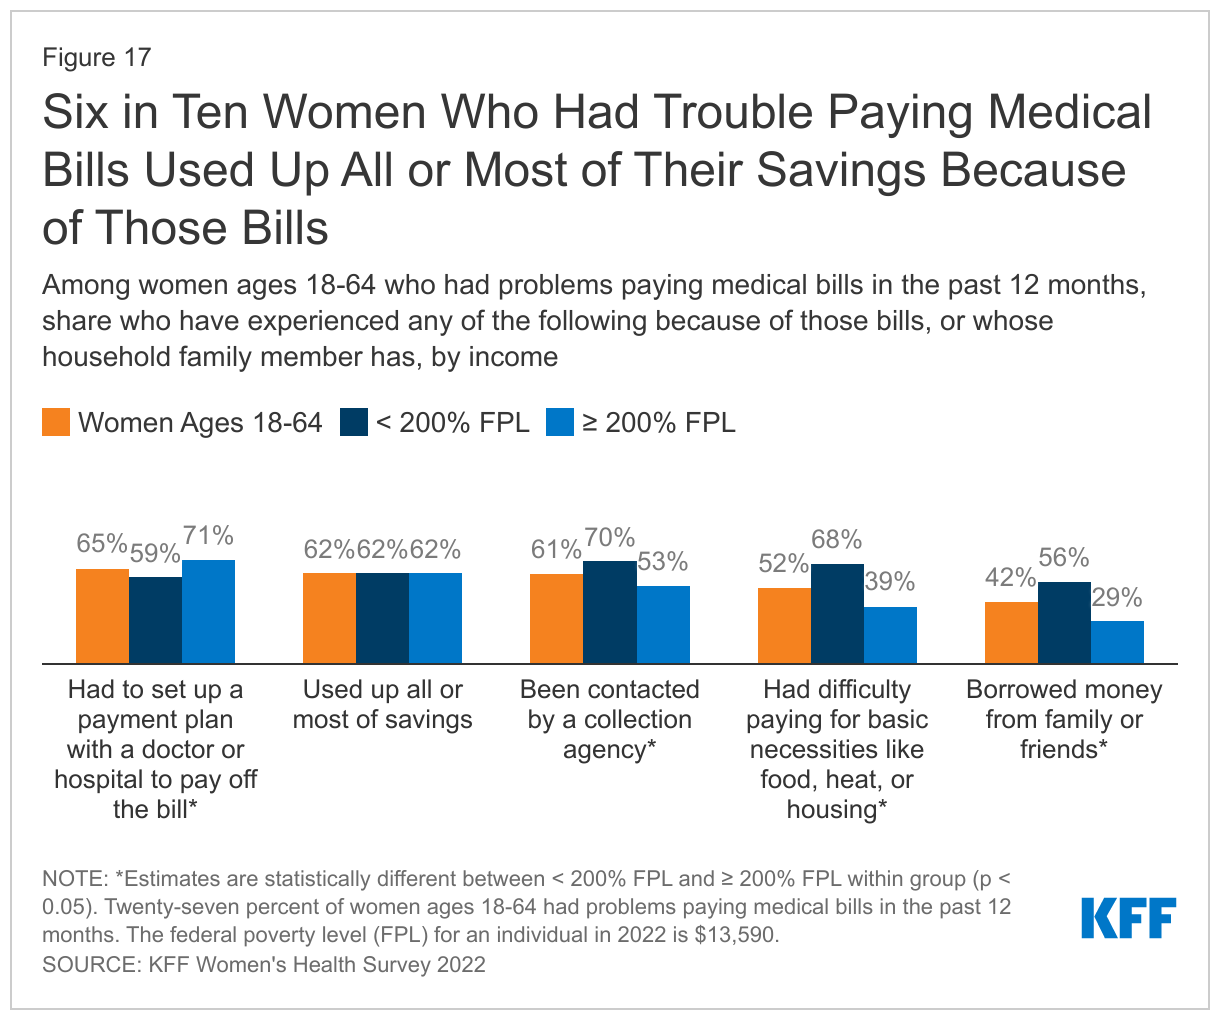
For women, the financial consequences of medical bills vary by income level (Figure 17).
Among the 27% of women who report having trouble paying medical bills in the past 12 months, women with low incomes are more likely than women with higher incomes to report having difficulty paying for basic necessities such as food, heat, or housing (68% vs. 39%); having been contacted by a collection agency (70% vs. 53%); or borrowing money from family or friends (56% vs. 29%). Women with higher incomes are more likely than women with low incomes to have had to set up a payment plan with a doctor or hospital (71% vs. 59%).
Conclusion
Women’s access to and use of health care services has an impact on their health outcomes. Most women report having a regular source of care and having had a recent doctor’s visit. However, connections to the delivery system are more tenuous for uninsured women and women with low incomes, who are less likely to report a recent visit or regular place of care. Most women report they have had a general check-up/well-woman visit in the past two years, but like other measures on access to care, rates are lower among uninsured women and those with low incomes. When looking at gender differences, women are more likely to have regular connections with the health care system than men.
The COVID-19 pandemic has changed how some people access health care, particularly a shift from in-person care to increased use of telehealth. Federal and state policy changes and market forces also contributed to the growth in the use of telehealth. Most women say they have used telehealth in the past two years, and most of them rate the quality of care they received as comparable to an in-person visit. This pattern is consistent for all types of telehealth services our survey asked about, ranging from check-ups to mental health care services. While many women do not express concerns about quality differences between telehealth and in person care, the extent to which this newer modality will continue to be utilized and grow will also depend on the reimbursement policies that private plans and public payors adopt following the end of the pandemic emergency.
Despite the role that health insurance plays in helping people afford health care and reducing patients’ financial risks when they need routine care, get sick, or need to be hospitalized, scope of coverage and affordability can still be challenging for many women with insurance coverage. A sizeable minority of women with insurance report having problems using their health plan, such as their plan not paying for health care they thought was covered but was not, or their plan not covering their prescription drugs or requiring high cost sharing for them. Many people say they have had problems paying medical bills in the past year, bur rates are higher among women than men. While the ACA strengthened access to coverage and offers protection from some out-of-pocket health care costs, gaps remain. For many, health care and coverage are still unaffordable and represent potential barriers to needed care.
Methodology
Overview
The 2022 KFF Women’s Health Survey is a nationally representative survey of 6,442 people ages 18 to 64, including 5,201 females (self-reported sex at birth) and 1,241 males, conducted from May 10, 2022, to June 7, 2022. The objective of the survey is to help better understand respondents’ experiences with contraception, potential barriers to health care access, and other issues related to reproductive health. The survey was designed and analyzed by researchers at KFF (Kaiser Family Foundation) and fielded online and by telephone by SSRS using its Opinion Panel, supplemented with sample from IPSOS’s KnowledgePanel.
This work was supported in part by Arnold Ventures. KFF maintains full editorial control over all of its policy analysis, polling, and journalism activities.
Questionnaire design
KFF developed the survey instrument with SSRS feedback regarding question wording, order, clarity, and other issues pertaining to questionnaire quality. The survey was conducted in English and Spanish. The survey instrument is available upon request.
Sample design
The majority of respondents completed the survey using the SSRS Opinion Panel (n=5,202), a nationally representative probability-based panel where panel members are recruited in one of two ways: (1) through invitations mailed to respondents randomly sampled from an Address-Based Sample (ABS) provided by Marketing Systems Group through the U.S. Postal Service’s Computerized Delivery Sequence. (2) from a dual-framed random digit dial (RDD) sample provided by Marketing Systems Group.
In order to have large enough sample sizes for certain subgroups (females ages 18 to 35, particularly females in the following subgroups: lesbian/gay/bisexual; Asian; Black; Hispanic; Medicaid enrollees; low-income; and rural), an additional 1,240 surveys were conducted using the IPSOS KnowledgePanel, a nationally representative probability-based panel recruited using a stratified ABS design.
Data collection
Web Administration Procedures
The majority of surveys completed using the SSRS Opinion Panel (n=5,056) and all of the surveys completed using the KnowledgePanel (n=1,240) were self-administered web surveys. Panelists were emailed an invitation, which included a unique passcode-embedded link, to complete the survey online. In appreciation for their participation, panelists received a modest incentive in the form of a $5 or $10 electronic gift card. All respondents who did not respond to their first invitation received up to five reminder emails and panelists who had opted into receiving text messages from the SSRS Opinion Panel received text message reminders.
Overall, the median length of the web surveys was 13 minutes.
Phone Administration Procedures
In addition to the self-administered web survey, n=146 surveys were completed by telephone with SSRS Opinion Panelists who are web reluctant. Overall, the median length of the phone surveys was 28 minutes.
Data processing and integration
SSRS implemented several quality assurance procedures in data file preparation and processing. Prior to launching data collection, extensive testing of the survey was completed to ensure it was working as anticipated. After the soft launch, survey data were carefully checked for accuracy, completeness, and non-response to specific questions so that any issues could be identified and resolved prior to the full launch.
The data file programmer implemented a “data cleaning” procedure in which web survey skip patterns were created in order to ensure that all questions had the appropriate numbers of cases. This procedure involved a check of raw data by a program that consisted of instructions derived from the skip patterns designated on the questionnaire. The program confirmed that data were consistent with the definitions of codes and ranges and matched the appropriate bases of all questions. The SSRS team also reviewed preliminary SPSS files and conducted an independent check of all created variables to ensure that all variables were accurately constructed.
As a standard practice, quality checks were incorporated into the survey. Quality control checks for this study included a review of “speeders,” reviewing the internal response rate (number of questions answered divided by the number of questions asked) and open-ended questions. Among all respondents, the vast majority (97%) answered 96% or more of the survey questions they received, with no one completing less than 91% of the administered survey (respondents were informed at the start of the survey that they could skip any question).
Weighting
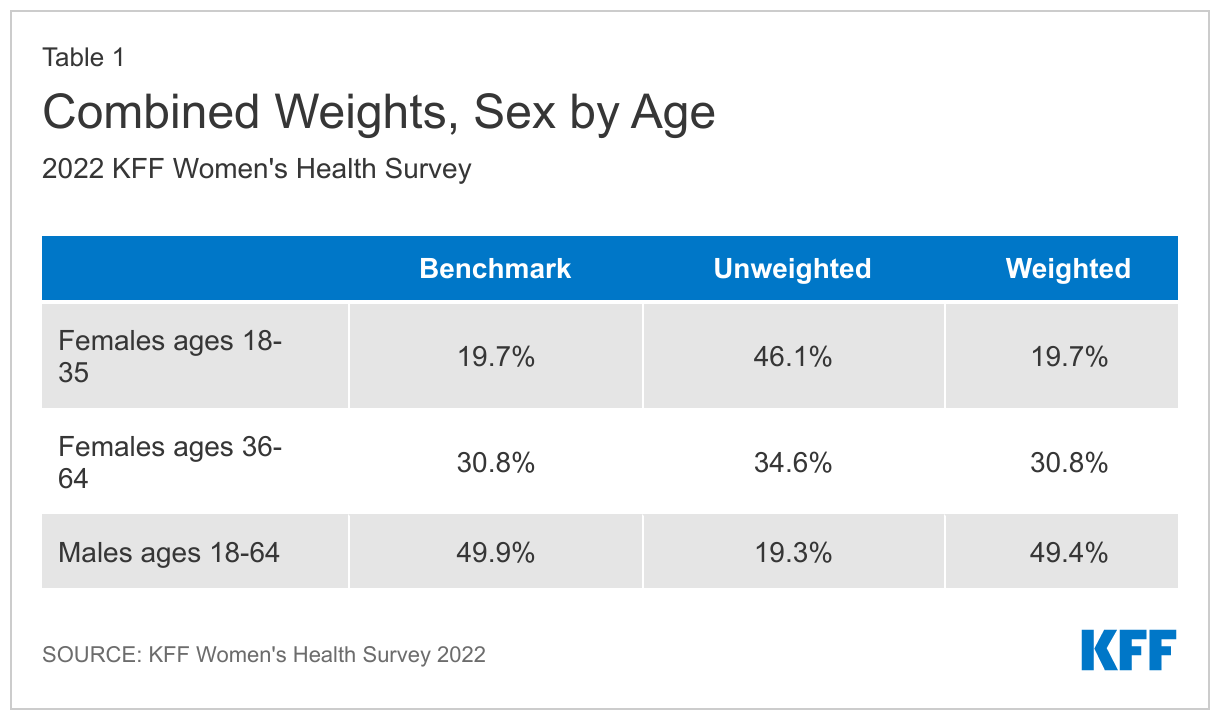
The data were weighted to represent U.S. adults ages 18 to 64. The data include oversamples of females ages 18 to 35 and females ages 36 to 64. Due to this oversampling, the data were classified into three subgroups: females 18 to 35, females 36 to 64, and males 18 to 64. The weighting consisted of two stages: 1) application of base weights and 2) calibration to population parameters. Each subgroup was calibrated separately, then the groups were put into their proper proportions relative to their size in the population.
Calibration to Population Benchmarks
The sample was balanced to match estimates of each of the three subgroups (females ages 18 to 35, females ages 36 to 64, and males ages 18 to 64) along the following dimensions: age; education (less than a high school graduate, high school graduate, some college, four-year college or more); region (Northeast, Midwest, South, West); and race/ethnicity (White non-Hispanic, Black non-Hispanic, Hispanic-born in U.S., Hispanic-born Outside the U.S., Asian non-Hispanic, Other non-Hispanic). The sample was weighted within race (White, non-Hispanic; Black, non-Hispanic; Hispanic; and Asian) to match population estimates. Benchmark distributions were derived from 2021 Current Population Survey (CPS) data.
Weighting summaries for females ages 18 to 35, females ages 36 to 64, and males ages 18 to 64 are available upon request.
Finally, the three weights were combined, and a final adjustment was made to match the groups to their proper proportions relative to their size in the population (Table 1).
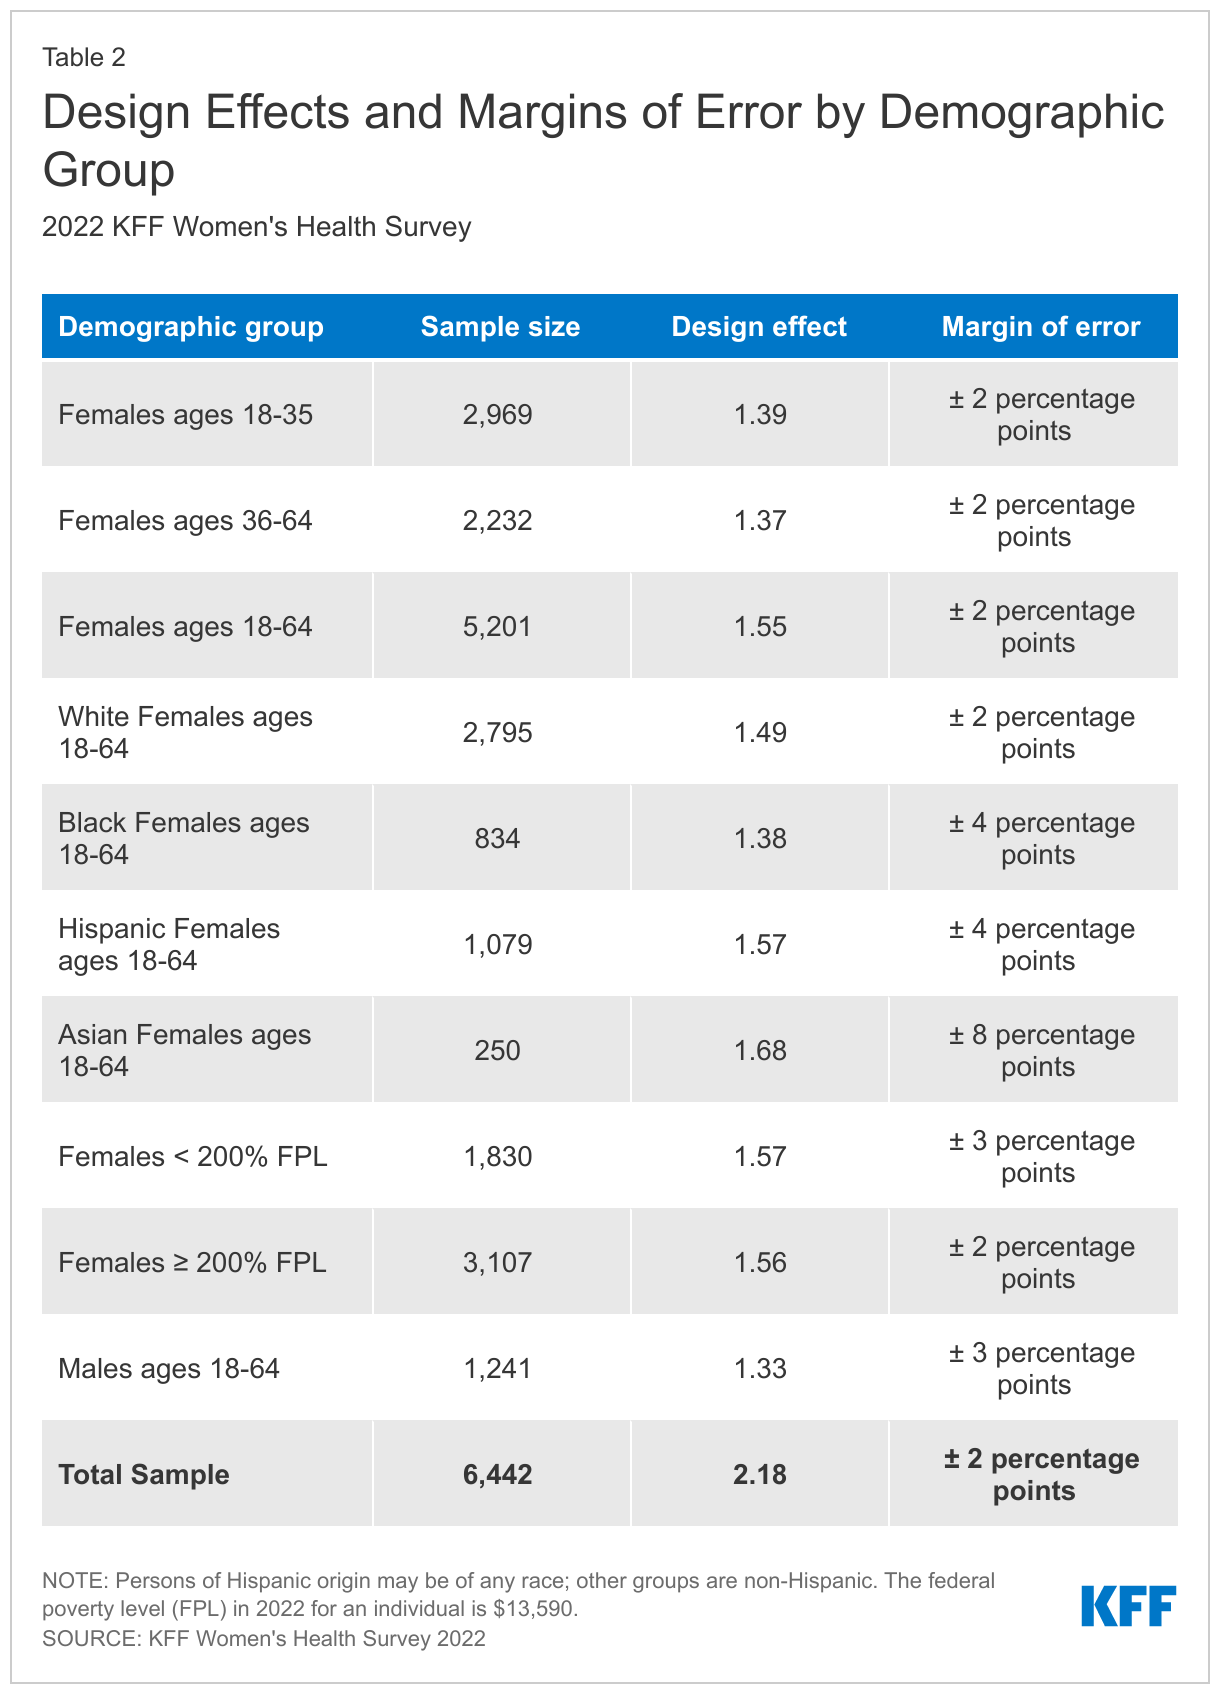
Margin of Sampling Error
The margin of sampling error, including the design effect for subgroups, is presented in Table 2 below. It is important to remember that the sampling fluctuations captured in the margin of error are only one possible source of error in a survey estimate and there may be other unmeasured error in this or any other survey.
KFF Analysis
Researchers at KFF conducted further data analysis using the R survey package, including creating constructed variables, running additional testing for statistical significance, and coding responses to open-ended questions. The survey instrument is available upon request.
Rounding
Some figures in the report do not sum to totals due to rounding. Although overall totals are statistically valid, some breakdowns may not be available due to limited sample sizes or cell sizes. Where the unweighted sample size is less than 100 or where observations are less than 10, figures include the notation “NSD” (Not Sufficient Data).
Statistical significance
All statistical tests are performed at the .05 confidence level. Statistical tests for a given subgroup are tested against the reference group (Ref.) unless otherwise indicated. For example, White is the standard reference for race/ethnicity comparisons and private insurance is the standard reference for types of insurance coverage. Some breakouts by subsets have a large standard error, meaning that sometimes even large differences between estimates are not statistically different.
A note about sex and gender language
Our survey asked respondents which sex they were assigned at birth, on their original birth certificate (male or female). They were then asked what their current gender is (man, woman, transgender, non-binary, or other). Those who identified as transgender men are coded as men and transgender women are coded as women. While we attempted to be as inclusive as possible and recognize the importance of better understanding the health of non-cisgendered people, as is common in many nationally representative surveys, we did not have a sufficient sample size (n >= 100) to report gender breakouts other than men and women with confidence that they reflect the larger non-cisgender population as a whole. The data in our reproductive health reports use the respondent’s sex assigned at birth (inclusive of all genders) to account for reproductive health needs/capacity (e.g., ever been pregnant) while the data in our other survey reports use the respondent’s gender.