A Look at Strategies to Address Behavioral Health Workforce Shortages: Findings from a Survey of State Medicaid Programs

Authors: Heather Saunders, Madeline Guth, and Gina Eckart
Published: Jan 10, 2023

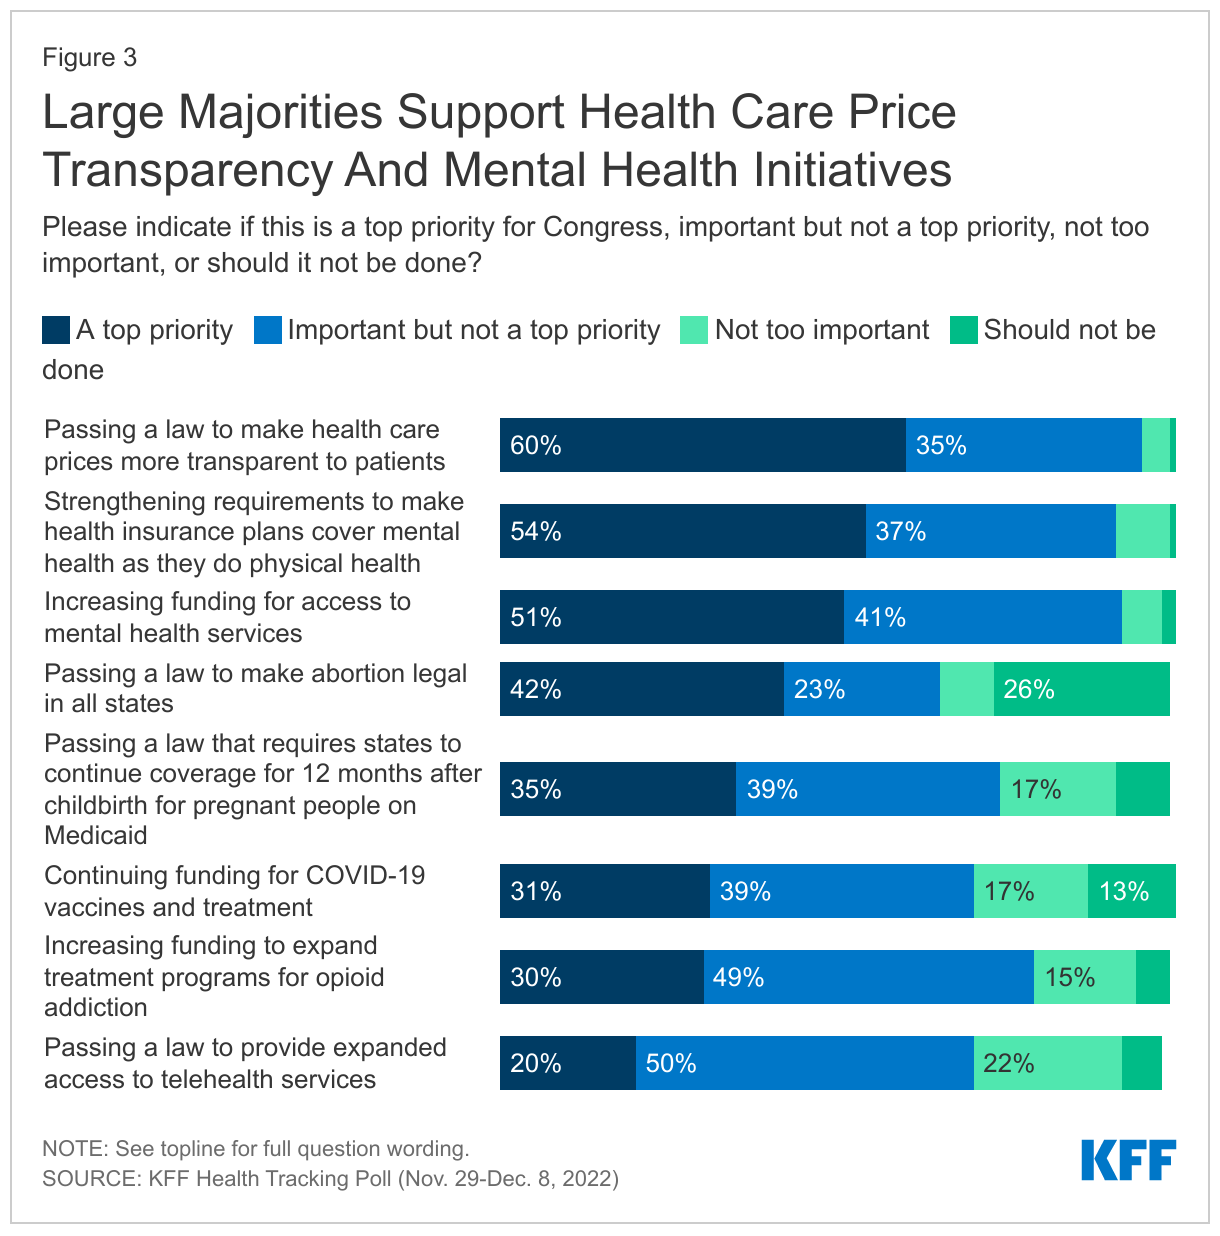
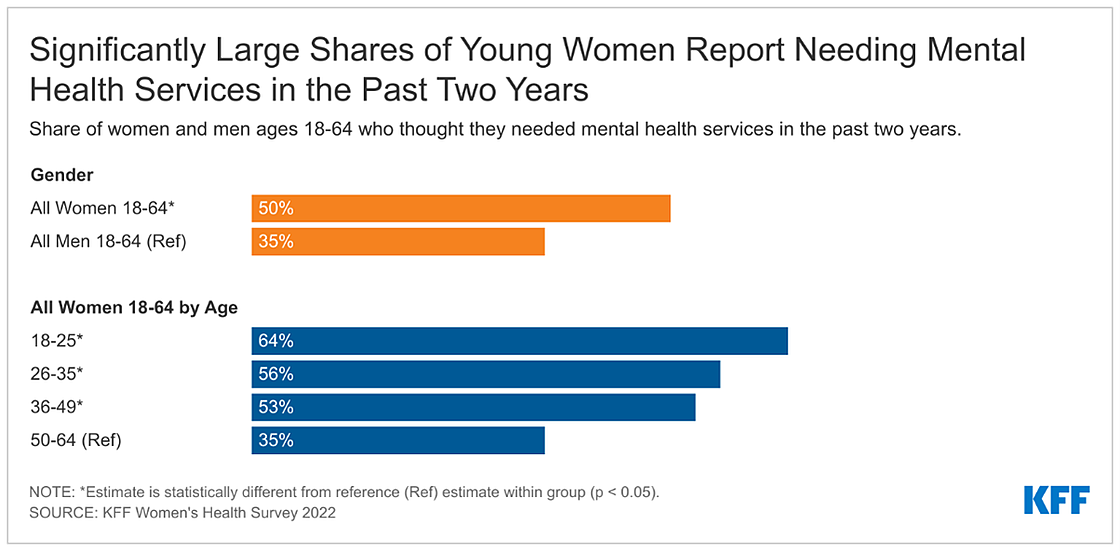
The pandemic has exacerbated mental health and substance use issues and 90% of Americans believe the nation is in the midst of a mental health crisis. Despite increases in need, data show that treatment rates across all payers are low. Documented workforce challenges contribute to barriers in access to care and nearly half of the US population – 47% or 158 million people – living in a mental health workforce shortage area. Behavioral health conditions (i.e. mental health and substance use disorders) are most prevalent in Medicaid enrollees, with data from 2020 showing that approximately 39% of Medicaid enrollees were living with a mental health or substance use disorder. Workforce challenges are widespread and go beyond Medicaid, but shortages may be exacerbated in Medicaid. On average, only 36% of psychiatrists accept new Medicaid patients – lower compared to other payers and compared to rates for physicians overall (71%). Even when providers accept Medicaid, they may only take a few patients or may not be presently taking new Medicaid patients. There is attention at the federal level to address workforce shortages—and states are also taking action to address these issues for Medicaid enrollees and more broadly. The Consolidated Appropriations Act passed in December 2022 authorized additional provisions to address workforce shortages, including new psychiatry residency positions, removal of additional requirements for providers who want to prescribe certain medications for opioid use disorder (OUD), requirements for improved Medicaid provider directories, and new funds that can be used toward workforce initiatives for peer support providers.

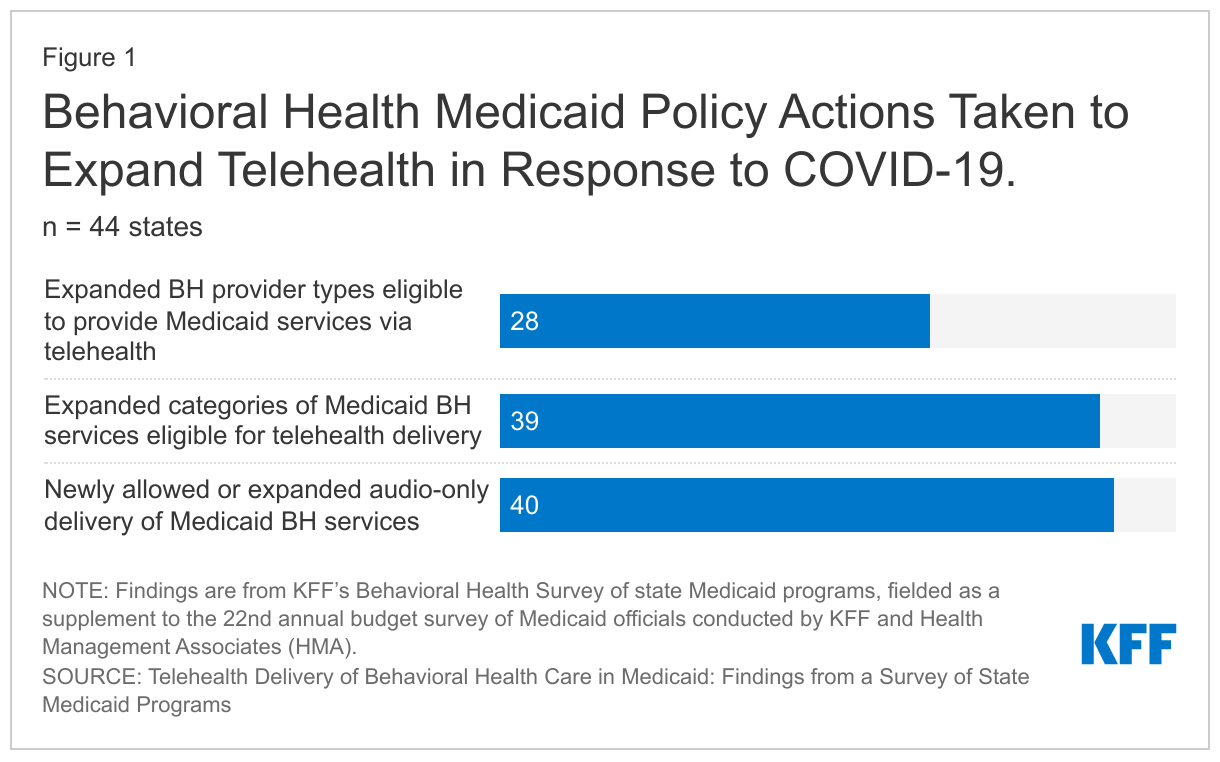
We surveyed state Medicaid officials about their state’s strategies for addressing behavioral health workforce shortages that were in place in state fiscal year (FY) 2022 or implemented/planned for FY 2023. These questions were part of KFF’s Behavioral Health Survey of state Medicaid programs, fielded as a supplement to the 22nd annual budget survey of Medicaid officials conducted by KFF and Health Management Associates (HMA). A total of 44 states (including the District of Columbia) responded to the survey, but response rates varied by question.

State strategies to address the behavioral health workforce shortage fall into four key areas: increasing rates, reducing burden, extending workforce, and incentivizing participation. We asked states about their strategies to address behavioral health workforce shortages. Nearly all states indicated using at least one specified strategy to increase behavioral health workforce, with almost half of states endorsing at least one strategy in all four key areas. This issue brief describes these four categories of behavioral health workforce strategies and summarizes state Medicaid program activity in each area.

Figure 1: Key Medicaid Strategies to Address Behavioral Health Workforce Shortages in place or planned as of FY2022

Increasing Reimbursement Rates

Gaps in access to certain providers, especially psychiatrists, are an ongoing challenge in Medicaid and often in the broader health system due to overall provider shortages and geographic maldistribution of behavioral health providers. Lower Medicaid payment rates (relative to other payers) as well as disparities in pay between physical and mental health providers could limit participation in Medicaid and further exacerbate existing workforce shortages. Psychiatrists, for example, receive lower Medicaid reimbursement than primary care providers for similar services. States have considerable flexibility to set provider payment rates in fee-for-service. Managed care plans, which now serve most Medicaid beneficiaries, are responsible under their contracts with states for ensuring adequate provider networks and setting rates to providers, but states have several options to ensure that rate increases are passed to the providers that contract with managed care organizations (MCOs). The American Rescue Plan Act (ARPA) gave states temporary funding (primarily through an increase in the Medicaid match rate for home and community based services (HCBS)) to increase certain provider rates or provide payments to attract or retain workers. COVID-19 Medicaid public health emergency (PHE) authorities gave states additional flexibility to adopt temporary rate increases.

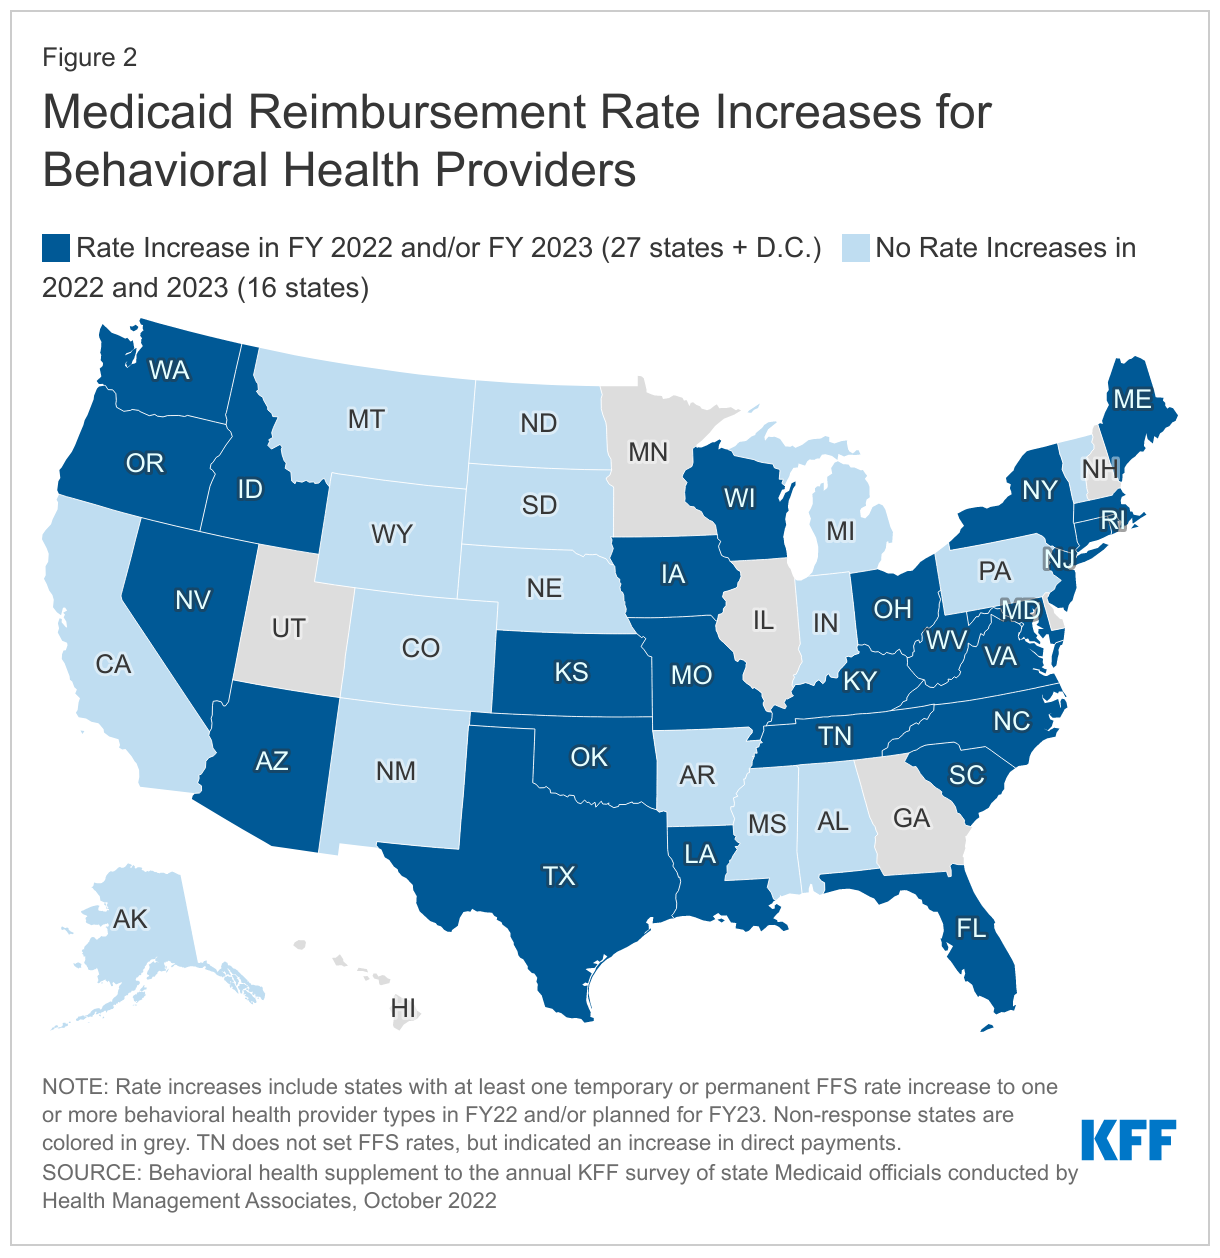
To attract or retain Medicaid behavioral health professionals, nearly two-thirds of responding states (28 of 44) implemented fee-for-service (FFS) rate increases in FY 2022 or plan to do so in FY 2023 (Figure 1). Of these, 19 states reported rate increases in FY 2022 and 23 states reported plans to increase rates in FY 2023. Sixteen states reported no rate increases for 2022 and 2023.

Many states report the use of ARPA HCBS funds to temporarily increase behavioral health provider rates. For example, behavioral health providers in Ohio have been approved to receive a one-time payment equal to 10% of claims paid in FY 2021. In some states, rate increases were targeted to specific provider types, such as increases to residential level of care for SUD or increases for applied behavioral analysts. Other states implemented increases that were more widespread. For example, the state of Oregon directed its Medicaid coordinated care organizations to increase the rates of behavioral health providers: a 30% increase for providers who receive 50% or more of their revenue from Medicaid; 15% increase for providers who receive less than 50% Medicaid revenue; and additional differentials for certain types of care (such as culturally or linguistically specific services). Missouri and Oklahoma are increasing some provider rates to be more in line with Medicare rates. In most states that contract with MCOs, states reported that they would require MCOs to implement the FFS rate increases (for example, through a state-directed payment). A smaller share of MCO states do not require, but may encourage, MCOs to implement FFS rate increases.

Medicaid Reimbursement Rate Increases for Behavioral Health Providers

Extending the Workforce

Given the substantial behavioral health workforce shortage, many state strategies focus on options that extend the workforce such as reimbursing for new provider types, adding provider types that can bill without a supervising practitioner, loosening restrictions on in-person requirements (such as telehealth or interprofessional codes), or reimbursing for care delivered by trainees or the license-eligible workforce. Each state has its own set of laws and regulations that set standards and specify the scope of practice for different provider types. Medicaid agencies have flexibility to decide which types of providers and services are eligible for reimbursement, as well as the settings in which those services must be provided, though there may be some variation across MCOs.

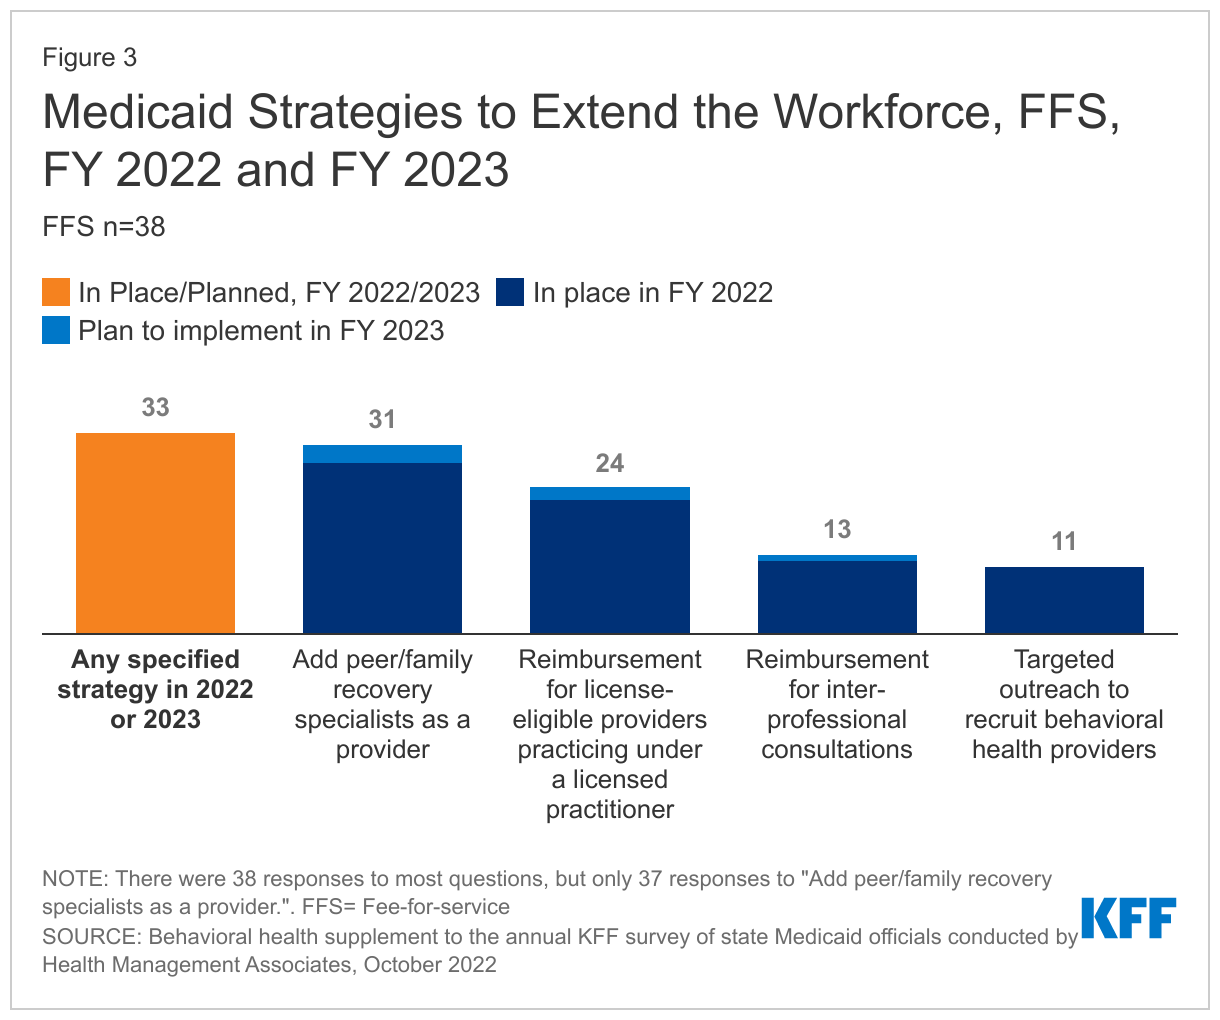
Nearly all responding states reported they had at least one strategy in place or planned for FY 2022/2023 to expand the workforce, such as extending the types of providers that could bill for services, using inter-professional consultation codes, or engaging in outreach efforts to recruit new providers (Figure 3). Most states with MCOs reported that requirements in FFS were also required for MCOs. Adding peer or family specialists as providers was the most commonly reported strategy for expanding the workforce. In addition, some states reported extending direct reimbursement privileges to other types of mental health practitioners. For example, New Jersey now includes licensed clinical social workers as a type of provider that can bill independently. Nearly two-thirds of responding states reimburse services delivered by individuals who are license-eligible and practicing under supervision as of FY 2022. Less common strategies included Medicaid reimbursement for inter-professional consultations and targeted recruitment efforts, with around one-third of reporting states having either of these strategies in place as of FY 2022. Interprofessional consultation codes can extend the workforce by allowing general providers to be reimbursed for consultations with specialists. For example, with this code, a rural primary care provider could get reimbursed for a consultation with a psychiatrist to discuss medication management for a patient with a serious mental illness. State interest in interprofessional consultations may increase following recent CMS guidance stating that interprofessional consultation can be covered as a distinct service.

Medicaid Strategies to Extend the Workforce, FFS, FY 2022 and FY 2023

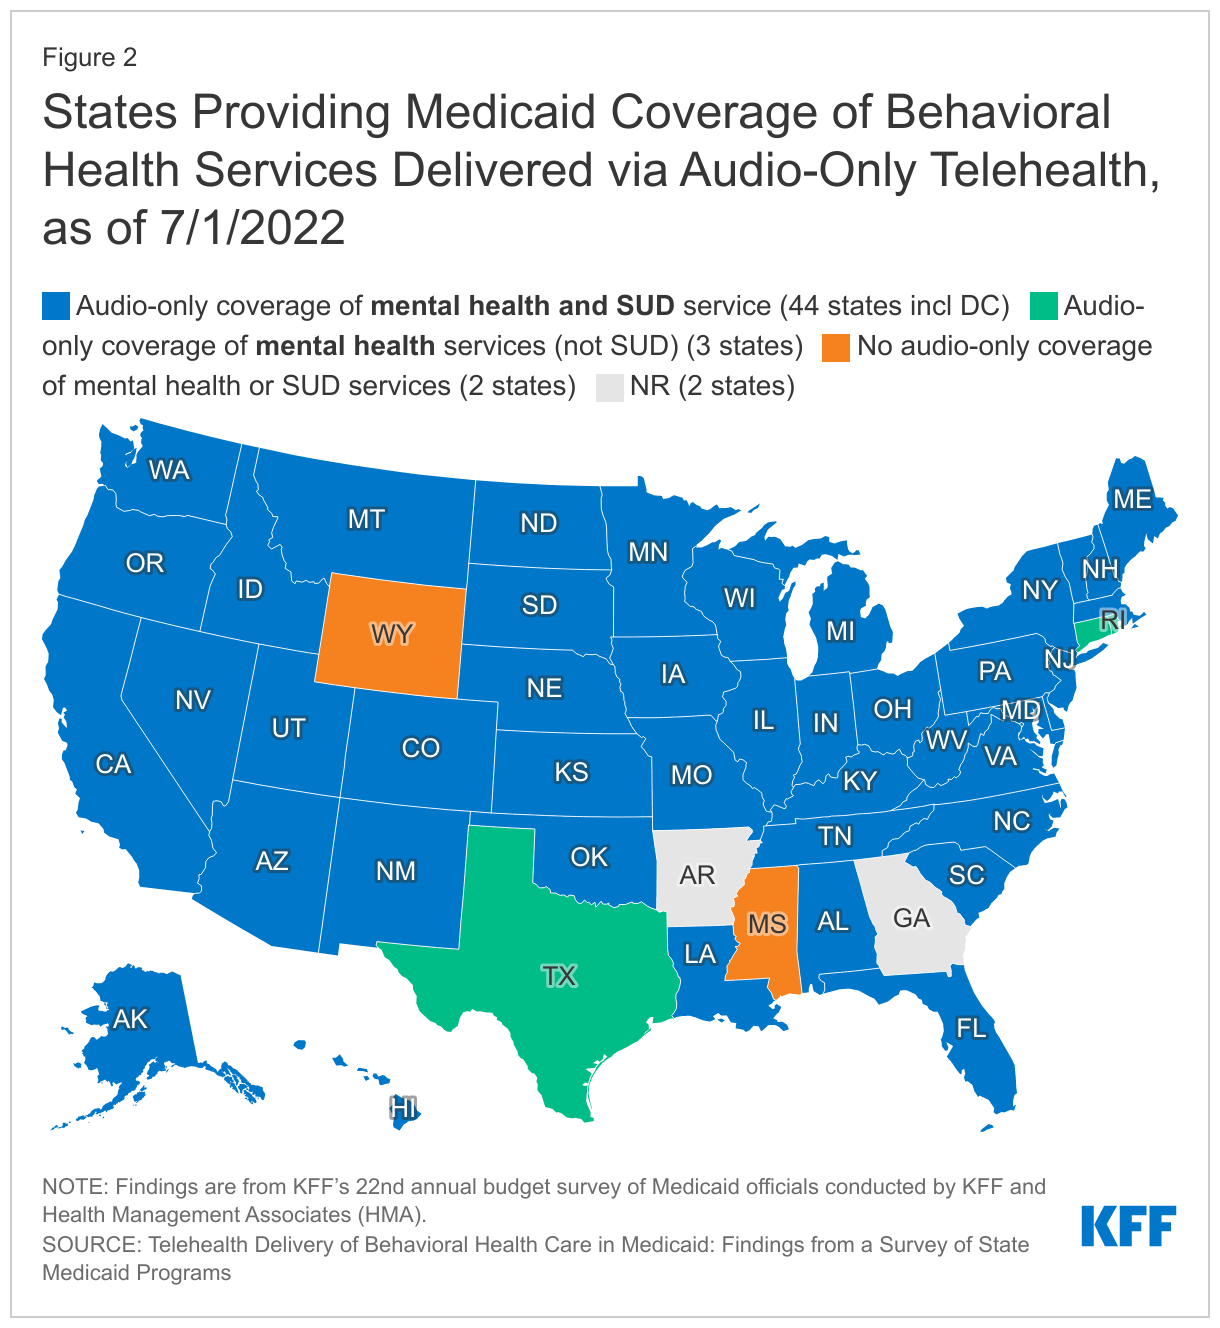
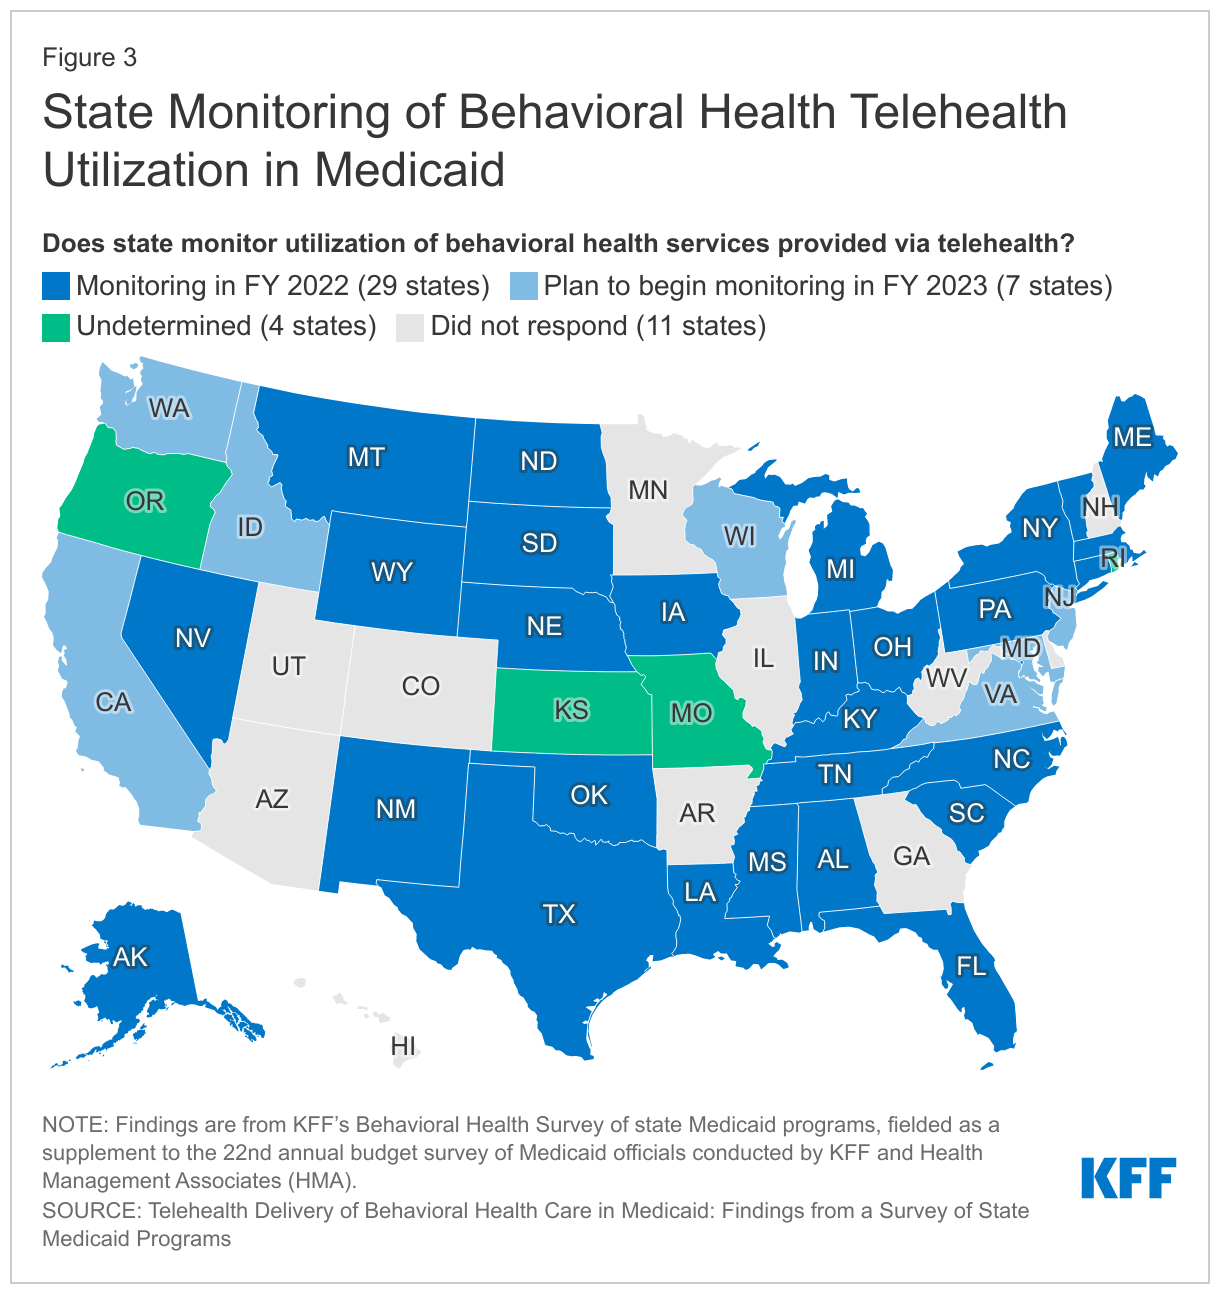
Telehealth may also address behavioral health workforce shortages and increase access to care. States have broad authority to cover telehealth in Medicaid without federal approval. To increase health care access and limit risk of viral exposure during the pandemic, all 50 states and DC expanded coverage and/or access to telehealth services in Medicaid, including expansions aimed at increasing access to telehealth delivery of behavioral health care. As of July 2021, most states reported wide coverage of telehealth services in both FFS and managed care programs. In FY 2022, more than three-quarters of states reported that behavioral health services were among those with the highest utilization. In the current survey, the state of Nebraska noted that telehealth was the most effective strategy for addressing its behavioral health workforce challenges.

Reducing Administrative Burden

Provider administrative burden refers to a wide range of administrative activities and can include prior authorization, lengthy forms or documentation requirements, unclear processes to navigate, lengthy credentialling process, and unclear reasons for denials or auditing. Research indicates that administrative burden can impede provider insurance acceptance, particularly if the administrative burdens are disproportionate for Medicaid relative to other payers. Providers contracting with multiple MCOs may notice that administrative requirements and processes vary between MCOs due to the lack of standardization at the state level. Varying administrative burdens may be particularly challenging for smaller behavioral health providers/organizations. Thus, addressing administrative burdens could reduce time associated with unbillable provider time and resources and result in higher rates of Medicaid acceptance.

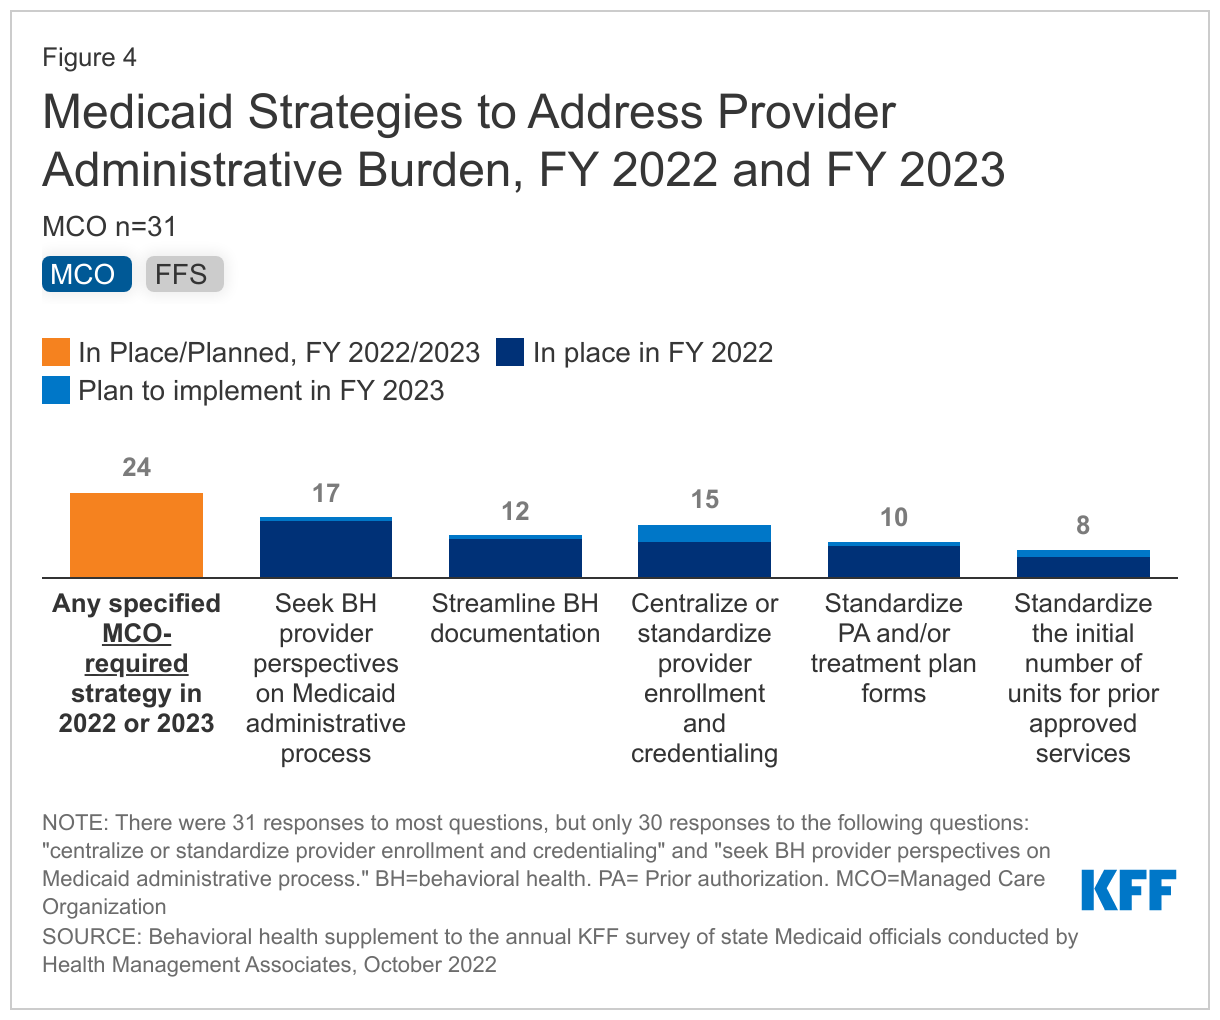
About three-quarters of responding states reported at least one strategy in place or planned for FY 2022/2023 to reduce provider administrative burden both in FFS and/or MCOs (Figure 4). States most frequently reported seeking behavioral health provider feedback on administrative processes, followed by implementing centralized or standardized credentialling. Notably, multiple states reported plans to implement centralized or standardized provider credentialing in FY 2023, suggesting growth in the adoption of this strategy. Somewhat fewer states reported standardized prior authorization, treatment plan forms, or initial number of units or days for prior approved services.

Notably, the authority of state Medicaid programs to independently reduce administrative burden may vary by state, with some Medicaid programs having this authority independent of other state agencies, and others sharing it. As an example, one state noted that their state's behavioral health authority also regulates documentation, so efforts to streamline documentation require collaboration between the two agencies.

Medicaid Strategies to Address Provider Administrative Burden,  FY 2022 and FY 2023

Incentivizing Participation

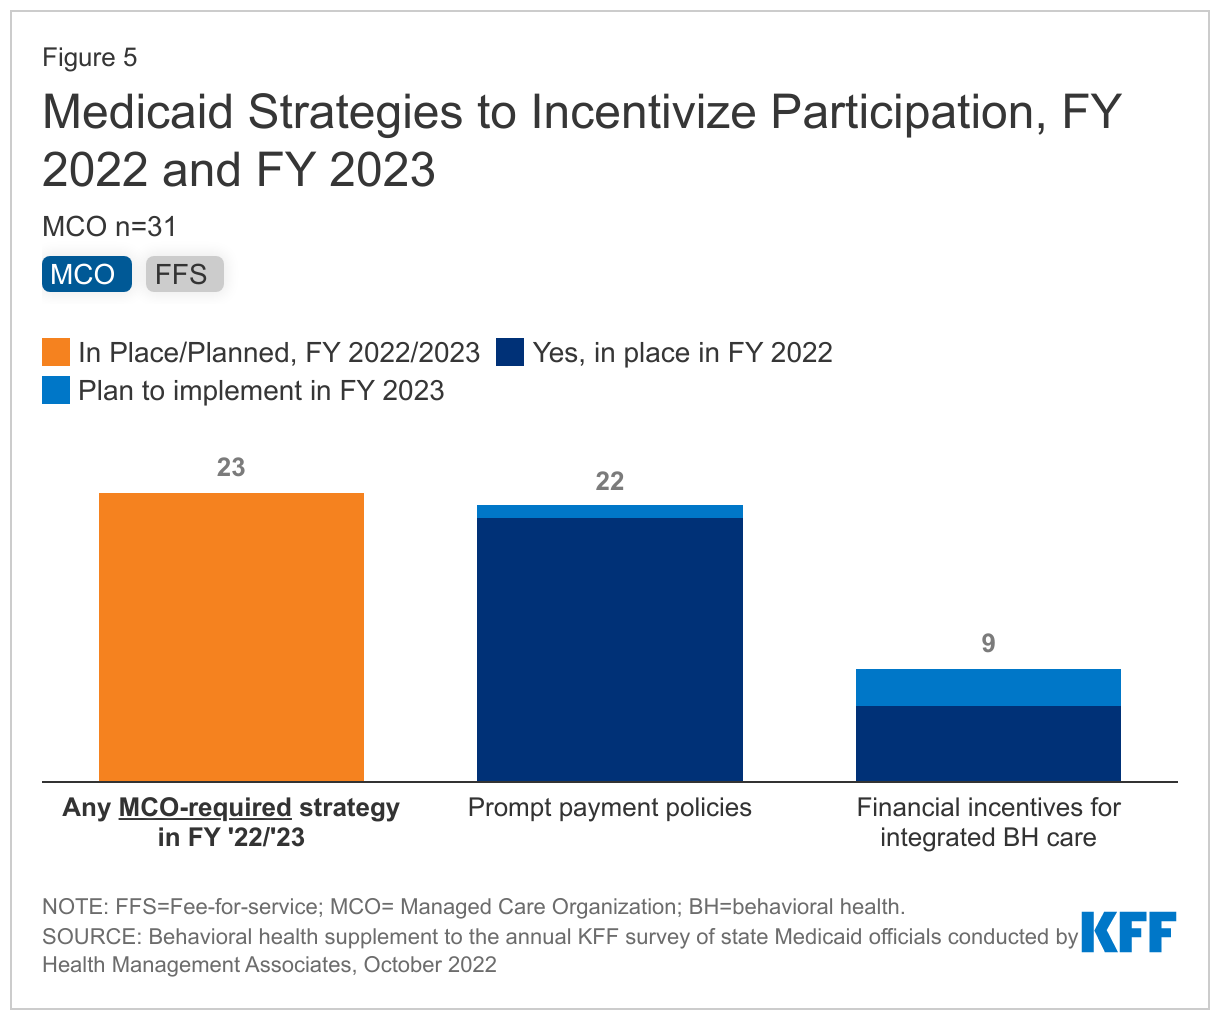
Delays in reimbursement have been shown to reduce provider participation in Medicaid, leading some Medicaid agencies to adopt prompt payment policies to incentivize provider participation (in addition to federal prompt pay requirements). In North Carolina, for instance, health plans must notify providers within 18 calendar days of any additional information needed to process a claim and they must pay for approved clean claims within 30 calendar days. Some states may choose to use financial incentives to encourage providers to participate in integrated physical and behavioral health systems, with some incentives aimed at increasing behavioral health screenings or developing the workforce. Financial incentives for integrated care may result in more facilities providing behavioral health care. Provider participation may also be encouraged through student loan repayment programs or other efforts to grow the workforce.

Most states reported prompt payment policies in place in FY 2022 or planned for FY 2023, but fewer reported financial incentives for integrated behavioral health care (Figure 5). As of FY 2022, about two-thirds of reporting states have prompt payment policies in place in FFS and/or MCOs. Fewer states reported providing financial incentives to providers to participate in physical and behavioral health integration, with less than one-fifth of responding states reporting doing so for FFS and/or MCOs in FY 2022.

Medicaid Strategies to Incentivize Participation, FY 2022 and FY 2023

Some states reported strategies to grow the workforce or to create new training opportunities, including efforts such as student loan repayment, outreach, and clinical supervision. For example:

  • Massachusetts is leveraging various funding streams to implement student loan repayment programs in exchange for four years of service in a community-based health care setting; increase family nurse practitioner residency slots; and support peer specialist training to increase the number of certified peers.
  • Washington launched a campaign to increase interest in behavioral health careers, as well as a pilot and training program to encourage behavioral health providers to increase internships in FY 2022.

Looking Ahead

State Medicaid program efforts to bolster the behavioral health workforce track with continued efforts at the federal level. In December 2022, Congress passed the Consolidated Appropriations Act, which authorized the funding for at least 100 new residency positions dedicated to psychiatry. Additionally, provisions in the Act will substantially increase the number of providers authorized to prescribe buprenorphine for the treatment of OUD by eliminating additional administrative requirements to prescribe buprenorphine to patients with OUD. The Act will also require additional training on treating and managing patients with OUD or SUD for all prescribers of controlled substances. Other relevant provisions include grants for mental health peer support providers and requirements to improve the accuracy and usability of Medicaid provider directories, which have been shown to be particularly inaccurate for mental health. A number of these provisions were included in bipartisan legislative drafts produced by the Senate Finance Committee.

This work was supported in part by Well Being Trust. KFF maintains full editorial control over all of its policy analysis, polling, and journalism activities.

This brief draws on work done under contract with Health Management Associates (HMA) consultants Angela Bergefurd, Gina Eckart, Kathleen Gifford, Roxanne Kennedy, Gina Lasky, and Lauren Niles.

Telehealth Delivery of Behavioral Health Care in Medicaid: Findings from a Survey of State Medicaid Programs

Author: Madeline Guth
Published: Jan 10, 2023

Telehealth can be an important component of facilitating access to care for Medicaid enrollees, particularly the nearly four in ten enrollees with behavioral health needs (mental health conditions and/or substance use disorder (SUD)). During the COVID-19 pandemic, states took advantage of broad authority to expand Medicaid telehealth policies, resulting in high telehealth utilization across populations. In particular, states report that telehealth has helped maintain and expand access to behavioral health care during the pandemic. Indeed, in state fiscal year (FY) 2022, behavioral health, especially mental health, remained a top service category with high telehealth utilization among Medicaid enrollees. Similarly, CMS data indicates that behavioral health services delivered via telehealth increased dramatically during the pandemic; this finding is consistent with other analysis of outpatient visits (including but not limited to Medicaid patients). However, CMS also notes that this increase was not enough to fully offset the decline in the rate of in-person utilization of mental health outpatient services.

Given ongoing provider workforce challenges that present barriers to enrollees’ access to behavioral health care, Medicaid telehealth policy may continue to serve as an important tool for extending the workforce and facilitating improved access to behavioral health care, even beyond the COVID-19 pandemic. The 2022 Bipartisan Safer Communities Act requires CMS to issue guidance on Medicaid and telehealth by the end of 2023. The Consolidated Appropriations Act passed in December 2022 authorized additional telehealth provisions, including requirements or funding related to provider directories, crisis services, and virtual peer mental health supports. In the future, Congress could pass additional legislation suggested in a Senate Finance Committee draft on mental health and telehealth.

Against this backdrop of state and federal policy activity, KFF surveyed state Medicaid officials about policies and trends related to telehealth delivery of behavioral health services. These questions were part of KFF’s Behavioral Health Survey of state Medicaid programs, fielded as a supplement to the 22nd annual budget survey of Medicaid officials conducted by KFF and Health Management Associates (HMA). A total of 44 states (including the District of Columbia) responded to the survey, but response rates varied by question. This issue brief utilizes this survey data to answer three key questions:

  • How have states expanded behavioral health telehealth policy in response to COVID-19?
  • What trends have states observed in behavioral health telehealth utilization?
  • What are key issues to watch looking ahead?

How have states expanded behavioral health telehealth policy in response to COVID-19?

States have broad authority to cover telehealth in Medicaid without federal approval. Prior to the pandemic, the use of telehealth in Medicaid was becoming more common; in particular, most states offered some coverage of behavioral health services delivered via telehealth, and the majority of telehealth utilization was for behavioral health services and prescriptions. However, Medicaid policies regarding allowable services, providers, and originating sites varied widely, and telehealth payment policies were unclear in many states. To increase health care access and limit risk of viral exposure during the pandemic, all 50 states and DC expanded coverage and/or access to telehealth services in Medicaid. We asked states to indicate specific behavioral health Medicaid policy actions taken to expand telehealth in response to COVID-19 and any implemented or planned changes to these policies.

Nearly all responding states took at least one specified Medicaid policy action to expand access to behavioral health care via telehealth (Figure 1). States most commonly reported adding audio-only coverage of behavioral health services, which can help facilitate access to care, especially in rural areas with broadband access challenges and for older populations who may struggle to use audiovisual technology. Also, nearly all states reported expanding behavioral health services allowed to be delivered via telehealth, such as to newly allow telehealth delivery of group therapy or medication-assisted treatment (MAT). Many states noted that virtually all behavioral health services were eligible for telehealth delivery during the pandemic. Finally, most states reported expanding the provider types that may be reimbursed for telehealth delivery of behavioral health services, such as to allow specialists with different licensure requirements (e.g. marriage and family therapists, addiction specialists, and peer specialists). A small number of states noted additional behavioral health Medicaid policy actions beyond those specified; for example, Washington reporting providing technology to enrollees and providers to improve access to behavioral health care during the pandemic.

Behavioral Health Medicaid Policy Actions Taken to Expand Telehealth in Response to COVID-19

As of July 2022, states were more likely to allow audio-only coverage of behavioral health services compared to other services. As reported on KFF’s 2022 Medicaid budget survey, nearly all states added or expanded audio-only telehealth coverage in Medicaid in response to the COVID-19 pandemic. As of July 1, 2022, a majority of states reported providing audio-only coverage (at least sometimes) across service categories, with mental health and SUD services the most frequently covered categories (Figure 2).

States Providing  Medicaid Coverage of Behavioral  Health Services Delivered via Audio-Only Telehealth, as of 7/1/2022

Many states reported permanently adopting some or all of these behavioral health Medicaid telehealth policy expansions. Consistent with responses to KFF’s 2022 Medicaid budget survey, many states reported permanent (i.e. non-emergency) adoption of telehealth policy expansions that were initially enacted during the pandemic on a temporary basis. In particular, states frequently noted that all or most expansions of behavioral health providers and/or services allowed for telehealth would be maintained after the public health emergency. However, some states also reported limiting or adding guardrails to pandemic-era behavioral health telehealth flexibilities. Most commonly, states reported that they would limit coverage of audio-only telehealth for behavioral health services, consistent with concerns about the quality of audio-only telehealth reported on the budget survey.

To better understand the impacts of behavioral health telehealth policy changes during the pandemic, we asked states to indicate whether they monitor behavioral health telehealth utilization in Medicaid and, if so, to report utilization trends by geography, demographics, and other factors.

Nearly all responding states monitored utilization of behavioral health services delivered via telehealth in FY 2022 or plan to begin doing so in FY 2023 (Figure 3). Telehealth utilization data can help states assess the impacts of expanded telehealth policy. These assessments may inform future quality and other analyses. Some states that already monitor behavioral health telehealth utilization reported future plans to increase this monitoring and/or to stratify utilization data by additional demographic or other factors.

State Monitoring of Behavioral Health Telehealth Utilization in Medicaid

Many states reported high utilization of telehealth for behavioral health care across all or most Medicaid populations, though some states noted utilization trends among certain subgroups of Medicaid enrollees, such as:

  • Geographic trends, with states most commonly reporting particularly high behavioral health telehealth utilization in rural areas compared to urban areas. Telehealth could be an important tool for facilitating access to behavioral health care for Medicaid enrollees in rural areas with fewer provider and hospital resources.
  • Demographic trends, which were most commonly captured by race/ethnicity and age. These trends generally mirror overall data indicating that behavioral health conditions are most prevalent among young adults and White people. In particular, some states reported that younger enrollees (including children and non-elderly adults) were most likely to utilize telehealth for behavioral health care. Several states reported higher telehealth utilization among White individuals compared to people of color. A small number of states reported that female enrollees were more likely to utilize telehealth compared to male enrollees.
  • Temporal trends, with states frequently reporting that behavioral health telehealth utilization has declined from its peak earlier in the pandemic, but remains high compared to the pre-pandemic period. Future policy changes, such as to further expand or to limit telehealth flexibilities, may impact ongoing utilization. For example, South Carolina reported anticipating an increase in behavioral health telehealth utilization among children in FY 2023 as part of an initiative to increase access for school-based mental health services.

The trends summarized above are generally consistent with overall Medicaid telehealth utilization trends reported on KFF’s 2022 budget survey. Additionally, several states reported that telehealth utilization was higher for mental health services compared to SUD services (this trend likely reflects the higher prevalence of mental health conditions compared to SUD conditions among Medicaid enrollees). A few states reported that demographic utilization trends varied by service or provider type. For example, New York indicated that female enrollees were more likely than male enrollees to receive psychological and psychiatric services via telehealth, but that male enrollees were more likely to receive SUD services via telehealth. Colorado reported that utilization trends by race/ethnicity were related to provider type, as community mental health centers are likelier to use telehealth and are also likelier to serve more racially/ethnically diverse populations.

What are key issues to watch looking ahead?

Key issues that may influence states’ future behavioral health Medicaid telehealth policy decisions include analysis of utilization and other data as well as federal guidance:

  • Data and quality: As states continue and expand their monitoring of behavioral health telehealth utilization, the results of these analyses may provide information that can inform policy decisions. Also, the Government Accountability Office (GAO) has recommended that CMS collect information to assess the impact of telehealth on quality of care for Medicaid enrollees, and most states report questions and/or concerns about the quality of services delivered via telehealth that may be addressed through ongoing data analysis.
  • Federal guidance and legislation: States also report watching for further guidance from the federal government related to Medicaid telehealth policies. The Bipartisan Safer Communities Act signed into law in June 2022 directs CMS to issue guidance to states on options and best practices for expanding access to telehealth in Medicaid, including strategies for evaluating the impact of telehealth on quality and outcomes. CMS must issue this guidance by the end of 2023. The Consolidated Appropriations Act passed in December 2022 authorized additional telehealth provisions, such as requirements for Medicaid provider directories to include information on telehealth coverage and for CMS to issue guidance on how states can use telehealth to deliver crisis response services. The Act also authorized grants for nonprofits to expand and improve virtual peer mental health support services, as well as other non-Medicaid telehealth provisions (such as telehealth policies for veterans and for Medicare enrollees). Several of these federal Medicaid telehealth policies passed in 2022 follow from a Senate Finance Committee discussion draft on ensuring access to telehealth, released by the Committee in May 2022 as part of a series of drafts associated with its mental health care initiative. Looking ahead, Congress could take up additional policies suggested in the draft, such as to require public awareness campaigns on the availability of behavioral health telehealth coverage.

As states emerge from the COVID-19 pandemic and grapple with behavioral health workforce shortages, the continuation of expanded telehealth policy—informed by data analysis and federal guidance—may be an important component of maintaining access to behavioral health care for enrollees.

This work was supported in part by Well Being Trust. KFF maintains full editorial control over all of its policy analysis, polling, and journalism activities.

This brief draws on work done under contract with Health Management Associates (HMA) consultants Angela Bergefurd, Gina Eckart, Kathleen Gifford, Roxanne Kennedy, Gina Lasky, and Lauren Niles.

KFF COVID-19 Vaccine Monitor Archives

Published: Jan 1, 2023

The KFF COVID-19 Vaccine Monitor was a research project tracking the public’s attitudes and experiences with COVID-19 vaccinations. Using a combination of surveys and qualitative research, this project tracks the dynamic nature of public opinion as vaccine development and distribution unfold, including vaccine confidence and hesitancy, trusted messengers and messages, as well as the public’s experiences with vaccination. This Vaccine Monitor dashboard features the most recent data across key issues from multiple reports.

This page lists all Vaccine Monitor reports released to date.

MAGA Republicans’ Relationship With COVID-19 Vaccines, released Dec. 14, 2023.

KFF COVID-19 Vaccine Monitor November 2023, released Nov. 17, 2023.

KFF COVID-19 Vaccine Monitor: September 2023, released Sept. 27, 2023.

KFF COVID-19 Vaccine Monitor: March 2023, released April 3, 2023.

KFF COVID-19 Vaccine Monitor: January 2023, released Feb. 7, 2023,

KFF COVID-19 Vaccine Monitor: December 2022, released Dec. 16, 2022.

KFF COVID-19 Vaccine Monitor: September 2022, released Sept. 30, 2022.

Concerns And Precautions Among Adults Who Report A Weakened Or Compromised Immune System, released Aug. 8, 2022.

KFF COVID-19 Vaccine Monitor: July 2022, released July 26, 2022.

KFF COVID-19 Vaccine Monitor: Pregnancy Misinformation, released May 27, 2022.

KFF COVID-19 Vaccine Monitor: April 2022, released May 4, 2022.

Views On The Pandemic At Two Years, released April 6, 2022.

Views on the U.S. Role In Global COVID-19 Response, released March 25, 2022.

The Pandemic’s Toll on Workers and Family Finances During the Omicron Surge, released March 10, 2022

KFF COVID-19 Vaccine Monitor: February 2022, released March 1, 2022

KFF COVID-19 Vaccine Monitor: January 2022 Parents And Kids Update, released February 1, 2022

KFF COVID-19 Vaccine Monitor: January 2022, released January 28, 2022

Differences in Vaccine Attitudes Between Rural, Suburban, and Urban Areas, released December 22, 2021

KFF COVID-19 Vaccine Monitor: Early Omicron Update, released December 21, 2021

KFF COVID-19 Vaccine Monitor: Winter 2021 Update On Parents’ Views Of Vaccines For Kids, released December 9, 2021

KFF COVID-19 Vaccine Monitor: November 2021, released December 2, 2021

The Increasing Importance of Partisanship in Predicting COVID-19 Vaccination Status, November 16, 2021

Media and Misinformation. released November 10, 2021

Views On The U.S. Role In Global Vaccine Distribution, released November 5, 2021

KFF COVID-19 Vaccine Monitor: October 2021, released October 28, 2021

Vaccination Trends Among Children And COVID-19 In Schools, released September 30, 2021

KFF COVID-19 Vaccine Monitor: September 2021, released September 28, 2021

The Impact Of The Coronavirus Pandemic On The Wellbeing Of Parents And Children, released August 19, 2021

KFF COVID-19 Vaccine Monitor: Parents and the Pandemic, released August 11, 2021

KFF COVID-19 Vaccine Monitor – July 2021, released August 4, 2021

KFF COVID-19 Vaccine Monitor: In Their Own Words, Six Months Later, released July 13, 2021

KFF COVID-19 Vaccine Monitor: June 2021, released June 30, 2021

Profile Of The Unvaccinated, released June 11, 2021

KFF COVID-19 Vaccine Monitor: May 2021, released May 28, 2021

How Employer Actions Could Facilitate Equity in COVID-19 Vaccinations, released May 17, 2021

COVID-19 Vaccine Access, Information, and Experiences Among Hispanic Adults in the U.S., released May 13, 2021

KFF COVID-19 Vaccine Monitor: April 2021, released May 6, 2021

Vaccine Attitudes Among Essential Workers, released April 23, 2021

What We’ve Learned, released April 18, 2021

Mental Health Impact of the COVID-19 Pandemic: An Update, released April 14, 2021

KFF COVID-19 Vaccine Monitor- Rural America, released April 9, 2021

KFF COVID-19 Vaccine Monitor: March 2021, released March 30, 2021

The Impact of the COVID-19 Pandemic on LGBT People, released March 11, 2021

Experiences With Vaccine Access And Information Needs, released March 9, 2021

Vaccine Confidence, Intentions and Trends released Feb. 26, 2021

Attitudes Towards COVID-19 Vaccination Among Black Women And Men released Feb. 19, 2021

What Do We Know About Those Who Want to “Wait and See”? released Feb. 12, 2021

In Their Own Words released Feb. 8, 2021

Where People are Getting Information About COVID-19 Vaccinations released Feb. 3, 2021

Trends in Vaccine Hesitancy released Jan. 27, 2021

Views of and Experiences with Vaccine Distribution released Jan. 22, 2021

Vaccine Hesitancy Among Hispanic Adults released Jan. 14, 2021

Vaccine Hesitancy in Rural America released Jan. 7, 2021

KFF COVID-19 Vaccine Monitor Initial Report released Dec. 15, 2020

Medicaid as a Potential New Third Rail of US Politics

Author: Larry Levitt
Published: Dec 22, 2022

In this JAMA Forum column, KFF’s Larry Levitt examines Medicaid’s growing political importance and the potential double whammy that could hit state Medicaid programs next year with the end of the COVID-19 public health emergency, which will mean reduced federal funding and substantial enrollment declines, and a possible simultaneous recession that could hurt state finances and leave more unemployed people relying on Medicaid coverage.

Changes in Community Health Center Patients and Services During the COVID-19 Pandemic

Authors: Jessica Sharac, Bradley Corallo, Jennifer Tolbert, Peter Shin, and Sara Rosenbaum
Published: Dec 21, 2022

Key Takeaways

Community health centers are a national network of safety-net primary care providers serving low-income and medically underserved communities, including communities of color and those in rural areas. Health centers also played a major role in national, state, and local responses to the coronavirus pandemic, particularly in hard-to-reach communities, and helped to meet growing demand for mental health and substance use disorder (SUD) services. Annual data reported by community health centers sheds light on how these safety-net providers and their patient populations have been impacted by the pandemic. Key findings from data reported for 2021 include:

  • After dropping in 2020, the number of health center patients and visits rebounded in 2021. Health centers served more than 30 million patients in 2021, which was the largest number of patients ever recorded in a calendar year. As patients returned to in-person care in 2021, the increase in visits was supported by increased telehealth use compared to 2019—telehealth visits represented 21% of visits (26 million) in 2021 – compared to less than 1% of total visits in 2019.
  • Medical, mental health, and SUD services exceeded pre-pandemic levels in 2021, while other services that were more difficult to provide virtually – such as dental and vision – were still below pre-pandemic utilization. Growth was particularly notable for mental health visits, which rose by 19% from 2019 to 2021.1  The increase in mental health and SUD services also followed a nationwide increase in demand for these services.
  • The number of children served by health centers remained below pre-pandemic levels. From 2019 to 2021, the number of child patients decreased by 6% and the number of patients served at school-based health centers declined by 13%. Other research has shown decreased utilization among children during the pandemic, most commonly due to concerns about visiting a healthcare provider, limited appointment availability, and closed clinic locations. Overall, however, increases in nonelderly adult and senior health center patients more than offset the decline in child patients.
  • Fewer health center patients were uninsured in 2021 compared to before the pandemic, reflecting national trends. The number of uninsured patients at health centers declined by 10% from 2019 to 2021.

As the nation looks beyond the pandemic, health centers and their patients face several uncertainties. Temporary policies put in place during pandemic that allowed greater telehealth access and ensured continuous enrollment in Medicaid as well as pandemic-related funding to providers are set to expire. At the same time, demand for health center services, particularly for mental health and SUD services, continues to increase. How health centers respond to these concurrent challenges will affect the ability of the nation’s primary care safety net to meet the needs of underserved communities.

Introduction

Community health centers are a national network of safety-net primary care providers serving low-income and medically underserved communities. Health centers served more than 30 million patients in 2021, including one-third of all people living in poverty in the U.S. and one in five rural residents. In addition to providing comprehensive primary care services, health centers have played a major role in national, state, and local responses to the coronavirus pandemic by offering a range of services designed to slow the spread and lessen the severity of COVID-19, especially in hard-to-reach, underserved communities. For example, health centers have administered over 22 million COVID-19 vaccinations2  as of December 2022, with 69% going to people of color.

Annual data reported by community health centers sheds light on how these safety-net providers and their patient populations have been impacted by the pandemic. Like other outpatient providers, health centers saw a dip in the number of patients and visits from 2019 to 2020. Given that health centers predominantly serve vulnerable and underserved populations, their experiences can provide valuable insights on how the pandemic has impacted these populations and how the nation’s primary care safety net is adapting to those needs.

This brief analyzes the changes in health center patients and services from 2019 (pre-pandemic) through 2021 using data from the Uniform Data System (UDS), to which all health centers are required to report annually. We also draw from previous national surveys of health centers to identify potential pitfalls for health centers as they begin recovering from the pandemic and going forward.

How have health center patients and services shifted during the pandemic?

Compared to before the pandemic, the number of health center patients and visits dipped in 2020 and began rebounding in 2021, with the increase in visits supported by increased telehealth use. Health centers served more than 30 million patients in 2021, which was the largest number of patients ever recorded in a calendar year and represented a 1.2% increase from 2019 (before the pandemic). Similarly, the number of health center visits reached a record 124 million in 2021 (Figure 1). Even as patients returned to in-person care, reliance on telehealth visits continued in 2021. Telehealth visits represented 21% of visits (26 million) in 2021 compared to less than 1% of total visits in 2019. While in-person visits increased relative to 2020, they remained below their pre-pandemic levels.

Telehealth and In-Person Visits to Health Centers, 2019-2021

Medical and mental health services exceeded pre-pandemic levels in 2021, while other services that were more difficult to provide virtually – such as dental and vision – were still below pre-pandemic utilization. Some services, including medical, mental health, substance use disorder (SUD), and social supportive services, successfully shifted to telehealth to varying degrees, which more than offset the drops for in-person visits from 2019 to 2021 (Figure 2). Services that were largely provided in person, namely dental and vision, were still below the pre-pandemic baseline for visits in 2021 by 20% and 9%, respectively.

Telehealth and In-Person Visits for Selected Services to Health Centers, 2019-2021

Health centers experienced increased demand for mental health and SUD services during the pandemic, mirroring national trends. Overall, the number of visits for mental health issues rose by 19% and visits for SUD services rose by 1% from 2019 to 2021.3  There was a particularly notable increase in the number of patients experiencing anxiety disorders; in 2021, three million patients, or 10% of all health center patients, had an anxiety disorder diagnosis, an increase of 17% from 2019.  The number of patients receiving medication-assisted treatment (MAT) for opioid use disorder also increased substantially; in 2021, over 180,000 patients received MAT representing an increase 29% from pre-pandemic levels. In addition to growing demand during the pandemic, these increases also reflect growth in health centers’ capacity to provide mental health and SUD services. For example, a survey of health centers in late 2021 found that roughly two-thirds (64%) of health centers added a new mental health or SUD service, including services that health centers newly provided via telehealth.

Percent Change in the Number of Health Center Patients with Selected Diagnoses or Receiving MAT for Opioid Use Disorder, 2019-2021

At the same time, the number of children served by health centers remained below pre-pandemic levels. From 2019 to 2021, the number of child patients decreased by 6% (Figure 4) and the number of patients served at school-based health centers declined by 13%. This trend is consistent with recent research showing decreased health care utilization among children, most commonly due to concerns about visiting a healthcare provider, limited appointment availability, and closed clinic locations during the pandemic. Related to the drop in child patients, children accessed fewer preventive services at health centers in 2021 compared to 2019: the number of patients receiving selected immunizations4  dropped by 19%, the number receiving childhood lead screenings declined by 13%, and the number receiving a well child visit fell 5%. These findings are consistent with national data showing declines in lead screenings, child screenings, and vaccinations for Medicaid and Children’s Health Insurance Program (CHIP) enrollees during the pandemic. While the number of children served by health centers declined, the number of patients ages 65 and older increased by 425,000 or 15% and the number of non-elderly adults grew by 501,000 or 3% from 2019 to 2021.

Health Center Patients by Age Group, 2019-2021

Reflecting national trends, fewer health center patients were uninsured in 2021 compared to before the pandemic. The number of uninsured patients at health centers declined by 10% from 2019 to 2021 (Figure 5), consistent with national patterns. The drop in the national uninsured rate is largely attributable to temporary policies in place during the COVID-19 public health emergency to ensure continuous enrollment in Medicaid during the pandemic. As a result of the continuous enrollment policy, the number of Medicaid patients served by heath centers increased by 2% from 2019 to 2021, and Medicaid/CHIP remained the largest source of coverage for Health center patients. In 2021, nearly half (49%) of patients were covered by Medicaid/CHIP and 20% were uninsured.

Health Coverage Among Health Center Patients, 2019-2021

Pandemic-related funding made up 7% of all health centers’ revenue in 2021, although Medicaid was the largest source of revenue (41%). In total, health centers received $2.8 billion in pandemic-related funding in 2021. This funding enabled health centers to respond to shifting patient needs, such as the growing need for telehealth and mental health services, and to continue building out pandemic-related services, such as vaccination drives and COVID-19 testing and treatments; however, these funding sources were temporary and have all since expired or will soon expire. For example, HRSA has distributed nearly all of the $7.6 billion provided to health centers in the American Rescue Plan Act (ARPA) in 2021 – the largest source of pandemic-related funding for health centers – with the remaining funds available to health centers through March 2023.5  While the temporary funding has been important to health centers during the pandemic, Medicaid, along with federal Section 330 grant funding, remains their primary source of funding.

Health Center Revenues by Payer Source, 2021

What to Watch

Changes in who sought care at health centers, how they accessed care, and the services that they received in 2021 could represent longer-term shifts with implications for health center finances and operations. The number of children served by health centers declined and, while the number of nonelderly adult and senior patients increased to fill in the gap, the health care needs of these patient populations differ. At the same time, demand for health center services, particularly for mental health and SUD services, continued to increase. Additionally, changes that accelerated the use of telehealth during the pandemic could also reflect a more permanent shift in how health center patients access services. Although telehealth has become an important mechanism for delivering certain health center services, it is unclear whether the reliance on telehealth will continue in the absence of pandemic-era flexibilities that made it easier for health centers and other providers to offer telehealth services. Given that nearly half of health center patients are covered by Medicaid, state Medicaid agencies’ decisions about whether or how to phase out these policies will have an especially large impact on health centers and their patients.

The end of the Medicaid continuous enrollment requirement and pandemic-related funding for providers could also have major implications for health centers and their patients. In the months following the end of the continuous enrollment requirement, millions of people could lose Medicaid coverage. These Medicaid coverage losses could reverse the recent decline in the number of uninsured health center patients. Moreover, because Medicaid accounts for 41% of total health center revenue, any significant loss of Medicaid coverage among health center patients could substantially reduce overall health center revenue. These changes will coincide with the end of pandemic funding streams and could pose challenges for health centers, especially those lacking strong financial footing. How health centers respond to these concurrent challenges will affect the ability of the nation’s primary care safety net to continue to meet the needs of underserved communities.

Funding support for this brief was provided to the George Washington University by the RCHN Community Health Foundation. KFF maintains full editorial control over all of its policy analysis, polling, and journalism activities.

  1. For this analysis, we use the Selected Service Detail Addendum tables in UDS to define integrated mental health and SUD visits. Using this definition, mental health visits include those provided by mental health providers as well as mental health services provided by medical providers. Visits in the latter group are reported as both medical visits in Table 5 of UDS and mental health visits in the UDS’s Selected Service Detail Addendum tables. Similarly, SUD visits include visits provided by SUD providers and SUD services provided by either mental health or medical providers. Visits in the latter group are counted as either medical or mental health visits in Table 5 of UDS as well as SUD visits in the Selected Service Detail Addendum tables. ↩︎
  2. Health centers report the number of vaccinations received by health center patients in the HRSA Health Center COVID-19 Survey. The survey’s questionnaire asks health centers to report the total number of patients receiving a vaccine, and HRSA has clarified that this count includes health center patients receiving vaccinations anywhere, including in settings other than the health center. However, we expect that health centers delivered the vast majority of vaccinations reported in the survey, and the number of patients reported through the survey receiving their vaccinations elsewhere is likely minimal. ↩︎
  3. For this analysis, we use the Selected Service Detail Addendum tables in UDS to define integrated mental health and SUD visits. Using this definition, mental health visits include those provided by mental health providers as well as mental health services provided by medical providers. Visits in the latter group are reported as both medical visits in Table 5 of UDS and mental health visits in the UDS’s Selected Service Detail Addendum tables. Similarly, SUD visits include visits provided by SUD providers and SUD services provided by either mental health or medical providers. Visits in the latter group are counted as either medical or mental health visits in Table 5 of UDS as well as SUD visits in the Selected Service Detail Addendum tables. ↩︎
  4. The UDS data on selected immunizations aggregates several immunizations for patients of all ages, though most are provided to children. These immunizations are taken from Table 6A Line 24 of UDS: Selected immunizations: hepatitis A; haemophilus influenzae B (HiB); pneumococcal, diphtheria, tetanus, pertussis (DTaP) (DTP) (DT); measles, mumps, rubella (MMR); poliovirus; varicella; hepatitis B ↩︎
  5. Based on email exchange with staff from the Bureau of Primary Health Care, HRSA, DHHS (September 30, 2022). ↩︎
News Release

Continuous Eligibility Policies Can Reduce the Number of Children Who Lose Medicaid Despite Still Being Eligible for Coverage

Published: Dec 21, 2022

A new KFF analysis finds disenrollment rates were lower in the 12 months leading up to annual renewals for children in states with 12-month continuous eligibility compared with states without the policy. Congress is expected to pass an omnibus spending bill by the end of the year that would require 12-month continuous eligibility for children in all states.

The analysis also finds that in states with 12-month continuous eligibility, a smaller share of children disenrolled from Medicaid and then re-enrolled within the year – a phenomenon known as “churn.” Churn often indicates children are losing coverage due to administrative burdens even if they remain eligible for coverage.

In the study, KFF analysts used Medicaid claims data to measure enrollment outcomes among a cohort of children newly enrolled in Medicaid in July 2017 in states with and without 12-month continuous eligibility.

By month 12 (before annual renewals), the share of children who “churned” was 2.9% in states with 12-month continuous eligibility policies and 5.3% in states without continuous eligibility.

The analysis also shows that following annual renewals, the cumulative disenrollment rate more than doubled, some of which is to be expected with family income changes. However, churn also increased – from 4.0% in month 12 to 10.5% in month 15, signaling many eligible children are losing coverage at their annual renewal. Churn and disenrollment rates increased sharply in states with and without 12-month continuous eligibility following annual renewal, though increases were larger in states without 12-month continuous eligibility.

While churn rates increased among all racial/ethnic groups following annual renewal, the increase was largest for Hispanic children, growing from 5.2% in month 12 to 12.5% in month 15.

These finding have implications for the end of the federal continuous enrollment requirement, when all states will be required to conduct renewals for all individuals on Medicaid. Millions of people, including children, could lose coverage if they are no longer eligible or face administrative barriers during the process despite remaining eligible. The omnibus spending bill would end the continuous enrollment requirement as of March 31, 2023 and phase out the enhanced match rate through the end of 2023.

About 37.8 million children were enrolled in Medicaid as of August 2022, with about half of those children in states with 12-month continuously eligibility and about half in states without the policy. Expanding 12-month continuous eligibility to all states likely would reduce the number of children who are uninsured but would come at a price of higher federal and state Medicaid spending.

The findings also suggest that multi-year continuous eligibility policies could help children maintain coverage beyond one year. To extend continuous eligibility for children for multiple years or for adults for 12 months or longer, states must use the Section 1115 waiver process and obtain approval from the Centers for Medicare and Medicaid Services (CMS).

Oregon was the first state to get CMS approval for such a waiver. It will provide continuous eligibility for children in Medicaid from birth until age six as well as two years of continuous eligibility for all enrollees ages six and older. Other states, including California, New Mexico, and Washington state, have proposals in development or pending approval from CMS.

Implications of Continuous Eligibility Policies for Children’s Medicaid Enrollment Churn

Published: Dec 21, 2022

Summary and Key Takeaways

Provisions in an omnibus spending bill currently under consideration in Congress would require all states to adopt continuous eligibility for children in both Medicaid and the Children’s Health Insurance Program (CHIP) and would decouple the Medicaid continuous enrollment requirement from the public health emergency (PHE). States currently have the option to provide 12 months of continuous coverage for children in Medicaid and/or separate CHIP, and about half of states do so for all children in Medicaid. Although states may only renew coverage for children once per year, children may lose coverage before the renewal period on account of changes in circumstances or administrative procedures such as data checks. Current continuous eligibility policies for children in Medicaid allow a child to remain enrolled for a specific period of time unless the child ages out of coverage, moves out of state, voluntarily withdraws, or, in some cases, does not make premium payments. KFF analysis of the Centers for Medicare and Medicaid Services (CMS) Performance Indicator Project Data finds 37.8 million children were enrolled in Medicaid (including Medicaid expansion CHIP) as of August 2022, with about half of those children in states with 12-month continuous eligibility and about half in states without the policy.

This analysis uses Medicaid claims data to follow a cohort of children newly enrolled in Medicaid in July 2017 in states with and without 12-month continuous eligibility to examine how children’s enrollment in Medicaid changes over time and understand the effect of continuous eligibility policies. Key findings include the following:

  • The disenrollment rate was lower for children in states with 12-month continuous eligibility policies in the period before annual renewals. The percentage of children who disenrolled and then re-enrolled within the year (or “churned” in and out of Medicaid) was also lower in states with 12-month continuous eligibility (2.9%) compared to states without the policy (5.3%).
  • Following annual renewals, the cumulative disenrollment more than doubled – some of which is to be expected, with family income changes – but cumulative churn also more than doubled from 4.0% in month 12 to 10.5% in month 15, signaling many eligible children are losing coverage at their annual renewal. Churn and disenrollment rates increased sharply in states with and without 12-month continuous eligibility following annual renewal, though increases were larger in states without 12-month continuous eligibility.
  • While churn rates increased among all racial/ethnic groups following annual renewal, the increase was largest for Hispanic children, growing from 5.2% in month 12 to 12.5% in month 15.

Our findings indicate that 12-month continuous eligibility policies are effective tools to reduce Medicaid disenrollment and churn rates within the year. However, some children may still lose coverage at annual renewal regardless of state adoption of 12-month continuous eligibility, and multi-year continuous eligibility policies could help children maintain coverage beyond one year and keep children from losing coverage during the renewal process. These findings are particularly relevant to the current policy landscape with provisions in the omnibus spending bill. In addition, following approval in Oregon, other states are seeking waivers to provide Medicaid continuous eligibility for multiple years, especially for young children. Lastly, all states will be required to conduct renewals for all individuals on Medicaid when the Medicaid continuous enrollment requirement ends, and an estimated 5.3 million children could lose Medicaid/CHIP coverage during the unwinding period.

What is continuous eligibility?

Under current law states are required to renew coverage for most children in Medicaid and CHIP no more than once every 12 months, but children may lose coverage before the renewal period under certain circumstances. Even with an annual renewal process, states can redetermine eligibility due to a change in circumstance (such as an increase in family income) at any point during the year, and some states conduct data matches on a periodic basis to identify changes in circumstances between annual renewal periods. Children may be disenrolled at annual renewal for a variety of reasons, including because they are no longer eligible for the program or they experience barriers navigating the redetermination process despite remaining eligible. Children can also voluntarily withdraw at any point (often when they have another source of coverage).

Under current law, states have the option to provide 12-months of continuous coverage for children in Medicaid and/or separate CHIP. Continuous eligibility policies for children in Medicaid allow a child to remain enrolled for a specific period of time even if there are fluctuations in income. Continuous eligibility would not apply if a child ages out of coverage, moves out of state, voluntarily withdraws, or, in some cases, does not make premium payments, and children in states with 12-month continuous eligibility are still subjected to annual renewals. As of January 2022, 24 states provided 12-month continuous eligibility for all children in Medicaid, and KFF analysis of CMS Performance Indicator Project Data finds, among all children in Medicaid (including Medicaid expansion CHIP) as of August 2022, 19.3 million (or 51% of) children were in states with 12-month continuously eligibility and 18.5 million (or 49% of) children were in states without the policy.1 

The Families First Coronavirus Response Act (FFCRA) requires states to provide continuous Medicaid enrollment in exchange for enhanced federal matching funds during the pandemic. Under FFCRA, the continuous enrollment requirement is in effect through the end of the month in which the PHE ends. During this time, states have not been able to disenroll people from Medicaid; however, when the continuous enrollment requirement ends, all Medicaid enrollees will undergo the renewal process, and millions of people, including children, could lose coverage if they are no longer eligible or face administrative barriers during the process despite remaining eligible. The current PHE is in effect until January 11, 2023, and the Biden administration has said it will give states a 60-day notice before ending the PHE. Since that notice was not issued in November 2022, it is expected the PHE will be extended again.

Provisions in an omnibus spending bill currently under consideration in Congress would require all states to adopt continuous eligibility for children in both Medicaid and CHIP and would decouple the Medicaid continuous enrollment requirement from the PHE. Under this legislation, all states would be required to implement 12-months continuous eligibility for children beginning on January 1, 2024. In addition, the bill would terminate the Medicaid continuous enrollment requirement on March 31, 2023, and permit states to resume disenrollments beginning in April 2023. Enhanced federal funding would continue to be available to states that comply with requirements for redeterminations during the transition period, though the enhanced funding would phase down through December 2023.

Continuous eligibility policies have been shown to lower rates of churn. Churn occurs when individuals temporarily lose Medicaid coverage and disenroll and then re-enroll within a short period of time. Churn in Medicaid suggests that some children are disenrolled due to short-term changes in income or circumstances that made them temporarily ineligible or are disenrolled for procedural reasons because they were unable to complete the redetermination process. When individuals churn on and off coverage, they experience gaps in coverage that could limit access to care and lead to delays in getting needed care. Gaps in coverage can be especially problematic for young children who are recommended to receive frequent screenings and check-ups.

Oregon was the first state to receive waiver approval to implement continuous coverage for children beyond 12-months. To extend continuous eligibility for children for multiple years or for adults for 12 months or longer, states must use the Section 1115 waiver process. Oregon received approval of a Section 1115 waiver application in September 2022 to provide continuous eligibility for children in Medicaid from birth until age six as well as two years of continuous eligibility for all enrollees age six and older. Other states have proposals in development or pending CMS approval.

What is the effect of 12-month continuous eligibility?

Disenrollment rates were lower for children in states with 12-month continuous eligibility policies. In the months leading up to annual renewal, the percentage of children who were disenrolled was lower in states with 12-month continuous eligibility compared to states without. By month 12, the cumulative disenrollment rate was 9.9% in states with 12-month continuous eligibility compared to 14.0% in states without the policy (Figure 1). The percentage of children who disenrolled and then re-enrolled in Medicaid within a short time period (or “churned” in and out of Medicaid) was also lower in states with 12-month continuous eligibility policies. Among all children, in states with continuous eligibility, 2.9% churned compared with 5.3% in states without continuous eligibility (Figure 3). There may be other policy differences between states with and without continuous eligibility that also contribute to the variation in disenrollment and churns rates, but these are outside the scope of this analysis.

Cumulative Percent of Children Disenrolled from Medicaid in Each Month Following Initial Enrollment in States With and Without 12-Month Continuous Eligibility (CE) for Children

What happens to disenrollment and churn after 12-month renewals?

Among all states, the disenrollment rate more than doubled following annual renewal. The cumulative disenrollment rate increased from 11.8% in month 12 (prior to completion of the annual redetermination) to 29.2% in month 15 (after the annual redetermination was completed), a 17.4 percentage point increase (Figure 2). Children can be disenrolled at annual renewal for a number of reasons, including because they are no longer eligible for the program or they experience barriers navigating the redetermination process despite remaining eligible. While disenrollment rates increased in both states with and without 12-month continuous eligibility after month 12, disenrollment rates remained lower in states with 12-month continuous eligibility. This could be due to another period of 12-month continuous eligibility beginning as well as other differences in enrollment practices between states with and without continuous eligibility.

Cumulative Percent of Children Disenrolled from Medicaid in Each Month Following Initial Enrollment

The churn rate also more than doubled following annual renewal, suggesting many children may be disenrolled due to administrative barriers at their annual renewal. The cumulative churn rate increased from 4.0% in month 12 to 10.5% in month 15 (Figure 3). Churn rates sharply increased after month 12 for states with 12-month continuous eligibility and states without; however, the increase was smaller for states with 12-month continuous eligibility (5.2 percentage points) compared to those without (7.9 percentage points). High rates of churn indicate that children are losing coverage for procedural reasons or because of temporary fluctuations in income.

Cumulative Churn Rates Before and After Annual Renewal in States With and Without Continuous Eligibility for Children

While churn rates increased among all racial/ethnic groups following annual renewal, the increase was largest for Hispanic children. This suggests Hispanic children may be more likely to experience income volatility or be disenrolled for procedural reasons at annual renewal compared to children of other races (Figure 4). Even before annual renewals at month 12, Hispanic children had slightly higher cumulative churn (5.2%) compared to other groups, but the gap widened following annual renewal.

Cumulative Churn Rates Before and After Annual Renewal, by Race/Ethnicity

Excluding infants, churn rates were similar across age groups before renewal at month 12, and all age groups experienced a similar increase in churn following annual renewal. Infants had the lowest cumulative churn rate at month 12 (2.2%), but experienced a sharp increase following annual renewal, reaching 9.8% by month 15, which is similar to the cumulative churn rates for the other age groups (Figure 4).

Looking Ahead

12-month continuous eligibility policies are effective tools to reduce Medicaid disenrollment and churn rates within the year. This analysis confirms what other analyses have found and demonstrates state adoption of 12-month continuous eligibility can decrease churn within the year, reducing the impact of income volatility on families and limiting the share of eligible children disenrolled due to procedural issues. National churn rates could be reduced further if legislation currently being considered in Congress passes (as it is expected to) and the policy is required for all states. While this analysis cannot determine whether children no longer enrolled in Medicaid had another source of insurance coverage, it is likely that 12-month continuous eligibility would reduce the number of children who are uninsured. That would come with higher federal and state Medicaid spending.

Multi-year continuous eligibility policies could help children maintain coverage beyond one year and keep children from losing coverage during the renewal process. This analysis finds churn increases during annual renewal periods, indicating children may be losing coverage at that point for procedural reasons regardless of state 12-month continuous eligibility policy status. Recently, some states have taken action to extend continuous eligibility for children in Medicaid for multiple years. While Oregon was the first state to submit and receive approval to extend continuous eligibility for children in Medicaid from birth until age six, Washington has also submitted a waiver renewal application, which is still pending CMS approval. In addition, New Mexico recently closed their public comment period on a similar waiver renewal application, and California is expected to follow.

A multi-year continuous eligibility policy could also be a tool to reduce disparities in churn rates and promote health equity. This analysis found Hispanic children experienced the largest increase in churn following annual renewals. A multi-year continuous eligibility policy, like the one included in Oregon’s recent waiver approval, would keep children from birth to age six continuously enrolled and reduce the number of children disenrolled for procedural reasons or temporary income fluctuations at annual renewal. States are especially targeting infancy and early childhood for continuous eligibility policies because the first years of life are an important developmental period for children when they are recommended to receive frequent screenings and check-ups.

Our findings indicate disenrollment and churn rates for children increase substantially following annual renewal, which could have implications for the end of the PHE. A report from the Assistant Secretary for Planning and Evaluation (ASPE) estimated 5.3 million children would lose Medicaid/CHIP coverage when the PHE ends; of those expected to lose coverage, an estimated 72% are likely still eligible for Medicaid/CHIP. Further, some groups may be more at risk of losing coverage at the end of the PHE. Our findings indicate Hispanic children may be more likely to lose coverage at renewal for procedural reasons, and a previous KFF analysis found individuals with limited English proficiency were more likely to experience administrative barriers when completing Medicaid renewal processes. Efforts to conduct outreach and provide enrollment assistance can help ensure that those who remain eligible for Medicaid are able to retain coverage and those who are no longer eligible can transition to other sources of coverage.

Methods

Data Source & State Exclusion Criteria

KFF used the Transformed Medicaid Statistical Information System (T-MSIS) 2017-2019 Demographic Eligibility Base File and Dates Files (Release 1). We used BENE_ID to link files when available and, when BENE_ID was missing, we used MSIS_ID to link files (see the TMSIS User Guide for information on linking variables). We used the longitudinal files to track enrollment outcomes among children from July 2017 through December 2019.

We use 44 states in our main analysis and 30 states for analyses using race/ethnicity. We excluded states due to missing or inconsistent data based on state-level information available from the DQ Atlas (Appendix Table 1).

State

Enrollee Sample Selection

Our sample is comprised of a cohort of children who “newly enrolled” in Medicaid or Medicaid Expansion Children’s Health Programs (MCHIP) in July 2017 with full benefits for that month. We defined newly enrolled as those who were not enrolled in Medicaid for the four months prior to July 2017 and were continuously enrolled for the first four months, through October 31, 2017. The four-month minimum enrollment period excludes children who were enrolled under presumptive eligibility provisions, but never completed an application or were determined to be ineligible. We excluded children enrolled in separate CHIP programs (SCHIP) because some states provide continuous eligibility for Medicaid but not for SCHIP. We excluded children born before January 1, 2001 because they would have turned 19 during the study period and children’s continuous eligibility provisions generally extend through age 18. We also excluded children eligible through a medically needy pathway in July 2017 because continuous eligibility provisions generally would not apply to this group. Finally, we excluded children who died during the study period. Our final sample includes 419,888 Medicaid enrollees in our main analysis (of 44 states) and 267,382 enrollees in our race/ethnicity analysis (30 states).

Calculating Enrollment, Disenrollment, and Churn

To calculate enrollment patterns, we used the DE Dates file’s start and end dates on enrollment spans. Short enrollment gaps of 28 days or less can represent data reporting errors, so we merged the spans on either side of the gap into a single, continuous enrollment span. Nearly all enrollment spans in the TMSIS data begin on the first day of the month and end on the last day of the month, but there are some rare cases in which disenrollments fall in between the first and last day of the month. For people in those situations, we considered them enrolled for the month if they had at least 15 days of coverage. We calculated disenrollment rates as the percentage of children from the initial cohort who had disenrolled in a given month. We defined churn as people who disenrolled and re-enrolled within 365 days. The renewal process varies by state and can take up to 60 days to process; this analysis compares churn rates at month 12 (prior to completion of the annual redetermination) to month 15 (after the annual redetermination was completed) to capture the effect of annual renewals. When calculating disenrollment and churn, we did not account for changes in eligibility group or benefit levels (i.e., from full benefits to restricted benefits) during the study period.

  1. The Centers for Medicare and Medicaid Services (CMS) Performance Indicator Project Data reports total child enrollment in Medicaid and CHIP (Note: Arizona does not report children or adults separately and is not included in totals). To estimate Medicaid (including Medicaid expansion CHIP) enrollment only, we estimate the share of children in S-CHIP alone in each state using the CY 2019 Transformed Medicaid Statistical Information System (T-MSIS) Analytic Files (TAF) Research Identifiable Files (RIF). We calculate and subtract the number of children in S-CHIP from the PI data total child enrollment in August 2022. Then, we sum the Medicaid enrollment for all states with 12-month continuous eligibility in Medicaid and states without the policy. ↩︎

Global Health Funding in the FY 2023 Omnibus

Published: Dec 20, 2022

Updated on January 3, 2023

The FY 2023 Omnibus appropriations bill and accompanying reports, released by Congress on December 20, 2022, and signed by the President on December 29, 2022, includes funding for U.S. global health programs at the State Department, U.S. Agency for International Development (USAID), Centers for Disease Control and Prevention (CDC), and National Institutes of Health (NIH).[i] Funding provided to the State Department and USAID through the Global Health Programs (GHP) account, which represents the bulk of global health assistance, totals $10.6 billion, an increase of $731 million above the FY 2022 enacted level and $15 million below the FY 2023 request. The bill provides higher levels of funding for almost all program areas compared to the FY 2022 enacted level, with the Global Fund to Fight AIDS, Tuberculosis and Malaria (Global Fund) and global health security receiving the largest increases; funding for bilateral HIV and family planning and reproductive health (FPRH) remained flat. Funding for global health provided to the CDC totals $693 million, an increase of $46 million compared to the FY22 enacted level, but $55 million below the FY23 request. Funding for the Fogarty International Center (FIC) at the NIH totaled $95 million, $8 million above the FY22 enacted level and essentially flat compared to the FY23 request. See the table below for additional detail on global health funding in the FY 2023 omnibus (downloadable table here). See the KFF budget tracker for details on historical annual appropriations, including Senate and House amounts, for global health programs.

Table

KFF Analysis of Global Health Funding in the FY23 Omnibus

Department /
Agency / Area
FY22Finali
(millions)
FY23 Request (millions)FY23 Omnibusi (millions)Difference: FY23 Omnibus – FY22 FinalDifference: FY23 Omnibus – FY23 Request
State, Foreign Operations, and Related Programs (SFOPs) — Global Health
HIV/AIDSii –$4,700.0 – – –
State Department$4,390.0$4,370.0$4,395.0$5
(0.1%)
$25
(0.6%)
USAID$330.0$330.0$330.0$0
(0%)
$0
(0%)
of which Microbicides$45.0$45.0$45.0$0(0%)$0(0%)
ESF AccountNot specified$0.5Not specified – –
Global Fund$1,560.0$2,000.0$2,000.0$440
(28.2%)
$0
(0%)
Tuberculosisii$352.0 – 
Global Health Programs (GHP) account$371.1$350.0$394.5$23.5
(6.3%)
$44.5
(12.7%)
Economic Support Fund (ESF) accountNot specified$2.0Not specified –
Malaria$775.0$780.0$795.0$20
(2.6%)
$15
(1.9%)
Maternal & Child Health (MCH)ii$1,044.0 – –
GHP account$890.0$879.5$910.0$20
(2.2%)
$30.5
(3.5%)
of which Gavi$290.0$290.0$290.0$0
(0%)
$0
(0%)
of which Polio$75.0Not specified$85.0$10
(13.3%)
 –
UNICEFiii$139.0$135.5$142.0$3
(2.2%)
$6.5
(4.8%)
ESF accountNot specified$29.0Not specified –
of which PolioNot specified$0.0Not specified –
Nutritionii$161.0 – – –
GHP account$155.0$150.0$160.0$5
( 3.2%)
$10
(6.7%)
ESF accountNot specified$10.3Not specified
AEECA accountNot specified$0.8Not specified
Family Planning & Reproductive Health (FP/RH)iv$607.5$653.0$607.5$0
(0%)
$-45.5
(-7%)
Bilateral FP/RHiv$575.0$597.0$575.0$0
(0%)
$-22
(-3.7%)
GHP accountiv$524.0$572.0$524.0$0
(0%)
$-48.1
(-8.4%)
ESF accountiv$51.1$25.0$51.1$0
(0%)
$26.1
(104.2%)
UNFPAv$32.5$56.0$32.5$0
(0%)
$-23.5
(-42%)
Vulnerable Children$27.5$25.0$30.0$2.5
(9.1%)
$5
(20%)
Neglected Tropical Diseases (NTDs)$107.5$114.5$114.5$7
(6.5%)
$0
(0%)
Global Health Securityii –$1,003.8 – –
USAID GHP accountvi$700.0$745.0$900.0$200
(28.6%)
$155
(20.8%)
of which for the Coalition for Epidemic Preparedness Innovations (CEPI)$100.0
State GHP accountviiNot specified$250.0Not specified –
ESF accountNot specified$6.0Not specified – –
AEECA accountNot specified$2.8Not specified – –
Emergency Reserve Fundviiiixx – –
Health Resilience Fundxi –$10.0 – – –
Health Reserve Fundxii – –$8.0 – –
SFOPs Total (GHP account only)xiii$9,830.0$10,576.0$10,561.0$731
(7.4%)
$-15
(-0.1%)
Labor Health & Human Services (Labor HHS)
Centers for Disease Control & Prevention (CDC) – Total Global Health$646.8$747.8$692.8$46
(7.1%)
$-55
(-7.4%)
Global HIV/AIDS$128.9$128.4$128.9$0
(0%)
$0.5
(0.4%)
Global Tuberculosis$9.7$9.2$11.7$2
(20.6%)
$2.5
(27.1%)
Global Immunization$228.0$226.0$230.0$2
(0.9%)
$4
(1.8%)
Polio$178.0$176.0$180.0$2
(1.1%)
$4
(2.3%)
Other Global Vaccines/Measles$50.0$50.0$50.0$0
(0%)
$0
(0%)
Parasitic Diseases$27.0$31.0$29.0$2
(7.4%)
$-2
(-6.5%)
Global Public Health Protection$253.2$353.2$293.2$40
(15.8%)
$-60
(-17%)
Global Disease Detection and Emergency ResponseNot specifiedNot specifiedNot specified – –
of which Global Health Security (GHS)Not specifiedNot specifiedNot specified – –
Global Public Health Capacity DevelopmentNot specifiedNot specifiedNot specified –
National Institutes of Health (NIH) – Total Global Health$954.0 – – –
HIV/AIDS$628.1$614.8Not specified – –
Malaria$239.0Not specifiedNot specified – –
Fogarty International Center (FIC)$86.9$95.8$95.2$8.3
(9.5%)
$-0.6
(-0.7%)
Labor HHS Total$1,600.8Not yet knownNot yet known – –
Notes:
i — The FY22 Final bill includes a provision giving the Secretary of State the ability to transfer up to $200,000,000 from the ‘Global Health Programs’, ‘Development Assistance’, ‘International Disaster Assistance’, ‘Complex Crises Fund’, ‘Economic Support Fund’, ‘Democracy Fund’, ‘Assistance for Europe, Eurasia and Central Asia’, ‘Migration and Refugee Assistance’, and ‘Millennium Challenge Corporation’ accounts “to respond to a Public Health Emergency of International Concern.”
ii — Some HIV, tuberculosis, MCH, nutrition funding, and global health security funding is provided under the ESF and AEECA accounts, which is not earmarked by Congress in the annual appropriations bills and is determined at the agency level.
iii — UNICEF funding in the FY22 Final bill includes an earmark of $5 million for programs addressing female genital mutilation.
iv — The FY22 Final and FY23 Omnibus bills state that “not less than $575,000,000 should be made available for family planning/reproductive health.”
v — The FY22 Final and FY23 Omnibus bills state that if this funding is not provided to UNFPA it “shall be transferred to the ‘Global Health Programs’ account and shall be made available for family planning, maternal, and reproductive health activities.”
vi — According to the Department of State, Foreign Operations, and Related Programs FY23 Congressional Budget Justification, $250 million of this funding is “for contributions to support multilateral initiatives leading the global COVID response through the Act-Accelerator platform.”
vii — According to the Department of State, Foreign Operations, and Related Programs FY23 Congressional Budget Justification, this funding is “to support a new health security financing mechanism, being developed alongside U.S. partners and allies, to ensure global readiness to respond to the next outbreak.”
viii — The FY22 Final bill states that “up to $100,000,000 of the funds made available under the heading ‘Global Health Programs’ may be made available for the Emergency Reserve Fund.”
ix — The FY23 Request states that “this request includes $90.0 million in non-expiring funds to replenish the Emergency Reserve Fund to ensure that USAID can quickly and effectively respond to emerging infectious disease outbreaks posing severe threats to human health.”
x — The FY23 Omnibus states that “up to $90,000,000 of the funds made available under the heading ‘Global Health Programs’ may be made available for the Emergency Reserve Fund.”
xi — The FY23 Request states that the Health Resilience Fund (HRF) “will support cross-cutting health systems strengthening in challenging environments or countries emerging from crisis.”
xii — The explanatory statement accompanying the FY23 Omnibus states that these funds are “to support cross-cutting health activities, including health service delivery, the health workforce, health information systems, access to essential medicines, health systems financing, and governance, in challenging environments and countries in crisis.”
xiii — The FY22 Final bill “includes $100,000,000 for a U.S. contribution to support a multilateral vaccine development partnership for epidemic preparedness innovations.”

Resources:

  • “Consolidated Appropriations Act, 2023” – Bill Text
  • FY2023 Department of State, Foreign Operations, and Related Programs (SFOPs) Appropriations – Explanatory Statement
  • FY2023 Department of Labor, Health and Human Services, and Education, and Related Agencies (Labor HHS) Appropriations – Explanatory Statement

[i] Total funding for global health is not currently available as some funding provided through USAID, NIH, and DoD is not yet available.

Poll Finding

KFF Health Tracking Poll December 2022: The Public’s Health Care Priorities For The New Congress

Published: Dec 20, 2022

Findings

Key Findings:

  • With the rising cost of living at the top of the public’s mind, the latest KFF Health Tracking poll finds that the public wants lawmakers to prioritize the economy and combatting inflation in the upcoming Congressional term. When asked specifically about health care priorities for Congress, passing a law to make health care costs more transparent to patients tops the list, with 60% calling this a top priority. And nearly three years into the pandemic and at a time when government COVID-19 funding may come to an end, three in ten (31%) say Congress should prioritize continuing funding for COVID-19 vaccines and treatment.
  • In the wake of the Dobbs decision overturning Roe v. Wade, President Biden pledged that the first bill he would send to the new Congress would be one to protect abortion rights. And though such a bill has little chance of passing in a divided Congress, this month’s KFF Health Tracking poll finds that two in three adults (65%) say passing a law to make abortion legal in all states is important, including four in ten (42%) who say it should be a top priority for Congress. Majorities across key groups say legalizing abortion nationwide should be a top priority for Congress, including Democrats and those who lean toward the party (66%), adults under 30 (58%), women under 50 (58%), and Black adults (55%). However, about one in four (26%) of the public overall and about half (49%) of Republicans and Republican-leaning independents say codifying the right to abortion nationwide is something Congress should not
  • Worries about rising prices are widespread among the public and health care costs are no exception. Nine in ten (91%) say they are concerned about increases in health care costs for individuals, including six in ten who say they are very concerned, nearly double the share who say they are very concerned about increases in government insurance programs like Medicare and Medicaid (34%) or about increases in health care costs paid by employers (31%). About half (48%) of the public say they are very worried about increases in health care costs for the nation as a whole.
  • Although there is great concern among the public about increases in health care costs, many have false impressions about where most U.S. health care money is spent. When asked where they think most health care spending goes, the most frequent answer given by the public is prescription drugs (36%), followed by hospitals (30%), long-term care (19%), and physician services (11%). Analyses of overall national health spending in 2020 found that the largest share of the U.S. health care dollar is spent on hospitals, while physicians/clinics and prescription drugs account for a smaller share of national health expenditures.
  • The costs associated with mental health care are another area where the public wants Congress to take action. Majorities say it should be a top priority for Congress to strengthen mental health parity laws (54%) and to increase funding for access to mental health services (51%). And, nearly eight in ten (79%) adults say that health insurance companies not covering mental health services like they do physical health is a big problem for mental health in the U.S., while a similar share (77%) say the same about the cost of mental health care.
  • Four months after the signing of the Inflation Reduction Act (IRA), at least seven in ten say they support each of the health care provisions polled, all of which aim to reduce patient costs. Support is highest for the provisions that aim to reduce costs for people on Medicare, such as capping monthly costs for prescription drugs, insulin, and allowing the government to negotiate for the price of prescription drugs. This includes majorities across partisans, though the majority that supports extending Affordable Care Act subsidies under the ACA is notably smaller among Republicans than among Democrats (54% vs. 90%).

The Public’s Top Priorities For The New Congress: Focusing On The Economy And Reducing Health Care Costs

Just as KFF analysis of APVotecast data found that inflation was the top factor motivating voters in midterm elections, the December KFF Health Tracking Poll finds that the economy and inflation is the public’s top issue for Congress in its upcoming term. More than one in three (37%) adults cite economic concerns when asked in their own words what should be the top priority for Congress in its new session next year, including 28% who mention inflation specifically.

Health care (including health care costs) is the second-most frequently mentioned priority by the public (9%), followed by immigration (8%). Other priorities were mentioned by smaller shares of adults, such as abortion and reproductive (5%), guns, crime and safety (4%), climate change, the environment, and global warming (3%), and democracy and election and voting reform (3%).

Economic Concerns Top The Public’s List Of Priorities For The New Congress

While the economy is the most frequently mentioned topic regardless of partisanship, Republicans and those who lean toward the party are twice as likely to name economic concerns as a top Congressional priority than are Democrats and Democratic leaners (50% vs. 26%). Beyond the economy and inflation, partisans differ somewhat in what they think Congress should prioritize in its new term. Among Democrats and those who lean toward the party, health care and health care affordability is the second most frequently mentioned topic (13%), while immigration is the second most frequently raised issue among Republicans and those who lean Republican (12%). A number of other priorities are named by at least 5% of Democrats, including abortion and reproductive rights; guns, crime and safety; democracy and election and voting reform; and climate change. Much smaller shares of Republicans mention each of these priorities.

Partisans Prioritize Economic Concerns Most, But Differ Across Other Top Concerns For New Congress

HEALTH CARE PRIORITIES FOR THE NEW CONGRESS

When asked specifically about health care priorities that Congress could take on next term, the public sees many as important for Congress to tackle. While recent regulations have sought to improve both price transparency and mental health care access, both of these issues are at the top of the public’s priority list for Congress. A large majority (95%) of the public say it is important for Congress to pass a law to make health care costs more transparent to patients, including 60% who call this a top priority.

On mental health, large shares say Congress should prioritize strengthening requirements to make health insurance plans cover mental health as they do physical health (91% important, including 54% top priority), as well as increasing funding for access to mental health services (92% important, 51% top priority). Another mental health priority, increasing funding to expand treatment programs for opioid addiction, is seen as important by about eight in ten adults (79%), but fewer (30%) say it should be a top priority for Congress.

Two policies related to women’s health are also seen as important areas for Congressional action by majorities of the public. About two-thirds (65%) say it is important for Congress to pass a law to make abortion legal in all states, including 42% who call this a top priority. Three-quarters (75%) also say it’s important for Congress to pass a law that requires states to continue coverage for 12 months after childbirth for pregnant people on Medicaid, including 35% who say this should be a top priority.

The Biden Administration recently announced that barring further Congressional action, the government will no longer fund the purchase of COVID-19 vaccines, which would likely increase spending on vaccines by billions of dollars a year according to an analysis by KFF. While seven in ten say continuing funding for COVID-19 vaccines is important for Congress to do, it ranks lower on the public’s priority list, with three in ten (31%) saying it should be a top priority.

Rounding out the list of health care priorities for the new Congress, seven in ten adults say it’s important for Congress to pass a law providing expanded access to telehealth services, though just two in ten call this a top priority. The relatively lower ranking of this issue may reflect the decline in the use of telehealth for outpatient visits, which peaked at 13% between March and August of 2020 according to KFF analysis.

Large Majorities Support Health Care Price Transparency And Mental Health Initiatives

On nearly all of these issues, women, Democrats, and those with lower incomes are more likely to see each of these as priorities for Congress.

Price Transparency And Mental Health Care Expenses Top Health Care Priorities For Congress

Majorities across key demographics say PROTECTING ABORTION ACCESS is IMPORTANT for new congress

As KFF analysis of AP VoteCast data has shown, the overturn of Roe v. Wade this summer  played an outsize role in shaping the minds of many voters in the recent midterm election. Now, looking ahead to the new Congressional term, about two-thirds (65%) of the public say passing a law to make abortion legal in all states is an important thing for Congress to do in its new term, including 42% who say it should be a top priority.

On this topic, 50% of women say it should be a top priority compared to one third (33%) of men. And Democrats and those who lean toward the party are about four times more likely than Republicans and those who lean Republican (66% vs. 17%) to say Congress should prioritize legalizing abortion nationwide. Notably, 26% of the public overall, including about half (49%) of Republicans and Republican leaners say that legalizing abortion is something Congress should not do.

About half of voters age 18-29 and women voters ages 18-49 said in November’s KFF/AP VoteCast poll that the Supreme Court overturning Roe v. Wade had a major impact on their decision about whether to vote in the midterm election, and a similar share said it also had a major impact on which candidates they supported in the election. This month’s KFF Health Tracking Poll finds majorities among these groups say legalizing abortion nationwide should be a top for the new Congress. Nearly six in ten adults under 30 (58%) and women under 50 (58%) say passing a law to legalize abortion in all states is a top priority, while similar shares of Black adults (55%) say the same.

Two In Three Favor Nationwide Abortion Protections, With Support Higher Among Key Groups

Another policy affecting women’s access to health care, passing a law that requires states to continue coverage for 12 months after childbirth for pregnant people on Medicaid, is seen as important by three-quarters of the public (75%). Fewer (35%) see this as a top priority for Congress, though the share who say it is a top priority rises to 50% for Democrats and those who lean Democratic and 41% for women. About one in two (51%) adults under 30 say passing a law to continue Medicaid coverage for 12 months postpartum is a top Congressional priority, while only about one in four (23%) adults 50 and older say the same. Majorities of women 18-49 (54%), Black adults (54%), and about half (49%) of Hispanic adults also say expanding postpartum Medicaid coverage should be a top priority for the new Congress. Currently, expansion of Medicaid coverage for 12 months after childbirth is optional for states, and about two thirds of states have implemented or plan to implement such coverage.1 

Three In Four Adults Favor Extending Medicaid Coverage For 12 Months After Childbirth

Concerns About Health Care Costs And National Health Care Expenditures

Just as the economy, inflation, and health care are at the top of the public’s priority list for the new Congress, when asked directly about increases in health care costs the public is concerned.  About nine in ten (91%) say they are concerned about increases in the amount individuals pay for health care, including six in ten (60%) who say they are “very” concerned. About eight in ten (83%) say they are concerned about increases in what the nation as a whole spends on health care, including nearly half (48%) who say they are “very” concerned. The public is somewhat less concerned about increases in spending when it comes to increases in costs borne by the government and employers. Around three in ten say they are “very” concerned about increases in spending on government health insurance programs like Medicare and Medicaid (34%), or the amount employers pay for their employees’ health care (31%).

Majorities Express Concern Over Health Care Spending In The U.S.,  With Particular Concern About Individuals' Spending

MANY SAY most health care spending is on prescription drugs, followed by hospitals

While the public is greatly concerned about increases in health care costs, many harbor misconceptions about where most of the U.S. health care dollar is spent. When asked about where they think most of health care spending by government and individuals goes, the most frequent answer given by the public is prescription drugs (36%), followed by hospitals (30%). About one in five adults say long-term care (19%) is where most money is spent, and about one in ten (11%) say physician services.

While it is true that the U.S. spends significantly more on prescription drugs than  other comparatively wealthy nations on average according to the Peterson-KFF Health System Tracker, analyses of overall national health spending found that hospitals represented nearly a third (31%) of spending, while physicians/clinics accounted for one fifth (20%) and prescription drugs a further 8%.

Prescription Drugs Thought To Be The Highest Spend Category In U.S. Health Care, With Hospitals A Close Second

Majorities Cite Lack Of Health Insurance Coverage And Costs As Key Concerns For Mental Health Care In The U.S.

Expense and overall costs also emerge as key issues when it comes to the public’s concerns about mental health in the United States. Similar to the shares found in an in-depth survey of mental health KFF conducted with CNN in July-August of this year, the latest KFF Health Tracking Poll finds that majorities say each of the items polled are big problems when thinking about mental health in the U.S. About eight in ten (79%) adults say that health insurance companies not covering mental health services like they do physical health is a big problem, while a similar share (77%) say the same about the cost of mental health care.

Beyond these expense-related problems, about two in three adults say stigma or shame associated with mental health is a big problem (66%), and a similar share (68%) say it is a big problem that there are not enough health care providers, such as therapists or counselors.

Women and those who report having a mental health condition are more likely to say each of these issues polled are a big problem when it comes to mental health in the U.S. than were men and those who do not report having a mental health condition.

Expense And Access Identified As Top Problems For Mental Health In The U.S.

Majorities Support Key Health Care Provisions Of The Inflation Reduction Act

Four months after President Joe Biden signed the Inflation Reduction Act (IRA) into law, most adults (71%) say they have read or heard at least a little about the law, though relatively few (13%) say they have heard “a lot.”

When asked about some specific health care components of the IRA, majorities of the public are in support. More than eight in ten adults support capping monthly-out-of-pocket costs for insulin for people with Medicare (84%) as well as placing a limit on out-of-pocket prescription drug costs for people with Medicare (82%). A similar share (81%) supports authorizing the federal government to negotiate the price of some prescription drugs for people with Medicare. And although the law was passed along party lines with all Democratic representatives in favor and no supporting Republican votes, large majorities across partisans in the public say they are in support of each of these provisions.

In addition to the Medicare provisions of the IRA, there is also strong support for the provision that extends financial subsidies for people who purchase health coverage through the Affordable Care Act marketplace. About seven in ten (72%) adults support this component of the law, though there is a strong partisan divide. The vast majority of Democrats and those who lean toward the party support this measure compared to a smaller majority of their Republican (90% v. 54%).

Strong Support For IRA Health Care Provisions, Especially Those That Reduce Costs For People With Medicare

Methodology

This KFF Health Tracking Poll/COVID-19 Vaccine Monitor Poll was designed and analyzed by public opinion researchers at the Kaiser Family Foundation (KFF). The survey was conducted November 29 – December 8, 2022, online and by telephone among a nationally representative sample of 1,259 U.S. adults in English (1,203) and in Spanish (56). The sample includes 1,029 adults reached through the SSRS Opinion Panel[1] either online or over the phone (n=32 in Spanish). The SSRS Opinion Panel is a nationally representative probability-based panel where panel members are recruited randomly in one of two ways: (a) Through invitations mailed to respondents randomly sampled from an Address-Based Sample (ABS) provided by Marketing Systems Groups (MSG) through the U.S. Postal Service’s Computerized Delivery Sequence (CDS); (b) from a dual-frame random digit dial (RDD) sample provided by MSG. For the online panel component, invitations were sent to panel members by email followed by up to three reminder emails. 1,004 panel members completed the survey online and panel members who do not use the internet were reached by phone (n=25).

Another 230 (n=24 in Spanish) interviews were conducted from a random digit dial telephone sample of prepaid cell phone numbers obtained through MSG. Phone numbers used for the prepaid cell phone component were randomly generated from a cell phone sampling frame with disproportionate stratification aimed at reaching Hispanic and non-Hispanic Black respondents. Stratification was based on incidence of the race/ethnicity groups within each frame.  Respondents in the phone samples received a $15 incentive via a check received by mail, and web respondents received a $5 electronic gift card incentive (some harder-to-reach groups received a $10 electronic gift card).

The online questionnaire included two questions designed to establish that respondents were paying attention. Cases that failed both attention check questions, those with over 30% item non-response, and cases with a length less than one quarter of the mean length by mode were flagged and reviewed. Cases were removed from the data if they failed two or more of these quality checks. Based on this criterion, one case was removed.

The combined cell phone and panel samples were weighted to match the sample’s demographics to the national U.S. adult population using data from the Census Bureau’s 2021 Current Population Survey (CPS). Weighting parameters included sex, age, education, race/ethnicity, region, and education. The sample was weighted to match patterns of civic engagement from the September 2017 Volunteering and Civic Life Supplement data from the CPS and to match frequency of internet use from the National Public Opinion Reference Survey (NPORS) for Pew Research Center.  Finally, the sample was weighted to match patterns of political party identification based on a parameter derived from recent ABS polls conducted by SSRS polls. The weights take into account differences in the probability of selection for each sample type (prepaid cell phone and panel). This includes adjustment for the sample design and geographic stratification of the cell phone sample, within household probability of selection, and the design of the panel-recruitment procedure.

The margin of sampling error including the design effect for the full sample is plus or minus 4 percentage points. Numbers of respondents and margins of sampling error for key subgroups are shown in the table below. For results based on other subgroups, the margin of sampling error may be higher. Sample sizes and margins of sampling error for other subgroups are available by request. Sampling error is only one of many potential sources of error and there may be other unmeasured error in this or any other public opinion poll. Kaiser Family Foundation public opinion and survey research is a charter member of the Transparency Initiative of the American Association for Public Opinion Research.

GroupN (unweighted)M.O.S.E.
Total1,259± 4 percentage points
Race/Ethnicity
White, non-Hispanic771± 5 percentage points
Black, non-Hispanic190± 10 percentage points
Hispanic226± 9 percentage points
 
Party identification
Democrat463± 6 percentage points
Republican327± 7 percentage points
Independent297± 8 percentage points
Democrats/Democratic-leaning independents620± 5 percentage points
Republicans/Republican-leaning independents454± 6 percentage points
Parents
Total parents377± 7 percentage points
Parent with a child ages 6 months through 4 years old133± 11 percentage points
Parent with a child ages 5-11201± 9 percentage points
Parent with a child ages 12-17193± 10 percentage points

[1] https://ssrs.com/opinion-panel/


Endnotes

  1. Data as of December 8, 2022. ↩︎
News Release

Large Shares of Women Report Needing Mental Health Services but Many Don’t Get Them

Published: Dec 20, 2022

An analysis of 2022 KFF Women’s Health Survey (WHS) data finds that although large shares of women report needing mental health services over the past two years, a significant percentage did not access services they felt they needed. Fifty percent of women ages 18-64 say they needed mental health services in the past two years (including 64% of women ages 18-25), but only half of these women obtained an appointment, which may suggest unmet mental health care needs.

Among those who felt they needed care, one in ten (10%) tried to get care but were unable to make an appointment for mental health services. Another 40% did not try to get mental health services even though they say they needed them.

Research has documented the challenges some consumers with health insurance face when finding in-network care. In fact, two in ten privately insured women with a mental health appointment in the past two years say their provider did not accept their insurance.

The country also faces a workforce shortage of behavioral health professionals in addition to other affordability challenges with health care infrastructure that impede accessibility. Among the one in six women who say they needed and sought mental health care services but were unable to get an appointment (16%), one-third say the main reasons they were unable to get an appointment were that they could not find a provider that was accepting new patients (33%) or that they could not afford the cost of mental health services (33%).

Conducted periodically since 2001, the 2022 KFF Women’s Health Survey (WHS) includes a nationally representative sample of 5,145 women and 1,225 men ages 18-64 conducted primarily online from May 10, 2022, to June 7, 2022. Our analyses present the state of health services access and utilization among women and men by income, race and ethnicity, insurance status, and other demographic characteristics.

Review “Access and Coverage for Mental Health Care” and explore “Experiences with Health Care Access, Cost, and Coverage,” which presents findings from the 2022 KFF WHS on women’s health status, use of health care services including telehealth, and costs.