What are the Consequences of Health Care Debt Among Older Adults?
Health care debt is a widespread problem in the United States, garnering the attention of some policymakers and emerging as a potential campaign issue. A 2022 KFF survey found that 2 in 5 US adults (41%) of all ages report some form of debt due to medical or dental bills for their own or someone else’s care. Nearly three-quarters of adults say they are worried about affording unexpected medical bills or the cost of health care services, higher than the shares who report worrying about affording other household expenses. The Medicare program, which provides health insurance coverage to 66 million people, most of whom are older adults ages 65 or older, helps to cover the cost of medical care for those who qualify, yet health care cost-related problems among Medicare-age adults are not uncommon and leave many exposed to debt, with potentially serious and long-lasting health and financial consequences.
Medicare offers coverage for a range of health care services, including hospitalizations, physician visits, prescription drugs, and post-acute care, but Medicare beneficiaries generally pay out-of-pocket for their monthly premiums and deductibles, cost-sharing for Medicare-covered services, and the cost of services not covered by Medicare, such as dental, vision, and hearing care and long-term services and supports. Medicare households also spend more on health care than other households and devote a larger share of their household budgets to medical costs and premiums. Health costs are a particular challenge for the millions of Medicare beneficiaries with limited income and savings to absorb unexpected health or other expenses. Finally, older adults are more likely than younger populations to have cognitive impairments such as Alzheimer’s Disease, which have been shown to contribute to a decline in credit scores and financial instability years before the condition is diagnosed.
This data note examines findings from the KFF Health Care Debt Survey to assess the prevalence, sources and consequences of health care debt among Medicare-age adults.
Key Takeaways
- More than one in five US adults ages 65 and older (22%) reported having some form of debt in 2022 as a result of medical or dental bills for their own or someone else’s care, which is half the share reported among adults ages 50-64 (44%).
- Among Medicare-age adults with health care debt, large shares say that some of the bills that caused their debt were due to routine health care services such as lab fees and diagnostic tests (49%), dental care (48%), and visits to the doctor (41%).
- Nearly three in ten Medicare-age adults with health care debt (29%) say their household has been contacted by a collection agency in the past five years as a result of medical or dental bills, while one in four (23%) say that health care debt has negatively affected their credit score.
- Three in five Medicare-age adults with health care debt (62%) say that they, or another member of their household, have delayed, skipped, or sought alternatives to needed health care or prescription medications due to costs in the past year.
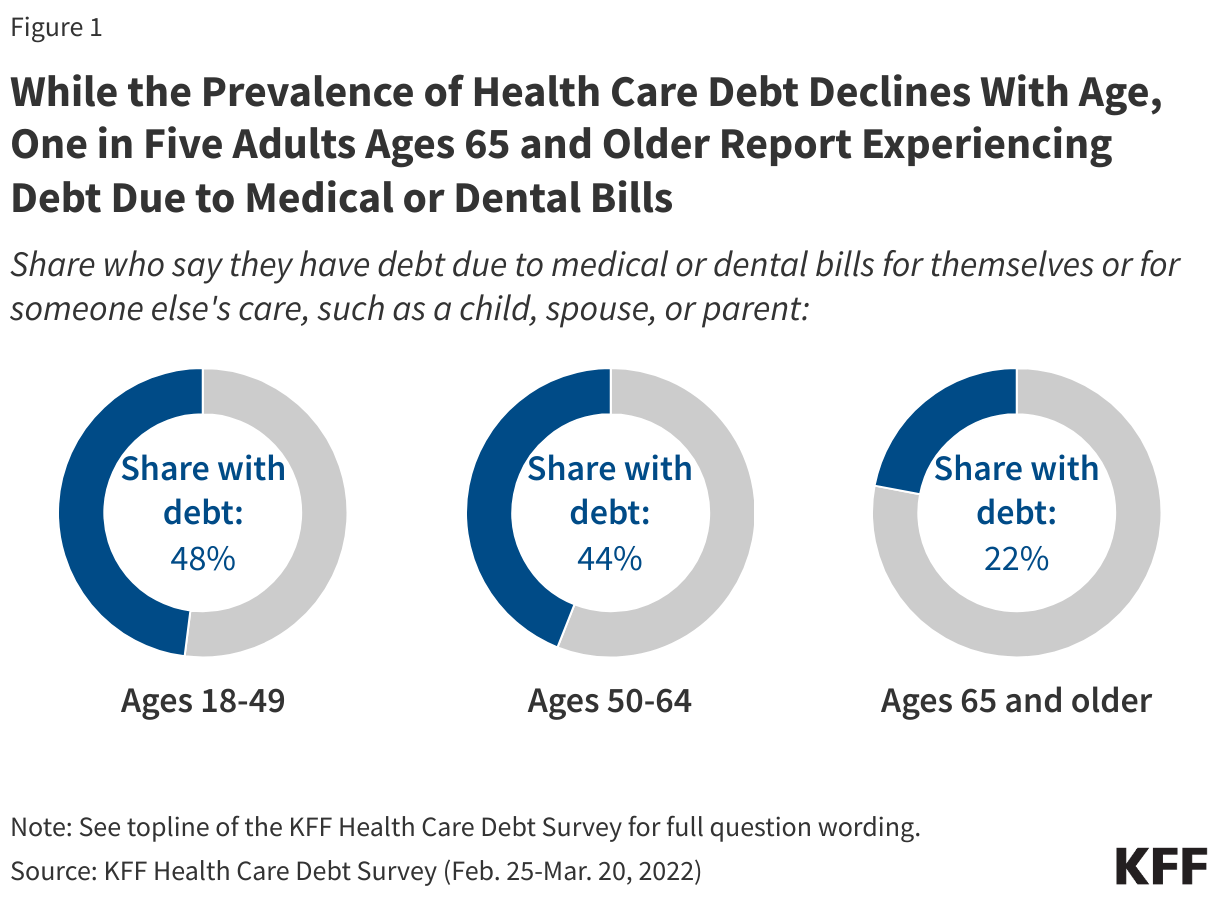
In 2022, more than one in five US adults ages 65 and older (22%) had some form of debt as a result of medical or dental bills (Figure 1). This is roughly half the share found among adults ages 50 to 64 (44%), who are not yet eligible for Medicare based on age. Lower rates of health care debt among older adults are likely due, in part, to nearly universal Medicare coverage among people ages 65 and older. Additionally, most Medicare beneficiaries have some form of coverage that limits their cost-sharing expenses, such as Medicare Advantage, or supplemental coverage, such as Medicaid, retiree health benefits, or Medigap.
The rate of health care debt among people ages 65 and older is higher than reported by some others, principally because of methodological differences in the way health care debt is defined. Surveys of health care debt in the US have commonly focused on unpaid medical bills, or bills which have been sent to collections, which may overlook the share of adults who pay off their health care bills by accumulating credit card debt, taking out loans, or borrowing from family and friends. For this reason, the KFF Health Care Debt Survey provides a broad measure of health care debt, which includes other types of debt incurred as a result of medical or dental bills, as well as debts owed for the care of someone else, such as a child, spouse, or parent.
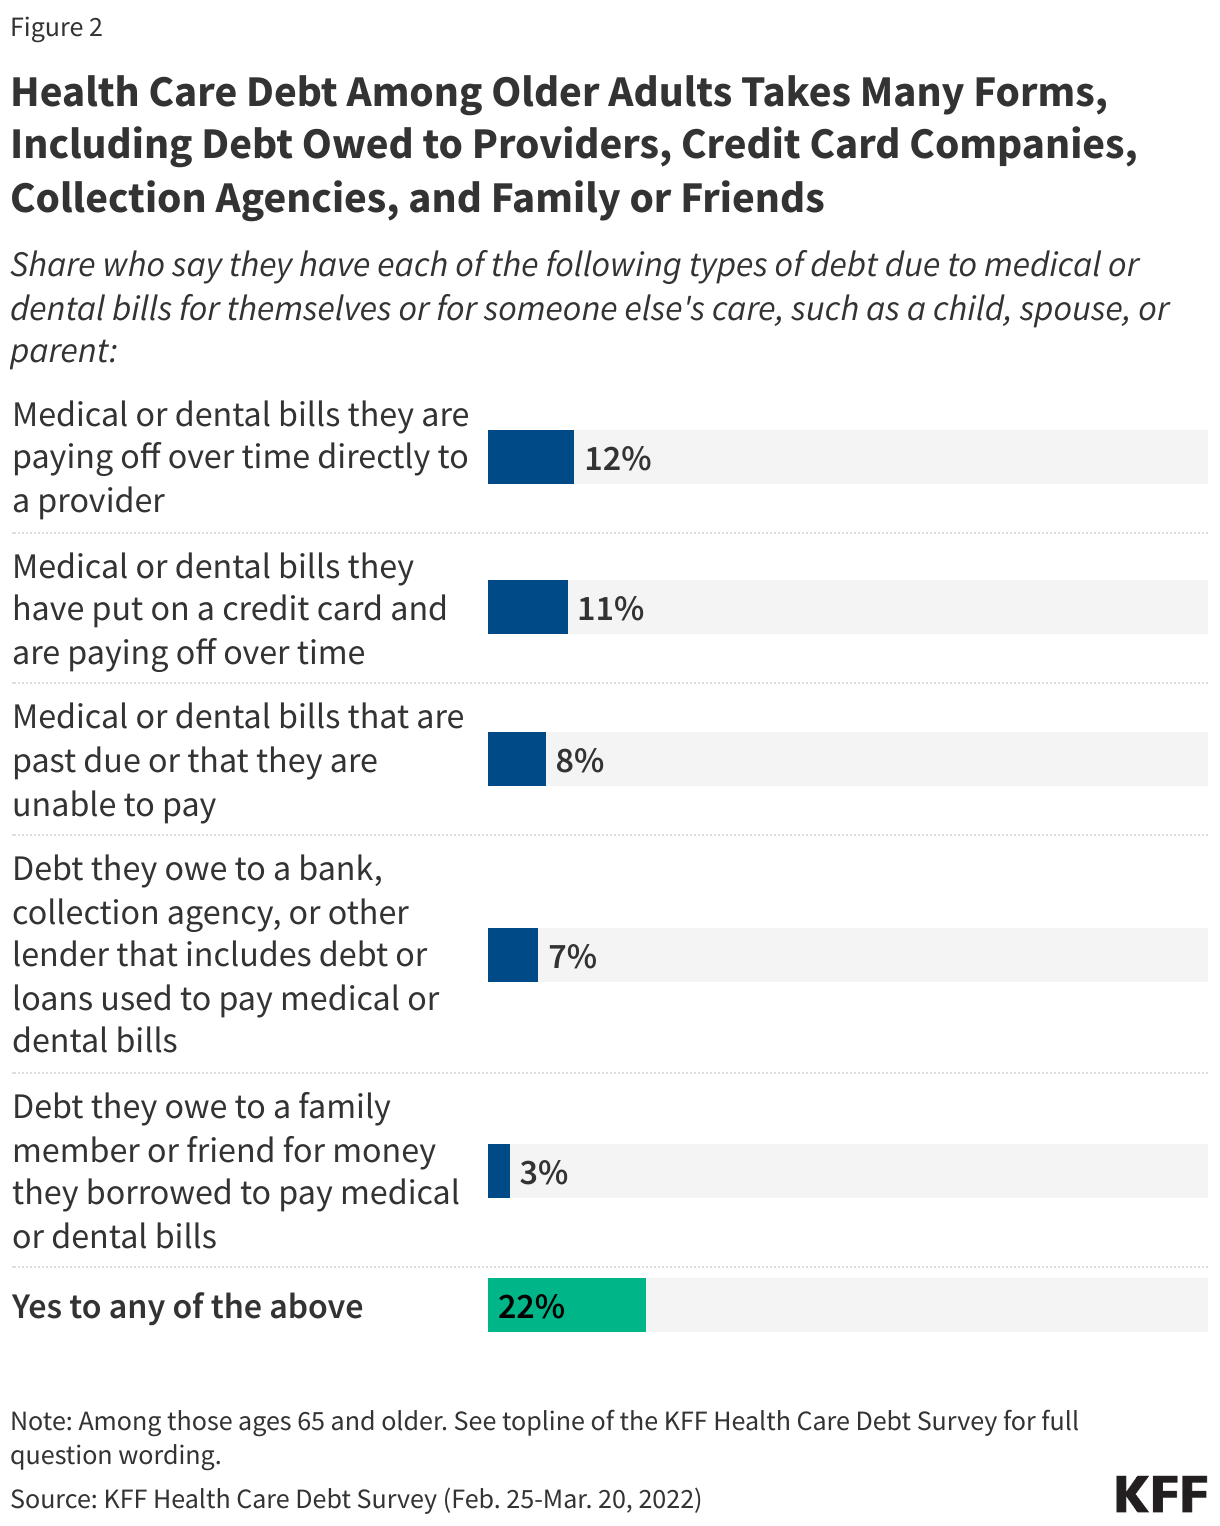
Many older adults pay off their health care bills by accumulating credit card debt or debt from other sources (Figure 2). Roughly one in ten Medicare-age adults report having medical or dental bills that they are paying off over time directly to a provider (12%), put on a credit card and are paying off over time (11%), are past due or unable to be paid (8%), or have debts owed to a bank, collection agency or other lender as a result of loans used to pay off medical or dental bills (7%). A smaller share report debts owed to family and friends for money borrowed to pay off medical or dental bills (3%).
Roughly two in five Medicare-age adults with health care debt (39%) owe less than $1,000, including one in five (19%) who owe less than $500, but one in ten Medicare-age adults with health care debt (11%) owe $10,000 or more (data not shown). Even relatively small amounts of debt can contribute to a drop in credit ratings.
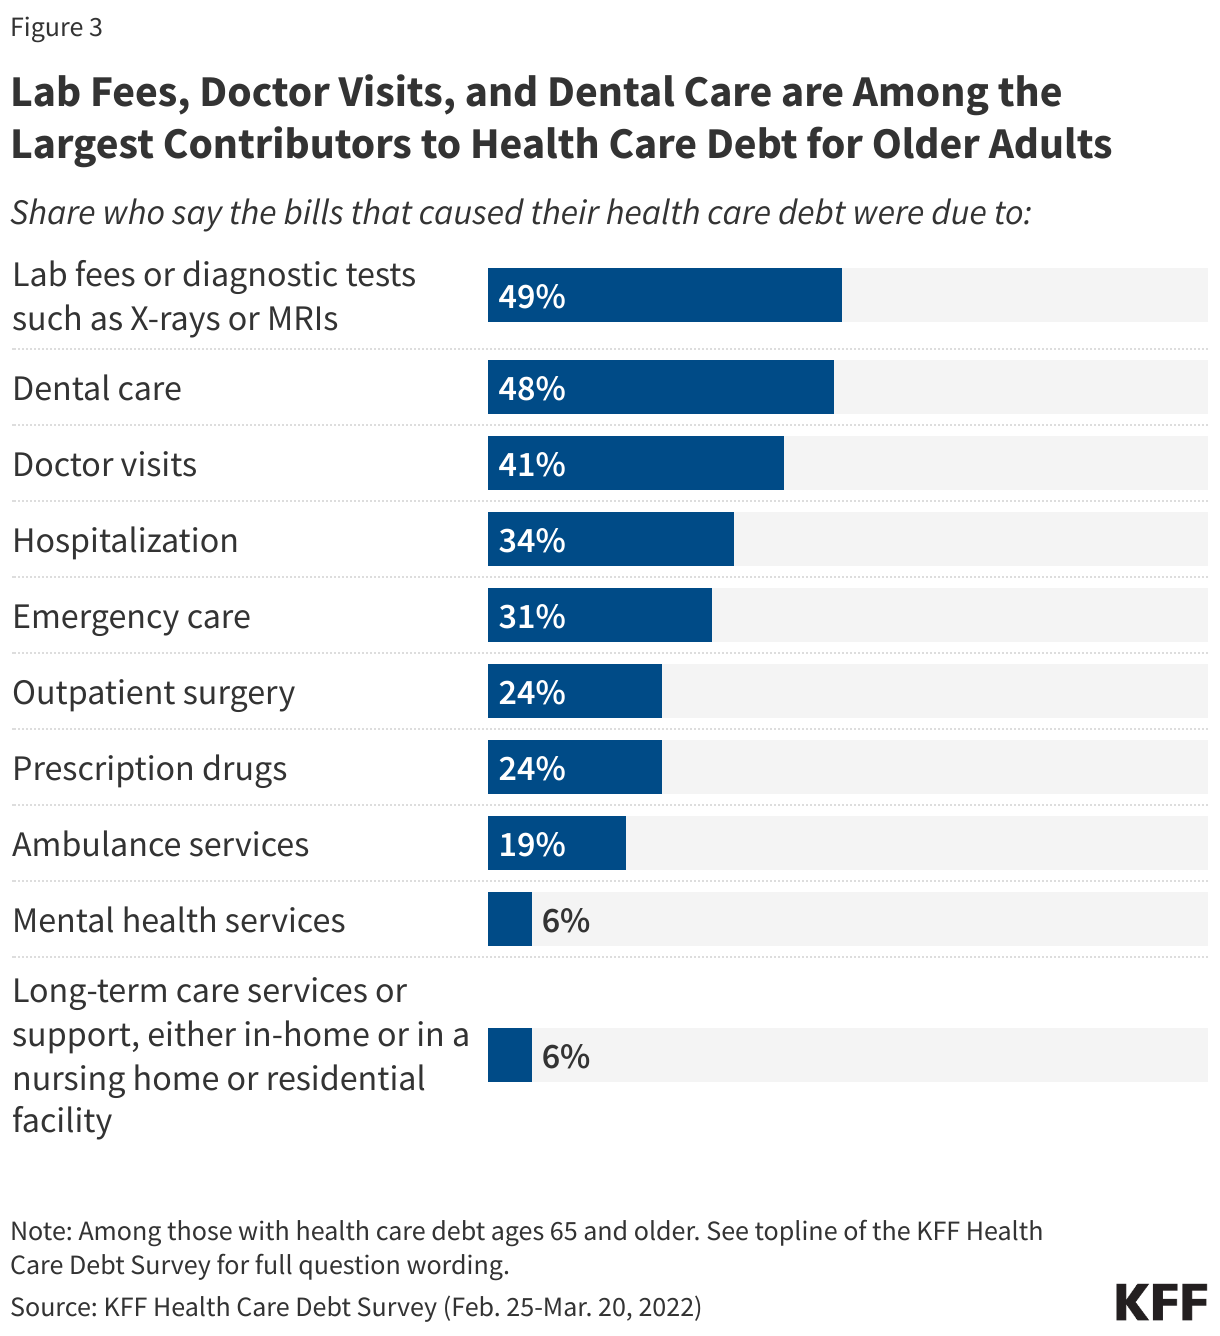
Sources of health care debt among older adults are varied, and include many routine health care needs (Figure 3). Nearly half of Medicare-age adults with health care debt say that some of the bills that caused their debt were due to lab fees and diagnostic tests (49%), dental care (48%), and visits to the doctor (41%). One in three (31%) attribute a portion of their debt to emergency care, and one in four (24%) to prescription drugs. Dental care is one of the leading causes of health care debt among Medicare-age adults, likely due to the fact that traditional Medicare does not offer coverage for dental care services. (Most Medicare Advantage plans include some dental care coverage, but the scope of coverage varies widely, and enrollees may still incur substantial out-of-pocket costs for these services.)
Just 6% of Medicare-age adults attribute a portion of their debt to bills for long-term care services and supports, such as the cost of nursing home care, assisted living or full or near full-time home health aides. These services are used extensively by a relatively small segment of the Medicare population but can be quite costly. For example, in 2023, the median annual cost of a private room in a nursing home was $116,800 and $288,288 for round-the-clock home health aide services. These costs far exceed the median income ($36,000 per person) and savings ($103,800 per person) of the average Medicare beneficiary in 2023. Medicare does not generally cover these services, placing them out of reach for many older adults and leaving some with substantial debt. (Survey findings may underrepresent the costs and associated debt incurred by people living in nursing homes, assisted living facilities and other institutional settings, though the survey does include debt associated with long-term services and supports if incurred by other family members.)
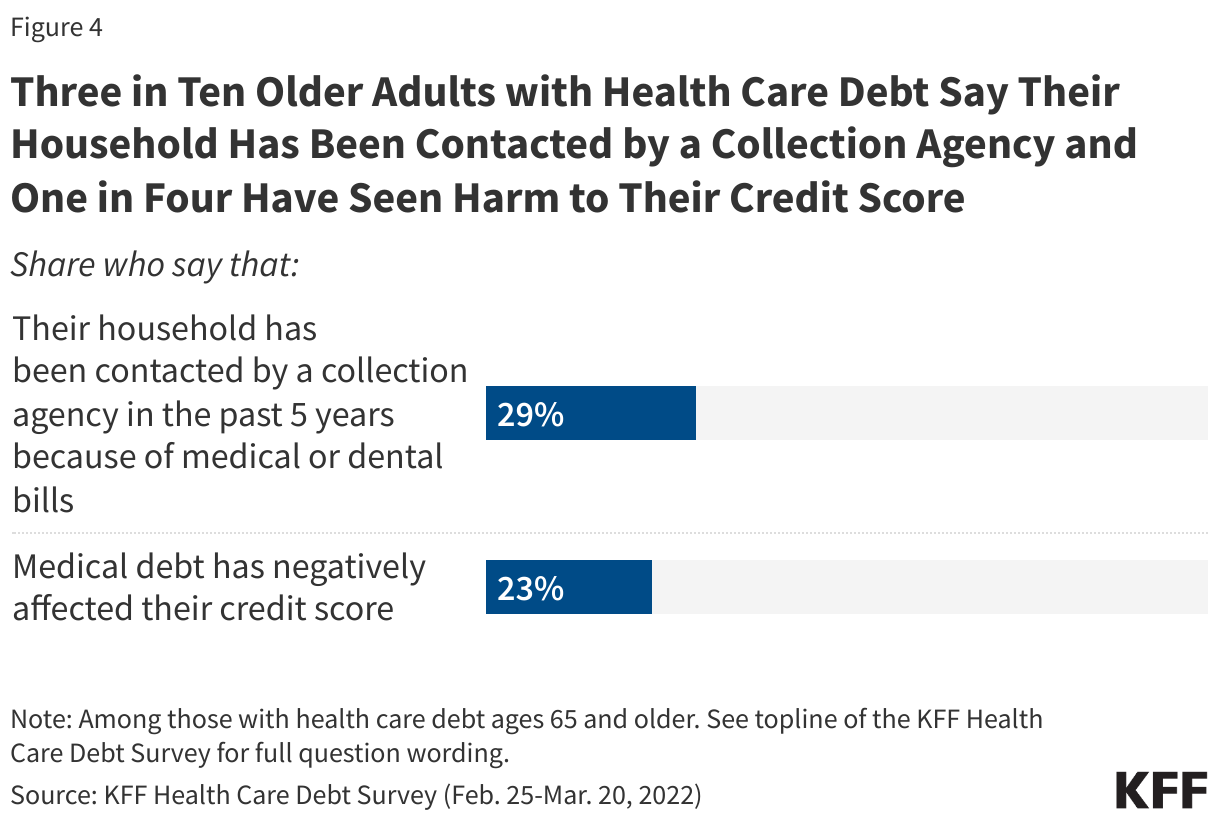
The financial consequences of health care debt may be lasting. Nearly three in ten Medicare-age adults with health care debt (29%) say their household has been contacted by a collection agency as a result of medical or dental bills, while one in four (23%) say that health care debt has negatively affected their credit score (Figure 4). For retirees with health care debt, these consequences may be difficult to reverse, and can make it more challenging to secure affordable credit in the future. The Consumer Financial Protection Bureau recently proposed a rule that would remove health care bills from most credit reports and prohibit lenders from making loan decisions based on medical information, with the goal of reducing the burden of health care debt for US adults and safeguarding against coercive credit reporting practices.
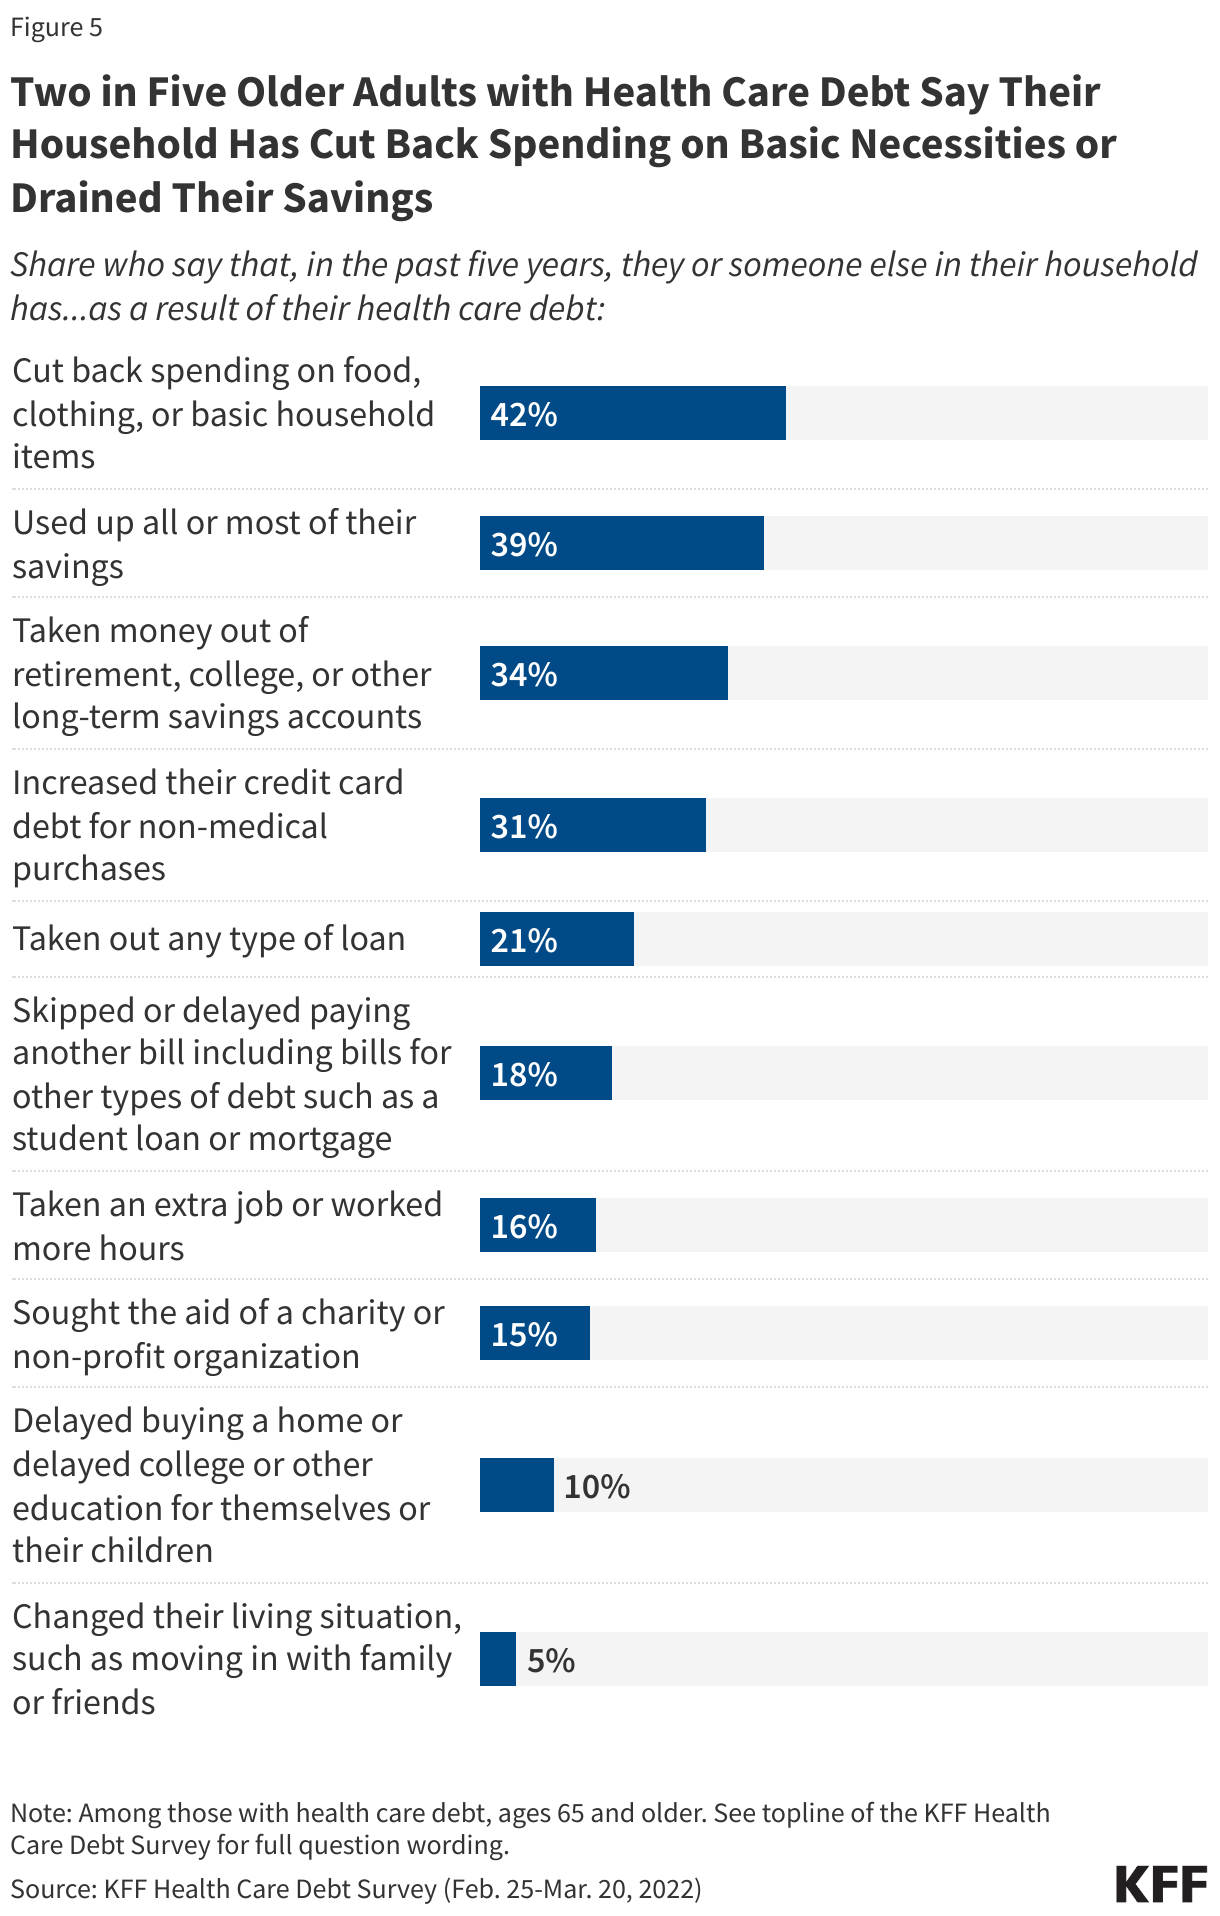
Two in five Medicare-age adults with health care debt report that they, or another member of their household, have cut back spending on household necessities (42%) or used up a large portion of their savings (39%) in the past five years as a result of their health care debt (Figure 5). One in three have taken money out of long-term savings accounts, such as a retirement account (34%) or increased their credit card debt for non-medical purchases (31%), and one in five have taken out a loan (21%) or skipped or delayed payment of other bills (18%). Sacrifices such as these can have serious consequences for financial stability and general wellbeing and may perpetuate the cycle of health care debt by leaving older adults with fewer resources for other needed health expenses.
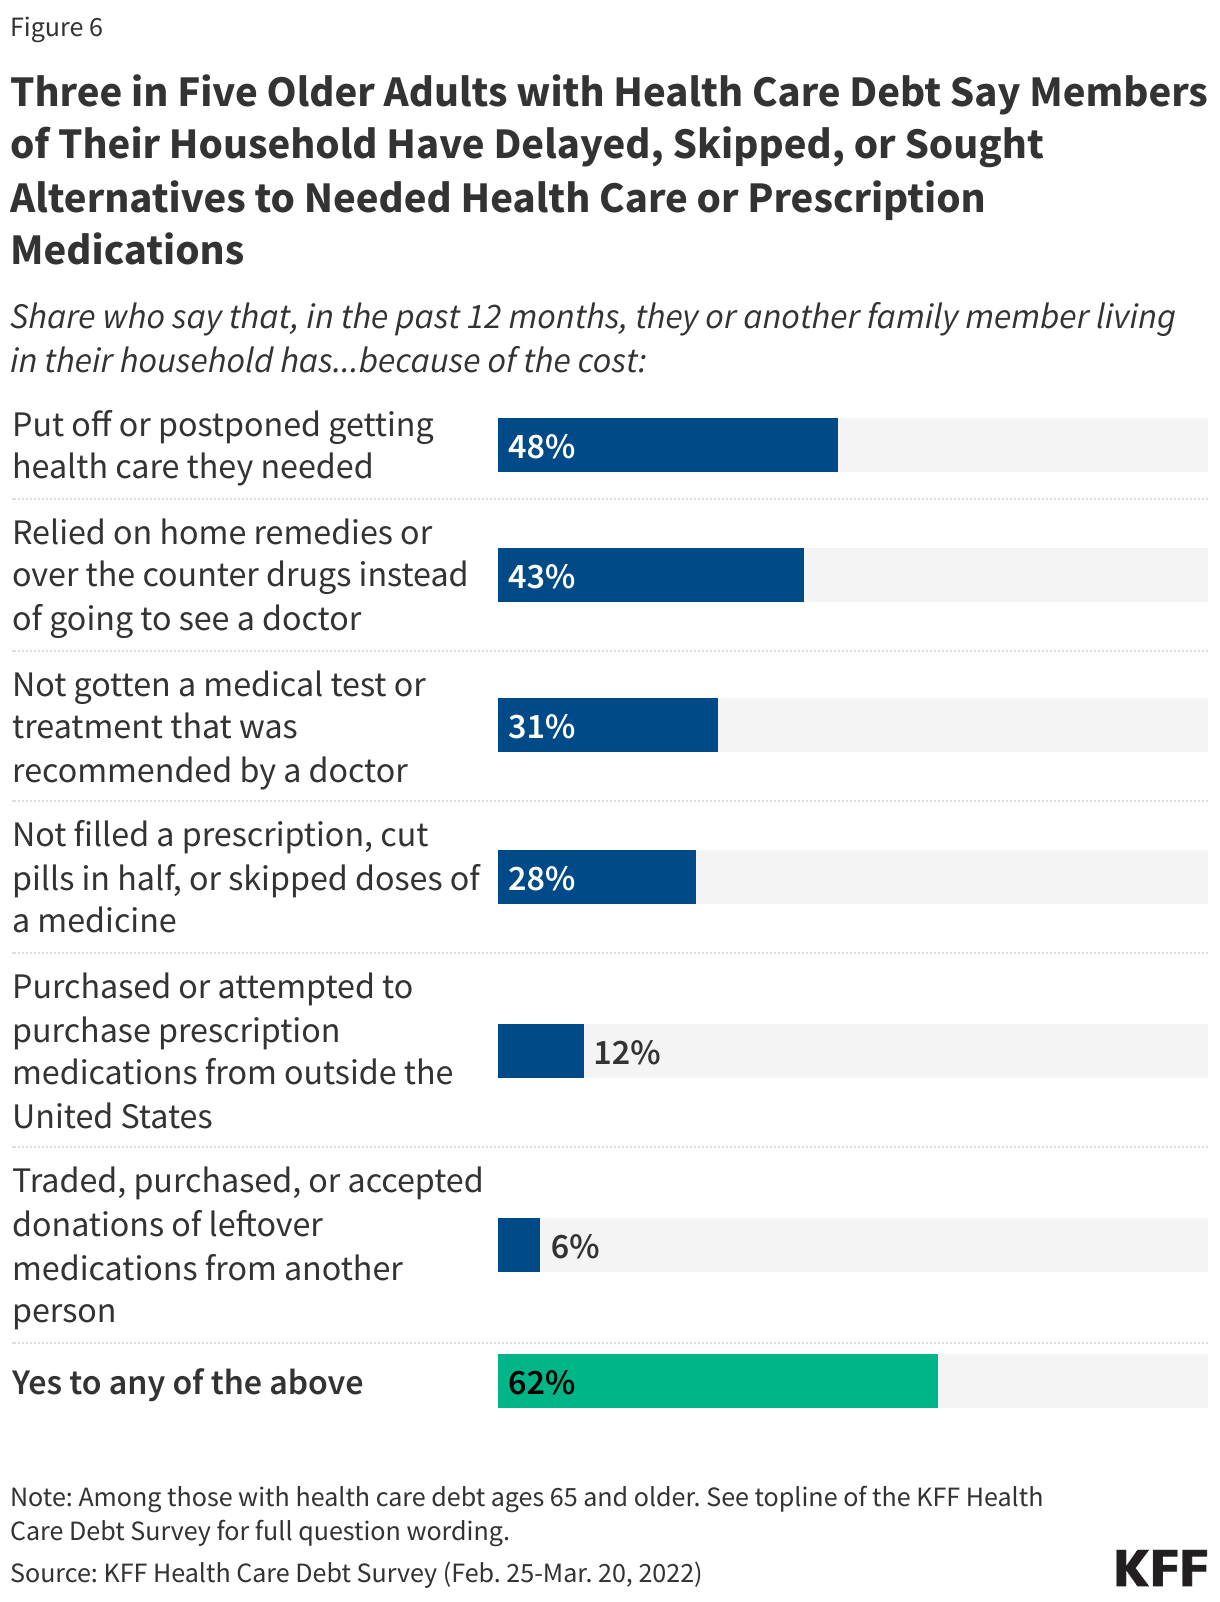
Three in five Medicare-age adults with health care debt (62%) say that they, or another member of their household, have delayed, skipped, or sought alternatives to needed health care or prescription medications due to costs (Figure 6). Nearly half (48%) of Medicare-age adults with health care debt postponed getting health care they needed in the past year, while two in five (43%) relied on home remedies or over the counter drugs instead of going to the doctor, and one in three did not get a medical test or treatment recommended by a doctor (31%) or took less than the prescribed dose of a medication by skipping doses, cutting pills in half, or leaving the prescription unfilled (28%).


 Irving Washington
  Hagere Yilma