Understanding Medicaid Cost Sharing and Policy Changes from the 2025 Reconciliation Law
Introduction
The 2025 reconciliation law makes significant changes to the Medicaid program, including requiring states to impose cost sharing on adults enrolled through the Affordable Care Act (ACA) Medicaid expansion, marking the first time the federal government has required states to impose cost sharing on Medicaid enrollees. Current federal rules allow, but do not require, states to impose cost sharing on certain Medicaid enrollees. In addition, the law creates new eligibility requirements that will affect expansion enrollees, including work requirements and the requirement for states to redetermine eligibility every six months. Together these provisions could create barriers to expansion enrollees maintaining coverage and increase their health care costs.
This brief explains current Medicaid cost sharing rules and changes made to cost sharing rules by the 2025 reconciliation law, reports on cost sharing amounts states currently impose on ACA expansion adults, and highlights literature on the impact of cost sharing. Key takeaways include:
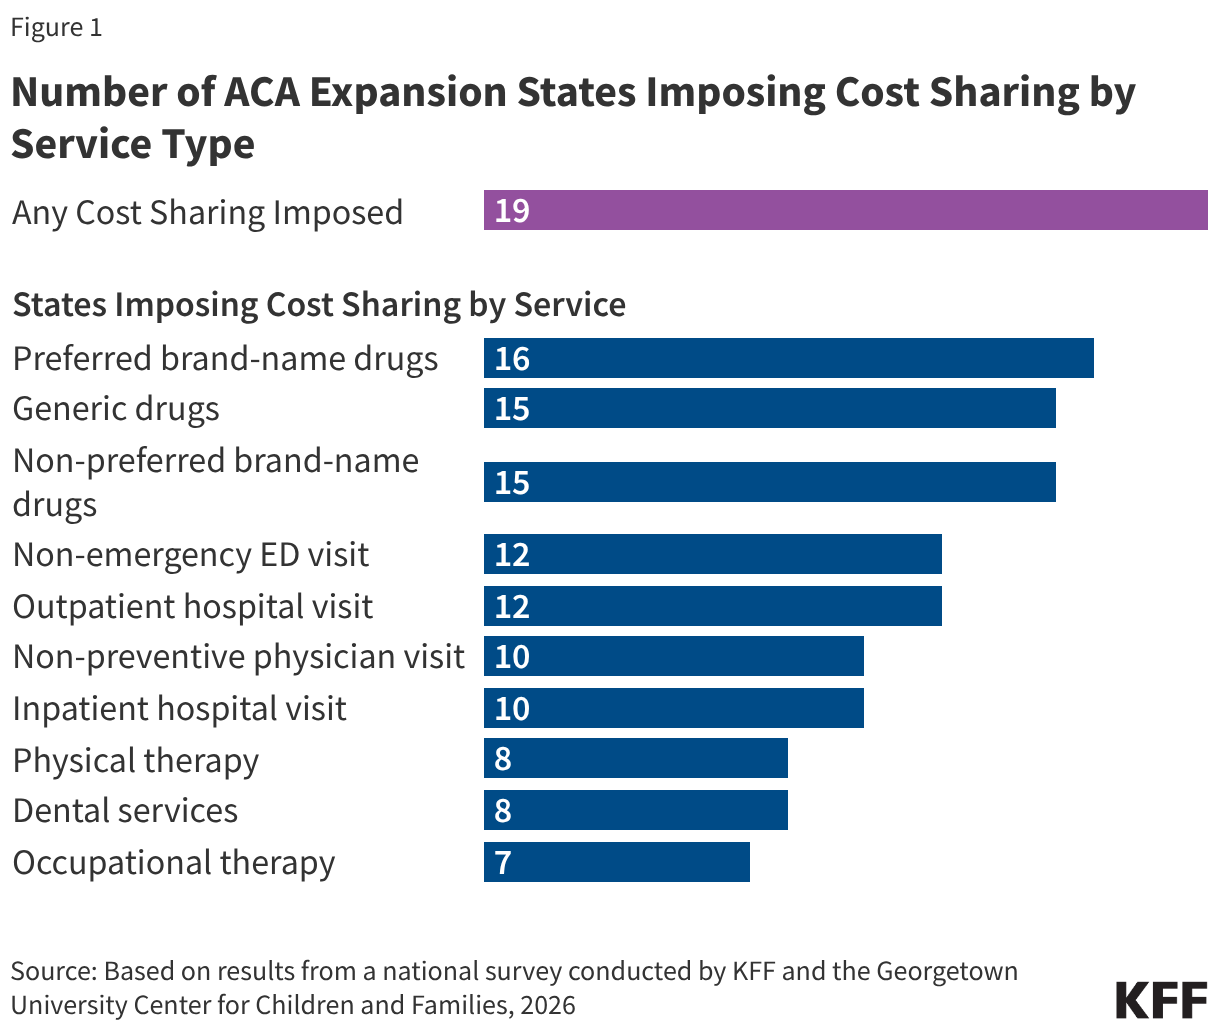
- As of January 2026, 19 states of the 41 that have adopted the ACA Medicaid expansion charge cost sharing on some services for adults enrolled in the expansion.
- While current rules generally limit cost sharing to nominal amounts, states can charge higher cost sharing to individuals with income above 100% of the federal poverty level (FPL), which is $27,320 for a family of three. The Medicaid expansion covers people with incomes up to 138% of the poverty level.
- The 2025 reconciliation law requires states to impose cost sharing of up to $35 per service on adults enrolled in the Medicaid expansion with income between 100% and 138% FPL. CMS guidance may address how much flexibility states have in determining which non-exempt services require cost-sharing and how much states may charge.
- Evidence shows that cost sharing is associated with reduced use of care, worse health outcomes and increased financial burden for low-income populations.
- Nearly half of expansion adults have at least one chronic condition. Medicaid expansion enrollees utilize some services more than traditional Medicaid enrollees, and expansion enrollees who are older or who have multiple chronic conditions are likely to face greater cost sharing burden than younger, healthy enrollees.
Current Cost Sharing Rules
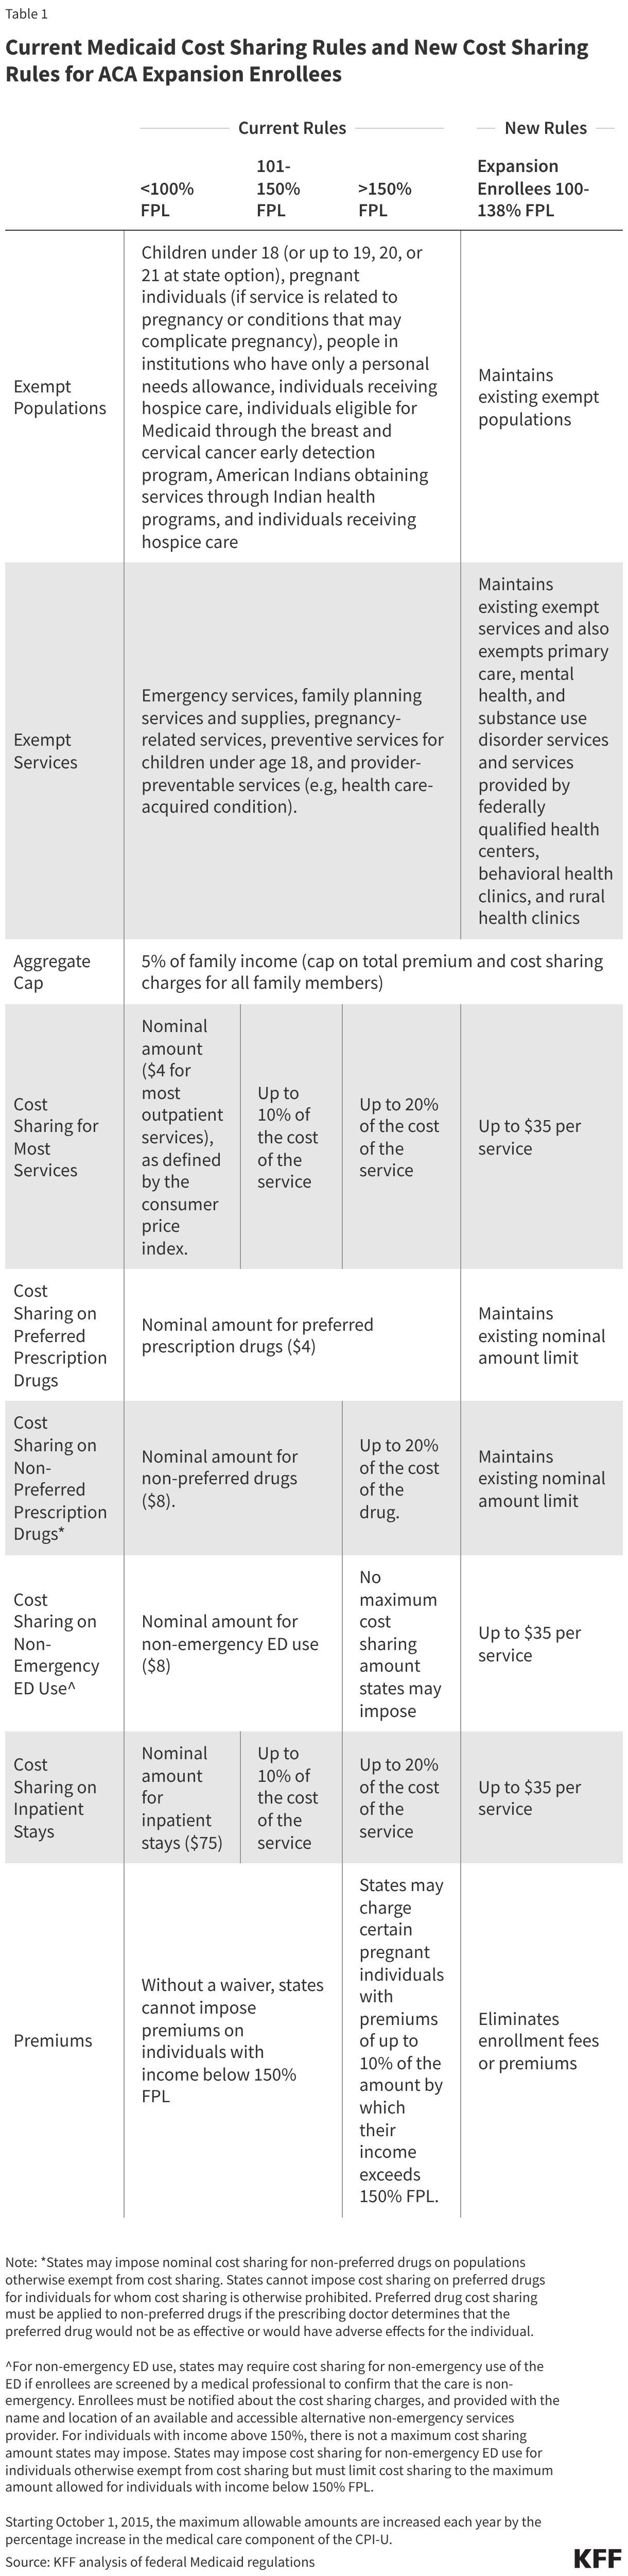
Current rules permit, but do not require, states to impose cost sharing on certain populations, within limits designed to protect Medicaid enrollees who have low incomes from high out-of-pocket costs. States have flexibility to impose cost sharing on certain populations. Cost-sharing is generally limited to nominal amounts but may be higher for those with incomes above 100% FPL. Certain populations and services are exempt from cost sharing requirements (Table 1). Total out-of-pocket costs for premiums and cost sharing for all individuals in a Medicaid household are capped at 5% of monthly or quarterly household income. States are required to establish a process for tracking incurred cost sharing that does not rely on enrollee documentation and stops cost sharing once a family meets the cap. States must allow providers to reduce or waive cost sharing for enrollees on a case-by-case basis. A state may allow providers to deny services to enrollees for nonpayment of cost sharing, if the enrollees have a household income above 100% FPL and are not a part of a population exempt from cost sharing except for certain services.
While cost sharing is generally limited to nominal amounts, states can charge higher cost sharing to individuals with income above 100% FPL. The nominal cost sharing amounts for individuals with income up to 100% FPL are specified in regulation and are set at $4 for most outpatient services and preferred drugs, $8 for non-preferred drugs and non-emergency use of the emergency department (ED), and $75 per inpatient stay. These maximum allowable amounts are increased annually by the percentage increase in the medical care component of the Consumer Price Index. For services other than prescription drugs and non-emergency ED use, cost sharing cannot exceed 10% of the cost of the service for individuals in families with incomes from 101-150% FPL and cannot exceed 20% of the cost of the service for individuals in families with incomes above 150% FPL.
States have additional flexibility for imposing cost sharing on non-preferred drugs and non-emergency ED (emergency department) use, including imposing cost sharing for populations otherwise exempt from cost sharing. For prescription drugs, states may impose different cost sharing amounts for preferred and non-preferred drugs and may impose nominal cost sharing for non-preferred drugs on populations otherwise exempt from cost sharing. Preferred drug cost sharing must be applied to non-preferred drugs if the prescribing doctor determines that the preferred drug would not be as effective or would have adverse effects for the individual.
For non-emergency ED use, states may require cost sharing if enrollees are screened by a medical professional to confirm that the care is non-emergency. Enrollees must be notified about the cost sharing charges and provided with the name and location of an available and accessible alternative non-emergency services provider. States may impose cost sharing for non-emergency ED use for individuals otherwise exempt from cost sharing but must limit cost sharing to the maximum amount allowed for individuals with income below 150% FPL. For individuals with income above 150%, there is not a maximum cost sharing amount states may impose. (See Table 1 for full cost sharing rules on prescription drugs and non-emergency ED use.)
Under current rules, states may not charge premiums for Medicaid enrollees with incomes less than 150% FPL. States may charge certain pregnant individuals with premiums of up to 10% of the amount by which their income exceeds 150% FPL. States may also obtain waivers to impose premiums in Medicaid that federal rules do not otherwise allow.
New Cost Sharing Requirements
The 2025 reconciliation law requires states to impose cost sharing on adults enrolled in the Medicaid expansion with income between 100% and 138% FPL. Starting October 1, 2028, states will be required to impose cost sharing of up to $35 per service on expansion adults with incomes between 100-138% FPL (Table 1). The law maintains existing exemptions of certain services from cost sharing and exempts additional services from cost sharing for this group. It also limits cost sharing for prescription drugs to nominal amounts. States may continue imposing existing cost sharing on other populations, including expansion adults with incomes below 100% FPL under existing rules. CMS guidance may clarify any flexibility states may have in determining whether some or all non-exempt services must require cost-sharing, and what cost sharing amounts are allowable. The reconciliation law does not specify a minimum level of cost-sharing that must be imposed, except that the cost sharing must be greater than $0.
Current Cost Sharing Imposed by States
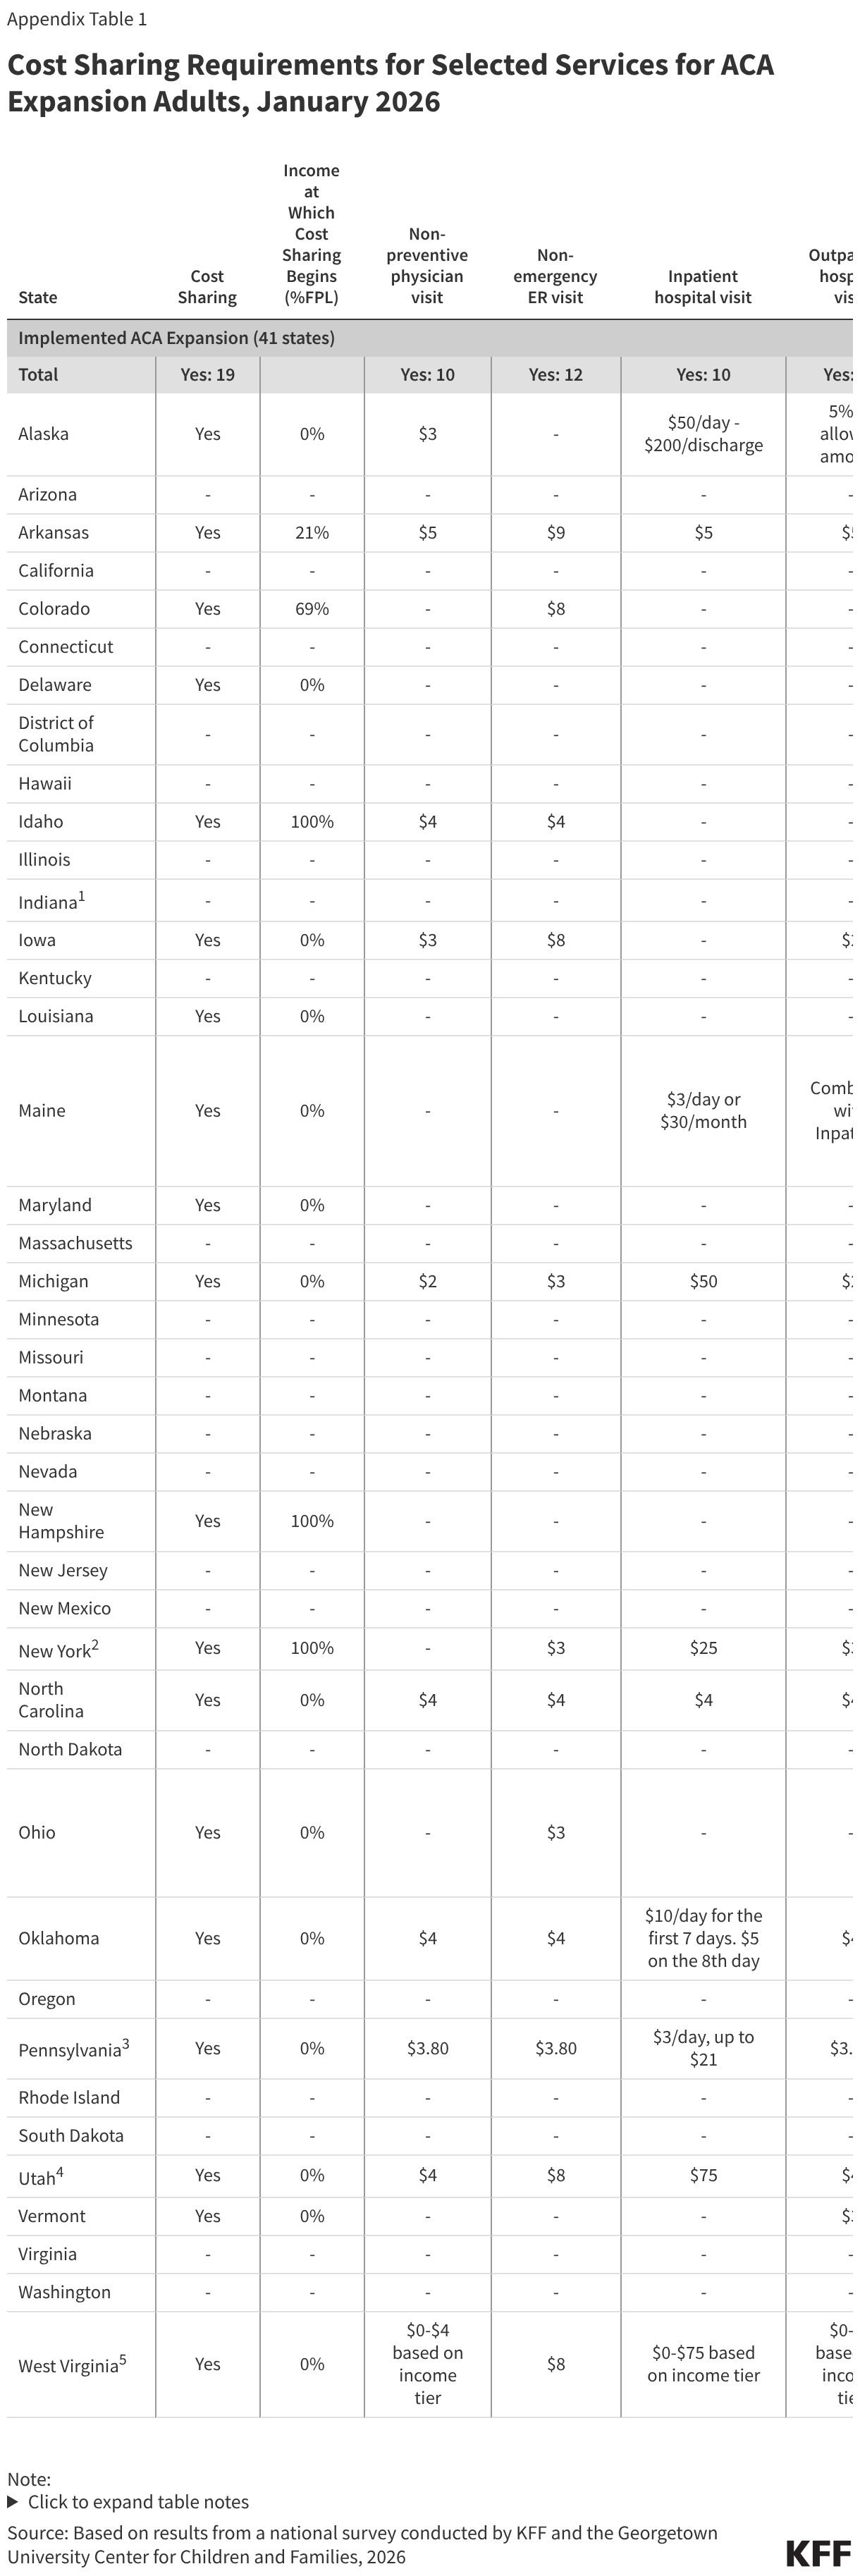
As of January 2026, 19 states that have adopted the ACA Medicaid expansion charge cost sharing on some services for adults enrolled in the expansion. Fourteen of the 19 states impose cost sharing regardless of income while three states impose cost sharing only on expansion adults with income 100%-138% FPL and two states charge cost sharing starting at incomes less than 100% FPL. States most commonly charge cost sharing for prescription drugs (Figure 1). Sixteen states charge cost sharing for preferred brand-name drugs. Fifteen states charge cost sharing for generic drugs and non-preferred brand-name drugs. Most of these states charge the same cost sharing amount for both preferred and non-preferred drugs. Twelve states require a copayment for non-emergency ED and outpatient hospital visits, while ten states charge cost sharing for inpatient hospital visits.
Four states (Delaware, Louisiana, Maryland, and New Hampshire) only impose cost sharing for prescription drugs. One state (Colorado) only imposes cost sharing for non-emergency ED visits. (Full details on cost sharing amounts by service can be found in Appendix Table 1. Data was collected through KFF’s 2026 Medicaid Eligibility, Enrollment, and Renewal Policies Annual Survey.)
While most states limit cost sharing amounts to under $10 per service, four states charge more than $35 for hospital stays. Each of these four states charges more than $35 for inpatient hospital stays. Alaska charges $50 per day up to $200 per discharge; Michigan charges $50 per inpatient stay; Utah charges $75 per stay; and West Virginia charges $75 per stay for enrollees with income above 100% FPL. These states will likely need to reduce these cost sharing amounts to meet the new requirements.
North Carolina has recently enacted legislation that sets all Medicaid copayments at the maximum amount allowable under federal law starting July 1, 2027. This will require North Carolina to increase current cost sharing amounts for certain services (e.g., non-preferred drugs, non-emergency use of ED, and inpatient stays) to the maximum allowable amounts for populations currently subject to cost sharing. When new cost sharing rules for expansion adults go into effect on October 1, 2028, the state will increase cost sharing amounts for most services to $35 for these adults.
Impact of Cost Sharing on Enrollees
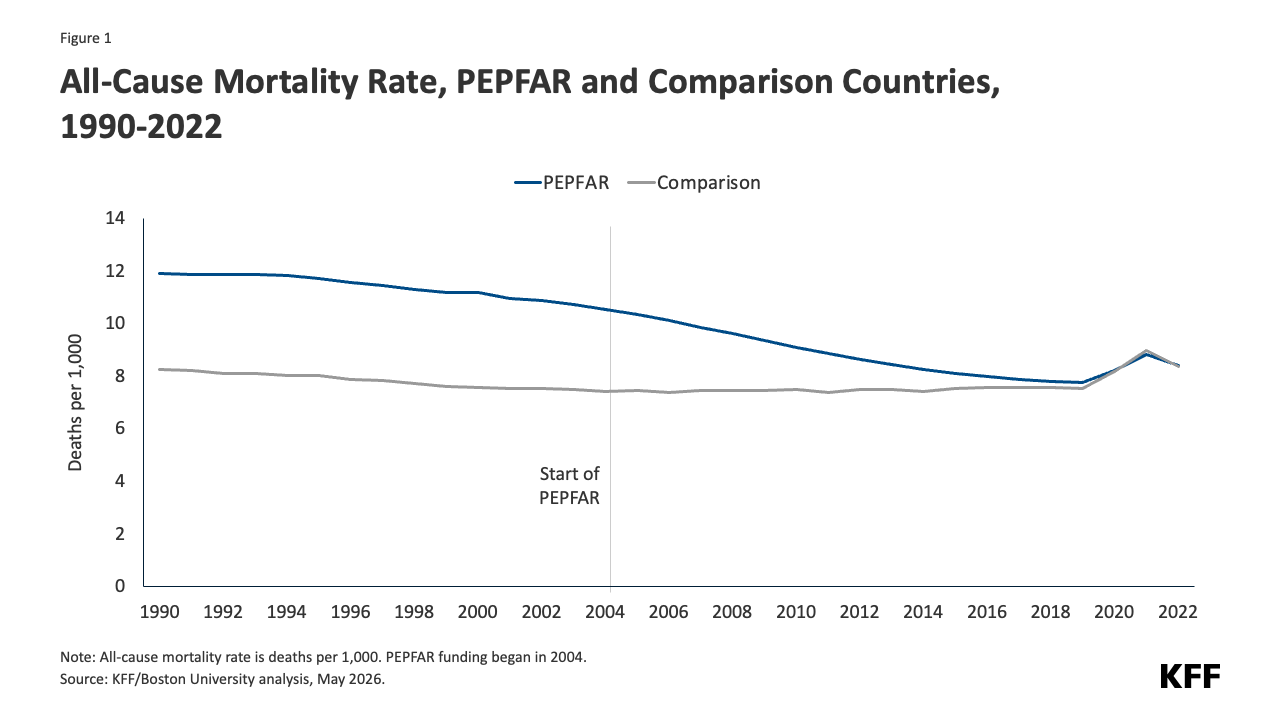
Evidence shows that cost sharing is associated with reduced use of care, worse health outcomes and increased financial burden for low-income populations. Cost-sharing results in higher costs and greater financial burden for low-income adults. Studies show that cost-sharing reduces utilization of both medically necessary care, including medications, behavioral health services for Medicaid enrollees with substance use disorders (SUDs) and clinically appropriate cancer screenings, as well as care that may be less necessary. Studies suggest that cost-sharing in older and low-income populations causes higher mortality.
Medicaid expansion enrollees utilize some services more than traditional Medicaid enrollees, and expansion enrollees who are older or who have multiple chronic conditions are likely to face greater cost sharing burden than younger, healthy enrollees. KFF analysis of 2021 Medicaid claims data found that one-third of expansion adults have a chronic physical health condition and a quarter have a chronic behavioral health condition. Likely because of these health conditions, expansion adults were more likely to use prescription drugs and behavioral health treatment compared to other adult Medicaid enrollees. Another KFF analysis of Medicaid utilization patterns estimates that among Medicaid expansion enrollees who used non-exempt services, the average enrollee could pay $542 if states charge $35 on all non-exempt services. Copayments that are required at the point of service have a greater impact on enrollees with higher health care needs who use more services. The analysis further suggests that expansion adults who are older could face cost sharing that is twice as high as younger enrollees and those with multiple chronic conditions could pay up to five times more cost sharing compared to enrollees with no chronic conditions.
Appendix