Inflation Reduction Act Health Insurance Subsidies: What is Their Impact and What Would Happen if They Expire?

Authors: Jared Ortaliza, Anna Cord, Matt McGough, Justin Lo, and Cynthia Cox
Published: Jul 26, 2024

As a candidate in 2020, President Biden campaigned on building upon the Affordable Care Act (ACA) by increasing the amount of financial assistance available to people buying their own health insurance coverage through the ACA Marketplaces. Temporary subsidies were originally passed as part of the American Rescue Plan Act (ARPA) in 2021, which included two years of enhanced subsidies (2021 and 2022). The Inflation Reduction Act (IRA), which passed in 2022, extended these enhanced subsidies for an additional three years, ending after 2025.

The IRA and ARPA’s enhanced health insurance subsidies both increase the amount of financial help available to those already eligible for assistance under the ACA and also newly expand subsidies to middle-income people (with incomes over four times the poverty level, $103,280 for a family of three in 2024), many of whom were previously priced out of coverage. These subsidies, combined with increased funding for outreach and marketing, have led to record-high enrollment in the ACA Marketplaces.

By the time these enhanced subsidies are currently set to expire at the end of next year, they will have been an integral part of the ACA Marketplaces for 5 years, or nearly half as long as the ACA Marketplaces have existed. Millions of enrollees have come to rely on the enhanced subsidies, with more people gaining Marketplace coverage since President Biden took office than had signed up for ACA Marketplace when the markets first launched in 2014. If the enhanced subsidies expire, almost all ACA Marketplace enrollees will experience steep increases in premium payments in 2026. However, the subsidies come at a steep cost to taxpayers, with the CBO projecting that a permanent extension of the subsidies would cost $335 billion over the next ten years.

The charts below show the impact these subsidies have had on enrollment and premium payments, and the potential implications if the enhanced subsidies expire. This analysis finds that:

  • The recent growth in ACA Marketplace plan enrollment has been driven primarily by low-income people, with signups by people with incomes up to 2.5 times poverty growing 115% since 2020.
  • Enhanced subsidies have cut premium payments by an estimated 44% ($705 annually) for enrollees receiving premium tax credits. If the subsidies expire, most Marketplace enrollees will see premium payment increase substantially.
  • Without these enhanced subsidies, premiums would double or more, on average, for subsidized enrollees in 12 states using Healthcare.gov.

While enhanced subsidies expire at the end of 2025, insurers and regulators will want to know well in advance whether the subsidies will be renewed or discontinued so they can set accurate premiums for 2026.

The Number of ACA Marketplace Enrollees Receiving Premium Tax Credits in 2024 Has Nearly Doubled Since 2017

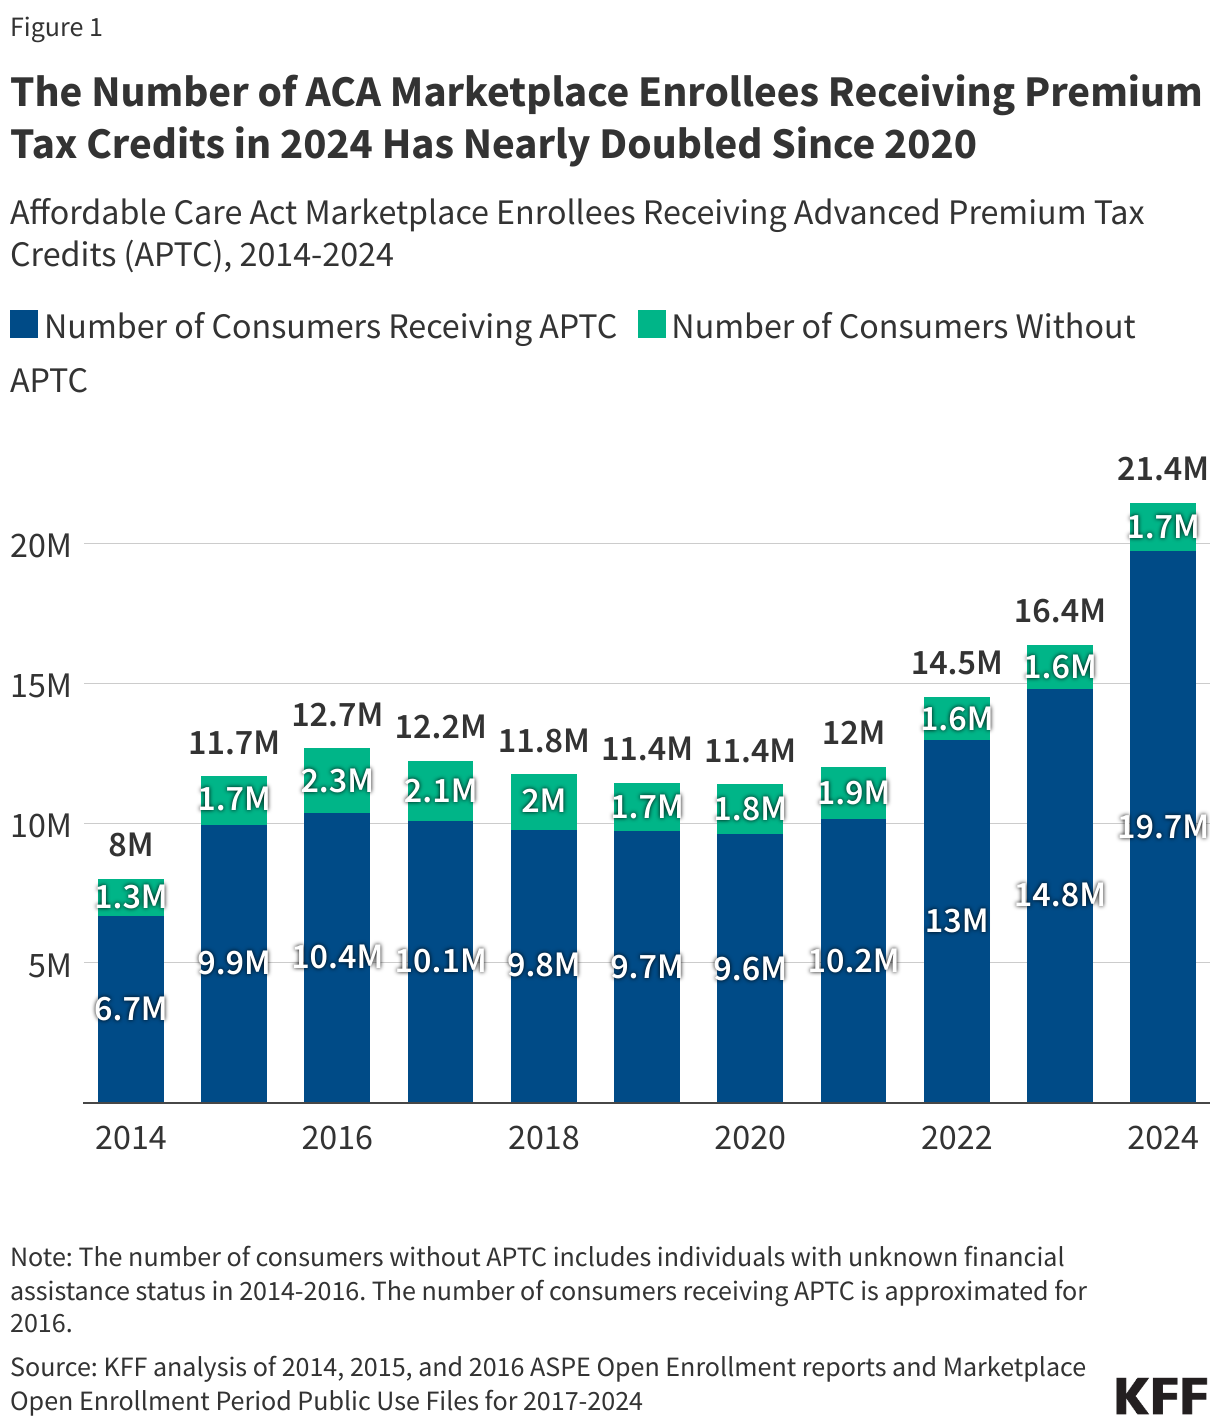
Since 2020, the year before the enhanced subsidies went into effect, the number of people with ACA Marketplace coverage has grown by 88% from 11.4 million to 21.4 million.

All the growth in Marketplace enrollment in the last four years is among people receiving an advanced payment of the premium tax credit. Subsidized enrollment is up 106%, from 9.6 million (84% of Marketplace enrollees) in 2020 to 19.7 million people (92% of the total number of Marketplace enrollees). If the Inflation Reduction Act’s enhanced subsidies expire, the Congressional Budget Office (CBO) expects ACA Marketplace enrollment to drop sharply from an estimated 22.8 million in 2025 to 18.9 million the following year. CBO projects that enrollment would continue to fall in the subsequent years reaching as low as 15.4 million in 2030.

Low Income People Make Up the Majority of The Growth in ACA Marketplace Enrollment

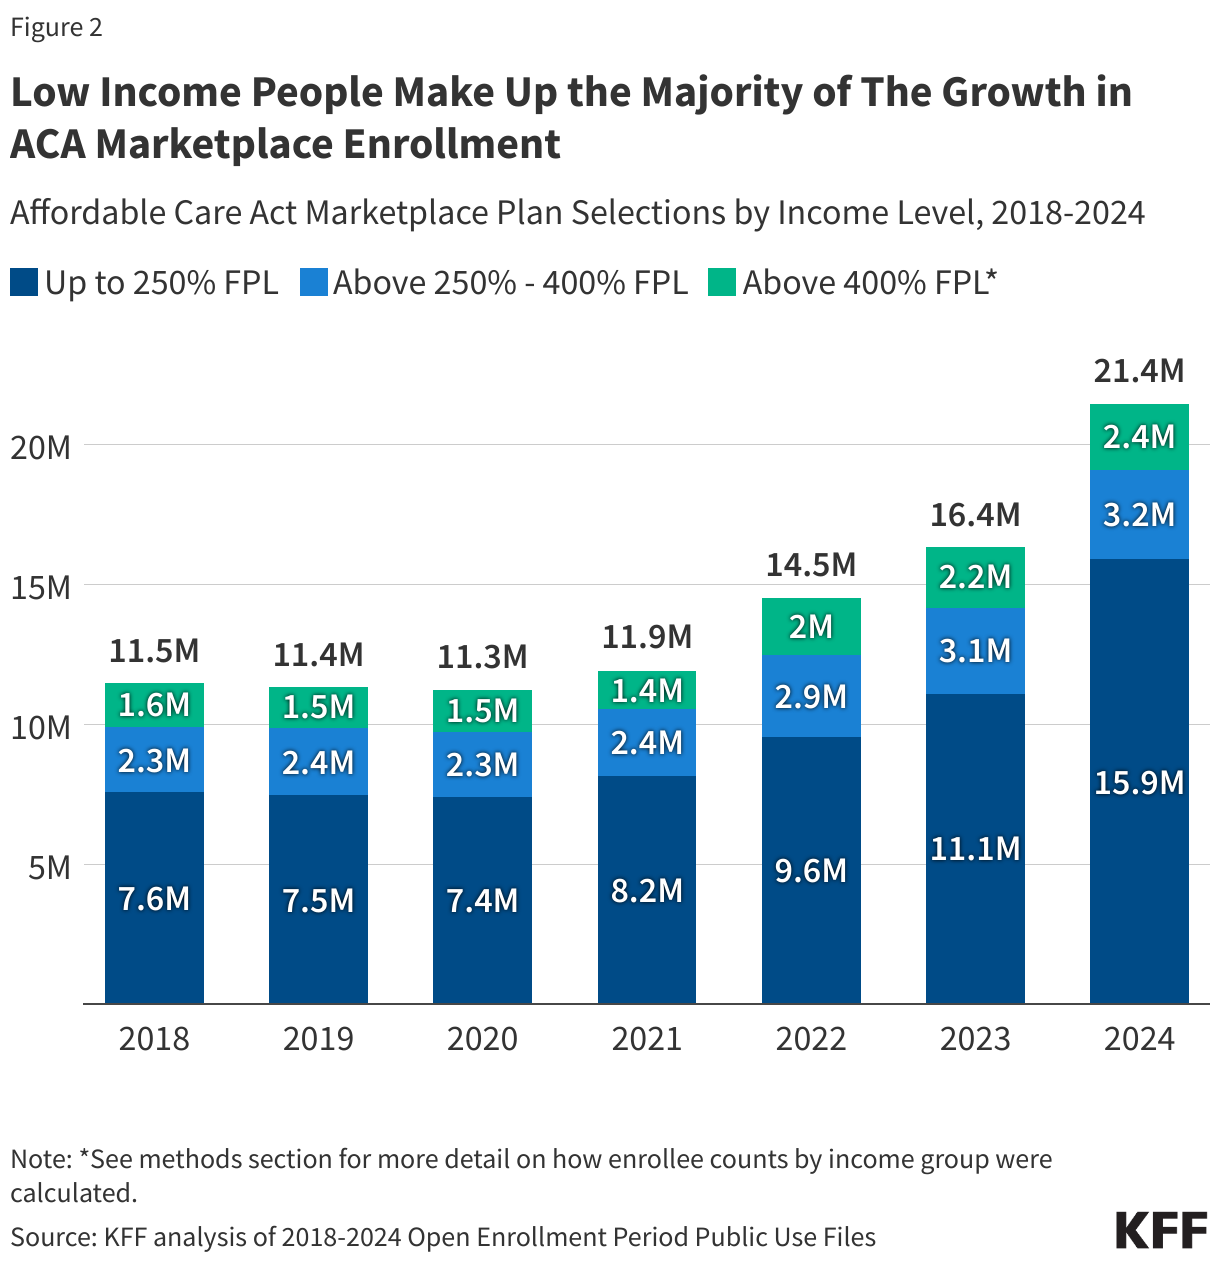
Spurred by the availability of plans with no or very low premium payment – often with very low deductibles – made possible by enhanced subsidies, low-income enrollees (those with incomes up to 2.5 times the federal poverty level) have driven most (83%) of the enrollment growth in the ACA Marketplaces from 2020 to 2024. While these plans with little or no premium payment are available nationwide, they are available to a larger share of ACA Marketplace enrollees in the ten states that have not expanded Medicaid.

While most of the recent growth in enrollment is from low-income enrollees, all income groups have seen substantial growth. From 2020 to 2024, the number of Marketplace enrollees with incomes up to 2.5 times poverty grew by 115%, whereas enrollment for those with incomes between 2.5 and 4 times poverty grew by 36%, and enrollment for those with incomes above 4 times poverty grew by 57%.

The Number of People Enrolled in Plans with Reduced Deductibles Has Nearly Doubled Since 2020

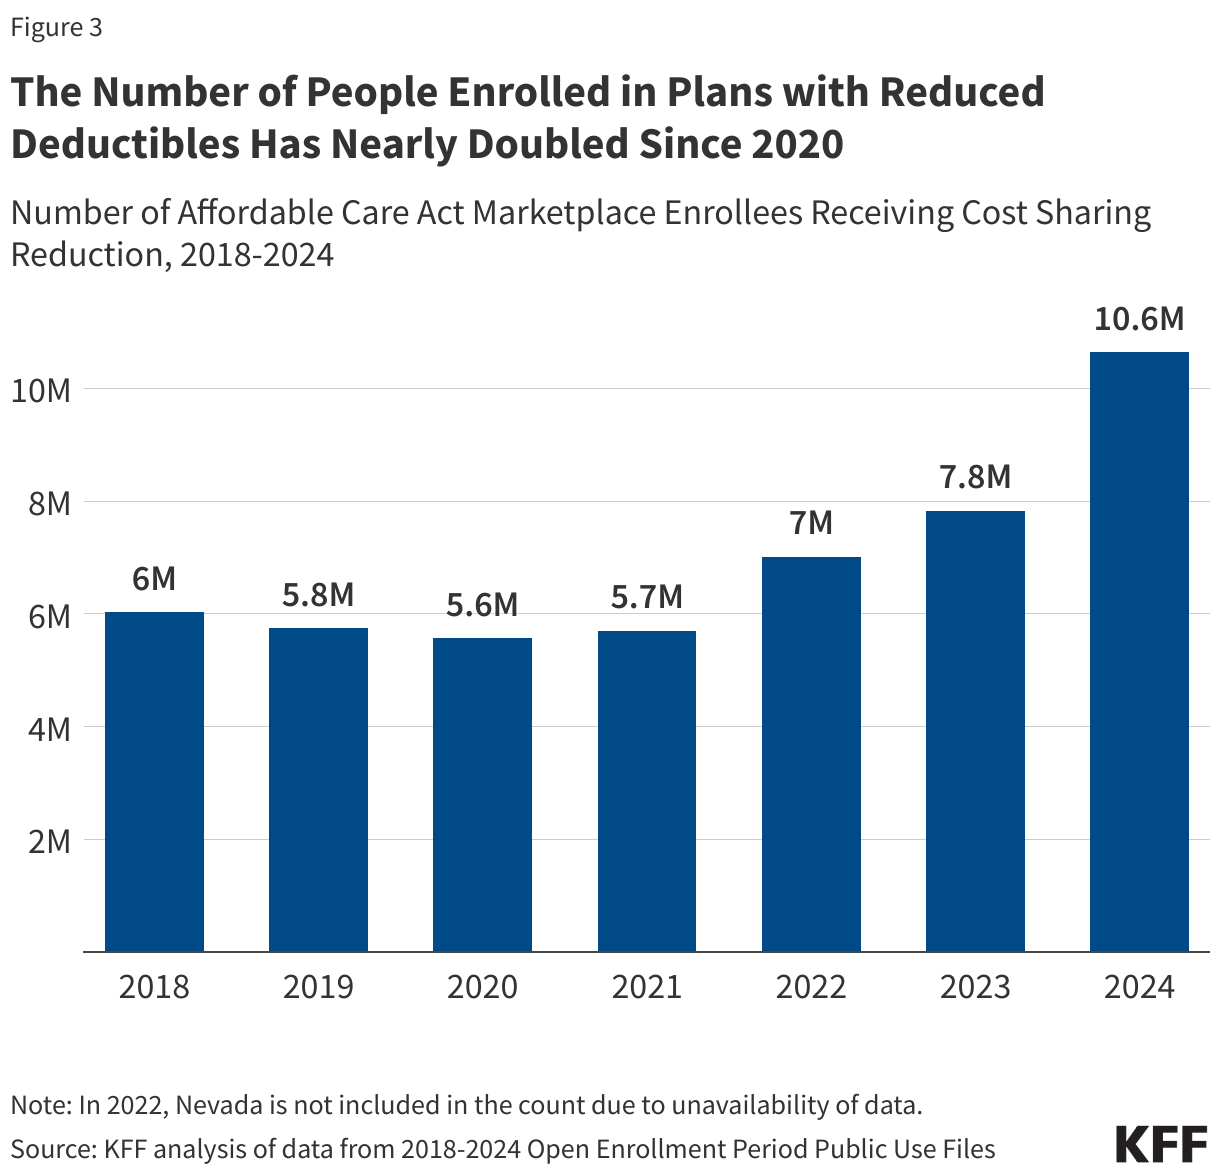
ACA Marketplace enrollees with incomes just above the federal poverty level (up to 2.5 times poverty) are eligible for cost sharing reductions (CSR) that reduce deductibles and other cost sharing. From 2020 to 2024, the number of enrollees receiving cost sharing reductions increased by 91% from 5.6 million to 10.6 million enrollees.

The Inflation Reduction Act’s enhanced subsidies make the reduced cost sharing plans more affordable. For example, $0 premium silver plans with very low deductibles are available to the lowest income enrollees (those with incomes up to 1.5 times poverty), whereas before the enhanced subsidies became available, these enrollees would have had to pay about 2%-4% of their household income for a plan with a reduced deductible.

Enhanced Subsidies from the Inflation Reduction Act Cut Premium Payments by 44%

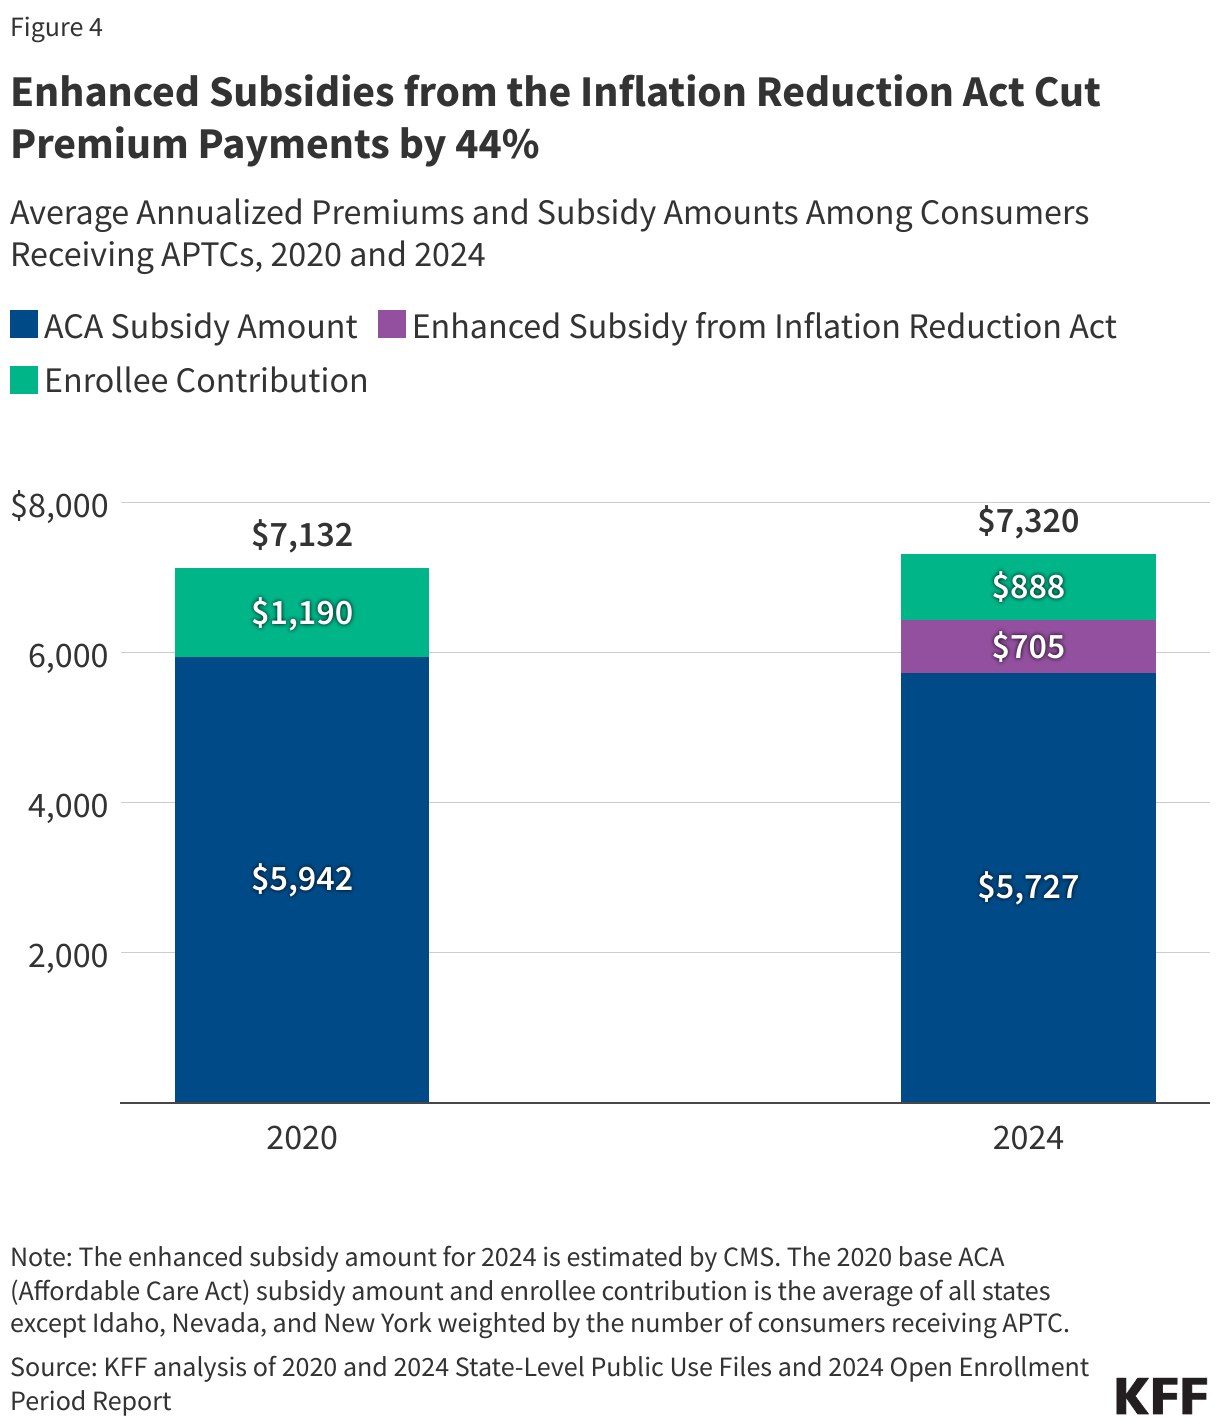
The enhanced subsidies in the Inflation Reduction Act reduce net premium costs by 44%, on average, for enrollees receiving premium tax credits, though the amount of savings varies by person. In 2024, the average annual premium payment would have been $1,593, but instead was $888 because of the Inflation Reduction Act subsidies, which average $705 per enrollee.

On average, the total annual premium is similar in 2024 ($7,320) to what it was in 2020 ($7,132), but the federal government is paying a larger share of the total premium (a subsidy of $6,432 or 88% of the average annual premium in 2024, compared to a subsidy of $5,942 dollars or 83% of the average annual premium in 2020).

Lower-Income Enrollees Would Experience the Steepest Premium Increases if Enhanced Subsidies Expire

Enhanced subsidies work by reducing the amount an enrollee has to pay for a benchmark silver plan. Under the Inflation Reduction Act, the amount of money enrollees are required to contribute toward their monthly silver premium varies by income, on a sliding scale with lower income enrollees paying as little as $0 and higher income enrollees paying as much as 8.5% of their household income.

Without enhanced subsidies, an enrollee making just above poverty would be required to pay around 2% of their income for a benchmark silver plan. With enhanced subsidies, however, most enrollees with incomes around the poverty level are eligible for zero-dollar benchmark silver plans. Similarly, without enhanced subsidies, an enrollee with an income just above 400% of the poverty level would have to pay full price for their monthly premium (because they would be ineligible for financial assistance), but with the enhanced subsidies, they pay no more than 8.5% of their household income.

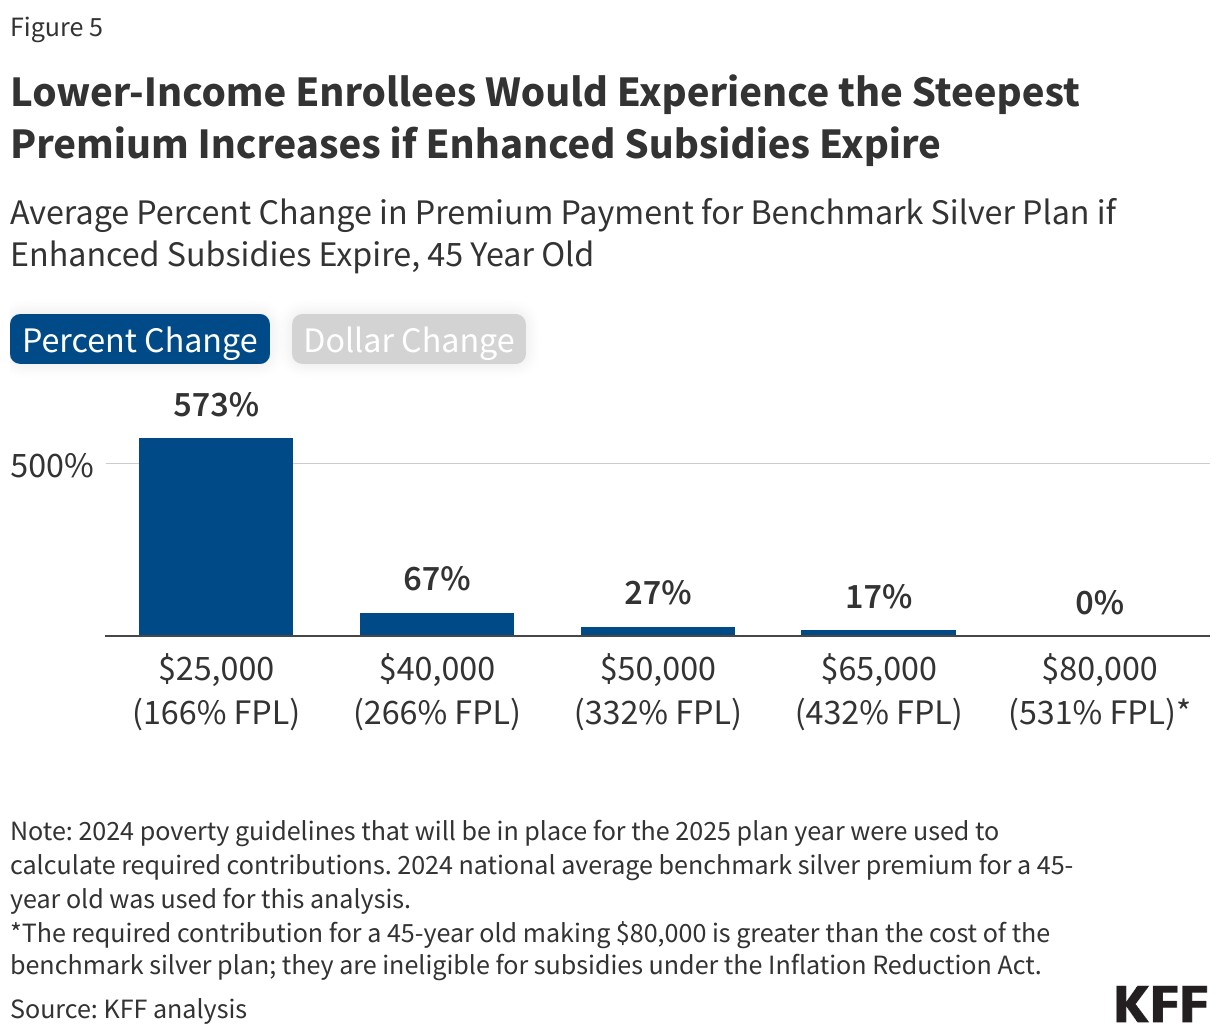
The chart above depicts the percent increase in premium payments for a 45-year-old buying a silver plan, if enhanced subsidies were to expire. (Because 2025 premiums and federal poverty guidelines are not yet available, the chart is based on 2024 premiums and poverty guidelines.)

Low-income enrollees would experience the steepest percent increase in their annual premium payments if enhanced subsidies were unavailable. A 45-year old enrollee making $25,000 (166% of poverty) would see their annual premium payments grow by an average of 573%, or $917, for a benchmark silver plan (an increase from $160 for the annual premium payment with enhanced subsidies to $1,077 without enhanced subsidies). Prior to the enhanced subsidies, enrollees making above 400% of poverty were ineligible for premium assistance. Without enhanced subsidies, a 45-year old individual making $65,000 (432% of poverty) would experience a premium increase of $941 annually from $5,525 to $6,466 (the full cost of the benchmark silver premium).

Middle-Income Enrollees Are At Risk of Losing Subsidized ACA Marketplace Coverage if Expanded Subsidies Expire

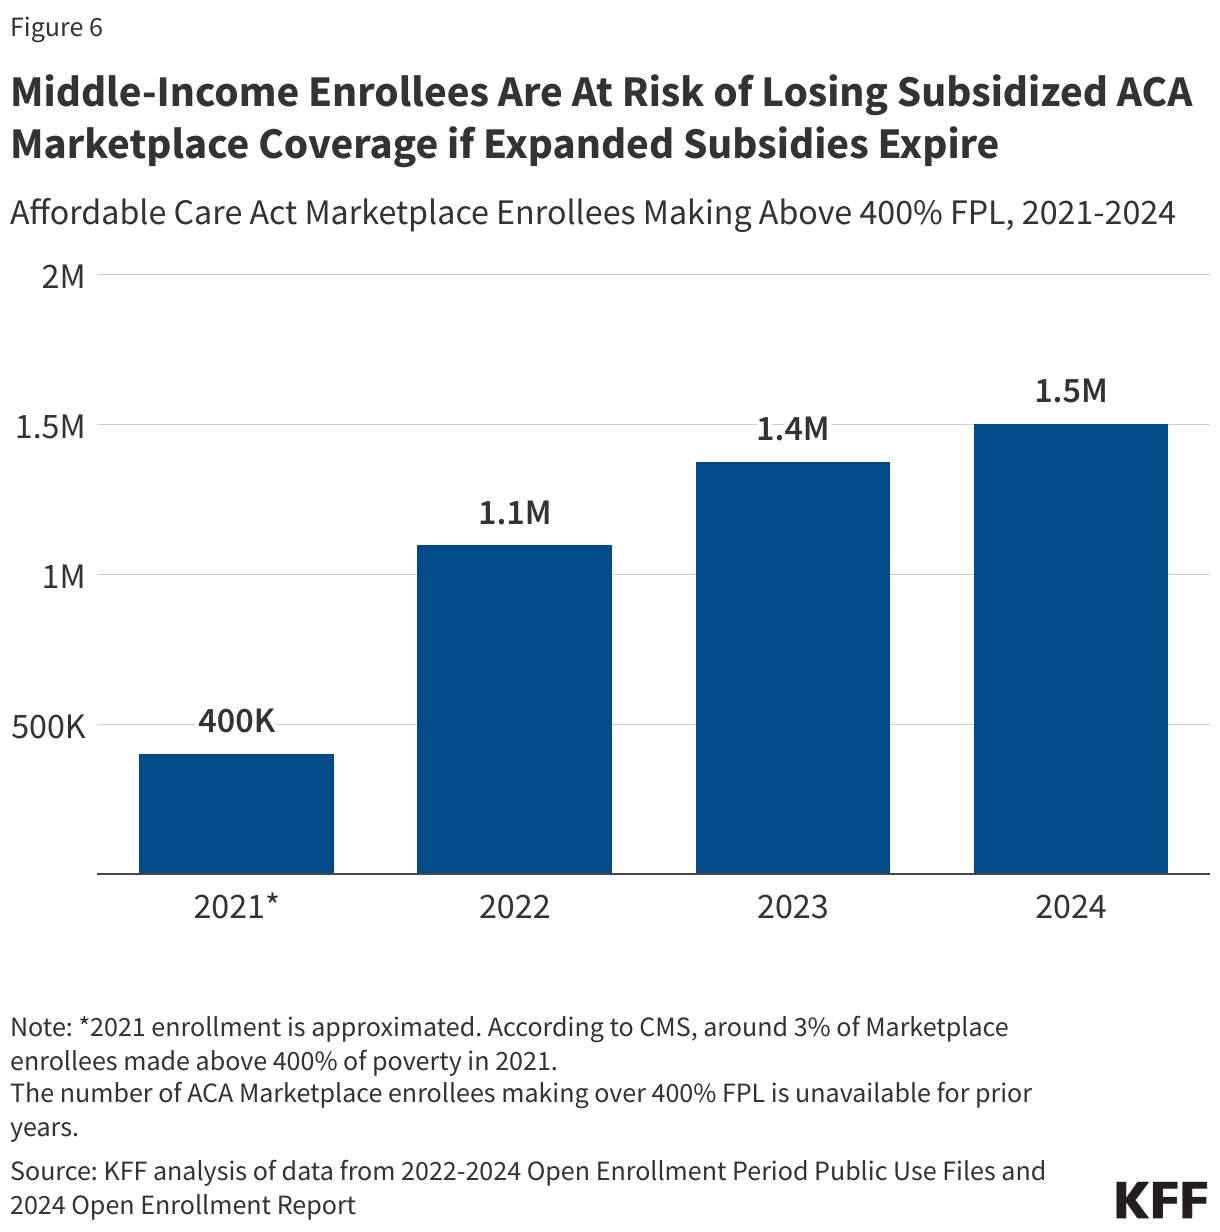
Prior to the ARPA and Inflation Reduction Act, individuals making above 400% of poverty were ineligible for ACA Marketplace premium subsidies and had to pay the full cost of monthly health insurance premiums. In 2024, CMS estimates that individuals making above four times poverty in HealthCare.gov states save an average of $4,248 annually due to the Inflation Reduction Act’s enhanced subsidies. Without the Inflation Reduction Act subsidies, middle income ACA Marketplace enrollees with incomes just above four times poverty would, in many cases, be priced out of health insurance coverage. The number of ACA Marketplace enrollees making above four times of poverty quadrupled from approximately 400 thousand in 2021 to 1.5 million in 2024.

Floridians and Texans Receive $2.2 and $1.5 Billion in Enhanced IRA Subsidies, Respectively, in 2024

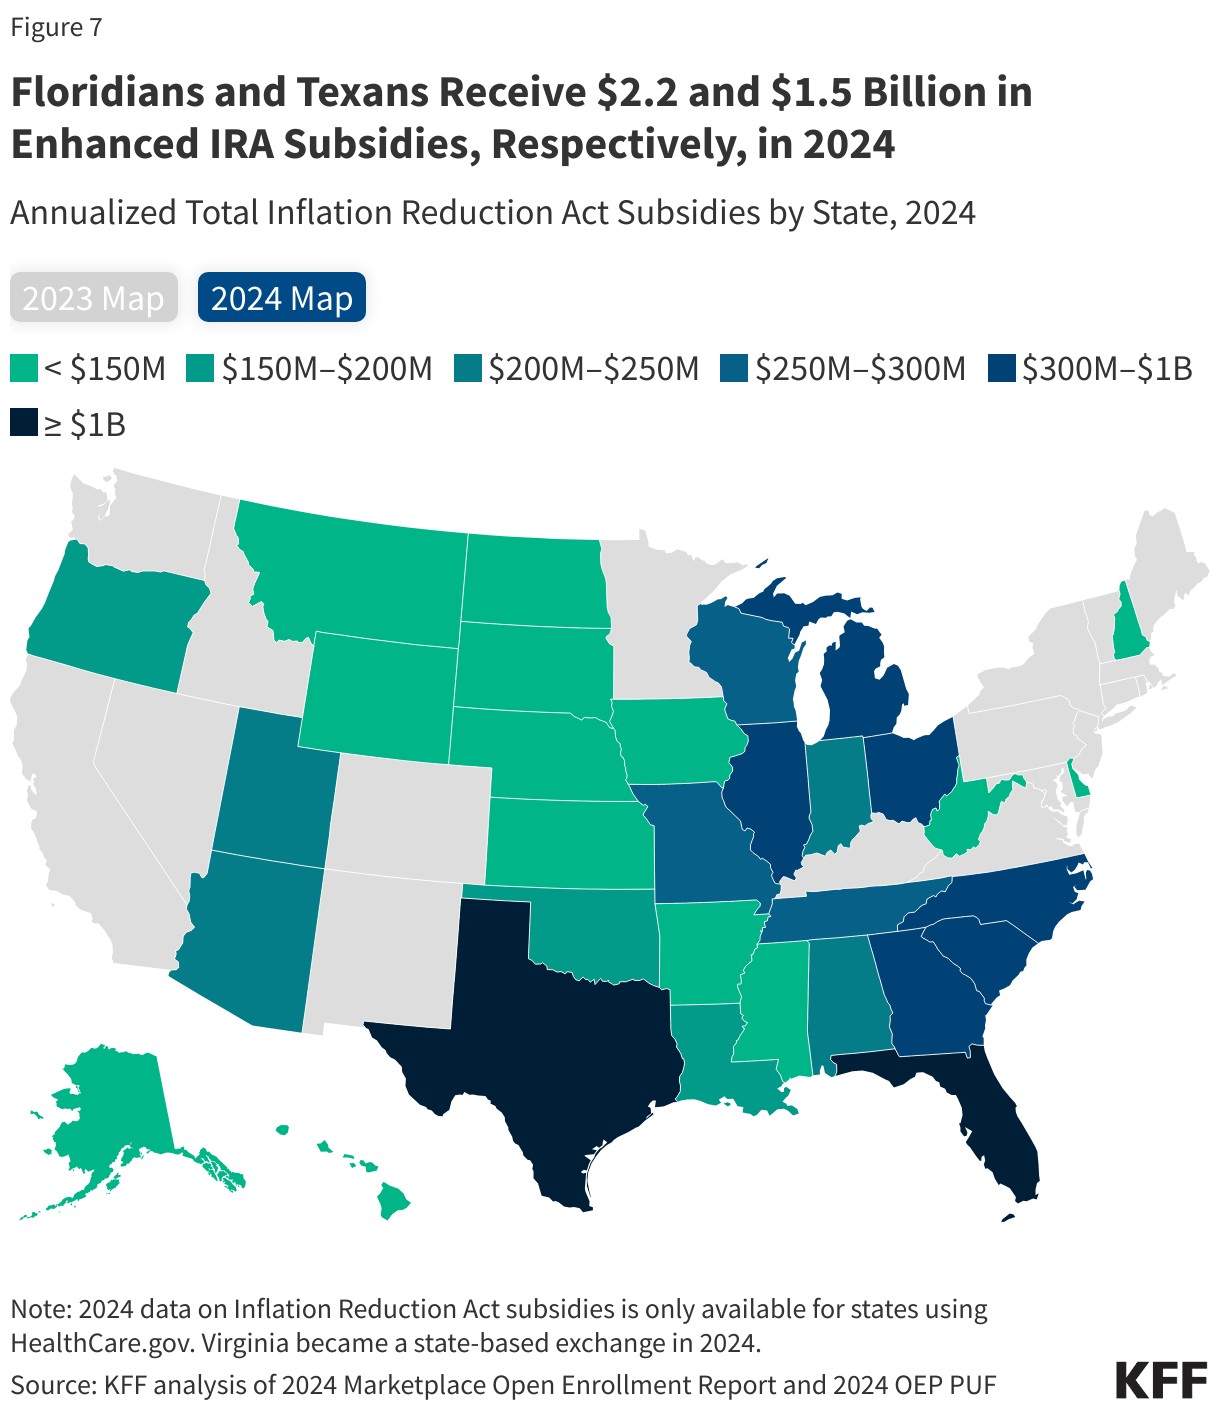
Inflation Reduction Act subsidies are available nationwide, but current data on the amount of the enhanced subsidies are only available in the 32 states that use Healthcare.gov. In these states, 15.5 million people are receiving an average of $624 per year in enhanced subsidies because of the Inflation Reduction Act. On an annual basis, this translates to nearly $10 billion in enhanced Inflation Reduction Act subsidies going to enrollees in these 32 states in 2024. Among states using Healthcare.gov, the majority (52%) of this federal funding is going to enrollees in Florida ($2.2 billion, or 22%), Texas ($1.5 billion, or 16%), Georgia and North Carolina ($660 million, or 7%, each). These are all high-population states, but also stand out because most have not expanded Medicaid, and therefore have more low-income residents who qualify for substantial ACA subsidies.

The Congressional Budget Office estimates that making enhanced subsidies permanent would result in an increase of $275 billion in direct outlays and a reduction in revenues of $60 billion, for a net impact of $335 billion on the federal budget over the 10-year period from 2025 to 2034. This amount reflects higher enrollment induced by the enhanced subsidies and projections of premium growth over time.

The Vast Majority of Marketplace Enrollees Will Experience Significant Increases in Their Monthly Premium Payments if Enhanced Subsidies Expire

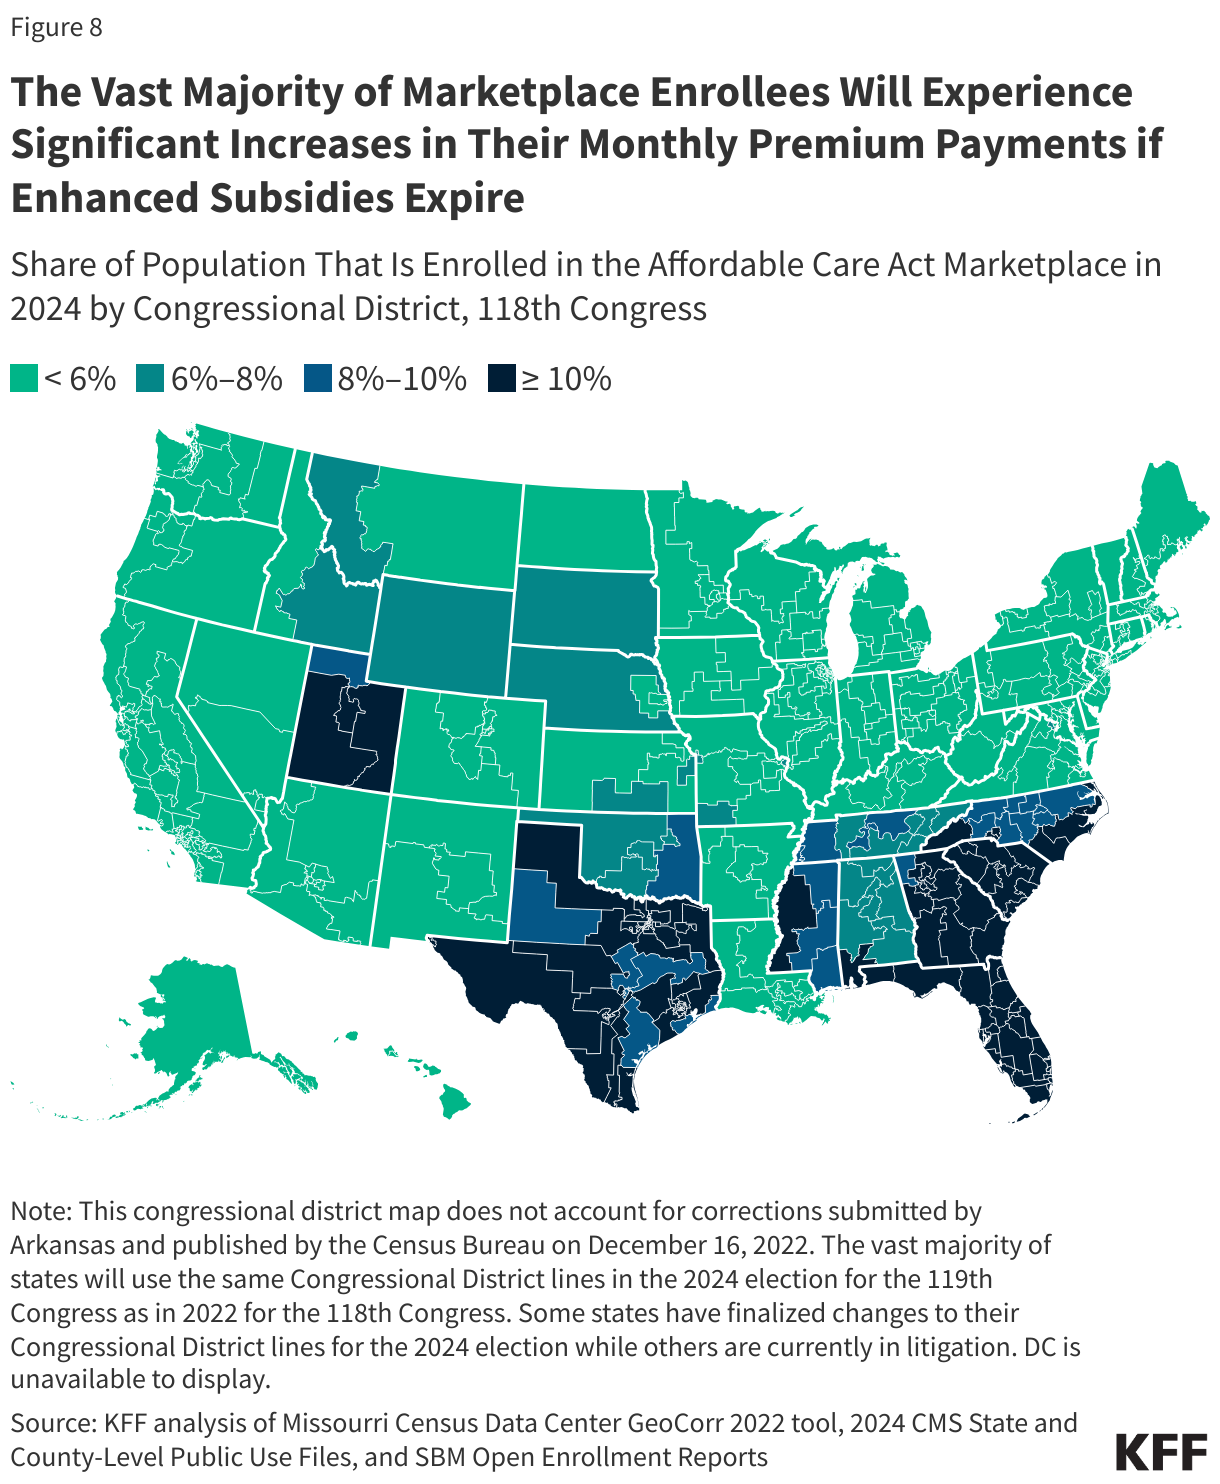
If the Inflation Reduction Act’s enhanced subsidies expire, the vast majority of ACA Marketplace enrollees will see their premium payments increase significantly in 2026.

The results of the 2024 elections will likely play a major role in whether enhanced subsidies are extended beyond 2025. The map above shows 2024 ACA Marketplace enrollment by congressional district in the 118th Congress. (Though some states have redrawn their congressional district lines ahead of the 2024 election for the 119th Congress, they remain the same for the majority of states as in the 2022 elections for the 118th Congress).

Generally, enrollment in Marketplace coverage by congressional district is largest in the South. At least 10% of the population is enrolled in ACA Marketplace plans throughout all congressional districts in Florida and South Carolina, along with most in Texas, Georgia, and Utah. In Florida, there are nine congressional districts where at least 20% of the population is enrolled in in a Marketplace plan.

Among States Using HealthCare.gov, Monthly Premium Payments Would At Least Double in 12 States If Enhanced Subsidies Expire

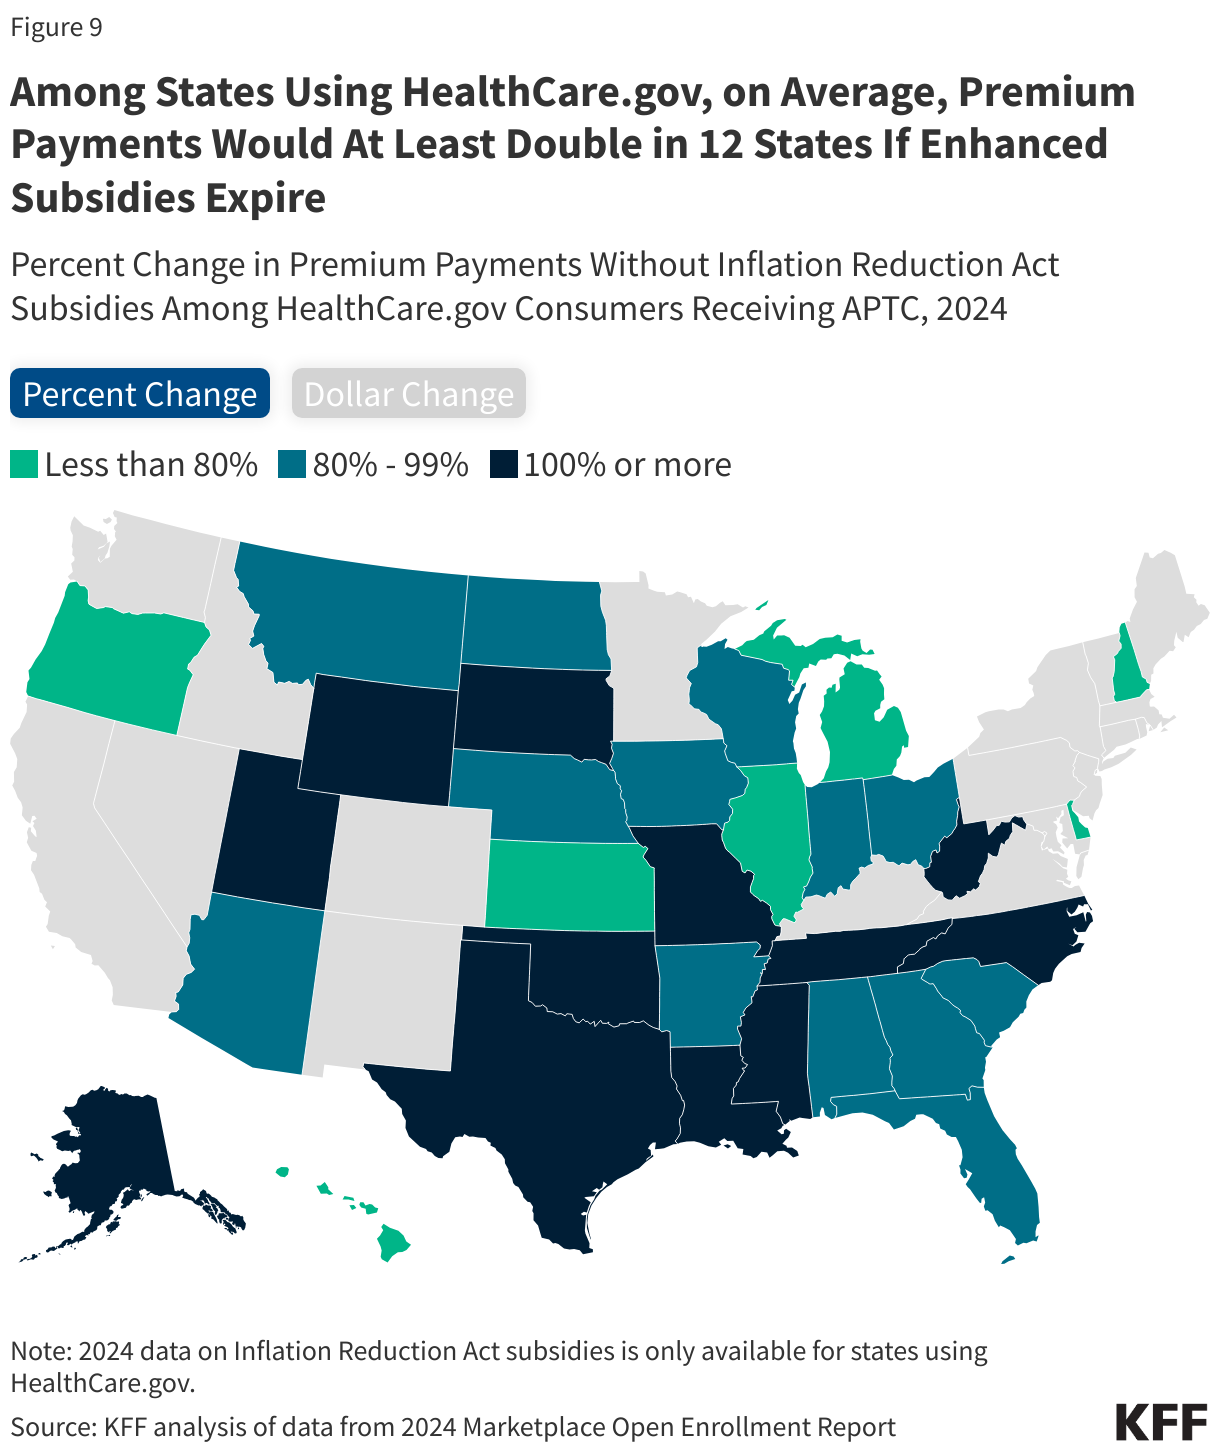
If the Inflation Reduction Act’s enhanced subsidies were to expire at the end of next year, the vast majority of ACA Marketplace enrollees would see significant increases in their premium payments. However, these increases would vary by state because of differences in the incomes and ages of people living in each state, as well as differences in the premiums charged by insurers in each state.

For subsidized enrollees in states using Healthcare.gov, premium payments average about $672 per year in 2024 ($56 per month). Without enhanced subsidies, the average annual premium payment would rise by 93% ($624) to $1,296.

Based on 2024 premiums, if these enhanced premium subsidies were to expire, subsidized Marketplace enrollees in at least 12 states would see their annual premium payments double or more, on average. As these data are only available in states using Healthcare.gov, there could be additional states that would see average premium payments double. Among states using Healthcare.gov, average annual premium payments for subsidized enrollees would grow the most in Wyoming (195%, or $1,872), Alaska (125%, or $1,836), and West Virginia (133%, or $1,404). In Texas, annual premium payments would increase by an average of 115%, or $456, for the 3.4 million people receiving premium tax credits, if these subsidies were to expire.

Insurers Will Need to Finalize 2026 Premium Rates by August of 2025

If enhanced subsidies expire, gains in Marketplace enrollment are projected to reverse and the health status of remaining enrollees may be sicker, on average, than it is with enhanced subsidies. If insurers expect to lose their healthier enrollees, they may raise premiums heading into 2026.

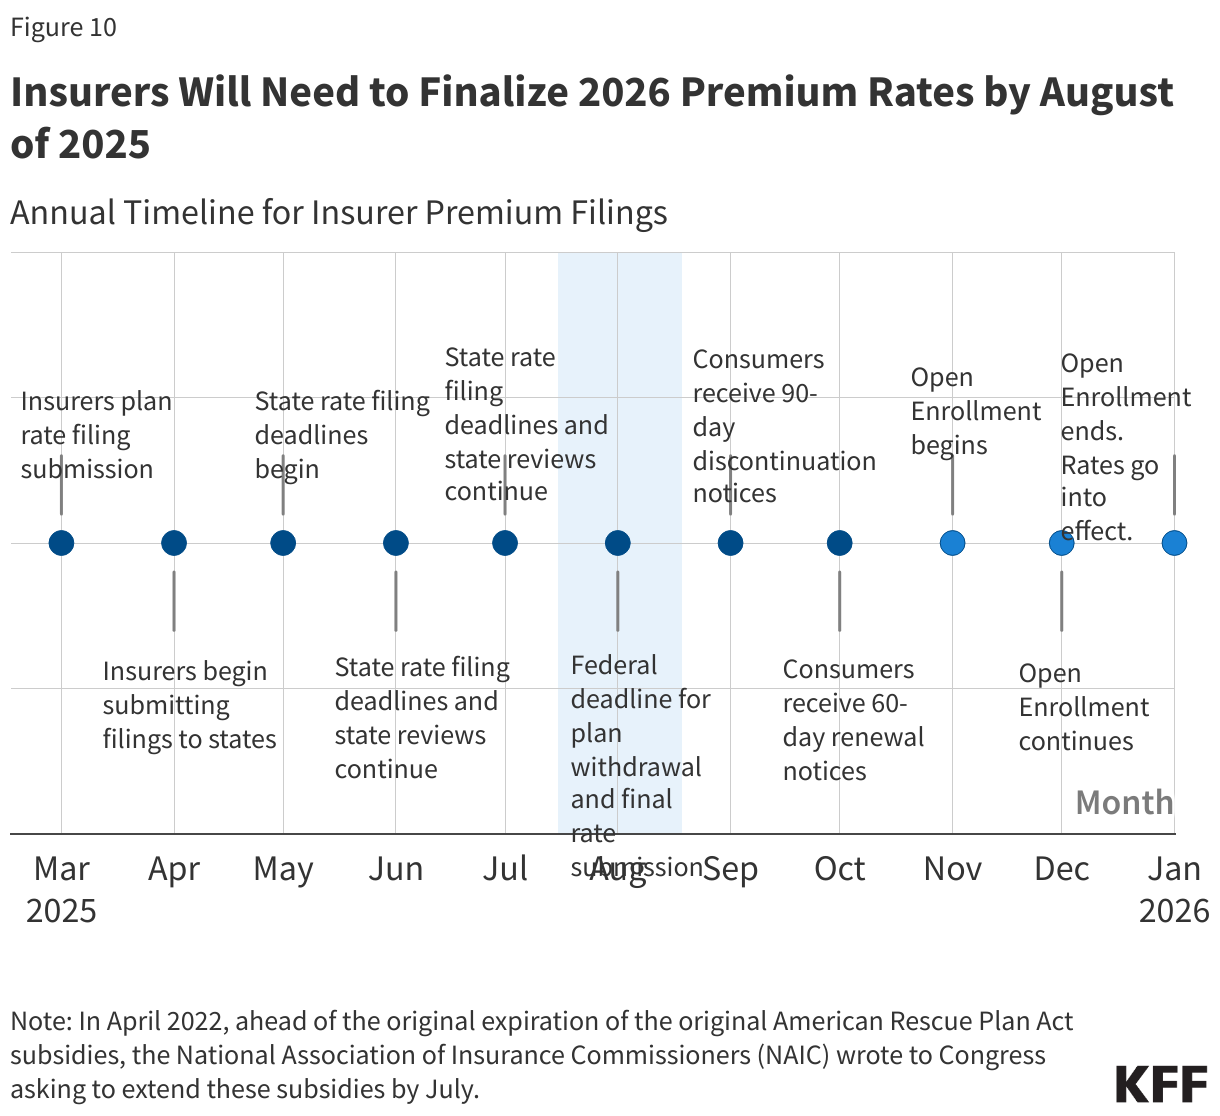
Every year, in early spring, insurers compile and then submit detailed rate filings proposing premium changes for the following year, for review by state regulators. Regulators evaluate insurer justifications for premium increases, provide feedback to the insurers, and request revisions or additional justifications as deemed necessary. This process stretches into the summer each year.

For the 2026 plan year, when the Inflation Reduction Act subsidies are set to expire, insurers will have to submit their proposed premiums and justifications in early 2025 and finalize their premiums by August 2025, in advance of the 2026 open enrollment period beginning November 1, 2025.

Because of this lengthy process, insurers and state and federal regulators will want to know whether enhanced subsidies will expire or be renewed well in advance of their expiration or renewal. In the leadup to the passage of the Inflation Reduction Act, uncertainty over whether the enhanced subsidies would be extended led some insurers to increase premiums. An April 2022 letter to Congress from the National Association of Insurance Commissioners and signed by regulators from Idaho, Missouri, Connecticut, and North Dakota urged Congress to “to act by July of this year to extend the enhanced premium tax credits beyond their current end date,” which, at the time, was the end of 2022.

Methods

Enrollee counts by income group for Figures 2 and 6 were taken or calculated from the CMS Open Enrollment period State-Level Public Use Files (PUFs) or the 2021 Open Enrollment report. Starting in 2022, enrollee counts in the State-Level PUF for individuals making below 100% and above 400% of poverty became available. In prior years, enrollee counts in the state-level PUF for people making below 100% of poverty, above 400% of poverty, or with unknown income were typically grouped together. For Figure 2, due to data limitations, enrollees with unknown incomes or making below 100% FPL are included in the “Above 400% FPL” category in 2018-2020. Individuals making below 100% FPL make up around 2% of total ACA Marketplace plan selections in 2024.

In Figure 2, the number of enrollees making below 100% of poverty in 2021 was approximated by multiplying the share of enrollees making below poverty level during the 2021 Open Enrollment period (found in the 2024 Open Enrollment report) by the 2021 national plan selection total. In Figure 2, the number of enrollees making above 400% of poverty for 2021 includes the number of consumers with other/unknown income subtracted by the approximated number of enrollees making below poverty. In Figure 2, due to unavailability of some states’ data, plan selections by income category in 2018-2021 do not sum to total national plan selections. In Figure 2, enrollees with other or unknown incomes (due to them not requesting financial assistance) are included in the “Above 400% FPL” category in 2022-2024.

2024 county-level plan selections were collected from a combination of the 2024 County-Level Public Use File from CMS, state open enrollment summary reports, or estimated by determining the share of plan selections by county for a given state in a prior year and applying this to the total state plan selection value from the CMS 2024 OEP State-Level Public Use File.

2024 plan selections were mapped onto the 118th Congressional District boundaries. To map county-level plan selections to the congressional district level, the Missouri Census Data Center Geocorr 2022 tool was used. For counties that corresponded to multiple congressional districts, an allocation factor was used to apportion plan selection enrollment. The vast majority of states will use the same Congressional District lines in the 2024 election for the 119th Congress as in 2022 for the 118th Congress. Some states have finalized changes to their Congressional District lines for the 2024 election while others are currently in litigation.

News Release

ACA Marketplace Enrollees Will See Steep Increases in Premium Payments in 2026 if Enhanced Subsidies Expire

Enrollees in 12 HealthCare.gov states would see their annual payments at least double on average without enhanced subsidies

Published: Jul 26, 2024

Without the enhanced subsidies in the Inflation Reduction Act (IRA), Affordable Care Act (ACA) Marketplace enrollees in 12 of the states that use HealthCare.gov would see their annual premium payments at least double on average, according to a new KFF analysis. Enrollees in three states would see the steepest annual increases: Wyoming (195% or $1,872), Alaska (125% or $1,836), and West Virginia (133% or $1,404), and premiums would rise by an average of 93% or $624 overall in HealthCare.gov states.

The results of the 2024 elections will likely play a major role in whether the enhanced subsidies are extended beyond 2025. Nationally, enhanced subsidies have cut premium payments by an estimated 44% ($705 annually) on average for people receiving a subsidy. If they expire, almost all subsidized ACA Marketplace enrollees, including those in state-run marketplaces, would experience steep increases in premium payments in 2026. Because enhanced subsidies have made Marketplace coverage more affordable for low- and middle-income people, they would be the most impacted by a potential subsidy expiration.

Enrollees with low incomes would see the greatest jump in their premium payments. For example, a 45-year-old enrollee earning $25,000 on average would pay 573% ($917) more annually for a benchmark silver plan (from $160 with enhanced subsidies to $1,077 without them).

The number of people with Marketplace coverage nearly doubled since the enhanced subsidies began in 2021, from 11.4 million in 2020 to 21.4 million in 2024. This enrollment growth has been concentrated among low-income individuals, spurred by the availability of low-cost (and in some cases, zero-premium) plans made available by the enhanced subsidies. Zero-premium plans are available to a larger share of ACA Marketplace enrollees in the 10 states that have not expanded Medicaid. Among states that use HealthCare.gov, enrollees in Florida and Texas received the most ($2.2 and $1.5 billion respectively) in enhanced IRA subsidies in 2024.

The Global HIV/AIDS Epidemic

Published: Jul 25, 2024

This fact sheet does not reflect recent changes that have been implemented by the Trump administration, including a foreign aid review and restructuring. For more information, see KFF’s Overview of President Trump’s Executive Actions on Global Health.

Key Facts

  • HIV, the virus that causes AIDS (acquired immunodeficiency syndrome), is one of the world’s most serious health and development challenges. Approximately 40 million people are currently living with HIV, and tens of millions of people have died of AIDS-related causes since the beginning of the epidemic.
  • Many people living with HIV or at risk for HIV infection do not have access to prevention, treatment, and care, and there is still no cure.
  • In recent decades, major global efforts have been mounted to address the epidemic, and despite challenges, significant progress has been made in addressing HIV. Current global health goals are to end AIDS as a public health threat by 2030.
  • The U.S. government (U.S.), through PEPFAR (the President’s Emergency Plan for AIDS Relief), is the single largest donor to international HIV efforts in the world, including the largest donor to the Global Fund to Fight AIDS, Tuberculosis and Malaria (Global Fund). PEPFAR, which now spans over 50 countries, has directed approximately $120 billion toward HIV prevention, care, and treatment efforts since it launched in 2003.

Global Response

HIV, the virus that causes AIDS (see box), has become one of the world’s most serious health and development challenges since the first cases were reported in 1981. Approximately 88 million people have become infected with HIV since the start of the epidemic.1  Today, there are approximately 40 million people currently living with HIV, and tens of millions of people have died of AIDS-related causes since the beginning of the epidemic.2  

HIV: A virus that is transmitted through certain body fluids and weakens the immune system by destroying cells that fight disease and infection, specifically CD4 cells (often called T cells). Left untreated, HIV reduces the number of CD4 cells in the body, making it more difficult for the immune system to fight off infections and other diseases. HIV can lead to the development of AIDS, “acquired immunodeficiency syndrome,” also known as Advanced HIV Disease.3 

AIDS: Advanced HIV Disease (AIDS), used to be seen as an issue of late diagnosis and treatment of HIV, and while that remains a concern, AIDS is now most common in people who have received treatment (antiretroviral therapy) but have stopped.4 

Over the past two decades in particular, major global efforts have been mounted to address the epidemic, and significant progress has been made. The number of people newly infected with HIV, especially children, and the number of AIDS-related deaths have declined over the years, and the number of people with HIV receiving treatment increased to 30.7 million in 2023.5 

Still, remaining challenges continue to complicate HIV control efforts. Many people living with HIV or at risk for HIV infection do not have access to prevention, treatment, and care, and there is still no cure. HIV primarily affects those in their most productive years, and it not only affects the health of individuals, but also impacts households, communities, and the development and economic growth of nations. Many of the countries hardest hit by HIV also face serious challenges due to other infectious diseases, food insecurity, and additional global health and development problems.

Latest Estimates6 

  • Global prevalence among adults (the percent of people ages 15-49 who are infected) has leveled since 2001 and was 0.8% in 2023, though prevalence was higher for certain groups of people, including women and girls and key populations (i.e., men who have sex with men, sex workers, people who inject drugs, transgender people, and people in prisons).
  • There were 40 million people living with HIV in 2023, up from 32 million in 2010, the result of continuing new infections and people living longer with HIV. Of the people living with HIV in 2023, 38.6 million were adults and 1.4 million were children under age 15.
  • Although HIV testing capacity has increased over time, enabling more people to learn their HIV status, about one in seven people with HIV (14%) are still unaware they are infected.
  • While there have been significant declines in new infections since the mid-1990s, there were still about 1.3 million new infections in 2023, or about 3,500 new infections per day. The pace of decline varies by age group, sex, race, and region, and progress is unequal within and between countries. 7 
  • HIV remains a leading cause of death worldwide and the leading cause of death globally among women of reproductive age.8  However, AIDS-related deaths have declined, due in part to antiretroviral treatment (ART) scale-up. 630,000 people died of AIDS in 2023, a 51% decrease from 1.3 million in 2010 and a 69% decrease from the peak of 2.0 million in 2004.
  • Sub-Saharan Africa,9  home to approximately two-thirds of all people living with HIV globally, is the hardest hit region in the world, followed by Asia and the Pacific. Latin America, Western and Central Europe and North America, as well as Eastern Europe and Central Asia are also heavily affected. In 2023, however – for the first time in the history of the epidemic – there were more new HIV infections outside of sub-Saharan Africa than within the region.10 

Affected/Vulnerable Populations

  • Most HIV infections are transmitted heterosexually, although risk factors vary. In some countries, men who have sex with men, people who inject drugs, sex workers, transgender people, and prisoners are disproportionally affected by HIV.
  • Women and girls represent over half (53%) of all people living with HIV worldwide, and HIV (along with complications related to pregnancy) is the leading cause of death among women of reproductive age.11  Gender inequalities, differential access to service, and sexual violence increase women’s vulnerability to HIV, and women, especially younger women, are biologically more susceptible to HIV. In many countries in sub-Saharan Africa, HIV incidence among adolescent girls and young women ages 15-24 is more than three times that among adolescent boys and young men.
  • Young people in particular face barriers to accessing HIV and sexual and reproductive health services, including age-appropriate comprehensive sexuality education. Over a third (36%) of older adolescents, ages 15-19 years, living with HIV were not on treatment in 2023.
  • Globally, in 2023, children accounted for 1.4 million people living with HIV; among children, there were 76,000 AIDS-related deaths and 120,000 new infections, the lowest number of new infections in children since the 1980s. Since 2010, new HIV infections among children have declined by 62%.

HIV & TB

HIV has led to a resurgence of tuberculosis (TB), particularly in Africa, and TB is a leading cause of death for people with HIV worldwide.12  In 2022, approximately 6% of new TB cases occurred in people living with HIV.13  However, between 2010 and 2022, TB deaths in people living with HIV declined substantially, largely due to the scale-up of joint HIV/TB services. 14   (See the KFF fact sheet on TB.)

Prevention and Treatment15 

Numerous prevention interventions exist to combat HIV, and new tools such as vaccines, are currently being researched.16 

  • Effective prevention strategies include behavior change programs, condoms, HIV testing, blood supply safety, harm reduction efforts for injecting drug users, and male circumcision.
  • Additionally, recent research has shown that engagement in HIV treatment not only improves individual health outcomes but also significantly reduces the risk of transmission (referred to as “treatment as prevention” or TasP). Those with undetectable viral loads (known as being virally suppressed) have effectively no risk of transmitting HIV sexually.17 
  • Pre-exposure prophylaxis (PrEP) has also been shown to be an effective HIV prevention strategy in individuals at high risk for HIV infection. In 2015, the World Health Organization (WHO) recommended PrEP as a form of prevention for high-risk individuals in combination with other prevention methods.18  Further, in 2016, the U.N. Political Declaration on HIV/AIDS stated PrEP research and development should be accelerated, and in 2022, WHO released new guidelines for the use of long-acting PrEP.19 
  • Experts recommend that prevention be based on “knowing your epidemic” (tailoring prevention to the local context and epidemiology), using a combination of prevention strategies, bringing programs to scale, and sustaining efforts over time. Access to prevention, however, remains unequal, and there have been renewed calls for the strengthening of prevention efforts.20 

HIV treatment includes the use of combination antiretroviral therapy (ART) to attack the virus itself, and medications to prevent and treat the many opportunistic infections that can occur when the immune system is compromised by HIV. In light of research findings, WHO released a guideline in 2015 recommending starting HIV treatment earlier in the course of illness.21  Further, research on long-acting ART is currently underway.22 

  • Combination ART, first introduced in 1996, has led to dramatic reductions in morbidity and mortality, and access has increased in recent years, rising to 30.7 million people (77% of people living with HIV) in 2023.
  • The percentage of pregnant and breastfeeding women receiving ART for the prevention of mother-to-child transmission of HIV increased to 84% in 2023, up from 49% in 2010.
  • While access to ART among children has increased, treatment gaps still remain, and children are less likely than adults to receive ART; treatment coverage in children was 57% compared to 77% among adults in 2023.
  • Approximately 72% of all people living with HIV are virally suppressed, which means they are likely healthier and less likely to transmit the virus. Viral suppression varies greatly by region, key population, age, and sex.

Global Goals

International efforts to combat HIV began in the first decade of the epidemic with the creation of the WHO’s Global Programme on AIDS in 1987. Over time, new initiatives and financing mechanisms have helped increase attention to HIV and contributed to efforts to achieve global goals; these include:

  • the Joint United Nations Programme on HIV/AIDS (UNAIDS), which was formed in 1996 to serve as the U.N. system’s coordinating body and to help galvanize worldwide attention to HIV/AIDS; and
  • the Global Fund to Fight AIDS, Tuberculosis and Malaria (Global Fund), which was established in 2001 by a U.N. General Assembly Special Session (UNGASS) on HIV/AIDS as an independent, international financing institution that provides grants to countries to address HIV, TB, and malaria (see the KFF fact sheet on the Global Fund).

The contributions of affected country governments and civil society have also been critical to the response. These and other efforts work toward achieving major global HIV/AIDS goals that have been set through:

  • the Sustainable Development Goals (SDGs). Adopted in 2015, the SDGs aim to “end the AIDS epidemic,” or end AIDS as a public health threat, 23  by 2030 under SDG Goal 3, which is to “ensure healthy lives and promote well-being for all at all ages.” 24 
  • UNAIDS targets to end the epidemic by 2030. On World AIDS Day 2014, UNAIDS set targets aimed at ending the AIDS epidemic by 2030. To achieve this, countries are working toward reaching the interim “95-95-95” targets—95% of people living with HIV knowing their HIV status; 95% of people who know their HIV positive status on treatment; and 95% of people on treatment with suppressed viral loads—by 2025.25  These targets are successors to the earlier 90-90-90 targets for 2020, which were missed.26  Based on the 2023 data and trends (the latest data available),27  86% of people living with HIV knew their status; among those who knew their status, 89% were accessing treatment; and among those accessing treatment, 93% were virally suppressed.28  Additional interim “95-95-95” targets have also been set for 2025, which place a greater emphasis on social services and reducing stigma and discrimination to address inequalities that hinder the HIV response.29 

Over the past decade, world leaders reaffirmed commitments to end AIDS by 203030  and adopted a Political Declaration with global commitments and targets for 2025 to address inequalities that impede the AIDS response.31 

Global Resources

UNAIDS estimates that $22.1 billion was available from all sources (domestic, donor governments, multilaterals, and foundations) to address HIV in low- and middle-income countries in 2023.32  Of this, donor governments provided $7.9 billion (see Figure 1).33  Other governments and organizations that contribute substantially to funding the global response include:

  •  hard-hit countries, which have also provided resources to address their epidemics;
  • the Global Fund, which has approved over $27 billion for HIV efforts in more than 100 countries to date;34  and
  • the private sector, including foundations and corporations, which also plays a major role (the Gates Foundation, for one, has committed more than $3 billion in HIV grants to organizations addressing the epidemic, as well as provided additional funding to the Global Fund).35 
HIV Funding from Donor Governments, 2002-2023

Looking ahead, UNAIDS estimates at least $29.3 billion annually will be needed by 2025 to meet global targets to end AIDS as a global public health threat by 2030.36 

U.S. Government Efforts

The U.S. government (U.S.) has been involved in HIV efforts since the 1980s and, today, is the single largest donor to international HIV efforts in the world, including the largest donor to the Global Fund.37  The U.S. first provided funding to address the global HIV epidemic in 1986. U.S. efforts and funding increased slowly over time through targeted initiatives to address HIV in certain countries in Africa, South Asia, and the Caribbean, but they intensified with the 2003 launch of the President’s Emergency Plan for AIDS Relief (PEPFAR), which brought significant new attention and funding to address the global HIV epidemic, as well as TB and malaria.38 

PEPFAR

Created in 2003, PEPFAR is the U.S. government’s global effort to combat HIV. As an interagency initiative, PEPFAR involves multiple U.S. departments, agencies, and programs that address the global epidemic, and it is carried out in close coordination with host country governments and other organizations, including multilateral organizations such as the Global Fund and UNAIDS.39  Collectively, U.S. bilateral activities span more than 50 countries, including countries reached through regional programs in Asia, West Africa, and the Western Hemisphere, with U.S. support for multilateral efforts reaching additional countries.40  (For more information, see the KFF fact sheet on PEPFAR.)

Since its creation, PEPFAR funding, which includes all bilateral funding for HIV as well as U.S. contributions to the Global Fund and UNAIDS, has totaled approximately $120 billion.41  For FY 2024, Congress appropriated $4.8 billion for bilateral HIV, as well as $50 million for UNAIDS and $1.65 billion for the Global Fund, totaling $6.5 billion.42  (For more details on historical appropriations for U.S. global HIV/AIDS efforts, see the KFF fact sheets on the U.S. Global Health Budget: Global HIV, Including PEPFAR and the U.S. Global Health Budget: The Global Fund, as well as the KFF budget tracker.)

  1. UNAIDS, Global HIV statistics 2024 fact sheet; July 2024. ↩︎
  2. UNAIDS, 2024 Global AIDS Update: The urgency of now – AIDS at the crossroads; July 2024. UNAIDS, AIDSinfo website; accessed July 2024, available at: http://aidsinfo.unaids.org/. UNAIDS, 2024 Core epidemiology slides; July 2024. ↩︎
  3. AIDS is the last and most severe stage of HIV infection, during which the immune system is so weak that people with AIDS acquire an increasing amount of severe illnesses. CDC HIV Website, https://www.cdc.gov/hiv/about/. ↩︎
  4. UNAIDS, 2024 Global AIDS Update: The urgency of now – AIDS at the crossroads; July 2024. ↩︎
  5. UNAIDS, Global HIV statistics 2024 fact sheet; July 2024. ↩︎
  6. UNAIDS, 2024 Global AIDS Update: The urgency of now – AIDS at the crossroads; July 2024. UNAIDS, AIDSinfo website; accessed July 2024, http://aidsinfo.unaids.org/. UNAIDS, 2024 Core epidemiology slides; July 2024. UNAIDS, Global HIV statistics 2024 fact sheet; July 2024; UNAIDS, UNAIDS data 2024; July 2024. ↩︎
  7. UNAIDS, 2024 Global AIDS Update: The urgency of now – AIDS at the crossroads; July 2024. ↩︎
  8. UNAIDS, Women and HIV – A spotlight on adolescent girls and young women; March 2019. ↩︎
  9. Sub-Saharan Africa constitutes as East and Southern Africa and West and Central Africa. ↩︎
  10. UNAIDS, 2024 Global AIDS Update: The urgency of now – AIDS at the crossroads; July 2024. UNAIDS, AIDSinfo website; accessed July 2024, http://aidsinfo.unaids.org/. UNAIDS, Global HIV statistics 2024 fact sheet; July 2024. ↩︎
  11. UNAIDS, 2024 Global AIDS Update: The urgency of now – AIDS at the crossroads; July 2024. UNAIDS, Global HIV statistics 2024 fact sheet; July 2024. UNAIDS, UNAIDS 2016-2021 Strategy; Aug. 2015. ↩︎
  12. WHO, Tuberculosis, fact sheet, https://www.who.int/news-room/fact-sheets/detail/tuberculosis. ↩︎
  13. WHO, Global Tuberculosis Report 2023; 2023. ↩︎
  14. WHO, Global Tuberculosis Report 2023; 2023. ↩︎
  15. UNAIDS, 2024 Global AIDS Update: The urgency of now – AIDS at the crossroads; July 2024. UNAIDS, AIDSinfo website; accessed July 2024, http://aidsinfo.unaids.org/. UNAIDS, 2024 Core epidemiology slides; July 2024. UNAIDS, Global HIV statistics 2024 fact sheet; July 2024; UNAIDS, UNAIDS data 2024; July 2024. ↩︎
  16. UNAIDS, Get on the Fast Track; 2016. Global HIV Prevention Working Group, Behavior Change for HIV Prevention: (Re) Considerations for the 21st Century; Aug. 2008. WHO, WHO recommends long-acting cabotegravir for HIV prevention, July 2022. ↩︎
  17. UNAIDS, UNAIDS Explainer: Undetectable = untransmittable; July 2018. ↩︎
  18. WHO, Guideline on When to Start antiretroviral Therapy and on Pre-Exposure Prophylaxis for HIV; Sept. 2015. WHO, WHO expands recommendation on oral pre-exposure prophylaxis of HIV infection (PrEP); Nov. 2015. ↩︎
  19. United Nations, Political Declaration on HIV and AIDS: On the Fast-Track to Accelerate the Fight Against HIV and to End the AIDS Epidemic by 2030; June 8, 2016. WHO, WHO recommends long-acting cabotegravir for HIV prevention, July 2022. ↩︎
  20. UNAIDS, 2024 Global AIDS Update: The urgency of now – AIDS at the crossroads; July 2024. United Nations, Reinvigorating the AIDS response to catalyse sustainable development and United Nations reform: Report of the Secretary-General; June 2017. ↩︎
  21. UNAIDS, Get on the Fast Track; 2016. WHO, Guideline on When to Start antiretroviral Therapy and on Pre-Exposure Prophylaxis for HIV; September 2015. WHO, Press Release: NIAID START Trial confirms that immediate treatment of HIV with antiretroviral drugs (ARVs) protects the health of people living with HIV; May 28, 2015. NIAID, Starting Antiretroviral Treatment Early Improves Outcomes for HIV-Infected Individuals; May 27, 2015. ↩︎
  22. NIH, News release: Long-acting HIV treatment demonstrates efficacy in people with challenges taking daily medicine as prescribed, February 21, 2024. ↩︎
  23. UNAIDS states that endings AIDS as a public health threat requires a 90% reduction in HIV incidence and mortality by 2030, compared to 2010. UNAIDS, Fast-Track: ending the AIDS epidemic by 2030; 2014. ↩︎
  24. United Nations, Transforming our world: the 2030 Agenda for Sustainable Development; 2015. ↩︎
  25. UNAIDS, Fast-Track: ending the AIDS epidemic by 2030; 2014. ↩︎
  26. These goals and targets were reiterated in the UNAIDS 2016-2021 Strategy, which also aligns with the SDGs. UNAIDS, Fast-Track: ending the AIDS epidemic by 2030; 2014. UNAIDS, UNAIDS 2016-2021 Strategy; Aug. 2015. ↩︎
  27. UNAIDS, 2024 Global AIDS Update: The urgency of now – AIDS at the crossroads; July 2024. See also KFF Dashboard: Progress Toward Global HIV Targets in PEPFAR Countries, September 2023. ↩︎
  28. UNAIDS, Global HIV statistics 2024 fact sheet; July 2024. ↩︎
  29. UNAIDS, Press Release: UNAIDS calls on countries to step up global action and proposes bold new HIV targets for 2025; November 26, 2020. UNAIDS, “2025 AIDS Targets,” webpage, https://aidstargets2025.unaids.org/#. UNAIDS, World AIDS Day Report 2020: Prevailing Against Pandemics by Putting People at the Centre; November 2020. ↩︎
  30. The 2016 U.N. General Assembly High-Level Meeting on Ending AIDS reaffirmed commitments made in the 2001 Declaration of Commitment on HIV/AIDS and the 2006 and 2011 political declarations on HIV/AIDS. UNAIDS, Declaration of Commitment on HIV/AIDS; 2001, https://www.unaids.org/sites/default/files/sub_landing/files/aidsdeclaration_en_0.pdf. UNAIDS, 2006 Political Declaration on HIV/AIDS; 2006, https://www.unaids.org/sites/default/files/sub_landing/files/20060615_hlm_politicaldeclaration_ares60262_en_0.pdf. UNAIDS, 2011 Political Declaration on HIV/AIDS; 2011, http://www.unaids.org/en/aboutunaids/unitednationsdeclarationsandgoals/2011highlevelmeetingonaids/. United Nations, 2016 Political Declaration on HIV and AIDS; 2016, https://www.unaids.org/sites/default/files/media_asset/2016-political-declaration-HIV-AIDS_en.pdf. UNAIDS, Press Release: Bold Commitments to Action Made at the United Nations General Assembly High-Level Meeting on Ending AIDS; June 10, 2016. UNAIDS, Reinvigorating the AIDS response to catalyse sustainable development and United Nations reform; 2017. ↩︎
  31. These commitments and targets align with the more recent UNAIDS 2021-2026 Global AIDS Strategy, which is focused on reducing inequalities. UNAIDS, Global AIDS Strategy 2021-2026 – Ending Inequalities. End AIDS.; March 2021. United Nations, Political Declaration on HIV and AIDS: Ending Inequalities and Getting on Track to End AIDS by 2030; June 2021. UNAIDS, Press release: United Nations High-Level Meeting on AIDS draws to a close with a strong political declaration and bold new targets to be met by 2025; June 2021. ↩︎
  32. UNAIDS estimates that US$19.8 billion was available for HIV from all sources (domestic resources, donor governments, multilaterals, and philanthropic organizations) in 2023, expressed in 2019 USD. For purposes of this fact sheet, this estimate was converted to 2022 USD, or $22.1 billion. KFF/UNAIDS, Donor Government Funding for HIV in Low- and Middle-Income Countries in 2023; July 2024. ↩︎
  33. KFF/UNAIDS, Donor Government Funding for HIV in Low- and Middle-Income Countries in 2023; July 2024. ↩︎
  34. Global Fund, The Global Fund Data Explorer, accessed September 2023, https://data.theglobalfund.org. ↩︎
  35. Bill & Melinda Gates Foundation, HIV Strategy Overview, accessed July 2024, http://www.gatesfoundation.org/What-We-Do/Global-Health/HIV#OurStrategy. ↩︎
  36. KFF/UNAIDS, Donor Government Funding for HIV in Low- and Middle-Income Countries in 2023; July 2024. UNAIDS, 2024 Global AIDS Update: The urgency of now – AIDS at the crossroads; July 2024. ↩︎
  37. KFF analysis of data from the Office of Management and Budget, Agency Congressional Budget Justifications, and Congressional Appropriations Bills. KFF/UNAIDS, Donor Government Funding for HIV in Low- and Middle-Income Countries in 2023; July 2024. ↩︎
  38. U.S. Congress, P.L. 108-25, May 27, 2003. KFF analysis of data from the Office of Management and Budget, Agency Congressional Budget Justifications, and Congressional Appropriations Bills. ↩︎
  39. KFF, The U.S. Government and Global Health, Sep. 2022. CRS, PEPFAR Reauthorization: Key Policy Debates and Changes to U.S. International HIV/AIDS, Tuberculosis, Malaria and Programs and Funding; Jan. 2009. ↩︎
  40. KFF analysis of data from congressional budget justification documents; PEPFAR, “Where We Work” webpage, https://www.state.gov/where-we-work-pepfar/; PEPFAR 2024 Country Operational Plan Guidance for all PEPFAR Countries; and CDC’s “Where We Work” webpage, https://www.cdc.gov/global-hiv-tb/php/where-we-work/. ↩︎
  41. KFF analysis of data from the Office of Management and Budget, Agency Congressional Budget Justifications, and Congressional Appropriations Bills. Totals include funding for bilateral HIV and contributions to multilateral organizations (specifically, the Global Fund and UNAIDS). ↩︎
  42. Totals represent funding specified by Congress in annual appropriations bills and/or identified by agencies for the Department of State, USAID, CDC, and DoD. In addition, international HIV research activities are supported by the NIH Office of AIDS Research (OAR) through its annual appropriated budget, but these amounts are not considered part of PEPFAR. See KFF’s “Breaking Down the U.S. Global Health Budget by Program Area” for additional information. ↩︎

VOLUME 4

Pfizer Lawsuit and Debunked Study Undermine COVID-19 Vaccine Recommendations

This is Irving Washington and Hagere Yilma. We direct KFF’s Health Misinformation and Trust Initiative and on behalf of all of our colleagues across KFF who work on misinformation and trust we are pleased to bring you this edition of our bi-weekly Monitor.

Note: Our next issue of the Monitor, which will be a special edition focused on the intersection of health misinformation and artificial intelligence, will be published on August 22.


Summary

In this Monitor, we explore how ongoing misinformation about the safety and efficacy of COVID-19 vaccines may affect the acceptance of new vaccine recommendations. First, we examine the false and misleading claims underlying the Kansas Attorney General’s lawsuit against Pfizer. We also discuss the CDC’s most recent vaccine recommendations and the resurfacing of a debunked study that has revived vaccine safety claims.


What “Death Panels” Can Teach Us About Health Misinformation

In last week’s “Beyond the Data” column, KFF’s CEO, Dr. Drew Altman, emphasizes how a lot of health misinformation often isn’t seen by many people on social media, but it can significantly impact the public when amplified by political figures and the news media, creating a cycle of misinformation that is difficult to break.


Emerging Misinformation Narratives

Kansas Cites Misleading Claims About Vaccine Safety in Lawsuit Against Pfizer

A photograph of a gavel and a stethoscope
Scholastica Sahinum / Getty Images

Kansas Attorney General Kris Kobach filed a lawsuit against Pfizer last month, resurfacing false claims about vaccine safety. Kobach accuses Pfizer of downplaying potential risks such as myocarditis and pregnancy complications, citing misinformation to support the lawsuit. However, the chance of developing myocarditis after vaccination is rare and the FDA already issued a myocarditis warning last year. Studies also show that the COVID-19 vaccine does not increase the risk of miscarriage.

Following the announcement of the lawsuit, there was a spike in social media posts about Pfizer. The top five posts came from accounts known for opposing vaccines, and they all expressed distrust of Pfizer. Some of these posts and comments echoed the lawsuit’s false claim that COVID-19 vaccines carry a high risk of heart inflammation. For example, one post said “…it’s definitely not normal for children to have heart attacks. I’m so happy I stayed strong and refused to put this in my family.” Many posts also suggested that pharmaceutical companies should be held accountable for alleged wrongdoing. Another post said, “Every state has to hold these companies accountable for injecting poison into people’s bodies.”

The false narratives suggest that vaccine opponents are leaning on years-old talking points to discourage COVID-19 vaccination, despite extensive research showing that COVID-19 vaccines have not caused mass death and that heart inflammation is much more common and more severe after a COVID-19 infection, not vaccination. We expect vaccine opponents to continue recycling false claims when major COVID-19 related news occurs.

More Misinformation Narratives to Watch

  • Bird Flu: H5N1 bird flu has continued infecting animals throughout the U.S., and, as of July 21 10 human cases have been reported in the U.S.. In July, news outlets reported that Moderna is developing an mRNA bird flu vaccine that can be distributed if further human outbreaks occur. Most of the 42,000 posts, articles, comments and videos mentioning bird flu and Moderna in the past 30 days were published immediately following the announcement. Some of the most popular social media posts falsely claim that bird flu is a “hoax” designed to make money for pharmaceutical companies or that bird flu vaccines are part of a “depopulation plan.”
  • Hepatitis B: Several social media accounts with large followings are circulating false claims that the hepatitis B vaccine is unsafe for infants. An X post shared on June 20 falsely claimed that Hepatitis B disease poses no risk to infants and that the vaccine contains a toxic amount of aluminum. As of July 8, that post received 1.7 million views, 21,000 likes, 11,000 shares, and 477 comments. Most comments on the post agreed with its false claims, and many also expressed distrust in COVID-19 vaccines. But some comments debunked the author’s false claims about Hepatitis B while still expressing distrust in mRNA vaccines. For example, one post said, “Bad take bro. You can talk about mRNA vaccines all day but just about every other conventional vaccine is worth it.”
  • Whooping Cough: A surge in whooping cough cases across the country has led to online conversations about the disease and vaccines that protect against it. In the past 30 days, there have been 12,000 posts, articles, comments on articles, and videos making false claims about whooping cough garnering 42,100 engagements. The top posts falsely claimed that whooping cough vaccines are ineffective, that they contain toxic heavy metals, and that they cause autism and death in children.

Other Developments

The CDC Recommends Updated COVID-19 Vaccines, But Misinformation Could Undermine Acceptance

A photograph of a young boy getting a vaccination
SDI Productions/Getty Images

Last month, the Centers for Disease Control and Prevention (CDC) updated its vaccine recommendations for COVID-19, along with other infectious diseases such as RSV and influenza. These recommendations come amid a slight increase in COVID-19 cases in the U.S. due to new variants and summer travel. To protect against these new variants before winter, the CDC recommends that everyone six months and older get an updated COVID-19 vaccine this fall. But as manufacturers roll out these new vaccines, misinformation about the safety and effectiveness of mRNA vaccines could sway people’s decisions to get them.

Polling Insights:

With the CDC recommending that everyone ages six month and older receive an updated 2024-2025 COVID-19 vaccine this fall, past data suggests that uptake of a new vaccine iteration may be slow. Last fall, a KFF COVID-19 Vaccine Monitor poll conducted two months after the latest update of the COVID-19 vaccines had been released found that just one in five adults had gotten the updated vaccine and about half said they probably or definitely would not get it.

Even among adults 65 and older – a group that is more likely to get seriously sick and experience complications from the virus – only a third (34%) said they had gotten the updated vaccine last fall, and many said they would not get it (Figure 1).

One In Five Adults Reported Having Gotten The Updated COVID-19 Vaccine in the Fall of 2023, Including Larger Shares Of Those Ages 65 And Older 

Debunked Study Resurfaces, Re-Sparking Old Claims About Vaccine Safety

A photo illustration of a person with a phone sending text messages
Witthaya Prasongsin / Getty Images

A rejected flawed study linking COVID-19 vaccines to widespread death has resurfaced online. The authors of the study reviewed published research on autopsies related to COVID-19 vaccination and determined for themselves whether the deaths were caused by COVID-19 vaccines. The authors concluded that 74% of the autopsies they reviewed were caused by the vaccine, negating many of the original findings of the studies they reviewed. Fact-checking efforts clarify that the study misinterprets autopsy data and is written by individuals known for spreading COVID-19 misinformation. The study was first submitted to The Lancet and shared online as a pre-print in 2023 but was rejected and removed during peer review for poor methodology. Forensic Science International has now published it, reigniting social media claims about vaccine dangers and censorship of anti-vaccine sentiments. As health professionals prepare for new COVID-19 vaccine rollouts, they will need to address and debunk myths about vaccine safety.

Polling Insights:

Previous KFF polling indicates that misinformation about the COVID-19 virus and vaccines could further contribute to slow or limited uptake of an updated vaccine this fall. The KFF Health Misinformation Pilot Poll conducted last summer found that many adults reported hearing false or misleading statements about COVID-19 and vaccines and substantial shares believed they were probably or definitely true. For example, many said it was probably or definitely true that “the COVID-19 vaccines have caused thousands of deaths in otherwise healthy people” (34%), that “Ivermectin is an effective treatment for COVID-19” (31%), that “the COVID-19 vaccines have been proven to cause infertility” (27%), that “more people have died from the COVID-19 vaccines than have died from the COVID-19 virus” (20%), and that “the measles, mumps, rubella vaccines, also known as MMR, have been proven to cause autism in children” (24%).

The poll further found a strong correlation between views of these claims and COVID-19 vaccination status. Among those who said four or more of those claims were probably or definitely true, just one in five (19%) had received a COVID-19 booster and 60% had not received any COVID-19 vaccines (Figure 2). By contrast, among those who thought none of these claims were true, 79% were boosted and just 7% were unvaccinated for COVID-19.

Adults Who Say Vaccine Misinformation Claims Are Probably Or Definitely True Are Less Likely To Be Vaccinated and Boosted For COVID-19

New FDA Guidance on Dispelling Misinformation May Help Combat Vaccine Myths

A photograph of two scientists working in a lab
LalaBird / Getty Images

The U.S. Food and Drug Administration (FDA) recently released new guidance that could serve as a tool for vaccine manufacturers to combat myths and inaccuracies about their vaccines. The draft guidance suggests how and when companies should develop and publish tailored messages to counter online misinformation about their FDA-approved products. By promptly addressing online misinformation on the platforms where it appears, manufacturers can provide factual, accurate, and scientifically sound information to the public.


Research Updates

COVID-19 Pandemic Impacted Public Trust in Routine Immunization and Health Information

A study in Nature Medicine explored the impact of COVID-19 on public confidence in routine immunization, health information sources, and pandemic preparedness in 23 countries. The study found that the disrupted global routine immunization services and misinformation on social media fueled vaccine hesitancy and affected overall trust in science and pharmaceutical companies. The study also found that the public’s confidence in society’s ability to manage future health crises remained high, but there was less trust in international organizations such as the WHO for pandemic guidance, particularly in countries such as Russia and the U.S.

Source: Lazarus, J. V., White, T. M., Wyka, K., Ratzan, S. C., Rabin, K., Larson, H. J., … & El-Mohandes, A. (2024). Influence of COVID-19 on trust in routine immunization, health information sources and pandemic preparedness in 23 countries in 2023. Nature Medicine, 1-5.

Strategies for Physicians to Address Vaccine Hesitancy

A study published in Vaccines highlights how physicians can reduce vaccine hesitancy by combating misinformation. Researchers interviewed physicians to understand how healthcare providers perceive and respond to patient vaccine hesitancy. Physicians reported addressing concerns about vaccine safety, side effects, misinformation, and distrust of government. The findings suggest that physicians can reduce vaccine hesitancy by engaging patients in open discussions, addressing concerns with empathy, and providing clear, evidence-based information that draws from trusted sources.

Source: Melnikow, J., Padovani, A., Zhang, J., Miller, M., Gosdin, M., Loureiro, S., & Daniels, B. (2024). Patient concerns and physician strategies for addressing COVID-19 vaccine hesitancy. Vaccine, 42(14), 3300-3306.


AI and Emerging Technologies

Ethical Implications of Large Language Models in Healthcare: Balancing Benefits and Risks

A photograph of a doctor looking at an iPad
Moyo Studio / Getty Images

Large Language Models (LLMs) are used in healthcare for clinical decision making, diagnosis, and patient communication, but they pose some risks, such as privacy concerns and the potential to spread false information and share biases. A systematic review recently published in Nature Digital Medicine mapped out the ethical landscape of LLMs in healthcare, focusing on their uses, risks, and benefits. The researchers found that LLMs can help medical providers with a number of tasks, including accessing health information, but they can also generate persuasive, inaccurate information that could lead to patient harm. The authors suggest that the use of LLMs in health care could benefit from robust ethical guidelines and careful management to prevent the spread of misinformation.

About The Health Information and Trust Initiative: the Health Information and Trust Initiative is a KFF program aimed at tracking health misinformation in the U.S., analyzing its impact on the American people, and mobilizing media to address the problem. Our goal is to be of service to everyone working on health misinformation, strengthen efforts to counter misinformation, and build trust. 


View all KFF Monitors

The Monitor is a report from KFF’s Health Information and Trust initiative that focuses on recent developments in health information. It’s free and published twice a month.

Sign up to receive KFF Monitor
email updates


Support for the Health Information and Trust initiative is provided by the Robert Wood Johnson Foundation (RWJF). The views expressed do not necessarily reflect the views of RWJF and KFF maintains full editorial control over all of its policy analysis, polling, and journalism activities. The Public Good Projects (PGP) provides media monitoring data KFF uses in producing the Monitor.


What the FTC’s New Protections From Non-Compete Agreements Mean in a Mostly Non-Profit Hospital Industry

Published: Jul 24, 2024

Introduction

In April 2024, the Federal Trade Commission (FTC) approved a final rule barring employers’ use of non-compete clauses in certain employment contracts. Non-compete clauses are used in many industries to prevent employees from taking a job with a competitor or starting a related business within a certain amount of time or distance. The FTC estimates that one in five workers (about 30 million) are subject to a non-compete clause. The regulation, which is set to take effect in September 2024, already faces multiple legal challenges, and possibly more to come, with plaintiffs claiming that the FTC exceeded its regulatory authority. Plaintiffs in of those cases were granted a preliminary injunction in July 2024, enjoining the FTC from enforcing the rule against them while the case makes its way through the courts.

This policy watch use 2022 data from the American Hospital Association (AHA) Annual Survey Database to present the number and share of hospital workers by occupation who may not be covered by the federal protections against non-compete agreements because they work for a non-profit hospital (see Methods section for details).

Overview of Rule

The American Medical Association estimates that non-compete clauses are common in health care and affect 37%-45% of physicians. The extent to which these non-competes are enforced or enforceable is unclear, though they may alter market dynamics. Less is known about the share of other health care professionals subject to non-compete clauses.

The FTC only has authority over companies organized to make a profit, so the new regulation will not apply to many non-profit hospitals, which comprise most U.S. hospitals and the majority of hospital workers. Not all tax-exempt hospitals fall outside the FTC’s jurisdiction. The FTC is authorized to regulate these entities if they are, in a fact-specific determination, a “profit-making enterprise,” and tax-exempt status is just one factor it considers. While the regulation might still apply to a non-profit hospital claiming tax-exempt status if it is “organized for profit,” the FTC can only make this determination on a case-by-case basis. (Also not generally covered are hospitals run by state and federal governments, which are typically regulated by specific public-sector employment laws whose employment practices differ substantially from private sector employers.)

A broad swath of employment relationships will be covered, including independent contractors, interns, and apprentices. Affiliations and employment arrangements between physician practices and hospitals are often complex, and some non-profit hospitals are affiliated with for-profit hospitals and medical groups. The new rule leaves open the question of whether it would apply to clinicians in these types of hospital relationships.

Hospital Worker Data

According to KFF’s analysis of 2022 AHA survey data, about 7.2 million people worked at a hospital. Two-thirds (67%) of them (about 4.8 million) worked at non-profit hospitals and may not be covered by protections under the FTC’s new non-compete agreement regulation.

In 2022, hospitals employed about 2.2 million nurses, 68% (nearly 1.5 million) of whom worked at a non-profit hospital (Figure 1). (Nurses include registered nurses and licensed practical (vocational) nurses.)

Nursing assistive personnel provide basic nursing procedures under the supervision of a registered nurse, licensed practical nurse, or other health care professionals. Nursing assistive personnel can include certified nursing assistants, birthing assistants, and medication aides. In 2022, 64% (417,078) of hospital-based nursing assistive personnel worked for non-profit hospitals and therefore also might not be covered by the FTC non-compete protections (Figure 1).

Among hospital-based health care workers, 71% of technicians, 66% of physicians and dentists, 66% of respiratory therapists, and 62% licensed pharmacists were also employed by non-profit hospitals (Figure 1). (Technicians include those working in radiology, laboratory, and pharmacy.)

4.8 Million Hospital Workers Are Employed by Non-Profit Hospitals and May Not Be Covered By New Federal Non-Compete Clause Prohibition

Other Considerations

Millions of health care workers could be impacted by the new federal regulations barring the use of non-compete clauses, and there are particular implications for lower-wage workers. That said, although the new rule applies nationally, several states have already taken action to restrict the use of non-competes for certain workers.

Lower-Wage Health Care Workers

Based on the comments the FTC received as well as economic evidence, the agency stated that non-compete clauses can suppress worker wages in part because they can prevent a worker from obtaining a higher-paying job in the same field elsewhere.

Many higher-paid health care workers may be excluded from the new regulation based on their annual earnings and duties. While the final rule would prevent new non-compete clauses for workers in “senior executive” roles—defined as those earning more than $151,164 annually who are in a “policy-making position”—it does not extend to existing non-competes for these workers. Nonetheless, data from the Bureau of Labor Statistics (BLS), which the rule references, suggest that most non-federal hospital health care workers earned well below this “senior executive” salary threshold in 2023. The FTC also presented evidence that many lower-wage workers, including hair stylists and fast-food workers, are subject to non-compete clauses.

Some of the lowest-paid non-federal hospital health care workers are nursing assistants and pharmacy technicians, who, on average, earned less than the national average annual salary of $65,470 in 2023. Nursing assistants at non-federal hospitals had an average annual salary of $40,820, pharmacy technicians made $49,950, and licensed practical and vocational nurses earned $56,450 (Figure 2). Non-compete clauses may make it more difficult for lower-paid workers to obtain a higher-paying job in their field with a different employer.

Hospital-Based Nursing Assistants Earn Only $40,000/Year On Average

State Non-Compete Restrictions

Many states have limited the use of non-compete agreements in at least some health care employment contracts (Figure 3). Four states have laws prohibiting non-competes for nearly all workers in those states (CA, MN, ND, and OK). The District of Columbia prohibits non-compete agreements for most workers earning less than $150,000 per year, or less than $250,000 for most physicians. Eleven other states prohibit non-competes for certain health care professionals (AL, CO, DE, IN, MA, MD, MT, NM, NH, RI, and SD). The new federal regulations establish a federal “floor” of protections, and these state laws will continue to apply. Applying a uniform standard across the country, the rule explains, could help alleviate confusion resulting from the patchwork of state laws, especially considering recent increases in interstate remote work.

14 States and D.C. Prohibit Non-Compete Clauses For Most Workers or Certain Health Care Professionals

Implications For Consumers

The implications of the rule for access to health care providers, especially those already in short supply, such as behavioral health care providers, are not yet clear. While some health care industry groups commented that a prohibition on non-competes could exacerbate workforce shortages, particularly in underserved areas, several comments from providers and patients indicated that non-compete contracts can create access barriers for patients when providers have to move long distances to continue practicing in their field. On the other hand, some health care industry commenters expressed concern that if non-compete agreements are prohibited, physicians may be inclined to leave markets with lower reimbursement in favor of markets with higher reimbursement rates, potentially, they say, increasing health care costs. Whether, and to what extent, the new rule may influence these access issues is an open question.

Methods

This analysis uses 2022 data from the American Hospital Association (AHA) Annual Survey Database to analyze how many health care workers, by occupation, are employed by non-profit hospitals. The survey includes data from nearly 6,200 hospitals in the U.S., including public, non-profit hospitals, and for-profit hospitals. AHA uses an estimation procedure to calculate the number of workers at a hospital when survey responses are missing, meaning there is some degree of uncertainty when measuring staffing. Additionally, hospitals often have complex employment arrangements with physicians, making it difficult to measure the precise number of physicians working at hospitals. However, U.S. Bureau of Labor Statistics hospital occupation data are similar to those reported by AHA. In this analysis, health care professionals are defined as those who were on the hospital/facility’s payroll at the end of its reporting period. It does not include physicians and dentists who are paid on a fee basis and residents. We do not know from the AHA data how many or which classifications of workers are subject to non-compete agreements. Also, we do not know the number of contracted staff or how many hospital workers are employed under a contract or the contract type (e.g., individual, group, etc.) Additionally, the FTC states that it “cannot predict precisely how many entities claiming non-profit tax-exempt status may be subject to the final rule.”


Poll Finding

Democratic Women Voters See Vice President Harris As Trusted Messenger on Abortion Policy

Published: Jul 23, 2024

Long before President Biden announced his decision to withdraw from the 2024 presidential race, Vice President Kamala Harris has been the administration’s voice on abortion rights. As part of her “Fight for Reproductive Freedoms” tour earlier this spring, V.P. Harris was the first sitting U.S. vice president1  to visit an abortion provider and she has consistently criticized Republican efforts to limit access to reproductive health care.

The KFF Survey of Women Voters finds that many Democratic women voters see the 2024 election as a pivotal moment for reproductive health care access in this country. For example:

  • A large majority (85%) of Democratic and Democratic-leaning women voters think access to safe and legal abortions has never been more at risk.
  • Seven in ten (71%) Democratic and Democratic-leaning women voters think this year’s election for president will have a “major impact” on access to abortion and reproductive health care in the U.S.

With President Biden stepping aside in the first presidential election following the Supreme Court Dobbs decision, it is likely that V.P. Harris will now take on an even more important role as the Democratic Party’s spokesperson on the future of abortion policy in this country, particularly if she becomes the party’s new presumptive presidential nominee.

The Survey of Women Voters, fielded before President Biden’s withdrawal, finds that about eight in ten (82%) Democratic and Democratic-leaning women voters say they trust V.P. Harris to speak about abortion policy – including half (49%) who say they trust her “a lot” to speak on this issue.

V.P. Harris is seen as a trusted messenger on abortion among large majorities of White Democratic women voters (85%), Black Democratic women voters (76%), and Hispanic Democratic women voters (72%). She is also trusted by Democratic women, regardless of their age, but notably garners the highest levels of trust among the oldest voting group. About nine in ten (93%) Democratic women voters ages 65 and older say they trust V.P. Harris to speak about abortion policy. The youngest voting bloc – voters ages 18 to 29 – also trust her to speak on this issue but to a lesser extent (69%), perhaps reflecting their overall discontent with the Democratic Party’s action on access to reproductive health care. Three-fourths (74%) of Democratic women voters ages 18 to 29 say the Democratic Party has not done enough to ensure access to reproductive health services, compared to half of Democratic women voters ages 65 and older who say the same.

Most Democratic Women Voters Say They Trust V.P. Harris to Speak About Abortion Policy, Including Overwhelming Majority of Older Democratic Women

In comparison, seven in ten Democratic women voters say they approved of the way President Biden was handling abortion and reproductive health issues, including half (49%) of Democratic women ages 18 to 29.

While abortion is not the top issue overall for Democratic and Democratic-leaning women voters, thirteen percent say abortion is their most important issue in deciding their choice for 2024 president. Among this group, nearly nine in ten (88%) trust V.P. Harris to speak on abortion policy – including about half (53%) who say they trust her “a lot.”

Fielded earlier this summer prior to President Biden’s withdrawal as the Democratic Party’s presidential nominee, the KFF Survey of Women Voters reveals where women voters stand on the issue of abortion and how it could impact their vote in the upcoming presidential election. The KFF Survey of Women Voters Dashboard includes more data from the survey, as well as the topline and methodology.

  1. While Harris was the first sitting U.S. vice president to visit an abortion provider, no sitting U.S. president has visited an abortion provider. ↩︎

Donor Government Funding for HIV in Low- and Middle-Income Countries in 2023

Authors: Adam Wexler, Jennifer Kates, Stephanie Oum, and Eric Lief
Published: Jul 22, 2024

Overview

This report, Donor Government Funding for HIV in Low- and Middle-Income Countries in 2023, tracks funding levels of the donor governments that collectively provide the bulk of international assistance for AIDS through bilateral programs and contributions to multilateral organizations. The new report, produced as a partnership between KFF and UNAIDS, provides the latest data available on donor funding disbursements based on data provided by governments. It includes their bilateral assistance to low- and middle-income countries and contributions to the Global Fund to Fight AIDS, Tuberculosis and Malaria as well as UNITAID.

Previous versions by publish date:

July 2022 (.pdf)

July 2021 (.pdf)

July 2020 (.pdf)

July 2019 (.pdf)

July 2018 (.pdf)

July 2017 (.pdf)

July 2016 (.pdf)

July 2015 (.pdf)

July 2014 (.pdf)

September 2013 (.pdf)

July 2012 (.pdf)

July 2011 (.pdf)

July 2010 (.pdf)

July 2009 (.pdf)

July 2008 (.pdf)

June 2007 (.pdf)

July 2006 (.pdf)

July 2005 (.pdf)

Key Findings

Key Findings

This report provides an analysis of donor government funding to address the HIV response in low- and middle-income countries in 2023, the latest year available, as well as trends over time. It includes both bilateral funding from donors and their multilateral contributions to the Global Fund to Fight AIDS, Tuberculosis and Malaria (Global Fund), UNITAID, and Joint United Nations Programme on HIV/AIDS (UNAIDS). Overall, the analysis shows that funding for HIV decreased between 2022 and 2023. While most of this was due to timing, the longer trend shows a shift away from bilateral funding by most donors, one that has not been fully offset by multilateral support. As a result, HIV funding, while fluctuating over time, has not returned to its highest level, reached a decade ago. At the same time, while there has been significant progress in addressing the HIV epidemic, the number of people newly infected by HIV is rising in some regions, some populations are particularly at risk and lack access to prevention services, and almost a quarter of people living with HIV are still not on treatment.1  Key findings include the following:

  • Donor government funding for HIV decreased in 2023 compared to the prior year. Disbursements were US$7.86 billion in 2023, a decrease of US$358 million compared to 2022 (US$8.22 billion), in current U.S. dollars (not adjusted for inflation).2  Funding decreased even after accounting for exchange rate fluctuations. Looking more broadly, HIV funding in 2023 was essentially the same as in 2008 (US$7.78 billion), and well below the peak level reached in 2014 (US$8.60 billion). As a result, funding has not kept pace with inflation.3 
  • While both bilateral and multilateral funding in 2023 declined, most of the decline was in multilateral support. Bilateral funding declined slightly, by US$46 million, to US$5.58 billion in 2023 compared to US$5.62 billion in 2022. Multilateral funding declined by US$312 million, to US$2.28 billion in 2023 compared to US$2.59 billion in 2022.4 
  • The decline in multilateral funding, however, was largely due to the timing of donor government contributions to the Global Fund in 2023, reflecting pledging periods, not reductions in actual support. With 2023 marking the first year of the most recent pledge period (2023-2025), there were large fluctuations in contributions to the Global Fund from most donor governments when compared to 2022 totals. Some donors choose to “front-load” contributions (e.g., the U.K. fulfilled almost its entire pledge for 2023-2025 in 2023), while others choose to fulfill pledges towards the end of the pledge period (e.g., Denmark did not provide any contribution in 2023 and will likely be fulfilling its pledge in future years).5 
  • The US continued to be the largest donor to HIV. In 2023, the U.S. disbursed US$5.71 billion, accounting for 73% of total donor government HIV funding (bilateral and multilateral combined).6  The U.K. was the second largest donor (US$714 million, 9%), followed by France (US$320 million, 4%), Germany (US$228 million, 3%), and the Netherlands (US$187 million, 2%). When standardized by the size of economy, the U.K. ranked first, followed by the U.S., the Netherlands, Sweden, and France.
  • More broadly, trends show that donor governments, other than the U.S., have significantly reduced their bilateral HIV support while increasing funding to the Global Fund, although this shift has not fully offset bilateral declines. Since 2011, the first year where detailed bilateral and multilateral data are available for all donors, bilateral funding from donor governments other than the U.S. has declined by US$1.37 billion (-80%). While multilateral funding from these donor governments has increased in recent years and was higher in 2023 (US$1.81 billion) than 2011 (US$1.46 billion), these increases have not been large enough to offset bilateral declines. Increases from the U.S. in some years have, for the most part, countered these declines.
  • Looking ahead, increases in donor government funding for HIV in low- and middle-income countries seem uncertain at best. There are significant headwinds on the horizon that complicate the funding picture from donor governments. These include multiple geopolitical challenges and broader economic pressures, as well as a crowded global health replenishment schedule, with several global health institutions, including the Global Fund, seeking to raise funds from the same donors over the same time period. Finally, national elections have either recently concluded or are taking place in the coming months in several donor capitals, including the U.S., the outcomes of which could shape future funding for HIV.

Report

Introduction

This report provides the latest data on donor government resources available to address HIV in low- and middle-income countries, reporting on disbursements made in 2023. It is part of a collaborative tracking effort between UNAIDS and KFF that began almost 20 years ago, just as new global initiatives were being launched to address the epidemic. The analysis includes data from all 32 members of the Organisation for Economic Co-operation and Development (OECD)’s Development Assistance Committee (DAC), as well as non-DAC members who report data to the DAC. Data are collected directly from donor governments, UNAIDS, the Global Fund, and UNITAID, and supplemented with data from the DAC. Of the 32 DAC members, 14 provide 98% of total disbursements for HIV; data for these donors are presented individually. For the remaining 18 DAC members, data are provided in aggregate. All totals are presented in current U.S. dollars (amounts are not adjusted for inflation). While totals include both bilateral and multilateral assistance for the entire period (2002-2023), detailed disaggregated bilateral and multilateral amounts for all donors are only available starting in 2011 (see Methodology for more detail).

Findings

Total Funding

In 2023, donor government funding for HIV through bilateral and multilateral channels totaled US$7.86 billion in current USD (not adjusted for inflation) and accounted for approximately 37% of the US$22.1 billion estimated by UNAIDS to be available to address HIV (the total estimated resources is US$19.8 billion when measured in 2019 constant USD).7 ,8 ,9 ,10  As per UNAIDS estimates, domestic resources accounted for 59%, and the remainder (4%) was from foundations, other multilateral organizations, and UN agencies. This amount is well below the US$29.3 billion that UNAIDS estimates will be needed by 2025 in order to reach global goals, and UNAIDS reports a widening funding gap overall and significant unmet need in funding for HIV prevention.11 

Donor government funding for HIV in 2023 declined by US$358 million compared to 2022 (US$7.86 in 2023 compared to $8.22 billion in 2022) (See Figure 1 and Table 1).12  While there were actual declines in bilateral funding by several donor governments, the overall decrease was largely due to the timing of donor contributions to the Global Fund.

Looking more broadly, HIV funding in 2023 was essentially the same as in 2008 (US$7.78 billion), and well below the peak level reached in 2014 (US$8.60 billion). While funding has fluctuated since 2008, overall amounts have not kept up with inflation.

HIV Funding from Donor Governments, 2002-2023
Donor Government Funding for HIV (bilateral & multilateral), 2011-2023 (current USD in millions)

The U.S. continued to be the largest donor to HIV efforts, providing US$5.71 billion and accounting for 73% of total donor government funding in 2023. The second largest donor was the U.K. (US$714 million, 9%), followed by France (US$320 million, 4%), Germany (US$228 million, 3%), and the Netherlands (US$187 million, 2%). In 2023, 91% of total donor government funding for HIV was provided by these five donors.

While most funding from donors was provided bilaterally (71%), largely driven by the U.S. (which provided 92% of its funding through bilateral channels), the majority of donors (ten – Canada, European Commission, France, Germany, Ireland, Italy, Japan, Norway, Sweden, and the U.K.) provide a larger share of their resources through multilateral channels (See Figure 2). Since 2011, most donor governments, other than the U.S., have shifted away from bilateral support. In 2011, 54% of their HIV funding was provided through bilateral channels compared to only 16% in 2023 (see below for more on bilateral disbursements and multilateral contributions).

HIV Funding from Donor Governments by Funding Channel, 2023

Bilateral Disbursements

Bilateral disbursements for HIV from donor governments – that is, funding disbursed by a donor on behalf of a recipient country or region – totaled US$5.58 billion in 2023, a decrease of US$46 million compared to 2022 (US$5.62 billion). This decline was due to decreased bilateral funding from half of the donor governments; all other donor governments either increased bilateral support or remained flat (See Figure 3). These trends were the same after accounting for exchange rate fluctuations.

Change

Bilateral disbursements by the U.S. declined slightly, by US$41 million (-1%) in 2023 (US$5.23 billion) compared to 2022 (US$5.28 billion) (See Figure 4) and represented the largest bilateral decrease (in USD) among donor governments. However, the change was due to the timing of disbursements of prior year funding and was not an actual decrease in funding commitments from the U.S. In fact, bilateral HIV funding as specified by the U.S. Congress in annual appropriations has been flat for several years.13  When the U.S. decrease is removed, bilateral funding from all other donor governments declined by US$5 million in 2023 (US$343 million) compared to 2022 (US$348 million).

HIV Funding from the United States, 2011-2023

Since 2011, bilateral funding from donor governments, other than the U.S., has decreased by approximately US$1.37 billion (80%) (See Figure 5). As a result, the U.S. has accounted for an increasing share of bilateral resources, rising from 70% in 2011 to 94% in 2023, with fluctuations in U.S. disbursements having an outsized impact on overall bilateral trends.

HIV Funding from Donor Governments, Other than the United States, 2011-2023

Multilateral Contributions

Multilateral contributions from donor governments to the Global Fund, UNITAID, and UNAIDS for HIV – funding disbursed by donor governments to these organizations which in turn use some (Global Fund and UNITAID) or all (UNAIDS) of that funding for HIV – totaled US$2.28 billion in 2023 (after adjusting for an HIV share to account for the fact that the Global Fund and UNITAID address other diseases).14  Funding was US$2.07 billion for the Global Fund, US$56 million for UNITAID, and US$151 million for UNAIDS.

The decline in donor government multilateral funding in 2023 was largely due to the timing of contributions to the Global Fund, reflecting pledge periods, and not actual decreases in support. With 2023 marking the first year of the most recent pledge period (2023-2025), there were large fluctuations in contributions to the Global Fund from most donor governments when compared to 2022 totals. Some donors choose to “front-load” contributions (e.g., the U.K. fulfilled almost its entire pledge for 2023-2025 in 2023), while others choose to fulfill pledges towards the end of the pledge period (e.g., Denmark did not provide any contribution in 2023 and will likely be fulfilling its pledge in future years). In addition, the timing of U.S. contributions to the Global Fund is based on the amount of funding received from other donors, as the U.S. is required by law not to exceed 33% of total contributions to the Global Fund from all donors, which also results in significant year-to-year fluctuations (See Figure 6). More generally, donor governments have increased contributions to the Global Fund.

HIV Funding from All Donor Governments, 2011-2023

Fair Share

There are different ways to measure donor government contributions to HIV, relative to one another. While the U.S. government provides the largest amount of funding for HIV, for example, it also has one of the largest economies in the world. To assess relative contributions, or “fair share”, two measures were used: ranking by overall funding amount and ranking by funding for HIV per US$1 million GDP, to adjust for the size of donor economies (See Table 2):

  • Rank by share of total donor government funding for HIV: By this measure, the U.S. ranked first in 2023, followed the U.K., France, Germany, and the Netherlands. The U.S. has ranked #1 in absolute funding amounts since tracking efforts began.
  • Rank by funding for HIV per US$1 million GDP: By this measure, the U.K. ranks first, followed by the U.S., the Netherlands, Sweden, and France (See Figure 7).15 
Assessing Fair Share Across Donors, 2023
Donor Government Ranking by Funding for HIV per US$1 Million GDP, 2023

Looking Forward

Donor government funding for HIV in low and middle-income countries will continue to be an important part of the sustainability of the HIV response for years to come, particularly given the funding gap for HIV prevention efforts. Yet future donor government funding levels seem uncertain at best, and while there has been significant progress in addressing the HIV epidemic –1.3 million people were newly infected with HIV in 2023, down from 2.1 million in 2010 – new infections are on the rise in some regions, including two (Eastern Europe and Central Asia and the Middle East and North Africa) that UNAIDS reports have the largest funding gaps and are making the least progress against their HIV epidemics.16  There are significant headwinds on the horizon that complicate the funding picture from donor governments. These include multiple geopolitical challenges, such as costs associated with ongoing conflicts and displacement of refugees, as well as broader economic forces, including continued inflationary pressures. In addition, there is a crowded global health replenishment schedule in the year ahead, with several global health institutions, including the Global Fund, seeking to raise funds from the same donors. Finally, national elections have recently concluded (European Union, France, and the U.K.) or will occur in the coming months (U.S.), the outcomes of which could shape future funding for HIV in 2024 and beyond.

This work was supported in part by the Joint United Nations Programme on HIV and AIDS (UNAIDS) and the Bill & Melinda Gates Foundation. KFF maintains full editorial control over all of its policy analysis, polling, and journalism activities.

Adam Wexler, Jen Kates, and Stephanie Oum are with KFF. Eric Lief is an independent consultant. Joint United Nations Programme on HIV and AIDS (UNAIDS).

Methodology

This project represents a collaboration between the Joint United Nations Programme on HIV/AIDS (UNAIDS) and KFF. Data provided in this report were collected and analyzed by UNAIDS and KFF.

Totals presented in this analysis include both bilateral funding for HIV in low- and middle-income countries, core contributions to UNAIDS, and the estimated share of donor government contributions to the Global Fund and UNITAID that are used for HIV. Amounts are based on analysis of data from the 32 donor government members of the Organisation for Economic Co-operation and Development (OECD) Development Assistance Committee (DAC) in 2023 who had reported Official Development Assistance (ODA). Bilateral and multilateral data were collected from multiple sources from April 2024 – June 2024. Disaggregated bilateral and multilateral data are only available starting from 2011.

Data on gross domestic product (GDP) were obtained from the International Monetary Fund’s World Economic Outlook Database and represent current price data for 2023 (see: https://www.imf.org/en/Publications/WEO/weo-database/2024/April).

Bilateral Funding:Bilateral funding is defined as any earmarked (HIV-designated) amount, including earmarked non-core (“multi-bi”) contributions to multilateral organizations, such as UNAIDS. Data included in this report represent funding assistance for HIV prevention, care, treatment and support activities, but do not include funding for international HIV research conducted in donor countries (which is not considered in estimates of resource needs for service delivery of HIV-related activities).

The research team collected the latest bilateral funding data directly from twelve governments: Australia, Canada, Denmark, France, Germany, Ireland, Japan, the Netherlands, Norway, Sweden, the United Kingdom, and the United States during the first half of 2024, representing the fiscal year 2023 period. Direct data collection from these donors was desirable because they represent the preponderance of donor government assistance for HIV and the latest official statistics – from the Organisation for Economic Co-operation and Development (OECD) Creditor Reporting System (CRS) (see: http://www.oecd.org/dac/stats/data) – are from 2022 and do not include all forms of international assistance (e.g., certain funding streams provided by donors, such as HIV components of mixed-purpose grants to non-governmental organizations). Data for all other member governments of the OECD DAC – Austria, Belgium, the Czech Republic, the European Commission, Estonia, Finland, Greece, Hungary, Iceland, Italy, Korea, Lithuania, Luxembourg, New Zealand, Poland, Portugal, the Slovak Republic, Slovenia, Spain, and Switzerland – which collectively accounted for less than 5 percent of bilateral disbursements in each of the past several years, were obtained from the OECD CRS database are from calendar year 2022.

Where donor governments were members of the European Union (EU), the research team ensured that no double-counting of funds occurred between EU Member State reported amounts and European Commission (EC) reported amounts for international HIV assistance. Figures obtained directly using this approach should be considered as the upper bound estimation of financial flows in support of HIV-related activities.

Reflecting deliberate strategies of integrating HIV activities into other activity sectors, some donors use policy markers to attribute portions of mixed-purpose projects to HIV. This is done, for example, by the Netherlands and the U.K. The bilateral figures submitted by the UK Foreign, Commonwealth & Development Office (FCDO) for the financial year 2023/24 are based on an existing FCDO ‘HIV policy marker’. Ireland and Denmark also attribute percentages of multipurpose projects to HIV. Canada breaks its mixed-purpose projects into components by percentage. Germany, Norway, and Sweden provided data much more conservatively, consistent with DAC constructs and purpose codes. Apart from targeted HIV/AIDS programs, bilateral health programs mainly focusing on health systems strengthening are also designed to contribute to the HIV response in partner countries.

Bilateral assistance data represent disbursements. A disbursement is the actual release of funds to, or the purchase of goods or services for, a recipient. Disbursements in any given year may include disbursements of funds committed in prior years and in some cases, not all funds committed during a government fiscal year are disbursed in that year. In addition, a disbursement by a government does not necessarily mean that the funds were provided to a country or other intended end-user.

Amounts presented are for the fiscal year period, which varies by country. The U.S. fiscal year runs from October 1-September 30. The fiscal years for Canada, Japan, and the U.K. are April 1-March 31. The Australian fiscal year runs from July 1-June 30. The European Commission, Denmark, France, Germany, Italy, Ireland, the Netherlands, Norway, and Sweden use the calendar year. The OECD uses the calendar year, so data collected from the CRS for other donor governments reflect January 1-December 31. Most UN agencies use the calendar year, and their budgets are biennial.

All data are expressed in current US dollars (USD), unless otherwise noted. Where data were provided by governments in their currencies, they were adjusted by average daily exchange rates to obtain a USD equivalent, based on foreign exchange rate historical data available from the U.S. Federal Reserve (see: http://www.federalreserve.gov/) or the OECD.

Funding totals presented in this analysis should be considered preliminary estimates based on data provided and validated by representatives of the donor governments who were contacted directly.

Multilateral Funding:Multilateral funding includes core contributions to UNAIDS, as well as contributions to the Global Fund (see: http://www.theglobalfund.org/en/) and UNITAID (see: http://www.unitaid.org/#end). All Global Fund contributions were adjusted to represent 52% of the donor’s core contribution, reflecting the Fund’s reported grant approvals for HIV-related projects to date and includes funding for HIV/TB activities. UNITAID contributions were adjusted to represent 46% of the donor’s core contribution, reflecting UNITAID’s reported attribution for HIV-related projects.

Data obtained from UNAIDS, the Global Fund, and UNITAID were already adjusted to represent a USD equivalent based on date of receipts.

UNAIDS core contributions reflect 2023 amounts. Global Fund and UNITAID contributions from all governments correspond to amounts received during the 2023 calendar year, regardless of which contributor’s fiscal year such disbursements pertain to. UNAIDS and UNITAID provided contributions data directly to the research team. Global Fund contributions data were compiled by the research team and validated by the Global Fund. The French reported additional set-aside funding for the Global Fund after data collection was complete; this is now pending further review.

In addition to contributions supporting the Global Fund’s and UNITAID’s core activities, some donor governments provided significant funding to these multilateral organizations for COVID-related efforts between 2000-2023. These COVID-specific contributions were not included in totals in this analysis. The U.S., for example, provided almost US$1.9 billion in such funding to the Global Fund during 2022.

Other than contributions provided by governments to the Global Fund and UNITAID, un-earmarked general contributions to United Nations entities, most of which are membership contributions set by treaty or other formal agreement (e.g., the World Bank’s International Development Association or United Nations country membership assessments), are not identified as part of a donor government’s HIV assistance even if the multilateral organization in turn directs some of these funds to HIV. Rather, these would be considered as HIV funding provided by the multilateral organization, as in the case of the World Bank’s efforts, and are not considered for purposes of this report.

Appendix

Donor Government Funding for HIV (current USD in millions), 2022 & 2023

Endnotes

  1. UNAIDS, “2024 UNAIDS Global AIDS Update Report: The Urgency of Now – AIDS at the Crossroads”, July 2024. ↩︎
  2. Between 2020-2023, some donor governments provided COVID-specific emergency contributions to the Global Fund and UNITAID in addition to their contributions for core activities. For the purposes of this report, these COVID-specific amounts have been excluded as they cannot be attributed to a specific area, such as HIV. ↩︎
  3. UNAIDS estimates that US$19.8 billion was available for HIV from all sources (domestic resources, donor governments, multilaterals, and philanthropic organizations) in 2023, expressed in 2019 USD. For purposes of this analysis, this estimate was converted to 2023 USD, or US$22.1 billion. In addition, while the amounts presented in this analysis include donor contributions to multilateral organizations, the UNAIDS estimate of total available resources for HIV includes the actual disbursements made by multilateral organizations in 2023 rather than the donor government contributions to these entities. ↩︎
  4. Donor government contributions to the Global Fund and UNITAID have been adjusted for an HIV-share to account for the fact that these multilateral organizations address other diseases and areas (see Methodology). ↩︎
  5. Personal communication with Danish Ministry of Foreign Affairs, July 2024. ↩︎
  6. U.S. totals represent funding amounts provided through regular appropriations only. In 2021, the U.S. Congress appropriated additional emergency supplemental funding for bilateral HIV activities and for the Global Fund to address the impacts of the COVID-19 pandemic. These emergency supplemental funding amounts are not included in overall U.S. totals. ↩︎
  7. Donor government disbursements are a subset of overall international assistance for HIV in low-and-middle-income countries, which also includes funding provided by other multilateral institutions, UN agencies, and foundations. ↩︎
  8. UNAIDS, “2024 UNAIDS Global AIDS Update Report: The Urgency of Now – AIDS at the Crossroads”, July 2024. ↩︎
  9. UNAIDS estimates that US$19.8 billion was available for HIV from all sources (domestic resources, donor governments, multilaterals, and philanthropic organizations) in 2023, expressed in 2019 USD. For purposes of this analysis, this estimate was converted to 2023 USD, or US$22.1 billion. In addition, while the amounts presented in this analysis include donor contributions to multilateral organizations, the UNAIDS estimate of total available resources for HIV includes the actual disbursements made by multilateral organizations in 2023 rather than the donor government contributions to these entities. ↩︎
  10. The donor share of total available resources includes bilateral disbursements as well as an adjusted share of Global Fund and UNITAID disbursements (the donor government share of contributions to each of the multilaterals in 2022 is applied to the disbursements from these multilaterals for the same year). ↩︎
  11. The UNAIDS resource needs estimate is expressed in 2019 USD. UNAIDS, “2024 Global AIDS Update: The Urgency of Now – AIDS at the Crossroads”, July 2024. ↩︎
  12. KFF & UNAIDS, “Donor Government Funding for HIV in Low- and Middle-Income Countries in 2022”, July 2023. ↩︎
  13. KFF, “The U.S. President’s Emergency Plan for AIDS Relief (PEPFAR)”, July 2023. ↩︎
  14. In 2023, 52% of the Global Fund’s disbursements and 46% of UNITAID’s disbursements were directed to HIV activities. These percentages were applied to the full donor government contributions to these multilateral organizations to calculate the “HIV-share” (see Methodology for additional details). ↩︎
  15. GDP estimates are from the International Monetary Fund’s (IMF) World Economic Outlook (WEO) Database (accessed June 2024). ↩︎
  16. UNAIDS, “2024 UNAIDS Global AIDS Update Report: The Urgency of Now – AIDS at the Crossroads”, July 2024. ↩︎

Immigrants Have Lower Health Care Expenditures Than Their U.S.-Born Counterparts

Published: Jul 18, 2024

Introduction

As of 2022, there were 45.5 million immigrants residing in the U.S., including 21.2 noncitizen immigrants and 24.2 million naturalized citizens, who together account for about 15% of the total population.1  While there has been increasing focus among some policymakers on the health care expenses incurred by immigrants, research suggests that they not only have lower health care costs than U.S.-born people but also help subsidize health care for U.S.-born people by paying more into the system through health insurance premiums and taxes than they utilize. This data note provides further insight into health care expenditures for immigrants by analyzing their average per capita health care expenditures and comparing them to expenditures for U.S.-born people overall and by health care services and payment sources using data from the 2021 Medical Expenditures Panel Survey.

This analysis finds that, on average, annual per capita health care expenditures for immigrants, including naturalized citizens and noncitizens, are about two-thirds of those for U.S.-born citizens overall ($4,875 vs. $7,277). This reflects lower spending for most types of health care, including office-based visits, prescription drugs, inpatient care, outpatient care, and dental care. Among average per capita expenditures, the relative amount paid by most payment sources is lower for immigrants compared to U.S.-born people, including private coverage, Medicare, and out-of-pocket spending. There is no significant difference in average emergency room and Medicaid expenditures between U.S.-born citizens and immigrants.

These patterns suggest that immigrants use less health care than U.S.-born people and often rely on the emergency room when they do seek care. Lower use of health care among immigrants likely reflects a combination of them being younger and healthier than their U.S.-born counterparts as well as them facing increased barriers to care, including lower rates of coverage due to more limited access to private coverage and Medicaid eligibility restrictions for immigrants. In general, lawfully present immigrants must have a “qualified” immigration status to be eligible for Medicaid or the Children’s Health Insurance Program (CHIP), and many must wait five years after obtaining qualified status before they may enroll. Undocumented immigrants are not eligible to enroll. Immigrants also face language access challenges and confusion and fears. Increasing coverage and reducing other barriers to care for immigrants could increase the use of preventive and primary care, which could prevent the worsening of conditions and reliance on emergency room care.

Findings

In 2021, annual average overall per capita health care expenditures for immigrants were $4,875 compared to $7,277 for U.S.-born citizens. Annual average per capita spending for immigrants was lower than for U.S.-born citizens on office-based visits ($1,325 vs. $2,126), prescription drugs ($1,159 vs. $1,655) inpatient care ($864 vs. $1,284), outpatient care ($581 vs. $1,001), and dental care ($280 vs. $402) (Figure 1). Average per capita spending on emergency room care was not statistically significantly different between immigrants ($169) and U.S.-born citizens ($200).

Average Annual Per Capita Health Care Expenditures Among Immigrants and U.S.-Born People by Type of Health Care, 2021

Among average annual total per capita expenditures, the relative amount paid for by private coverage ($1,925 vs. $3,075), Medicare ($1,161 vs. $1,999), and out-of-pocket spending ($705 vs. $950) was lower for immigrants compared to U.S.-born people (Figure 2). There was no statistically significant difference in the average amount paid by Medicaid for immigrants ($854) and U.S.-born people ($830). Medicaid eligibility is limited for immigrants. In general, lawfully present immigrants must have a “qualified” immigration status to be eligible for Medicaid or CHIP, and many must wait five years after obtaining qualified status before they may enroll. For children and pregnant people, states can eliminate the five-year wait and extend coverage to lawfully present immigrants without a qualified status. States can also extend pregnancy-related coverage to immigrants regardless of status through the CHIP From-Conception-to-End-of-Pregnancy option. Undocumented immigrants are not eligible to enroll in Medicaid. Medicaid payments for emergency services may be made for individuals who are otherwise eligible except for immigration status to help cover the costs incurred for providing this care. Given these limits, it is likely that a greater share of Medicaid spending for immigrants goes toward pregnancy-related care and emergency care, which tend to be costly. In contrast, U.S.-born enrollees include a high share of children, who typically utilize lower-cost preventive and primary care, resulting in lower spending.

Average Annual Per Capita Health Care Expenditures Among Immigrants and U.S.-Born People by Payment Source, 2021

Methods

The data in this brief are based on KFF analysis of the 2021 Medical Expenditures Panel Survey (MEPS) full-year consolidated data file. The data presented in this brief include the average annual per capita health care expenditures for immigrants (individuals born outside the U.S. or its territories) and U.S.-born citizens both overall and for major types of health care including office-based visits, prescription drugs, inpatient care (including facility and doctor charges), outpatient care (including facility and doctor charges), dental care, and emergency room care (including facility and doctor charges). Health care expenditures are also examined by payment source, that is, the amount of total average per capita expenditures that are paid through private coverage, Medicare, Medicaid, and out-of-pocket spending. A limitation of federal surveys, including MEPS, is the likely underrepresentation of immigrants, particularly recent and undocumented immigrants, and potential undercounting of emergency Medicaid spending.

  1. KFF analysis of 2022 American Community Survey 1-year Public Use Microdata Sample ↩︎

The U.S. Government and Gavi, the Vaccine Alliance

Published: Jul 17, 2024

This fact sheet does not reflect recent changes that have been implemented by the Trump administration, including a foreign aid review and restructuring. For more information, see KFF’s Overview of President Trump’s Executive Actions on Global Health, and also see the KFF fact sheet on the Trump administration’s foreign aid review and the status of U.S. support for Gavi.

Key Facts

  • Gavi, the Vaccine Alliance (Gavi) is an independent public-private partnership and multilateral funding mechanism that aims to expand global access to and use of vaccines, particularly among vulnerable children.
  • Since its launch in 2000, Gavi has provided approximately $23 billion to support immunization efforts in low- and middle-income countries, not including funding for COVAX.
  • The U.S. government (U.S.) has supported Gavi since its creation through direct financial contributions, participation in Gavi’s governance, and technical assistance.
  • The U.S. is the third largest contributor to Gavi and its second largest government contributor, providing 12% overall and 15% of government funding (not including COVAX). U.S. annual contributions have grown over time, reaching $300 million in FY 2024. Additionally, the U.S. recently pledged at least $1.58 billion to Gavi over the next five years for its next replenishment period.
  • Additionally, the U.S. was the largest donor to COVAX, providing $4 billion in emergency funding in FY 2021 to this multilateral effort to equitably procure and distribute COVID-19 vaccines globally. Co-led and administered by Gavi, COVAX came to an end in 2023, with COVID-19 vaccines and funding now integrated into Gavi’s regular programming.
  • Despite past progress in expanding access to childhood vaccinations, the COVID-19 pandemic had a detrimental impact on childhood immunization efforts in many countries, presenting new challenges for Gavi and partners going forward.
  • Gavi is now launching its next replenishment effort to raise resources for the 2026-2030 period, with a pledging conference expected later this year, as well as an update to its five-year strategy.

Gavi Overview

Created in 1999 and formally launched in January 2000, Gavi, the Vaccine Alliance (Gavi) is an independent public-private partnership and multilateral funding mechanism that “aims to save lives and protect people’s health by increasing coverage and equitable and sustainable use of vaccines.” Gavi’s main activities include supporting low- and middle-income countries’ access to new and underused vaccines for vulnerable children through financial support, technical expertise, and market-shaping efforts, such as negotiating with manufacturers, to help lower the cost of procuring vaccines. Gavi operates in five-year funding cycles, with a revised strategy and goals for each cycle. Each five-year strategy is accompanied by a vaccine investment strategy, which determines which vaccines will be made available to countries.

Gavi’s current five-year strategy, for the 2021-2025 period, which is its fifth strategy, includes four core goals:

1.  introduce and scale-up vaccines,

2.  strengthen health systems to increase equity in immunization,

3.  improve sustainability of immunization programs, and

4.  ensure healthy markets for vaccines and related products.

The current strategy emphasizes reducing the number of ‘zero-dose’ children with the goal of reaching no zero-dose children by 2030; prioritizing programmatic and financial sustainability of country immunization programs; supporting countries that have phased out of Gavi support or have never been eligible for Gavi support; and providing more tailored approaches for Gavi countries to reach under-vaccinated populations, such as those living in remote or conflict settings, by encouraging countries to adopt strategies that reduce potential barriers to vaccination. Gavi is currently in the process of developing its sixth strategy.

In addition to Gavi’s role in routine childhood immunizations, Gavi was one of the organizations leading COVAX, a multilateral effort that supported the equitable development, procurement, and delivery of COVID-19 vaccines globally that began in 2020 and ended in 2023. Gavi’s role in COVAX was to facilitate the procurement and delivery of COVID-19 vaccines, with particular emphasis on low- and middle-income countries. Provision of COVID-19 vaccines and funding support to countries has now been integrated into Gavi’s regular programming; however, COVID-19 vaccine support will be discontinued after 2025.

Organization

Gavi’s Secretariat, with its main headquarters in Geneva and an office in Washington, D.C., carries out the day-to-day operations of the partnership. Gavi does not have program offices or staff based in recipient countries but rather relies on country health ministries and World Health Organization (WHO) regional offices to implement programs. Gavi is led by a Chief Executive Officer (CEO), currently Sania Nishtar.

The 28-member Gavi Board sets Gavi’s funding policies and strategic direction, and monitors program implementation. It includes 18 “representative” seats, nine seats for independent individuals, and one ex-officio non-voting seat for Gavi’s CEO. The 18 representative seats, as specified in Gavi’s statute, are as follows: donor country governments (5), implementing country governments (5), the WHO, the United Nations Children’s Fund (UNICEF), the World Bank, and the Bill & Melinda Gates Foundation, and one seat each for civil society groups, the vaccine industry in industrialized countries, the vaccine industry in developing countries, and technical health/research institutes. Additionally, several Board committees guide and advise the Board and the CEO on Gavi activities under their purview. The U.S. government is currently represented on Gavi’s Board as the Board member for the donor country government constituency and is a member of the Audit and Finance Committee, Programme and Policy Committee, and the Market-Sensitive Decisions Committee.

Funding

Since its 2000 launch, Gavi has received approximately $30 billion in financing, not including funding for COVAX (see Table 1).1  Approximately four-fifths (80%) of Gavi’s funding came from contributions provided by donor governments and private organizations and individuals. The top three government donors were the United Kingdom, the U.S. and Norway, while the largest private donor was the Gates Foundation.

Donors support Gavi through direct contributions as well as funding commitments to innovative financing mechanisms, the proceeds of which help support Gavi’s overall financing. These innovative financing mechanisms include the International Finance Facility-Immunisation (IFFIm) and the Pneumococcal Conjugate Vaccine (PCV) Advance Market Commitment (AMC). The IFFIm was created in 2006 and uses donor funding commitments to back the issuance of special bonds in capital markets, essentially providing “up-front” financing to Gavi. The PCV AMC began in 2010, and though it ended in 2020, it supported accelerated access to pneumococcal vaccines through up-front funding commitments from donors and continues to do so through contracts with manufacturers that extend until 2029. The U.S. does not provide support to either of these mechanisms.2 

In addition to financing Gavi’s regular activities, donors pledged additional resources to support the Gavi COVAX Advance Market Commitment (COVAX AMC), a financial mechanism within COVAX that supported low- and middle-income countries through procurement and distribution of COVID-19 vaccines; through 2023, Gavi received $12.3 billion from donor governments, private philanthropy, and innovative financing mechanisms for the COVAX AMC for vaccine procurement, delivery, and logistics.3 

Funding to Gavi, 2000-2025

Country Eligibility and Support

Eligibility

Only low- and middle-income countries with a Gross National Income (GNI) per capita below or equal to $1,730 on average over the last three years are eligible for Gavi support. In 2023, 54 countries were eligible for Gavi support; these included 23 of the 25 U.S. priority countries for maternal and child health assistance.

Recipient countries’ governments are expected to share responsibility for funding their national immunization efforts through Gavi’s co-financing requirements (introduced in 2008), determined according to country income level and transition status. As countries develop economically, they are expected to contribute a greater share of the funding required for immunization programs. Countries below the threshold (average of $1,730 GNI per capita over the past three years) and classified as low-income by the World Bank are initial self-financing countries, while countries below the threshold and classified as lower-middle income by the World Bank are in preparatory transition. Initial self-financing countries are responsible for co-financing the equivalent of $0.20 per dose each year. Countries in preparatory transition gradually increase their co-financing contribution each year.4  When a country’s income rises above the GNI per capita threshold, it moves into an eight-year “accelerated transition” period of increasing domestic financing share, after which the country is expected to fully fund its own immunization programs.5  As of 2023, 19 countries have transitioned out of Gavi financial support.

Additionally, as part of its 2021-2025 strategy, the Gavi Board approved limited support for countries that have transitioned out of Gavi eligibility and for middle-income countries (MICs) that have never been eligible for Gavi support.6  Recognizing that many formerly and never Gavi-eligible countries experience low coverage rates and have yet to make key vaccine introductions, an initial investment of $281 million was approved to provide limited support for 19 former and 26 never Gavi-eligible countries for political advocacy related to immunization, technical assistance, targeted assistance to reach under-vaccinated communities, and financial support for one-off costs and vaccine introductions.

Country Support

Gavi provides grant financing to country programs in the following five areas:

  • Vaccine support (including for vaccine introduction, targeted campaigns, and routine campaigns),
  • Health systems strengthening support (including to improve country data systems, supply chains, and community engagement, among other priority areas),
  • Cold Chain Equipment Optimization Platform (CCEOP) support (for purchasing and deploying modern cold chain technology),
  • Equity Accelerator Fund (EAF) support (for reaching zero-dose children and missed communities), and
  • Targeted country assistance (support for country-specific needs to improve vaccine introductions and routine campaigns, through the work of partner organizations such as WHO, UNICEF, U.S. Centers for Disease Control and Prevention, and the World Bank).

Country allocations include funding ceilings, representing the maximum available funding each country can apply for during the 2021-2025 period, for all areas of support except vaccines. These ceilings are formulated based on a country’s number of zero-dose children, under-immunized children, birth cohort, and GNI per capita. For vaccines, all countries are required to pay a share of the cost of their Gavi-supported vaccines.

Additionally, Gavi has provided country support through emergency response funding, including: support for Ebola vaccination,7  allowing for up to $200 million in reprogrammed Gavi support for the COVID-19 response in Gavi-eligible countries, and other support for the COVID-19 response including the creation of COVAX (which helped expand access to COVID-19 vaccines in lower-income countries) and the COVID-19 Vaccine Delivery Partnership (CoVDP, which aimed to improve COVID-19 vaccine coverage in certain COVAX countries, with a particular emphasis on countries that were below 10% coverage in January 2022).8  In 2022, Gavi supported 40 outbreak response vaccination campaigns.

Since its launch in 2000, Gavi has provided approximately $23 billion to support country immunization programs (not including funding for COVAX).9  Over the past three years, 2020-2023, more than $7.3 billion has been disbursed, most of which has been for vaccine support (60%), followed by health systems strengthening (13%) (see Table 2).

Gavi Country Support (Disbursements), by Type, 2020-2023

Results

Gavi reports it has helped to immunize more than 1 billion children in supported countries, including more than 68 million in 2022 alone, and supported 40 different vaccine introductions and preventive campaigns and 40 outbreak response campaigns in 2022. Additionally, Gavi support has helped avert more than 17.3 million deaths and contributed to more than $220 million in economic benefits, since its launch in 2000. Additionally, according to Gavi, its support has led to improved child health and immunization indicators across its supported countries. For example, the average vaccine coverage across multiple key Gavi-supported vaccines –  including the human papillomavirus (HPV) vaccine, inactivated polio vaccine, and pentavalent vaccine (the vaccine providing protection against diphtheria, tetanus, pertussis, hepatitis B, and Hib),10  among others –  was 56% in Gavi-supported countries in 2022, up from 48% in 2019 and higher than the global average of 53%.11  Lastly, Gavi’s work has contributed to vaccine market-shaping; for example, Gavi reports that its influence has helped lower the cost of the HPV vaccine from a price per dose of $4.50 in 2015 to $2.90 in 2022.

U.S. Engagement with Gavi

The U.S. government has supported Gavi since its creation. President Clinton made the initial U.S. pledge to the newly formed partnership in 2000, and the U.S. provided its first contribution in 2001. Currently, the U.S. supports Gavi through financial contributions, participation in Gavi’s governance, and by providing technical assistance. It also supports other global immunization that complement Gavi’s activities.

Financial Support

The U.S. has supported Gavi through direct contributions every year since 2001. Over the last 10 years, U.S. contributions grew from $175 million in FY 2014 to $300 million in FY 2024, which is the highest amount appropriated to Gavi thus far (see figure). Additionally, the U.S. recently pledged at least $1.58 billion to Gavi over the next five years as a sign of support for Gavi’s upcoming replenishment. Congress provides funding for U.S. contributions to Gavi through the Global Health Programs account at the U.S. Agency for International Development (USAID), specifically within the maternal and child health budget line. See the KFF budget tracker and the KFF fact sheet on the U.S. Global Health Budget: Maternal & Child Health (MCH) for details on historical appropriations for Gavi.

U.S. Contributions to Gavi, FY 2014 - FY 2024

Additionally, in response to the COVID-19 pandemic, the U.S. provided $4 billion in FY 2021 emergency funding to Gavi COVID-19 vaccine procurement and delivery support under COVAX, making the U.S. the largest donor to COVAX (33% of $12.3 billion received overall).12  In addition to its financial support for COVAX, the U.S. donated the largest number of COVID-19 vaccines to other countries.

Governance Activities

A U.S. government representative (from USAID) is currently a Board member of the donor government constituency on the Gavi Board. The U.S. government is also represented on the Gavi Board’s Audit and Finance Committee, Programme and Policy Committee, and Market Sensitive Decisions Committee.

Technical Support

The U.S. also provides Gavi with technical support and expertise in the design, implementation, and evaluation of its programs in the field through partnerships with several U.S. agencies. For example, Gavi’s accelerated vaccine introduction programs have been conducted with technical support from the Centers for Disease Control and Prevention (CDC) and USAID, along with other partners.

Other U.S. Immunization Activities

Multilateral support of Gavi is one component of a broader set of global immunization activities of the U.S. government. The U.S. also provides bilateral (country-to-country) support for immunization through USAID, CDC, and other agencies, which focuses on strengthening routine immunization systems to deliver vaccines. U.S. multilateral and bilateral vaccine support are intended to be complementary. Indeed, many of the countries in which the U.S. carries out bilateral global immunization activities (provided as part of USAID’s maternal and child health efforts)  also receive support from Gavi.13  See the KFF fact sheets on U.S. global MCH efforts and U.S. global polio efforts.

  1. This amount includes proceeds for 2000-2023 and pledges for 2024-2025. ↩︎
  2. For further information about restrictions on U.S. support for these innovative financing mechanisms, see KFF, Innovative Financing Mechanisms for Global Health: Overview and Considerations for U.S. Government Participation, Sept. 2011. ↩︎
  3. KFF analysis of Gavi cash receipts data. Gavi, “Cash Receipts 31 December 2023,” https://www.gavi.org/news-resources/document-library/cash-receipts. ↩︎
  4. Countries in the first year of the preparatory transition phase co-finance the equivalent of $0.20 per dose, the same as initial self-financing countries. For each subsequent year, countries in preparatory transition co-finance a 15% increase of the total fraction paid in the prior year. The preparatory transition phase does have a set duration amount. Gavi, “Gavi Application Process Guidelines,” Nov. 2022, https://www.gavi.org/sites/default/files/support/ApplicationProcess_Guidelines.pdf. ↩︎
  5. Countries in the first year of the accelerated transition phase co-finance the equivalent of the prior year’s total fraction plus 15%, the same as countries in preparatory transition. For each year after, the amount per dose increases linearly until the country is fully financing each vaccine after the eighth year and end of Gavi support. Gavi, “Gavi Application Process Guidelines,” Nov. 2022, https://www.gavi.org/sites/default/files/support/ApplicationProcess_Guidelines.pdf. In December 2022, the Gavi Board decided to shift the accelerated transition phase from a five-year to an eight-year timeframe. Gavi, “Eligibility,” webpage, https://www.gavi.org/types-support/sustainability/eligibility. ↩︎
  6. This would include countries with GNI per capita below $4,000, as well as all other IDA-eligible countries. Gavi, “Gavi’s approach to engagement with former and never-eligible Middle Income Countries (MICs),” Board presentation, Dec. 2020, https://www.gavi.org/sites/default/files/board/minutes/2020/15-dec/07%20-%20MICs%20-%20Presentation.pdf. ↩︎
  7. Gavi, “500,000 doses of Ebola vaccine to be made available to countries for outbreak response,” webpage, https://www.gavi.org/news/media-room/500000-doses-ebola-vaccine-be-made-available-countries-outbreak-response. ↩︎
  8. CoVDP phased out its operations in June 2023 as the partnership was not set up to be a permanent structure. WHO, “COVID-19 Vaccine Delivery Partnership,” webpage, https://www.who.int/emergencies/diseases/novel-coronavirus-2019/covid-19-vaccines/covid-19-vaccine-delivery-partnership; Devex, “Exclusive: A COVID-19 initiative for vaccine delivery is winding down,” 11 January 2023, https://www.devex.com/news/exclusive-a-covid-19-initiative-for-vaccine-delivery-is-winding-down-104724. ↩︎
  9. KFF analysis of data provided by Gavi on disbursements by program area and year. KFF personal communications with Gavi, Feb. 14, 2024, and Feb.10, 2023. ↩︎
  10. The pentavalent vaccine is the vaccine providing protection against diphtheria, tetanus, pertussis, hepatitis B, and Hib. ↩︎
  11. Breadth of protection is a measure of the average vaccine coverage across the following key Gavi-supported vaccines: last dose of human papillomavirus (HPV) vaccine, second dose of inactivated polio vaccine, third dose of pentavalent vaccine, third dose of pneumococcal conjugate vaccine, first dose of rubella-containing vaccine, last dose of the RotavirusC vaccine, second dose of measles-containing vaccine, yellow fever, meningococcal A, and Japanese encephalitis. Gavi, “Annual Progress Report 2022,” https://www.gavi.org/sites/default/files/programmes-impact/our-impact/apr/Gavi-Progress-Report-2022.pdf. ↩︎
  12. The U.S. announced it would donate 500 million Pfizer doses to COVAX at the G7 Summit in June 2021. However, a portion of these doses were purchased using funds appropriated to Gavi ($2 billion for 300 million Pfizer doses), while the remaining 200 million doses were purchased using $1.5 billion in other emergency funds from the American Rescue Plan Act. To avoid double-counting, Gavi counts the U.S. funding that was contributed to Gavi under its COVAX funding contributions, with only 200 million of the doses – those purchased directly by the U.S. – counted as COVAX vaccine dose donations. KFF personal communication with Gavi, Nov. 12, 2021; White House, “FACT SHEET: President Biden Announces Historic Vaccine Donation: Half a Billion Pfizer Vaccines to the World’s Lowest-Income Nations,” June 10, 2021; Gavi, “COVAX AMC Donors Table,” Apr. 7, 2022, https://www.gavi.org/sites/default/files/covid/covax/COVAX-AMC-Donors-Table.pdf; Gavi, “Cash Receipts 30 June 20232,” https://www.gavi.org/news-resources/document-library/cash-receipts. https://www.usaid.gov/sites/default/files/documents/USAID_COVID_Response_Fact_Sheet_Oct_2021_FINAL.pdf. ↩︎
  13. These included 23 of the 25 U.S. priority countries for maternal and child health assistance. KFF analysis of Gavi recipient countries and USAID maternal and child health priority countries. Gavi, “Eligibility,” webpage, https://www.gavi.org/types-support/sustainability/eligibility; USAID, “Priority Countries,” webpage, https://www.usaid.gov/global-health/health-areas/maternal-and-child-health/priority-countries. ↩︎
Poll Finding

Polling Insight: 4 Key Takeaways About Hispanic Women Voters Nationally and in Arizona

Published: Jul 17, 2024

Hispanic Americans account for half the growth of the voting-age population in the U.S. since the 2020 presidential election, and their diversity of opinion and experiences is as great as their numbers. Former President Trump made gains with Hispanic voters between the last two presidential elections, though an analysis shows they voted for President Biden by wide margins in key states in 2020. Across racial and ethnic groups, women voters overwhelmingly cite inflation as the most important issue determining their vote and are similarly dissatisfied with their options for president. However, women of color, including both Hispanic and Black women, are less motivated to vote and less likely to say they plan to vote in this election. Hispanic women in particular are an important segment of American voters, as they have historically turned out at higher rates than Hispanic men and may be more motivated to vote in this election by the inclusion of abortion and other reproductive health measures on state-level ballots. In a close election, the turnout of Hispanic women voters may tip the scale toward either candidate.

This polling insight from the KFF Survey of Women Voters is based on analysis of Hispanic women voters nationally and in Arizona, a key battleground state for the upcoming presidential election where it is projected that one in four voters will be Hispanic1 . This analysis finds the potential state ballot measure in Arizona which would enshrine abortion rights may motivate younger Hispanic women in particular to cast their vote.

The KFF Survey of Women Voters Dashboard includes more analyses from the survey, as well as the topline and methodology.

#1: Inflation Is the Most Important Election Issue for Hispanic Women Voters; Most Worry About Affording Basic Expenses

Economic issues are top of mind for Hispanic women voters across the country leading into the presidential election, as majorities say they worry “a lot” about affording basic expenses for them and their family, including food and groceries (64%), rent or mortgage (63%), the cost of health care (60%), monthly utilities (56%), and childcare (54% among those with children under age 18). Similar shares of Black women voters say they worry “a lot” about most of these household expenses, while White women voters are less likely than both Black and Hispanic women voters to express worry about affording the items asked about in this survey.

Majorities of Hispanic Women Voters Say They Worry "A Lot" About Affording Groceries, Utilities, Childcare, and Health Care

Americans overall have been affected by growing inflation rates after the economy struggled to recover after the COVID-19 pandemic, peaking at 9.1% in June 20222 . Over half (56%) of Hispanic women voters say “inflation, including the rising cost of household expenses” is the most important issue determining their vote in the upcoming election, and the Democratic Party has an advantage over the Republican Party when it comes to addressing the cost of household expenses for this group (35% vs. 22%). However, many still say neither party does a better job (43%).

The KFF Survey of Women Voters Dashboard displays top issues determining the vote of Hispanic women voters and other key groups of women voters.

#2: Hispanic Women Voters Are Frustrated, Dissatisfied With Options for President; Younger Voters Are Particularly Disaffected

About six in ten Hispanic women voters nationally say they are “anxious” (60%) or “frustrated” (57%) about the upcoming presidential election, while half (54%) say they are “hopeful,” and a much smaller share are “enthusiastic” (35%). Negative feelings surrounding the election may be related to dissatisfaction with the candidates themselves. The poll, fielded before the first presidential debate between President Biden and former President Trump, found over half (55%) of Hispanic women voters say they are dissatisfied with their options for president, including a quarter (27%) who say they are “not at all” satisfied.

Younger Hispanic women voters are particularly disaffected this election cycle. One-third (32%) of those ages 18 to 44 say they are less motivated to vote compared to previous presidential elections (19% of Hispanic women voters ages 45 and older respond similarly), and a quarter (26%) say they would not vote if the election were held today. Younger Hispanic women are also more likely to identify as independent compared to those 45 and older (40% vs. 25%). This patten is consistent across racial and ethnic groups nationally, with younger women more likely than their older counterparts to identify as independent.

One-Third of Younger Hispanic Women Voters Are Less Motivated to Vote Than in Previous Elections; One in Five of Their Older Counterparts Say the Same

In addition, the KFF Survey of Women Voters, which was fielded in late May to early June, finds lack of motivation to vote among younger Hispanic women may be related to their mixed views on the candidates’ records. Half (52%) of Hispanic women voters ages 18 to 44 say they were better off financially during Trump’s presidency, compared to one in ten who say they are better off now under President Biden and about four in ten (37%) who say there is no difference. Financial security appears top of mind for this voting bloc, among whom six in ten cite inflation as the top issue determining their vote (62%).

Younger Hispanic Women Voters Are More Likely Than Their Older Counterparts to Say They Were Better Off Financially Under Trump’s Presidency

Though Trump may have a comparative advantage on voters’ perceptions of their financial situations during his presidency, Biden does better among younger Hispanic women voters on reproductive health issues. This group is over twice as likely to say they trust Biden over Trump to do a better job deciding policy related to abortion access (40% vs. 19%) and birth control access (45% vs. 18%) in the U.S. Though once again, four in ten say they trust neither candidate to do a better job in each of these areas (41% and 37%, respectively).

Hispanic Women Voters Across Age Groups Are More Likely to Trust Biden Over Trump on Reproductive Health Policy, Though Four in Ten Younger Voters Trust Neither Candidate

#3: In Arizona, a Key Battleground State, the Arizona Right to Abortion Initiative May Drive Turnout Among Younger Hispanic Women Who Support Abortion Rights

Analysis suggests that turnout of young Hispanic voters in Arizona was a key part of President Biden’s narrow victory in the state in 2020. The candidate who wins the 11 electoral college votes in this swing state in 2024 could tip the scale for who wins the presidency, especially if this crucial voting bloc turns out once again.

Fielded in late May to early June, the KFF Survey of Women Voters finds about one third (32%) of younger Hispanic women voters ages 18 to 44 in Arizona say there is a 50-50 chance or less of voting in the upcoming November election. Just 7% of older Hispanic women voters, ages 45 and older, say the same. These younger voters are also more likely to not affiliate with either political party (40% vs. 14% who identify as independents). These patterns among younger Hispanic women voters in Arizona are also found among this group nationally.

If the presidential candidates are not motivating younger Hispanic women in Arizona to vote, a citizen-initiated amendment to the state constitution enshrining abortion rights, which will likely appear on the ballot, may encourage this group to turn out. A large majority (82%) of Hispanic women voters ages 18 to 44 say they support the Arizona Right to Abortion Initiative, which would establish a fundamental right to abortion until fetal viability, typically between 23 and 25 weeks of pregnancy. Notably, two-thirds (67%) of younger Hispanic women voters say they would be more motivated to vote if it makes it on the state ballot. Smaller shares of Hispanic women ages 45 and older say they support the measure (46%) and would be more motivated to vote if it is on the ballot (45%).

Young Hispanic Women in Arizona Overwhelmingly Support the Arizona Right to Abortion Initiative, While Older Women Are More Divided
In Arizona, Two-Thirds of Younger Hispanic Women Voters and Half of Older Hispanic Women Voters Would Be More Motivated To Vote if the State Measure To Enshrine Abortion Rights Was on the November Ballot

#4: President Biden Has the Advantage Among Hispanic Women in Arizona on Abortion, Though Many Still Trust “Neither Candidate”

During the first presidential debate in June (held after the field period for the survey), both President Biden and former President Trump reaffirmed their stances on abortion. Biden declared his commitment to restoring Roe v. Wade, which would secure a federal right to abortion until fetal viability, akin to the Arizona Right to Abortion Initiative which young Hispanic women in the state overwhelmingly support. In contrast, Trump stated the legal status of abortion should be left to the states to decide, a policy stance that 77% of younger Hispanic women voters from Arizona oppose. A majority (59%) of Hispanic women voters in Arizona, regardless of age, say this year’s election for president will have a “major impact” on access to abortion and reproductive health care in their state. However, while younger Hispanic women voters are twice as likely to say they trust Biden over Trump when it comes to deciding policy related to abortion and birth control access in the U.S., three in ten or more still say they trust “neither” candidate.

One-Third or More of Young, Hispanic Women Voters in Arizona Trust Neither Presidential Candidate to Decide Reproductive Health Policy

Hispanic women who cast their ballot in the upcoming 2024 presidential election will be deciding between two candidates whose incoming tenure will address policy related to inflation, threats to democracy, immigration, and abortion – all top issues determining the vote of this growing voting bloc. In Arizona, a state with a growing Hispanic electorate that is majority younger and female, it is unclear whether turnout of young Hispanic women who may show up to vote for the Arizona abortion rights measure will translate to an advantage for either candidate. With substantial shares declaring trust in neither candidate to address reproductive health issues, alongside disaffection towards the election overall, the presidential nominees will each need to convince this bloc of largely disaffected voters that his presidency will best address their needs and top issues.

  1. Hispanic women voters include any women voters who identify as Latino or Hispanic, regardless of racial identity. ↩︎
  2. The most recent Consumer Price Index, measuring the rate of inflation between May 2023 and May 2024 is 3.3%. ↩︎