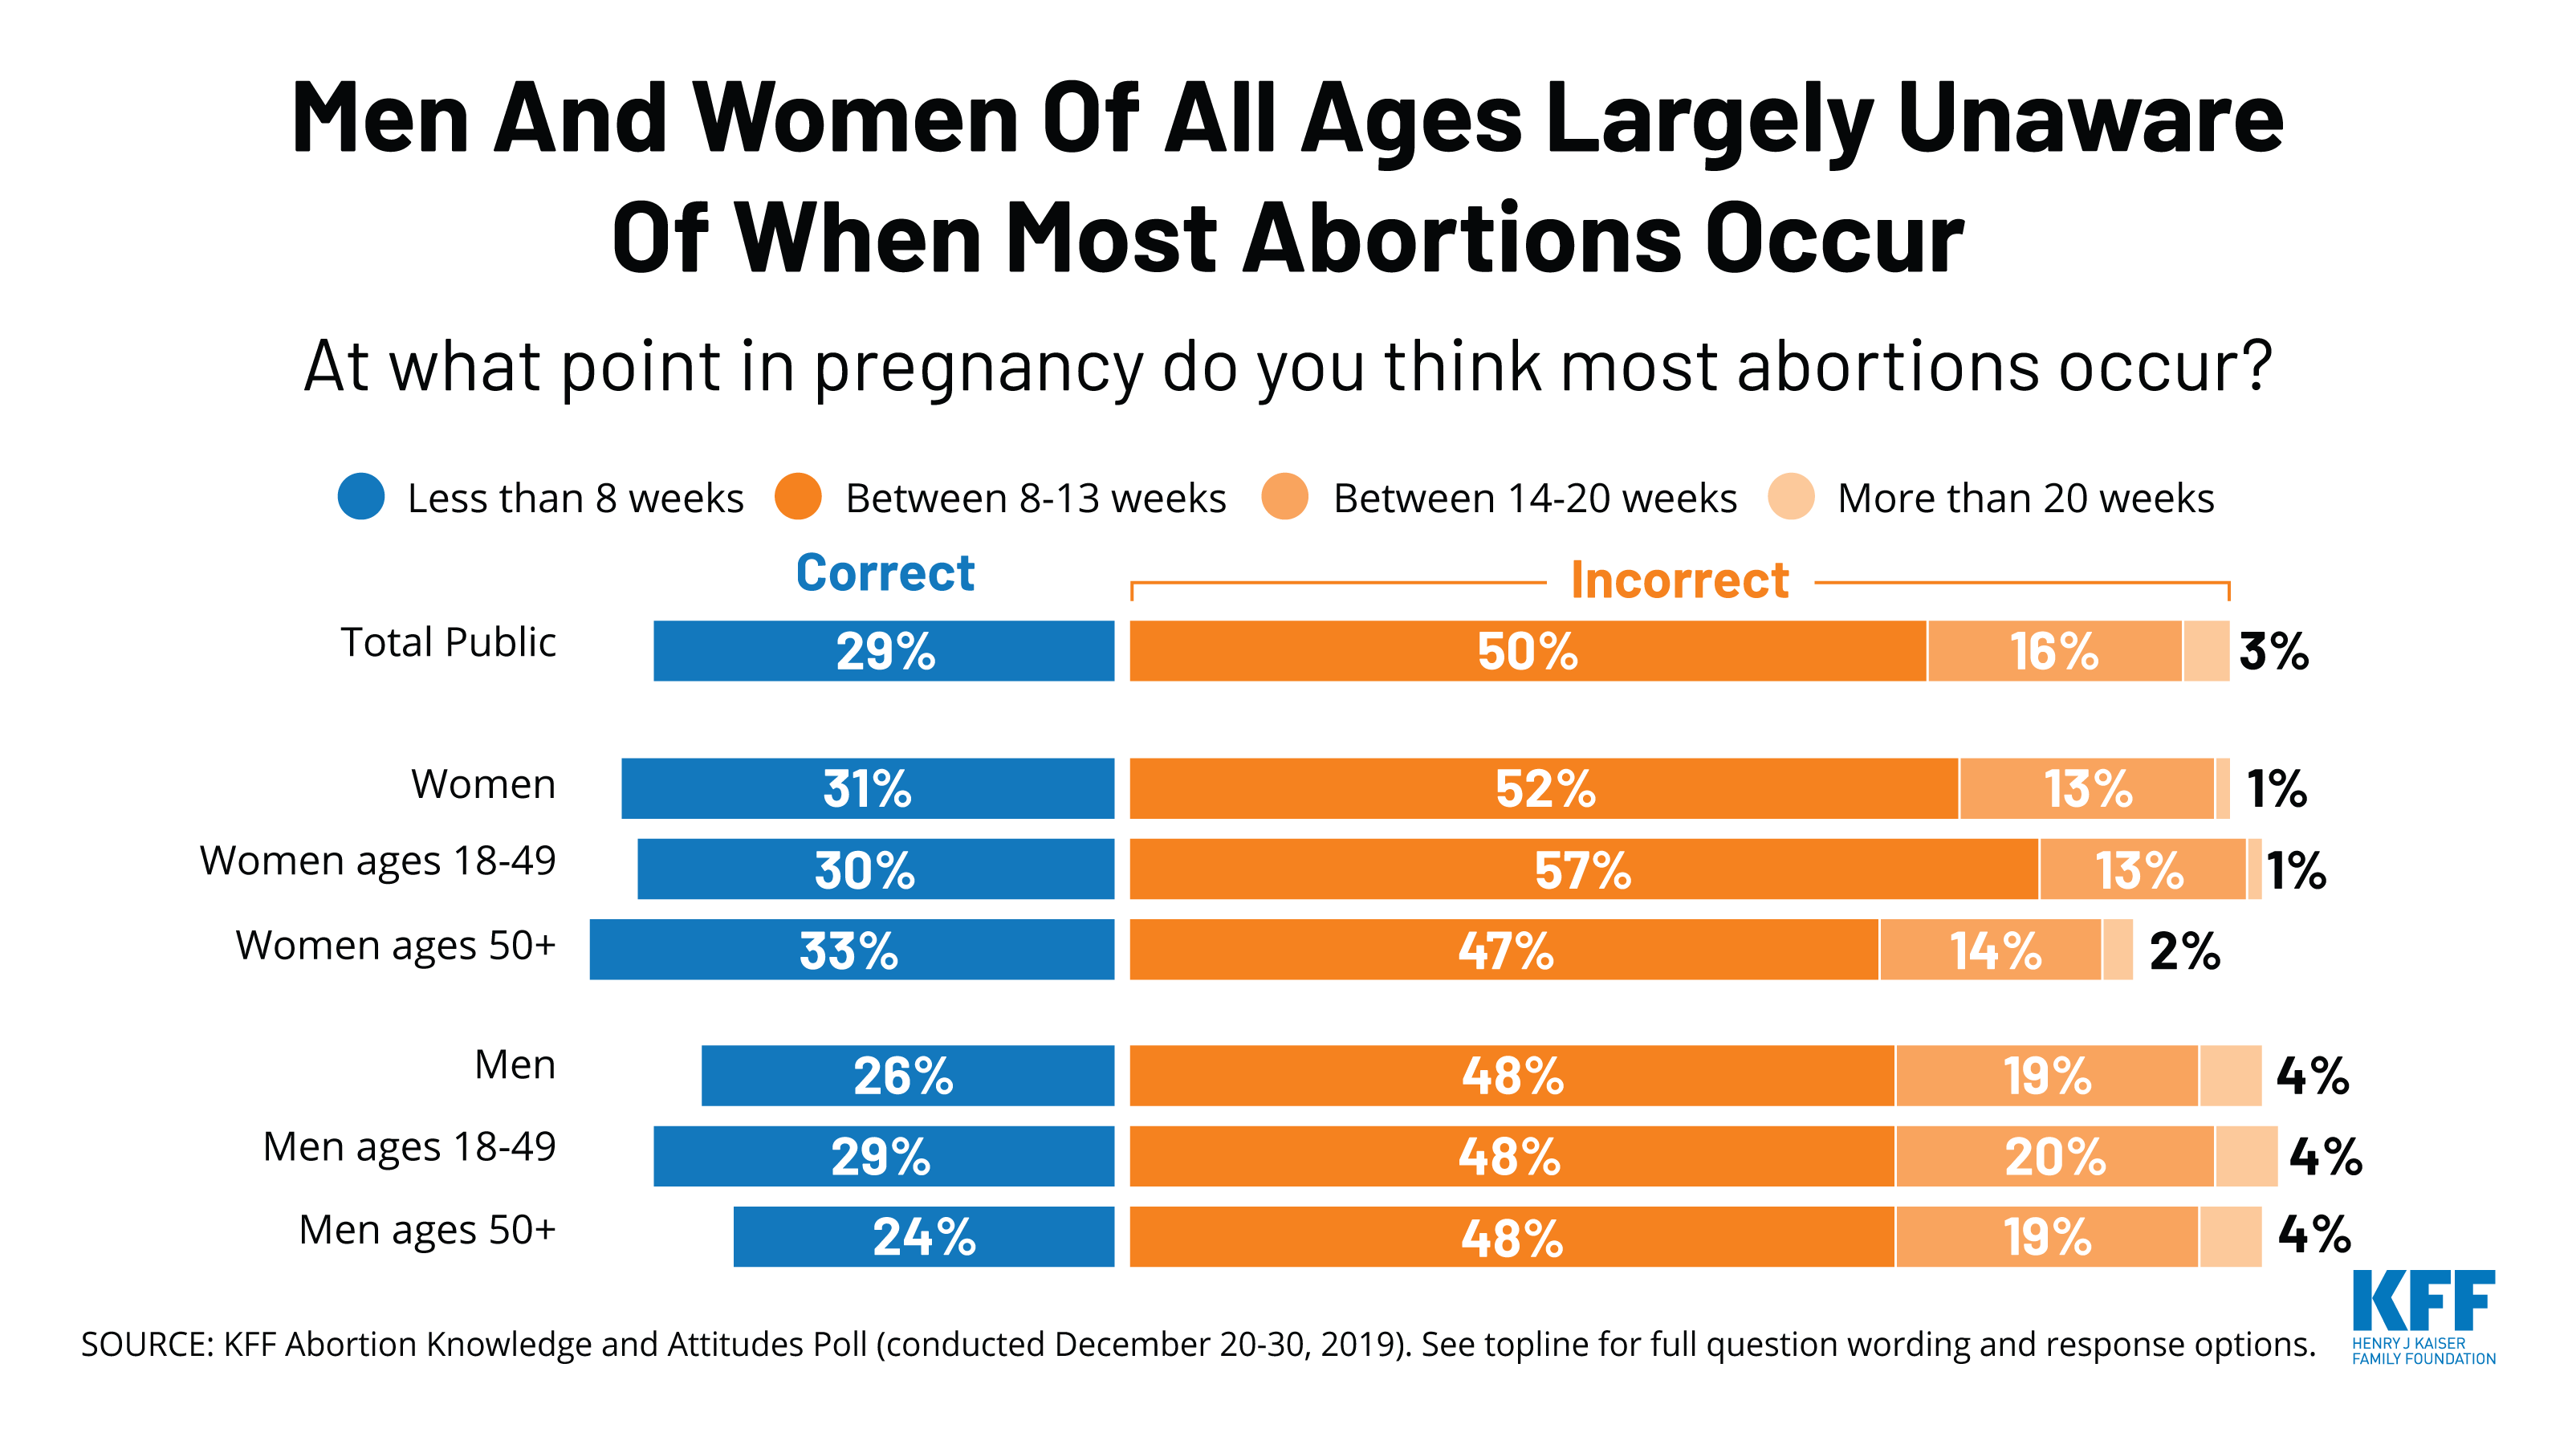
Men And Women Of All Ages Largely Unaware Of When Most Abortions Occur
Source
Abortion Knowledge and Attitudes: Polling and Policy Insights
The independent source for health policy research, polling, and news.
Abortion Knowledge and Attitudes: Polling and Policy Insights
The cost of prescription drugs is a leading health policy issue in the United States, with 79% of the public believing that the cost of prescription drugs is unreasonable1 and both major parties introducing legislation aimed at lowering drug costs.2 Though much of the focus of the current debate is on the effect of drug prices on consumer spending within Medicare and commercial insurance, proposed policy changes may have implications for Medicaid as well. In addition, as part of ongoing efforts to control drug costs, there is renewed interest in drug prices and reimbursement within Medicaid as a major component of Medicaid spending, along with utilization. Changes made in 2016 to federal rules governing how state Medicaid programs pay for drugs aimed to make the prices paid more accurate, but increased reliance on pharmacy benefit managers (PBMs) poses challenges to drug price transparency. This brief explains Medicaid prescription drug prices to help policymakers and others understand Medicaid’s role in drug pricing and any potential consequences of policy changes for the program by answering the following questions:
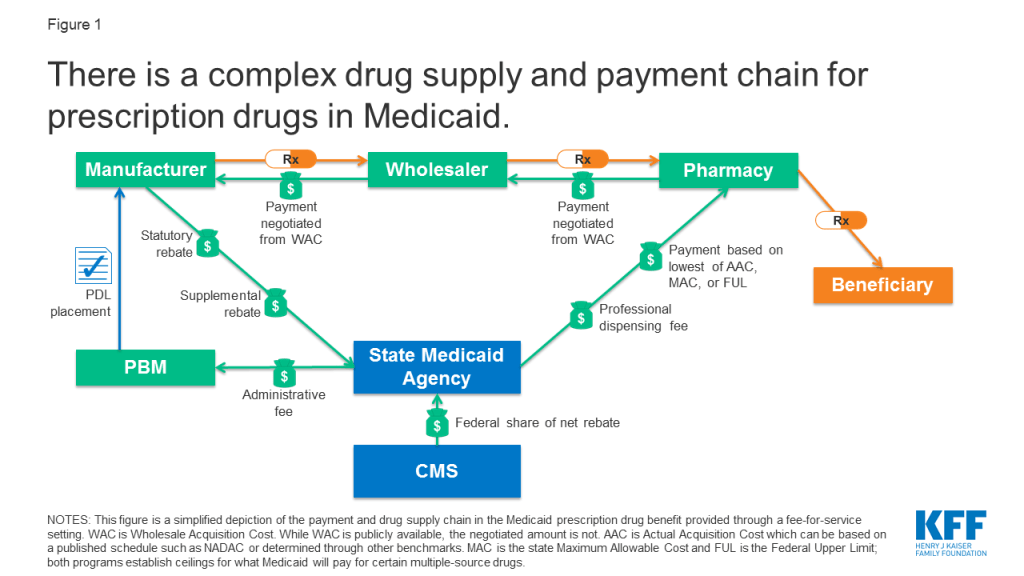
Medicaid payments for prescription drugs are determined by a complex set of policies, at both the federal and state levels, that draw on price benchmarks (Box 1). States have some flexibility within federal guidelines to set the payment amounts. Price benchmarks represent prices paid by different parties at different stages in the drug manufacturing, acquisition, and dispensing processes. Because price benchmarks are related to one another, the prices paid throughout the drug distribution process have an effect on the final price that Medicaid pays.
Box 1: Key Terms and Prices in Medicaid Drug Pricing
AAC: Actual Acquisition Cost is the state Medicaid agency’s determination of pharmacy providers’ actual prices paid to acquire drug products marketed or sold by a specific manufacturer. AAC is the current Medicaid benchmark to set payment for drug ingredients.
AMP: Average Manufacturer Price is the average price paid to the manufacturer by wholesalers and retail community pharmacies that purchase drugs directly from the manufacturer. AMP is used to calculate drug rebates under the Medicaid Drug Rebate Program.
AWP: Average Wholesale Price is the published list price for a drug sold by wholesalers to retail pharmacies and nonretail providers. It is akin to a sticker price and used as a starting point for negotiation for payments to retail pharmacies.
Best Price: The lowest available price to any wholesaler, retailer, or provider, excluding certain government programs like the 340B drug pricing program and the health program for veterans.
EAC: Estimated Acquisition Cost is a benchmark previously used by many state Medicaid programs to set payment for drug ingredient cost.
FUL: The Federal Upper Limit sets a reimbursement limit for some generic drugs; calculated as 175% AMP.
MAC: Maximum Allowable Cost is a reimbursement limit set by states in addition to the FUL.
NADAC: The National Average Drug Acquisition Cost is intended to be a national average of the prices at which pharmacies purchase a prescription drug from manufacturers or wholesalers, including some rebates. NADAC can be used to calculate AAC.
WAC: Wholesale Acquisition Cost is the manufacturer’s list price to wholesalers. The WAC represents manufacturers’ published catalog, or list, price for sales of a drug (brand-name or generic) to wholesalers. However, in practice, the WAC is not what wholesalers pay for drugs.
State Medicaid programs reimburse pharmacies for prescription drugs based on the ingredient costs for the drug and a dispensing fee for filling the prescription.3 Medicaid agencies do not buy drugs directly from manufacturers. Rather, they reimburse retail pharmacies that fill prescriptions written for Medicaid enrollees. The amount the pharmacy receives is based on the ingredient cost of the drug and professional dispensing fees paid by Medicaid, plus any cost sharing paid by the beneficiary (Figure 1). For beneficiaries who receive their drug benefit through managed care organizations (MCOs), MCOs reimburse the pharmacy, usually through the use of a PBM.
States set policies on dispensing fees and, within federal guidelines, beneficiary cost-sharing, while federal regulations guide payment levels for ingredient costs. With the exception of some multiple-source drugs for which there are specific federal or state limits, federal regulations require Medicaid programs to reimburse pharmacies based on the lesser of the (1) ingredient cost, as defined by federal guidelines, plus a professional dispensing fee; or (2) the pharmacy’s “usual and customary charge” to the public.4 The final cost to Medicaid is then offset by any rebates received under the federal Medicaid Drug Rebate Program or state-negotiated supplemental rebates.
The ingredient cost reflects the price to the pharmacy of actually acquiring the drug from a manufacturer or wholesaler and is calculated based on percentages of what pharmacies and wholesalers pay for the drug.5 Payment for ingredient cost is governed by average acquisition cost (AAC), which is the benchmark for setting payment for ingredient cost, capped at the lower of federal upper limits (FULs) or state maximum allowable costs (MAC) for some drugs. FULs and MACs may lead to lower prices for ingredient costs than AAC. States generally pay the lowest of the three benchmarks for any given drug.
In 2016, the Centers for Medicare & Medicaid Services (CMS) finalized regulations that changed Medicaid payment for ingredient cost from an “estimated acquisition cost” (EAC) to an “actual acquisition cost” (AAC).6 CMS defines AAC as the state Medicaid agency’s determination of pharmacy providers’ actual prices paid to acquire drug products marketed or sold by a specific manufacturer. States have flexibility within federal rules to calculate AAC, and CMS approves the states’ methodologies for calculation through the Medicaid state plan amendment (SPA) process. To determine AAC, states may survey pharmacies, use national survey data, or use the AMP data that manufacturers already are required to report to enable calculations of federal rebates and FUL pricing. States were required to be in compliance with the AAC rules by April 1, 2017.
CMS also publishes the NADAC, a federal survey of pharmacies that helps states to determine AAC. NADAC is designed to be a national reference file for determining AAC and consists of survey data from retail pharmacies to determine the prices they pay to manufacturers and wholesalers.7 NADAC is a voluntary survey of retail pharmacies of invoice prices; the prices do not include off-invoice discounts or rebates paid to plans or PBMs from manufacturers.
The Federal Upper Limit (FUL) program caps ingredient reimbursement for certain multiple-source drugs.8 Prices can vary widely between generic drugs.9 The intent of the FUL program is to make the government a prudent buyer — and reduce Medicaid expenditures — by basing payments on market prices for these drugs. CMS calculates a FUL amount for specific forms and strengths for each multiple-source drug that meets the established criteria. The federal government establishes maximum payment amounts for about 700 multiple-source drugs including both generics and originator brands for which generic versions are now available. The Affordable Care Act and subsequent rules set reimbursement at 175% of the weighted average of the most recently reported average manufacturer prices (AMP) for that drug. Federal law defines AMP as the average price paid to the manufacturer for the drug in the United States by (1) wholesalers for drugs distributed to retail community pharmacies and (2) retail community pharmacies that purchase drugs directly from the manufacturer.10 In instances in which FUL is less than AAC, FUL is calculated using a higher multiplier to reflect average retail community pharmacies’ acquisition costs. The revised FUL calculation is estimated to save Medicaid $2.7 billion from FY 2016 to FY 2020.11
Nearly all states apply maximum allowable cost (state MAC, or SMAC) limits to multiple-source drugs, which establish ceilings on reimbursement for the drug products included on state MAC lists.12 These state MAC amounts generally are part of a complex “lesser of” formula, where the state agency sets reimbursement for multiple-source drugs at the lowest amount for each drug based on (1) the state’s AAC formula, (2) the FUL (if applicable), (3) the state MAC or (4) the pharmacy’s usual and customary charge to the public. State MAC programs frequently include other drugs that do not have established FULs: a 2013 analysis by the U.S. Department of Health and Human Services’ Office of Inspector General (OIG) found that state MAC programs include 50-60% more drugs than FULs. States have flexibility in how they set MAC benchmarks: of 41 states that identified a pricing benchmark for their state MAC programs, 29 used pharmacy acquisition costs as part of the benchmark to set state MAC prices.13
The dispensing fee is intended to cover reasonable costs associated with providing the drug to a Medicaid beneficiary. This cost includes the pharmacist’s services and the overhead associated with maintaining the facility and equipment necessary to operate the pharmacy. States establish dispensing fees for the pharmacies that fill prescriptions for Medicaid beneficiaries. In most states, these fees typically range between $9 and $12 for each prescription.14 After moving to AAC, most states increased dispensing fees while ingredient costs decreased. A number of states reported that they expected savings or a neutral budgetary impact from implementing the changes.15 However, though AAC is less than EAC, savings are dependent on the total of ingredient cost plus dispensing fee. States may vary the professional dispensing fee by type of pharmacy, pharmacy prescription volume, or type of drug. For example, Medicaid may pay more in dispensing fees for a specialty drug or to a pharmacy filling fewer prescriptions.
States may impose nominal cost sharing for prescription drugs for some beneficiaries. A final component of Medicaid reimbursement for prescription drugs is cost sharing paid by the beneficiary. Federal law caps these amounts to $4 for preferred drugs and $8 for non-preferred drugs for individuals with incomes at or below 150% of the federal poverty level (FPL), with slightly higher caps for beneficiaries with higher incomes.16 Fifteen states do not impose cost-sharing for prescription drugs,17 and some beneficiary groups, such as children and pregnant women, or drug classes like family planning and tobacco cessation drugs are generally exempt from cost sharing requirements. In addition, pharmacies are required to dispense the drug regardless of the beneficiary’s ability to pay, resulting in inconsistent collection of this component of reimbursement at cost to the pharmacy.
MCOs and PBMs play an increasingly large role in administering Medicaid pharmacy benefits. This growth has occurred as states have enrolled more beneficiaries into managed care, more states opt to “carve in” their pharmacy benefits under contracts with MCOs, and states rely on PBMs for administrative support, negotiation of supplemental rebates, and clinical drug class reviews.18 In 2017, approximately two-thirds of Medicaid gross drug spending was administered through managed care.19
PBMs perform a variety of financial and clinical services for Medicaid programs, including price negotiation for MCOs.20 States may utilize PBMs in both managed care and fee-for-service (FFS) settings. PBMs acting on behalf of managed care companies negotiate individual prices with pharmacies and can set proprietary maximum allowable costs (MACs).21 PBMs operating under Medicaid FFS must abide by federal and state rules regarding drug pricing and reimbursement.
MCOs do not need to base pharmacy payment rates on AAC. Federal rules state that MCOs must set payment rates sufficient to guarantee beneficiary access, but MCOs are not bound by rules regarding ingredient costs like drugs purchased through FFS.22 Plans may have their own MAC lists and negotiate additional rebates with manufacturers. MCOs also may contract with a PBM that negotiates individual rates with pharmacies rather than a set payment rate.23
The use of MCOs and PBMs means prices paid for drugs for Medicaid beneficiaries are not always transparent, because MCOs are not subject to the same drug payment rules as in FFS. Many prices are not publicly known or even known to states, as MCOs keep some pricing information proprietary in their negotiations with pharmacies. This lack of transparency is particularly true for generic drugs, which represent around 84% of total paid claims and 18% of total spending.24
Drug list prices affect not only the reimbursement paid to the pharmacy in ingredient costs but also the amount of rebates the Medicaid program receives. Under the Medicaid Drug Rebate Program, Medicaid receives a rebate for prescription drugs reimbursed under the program. Rebates are calculated based on a share of the average price paid to manufacturers and include an inflationary component to account for rising drug prices over time. Thus, the larger the gross price of a drug and the faster the price increases over time, the larger the rebate that Medicaid receives. The rebate program substantially offsets Medicaid spending on drugs: In 2018, Medicaid spent $60 billion on drugs and received $36 billion in rebates.25 While gross prescription drug spending has increased substantially over time, rebates have held net spending growth to a much slower rate.
Because of the large role of rebates in reducing Medicaid drug costs, the drug with the lowest price is not always the drug that costs the least. Because generic drugs are usually lower-cost but still therapeutically equivalent to brand name drugs, most state Medicaid programs require generic substitution unless the prescriber specifies that the brand is medically necessary. However, there are some instances where, due to the structure of the rebate program, the generic drug is not the lowest cost drug to the program.
States are increasingly comparing the net cost of the brand drug to the net cost of the generic drug to make sure that the state is paying the lowest price, also known as “brand-over-generic” programs.26 Estimates suggest these programs can lead to substantial savings. This is especially the case at the initial entrance of a generic equivalent into the market, when a state may still have supplemental rebate agreements and other large rebates that offset the price of the brand drug. New York is one state with a specific program that promotes the use of brand-name drugs over generics whenever the brand name drug is less expensive to the program. As of the release of this brief, there are 30 drugs on the program list.27
Given increased national attention on drug prices, there are myriad policy proposals at both the state and federal level to lower drug costs. Many of these proposals may impact Medicaid’s ultimate payment for drugs, such as a use of value-based purchasing, the “Netflix” subscription model, and changes to rebates, but not all are specifically aimed at underlying drug prices. Drug importation proposals to allow payers or customers in the US to purchase drugs from foreign nations at those nations’ prices have gained traction in some states and at the federal level, but the impact on Medicaid prices is unclear at this point as these proposals are still under development. Two policy areas that may directly affect Medicaid prices are market-wide trends in drug prices and efforts to address drug price transparency.
The cost burden of high-cost and specialty drugs makes new and first-in-class drugs a pressing policy area for Medicaid agencies. Because of the structure of the Medicaid drug rebate program, states must cover nearly all drugs, including new, blockbuster drugs once they are approved by the Food and Drug Administration (FDA).28 Some “blockbuster” drugs can cost from tens of thousands to over a million dollars. The introduction of new drugs can be particularly challenging for Medicaid programs in the initial phases of coverage, as states work out prior authorization requirements or coverage guidelines. States identified the cost of specialty drugs as one of the factors behind a projected increase in Medicaid spending in 2020.29
While generics are priced lower than brand name drugs, the cost of generics has also been rising in recent years.30 These price increases reflect a combination of factors, including decreasing competition within the generic market and a drop in the number of generic manufacturers, as well as delays in FDA generic approvals and supply or manufacturing challenges for some drugs, among other reasons.22 Despite the rebate calculation including an inflationary component, the complex, interrelated nature of pricing and reimbursement means that cost increases for generic drugs in Medicaid are not necessarily limited. Additionally, some believe that even limiting Medicaid spending for generics to inflation is problematic, as the expectation is that the price of generic drugs will decline over time due to competition.31
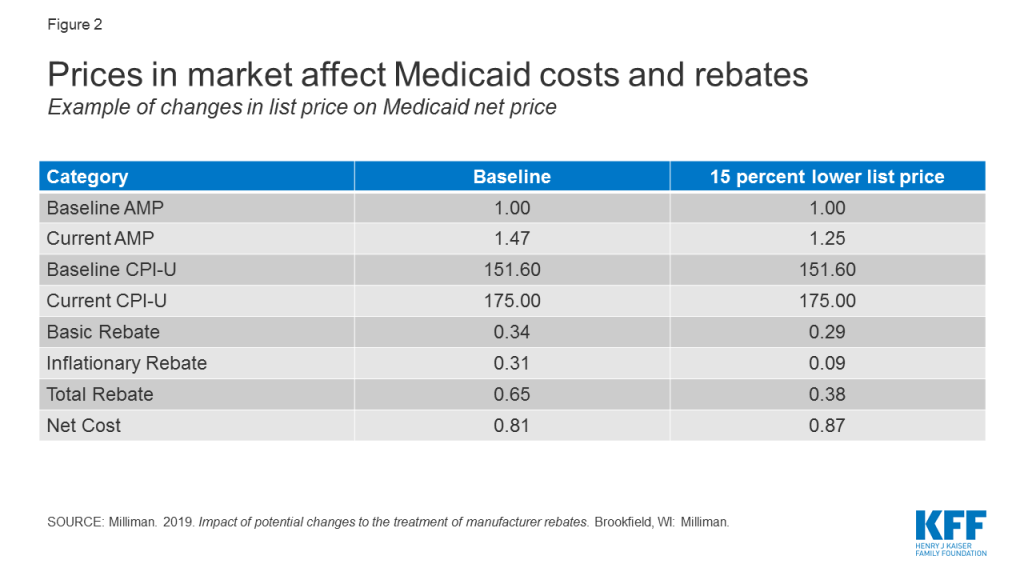
Though they are not specifically targeted to Medicaid, policy proposals to change the structure of rebates or prices in Medicare and the private market also affect Medicaid. These indirect effects occur because many proposals affect list prices or AMP, which in turn affect Medicaid rebate calculations and reimbursement rates to pharmacies. For example, proposals (such as those made by the Trump Administration32 and by House Democrats) to align Medicare drug prices more closely with drug prices in other countries could have implications for Medicaid drug spending by changing drug list prices. Policy changes that would allow the federal government to negotiate Medicare prices also may have implications for Medicaid, depending on how the price applies to the wider marketplace and the prices used to set Medicaid rebates.33 Because a large share of Medicaid rebates for some drugs can be attributed to inflationary increases, proposals that lower the baseline price of a drug may actually increase the net cost of the drug to the Medicaid program by significantly reducing the inflationary rebate (Figure 2).
There are many opaque aspects to the pricing of prescription drugs in general and specifically within Medicaid. Though price benchmarks like WAC and AWP are collected, they are not always easily accessible, and determining actual prices paid is difficult without access to a private database. Many negotiated prices are proprietary and known only to the parties involved. In addition, manufacturers do not provide public information on how they set this list price and historically have not been required to explain changes in a product’s list price.34 PBMs add another layer of opacity, as the prices they pay manufacturers and reimbursement they pay pharmacies is often unknown. Proposals to make drug pricing information more publicly available at the federal level include making NADAC a mandatory survey and increasing the amount of information collected by the survey.
Although most believe it would not directly lower drug costs, some feel that increased drug pricing transparency would help policymakers better understand which prescription drugs and which parts of the supply chain are spending drivers. 35 Transparency laws would make information that may be available only to a state Medicaid agency or PBM available to the general public and other state lawmakers.36 The public highly favors drug pricing transparency, with a recent poll finding that 86% of Americans would like drug companies to publicly release information on how prices are set.37
Several states have included public reporting as a component in broader prescription drug initiatives, and several states have passed laws focused on pricing transparency. These laws vary in scope, focus of drug class, and actor, as well as how they report information.38 Laws promoting drug transparency tend to focus on manufacturers and WACs, but the pharmaceutical industry has argued that policymakers should also seek transparency throughout the supply chain, including PBMs.39 Policy proposals at the federal level also address drug price transparency. The Senate Finance Committee bill would require manufacturers to report information to the Secretary of HHS to justify certain increases in the WAC of prescription drugs.40
Manufacturer transparency laws focus on publicizing information about WACs, which feed into prices and payment throughout the system. Many laws focus on requiring manufacturers to disclose their methodology for setting prices or setting formularies or provide advance notice of some price increases. Vermont was the first state to pass drug transparency legislation in June 2016. It did so with the purpose of understanding drug cost drivers statewide. The Vermont law directs the two separate agencies to collaborate to identify up to 15 costly drugs from separate drug classes with large WAC increases, posting them online. The manufacturers must then provide justification for these price increases to the Attorney General, who presents findings to the General Assembly.41 Oregon and Nevada require manufacturers to report profits for certain drugs, and in Maine, manufacturers must report to the state’s all-payer claims data program when they increase the WAC of a drug by a certain threshold42 ,43 ,44 . Those skeptical of the impact of some state laws argue that most are still focused on list prices and WAC and thus do not reveal true transaction prices.45
Price transparency is a particular challenge under PBM arrangements, as PBM drug prices are opaque, particularly for generic drugs where prices vary considerably.46 PBMs that negotiate prices on behalf of MCOs are not subject to the same rules about AAC-based payment and set their own pharmacy payments that are not known to states.47 Managed care programs usually pay PBMs a discount off the AWP, akin to a sticker price, for generic claims. The AWP does not reflect the acquisition cost for generic drugs.48 PBMs pay pharmacies a negotiated MAC that is proprietary and is also not known to states. The difference between the AWP-based payment and the MAC is referred to as the “spread,” or profit of the PBM. Because the components of the spread are often unknown, many states do not know how much profit PBMs retain.
Lack of transparency is leading some states to question whether these management methods produce savings or generate additional costs. 49 In 2018, a report by Ohio’s state auditor found that PBMs cost the state program nearly $225 million through spread pricing in managed care.50 ,51 Similar analysis by the Massachusetts Health Policy Commission found that PBMs charged MassHealth MCOs more than the acquisition price for generic drugs in 95% of the analyzed pharmaceuticals in the last quarter of 2018.52 Michigan found that PBMs had collected spread of more than 30% on generic drugs and a report found that the state had been overcharged $64 million.53 Other states have released similar reports finding high amounts of spread on generic prescriptions.54 Concerns about Medicaid spread pricing led CMS to issue guidance in May 2019 about how managed care plans should report spread pricing.55
States are addressing concerns about PBM spread pricing through a variety of policies, like licensure requirements, reporting requirements, and increased oversight. For example, after the 2018 report, Ohio prohibited its managed care plans from contracting with PBMs that use spread pricing.56 Since then, the state has announced it will move to contract with a single PBM for its entire managed care program starting July 2020, with enhanced transparency reporting requirements.57 Michigan is planning to no longer use PBMs and to use FFS to pay for its prescription drugs.58 Other states like Nevada have implemented policies establishing PBMs as fiduciaries with a duty to act in the best interest of pharmacies and beneficiaries.59 Federal legislative proposals would prohibit spread pricing by PBMs in Medicaid managed care.60
The price Medicaid pays for drugs is the result of a complex set of factors and inputs. Recent changes to price benchmarks attempt to move payments closer to actual pharmacy acquisition costs. Attention to high list prices continues at both the state and federal levels with a number of policy proposals aimed at lowering drug prices. Policy changes to lower drug prices will have implications for the Medicaid program so it is important to understand the program’s role and how the program pays for drugs.
| This work was supported in part by Arnold Ventures. We value our funders. KFF maintains full editorial control over all of its policy analysis, polling, and journalism activities. |
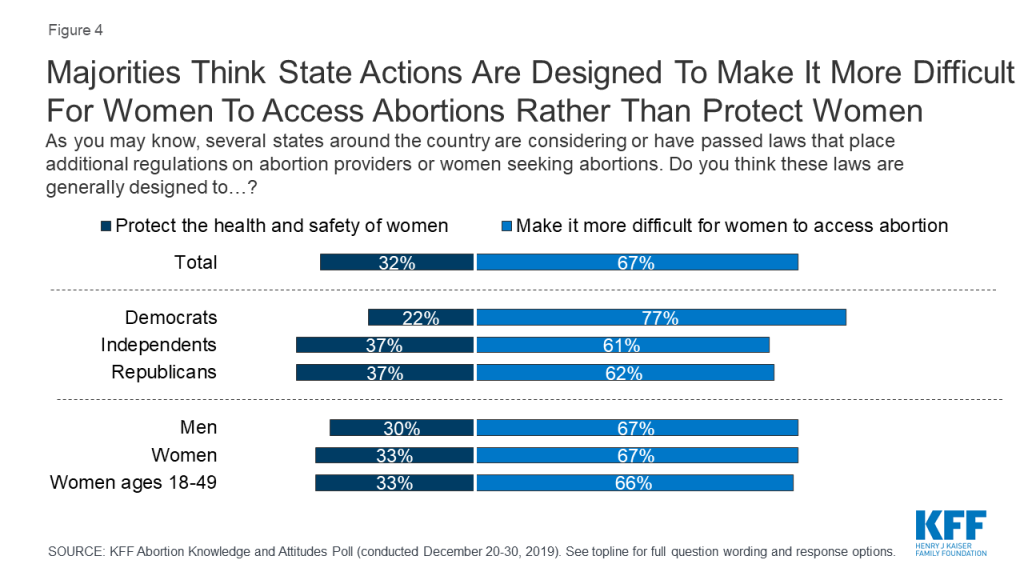
The latest KFF poll finds most Americans (67%) think recent state-level abortion restrictions are designed to make access to abortion more difficult, rather than protect women’s health and safety. These state-level abortion restrictions have become more common in the last several years – with lawmakers arguing that these laws are intended to protect women’s health and safety.
Overall, twice as many think recent state actions are generally designed to make it more difficult for women to access abortion (67%) rather than protect the health and safety of women (32%). Three-fourths of Democrats (77%) as well as six in ten independents (61%) and Republicans (62%) say these state laws are designed to make it more difficult for women to access abortions. The poll also found the public overwhelmingly thinks that decisions about abortions should be made by women in consultation with their doctors (79%) rather than having lawmakers decide when abortions should be available and under what conditions (20%).
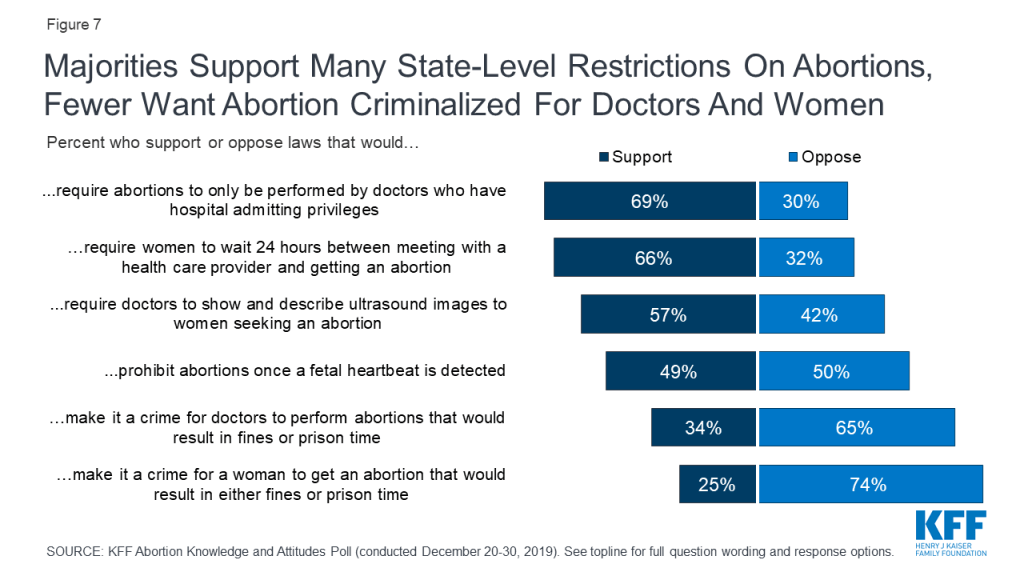
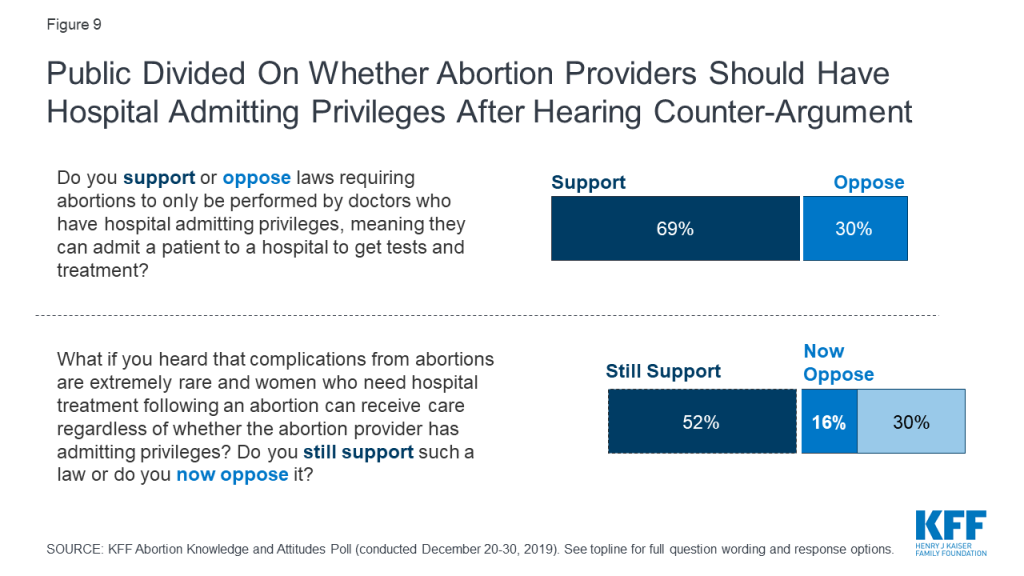
Despite knowing that these state actions are intended to reduce access to abortion, the poll also found that many support some of these regulations, including laws that require abortion providers to have admitting privileges at nearby hospitals (69%) and laws that prohibit abortions once cardiac activity is detected (49%).
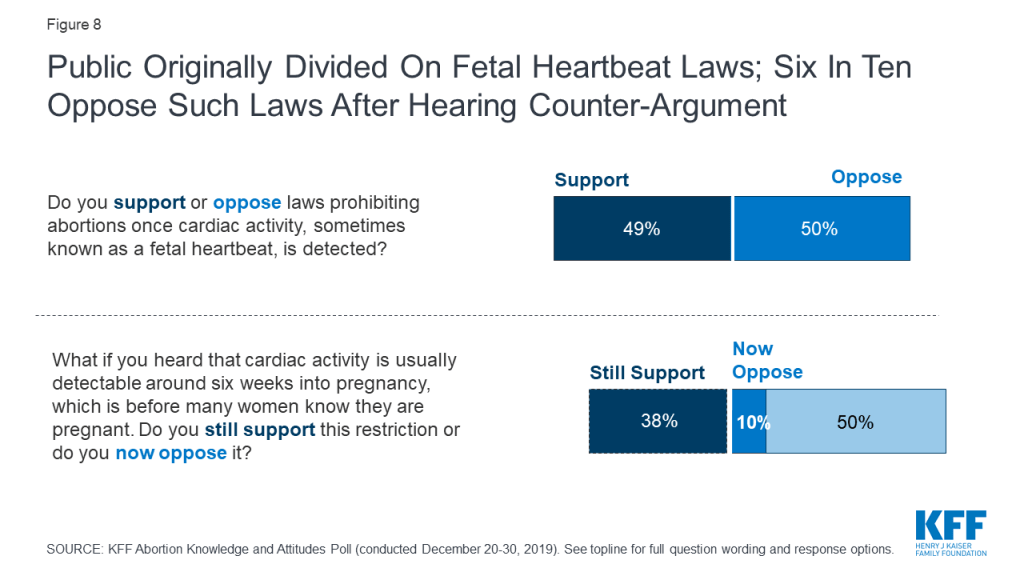
However, opinions on many state-level abortion laws can change once people hear counter-arguments. Support for admitting privilege requirements drops 17 percentage points to 52 percent after hearing that complications from abortions are extremely rare and women who need hospital treatment following a procedure can receive care whether or not the provider has admitting privileges. Support for fetal heartbeat laws drops 11 percentage points to 38 percent after hearing that cardiac activity is usually detectable around six weeks into pregnancy, before most women know they are pregnant.
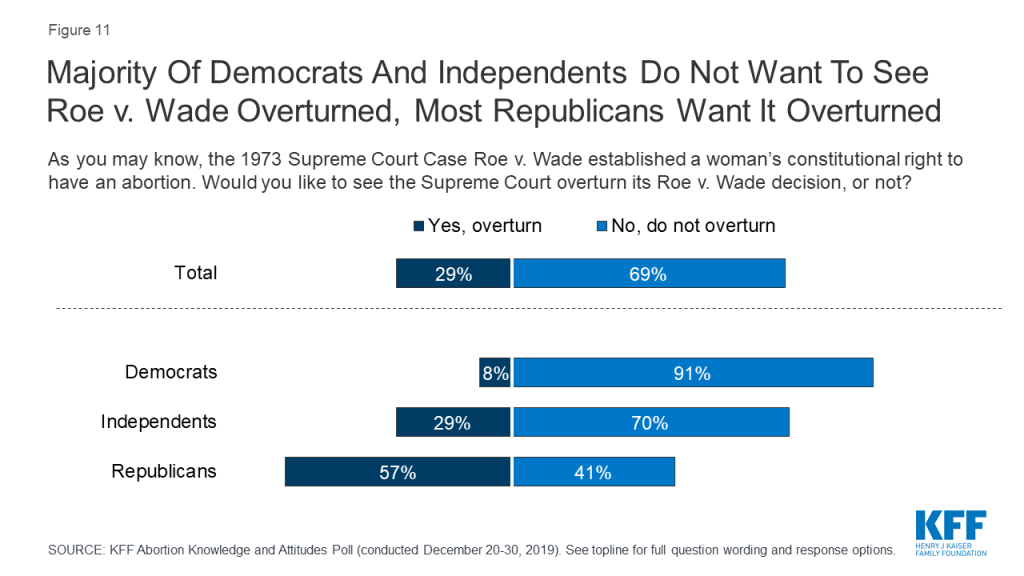
Nearly five decades since the Supreme Court decision in Roe v. Wade, a majority (69%) of the public do not want to see the Supreme Court overturn the 1973 landmark case. While a majority of Republicans (57%) would like to see Roe overturned, larger majorities of Democrats (91%) and independents (70%) do not want it overturned.
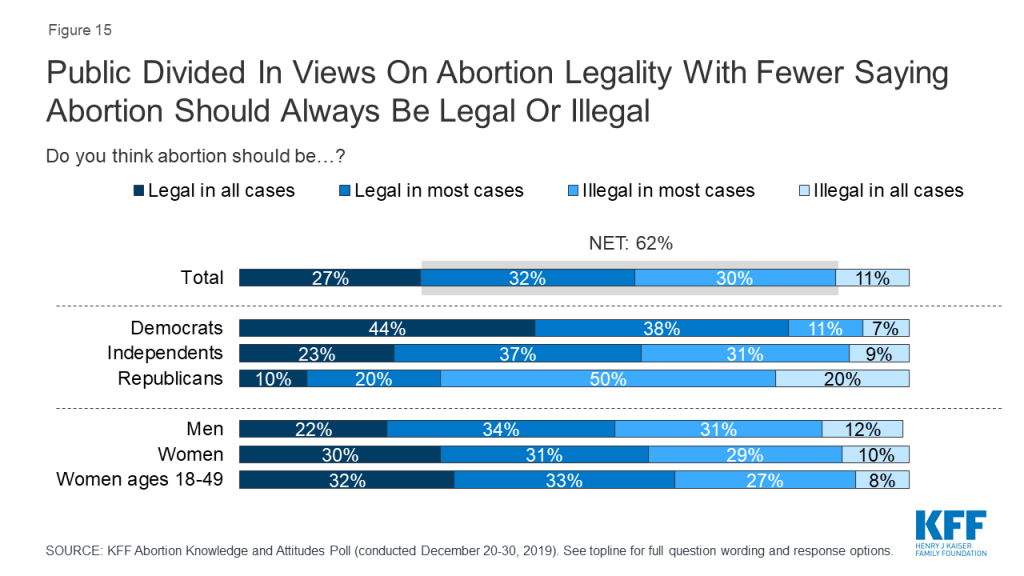
Few (11%) think abortion should be illegal in all cases, with the remainder saying abortion should be legal in all cases (27%), legal in most cases (32%), or illegal in most cases (30%). Large majorities think abortion should be legal if the patient’s life is endangered (82%), in cases of rape or incest (80%), if the fetus is not expected to survive (75%), or if the fetus is expected to have serious birth defects (71%). A smaller majority say abortion should be legal for women who do not want to be pregnant (55%).
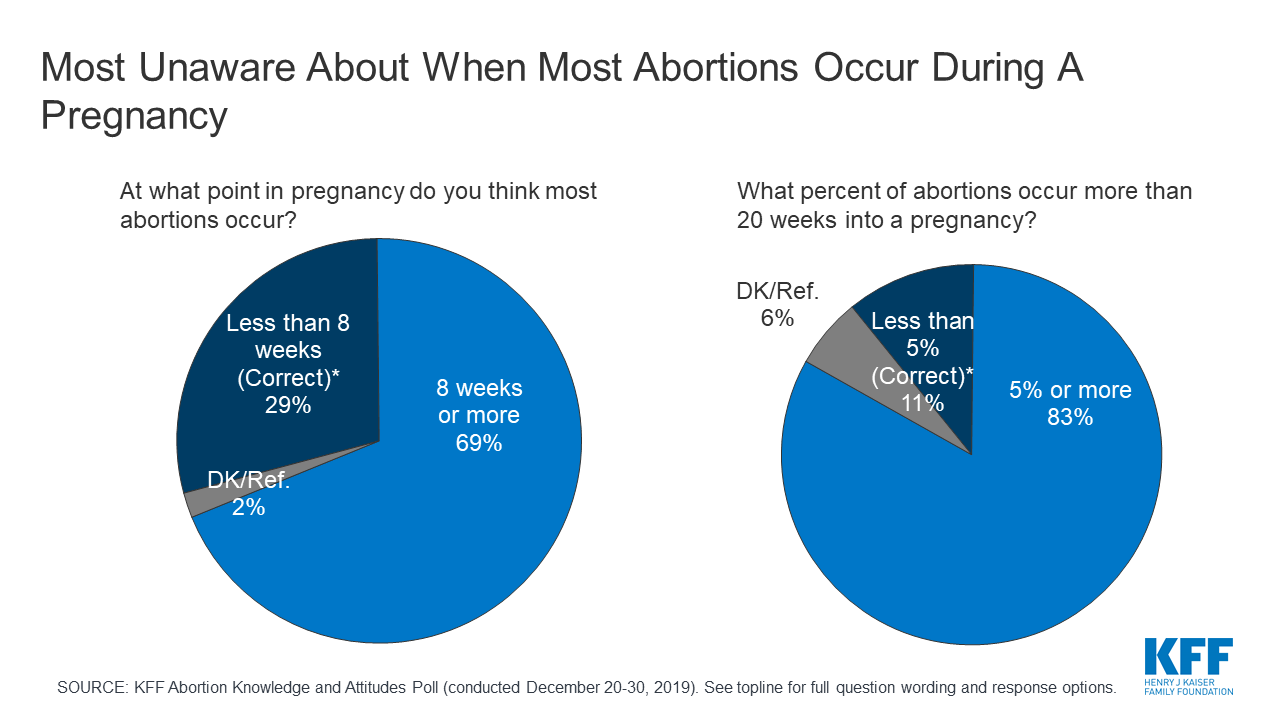
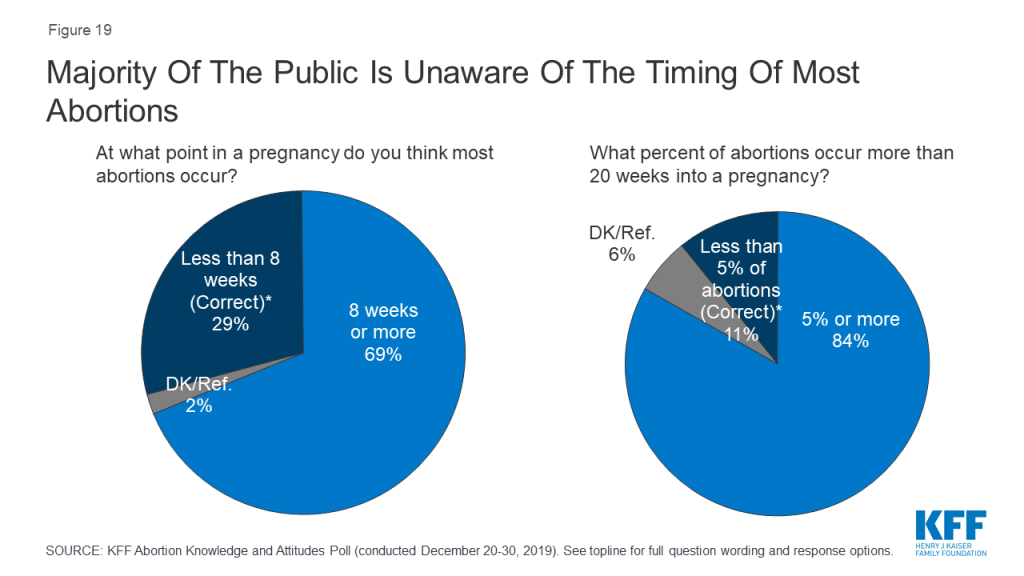
The poll also finds there are significant knowledge gaps on abortion among the public. A majority (69%) incorrectly think most abortions occur 8 weeks or later into a pregnancy and few (11%) are aware that less than 5% of abortions occur more than 20 weeks into a pregnancy.
In addition, only about one-fifth of adults (21%) and one-third of women between the ages of 18 and 49 (36%) have ever heard of Mifepristone, or a medication abortion.
Despite an increase in state-level abortion regulations and ongoing court cases regarding reproductive health care, these issues do not appear to be a priority in the 2020 election for most voters – even among Democrats. Health care generally is the top issue that Democrats want to hear discussed by the 2020 presidential candidates, with one-third calling it the most important issue. Only six percent of Democrats cite reproductive health issues, including birth control and abortion, as their chief concern.
METHODOLOGY
Designed and analyzed by public opinion researchers at KFF, the poll was conducted December 20-30, 2019 among a nationally representative probability-based sample of 1,215 adults including an oversample of 351 women, 18-49 years old. Interviews were conducted in English and Spanish online (1,100) and on the phone (115). The margin of sampling error is plus or minus 3 percentage points for the full sample and 6 percentage points for women, 18-49. See topline for margin of sampling error for other subgroups.
KFF has a long history of providing insights into national and state-level reproductive health care policy including a series of public opinion polls examining the experiences and attitudes of the general public and the group most likely to be impacted by such policies – women between the ages of 18 and 49. In recent years, many states have passed laws restricting access to abortion and the Trump administration has made a number of changes to federal reproductive health policy, including major changes to the federal Title X family planning program.1 This polling and policy analysis includes new polling data on federal and state reproductive health policy in the U.S. as well as knowledge of abortion and its safety.
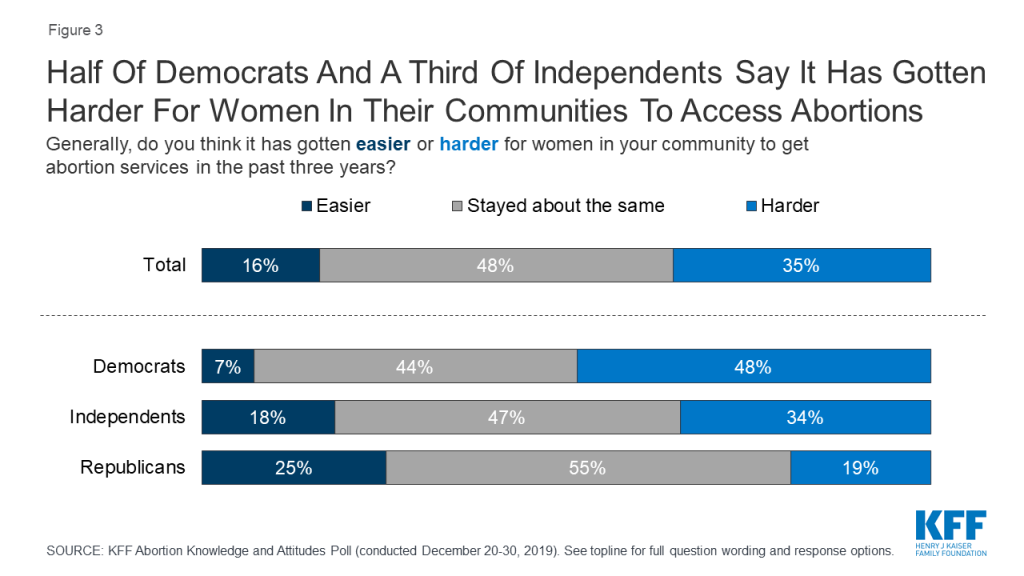
In the last several years, over 250 abortion clinics have closed across the U.S. and there are currently six states with one abortion clinic remaining: Kentucky, Mississippi, Missouri, North Dakota, South Dakota, and West Virginia. The most recent KFF poll finds about half of Democrats (48%) and one-third of independents (34%) say it has gotten “harder” for women in their community to get abortions during the last three years. On the other side of the aisle, most Republicans (55%) don’t think women’s ability to get abortion services in their community has changed under the Trump administration.
Box 1: Key Facts about Abortion in the U.S.
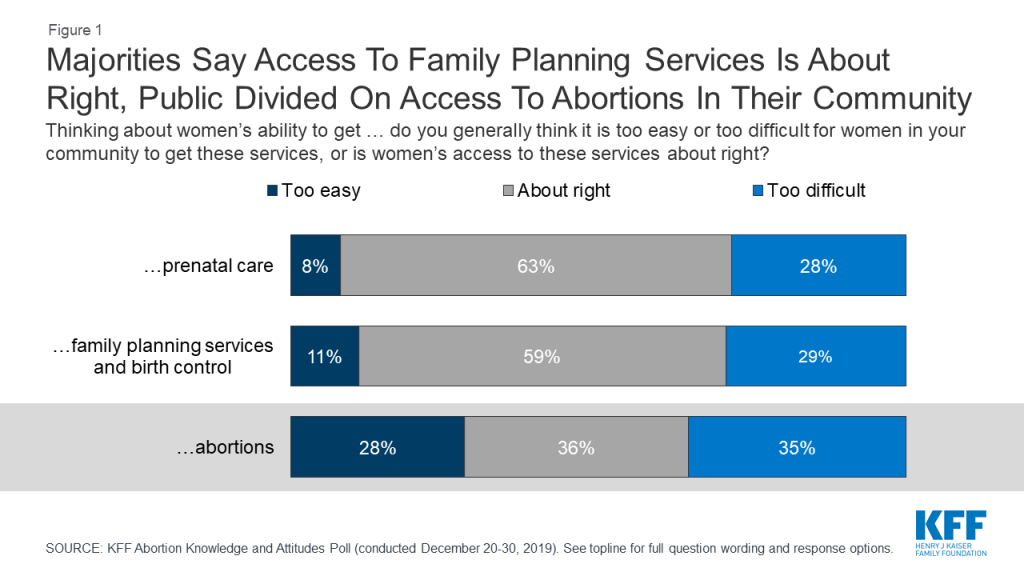
The closure of clinics that offer reproductive health services could affect more than access to abortion and also affect women’s ability to access services including prenatal care and contraception. Most say women’s ability to get prenatal care and family planning services including birth control in their communities is “about right” (63% and 59%, respectively) while about three in ten say it is too difficult for women to access these services and one in ten say it is “too easy.” Yet, the public is divided in their views of women’s ability to access abortions in their communities with similar shares saying it is “too difficult” (35%), and “about right” (36%), and a slightly smaller share saying it is “too easy” (28%).
This divide is largely driven by differences among partisans. A slim majority of Democrats say it is “too difficult” for women in their community to access abortions (52%) while half of Republicans say it is “too easy” for women to get an abortion in their community. Independents are more evenly split with similar shares saying it is “too difficult” (35%) and access is “about right” for women in their community (36%). About three in ten (28%) independents say it is “too easy” for women in their community to get abortion services.
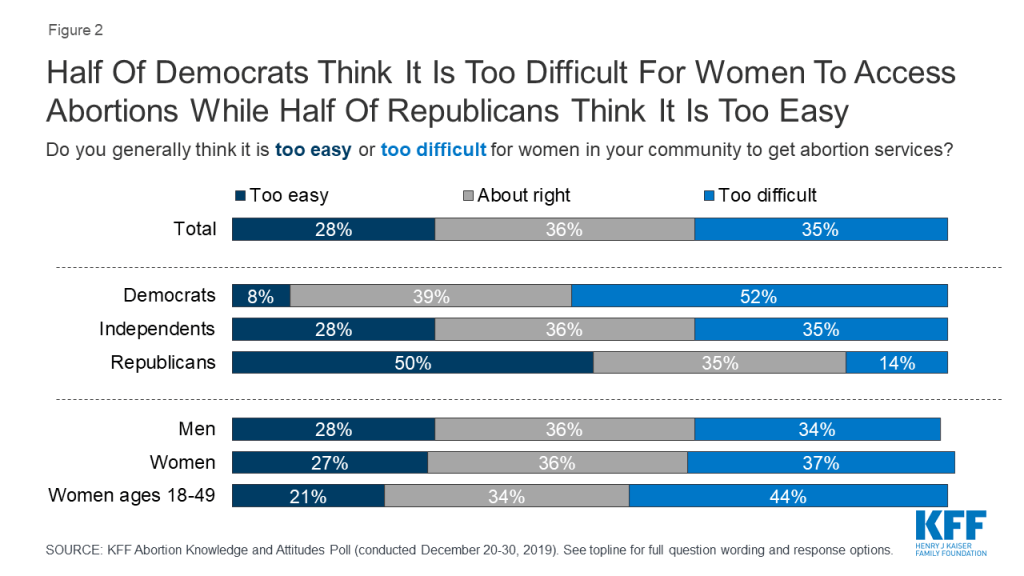
More than four in ten women, 18-49, say it is “too difficult” for women in their community to get abortion services, compared to one-third (34%) who say women’s access is “about right,” and one in five (21%) who say it is “too easy.”
The share who say it is “too difficult” for women in their community to get abortion services has increased 13 percentage points since 2018, up from 22% to 35%. The increase is largely driven by Democrats with half (52%) now saying it is “too difficult” for women in their community to get abortion services (compared to 37% in 2018).
Overall, about half of the public says women’s ability in their community to get abortion services has “stayed about the same” in the past three years but there are differences across partisans. About half of Democrats (48%) say it has gotten “harder” in the past three years for women in their community to get abortion services while 55% of Republicans say women’s access to abortions in their community has “stayed about the same.” About half (47%) of independents say access has “stayed about the same” but a larger share (34%) say access has gotten “harder” rather than “easier” (18%).
Over the past couple of years, many state legislatures have passed laws restricting women’s access to abortions within each state. These include a wide variety of restrictions that range from gestational age bans, prohibiting abortions for specific reasons, barring certain methods of abortion, and regulations on abortion providers.
Box 2: State Regulations on Abortion
States vary in the degree to which they regulate abortion services, including the following.
Time Limits: The Supreme Court’s decision in Roe v. Wade allows states to restrict access to abortion after “viability,” often presumed around 24 weeks gestation. However, many states seek earlier gestational limits on abortion. This includes Alabama that has banned abortion altogether and six states with “so-called” heartbeat bans, which ban abortions after there is detectable cardiac activity, around 6 weeks into a pregnancy. All of these bans are currently blocked by court action.
Waiting Periods: Twenty-seven states require waiting periods between abortion counseling and obtaining an abortion, necessitating at least two trips to the clinic. Waiting periods vary by state, from 18 to 72 hours.
Ultrasounds: About half of states (26) have various requirements surrounding pre-abortion ultrasounds. For example, 3 states require the abortion provider shows and describes ultrasound images to the patient before an abortion, while 14 states mandate the patient is given information on how to access ultrasound services.
Penalties for Abortion Providers: An array of legal and financial penalties can be imposed on providers for violating state abortion laws including jail sentences (20 states) for abortions performed after a certain time period in the pregnancy.
Admitting Privileges: Hospital admitting privileges for abortion providers, which means that the provider could admit a patient to a hospital to get tests and treatment, are required in two states and in 8 states this law is enjoined. This means that in event of an emergent complication from an abortion, the physician can admit the patient to a hospital and continue management of their care. In practice, however, when complications from abortion arise, albeit rarely, patients typically present to emergency departments (<1% of the time) that are required by law to evaluate and treat all patients.
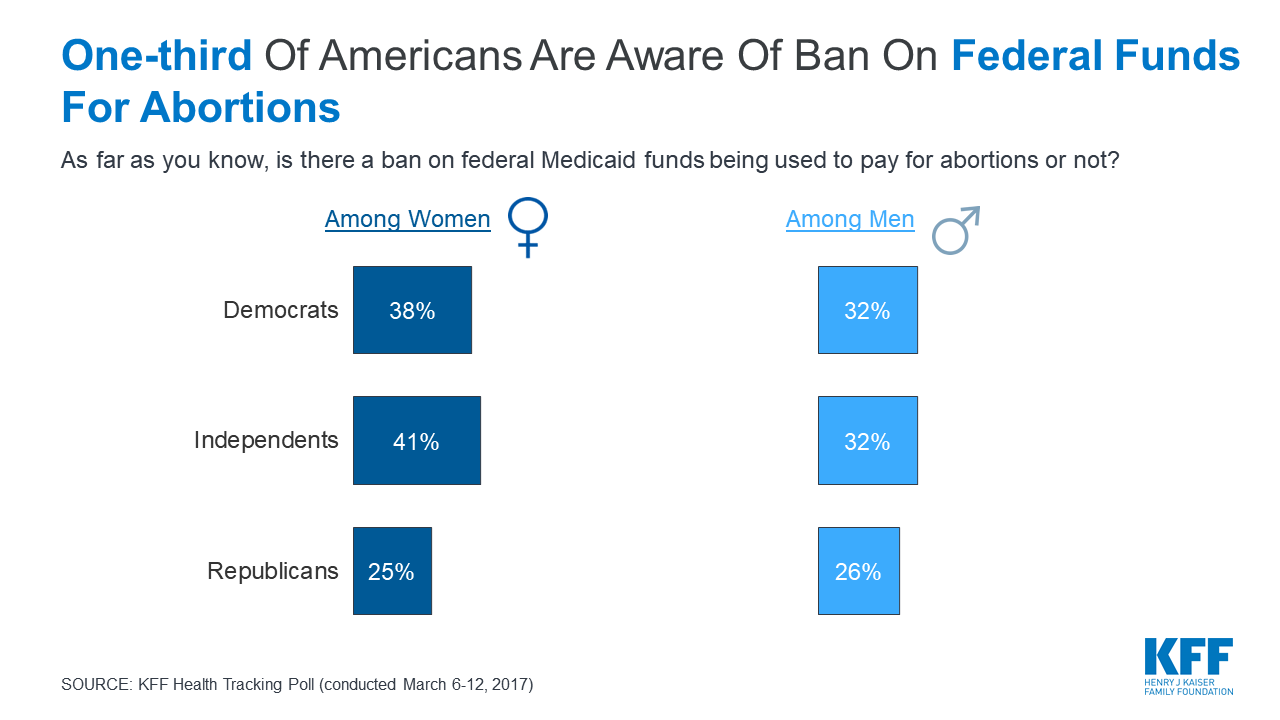
Insurance Coverage: The Hyde Amendment restricts federal funding for abortion, except in cases of life endangerment, rape and incest. This affects Medicaid, Medicare, and other federally funded programs. While some states prohibit coverage of abortion services in private insurance plans, some states have enacted laws that require plans to cover abortions.
Overall, twice as many think recent state actions are generally designed to make it more difficult for women to access abortion (67%) rather than protect the health and safety of women (32%). Three-fourths of Democrats (77%) as well as six in ten independents (61%) and Republicans (62%) say these state laws are designed to make it more difficult for women to access abortions. This includes majorities of men (67%), women (67%), and women between the ages of 18 and 49 (66%).
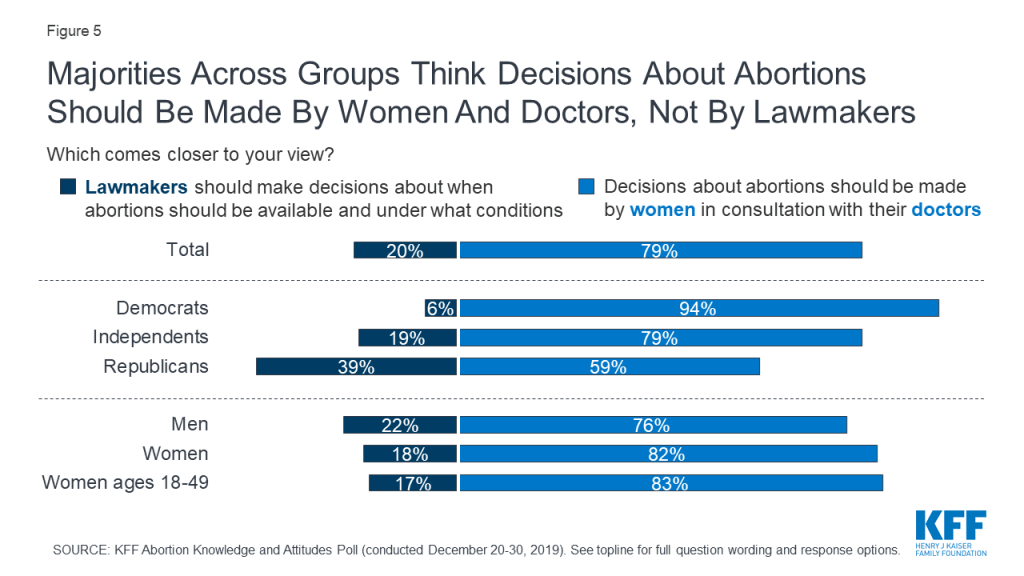
The public overwhelmingly thinks that decisions about abortions should be made by women in consultation with their doctors (79%) rather than having lawmakers decide when abortions should be available and under what conditions (20%). This includes majorities of Democrats (94%), independents (79%), and Republicans (59%), as well as eight in ten women (82%) and women of reproductive age (83%), and three-fourths of men (76%).
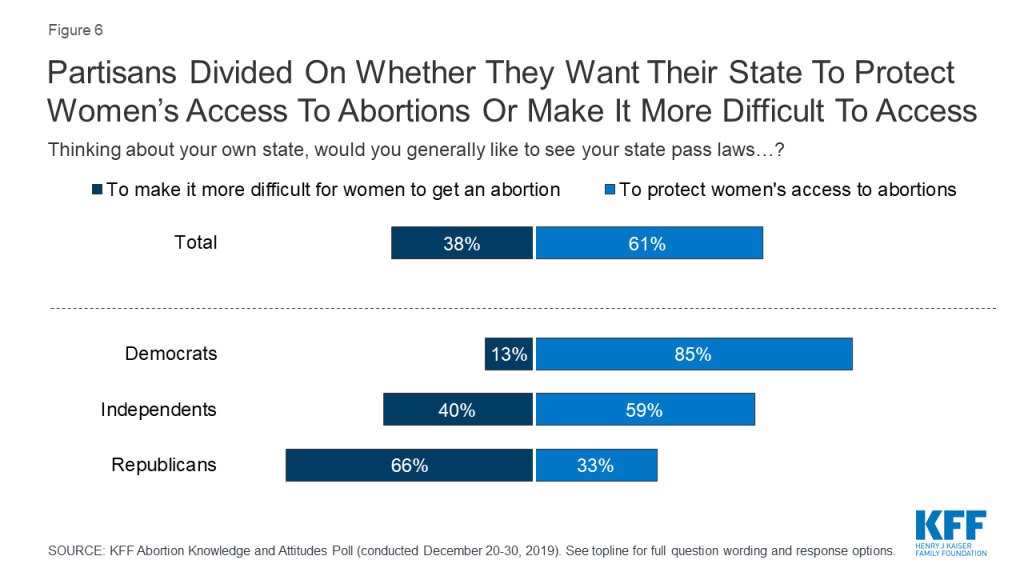
A majority of the public say they would like to see their state “pass laws to protect women’s access to abortions” (61%) while four in ten (38%) say they would like to see their state “pass laws to make it more difficult for women to get an abortion.” Attitudes towards state actions are largely partisan with two-thirds of Republicans saying they want their state to pass laws to make it more difficult to get an abortion while a majority of Democrats (85%) and independents (59%) say they want their state to pass laws to protect women’s abortion access. Seven in ten (69%) women between the ages of 18 and 49 want their state to pass laws to protect women’s access to abortions.
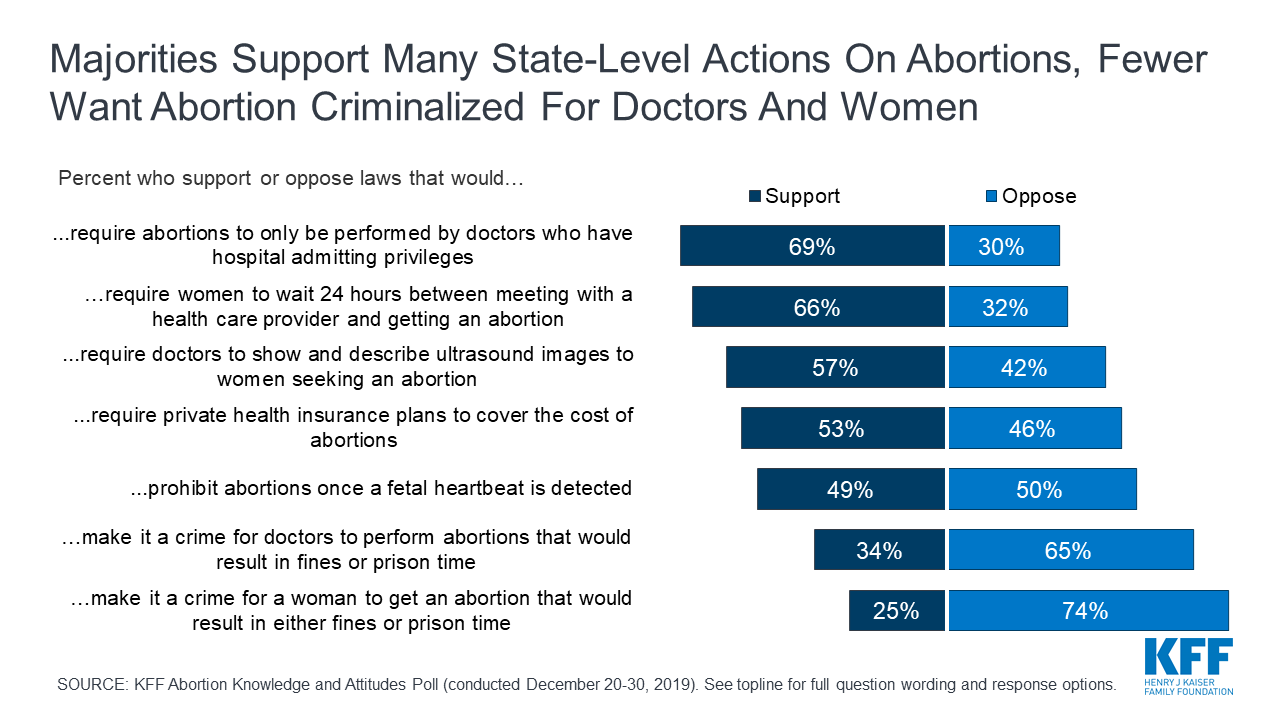
However, there is support for some state-level restrictions on women seeking abortions as well as abortion providers. Roughly seven in ten support state laws that would require abortions to only be performed by doctors who have hospital admitting privileges (69%), and a similar share (66%) support laws requiring women to wait 24 hours between meeting with a health care provider and getting an abortion. A smaller majority supports laws requiring doctors to show and describe ultrasound images to women seeking an abortion (57%). The public is divided on laws prohibiting abortions once a fetal heartbeat is detected, which is usually around 6 weeks (49% support, 50% oppose). Majorities oppose making it a crime for either doctors who perform abortions (65%) or women who get abortions (74%).
While majorities of Democrats (56%), independents (72%), and Republicans (82%) support requiring abortions to only be performed by doctors who have hospital admitting privileges, there are partisan differences in support for other state-level actions.
A majority of Republicans support many of the state-level restrictions including a 24 hour waiting period (86%), requiring doctors to show and describe ultrasound images (83%), prohibiting abortions once there is cardiac activity (70%), and making it a crime for doctors to perform abortions that would result in fines or prison time (58%); all of these are opposed by a majority of Democrats.
| Table 1: Support For Laws Restricting Access To Abortion Services Divided Across Partisans | |||
| Percent who support each of the following laws: | Democrats | Independents | Republicans |
| Requiring women to wait 24 hours between meeting with a health care provider and getting an abortion | 50% | 70% | 86% |
| Requiring abortions to only be performed by doctors who have hospital admitting privileges | 56 | 72 | 82 |
| Requiring doctors to show and describe ultrasound images to women seeking an abortion | 34 | 61 | 83 |
| Making it a crime for doctors to perform abortions that would result in either fines or prison time | 14 | 34 | 58 |
| Making it a crime for a woman to get an abortion that would result in either fines or prison time | 10 | 23 | 49 |
| Prohibiting abortions once cardiac activity, known as fetal heartbeat, is detected | 32 | 49 | 70 |
The poll finds that the public can be swayed on many of these state actions with some changing their opinions after hearing counter-arguments. For example, though about half the public initially supports laws prohibiting abortions once cardiac activity is detected, a majority (60%) say they would now oppose such laws after supporters hear that fetal activity is usually detected around six weeks into pregnancy and before many women know they are pregnant. Overall support for fetal heartbeat laws decrease to 38% after hearing counter-argument.
Seven in ten (69%) originally support laws requiring abortions to only be performed by doctors who have hospital admitting privileges,2 but after supporters hear the argument that complications from abortions are rare and women who need treatment would be able to receive it, regardless of whether the abortion provider has admitting privileges, support drops to about half (52%).
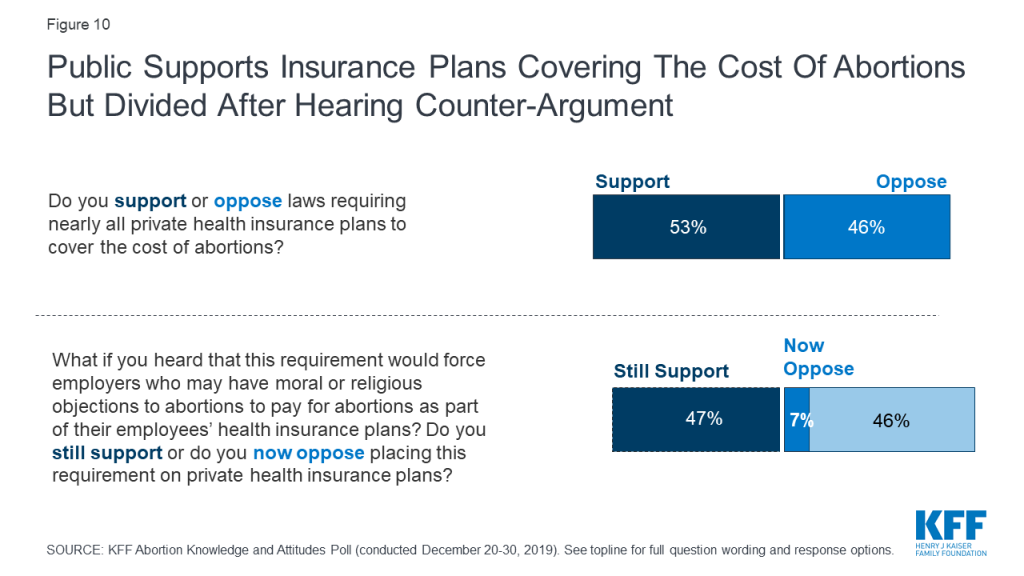
The public is also somewhat supportive of laws requiring private health insurance plans to cover the cost of abortions (53%), a policy that has been enacted in six states. This is supported by a majority of Democrats (76%), about half of independents (52%), and one-fourth of Republicans (26%).
While a small majority of the public initially support such laws, the divided is divided after hearing that this would force employers who may have moral or religious objections to pay for abortions with 52% now opposing these requirements and 47% still supporting.
It has been nearly five decades since the U.S. Supreme Court issued their landmark ruling on Roe v. Wade establishing a woman’s constitutional right to abortion services. There have been many cases since the Roe decision over the legality of abortion, and the Supreme Court is hearing another case in March 2020, June Medical Services v. Gee. This case is nearly identical to the 2016 Supreme Court case, Whole Woman’s Health v. Hellerstedt, in which the Court ruled that state requirements for physicians who provide abortions to hold hospital admitting privileges place undue burdens on women seeking abortion services and consequently violate their Constitutional rights. The Court also ruled that such requirements do not provide any medical benefits to women. Since the 2016 decision, the composition of the Supreme Court has changed, and some think the Court may overrule its recent precedent established in 2016 and Roe v. Wade could be overturned by a future case.
KFF polling has consistently found that a majority of the public do not want to see Roe v. Wade overturned and the latest KFF poll is no different. Seven in ten (69%) Americans say they do not want to see the Supreme Court overturn Roe v. Wade while 29% of adults say they would like to see the case overturned. Nearly six in ten (57%) Republicans want to see the law overturned while the vast majority of Democrats (91%) and seven in ten independents do not want the Supreme Court to overturn its decision.
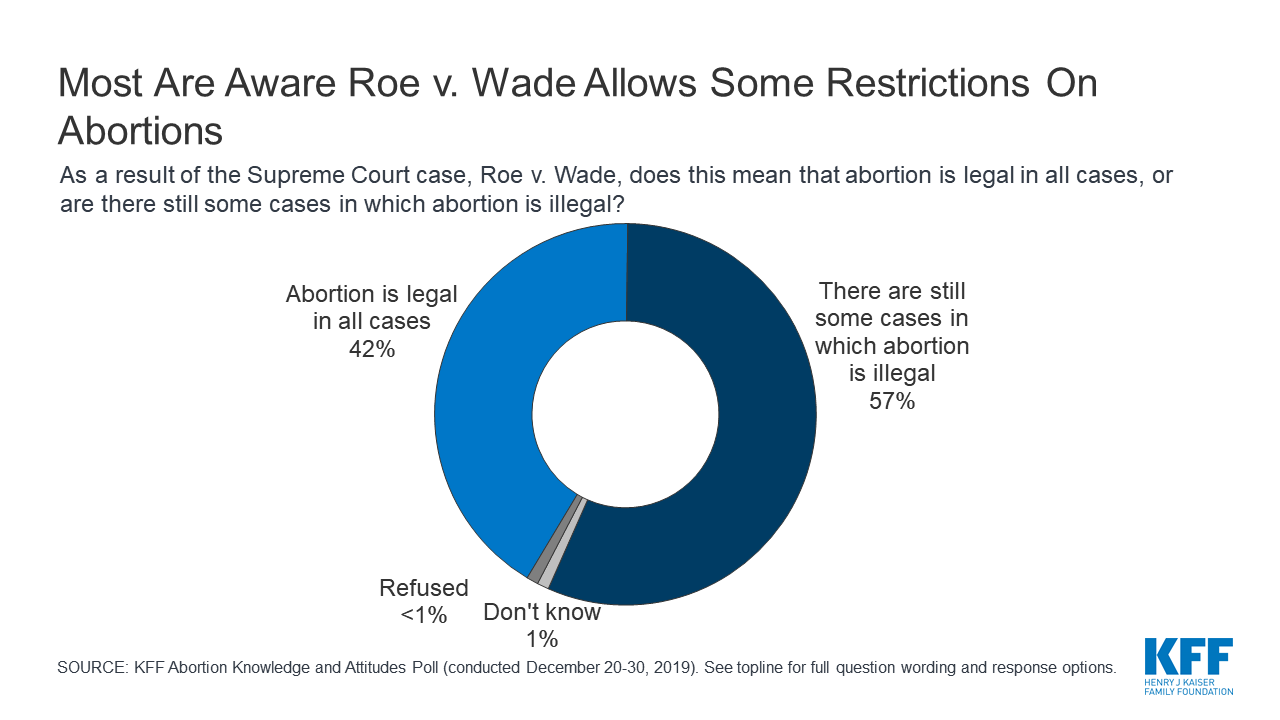
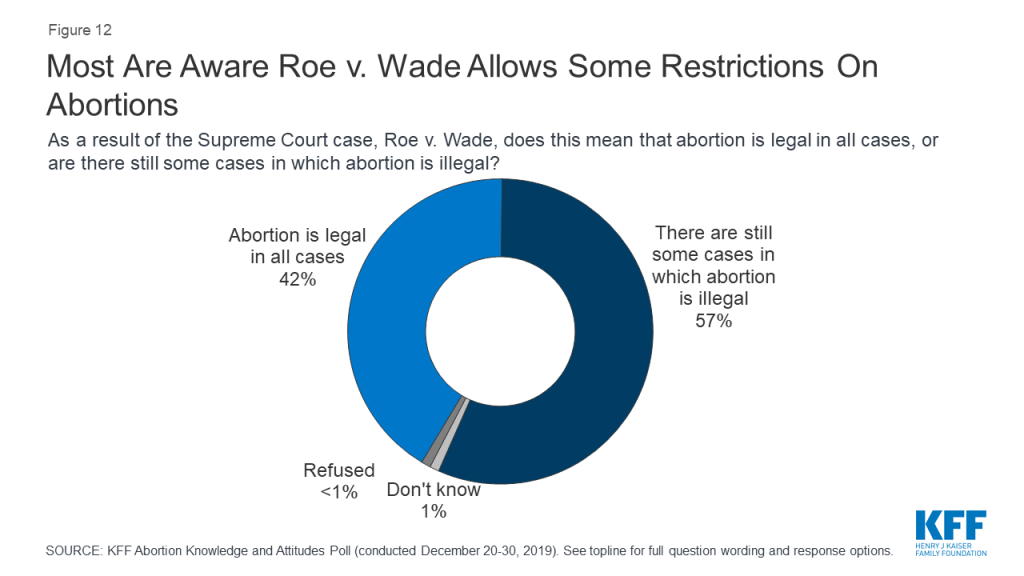
In Roe v. Wade, the Supreme Court ruled that a woman’s right to choose to have an abortion falls within their right to privacy before the fetus is viable outside the womb (typically around 24 weeks). Therefore, while states may not ban abortions before fetal viability, states may ban abortions later in pregnancy as long as the laws allow for exceptions for maternal health. A majority of the public (57%) are aware that the Roe v. Wade decision means there are still some cases in which abortion is illegal while four in ten (42%) incorrectly believe the Roe v. Wade decision means that abortion is legal in all cases. Most Democrats (58%) and independents (60%), as well as half of Republicans, are aware that there are still some cases in which abortion is illegal.
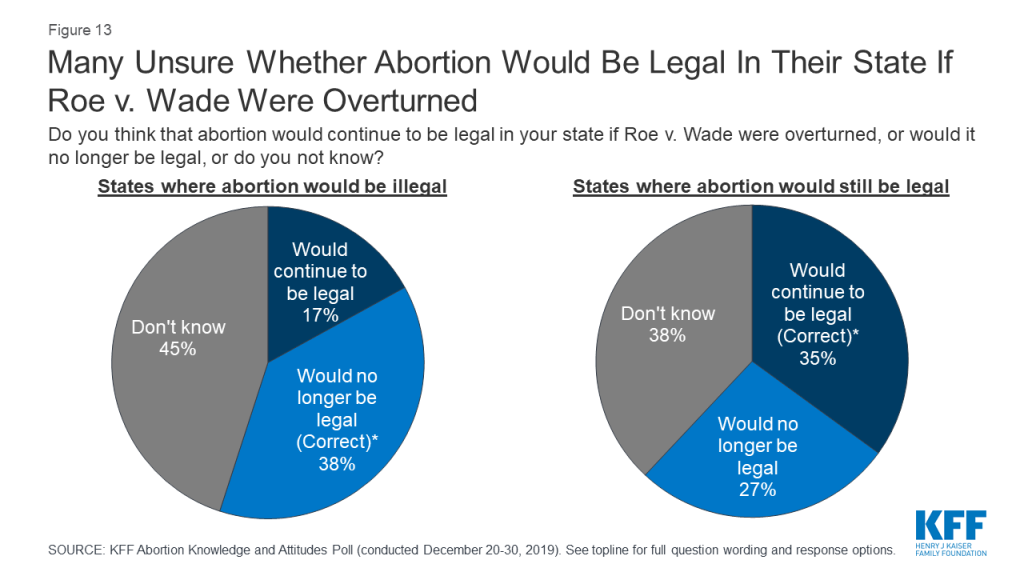
If Roe v. Wade was overturned by the Supreme Court, some states have laws that would make abortion illegal immediately. About four in ten (38%) of those living in states with such laws3 are aware that if Roe v. Wade was overturned, abortion would no longer be legal in their state. One-third (35%) of those living in states without such laws are aware that abortion would continue to be legal if the case was overturned.
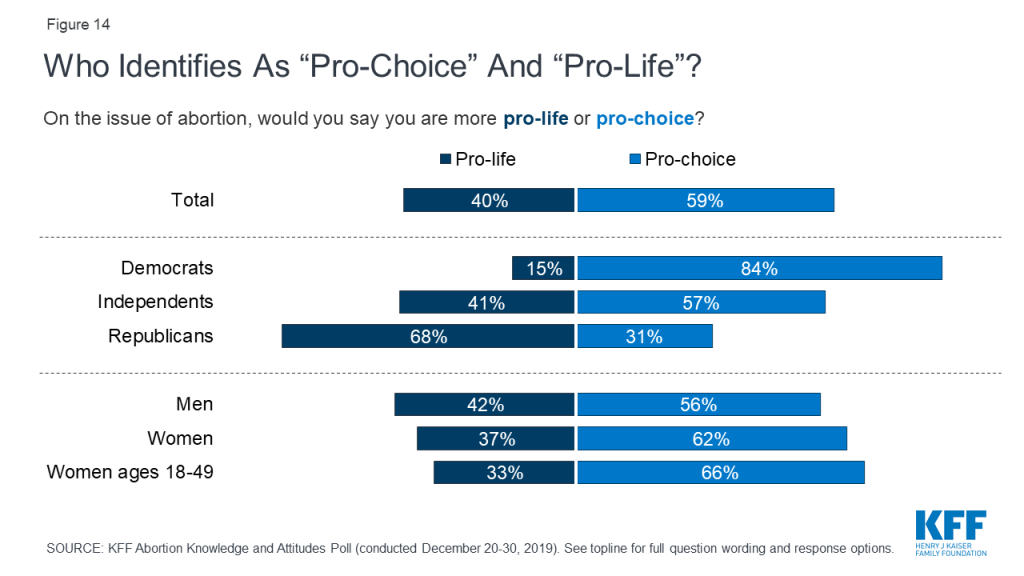
This poll also delved deeper into the public’s attitudes around abortion services beyond whether they simply want to see Roe v. Wade overturned. Overall, a majority of the public (59%) including majorities of men (56%), women (62%), women between the ages of 18 and 49 (66%), Democrats (84%), and independents (57%) say they are “pro-choice” on the issue of abortion. Two-thirds of Republicans (68%) and conservatives (68%), and seven in ten white evangelicals (72%) identify as “pro-life.”
About one-fourth of the public (27%) and 32% of women between the ages of 18 and 49 say abortion should be “legal in all cases” compared to one in ten (11% of total, and 8% of women between the ages of 18 and 49) who say abortion should be “illegal in all cases.”
Not all those who identify as “pro-life” want to overturn Roe v Wade.
Four in ten U.S. adults identify as “pro-life” on the issue of abortion but this group does not have unanimous views on the legality of abortion services. While the majority of pro-life adults say they want to see the Supreme Court overturn Roe v. Wade, three in ten pro-life adults say they do not want to see the Supreme Court overturn Roe v. Wade (by comparison the vast majority (96%) of “pro-choice” adults don’t want Roe v. Wade overturned). These individuals also are divided on whether abortion should be legal or illegal. About one-fourth (23%) say abortion should be “illegal in all cases” compared to few (3%) who say abortion should be “legal in all cases.” A majority of pro-life individuals think abortion should be legal if the patient’s life is endangered (64%) or in cases of rape or incest (60%).
When should Abortion Be Legal or Illegal?
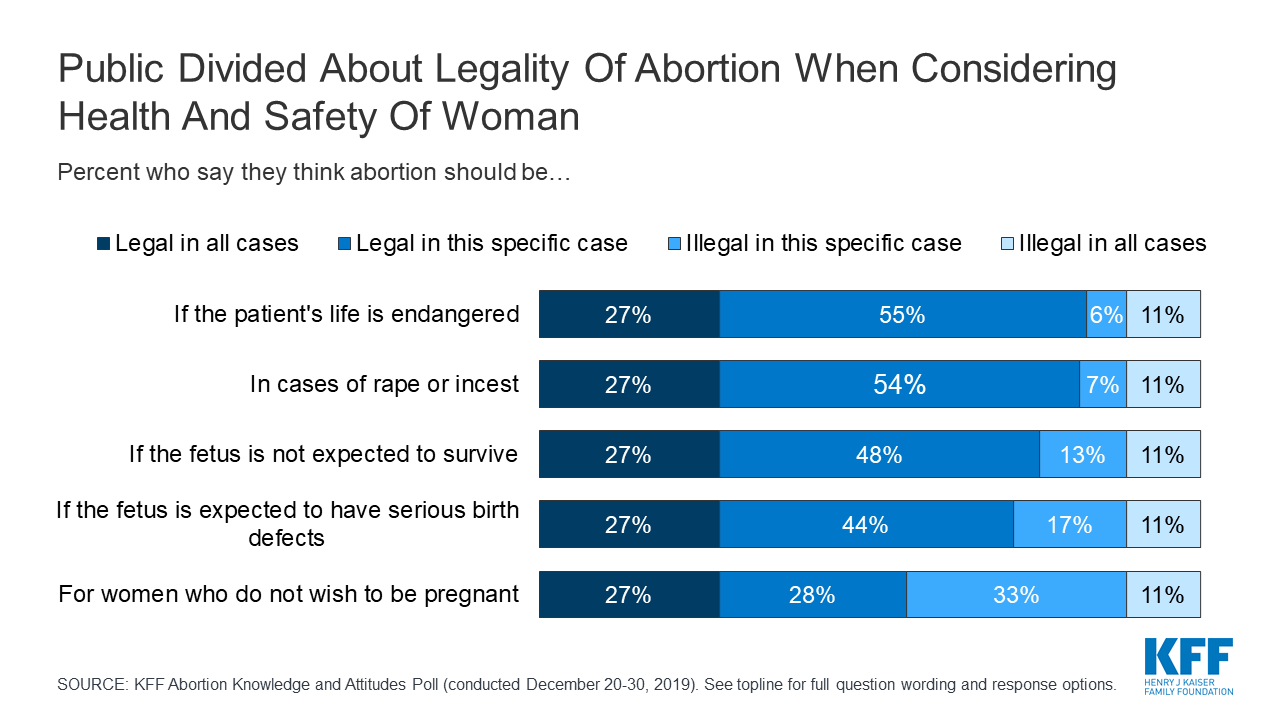
A majority of the public say abortion should be legal if the patient’s life is endangered (82%), in cases of rape or incest (80%), if the fetus is not expected to survive (75%), or if the fetus is expected to have serious birth defects (71%). A smaller majority say abortion should be legal for women who do not wish to be pregnant (55%).

A majority of women ages 18-49 say abortion should be legal in all of these situations. Large majorities say abortion should be legal if the patient’s life is endangered (87%), in cases of rape or incest (83%), if the fetus is not expected to survive (79%), or if the fetus is expected to have serious birth defects (77%). Six in ten (62%) women of reproductive age say abortion should be legal for women who do not wish to be pregnant.
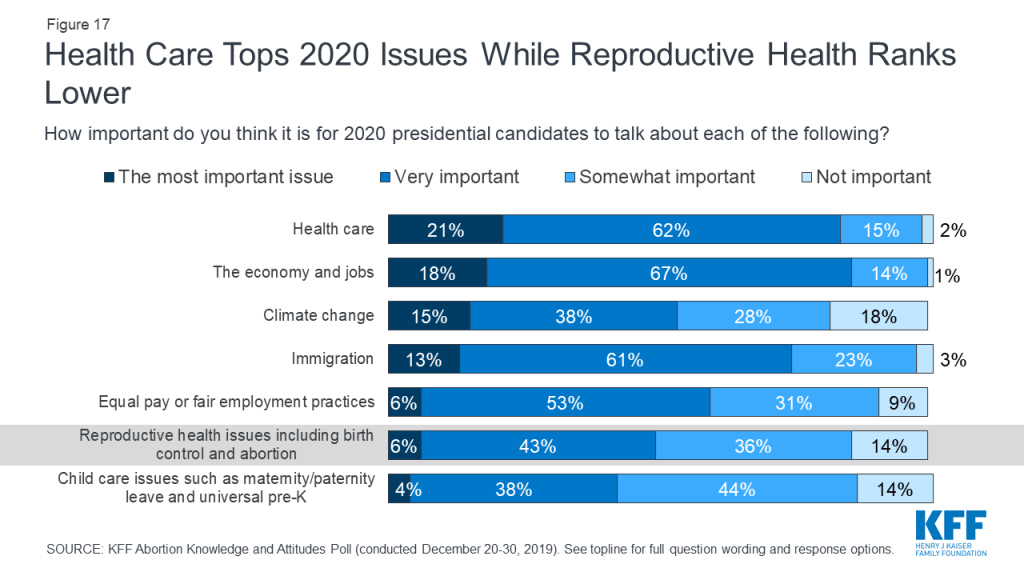
Despite the ongoing court cases and pending state actions regarding reproductive health care, these issues are not resonating with voters as top issues in the upcoming presidential election. While health care ranks among the top issues that Americans want to hear the 2020 presidential candidates talk about during the election year, smaller shares say reproductive health care is the most important issue for the candidates to discuss. About one in five (21%) say health care is “the most important issue” for 2020 presidential candidates to talk about, which is similar to the share who say the same about the economy and jobs (18%). Slightly smaller shares say climate change (15%) and immigration (13%) are the most important issues for the 2020 candidates to discuss. Yet, all of these issues rank higher among the public than equal pay or fair employment practices (6%), reproductive health issues including birth control and abortion (6%), and child care issues such as maternity or paternity leave and universal pre-K (4%).
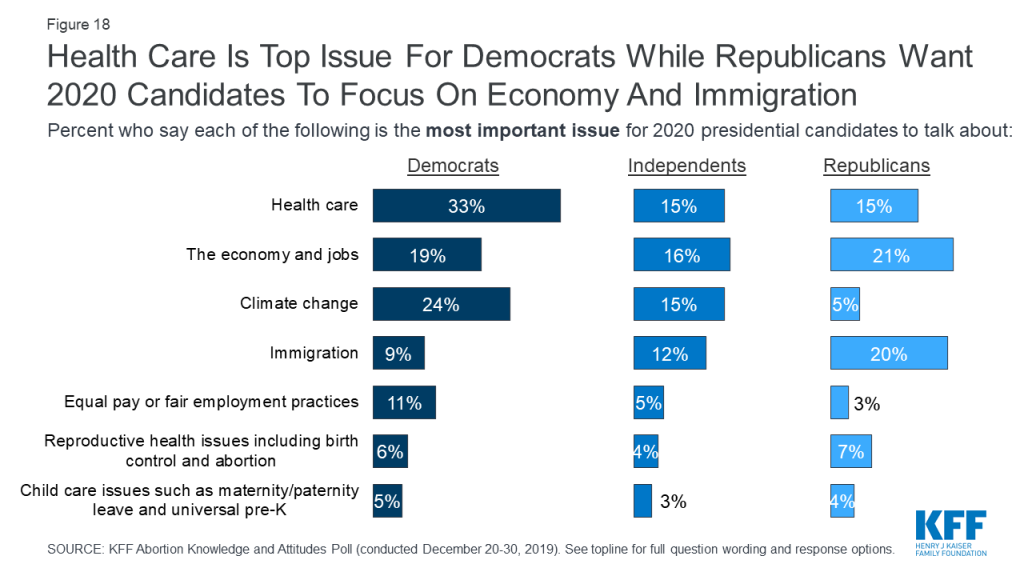
Health care is the top issue that Democrats want to hear the 2020 presidential candidates talk about with one-third saying it is “the most important issue,” while the economy and immigration rank as the top issues for Republicans (21% and 20%, respectively). Independents are more split with similar shares saying the economy and jobs (16%), health care (15%), and climate change (15%) are the most important issues for the 2020 presidential candidates to talk about. Reproductive health care issues rank low across partisans with small shares of Democrats (6%), independents (4%), and Republicans (7%) saying it is the “most important issue” for candidates to talk about.
The KFF poll also goes beyond the current abortion policy debates and examines what Americans know about abortion services and finds there are significant knowledge gaps on the prevalence and the overall safety of abortions.
Box 3: Key Facts about Abortion in the U.S.
Six in ten (63%) Americans – including 69% of all women and 71% of women between the ages of 18 and 49 – say that they personally know someone, including themselves, who has ever had an abortion. Yet, many do not know when most abortions occur. A majority (69%) incorrectly think most abortions occur 8 weeks or more into a pregnancy and few (11%) are aware that less than 5% of abortions occur more than 20 weeks into a pregnancy.
There are no significant differences among men, women, and women between the ages of 18 and 49 with majorities across groups providing incorrect answers. In addition, only about one-fifth of adults (21%) and one-third of women between the ages of 18 and 49 (36%) have ever heard of Mifepristone, or a medication abortion.
| Box 4: Emergency Contraception vs. Medication Abortion | ||
| Emergency contraception and medication abortion are distinct treatments, used for different reasons. Emergency contraception is used to prevent pregnancy before it has occurred, while a medication abortion terminates a pregnancy after it has already occurred. Emergency contraception does not cause an abortion. | ||
| Emergency Contraception | Medication Abortion | |
| Purpose | To prevent pregnancy after unprotected sex | To terminate an existing pregnancy |
| Medications Used | Multiple options: Levonogestrel (Plan B), Ulipristal Acetate (Ella) or copper IUD | Most commonly: mifepristone (RU486, Mifeprex) followed by misoprostol (Cytotec) |
| How It Works | Prevents fertilization of the egg by the sperm Levonogestrel and Ulipristal Acetate: delays or prevents ovulation (release of the egg from the ovary) Copper IUD: makes sperm less likely to fertilize the egg | Causes uterus to expel existing pregnancy Mifepristone: blocks progesterone, a hormone critical for continuing a pregnancy Misoprostol: causes uterine contractions to expel the pregnancy |
| Timing | FDA approved for use within 72 hours after intercourse for Levonogestrel and within 120 hours for Ulipristal Acetate and the copper IUD | FDA approved for use up to 10 weeks gestational age |
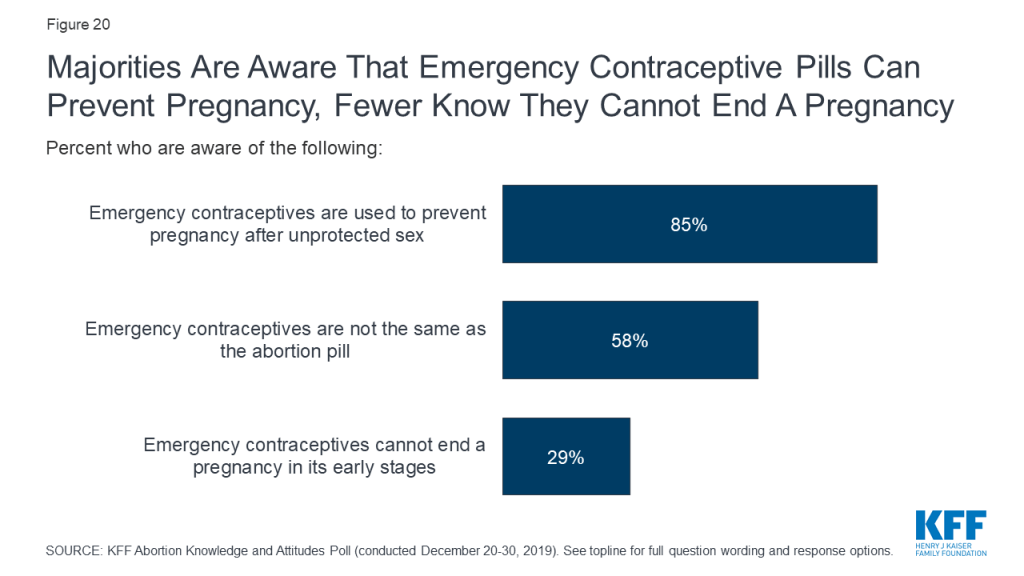
Most Americans – including the vast majority of women (95%) have heard of emergency contraceptive pills, sometimes called morning after pills or “Plan B.” In fact, the share of women who are aware of emergency contraceptives has increased slightly, up from 84% in 2003, shortly after it was approved by the FDA. Yet, there are still some knowledge gaps surrounding the effects of these pills. While most are aware that emergency contraceptive pills are not the same as the abortion pill (58%) and that they are used to prevent pregnancy after unprotected sex (85%); a substantial share (62%) incorrectly think that emergency contraceptive pills can end a pregnancy in its early stages while about three in ten (29%) are aware that emergency contraceptives cannot end a pregnancy.
Overall, women and men are equally knowledgeable about emergency contraceptives, but women between the ages of 18 and 49 are the most knowledgeable group. Larger shares of women 18-49 than older women (50 and older) know that emergency contraceptives are used to prevent pregnancy (95% and 77%, respectively) and are not the same as the abortion pill (73% and 46%, respectively). Still, less than half of women between the ages of 18 and 49 are aware that emergency contraceptives cannot end a pregnancy in its early stages (44%).
| Table 2: Awareness of emergency contraceptive pills differs by age among women | ||
| Percent who are aware of the following: | Women, 18-49 | Women, 50 and older |
| Emergency contraceptive pills are used to prevent pregnancy after unprotected sex | 95% | 77% |
| Emergency contraceptives are not the same as the abortion pill | 73 | 46 |
| Emergency contraceptives cannot end a pregnancy in its early stages | 44 | 17 |
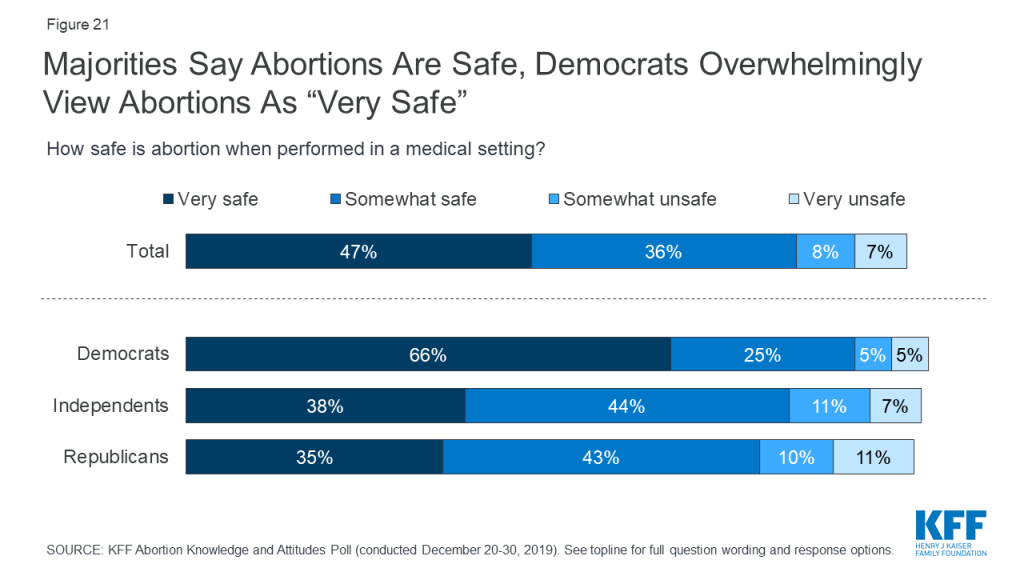
The majority (83%) of adults say abortions performed in a medical setting are either “very safe” (47%) or “somewhat safe” (36%),while one in six (16%) say abortions are either “somewhat unsafe” (8%) or “very unsafe” (7%). While majorities across partisans say abortions are safe, Democrats overwhelmingly hold this opinion with two-thirds of Democrats saying abortions are “very safe.” Majorities of men, women, and women 18-49 all say abortions are at least somewhat safe.
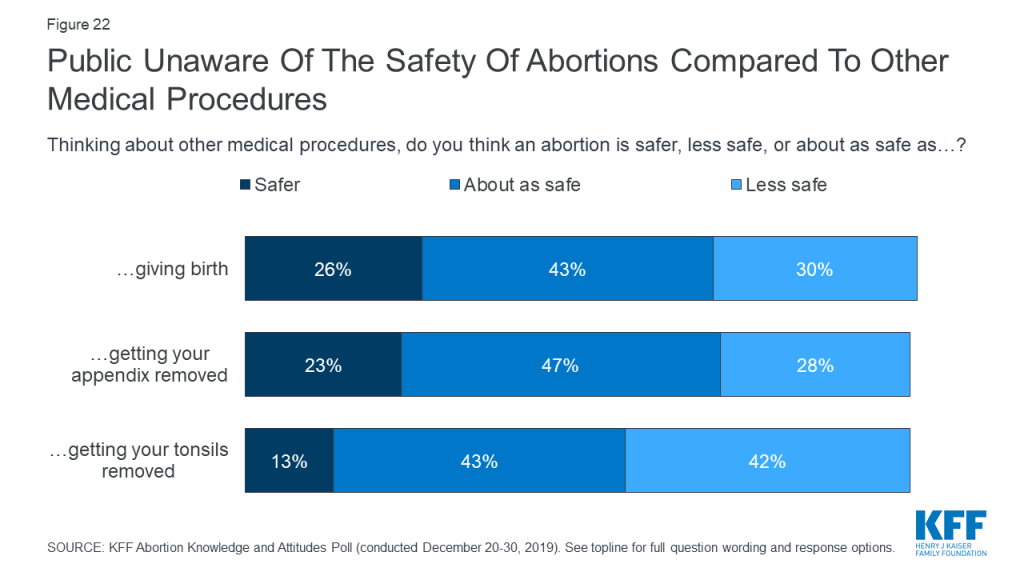
There is still some confusion on how safe abortions are in comparison to other medical procedures. Small shares are aware that abortions are safer than giving birth (26%), getting your appendix removed (23%) and getting your tonsils removed (13%).
Box 5: Abortion Safety
Obtaining an abortion is generally very safe in the U.S. Less than 1% of abortions result in subsequent emergency room treatment due to complications, which makes abortions safer than many other common procedures, such as wisdom tooth removal (7%), tonsil removal (8-9%), appendix removal (13%), and childbirth (29%).
Most Americans are aware of the truth behind many common myths surround abortions. Majorities say it is “false” that a women who has gotten an abortion has a higher chance of getting breast cancer (86%) or will have a harder time getting pregnant (72%).
This Kaiser Family Foundation survey is based on interviews with a nationally representative probability-based sample of 1,215 adults ages 18 and over, living in the United States, including an oversample of women between the ages of 18-49. Interviews were administered online and by telephone from December 20-30th, 2019 in English and Spanish. KFF paid for all costs associated with this survey.
The poll was designed and analyzed by public opinion researchers at the Kaiser Family Foundation (KFF). The sample was recruited using the SSRS Opinion Panel (n=1,100) as well as a subsample of respondents who had previously completed an interview via random digit dialing (RDD) on the SSRS Omnibus (n=115). For both methods of recruitment, the sample was provided by Marketing Systems Groups (MSG) of Horsham, PA.
The SSRS Opinion Panel is a representative probability-based panel of adults ages 18 and over living in the United States, and is recruited using the SSRS Omnibus poll and through address-based sampling (ABS). To efficiently obtain a sample of Spanish language interviews as well as non-internet adults, additional interviews were conducted using computer assisted telephone interviewing (CATI) by landline (n=63) and cell phone (n=52). Non-internet adults (n=100) are those who had previously completed interviews on the SSRS Omnibus and had indicated they did not have internet access. Their status as non-internet users was confirmed at the start of their interview. To ensure the representation of Spanish-speaking respondents, 15 additional interviews were completed by CATI with respondents who had previously completed interviews in Spanish on the SSRS Omnibus, and were not part of the Opinion Panel or the Non-Internet sample.
To meet this study’s analytical goals, SSRS disproportionally invited SSRS Opinion Panel respondents who were women between the ages of 18 and 49 to participate in the study. The total sample (n=351) for this group of women, 18-49, includes 344 online panel respondents and 7 interviews conducted using RDD.
The combined web, landline, and cell phone sample was weighted to match the sample demographics to estimates for the national population. In order to take into account the oversampling of women 18 to 49 years old, men and women first were separately weighted to estimates on age, education, race, Hispanic origin, and region, using data from the Census Bureau’s 2019 Current Population Survey (CPS) data. The male and female samples were then combined and a final weighting adjustment was made including estimates for civic engagement (from the September 2017 CPS data), internet access (internet or no internet, from the 2017 American Community Survey (ACS)), and education (from the 2019 CPS data).
The margin of sampling error including the design effect for the full sample is plus or minus 3 percentage points. Numbers of respondents and margins of sampling error for key subgroups are shown in the table below. For results based on other subgroups, the margin of sampling error may be higher. Sample sizes and margins of sampling error for other subgroups are available by request. Note that sampling error is only one of many potential sources of error in this or any other public opinion poll. Kaiser Family Foundation public opinion and survey research is a charter member of the Transparency Initiative of the American Association for Public Opinion Research.
| Group | N (unweighted) | M.O.S.E. |
| Total | 1,215 | ±3 percentage points |
| Gender | ||
| Men | 573 | ±5 percentage points |
| Women | 641 | ±5 percentage points |
| Women, 18-49 years old | 351 | ±6 percentage points |
| Party Identification | ||
| Democrats | 425 | ±6 percentage points |
| Republicans | 308 | ±7 percentage points |
| Independents | 429 | ±6 percentage points |
Medicaid, the provider of health insurance coverage for about one in five Americans and the largest payer for long-term care services in the community and nursing homes, continues to be a key part of health policy debates at the federal and state level. Key Medicaid issues to watch in 2020 include: Medicaid expansion developments; Section 1115 waiver activity; enrollment and spending trends; benefits, payment and delivery system reforms, and the implications of the 2020 elections.
At the start of 2020, 37 states had adopted the ACA Medicaid expansion. This total includes Idaho and Utah, which implemented the expansion on January 1, 2020, and Nebraska, where the expansion was adopted but not yet implemented. A review of over 300 studies points to positive effects of expansion on coverage, access to care, service utilization, and state budgets and economies. Millions of adults could gain Medicaid eligibility if additional states expanded their programs. Expansion activity is ongoing in a number of states that have not adopted the expansion. Initiatives are underway in Oklahoma and Missouri to put Medicaid expansion on the ballot in November 2020, while Kansas announced an agreement between the Governor and the Senate Majority Leader to adopt the Medicaid expansion in the 2020 legislative session. In addition, North Carolina came close to passing the Medicaid expansion through the state legislature during the 2019 session, but ultimately failed to do so, adjourning the session without a budget. Since the Governor continues to support expansion, the issue may come up again in 2020.
Some states are seeking waiver authority to implement a new expansion or make changes to an existing expansion. After Nebraska voters approved a Medicaid expansion ballot measure in November 2018, the state delayed implementation until October 1, 2020 to allow time for the state to seek a Section 1115 waiver to implement expansion. The waiver calls for a tiered benefit package; to access enhanced benefits, enrollees must meet certain wellness and personal responsibility requirements as well as work/community engagement requirements. Georgia submitted a waiver to the Centers for Medicare and Medicaid Services (CMS) seeking approval for a Medicaid expansion with enhanced ACA funding with coverage up to 100% of the federal poverty level (FPL) for individuals who meet work requirements. However, the state acknowledges recent CMS guidance indicating that the enhanced match rate will be available only to states that cover the entire adult expansion group (up to 138% FPL). The waiver proposal also contains other provisions that would restrict eligibility and benefits.
What to Watch:
Section 1115 Medicaid demonstration waivers provide states an avenue to test new approaches in Medicaid not otherwise allowed under current law, provided the demonstrations meet the objectives of the program. The focus of Section 1115 waivers has changed over time reflecting changing priorities for states and CMS. Under the Trump Administration, CMS issued guidance for state Medicaid waiver proposals that would impose work requirements on individuals as a condition of Medicaid eligibility, and several states have received approval for or are pursuing these waivers. As of January 2020, seven states had approved waivers with work requirements, ten states had pending waivers and three other states (Arkansas, Kentucky and New Hampshire) have had waivers set aside by the courts, citing the Secretary’s failure to consider the impact on Medicaid’s primary objective of providing affordable coverage. Litigation challenging waiver approvals is pending in Indiana and Michigan, and an appeal of the court decision setting aside Arkansas’s waiver approval is also pending. The Kentucky waiver that had been set aside by the courts has since been rescinded by the new Governor, and the case has now been dismissed. Michigan is the only state currently implementing a work requirement waiver. Other states with approval have not yet implemented (Ohio, South Carolina, Utah, and Wisconsin) or have put the program on hold due to pending litigation (Arizona and Indiana). Data show that the majority of adult Medicaid enrollees are working and that prior implementation of a work requirement in Arkansas resulted in coverage losses for over 18,000 people without gains in employment.
Beyond work requirements, CMS has issued guidance and has been approving waivers to allow states to use Medicaid funds to provide short-term inpatient and residential treatment for enrollees with substance use disorder (SUD) and enrollees with serious mental illness (SMI) or serious emotional disturbance (SED) in institutions “institutions for mental disease” (IMDs). As of January 2020, 27 states have approval for such waivers for SUD services, and two states have approval for SMI/SED services. Without the waivers, states have limited authority to finance these services for nonelderly adults in IMDs.
While CMS has focused on increasing flexibility for states through waivers, some waiver requests have not been approved, including allowing for the ACA enhanced match for partial expansion (in Utah, Arkansas and Massachusetts), enrollment caps for the expansion group (in Utah) and closed prescription drug formularies (in Massachusetts). Some states continue to seek approval for similar waivers. CMS has been developing guidance and will consider a waiver from Tennessee seeking a modified block grant with shared savings provisions. New guidance on block grants and the outcome of the pending Tennessee waiver will have broader implications for other states interested in similar types of waivers.
What to Watch:
Medicaid spending and enrollment trends not only reflect policy changes at the state and federal level but also reflect changes in the economy as well as demographic changes. Over the last decade, Medicaid spending and enrollment peaked during the Great Recession (when incomes fell and more people qualified and enrolled in Medicaid and other public programs) and then again with implementation of the Affordable Care Act (ACA). Future Medicaid enrollment and spending trends will likely be affected by an inevitable economic downturn as well as the aging population.
In recent years, enrollment growth has slowed or declined in many states and declined nationally by 1.9 million from December 2017 through July 2019 as unemployment has reached historically low levels and the number of people in poverty has declined. While some enrollees leaving Medicaid may have gained other coverage, survey data show a rise in the uninsured rate between 2017 and 2018, suggesting that some individuals losing Medicaid are becoming uninsured. Some of this rise in the uninsured was among people with higher incomes, indicating that as people’s incomes rise due to the strong economy, they may not be transitioning to private coverage after losing Medicaid eligibility. A portion of Medicaid enrollment declines may reflect some states catching up on eligibility renewals after delays following implementation of new computer systems under the ACA. Experiences in some states suggest that some people who remain eligible may be losing coverage due to barriers maintaining Medicaid associated with renewal processes and periodic eligibility checks that have been encouraged by CMS as part of program integrity efforts. Other factors contributing to enrollment declines may be reduced funds to support outreach and enrollment assistance as well as the shifting immigration policy environment that may be deterring some families from enrolling themselves or their children in coverage or continuing coverage at renewal, despite being eligible.
While slower enrollment has moderated spending growth, rising costs for prescription drugs, provider rate increases, and costs for the elderly and people with disabilities (including increased utilization of long-term services and supports) are expected to put upward pressure on total Medicaid spending. In response to concern about the rising cost of new specialty prescription drugs as well as increasing costs for some generic drugs, states are continuing to adopt strategies to contain costs. Prescription drug efforts include addressing pharmacy benefit manager (PBM) spread pricing (the difference between the payment the PBM receives from the MCO and the reimbursement amount it pays to the pharmacy), negotiating additional supplemental rebates, and implementing new purchasing arrangements, including value-based contracts. Some states have more unique models, including a modified subscription model for hepatitis C drugs in Louisiana. CMS program integrity efforts including audits, heightened oversight of state claiming for enhanced federal matching funds for the ACA expansion and a new proposed rule related to supplemental payments and other state financing practices could have broader implications for Medicaid that could reduce federal spending in the program. In some cases, reduced federal spending may be tied to additional oversight to ensure states are complying with current rules, while in other cases the reductions may reflect CMS changes or proposed changes in policies.
Finally, Medicaid funding for the territories will continue to be an issue. As ACA funds and other disaster funds were set to expire Congress authorized additional funding of $5.7 billion for FY 2020 and FY 2021 (including $5.3 billion for Puerto Rico). However, the short extension and new disasters like the earthquakes in Puerto Rico mean that long-term funding is not secure and new health care needs will emerge.
What to Watch:
Managed care continues to be the dominant delivery system for Medicaid. As of July 1, 2019, among the 40 states with comprehensive risk-based managed care organizations (MCOs), 33 states reported that 75% or more of their Medicaid beneficiaries were enrolled in MCOs. States continue to expand the scope of services included in MCO contracts by carving in behavioral health and long-term care services into MCO contracts. Nearly all states have managed care quality initiatives like pay for performance or capitation withholds in place, and many states are implementing alternative provider payment models (APMs) to incentivize quality and outcomes. In addition, both within managed care (often leveraging MCO contracts) and outside of managed care, states are experimenting with ways to address social determinants of health, though there are limitations in how far states can go in using federal dollars to pay for non-medical services. States are also working with their MCO and corrections partners to coordinate care for justice-involved individuals prior to release with the goal of improving continuity of care and smoothing community transitions. Many states are also implementing initiatives to improve birth outcomes and/or reduce maternal mortality. A number of states are also implementing payment policies to promote access to rural hospitals or other rural providers.
As the need for Medicaid long-term services and supports is expected to rise as the population continues to age, states continue to expand the number of people served in home and community-based settings; however, direct care workforce and affordable housing shortages remain challenges in meeting the demands to serve the elderly and people with disabilities in community settings. Existing authority to help states provide care in the community including spousal impoverishment rules and the Money Follows the Person program were set to expire at the end of 2019 but received an extension through May 2020.
Bolstered by a strong economy, an urgency to address the opioid and SUD crisis, and new options made available through the SUPPORT Act, many states are expanding Medicaid mental health/substance use disorder benefits, including medication-assisted treatment (MAT), and are using an array of pharmacy benefit management strategies to prevent opioid related harms. Funding through the new CMMI INCKids demonstrations was recently awarded to eight states to develop new delivery system and payment models focused on prevention, early identification, and treatment of children’s physical and behavioral health needs, including SUD.
What to Watch:
Health care proved to be a dominant issue in the 2018 midterm elections and in some state elections in 2019. Once again, health care is a key issue for voters heading into the 2020 elections. Some Democratic presidential candidates support a Medicare-for-All option while others propose or endorse a “public option”. While there are differences across all of the proposals and many lack sufficient details to fully understand the effects, these plans all could fundamentally change the broader health care system and would have significant implications for Medicaid and the role of states, an issue that has not received much attention. Medicare-for-all proposals would shift responsibility for designing and implementing much of health policy from states to the federal government and would generally eliminate current variation in eligibility, enrollment and renewal processes, benefits, and payment and delivery systems that are part of the current structure of Medicaid where states have considerable flexibility to design programs. The proposals would extend coverage for certain Medicaid services such as comprehensive benefits for children and community based long-term care. Under some Medicare-for-all proposals, the federal government assumes all or a significant share state spending on Medicaid, leading to significant state savings, while other proposals call for a maintenance of effort for all or some current state Medicaid spending.
In contrast, public option proposals vary in their implications for Medicaid. Some proposals would have little effect on Medicaid while others would cover low-income adults in non-expansion states and/or allow individuals with Medicaid or private coverage to, instead, opt-in to the public option. Some proposals would allow states to move current Medicaid enrollees to the public plan and some would require states to contribute to the costs through an MOE.
All Democratic presidential candidates differ sharply from policies advanced by the Trump Administration related to the ACA and Medicaid more broadly. The Trump Administration has proposed to significantly limit federal Medicaid funds, convert Medicaid to a block grant, and repeal the ACA (which would end the authority for the Medicaid expansion and other Medicaid provisions); these policies are not supported by any Democratic candidate. In addition, litigation challenging the ACA with support from the Trump administration is ongoing, with continued uncertainty about the law’s future. On December 18, 2019, the 5th Circuit decided in Texas v. Azar to send the case back to the trial court for additional analysis on whether the individual mandate can be severed from the rest of the ACA, to determine if the entire ACA is struck down or not. In the meantime, a group of 21 states represented by Democratic state officials and led by California, and the Democratic-led House of Representatives has asked the Supreme Court for an expedited review of the case, which could result in a final decision before the 2020 election.
In addition to the presidential race, the make-up of Congress will affect the direction of federal health care policy. At the state level, there are 11 governors up for election in 2020 (four seats currently held by Democrats (DE, NC, MY and WA) and seven seats held by Republicans (MO, ND, NH, IN, UT, VT and WV)). The make-up of state legislatures also has direct implications for Medicaid policy as state law can authorize expansion, require a state to submit a demonstration waiver, set state budgets and direct other Medicaid changes. As mentioned earlier, initiatives are underway in Oklahoma and Missouri to put Medicaid expansion on the ballot in November 2020.
What to watch:
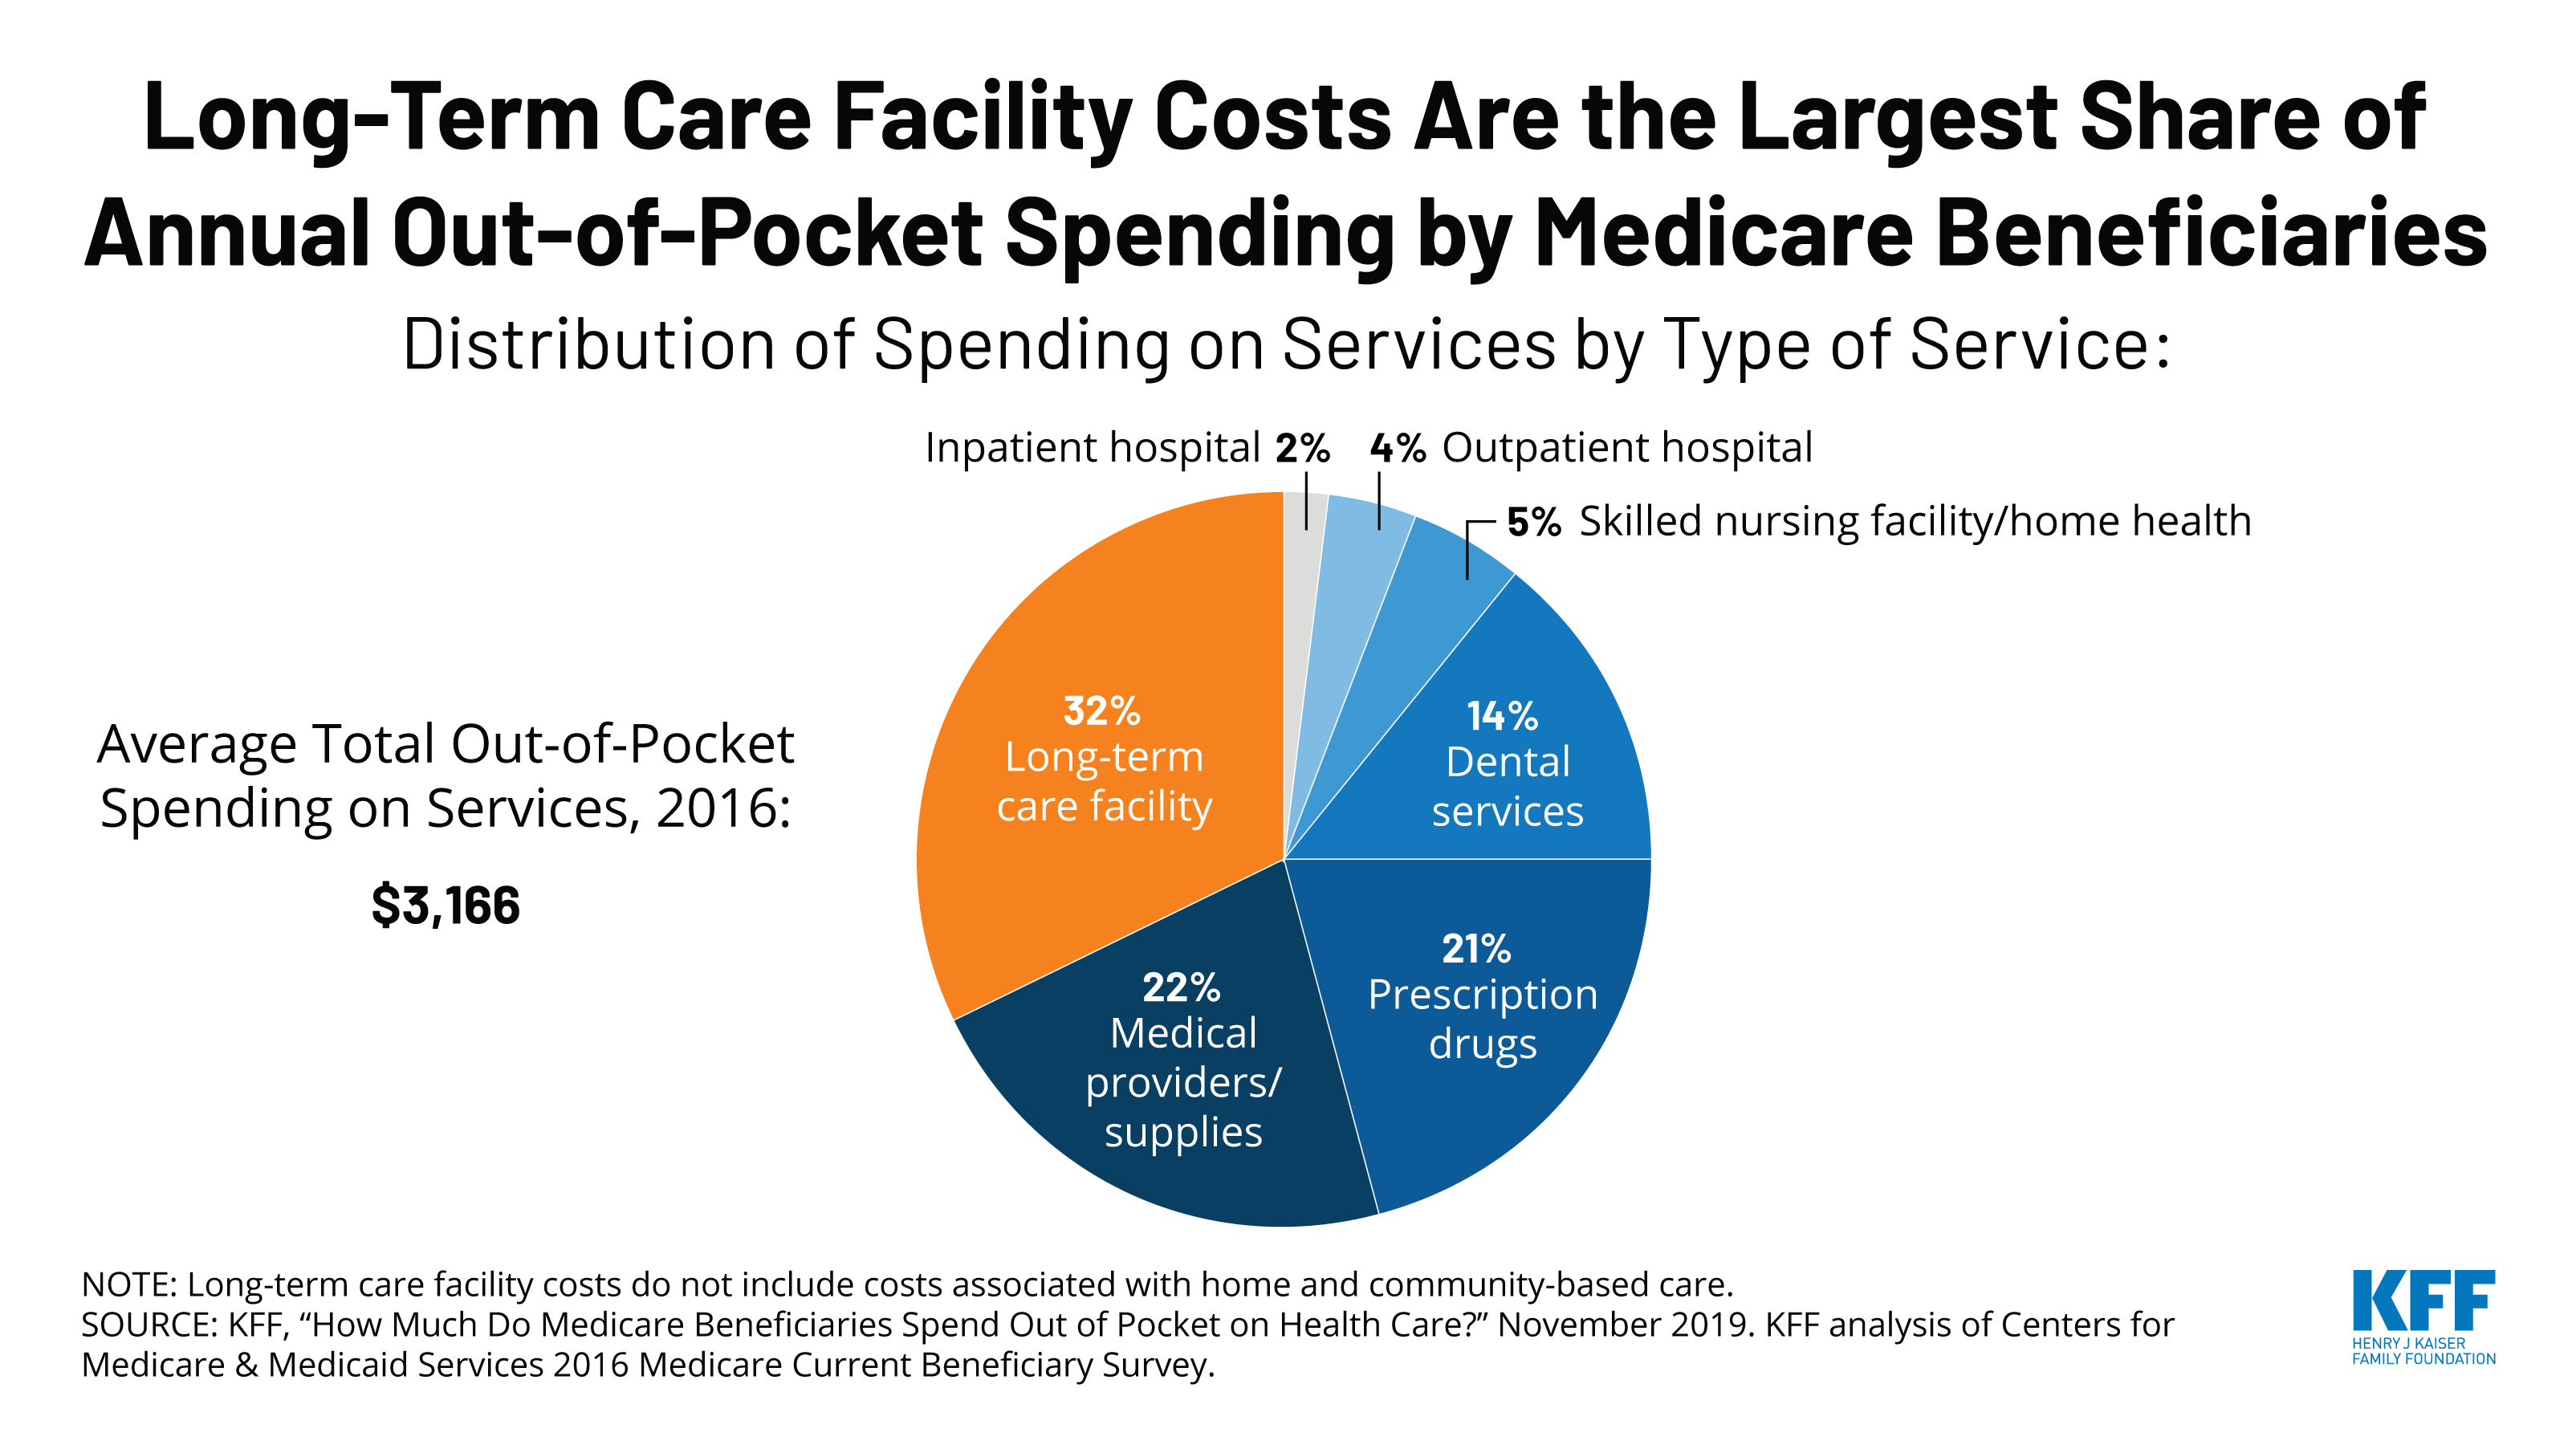
How Much Do Medicare Beneficiaries Spend Out of Pocket on Health Care?

“How Has U.S. Spending on Healthcare Changed Over Time?” Peterson-KFF Health System Tracker

The current Ebola outbreak was first declared by the DRC Ministry of Health on August 1, 2018 (see timeline of key events below). Almost all cases of Ebola in this outbreak so far have occurred in the two northeastern DRC provinces of Ituri and North Kivu, though a few cases have recently been identified in South Kivu province. This outbreak is the tenth – and by far the largest – in the DRC’s history and the second largest Ebola outbreak ever recorded after the West Africa Ebola outbreak in 2014-2015 that saw 28,616 cases, including 11,310 deaths, in the three most affected countries (Guinea, Liberia, and Sierra Leone).
Cross-border spread remains a concern. Uganda has reported several imported Ebola cases in areas bordering the DRC, with the most recent reported on August 26, 2019. WHO says there is a risk of further spread within the DRC and potentially across borders to Burundi, Rwanda, South Sudan, and Uganda, in particular. Several cases over the summer of 2019 in the large city of Goma, a regional and international transport hub that directly borders Rwanda, highlighted such concerns. Given the risks, neighboring countries have been preparing for possible cases for some time.
| Timeline of Key Events in Current Ebola Outbreak |
| August 1, 2018: Outbreak declared by the DRC Ministry of Health |
| Early August 2018: First U.S. CDC staff deployed to North Kivu province to assist in response efforts |
| August 7-8, 2018: Genetic tests confirm outbreak; vaccination efforts begin |
| August-September 2018: U.S. government pulls back staff from outbreak area due to security concerns |
| September 21, 2018: USAID deployed a Disaster Assistance Response Team (DART) to the DRC |
| October 17, 2018: WHO-convened Emergency Committee recommends that “public health emergency of international concern” (PHEIC) not be declared with regard to the DRC Ebola outbreak |
| November 9, 2018: Ebola case count surpasses largest number from previous DRC outbreaks, making this the largest Ebola outbreak in the DRC’s history |
| Late November 2018: Ebola case count surpasses all but the 2014-2015 West Africa outbreak, making this the second largest Ebola outbreak ever |
| Late December 2018: Voting in the DRC elections postponed in certain Ebola-affected areas, sparking protests |
| February 24, 2019: Ebola treatment center attacked and partially burned down, leading Medicins Sans Frontieres (MSF) to suspend services at the center; another center was attacked three days later, leading MSF to suspend its activities in the area |
| March 30, 2019: Ebola case count in this DRC outbreak surpasses 1,000 |
| April 12, 2019: WHO-convened Emergency Committee recommends for a second time that a PHEIC not be declared with regard to the DRC Ebola outbreak |
| April 15, 2019: The DRC Ministry of Health reports over 100,000 people have been vaccinated in this outbreak to date |
| April 19, 2019: WHO epidemiologist from Cameroon killed when a clinic was attacked in Butembo in the DRC |
| June 5, 2019: Ebola case count in the DRC outbreak surpasses 2,000 |
| June 11, 2019: Uganda confirmed first imported case of Ebola, with two additional cases reported the next day |
| June 14, 2019: WHO-convened Emergency Committee recommends for a third time that a PHEIC not be declared with regard to the DRC Ebola outbreak |
| July 14, 2019: The DRC government reports first case in Goma, capital of North Kivu province and a large city of 1-2 million people bordering Rwanda |
| July 17, 2019: WHO-convened Emergency Committee meets for a fourth time; WHO Director-General accepts the Committee’s assessment and declares the DRC Ebola outbreak a PHEIC |
| August 16, 2019: First Ebola cases confirmed in South Kivu province, the third province to see cases in this outbreak. |
| August 29, 2019: Ebola case count in the DRC surpasses 3,000; Uganda reports a fourth imported Ebola case |
| October 18, 2019: WHO Emergency Committee meets again and says the DRC outbreak remains a PHEIC. |
| November 11-12, 2019: Merck’s Ebola vaccine (Ervebo) approved by the European Commission and pre-qualified by WHO, making it the first officially licensed vaccine for Ebola. |
| November 14, 2019: Second Ebola vaccine (from Johnson & Johnson) is introduced into the Ebola response in eastern DRC, with a planned 50,000 people to be vaccinated in Goma. |
| November 27-28, 2019: WHO and other organizations temporarily halt operations and evacuate some staff after armed militia groups kill four people at Ebola response centers and violent protests erupt. |
| NOTES: WHO means World Health Organization. The DRC means the Democratic Republic of the Congo. |
As of December 16, 2019, the DRC Ministry of Health reports the country has had 3,348 cases (see figure below), of which there were 2,210 deaths. The number of new cases reported each week has declined noticeably since the end of July 2019, indicating progress has been made in interrupting transmission. Still, cases continue to occur, and recent violence in some Ebola-affected areas has interrupted the response, sparking concerns about this potentially leading to an increase in Ebola cases. Regardless, response activities could be needed for another several months at least, and another increase in transmission remains a concern. The crude case fatality ratio for this outbreak is high, at 66%, as of December 16, 2019.
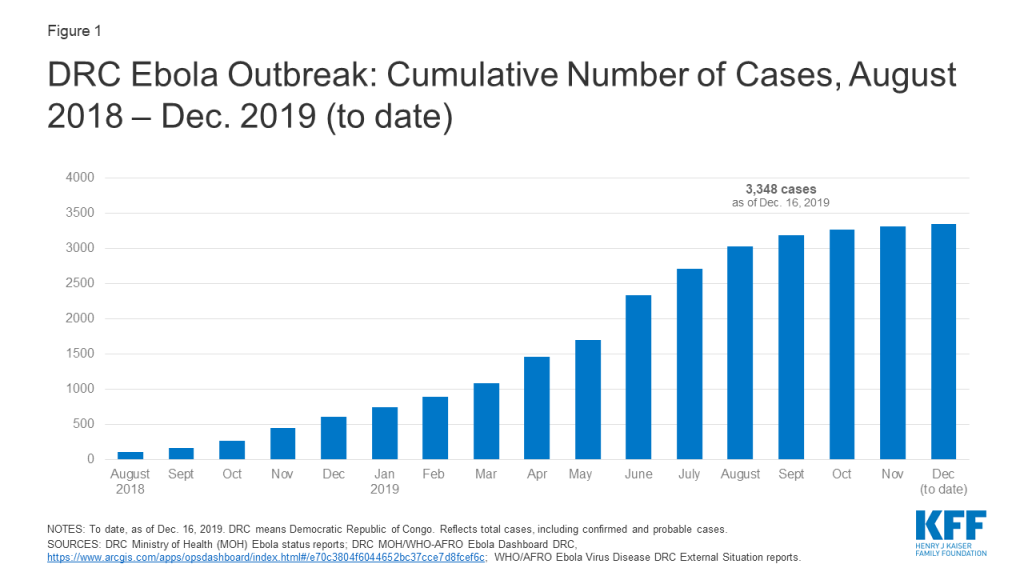
Health care workers (HCWs), such as nurses and doctors, caring for Ebola patients have been at particularly high risk of infection. At least 169 cases (about 5% of total cases) over the course of this outbreak have occurred among HCWs. This Ebola outbreak has also disproportionately affected children, with about 15 percent of all cases occurring among children under 5 and a higher proportion of the child cases dying from the disease compared with older age groups.
Multiple issues make responding to this Ebola outbreak more challenging than any prior outbreaks in the DRC. These include:
This combination of factors has made responding to this outbreak a much more difficult challenge compared with previous outbreaks in the DRC (see KFF brief).
U.S. engagement in the current outbreak has been limited compared to its role in the 2014-2015 West Africa Ebola outbreak response, where the U.S. played a major leadership role, mobilizing an unprecedented amount of funding, other resources, and personnel to support the Ebola response. Since then, there have been improvements in the global capacity to respond to Ebola, particularly on the part of WHO, and the DRC has had significant experience in addressing prior Ebola outbreaks; both WHO and the DRC took the lead early on in the current outbreak (see KFF brief). In addition, insecurity in the affected areas of the DRC has prevented U.S. agencies from being more involved, as U.S. personnel have been mostly restricted from working directly in the hardest hit areas due to safety concerns. However, the U.S. has provided significant funding and technical assistance in the DRC and in neighboring countries, working in conjunction with national governments, United Nations (U.N.) agencies, and other organizations leading the response. In fact, the U.S. is the largest donor to the Ebola response effort in the country, having provided over $250 million since August 2018.
While the number of Ebola cases in the DRC continues to decline from a peak over the summer, major challenges remain for the U.S. and other responders, such as: completing the task of interrupting transmission even amid ongoing violence, preventing expansion of the outbreak into other geographic areas, and effectively transitioning from an emergency response to a longer-term development effort to help stabilize and build up health systems in the affected areas.
The U.S. Agency for International Development (USAID) and U.S. Centers for Disease Control and Prevention (CDC) are the two main agencies contributing to the U.S. government response. USAID’s Office of Foreign Disaster Assistance (OFDA) coordinates U.S. emergency response efforts in the DRC, and in September 2018, the agency deployed a Disaster Assistance Response Team (DART) to the DRC in response to the outbreak. USAID’s Bureau for Global Health provides operational and personnel support. Several CDC offices, including the Center for Global Health’s Division of Global Health Protection and the National Center for Emerging and Zoonotic Infectious Diseases’ Division of High-Consequence Pathogens and Pathology (NCEZID/DHCPP), provide technical and personnel support. CDC efforts in the DRC are coordinated through its Emergency Operations Center (EOC) in Atlanta, which was activated in June 2019 at its lowest level (level 3).
Other U.S. agencies engaged in Ebola efforts include the National Institutes of Health (NIH) (conducting research on drug and vaccine development, including Ebola treatment trials in the DRC); the U.S. Food and Drug Administration (FDA) (regulating drug and vaccine development); and the Department of State (coordinating the U.S. and international diplomatic response).
U.S. personnel have been assisting in the DRC since the outbreak was announced in August 2018, but since late August/early September 2018, no U.S. personnel have been allowed to directly engage in response activities in active transmission areas in northeastern DRC. Citing safety concerns due to ongoing violence there, U.S. officials have decided to keep CDC and other U.S. staff away from the front lines of the response. Outside experts have made calls for the U.S. to return CDC staff to affected areas to assist more directly. So far though, there is little indication that the U.S. government will deviate from its current policy, though CDC reports working with the U.S. Department of State to “pre-position CDC staff in Goma to rapidly respond to hotspots where the security situation is permissible.”
Outside of the outbreak zone, U.S. personnel continue to assist. The DART – a “team of disaster and health experts” from USAID and CDC – continues its work in the DRC in response to the outbreak. CDC reports 34 staff working the DRC. Other CDC workers have deployed to WHO headquarters and to neighboring countries, such as Uganda, to assist in keeping the virus from crossing borders and to support countries in preparedness and response activities.
USAID reports providing about $266 million toward the Ebola response in the DRC and surrounding countries since the outbreak began in August 2018. Of this amount, $252 million is for activities in the DRC, while $14 million is for preparedness and response activities in Burundi, Rwanda, South Sudan, and Uganda. No estimate is available for the amount that CDC has spent on its Ebola response activities, though WHO reports the CDC has provided $500 thousand in funding to its efforts. The funding for both USAID and CDC, as well as for other U.S. agencies, in the response is not new funding; rather, it has been drawn from unspent FY 2015 emergency Ebola supplemental appropriations provided by Congress at the time of the West Africa Ebola outbreak. For USAID, leftover funding in the International Disaster Assistance (IDA) account that was designated for “assistance for countries affected by, or at risk of being affected by,” Ebola is being utilized for this purpose, and for CDC, leftover funding that was designated for Ebola international preparedness and response is being utilized. CDC’s leftover funding expired at the end of FY 2019 on Sept. 30, 2019 and, per communication with CDC, was expected to have been entirely spent by that time. In recent months, Congress has stated that CDC may use existing funds in the Infectious Diseases Rapid Response Reserve Fund, which was established in FY 2019, for CDC Ebola response.
The DRC government, including the Ministry of Health, and agencies of the U.N. lead the outbreak response. WHO is the lead U.N. agency for the public health response; other key U.N. actors include the U.N. Office for Coordination of Humanitarian Affairs (OCHA), the U.N. Children’s Fund (UNICEF), the World Food Programme (WFP), and MONUSCO, a multinational peacekeeping force that has been assisting with security. U.N. actors are led by a U.N. Emergency Ebola Response Coordinator.
Other key actors in and supporters of the response include governments of various countries, including the U.S.; multilateral organizations, such as the World Bank and Gavi; international and national non-governmental organizations (NGOs), such as Medicins Sans Frontieres (MSF), International Medical Corps, the Alliance for International Medical Action (ALIMA), and the International Red Cross/Red Crescent; and other partners.
Current public health response efforts in the DRC are focused on interrupting chains of Ebola transmission through identifying, isolating, and caring for cases before they transmit the disease further. The goal of the response is to bring the number of cases down “to zero”. Ebola outbreaks are usually declared to be over after 42 days have passed since the last known case (equal to two incubation periods of Ebola virus disease). A national Strategic Response Plan outlines the overall strategy, objectives, and priority activities for responding to the outbreak. There have been four iterations of the plan to date, each covering a specific period of time. The current plan that focuses on the core public health “pillar” of the response covers planned activities from July through the end of December 2019. It addresses strengthening response capacities in priority areas such as: coordination, surveillance and laboratory capabilities, infection prevention and control measures, vaccination, human resources, security, and risk communication among others. Complementary humanitarian response activities are another “pillar” of the response and outlined in a broader integrated Ebola response strategy, which includes efforts addressing food assistance, employment, and economic development in Ebola-affected regions.
On July 17, 2019, the WHO Director-General accepted the recommendation of the Emergency Committee and declared the DRC Ebola outbreak to be a “public health emergency of international concern” (PHEIC). A PHEIC is “an extraordinary event which is determined to constitute a public health risk to other States through the international spread of disease and to potentially require a coordinated international response.” In its declaration, WHO released a set of recommend actions for affected countries, neighboring countries, and all states. This was the fourth time the Emergency Committee had met to discuss a potential PHEIC declaration for Ebola in the DRC; each of the prior three times the Committee recommended not to do so.
At its most recent meeting, on October 17, 2019, the WHO Emergency Committee again recommended that the PHEIC declaration remain in place.
Vaccination has been an important component of the response since it began. This outbreak marks the first time that an effective vaccine is available and being used as a core component of an Ebola response. Authorities have mostly used a “ring vaccination” approach, targeting vaccination of those who have been in contact with a case of Ebola and the contacts of those contacts, as well as other groups at potential risk of exposure such as health care workers. As of December 8, 2019, over 256,000 people have been vaccinated in the DRC since the start of the outbreak, which has likely prevented hundreds, if not thousands, of Ebola cases already. Authorities have been primarily using a vaccine manufactured by Merck, which the company has provided free of charge to WHO and the DRC for the purposes of the response. The Merck vaccine, which was being deployed on an emergency use basis under a “compassionate use” protocol, received approval from European regulators and prequalification from WHO in November 2019, making it the first officially licensed Ebola vaccine. It is not yet approved and licensed by the FDA (though it is under review and an FDA regulatory decision is expected in early 2020). Costs for vaccine distribution and management of vaccinations in the response are shared among Gavi, WHO, other donors, and the DRC government.
In addition to the vaccination efforts in the DRC, neighboring countries are also vaccinating certain people, such as health workers, in areas at risk of seeing or that have seen Ebola cases due to cross-border spread (like Uganda, with at least 5,000 people vaccinated thus far).
A second Ebola vaccine, manufactured by Johnson & Johnson, is also available. Following recommendations from WHO and other expert groups, the DRC government decided to introduce the second vaccine into some at-risk areas of the country that do not have active Ebola transmission. For example, DRC authorities began vaccinating 50,000 people in Goma with the second vaccine in November 2019, and in December 2019, the DRC and neighboring Rwanda initiated a new vaccination campaign using that vaccine to protect people in at-risk areas on their mutual border.
It appears there are enough doses of the Merck vaccine to meet the demands of the current WHO/DRC government’s ring vaccination approach. Currently there are enough vaccine doses to vaccinate 300,000 people, which is greater than the total number of people vaccinated in the outbreak over the first 17 months of the response. In addition, WHO reports that Merck will produce enough vaccine over the next 6 to 18 months to vaccinate an additional 1.3 million people. Gavi announced in December 2019 that it will support a new global stockpile of 500,000 doses of Ebola vaccine, to be made available for emergency use as needed.
There is reportedly an adequate supply of the second (Johnson & Johnson) Ebola vaccine, with enough to vaccinate approximately 2 million people.
There are no FDA- or other approved treatments for Ebola, though several promising treatments are under development. Four experimental treatments have been studied in a clinical trial among Ebola patients in the DRC, and in August, the U.S. NIH announced that initial results of the trial indicated two of those treatments (the monoclonal antibody mAb114 and the multi-antibody “cocktail” REGN-EB3) showed the most promise. Ebola patients in the DRC enrolled in the trials are offered these two treatments as investigators further evaluate them. The treatments are still under investigation and being offered on a “compassionate use” basis only in the DRC.
From August 2018 through early December 2019 the amount of funding directed to response activities in the DRC included under four iterations of a national Strategic Response Plan has reached $361 million. This amount does not include additional DRC outbreak activities not captured under the plans, nor response costs in Uganda and preparedness costs in neighboring countries.
Funding amounts provided under each of the plans so far:
As mentioned earlier, USAID reports providing about $252 million toward the Ebola response in the DRC and about $14 million for activities in neighboring countries since the outbreak began in August 2018 (this includes funding channeled through the DRC national plans as well as funding not captured under the plans). No estimate is available for the amount that CDC has spent on its Ebola response activities, though WHO reports the CDC has provided $500 thousand in funding to its efforts. All U.S. funding for the current outbreak is drawn from existing funding sources (i.e., no new funding has been appropriated to agencies by Congress for this Ebola response, thus far).
See the KFF data note on donor funding for the response for further information.
Now well into its second year, the Ebola outbreak in the DRC remains challenging for responders, despite having important tools (such as vaccines and new treatment options) on hand. This is because the underlying factors driving transmission of Ebola in the DRC remain. The security situation shows no sign of abating, and there is a fear that it can always worsen. Mistrust of public health authorities also remains a barrier to response efforts. While it is not possible to predict the trajectory of the outbreak, it could take at least a few more months to fully contain even under good circumstances, so given the complex set of challenges being faced, the outbreak could take even longer than that to be brought under control.
Addressing these longstanding challenges more effectively is the aim of the broader integrated response strategy being implemented in the DRC. This strategy, which includes the public health pillar’s current national plan and is designed to guide the response through the end of December 2019, calls for greater community engagement, support for health and development interventions beyond addressing Ebola alone, a new approach to security, and more coordination among all responders.
Finally, the major questions for the U.S. government going forward include: whether or not it will change its approach and engagement in the DRC to allow U.S. government personnel to directly engage in public health activities on the frontlines of the response, how the U.S. will contribute to finally breaking all chains of transmission, and how the U.S. will support efforts to transition from an emergency response to a longer-term strategy for supporting the health care system in the affected areas to help prevent and contain any future recurrences of Ebola or other outbreaks.