Drug Overdose Deaths Have Declined Nationally and in Most States, Though Some States Have Seen Increases

The independent source for health policy research, polling, and news.
While every Democratic debate so far featured a slugfest among the candidates over the question of building on the Affordable Care Act by adding a public option or scrapping the current system in favor of Medicare-for-all, there hasn’t been nearly as much discussion of bringing down prescription drug prices.
In this February 2020 post for The JAMA Forum, Larry Levitt examines both the Democratic candidates’ proposals and the Trump administration’s record on lowering drug prices, which remains a top issue for the public with bi-partisan support.
Other contributions to The JAMA Forum are also available.
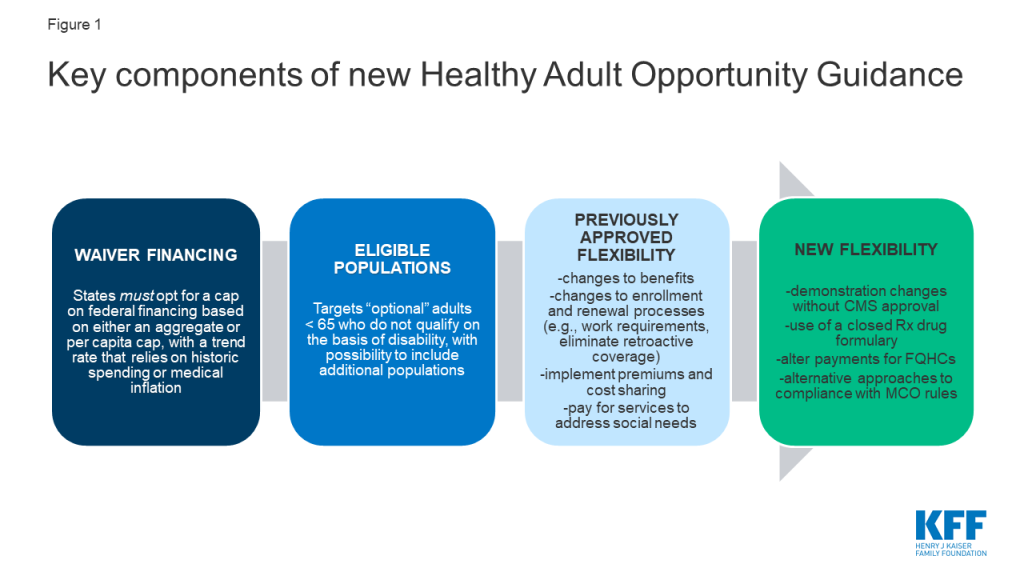
On January 30, 2020, the Centers for Medicare and Medicaid Services (CMS) released guidance inviting states to apply for new Section 1115 demonstrations known as the “Healthy Adult Opportunity” (HAO). These demonstrations would permit states “extensive flexibility” to use Medicaid funds to cover Affordable Care Act (ACA) expansion adults and other nonelderly adults covered at state option who do not qualify on the basis of disability, without being bound by many federal standards related to Medicaid eligibility, benefits, delivery systems, and program oversight. In exchange, states would agree to a limit on federal financing in the form of a per capita or aggregate cap. States that opt for the aggregate cap and meet performance standards could access a portion of federal savings if actual spending is under the cap.
HAO demonstrations differ from other Medicaid demonstrations already granted by this Administration in several ways, including the scope of flexibility offered to states and the capped federal funding. This issue brief explains the key elements of the HAO guidance (Figure 1) and considers the implications of the new demonstrations.
Today, states operate their Medicaid programs within federal minimum standards and a wide range of state options in exchange for federal matching funds that are available with no limit. The matching structure provides states with resources that automatically adjust for demographic and economic shifts, health care costs, public health emergencies, natural disasters and changing state priorities. In exchange for the federal funds, states must meet federal standards that reflect the program’s role covering a low-income population with limited resources and often complex health needs. Over time, states have transformed and updated their Medicaid programs to adopt new service delivery models, payment strategies, and quality initiatives.
Capped financing can present challenges for health programs. Unlike Medicaid in the states, the U.S. territories operate Medicaid under a federal cap, which has been set too low to meet enrollees’ needs and inflexible when responses to emerging health issues and natural disasters are required. Another capped entitlement, the Children’s Health Insurance Program (CHIP), has been successful mainly because most states administer CHIP in conjunction with Medicaid (which is not capped), and the federal funding caps for CHIP have been set at levels that have not required states to make substantial program cuts. However, requirements to reauthorize federal CHIP funding and past failure of Congress to act timely resulted in state budget issues and confusion for some enrollees.
Use of block grants in Medicaid has been debated before, dating back to the Reagan administration and most recently as part of the 2017 ACA repeal and replace debate. Under these legislative proposals, which would have applied to all states, federal funding for Medicaid could have been reduced by more than one-third over the next two decades below the projected baseline. Analysis of previous block grant proposals finds that reductions in funding and federal caps shift risk to states; coupled with additional state flexibility, enrollees could face fewer guaranteed benefits and less coverage compared to current law. Congress also considered the 2017 Graham-Cassidy legislation that would have ended federal funding for the ACA, partially replaced that funding with a block grant (for the Medicaid expansion and other Medicaid populations), and redistributed funds across states. A similar proposal was included in the President’s FY 2020 budget proposal. Congress failed to enact these proposals, and polling at the time showed that the public opposed block grants.
The Trump administration has used Section 1115 authority to implement substantial policy changes to the Medicaid program. Previous administrations also have used Section 1115 authority to advance policy priorities, but the Trump administration marked a new direction for Medicaid demonstrations beginning with the release of revised demonstration approval criteria in November 2017 that no longer included expanding coverage among the stated objectives. Section 1115 demonstrations issued under the Trump administration to date have included state programs to condition Medicaid eligibility on fulfillment of work and reporting requirements; use of premiums, copayments, and benefit restrictions not otherwise allowed under federal law; and behavioral health programs to use Medicaid funds for inpatient psychiatric hospital payments, among others. Most of these demonstrations were authorized through Section 1115 (a) (1) authority, which allows the HHS Secretary to waive state compliance with certain provisions in Section 1902 of the statute. In a few instances, the Administration has used Section 1115 (a) (2) authority, which allows the Secretary to approve federal matching funds for state spending on costs not otherwise matchable (CNOM). For example, more than half of all states have demonstrations to pay for services in “institutions for mental disease” (IMDs) for adults age 21-64, an expense not otherwise allowable under the law. The HAO demonstrations also will use Section 1115 (a) (2) expenditure authority, which CMS maintains enables the Secretary to permit states to “not apply” federal Medicaid requirements to expenditures for individuals covered under the HAO demonstrations. While previous administrations have relied on Section 1115 (a) (2) for coverage expansions, they did so before there was legal authority under the ACA to cover those populations. In using Section 1115 (a) (2), this Administration is inviting states to choose from a “menu” of provisions included in other approved demonstrations to date, and it is offering states the opportunity to modify or eliminate some program rules not previously granted.
The HAO demonstrations will be subject to an annual federal spending cap. States will choose whether to use an aggregate cap or a per capita cap. States opting for an aggregate cap will be subject to that cap without regard to changes in Medicaid enrollment; the cap for states opting for a per capita cap is calculated based on the number of enrollees, times the maximum allowable spending per person. In both cases, the Centers for Medicare and Medicaid Services (CMS) will establish a base amount for the cap using recent spending data and will trend that amount forward. The trend factor will be the lesser of the prior five year state average Medicaid spending growth or medical inflation (CPI-M) for the per capita cap, or CPI-M +.5% for the aggregate cap. For states electing the per capita cap, funding would reflect the trend plus enrollment growth. The guidance also says that CMS will adjust the base amount or subsequent annual caps to account for state flexibilities that could significantly affect enrollment to ensure that states do not achieve savings from disenrolling individuals. States will continue to submit claims reflecting actual expenditures to draw down federal matching funds. States that expand coverage to 138% of the federal poverty level (FPL) can receive enhanced matching funds for ACA expansion adults.
The HAO spending caps differ from current methods used to determine budget neutrality for demonstrations. By long-standing policy, Section 1115 demonstrations are required to be budget neutral to the federal government (i.e., the federal government cannot spend more than it would have spent in the absence of the demonstration). Budget neutrality is calculated by establishing a “without waiver” baseline of expected costs and then comparing that baseline to expected spending under the demonstration. These determinations are typically calculated over the entire term of the demonstration (usually five years) and also typically calculated on a per member per month basis. However, budget neutrality can also be calculated using an aggregate cap. In the past, capped demonstrations have been approved in Rhode Island, Vermont, and Virginia (for a limited population), but they are no longer in place in these states. Under the HAO, caps will be enforced annually (not over the term of the demonstration).
In exchange for taking on greater risk, states choosing an aggregate cap can obtain 25 to 50% of federal savings if spending is below the cap and performance benchmarks are met. Shared savings can be used for existing state-funded health programs or new health-related initiatives targeted to demonstration or other Medicaid enrollees or to offset expenditures that exceed the cap for up to three years. This policy seems to stand in contrast with earlier guidance that would not allow federal funds for designated state health programs (DSHP). Shared savings are available to states on a matched basis at their regular matching rate. States that do not spend at least 80% of their cap annually (combined federal and state spending) will have their cap reduced in subsequent years. States that access shared savings must spend those funds within three years after the demonstration period. States extending coverage to new populations under HAO demonstrations must first implement through a per capita cap model before switching to an aggregate cap model to be eligible for shared savings.
States would be able to propose adjustments to an approved cap to account for changes in projected expenditures or enrollment due to unforeseen circumstances outside the state’s control such as a public health crisis or major economic event. For populations newly covered under an HAO demonstration, CMS will estimate expenditures based on national averages and state specific factors but will re-base the estimate if actual expenditures exceed a specified margin above or below the base. Such adjustments, along with opportunities for shared savings, mitigate the risks for states. Analyses of historic per enrollee growth showed that 47 states would have experienced declines in spending if per enrollee spending for adults had been limited to CPI-M for 2001-2011, though growth in per enrollee health care spending in Medicaid and more broadly has slowed since then. Certain expenditures will be excluded from the HAO caps including disproportionate share hospital (DSH) payments, administrative expenditures, expenditures for public health emergencies, expenditures for Indian Health Services (IHS) matched at 100%, and a portion of supplemental payments that could be attributable to the population included in the demonstration.
States could include in HAO demonstrations ACA expansion adults and other adults under age 65 that do not qualify on the basis of disability. These other adult groups include low-income parents and pregnant women covered at state option and other populations currently covered under Section 1115 demonstration authority. All children, mandatory pregnant women (those with incomes up to 138% FPL), mandatory low-income parents (those up to the state’s 1996 cash assistance levels), and adults eligible based on a disability or long-term care need are excluded from the new demonstrations. Still, some people included in HAO demonstrations may have functional or other disabilities, as a large share of Medicaid adults have such disabilities even though they do not qualify on the basis of a disability. The guidance also notes that CMS may consider state requests to include other adult populations who are not covered under the state plan, which may open these demonstrations up to additional adult populations. States could use HAO demonstrations to extend coverage to groups not already covered. States also could terminate current state plan authority for optional groups and move that coverage to an HAO demonstration with additional restrictions.
States could limit eligibility for certain adults under HAO demonstrations. States could set an income limit for expansion adults below 138% FPL and apply an asset test to limit eligibility for any demonstration enrollees. However, states can only receive enhanced matching funds for ACA expansion adults if they cover the full expansion population (all adults with incomes up to 138% FPL) without an asset test. Under the ACA, asset tests are not allowed for low-income parents, pregnant women, and expansion adults. States also can use HAO demonstrations to cover a subset of ACA expansion adults (at the regular matching rate), using other (non-financial) criteria, such as establishing geographic limits or restricting coverage to people with specific illnesses, such as behavioral health diagnoses.
Under the HAO demonstrations, states could limit Medicaid eligibility in other ways not allowed by current law. States could impose additional eligibility requirements, such as work requirements or other criteria that individuals must meet to gain coverage. States also could eliminate 3-month retroactive eligibility and delay the effective coverage date beyond the eligibility determination. For example, states could require that coverage does not begin until an individual enrolls in a health plan, which could involve paying the first month’s premium. States also could require premiums for enrollees at any income level and at any amount, subject only to a cap of 5% of income, and suspend coverage for those who fail to pay after a grace period (other than tribal members, those with substance use disorders, and those with HIV). States could also make changes to current rules around enrollment and renewal processes. For example, states could conduct the initial eligibility renewal sooner than the current 12-month requirement (to align with the Marketplace) and eliminate the ability for hospitals to determine individuals “presumptively” eligible – changes that could reduce enrollment. However, states also could apply 12-month continuous eligibility to demonstration enrollees which could reduce enrollment churn.
The HAO demonstrations would allow states to limit covered benefits compared to current law. States would not have to provide the full Medicaid alternative (formerly known as benchmark) benefit package to demonstration enrollees. For example, states could eliminate non-emergency medical transportation and Early and Periodic Screening, Diagnostic, and Treatment Services (EPDST) for 19 and 20 year olds. Instead, states only need to cover the 10 categories of essential health benefits (EHB) available in Marketplace plans and would have flexibility beyond current law to determine the appropriate amount, duration, and scope of covered services. States could receive enhanced ACA matching funds for expansion adults without providing the full benchmark benefit package as required by current law. States also could seek authority to cover additional services that would improve health outcomes and “address certain health determinants to promote independence.”
States could establish closed prescription drug formularies, a change from current Medicaid rules that generally require states to include all FDA-approved drugs from manufacturers with Medicaid rebate agreements. While the guidance provides that states can use formularies, it stipulates that manufacturers are still obliged to pay rebates under the Medicaid drug rebate program. In addition to EHB requirements, which require coverage of the greater of at least one drug in each drug category and class (with an exceptions process) or the same number of drugs in each category and class as the base benchmark plan used to define EHB, prescription drug formularies under the demonstrations would have to cover substantially all mental health and antiretroviral drugs and all FDA approved drugs with rebate agreements to treat opioid use disorder.
States would have broader authority to impose cost-sharing on enrollees. States could impose cost sharing for any service on any enrollee (other than tribal members, those with substance use disorder, those with HIV, and mental health drugs) above the currently allowed nominal amounts, subject only to the 5% of income out of pocket cap (including premiums and cost-sharing).
States could not follow and/or propose alternative approaches that differ from current federal Medicaid managed care regulations, including access to care and rate certification standards. For example, states would not have to obtain prospective CMS review of actuarially sound capitation rates or CMS approval of health plan contract amendments. States also could adopt alternative provider network adequacy standards and propose alternative approaches to other federal managed care requirements. In addition, while CMS acknowledges that fair hearings are constitutionally required, it will permit states to “not implement” and streamline portions of these processes for all HAO enrollees.
States could deviate from current federal rules with respect to payment and delivery system under HAO demonstrations. For example, states could use value-based payment (VBP) for federally-qualified health centers (FQHCs), which are currently paid under a Prospective Payment System (PPS) that ties payments to the costs of delivering care. VBPs to health centers may limit payment for only certain services, lower their payment, or make payment contingent on meeting certain outcomes. Elimination of hospital presumptive eligibility could also lower payment to hospitals. States are encouraged to pursue delivery system changes under the demonstrations to “promote competition” and incorporate models currently being tested by the Center for Medicare & Medicaid Innovation (CMMI). States also could limit enrollees’ free choice of fee-for-service provider based on state-established standards for reimbursement, quality and utilization.
Once a 5-year demonstration is approved, states can make “administrative and programmatic changes” without prior CMS approval, unless the change “has the potential to substantially impact enrollment.” For example, states could change premium and cost sharing amounts or EHB benchmark plans or eliminate optional benefits during the course of the demonstration without submitting a demonstration amendment to CMS. States must report quarterly on 13 performance metrics in the areas of enrollment, retention, access to care, and financial management, and CMS will use rapid cycle evaluation for mid-course corrective action if state cannot correct problems related to enrollee access to coverage or care. States will also be subject to the evaluation requirements standard for all Section 1115 demonstrations.
CMS maintains that these new demonstrations will advance program objectives. Specifically, CMS states that the demonstrations will advance program objectives by “furnishing medical assistance in a manner that promotes the sustainability of government health care spending” and will require states to evaluate their demonstrations to determine whether the additional flexibilities “enable states to more efficiently administer their Medicaid programs” as well as the demonstration’s impact on enrollees. As recent litigation on work requirements shows, the stated goals of the demonstrations have implications for their legality. Those lawsuits have been decided based on the finding that the primary objective of the Medicaid program is to provide affordable coverage to low-income people, which is not highlighted as a program objective for the HAOs.
The HAO guidance, in giving states significantly greater leeway in operating Medicaid programs within a cap on federal spending, is consistent with the Trump administration’s previous support for block grants in the President’s budget proposals and its position in the debate over repealing and replacing the ACA. Unlike past proposed legislative changes, demonstrations under this new guidance would not apply to all states. While states opting for HAO demonstrations would be given greater flexibility compared to current law, they would also face fiscal risks in accepting capped federal funding. The breadth of the new flexibility could also result in limits on coverage and access to care for current enrollees and potentially limit the reach of the ACA Medicaid expansion through the HAO demonstrations, compared to coverage of new enrollees under current law.
Overall, the HAO demonstrations could cover nearly 30 million adults if adopted in all states. This total includes approximately 13 million adults newly covered through the ACA Medicaid expansion, 10 million adults currently covered through other state options (using the estimate that 16.1% of Medicaid enrollees are adults covered at state option without accounting for the ACA expansion), and nearly five million uninsured low-income adults in non-expansion states who could be eligible for Medicaid if the state adopted the expansion.
The HAO guidance would make significant changes to the Medicaid program in the absence of federal legislation, which will likely subject it to legal challenges. Under the HAO, states could access substantial flexibility to provide Medicaid coverage, with various eligibility and benefit restrictions, to many adults in exchange for taking on the risk of capped financing. Oklahoma plans to develop an HAO demonstration proposal that could access Medicaid expansion funding, amid efforts to put the Medicaid expansion question to voters on the ballot in November 2020. While a number of states pursued work requirements promoted under other Section 1115 demonstration guidance, those efforts have been challenged in the courts. The debate has demonstrated the tension and limits on how far an administration can go in implementing significant policy changes to Medicaid through demonstration authority. The HAO guidance is likely to set up a similar tension. Looking ahead, the following questions will be important to follow:
Jennifer Kates, Senior Vice President and Director of KFF’s Global Health & HIV Policy program, testified before the U.S. House of Representatives’ Committee on Foreign Affairs on February 5, 2020, as part of a hearing on Unique Challenges Women Face in Global Health. Her testimony describes the role of the U.S. government in women’s global health, including U.S. programs on global maternal and child health/nutrition, family planning and reproductive health, and HIV (PEPFAR), and highlights challenges and opportunities to strengthen these efforts.
Medicaid continues to be the primary payer for long-term services and supports (LTSS), with these services typically unavailable or unaffordable through Medicare or private insurance. State Medicaid programs must cover LTSS in nursing homes, while most home and community-based services (HCBS) are optional, which results in considerable differences among states in HCBS eligibility, scope of benefits, and delivery systems. This issue brief illustrates current variation and trends in Medicaid HCBS state policy choices, using the latest data (FY 2018) from the Kaiser Family Foundation’s 18th annual 50-state survey. A related brief presents state-level HCBS enrollment and spending data. Key findings include:
State HCBS programs reflect states’ substantial flexibility in choosing among optional authorities.
Over half of states have capitated managed long-term services and supports (MLTSS) programs.
States are working to implement new policies in response to federal laws and regulations affecting HCBS.
States will face increasing pressure to meet the health and LTSS needs of a growing elderly population in the near future. Understanding the variation in Medicaid HCBS state policies is important for analyzing the implications of this demographic change as well as the implications of a range of policy changes that could fundamentally restructure federal Medicaid financing or the larger U.S. health care system. For example, substantially cutting and capping the federal Medicaid funds available to states through a block grant or per capita cap could put pressure on states to eliminate optional covered populations and services, such as those that authorize and expand the availability of HCBS. While all states could face challenges in this scenario to varying degrees, those with certain characteristics – such as existing restrictive Medicaid policies; demographics like poverty, old age, or poor health status that reflect high needs; high cost health care markets; or low state fiscal capacity – could face greater challenges. On the other hand, moving to a Medicare-for-all system would eliminate existing state variation in favor uniform coverage of HCBS for all Americans. Unlike Medicaid, HCBS would be required and explicitly prioritized over institutional services under current Medicare-for-all proposals. As these policy debates develop, there will be continued focus on Medicaid’s role in providing HCBS for seniors and people with disabilities.
State Medicaid programs must cover long-term services and supports (LTSS) provided in nursing homes, while most home and community-based services (HCBS) are optional.1 Joint federal and state Medicaid spending across the main HCBS authorities totaled $92 billion in FY 2018, with most spending and enrollment in optional authorities.2 In addition to choosing which HCBS to offer, states have flexibility to determine a number of policies that shape these benefits in important ways for the seniors and people with disabilities and chronic illnesses who rely on them to live independently in the community.
This issue brief presents the latest (FY 2018) data on key state policy choices from the Kaiser Family Foundation’s 18th annual survey of Medicaid HCBS programs in all 50 states and DC. Our survey encompasses home health, personal care, Community First Choice, and Section 1915 (i) state plan benefits as well as Section 1915 (c) and Section 1115 waivers (Figure 1 and Appendix Table 1). We include findings related to state choices about scope of benefits, self-direction, capitated managed care delivery systems, provider policies and reimbursement rates, financial and functional eligibility criteria, HCBS waiver waiting lists and other utilization controls, and quality measures. We also report on state progress in implementing notable regulations, including the LTSS provisions in the Medicaid managed care rule, the electronic visit verification rule, the home and community-based settings rule, and the U.S. Department of Labor direct care worker minimum wage and overtime rule. Appendix Tables contain detailed state-level data. A related brief presents the latest state-level Medicaid HCBS enrollment and spending data.
All states offer home health state plan services, the only HCBS that is not provided at state option. At minimum, the home health state plan benefit includes nursing services, home health aide services, and medical supplies, equipment, and appliances. Home health aides typically assist individuals with self-care tasks, such as bathing or eating. While all state Medicaid programs must offer home health state plan services, states have substantial flexibility in designing this benefit. Key state home health policy choices are described below and summarized in Figure 2 and Appendix Table 2.
Nearly all states choose to expand the scope of their home health state plan benefit by including optional therapy services (physical, occupational, and/or speech-language) (Figure 2 and Appendix Table 2). Oklahoma is the only state that does not cover any form of optional therapy services as part of its home health state plan benefit. A minority of states choose to include assistance with household activities, such as preparing meals or housekeeping, within their home health state plan benefit. A dozen states cover other optional services within their home health state plan benefit, such as social work, counseling, nutrition/dietitian services, case management, telehealth (remote monitoring), and emergency support/caregiver respite (no data shown).
Few states allow beneficiaries to self-direct home health state plan services (Figure 2 and Appendix Table 2). Self-direction typically allows beneficiaries to select and dismiss their direct care workers, determine worker schedules, set worker payment rates, and/or allocate their service budgets. The states that offer self-direction for home health state plan services are California, Nebraska,3 and New Jersey. States may be less likely to offer self-direction for home health services compared to personal care services (discussed below) at least in part because home health services may be used by some beneficiaries for shorter periods of time. Nebraska is the only state that allows self-direction for home health services but not for personal care services (Appendix Tables 2 and 3).
Just over half of states apply utilization controls to their home health state plan benefit (Figure 2 and Appendix Table 2). Specifically, 25 states cap the number of home health service hours or visits that a beneficiary can receive, and three states cap the daily amount that can be spent on home health services for an individual. Among states applying utilization controls, all choose either hour/visit caps or spending caps, except Oregon, which applies both types of utilization controls. Thirteen states allow exceptions to their hour/visit limits, while two states (AK and RI) do not.4 Among the three states that offer self-direction for home health services, two (CA and NJ) apply their hour/visit limits to both self-directed and other (e.g., agency-provided) services, while Nebraska does not apply its cost cap to self-directed services. Applying hour or cost caps to self-directed services can have implications for beneficiary access to needed service hours as well as the direct care worker overtime rule (discussed below).
Ten states require a copayment for home health state plan services (Figure 2 and Appendix Table 2).5 Copayment amounts range from $1 to $4 per visit,6 with most states (7 of 10) charging about $3.7 Maine’s copayments are capped at $30 per month, while South Carolina and Virginia note that if more than one home health service is provided on the same day, the individual is only assessed one copay. Kansas’s copayment applies only to individuals enrolled in fee-for-service Medicaid (about 2% of the population) and not to those enrolled in a capitated managed care plan.
Over half of states deliver some or all home health state plan services through capitated managed care (Figure 2).8 A Section 1115 demonstration waiver is the most frequently used Medicaid managed care authority for these services (12 states), while fewer states use a Section 1915 (b) managed care waiver (5 states), the Section 1932 managed care state plan option (4 states), or a combination of Medicaid managed care authorities (5 states) (no data shown).9
The average provider reimbursement rate for home health agency services is $102.85 per visit (Appendix Table 2).10 Agency reimbursement rates account for a range of home health providers, such as registered nurses; home health aides; physical, occupational, and speech-language therapists; and social workers. In the 37 states with direct payment or mandated rates for registered nurses providing home health services, the average rate per visit is $89.89.11 In the 39 states with direct payment or mandated rates for home health aides, the average rate per visit is $46.80.12
Thirty-four states offer personal care services as an optional state plan benefit (Appendix Table 3). Delaware discontinued its personal care state plan benefit in FY 2018, and instead now covers those services under its home health state plan benefit.13 Personal care services “may include a range of human assistance. . . [that] enables [individuals] to accomplish tasks that they would normally do for themselves if they did not have a disability.”14 These services typically assist individuals with self-care tasks, such as eating, bathing, dressing, toileting, transferring, and maintaining continence, and household activities, such as personal hygiene, light housework, laundry, meal preparation, transportation, grocery shopping, using the telephone, medication management, and money management.15 The scope of personal care services “may be in the form of hands-on assistance (actually performing a personal care task for a person) or cuing so that the person performs the task by him/herself.”16 Key state policy choices about personal care state plan benefits are summarized in Figure3 and Appendix Table 3 and described below.
All states (of 32 responding)17 that elect the personal care state plan option include assistance with self-care activities, and most include homemaker/chore services to assist with household activities. Over half of personal care states cover cueing or monitoring, in addition to hands-on assistance (Figure 3). Fifteen states provide transportation as part of their personal care benefit, and a dozen include tasks delegated by a nurse, such as injections (no data shown). About one-third of states cover other services within their personal care state plan benefit, such as respite, case management, medical escort, life skills training,18 and assistive technology (no data shown).
In addition to a beneficiary’s residence, about three-quarters of states electing the personal care state plan option offer services at an individual’s work site (Figure 3 and Appendix Table 3). Two-thirds of personal care states provide services elsewhere in the community outside of a home or work setting. Providing services at a work site or elsewhere in the community can increase the extent to which beneficiaries are integrated into the community. About one-third of personal care states provide services at other residential settings, such as residential care, foster care, or assisted living facilities; the residence of family or friends; or dormitories for full-time students (no data shown). California allows for services to be provided out-of-state on a limited basis, to enable individuals to go on vacation or attend a funeral.
Over half of personal care states allow individuals to self-direct these services (Figure 3 and Appendix Table 3), almost seven times the number that do so for home health state plan services. As noted above, self-direction typically allows beneficiaries to select and dismiss their direct care workers, determine worker schedules, set worker payment rates, and/or allocate their service budgets.
Over one-third of personal care states allow individuals to choose among both agency and independent providers, while few states allow legally responsible relatives to be paid providers (Figure 3 and Appendix Table 3). Covering more provider types can help to increase access to personal care services, which is especially critical as individuals often rely on these services for basic daily needs. Just under half of personal care states cover only agency providers, and three states (CA, MA and VT) offer only independent providers. The states that allow legally responsible relatives, such as a spouse or parent, to be paid providers are Alaska,19 California, Louisiana,20 Minnesota, and Oregon.
Nearly all personal care states use a standardized assessment tool to determine functional needs for personal care state plan services. The two states that do not base the functional needs assessment on a standardized tool are New Hampshire and Utah. Among states using a standardized assessment tool, 25 describe it as a state-specific or “another” tool,21 while five states report using the Inter-RAI tool (LA, MD, MO, NM and SD).
Just under half of personal care states rely on a state or local government agency to perform the functional needs assessment for personal care state plan services. Two states (CO and WI) rely on health care providers to assess functional needs; one state (NJ) relies on managed care plans; and one state (VT) uses community-based organizations. The remaining dozen states use “another entity,” which could include a combination of state staff and providers, community-based organizations, and/or health plans. Nearly three-quarters of personal care states have an exceptions process if individuals disagree with the assessment results (no data shown).
Over half of personal care states apply utilization controls to these services (Figure 3 and Appendix Table 3), while one state requires a copayment. Among the states with utilization controls, 20 cap the number of hours that an individual can receive, and two states (FL and MO) cap the amount spent on personal care services that an individual can receive. All states with utilization controls choose either hour or cost caps, except Florida, which applies both. Among the 11 states with hourly caps that also allow self-direction, seven (AR, ID, MI, MN, MT, NV, and NJ) apply hourly caps to both self-directed and other (e.g., agency-provided) services, three (DC, MA, and VT) apply hourly caps only to self-directed services, and one (CA) applies hourly caps only to non-self-directed services. Applying hourly caps to self-directed services can have implications for beneficiary access to needed service hours as well as the direct care worker overtime rule (discussed below). Maine is the only state that requires a copayment, of $3 per day (capped at $30/month), for personal care state plan services.
Over one-third of personal care states deliver some or all of these services through capitated managed care.22 States’ choice of Medicaid managed care authority varies, with three states using a Section 1115 demonstration waiver, three states using the Section 1932 managed care state plan option, two states using a Section 1915 (b) managed care waiver, one state using Section 1915 (a) managed care authority, and three states using a combination of managed care authorities (no data shown).
The average provider reimbursement rate paid to personal care agencies is $19.90 per hour (Appendix Table 3).23 In the 15 states that report paying personal care service providers directly or mandating their reimbursement rates, the average rate is $17.26 per hour.
Eight states offer attendant services and supports under the Community First Choice (CFC) state plan option (Figure 1 and Appendix Table 1).24 These states include CA, CT, MD, MT, NY, OR, TX, and WA. States providing CFC services receive enhanced federal matching funds at an additional six percent. Key state policy choices about CFC financial eligibility and services are described below.
Nearly all CFC states choose to expand financial eligibility to beneficiaries who qualify for Medicaid under an HCBS waiver.25 All states electing the CFC option must provide services to individuals who either (1) are eligible for Medicaid in a state plan coverage group that includes nursing home services in the benefit package, or (2) have income at or below 150% of the federal poverty level (FPL, $18,735/year for an individual in 2019).26 States can choose to expand CFC eligibility to individuals who are eligible for Medicaid under an HCBS waiver; these waivers (described below) enable states to expand Medicaid financial eligibility up to 300% SSI ($27,756/year for an individual in 2019).27 Montana is the only CFC state that does not opt to expand financial eligibility to individuals who qualify for Medicaid under an HCBS waiver. In addition to meeting financial eligibility criteria, individuals receiving CFC services must have functional needs that would otherwise require an institutional level of care.
Half of CFC states choose to offer additional services beyond the minimum CFC benefit package. CFC services must include assistance with self-care, household activities, and health-related tasks,28 self-direction opportunities, and back-up systems.29 States also have the option to cover additional CFC services, including institutional to community transition costs30 and supports that increase or substitute for human assistance.31 Four states (CT, MD, OR, and WA) cover both types of optional CFC services, while three states offer the basic CFC benefit package (CA, MT, and TX).32
Eleven states offer the Section 1915 (i) HCBS state plan option in FY 2018, and two more states newly added this option effective in FY 2019 (Figure 1 and Appendix Table 1). The 11 Section 1915 (i) states responding to the FY 2018 policy survey include CA, CT, DE, DC, ID, IN, IA, MS, OH, NV, and TX. In addition, Michigan has a new Section 1915 (i) HCBS state plan option, effective October 2018,33 and Arkansas newly elected the Section 1915 (i) HCBS state plan option, effective March 2019. Section 1915 (i) allows states to offer HCBS as part of their Medicaid state plan benefit package instead of through a waiver. Key state policy choices about Section 1915 (i) target populations, services, and eligibility are described below.
People with mental illness and those with intellectual or developmental disabilities (I/DD) are the target populations most commonly served under Section 1915 (i). Like waivers, states can target Section 1915 (i) services to a particular population. Four states (IA, IN, OH, and TX) target people with mental illness, four states (CA, DE, ID, and MS) target people with I/DD, and three states target seniors and/or people with physical disabilities (CT-seniors only, DC, and NV). Three states (ID, IN, and NV) have more than one Section 1915 (i) program serving different sub-populations.34
Home-based services are the most frequently covered type of service across all Section 1915 (i) target populations (in 8 of 10 states reporting)35 (Appendix Table 4). Other frequently covered Section 1915 (i) services include case management (7 states), day services (7 states), supported employment (6 states), and other mental/behavioral health services (6 states). Nursing/therapy services, round-the-clock services, and equipment/technology/modifications are less frequently covered under Section 1915 (i) (4 states), which likely reflects the fact that Section 1915 (i) functional eligibility is less than an institutional level of care. Box 1 lists the nine service categories included in our survey.
Box 1: Service Categories for Section 1915 (i) and Section 1915 (c) HCBS
States provide a range of different HCBS through the Section 1915 (i) state plan option and Section 1915 (c) waivers, which our survey groups into nine categories that reflect CMS’s HCBS Taxonomy:36 (1) case management; (2) home-based services (including personal care, companion services, home health, respite, chore/homemaker services, and home-delivered meals); (3) day services (including day habilitation and adult day health services); (4) nursing/other health/therapeutic services; (5) round-the-clock services (including in-home residential habilitation, supported living, and group living); (6) supported employment/training; (7) other mental health and behavioral services (including mental health assessment, crisis intervention, counseling, peer specialist); (8) equipment/technology/modifications (such as personal emergency response systems, home and/or vehicle accessibility adaptions); and (9) other services (including non-medical transportation, community transition services, payments to managed care, and goods and services).
States’ Section 1915 (i) benefit packages vary by target population (Appendix Table 4). For people with I/DD, home-based services, day services, and supported employment are the most frequently provided Section 1915 (i) services (in 3 of 4 states covering this population), while nursing/therapy and round-the-clock services are the least likely to be covered (1 of 4 states). For people with mental illness, Section 1915 (i) states most frequently provide case management, home-based, and other mental/behavioral health services (3 of 4 states covering this population) and are less likely to provide round-the-clock services and equipment/technology/modifications (1 of 4 states). Home-based services, day services, case management, and round-the-clock services are the most frequently covered Section 1915 (i) services for seniors/people with physical disabilities (2 of 3 states reporting).37
Two states opt to extend Section 1915 (i) financial eligibility to the federal maximum of 300% of SSI for certain individuals. Specifically, Idaho expands financial eligibility for both of its Section 1915 (i) programs (children with I/DD and adults with I/DD), while Indiana expands financial eligibility for one of its three programs (people with mental illness receiving behavioral health and primary care coordination).38 The other nine states provide Section 1915 (i) services to people with income up to 150% FPL. Under Section 1915 (i), states can cover (1) people who are eligible for Medicaid under the state plan up to 150% FPL, with no asset limit, who meet functional eligibility criteria; and also may cover (2) people up to 300% SSI who would be eligible for Medicaid under an existing HCBS waiver.
Idaho began using Section 1915 (i) as an independent Medicaid coverage pathway in FY 2018, joining two other states (IN and OH) electing this option. Idaho applies this policy to one of its two Section 1915 (i) target populations (children with developmental disabilities). Indiana applies this policy to one of its three Section 1915 (i) target populations (people with mental illness receiving behavioral health and primary care coordination). Ohio’s Section 1915 (i) option provides an independent eligibility pathway for people with mental illness. This option within Section 1915 (i) allows individuals who are not otherwise eligible under the state plan or a waiver to gain Medicaid coverage. The other eight states use Section 1915 (i) to authorize HCBS but require beneficiaries to be otherwise eligible for Medicaid through another coverage pathway.
Since adopting Section 1915 (i), no state has applied the option to restrict functional eligibility criteria to control enrollment. Unlike waivers, states are not permitted to cap enrollment or maintain a waiting list for Section 1915 (i) state plan HCBS. However, states can manage enrollment under Section 1915 (i) by restricting functional eligibility criteria if the state will exceed the number of beneficiaries that it anticipated serving. Functional eligibility for Section 1915 (i) HCBS requires beneficiaries to have needs that are less than what the state requires to qualify for an institutional level of care.
All states operate a total of 277 waivers to expand financial eligibility and offer HCBS to meet the needs of seniors and people with disabilities in the community. Nearly all of these waivers (265) are authorized under Section 1915 (c) (Appendix Table 5), while a minority (12) use Section 1115 to authorize HCBS (Appendix Table 6).39 Nine states (CA, DE, HI, NJ, NM, NY, TN, TX, and WA) serve some HCBS populations under a Section 1115 waiver and other HCBS populations through Section 1915 (c) waivers. Three other states (AZ, RI, and VT) use a Section 1115 waiver to provide HCBS to all covered populations and do not offer any Section 1915 (c) waivers. Both of these waiver authorities allow states to expand Medicaid financial eligibility and offer HCBS to seniors and people with disabilities who would otherwise qualify for an institutional level of care, target benefit packages to a particular population, and limit the number of people served.
Most states using a Section 1115 HCBS waiver require individuals to enroll in capitated managed care. The exception is Washington, which provides Section 1115 HCBS on a fee-for-service basis.40 Unlike Section 1915 (c) waivers, Section 1115 waivers can be used to authorize both HCBS and mandatory managed care enrollment. Alternatively, states can combine a Section 1915 (c) waiver with another managed care authority to permit or require HCBS beneficiaries to enroll in capitated managed care.41
CMS appears to be moving toward requiring states to operate joint Section 1915 (c)/1115 waivers if states want to require HCBS beneficiaries to enroll in capitated managed care. From 2008 to 2014, nine states eliminated Section 1915 (c) waivers and instead used Section 1115 waivers to authorize HCBS along with mandatory managed care (Figure 4). More recently, Kansas42 and North Carolina43 have been granted Section 1115 waiver authority to require beneficiaries to enroll in capitated managed care but continue to operate concurrent Section 1915 (c) waivers that authorize HCBS, instead of moving the HCBS authority to Section 1115. In addition, Rhode Island’s latest Section 1115 waiver renewal requires the state to transition HCBS authorized under Section 1115 to a Section 1915 (c) waiver or Section 1915 (i) state plan authority to the extent possible.44 Rhode Island’s waiver renewal also provides that any new HCBS that the state wants to implement after January 1, 2019 must be authorized under Section 1915 (c) or Section 1915 (i).45
The number of Section 1915 (c) waivers averages five per state and ranges from one to 11, depending on the number of populations served and how the state groups those populations (Appendix Table 5). Three states (DE, HI, and NJ) operate one Section 1915 (c) waiver and use Section 1115 waivers for all other HCBS populations. At the other end of the range, Connecticut and Colorado each operate 11 Section 1915 (c) waivers, and two states (MA and PA) each offer 10 Section 1915 (c) waivers targeted to different populations. By contrast, all 12 states using stand-alone Section 1115 HCBS waivers serve multiple populations under a single waiver (Appendix Table 6).
Two states added new HCBS waivers to serve additional enrollees in FY 2018, while one state discontinued a waiver that is expected to result in fewer people receiving HCBS.46 California added a new Section 1915 (c) waiver to serve individuals with I/DD, while Washington added a Section 1115 waiver providing HCBS to multiple populations, including seniors and people with physical disabilities, mental health disabilities, and TBI. Colorado is the state that anticipates an overall decline in the number of HCBS enrollees as a result of eliminating its Section 1915 (c) waiver targeted to young children with autism (I/DD).
All states serve people with intellectual and developmental disabilities (I/DD),47 seniors, and nonelderly adults with physical disabilities48 through HCBS waivers (Figure 5, Appendix Tables 5 and 6). Fewer states use HCBS waivers to serve people with traumatic brain and/or spinal cord injuries (TBI/SCI),49 children who are medically fragile or technology dependent,50 people with mental health disabilities,51 and people with HIV/AIDS.52
Over three-quarters of HCBS waivers set the income eligibility limit at the federal maximum (Figure 6 and Appendix Table 7). States can use waivers to expand HCBS financial eligibility to a maximum monthly income of 300% of SSI ($2,313/month for an individual in 2019). A minority of HCBS waivers (15 in 4 states) set the monthly income limit at 100% of SSI ($771/month for an individual in 2019).
Nearly all HCBS waivers set income eligibility limits at or above the nursing home limit. Most HCBS waivers (248 in 43 states) waivers use the same income eligibility criteria as are required for nursing home eligibility (no data shown). Another 17 HCBS waivers in six states use income limits that are less stringent than those required for institutional care. A minority of waivers (12 in five states, MD, MI, MO, OR, TX) use income limits that are more restrictive than those required for institutional care, which could incentivize institutional care over HCBS. Using the same income limits for HCBS waivers and institutional care removes any potential bias in favor of institutional care, which can occur if an individualmust have less income and/or assets to receive HCBS than to receive institutional services.
Over three-quarters of HCBS waivers apply the federal SSI asset limit of $2,000 for an individual, while a notable minority do not have any asset limit (Figure 6). The 24 waivers without an asset limit are in seven states (CO, IN, MA, MO, NE, ND, and WI). Colorado does not apply an asset limit to any of its 11 HCBS waivers, while the other six states remove asset limits for only some waiver populations, most frequently medically fragile children and children with I/DD.53 In addition, 23 waivers in eight states (DC, MD, MN, MS, ND, NE, NH, RI) have an asset limit that is higher than the SSI amount, ranging from $2,500 to $4,000.54 Five states apply this higher asset limit to all waiver populations (DC, MN, MS, NH, and RI), while three states apply the higher asset limit to some but not all waiver populations.55 Connecticut is the only state that applies an asset limit lower than the federal SSI amount ($1,600 per individual).56
Once eligible for an HCBS waiver, over half (27) of states require an individual to contribute a portion of their monthly income to the cost of their care (no data shown). Certain beneficiaries receiving home and community-based waiver services57 must contribute a portion of their income to their cost of care, although states generally allow them to retain a monthly maintenance needs allowance, recognizing that recognizing that they must pay for room and board as well as other basic needs that Medicaid does not cover, such as clothing. There is no federal minimum maintenance needs allowance for HCBS waiver enrollees; instead, states may use any amount as long as it is based on a “reasonable assessment of need” and subject to a maximum that applies to all enrollees under the waiver.58 Eight states set the monthly maintenance needs allowance at $2,250 (300% of SSI) for at least one waiver,59 while four states use $1,012 (100% FPL).60 The remaining states report another amount, ranging from $100 in Montana to $2,082 in Maine.61 Amounts vary within some states by waiver program and/or living arrangement. For example, only individuals in assisted living facilities are required to contribute to their cost of care in Delaware and Maryland. The maintenance needs allowance established by states play a critical role in determining whether individuals can afford to remain in the community, as Medicaid HCBS does not cover room and board, and avoid or forestall institutional placement.
Nearly all (273 of 277) HCBS waivers use functional eligibility criteria that are the same as or less stringent than the criteria to qualify for nursing home services (no data shown). Most (253 in 51 states) HCBS waivers use the same functional eligibility criteria as are required for nursing facility eligibility, treating HCBS and institutional care equally. A minority of waivers (20 in 11 states) use functional eligibility criteria that are less stringent than those required for institutional care. Very few waivers (four in three states, CA, OK, and OR) use functional eligibility criteria that are more restrictive than those required for institutional care. Each of these four waivers serves medically fragile children and sets financial eligibility the same as for institutions, even though functional eligibility is more restrictive. Functional eligibility criteria typically include the extent of assistance needed to perform self-care (such as eating, bathing, or dressing) and/or household activities (such as preparing meals or managing medications). Using the same functional eligibility for HCBS waivers and institutional care removes any potential bias in favor of institutional care, which can occur if an individual must have greater functional needs to receive HCBS than to receive institutional services.
The majority of states (40 of 49 responding) rely on state or local government agencies to perform the functional needs assessment for waiver services, and most (32 of 49 responding) states rely on a combination of entities across waiver programs (no data shown).62 Thirteen states rely solely on state or local government agencies to perform assessments. Other entities include community-based organizations (11 states), health care providers (8 states), and managed care plans (4 states).
Nearly all (46 of 48 responding) states rely on state-specific tools to conduct the functional needs assessment for HCBS waivers (no data shown).63 Thirty-five states use multiple tools across different waiver programs to assess functional need. Some states rely on nationally recognized assessment tools, including Inter-RAI (16 states), OASIS (AL), and CHOICES (AR). Nearly all (47 of 48 responding) states have an exceptions process in place for beneficiaries to appeal functional assessment results.64
Home-based services and equipment/technology/modifications are among the most commonly offered waiver services across all states and target populations.65 Other frequently offered services across all states and waivers include day services, nursing/therapy, and case management. Box 1 above lists the nine service categories included in our survey.
Some services are more common in waivers that target certain populations. For example, supported employment services are offered in nearly three-quarters of all I/DD waivers and over half of TBI/SCI waivers, compared to about one-quarter of waivers targeting seniors and adults with physical disabilities. Case management services are included in three-quarters of waivers serving medically fragile or technology dependent children but less than half of mental health waivers. Mental health/behavioral services are offered in two-thirds of waivers targeting individuals with mental illness, compared to less than half of TBI/SCI waivers and just over a quarter of waivers targeting seniors and adults with physical disabilities. The variation in waiver benefit packages reflects state flexibility in designing benefit packages targeted to particular populations’ needs. Table 1 presents the share of waivers that cover each service category by target population.
| Table 1: Share of HCBS Waivers that Provide Key Services, By Target Population, FY 2018 | ||||||||
| Target Population | Case Mgmt. | Home-based Services | Day Services | Nursing/Therapy Services | Round-the-Clock Services | Supported Employment | Other Mental Health/Behavioral Services | Equipment/Technology/Modifications |
| I/DD | 54% | 88% | 75% | 68% | 51% | 74% | 69% | 86% |
| Seniors & People with Disabilities | 62% | 85% | 61% | 70% | 40% | 24% | 27% | 78% |
| Medically Fragile/Tech. Dependent Children | 75% | 67% | 17% | 46% | 17% | 21% | 17% | 63% |
| Mental Illness | 42% | 75% | 17% | 33% | 25% | 42% | 67% | 50% |
| HIV/AIDS | 60% | 100% | 40% | 100% | 20% | 0% | 40% | 80% |
| TBI/SCI | 58% | 81% | 65% | 58% | 54% | 62% | 38% | 85% |
| NOTES: Includes both § 1915 (c) and 1115 waivers. Section 1115 waiver services were assigned to the main population targeted by the waiver: seniors/adults with physical disabilities and/or people with I/DD.SOURCE: KFF Medicaid HCBS Waiver Survey, FY 2018. | ||||||||
Waivers targeting seniors and/or adults with physical disabilities and people with TBI/SCI are most likely to offer enrollees the option to self-direct services, while mental health waivers are least likely to do so (Figure 7). Nearly all states allow beneficiaries in at least one HCBS waiver to self-direct services (Appendix Table 8).66 The exception is Alaska. In all 50 self-direction states, beneficiaries can select, train, and dismiss their direct care workers and set worker schedules.67 In 39 states, beneficiaries also can determine worker pay rates, and in 33 states, beneficiaries can decide how to allocate their service budgets.
Almost all states enable waiver enrollees to choose either agency-employed or independent providers, and over half of states allow legally responsible relatives to be paid providers (Appendix Table 8). All states offer agency-employed providers, and all but two states (DC and RI) offer independent providers. Thirty states allow certain legally responsible relatives (e.g. spouse, parent) to be paid providers.68
More than three-quarters of states (41 of 51) report an HCBS waiver waiting list for at least one waiver target population (Appendix Table 9). In addition to expanding financial eligibility and offering benefits targeted to a particular population, HCBS waivers allow states to choose – and limit – how many people are served. States’ ability to cap HCBS waiver enrollment can result in waiting lists when the number of people seeking services exceeds the number of waiver slots available. The 10 states without any waiver waiting lists are AZ, DC, DE, HI, ID, MA, NJ, RI, VT, and WA.
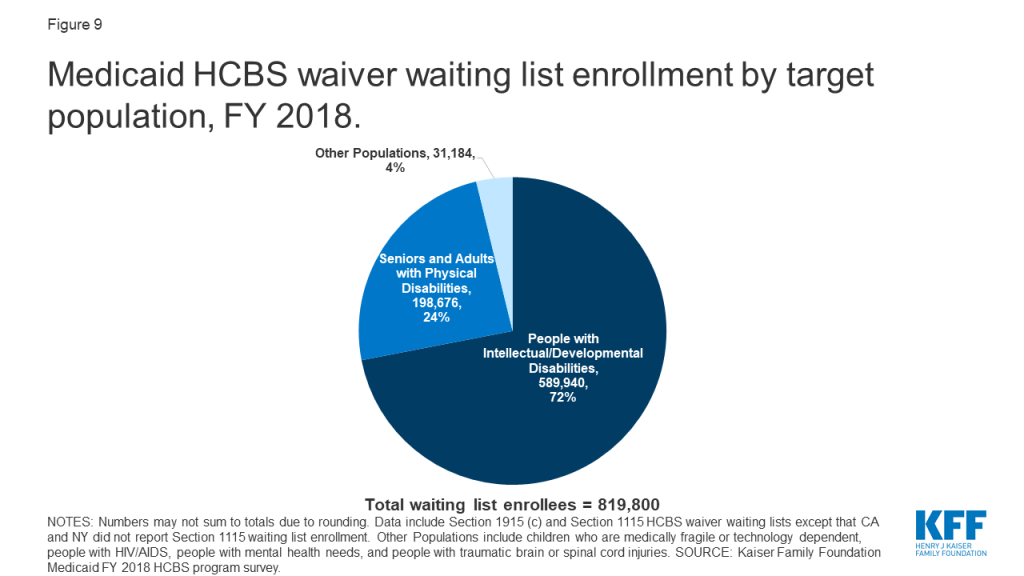
Nearly 820,000 people are on HCBS waiver waiting lists nationally (Figure 8 and Appendix Table 9).69 Waiting lists are a function of the populations a state chooses to serve and how the state defines those populations; both of these factors vary among states, making waiting lists an incomplete measure of state capacity and demand for HCBS and not directly comparable among states. While all states have waivers serving people with I/DD, seniors, and adults with physical disabilities, fewer states offer waiver services for other target populations. Consequently, there may be a particular population in need of services, but the state does not keep a waiting list because it does not offer a waiver for that population. In addition, as described above, all states do not define the eligibility criteria for their waiver target populations in the same way.
All individuals on waiting lists ultimately may not be eligible for waiver services. For example, 33 states with waiting lists screen individuals for waiver eligibility before they are placed or while they are on a waiting list, while eight states do not. Notably, the eight states that do not screen for waiver eligibility comprise 61% (499,000) of the total waiting list population.70 Box 2 provides examples of recent changes in state waiver waiting list assessment policies.
Box 2: State Waiver Waiting List Policy Changes
Two states reported new waiver waiting list policies in FY 2018. Ohio adopted a new assessment tool in an effort to better understand the current needs of individuals on its I/DD waiver waiting lists.71 Ohio’s new assessment is in response to a study finding that 45% of its I/DD waiting list population had no current areas of unmet need; rather, individuals were joining the waiting list “well in advance of their need” for waiver services because they anticipated a lengthy wait.72 Another new Ohio policy requires county boards of developmental disabilities to address a person’s immediate needs within 30 days, through community resources, local funds, state plan services, or waiver services. Louisiana also adopted a new assessment tool to determine if individuals on its I/DD waiver waiting list require services now or in the near future to avoid institutionalization.73 Those with the highest scores on the new assessment are offered a waiver slot, and others will be rescreened at regular intervals or upon request.
Waiver waiting lists increased by 16 percent from FY 2017 to FY 2018, attributed primarily to the increase in Texas (Figure 8 and Appendix Table 10).74 This is higher than the average annual percent change in waiting list enrollment over the last 16 years, which was 10 percent. It also represents the highest annual percent increase since FY 2011, when waiting lists grew by 19 percent. Texas’ waiting list growth accounts for over 90% of the overall national increase in waiver waiting lists. In FY 2017, Texas’ waiver waiting list was 40% of the national waiting list total. In FY 2018, Texas’ share increased to nearly half (47%) of the national total. Texas does not determine eligibility before putting an individual on a waiting list, which is a possible contributing factor to the state’s increase.
Overall, 18 states reported an increase in total waiting lists from FY 2017 to FY 2018, and 15 states reported a decrease from FY 2017 to FY 2018, indicating state-level variation in waiting list trends (Appendix Table 10). Three states reported no notable change in waiver waiting lists from FY 2017 to FY 2018.75 Waiting list changes also varied by population, with growth occurring among waivers targeting individuals with I/DD (25%), seniors (19%), and individuals with mental health disabilities (10%). In contrast, waivers serving individuals with TBI/SCI, medically fragile children, and seniors and adults with physical disabilities experienced declines (-51%, -6% and -1% respectively) in the number of individuals on waiting lists for services between FY 2017 and FY 2018.
Although some people joined waiver waiting lists between FY 2017 and FY 2018, others left a waiting list and began receiving waiver services during this period. For example, 53,000 people moved off waiting lists and began receiving services in FY 2018, in the 33 (of 41) states that could report this data.76 People may move off a waiting list and begin receiving services when a state increases waiver capacity by funding new slots or when an existing waiver enrollee stops receiving services due to a change in income, functional need, age, state residency, or another reason relevant to waiver eligibility.
People with I/DD comprise over 70 percent (about 590,000 in 37 states)77 of total waiver waiting lists (Figure 9 and Appendix Table 9). Seniors and adults with physical disabilities account for about one-quarter (about 199,000 in 20 states)78 of total waiting lists. The remaining four percent of waiver waiting lists is spread among other populations, including children who are medically fragile or technology dependent (about 27,000 in five states),79 people with traumatic brain or spinal cord injuries (TBI/SCI, about 1,700 in seven states),80 people with mental illness (about 1,500 in four states),81 and people with HIV/AIDS (about 80 in 1 state).82
The waiting period for waiver services averages 39 months across all waivers with waiting lists, with substantial variation by target population (Appendix Table 11).83 The average waiting period by population ranged from one month for a waiver targeting people with HIV/AIDS (in 1 state) to 71 months for waivers targeting people with I/DD.
Almost all (38 of 41) states with waiting lists prioritize individuals with certain characteristics to receive services when slots become available.84 For example, 27 states offer waivers that give priority to individuals who meet specific crisis or emergency criteria, 24 states prioritize people who are moving from an institution to the community, and 22 states prioritize people who are at risk of entering an institution without waiver services (no data shown). Fewer states prioritize individuals based on assessed level of need (16) or age (5). Other reasons states use to prioritize individuals on waiting lists include aging caregiver, loss of primary caregiver, child in foster care, homelessness, or danger to self or others. Thirty-two states use more than one priority group.85
All states with waiting lists provide non-waiver Medicaid services (i.e., state plan services) to people who are waiting for waiver services. Medicaid state plan services can include some HCBS, such as home health, personal care, or case management. Some states also may provide services funded with state dollars that are allocated to county-based programs to individuals on a Medicaid waiver waiting list. Nearly all (94%) of people on waiver waiting lists currently live in the community in 27 (of 41) states reporting this data.86
Nearly three-quarters of states use hour, cost, or geographic limits to control utilization in their HCBS waivers (Appendix Table 12).87 Among these states, 19 use more than one type of utilization control, including 16 states with caps on both the number of service hours and the amount spent per enrollee, one state (CO) with both spending and geographic limits, and two states (CA and OH) with all three of these utilization controls. Another 15 states use only spending caps, such as such as limiting the cost of HCBS to a percentage of the nursing facility reimbursement rate or applying a maximum service cost based on a functional needs assessment score. Two states (AR and DC) use only hourly service caps, such as day, week, or annual limits. Services to which states apply hourly service caps include supported living, day habilitation, case management, respite, home modifications/environmental accessibility, skilled nursing, peer support, medical supplies, supported employment, and transition assistance. Most states (15 of 20 with hour caps88 and 25 of 34 with cost caps)89 allow exceptions to their utilization limits. The remaining 14 states do not apply any of these HCBS waiver service utilization controls.
States with utilization controls typically apply them to both self-directed and non-self-directed (e.g., agency-provided) services. Among the 20 states with both hourly caps and self-direction, most (14) apply these caps to both self-directed services and other services. Four states (LA, MO, MT, and NY) apply hourly limits only to non-self-directed services, and two states (ND and PA) apply hourly limits only to self-directed services. Similarly, most states (25 of 34) apply cost caps (typically per year) to both self-directed and other services, while nine states apply cost caps to only non self-directed services. No state applies a cost cap only to self-directed services.
Application of state utilization controls varies by waiver target population, with at least half of all waivers that serve people with TBI/SCI (58%), HIV/AIDS (60%), and mental illness (50%) applying at least one utilization control. Other waiver populations see smaller rates of utilization control application, with one-third of waivers that serve medically fragile children applying at least one utilization control. All target populations have some waivers that apply spending caps or service hour limits, except that waivers serving people with HIV/AIDS apply spending caps but not service hour limits. Spending caps are a more common utilization control than service hour limits across all target populations, with about twice as many waivers applying spending caps as service hour limits.
All states monitor HCBS waiver quality, but no set of standardized measures is used across programs. Most HCBS waiver quality measures are based on CMS reporting requirements for Section 1915 (c) waivers, and these measures tend to be process, not outcome, oriented. For example, states must identify Section 1915 (c) waiver performance measures to evaluate level of care determinations, provider qualifications, service plans, enrollee health and welfare, and financial compliance.90 In recent years, states have begun to expand HCBS quality measures to add beneficiary experience measures, such as quality of life, community integration, and LTSS rebalancing, described below.
Forty-six states measure beneficiary quality of life when monitoring HCBS waiver quality (Appendix Table 12). Quality of life measures include assessing an individual’s level of satisfaction with their current living situation, degree of control over their daily activities, and whether services are adequate to their support needs. Among these specific quality of life measures, level of satisfaction with current living situation (22 states) was the most commonly reported measure. States measuring quality of life most commonly rely on the National Core Indicators (NCI) surveys for seniors and adults with physical disabilities91 and/or for individuals with I/DD92 (30 states). Ten states use other state-specific tools, and four states (CT, OH, PA, and WV) use the Consumer Assessment of Healthcare Providers and Systems (CAHPS) HCBS survey.93 States can use more than one tool to measure quality of life.94
Forty-four states have waiver quality measures to assess community integration (Appendix Table 12). Community integration measures include the ability to choose where one lives or the amount of community involvement in work and/or leisure activities. Among these specific community integration measures, the ability to choose where an enrollee lives (19 states) was the most commonly reported measure. States measuring community integration most commonly use the NCI surveys (21 states), followed by state-specific tools (13 states), and the CAHPS survey (3 states, CT, PA, WV).95
Twenty-five states measure LTSS rebalancing when assessing HCBS waiver quality (Appendix Table 12). To do so, states may collect information on the number of enrollees in institutions versus the community, the number of individuals transitioning from institutions to the community, and/or the number of individuals transitioning from the community to institutions. Among these specific rebalancing measures, the number of individuals transitioning from institutions to the community (9 states) was the most commonly reported measure. No state reported measuring the number of individuals transitioning from the community to institutions. States measuring rebalancing utilize various tools including Money Follows the Person program benchmarks (12 states), state-specific tools (6 states), and the NCI-IDD survey (one state).96
Forty-one states have an HCBS waiver ombudsman program, typically as part of state government, to assist waiver enrollees (Appendix Table 12).97 Thirty-two states have an ombuds program that is solely within state government, while four (HI, IN, TN, and WI) have ombuds programs that include both state government and non-governmental entities. For example, in Wisconsin, ombuds services for seniors are provided through a governmental entity (the Board on Aging and Long-Term Care), while ombuds services for non-elderly adults with disabilities are provided through a contract with a community-based organization (the state’s protection and advocacy agency for people with disabilities). Tennessee uses governmental agencies (Area Agencies on Aging and Disability) to provide ombuds services for individuals receiving community-based residential alternatives and also contracts with a community-based organization (the state’s protection and advocacy agency) to provide broader ombuds services. Two states (AZ and RI) have ombudsman programs solely operated by a community-based agency, and three states (LA, NY, and VT) rely solely on another type of entity. Ombudsman programs may provide enrollment options counseling, assist beneficiaries with health plan appeals, offer information about state fair hearings, track beneficiary complaints, train health plans and providers about community-based services and supports that can be linked with Medicaid-covered services, and report data and systemic issues to states.98
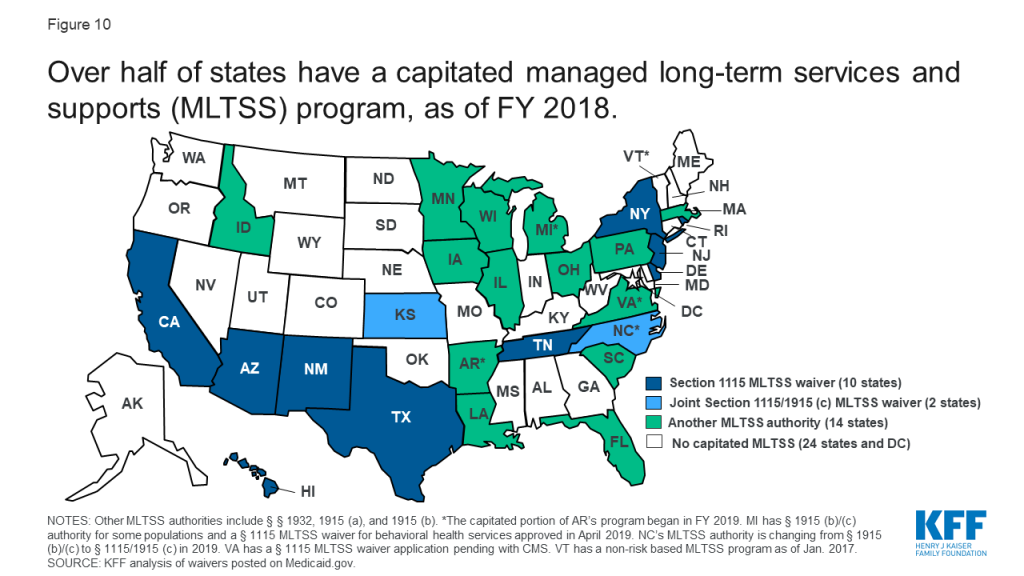
Twenty-five states deliver some or all HCBS through capitated (risk-based) managed long-term services and supports (MLTSS) programs (Figure 10 and Appendix Table 13).99 In addition, survey findings in this section include responses from Arkansas, which implemented the capitated portion of its MLTSS program for people with I/DD and behavioral health needs in FY 2019,100 for a total of 26 states reporting MLTSS policies. About half of MLTSS states implement capitated managed care through a Section 1115 waiver, while the remaining states use another managed care authority, such as a Section 1915 (b) waiver, the Section 1932 state plan option, or Section 1915 (a) authority. Two states implemented new MLTSS programs in FY 2018: Louisiana has a joint Section 1915 (b)/(c) waiver providing specialty behavioral health services and HCBS for children with serious emotional disturbance effective February 2018,101 and Pennsylvania has a joint Section 1915 (b)/(c) waiver that includes individuals with I/DD, seniors, adults with physical disabilities, and individuals with TBI, with enrollment effective January 2018.102 In addition, one state, North Carolina, is in the process of changing its MLTSS authority from joint Section 1915 (b)/(c) waivers to joint Section 1115/1915 (c) waivers for people with I/DD and TBI.103
About half of capitated MLTSS states use financial incentives for health plans to offer HCBS instead of institutional care (Appendix Table 13). The most common type of rebalancing incentive is a blended capitation rate that includes both institutional and home and community-based LTSS, used in 11 states. Two states (FL and SC) offer bonus payments to health plans based on institutional to community transitions.104 Six MLTSS states do not include financial incentives for HCBS over institutional services.105
Seven capitated MLTSS states currently are using value-based payment (VBP) models for HCBS,106 and 10 states plan to implement new or expanded VBP models for HCBS in the future107 (Appendix Table 13). Among the states with current models, four require health plans to use VBP arrangements (AZ, AR, TN, and WI), and two encourage health plans to use VBP arrangements (NY and VA). For example, Arizona requires its health plans to have a certain proportion of provider payments made through VBP; the target percentage varies by provider type and population, ranging from 35 percent for seniors and adults with physical disabilities to five percent for adults with I/DD. The remaining state, Iowa, encourages VBP arrangements for all waiver populations, except for individuals with HIV/AIDS and seniors where VBP is required. VBP models generally include any initiative in which a state Medicaid program seeks to hold providers and/or health plans accountable for the cost and quality of care that they provide or finance.108 These models seek to shift the focus away from payment based solely on the provision of individual services, as in the fee-for-service model, which is critiqued as incentivizing service volume. Instead, VBP seeks to account for the value and quality of services delivered through shared savings/shared risk arrangements, episode-based payments, or other alternative payment models.109
The most commonly used VBP model for HCBS is pay for performance, used by four of seven states (AZ, AR, IA & WI).110 A pay for performance model seeks to improve care coordination and care quality and reduce overall spending by tying payment to care that meets specific goals or quality standards. For example, Wisconsin’s Family Care pay for performance model bases payments on results from an enrollee survey and competitive integrated employment. In Arkansas, the Provider-led Arkansas Shared Savings Entity (PASSE) program, serving individuals with I/DD or mental illness, will use both shared savings and incentive payments that are tied to reporting/achieving certain outcome or quality measures.111 Tennessee uses an outcome-based reimbursement model for supported employment services provided to people with I/DD. Tennessee’s program includes outcome-based reimbursement for up-front services leading to employment; tiered outcome-based reimbursement for job development and self-employment start-up services based on the individual’s acuity level and paid in phases to support job tenure; and tiered reimbursement for job coaching, based on acuity and taking into account the length of time the person has held the job and the amount of paid support required as a percentage of hours worked, with the goal of paid supports fading over time. Virginia encourages its health plans to establish VBP arrangements with all provider types, including HCBS, but does not require a specific model.
Most capitated MLTSS states have adopted policies to comply with the 2016 Medicaid managed care regulations (Figure 11 and Appendix Table 13). The 2016 regulations, issued under the Obama Administration, addressed MLTSS for the first time and included new provisions for LTSS provider network adequacy standards, independent enrollment choice counseling, disenrollment for cause if an LTSS provider leaves the health plan network, stakeholder advisory committees, and LTSS quality measures; different provisions of the regulations had different effective dates.112 However, in November 2018, under the Trump Administration, CMS proposed some changes to the 2016 regulations, most notably to the network adequacy standards.113 The public comment period closed in January 2019, and the proposed changes have not yet been finalized. CMS also issued a June 2017 informational bulletin indicating that it “intends to use [its] enforcement discretion. . . when states are unable to implement new and potentially burdensome requirements of the final [managed care] rule by the required compliance date, particularly provisions with a compliance deadline of contracts beginning on or after July 1, 2017,” while changes to the managed care regulations are pending.114
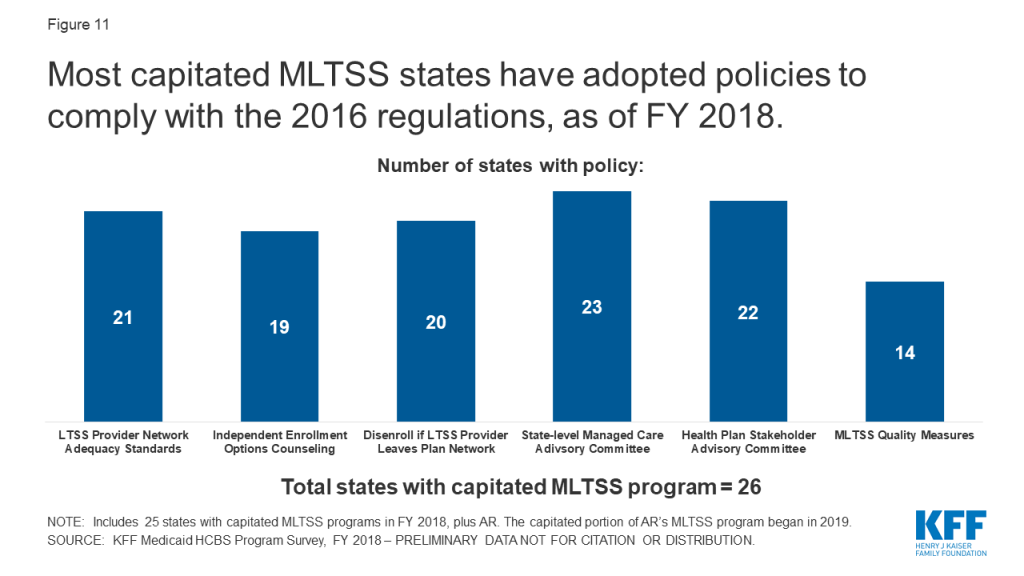
Over three-quarters of capitated MLTSS states require network adequacy standards for HCBS providers (Figure 11 and Table 2).115 The 2016 managed care regulations require states to develop time and distance standards for MLTSS providers when the enrollee must travel to the provider, and network adequacy standards other than time and distance standards for MLTSS providers that travel to the enrollee to deliver services. These standards are required for health plan contracts beginning on or after July 1, 2018. However, CMS’s November 2018 proposed rule would remove the requirement for time and distance standards and instead would allow states to choose another quantitative standard, such as minimum provider-to-enrollee ratios, maximum travel time or distance to providers, minimum percentage of contracting providers accepting new patients, maximum wait times for an appointment, orhours of operation requirements.116
The most commonly used HCBS network adequacy standard is based on time and distance, when the enrollee must travel to the provider, used by 14 states (Table 2). Over half of capitated MLTSS states with HCBS network adequacy standards (12 of 21) include more than one type of standard.117 For example, Tennessee includes time and distance to provider (for site-based services, such as adult day services), minimum provider to enrollee ratio, and maximum travel time or distance (including a choice of providers for every service in every county), while Texas includes time and distance to provider, hours of operation requirements, and maximum wait time for an appointment. No state reported requiring a minimum percentage of contracting providers who are accepting new patients.
| Table 2: State MLTSS Network Adequacy Standards for HCBS Providers, FY 2018 | |
| Standard | Number of States Adopting, out of 26 Capitated MLTSS States: |
| Time and Distance to Provider | 14 states (AZ, DE, FL, ID, KS, LA, MI, NM, PA, SC, TN, TX, VA, WI) |
| Minimum Provider to Enrollee Ratio | 8 states (AR, FL, HI, ID, OH, SC, TN, WI) |
| Maximum Travel Time or Distance to Provider | 6 states (ID, LA, NY, SC, TN, VA) |
| Hours of Operation Requirements | 5 states (AZ, FL, LA, NY, TX) |
| Maximum Wait Time for an Appointment | 4 states (DE, LA, NY, TX) |
| Another Standard | 9 states (AZ, DE, IA, MI, MN, NJ, SC, TN, TX) |
| No Network Adequacy Standard Reported | 5 states (CA, IL, MA, NC, RI) |
| SOURCE: KFF Medicaid HCBS Program Survey, FY 2018. | |
Most MLTSS states offer independent enrollment options counseling (Figure 11 and Appendix Table 13). States most often contract with a third party enrollment broker for options counseling (8 states), while others rely on community-based organizations (5 states) or another entity (4 states).118 In addition, Arizona provides options counseling through the state Medicaid agency instead of a third-party entity.119 CMS’s 2016 Medicaid managed care regulations require all states to offer enrollee choice counseling through the independent beneficiary support system required in health plan contracts beginning on or after July 1, 2018.120 Options counseling seeks to help MLTSS enrollees select a health plan; this population may not be familiar with that process because they traditionally have been enrolled in the fee-for-service delivery system. MLTSS enrollees also may seek assistance with choosing a health plan to find a provider network that best meets their various needs – which may go beyond primary care to include specialists, behavioral health providers, durable medical equipment suppliers, and personal care attendants – and preserves their existing provider relationships to the extent possible.
Most MLTSS states allow individuals to disenroll from their health plan if their residence or employment would be disrupted as a result of an LTSS provider leaving the health plan network (Figure 11 and Appendix Table 13).121 Under the 2016 Medicaid managed care regulations, states must consider these circumstances as good cause for disenrollment for health plan contracts beginning or after July 1, 2017.122 Another state, Arizona, does not allow individuals to disenroll from a health plan for employment disruptions; however, if a skilled nursing facility or assisted living facility leaves the health plan provider network, Arizona requires the health plan to continue pay for those services until the individual’s next open enrollment period in order to mitigate disruption in residential placement.
Nearly all MLTSS states have a state-level managed care advisory committee and require health plans to have a stakeholder advisory committee (Figure 11 and Appendix Table 13).123 The 2016 Medicaid managed care regulations require states to create and maintain a stakeholder group to solicit and address the opinions of beneficiaries, individuals representing beneficiaries, providers, and other stakeholders in the design, implementation, and oversight of a state’s MLTSS program. In addition, health plans providing MLTSS must have a member advisory committee that includes at least a reasonably representative sample of the populations receiving LTSS covered by the plan or other individuals representing those enrollees. These provisions are effective for health plan contracts beginning on or after July 1, 2017.124
Over half of MLTSS states have adopted at least one MLTSS quality measure (Figure 11 and Table 3).125 The 2016 Medicaid managed care rule requires states that provide MLTSS to identify standard performance measures related to quality of life, rebalancing, and community integration for health plan contracts beginning on or after July 1, 2017.126 To assist states in this area, CMS developed eight MLTSS quality measures, with the goal of creating nationally standardized measures to enable comparisons of state MLTSS programs performance.127 Most of these states (10 of 14) are using at least one of CMS’s recommended measures, while the remaining states are using other state-specific measures (MI, NJ, VA, and WI). Among these 10 states using CMS recommended measures, nearly all have adopted three or more of the eight measures. The exception is New Mexico, which has adopted one of the recommended measures.
| Table 3: State Use of MLTSS Quality Measures, FY 2018 | |
| Measure Type | Number of States Adopting Measure, out of 26 Capitated MLTSS States: |
| CMS Recommended Measures | |
| Comprehensive Assessment | 9 states (AZ, DE, FL, IA, MN, PA, RI, SC, TN) |
| Comprehensive Care Plan and Update | 9 states (AZ, DE, FL, IA, MN, PA, RI, SC, TN) |
| Screening, Risk Assessment and Plan of Care to Prevent Future Falls | 5 states (DE, IA, MN, PA, SC) |
| Successful Transition After Long-Term Institutional Stay | 5 states (DE, IA, NM, PA, SC) |
| Re-Assessment/Care Plan Update After Inpatient Discharge | 4 states (FL, IA, PA, TN) |
| Shared Care Plan with Primary Care Practitioner | 4 states (AZ, FL, IA, TN) |
| Admission to Institution from the Community | 3 states (DE, IA, PA) |
| Minimizing Institutional Length of Stay | 2 states (IA, SC) |
| Another Measure | 4 states (MI, NJ, VA, WI) |
| No Measure | 12 states (AR, CA, HI, ID, IL, KS, LA, MA, NY, NC, OH, TX) |
| SOURCE: KFF Medicaid HCBS Program Survey, FY 2018. | |
States are working to meet electronic verification visit (EVV) requirements for all Medicaid personal care services and home health services that require an in-home visit by a provider.128 This new policy requires electronic verification of the type of service performed; the individual receiving the service; the service date; the location of service delivery; the individual providing the service; and the time the service begins and ends.129 EVV seeks to reduce unauthorized services, fraud, waste, and abuse and improve service quality.130 The EVV requirement is part of the 21st Century Cures Act and applies to all personal care and home health services provided under state plan or waiver authority.131 States are required to implement EVV for personal care services by January 1, 2020, and home health services by January 1, 2023.132
Four states already have EVV systems in place for all personal care state plan and waiver services, and another 12 states have implemented EVV for some but not all personal care services (Figure 12 and Appendix Table 14). In general, states report wide variation in EVV implementation across their personal care state plan and waiver programs, with few states having EVV systems in place for personal care services provided under all authorities. The states that have implemented EVV for all personal care services to date are Alabama, Louisiana, New Mexico, and Rhode Island. Eighteen percent (6 of 34 states)133 of state plan personal care programs and 19 percent of all waivers offering personal care services (41 of 216 waivers in 15 states) had an EVV system in place for personal care services inFY 2018.
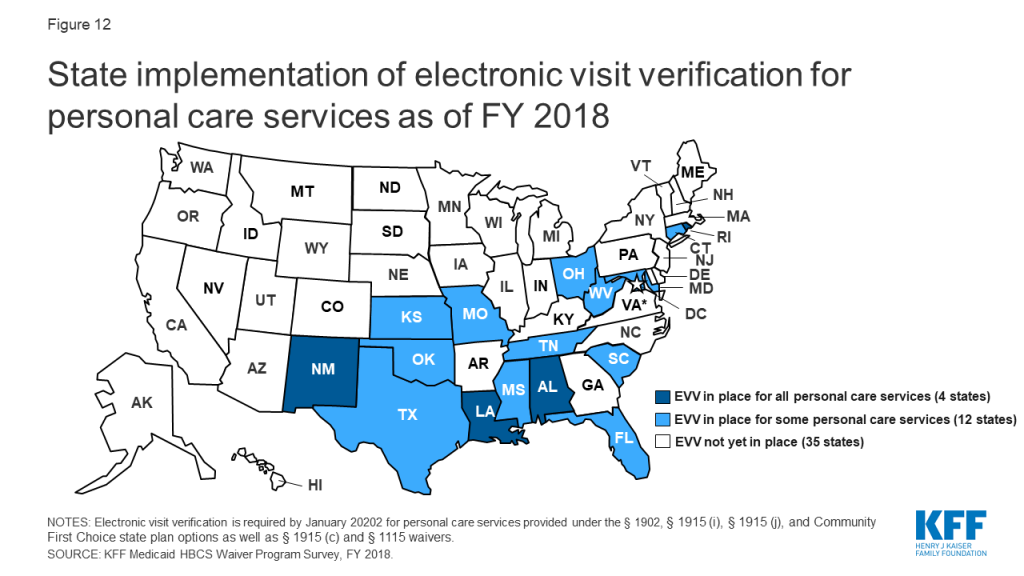
About half of states expect to have EVV in place for some or all personal care services by the January 2020 deadline (Appendix Table 14). Seven of these states (AR, ME, NV, SD, VT, WA, and WV) expect to have EVV in place for all personal care state plan and waiver authorities, and the remainder expect to have EVV in place for some but not all personal care authorities. States that fail to implement EVV for personal care services by January 2020 are subject to incremental reductions in federal Medicaid matching funds, up to one percent.134 However, CMS can grant an exemption from federal funding reductions to states that make a good faith effort to comply but encounter unavoidable delays, though the exemption authority only applies to 2020.135 Most states already have requested or plan to request such an exemption. CMS began accepting exemption requests in July 2019, and as of February 2020, 40 states had been approved.136
Few states already have EVV systems in place for home health state plan services, although most expect to do so by the January 2023 deadline (Appendix Table 14). Among the states that have not yet implemented EVV for home health services, a dozen expect to do so prior to the 2023 deadline. As for personal care services, states that do not implement EVV for home health services by January 2023 are subject to incremental reductions in federal matching funds, although CMS can grant a one year exemption from these reductions to states that have made a good faith effort to comply but have encountered unavoidable delays.137
Nearly all states have selected an EVV model for personal care services (46 of 51)138 and home health services (41 of 51),139 with an open vendor model as the most common choice (Appendix Table 14). States have flexibility to choose their EVV model.140 Eighteen states are using an open vendor model for personal care services, and 16 are doing so for home health services. In an open vendor model, the state contracts with a single vendor or builds its own EVV system but also allows providers and health plans to use other vendors. Seven states are using a state mandated external vendor model for personal care services and six are doing so for home health services. In this model, the state contacts with a single EVV vendor that all providers must use. Six states are using a provider choice model for personal care services, and seven are doing so for home health services. In a provider choice model, providers select an EVV vendor and fund system implementation. One state (LA) is using a state-mandated in-house system for home health EVV, which involves the state creating and managing its own EVV system. The remaining states report using “another” model, which could include a hybrid approach. For example, Tennessee is allowing health plans to select an EVV vendor and fund its implementation. Most states have selected the same EVV model for personal care and home health services, although seven states have selected different models.141
Over half of states (32 of 51) states report challenges with meeting the EVV requirements for personal care and/or home health services. Common challenges include issues related to provider outreach and education (22 states), establishing an EVV system in rural areas (21 states), accommodating enrollees who self-direct services (21 states), and enrollee outreach and education (18 states). About half (24) of states cite multiple challenges with EVV implementation. Provider outreach and education can be challenging given the diversity and often high turnover rate of HCBS providers. Challenges in rural areas include establishing systems that can accommodate enrollees and providers who may lack cellphone or internet access. EVV for enrollees who self-direct services can be challenging to align with the system used by fiscal agents.
Nearly all states (47 of 51) already have changed or anticipated having to change a rule or policy to come into compliance with the home and community-based settings rule (Figure 13 and Appendix Table 15).142 This includes 38 states that made changes prior to FY 2018, and 33 states that were making new or additional changes in FY 2018. The January 2014 rule defines the qualities of residential and non-residential settings in which Medicaid-funded HCBS can be provided.143 To be considered community-based, a setting must support an individual’s full access to the greater community; be selected by the individual from options including non-disability specific settings; ensure individual privacy, dignity, respect and freedom from coercion or restraint; optimize individual autonomy in making life choices; and facilitate individual choice regarding services and providers. Additional criteria apply to provider-owned or controlled settings. CMS extended the original state compliance deadline by three years, to March 2022, and states’ transition plans were due in March 2019.144 As of February 2020, 15 states have received final CMS approval on their transition plan,145 and another 30 states have received initial approval.146
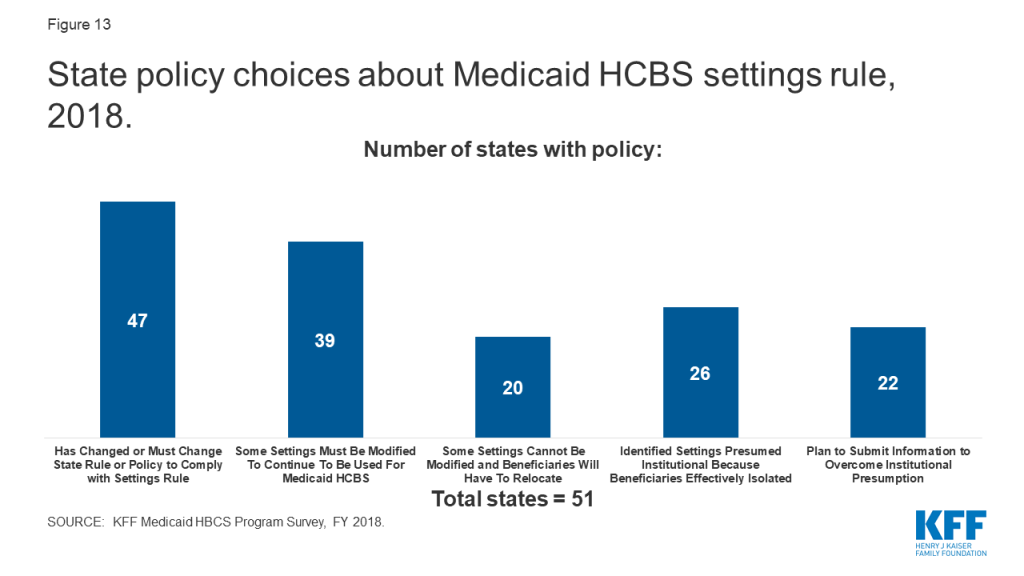
Among the policy changes states are making to comply with the settings rule, most are related to settings that do not meet the rule’s requirements and need to be modified in some way to continue to be used for Medicaid-funded HCBS. To date, 39 states have identified settings that need to be modified (Figure 13).147 The number of settings that must be modified varies substantially by state, ranging from the single digits in Alabama, Arkansas, and Wyoming, to several hundred in other states, to one thousand or more in Hawaii, Indiana, Michigan, New Hampshire, Oregon, and South Carolina (Appendix Table 15).148
Additionally, 20 states have identified settings that cannot be modified to meet the settings rule and consequently will require beneficiaries to be relocated to continue receiving Medicaid-funded HCBS (Figure 13).149 Relatively few settings per state fall into this category, ranging from one in Delaware and Florida to 20 in North Carolina (Appendix Table 14),150 although any relocation has the potential to be disruptive to the affected beneficiaries.
Over half of states have identified settings that are presumed institutional because they effectively isolate beneficiaries as a result of the settings rule (Figure 13).151 Most states have relatively few settings in this category, with the exception of Michigan, which has identified over 1,000 settings that may isolate individuals with I/DD (Appendix Table 15).152 The settings rule presumes that certain settings are not community-based because they have institutional qualities, such as those in a facility that provides inpatient treatment, those on the grounds of or adjacent to a public institution, and those that have the effect of isolating individuals from the broader community.
Less than half of states plan to submit or already have submitted information to the HHS Secretary to overcome the rule’s presumption that a specific setting is institutional so that Medicaid-funded HCBS can continue to be provided there (Figure 13).153 The number of settings for which each state plans to seek to overcome the institutional presumption ranges from the single digits in Delaware, Nevada, North Dakota, Washington, and Wyoming, to over 200 in Minnesota (Appendix Table 15).154 The Secretary can overcome the institutional presumption for these settings by applying heightened scrutiny based on information submitted by the state.155
Twenty-one states already have or are planning to restrict worker hours or make other policy changes in response to the U.S. Department of Labor (DOL) minimum wage and overtime rules (Figure 14 and Appendix Table 16). Specifically, seven states report new plans to restrict worker hours or make other policy changes for the first time in FY 2018, while the remaining states are continuing to apply restrictions or other policy changes implemented in a prior year. The DOL extended the Fair Labor Standards Act minimum wage and overtime rules to most direct care workers (such as certified nursing assistants, home health aides, personal care aides, and other caregivers, who previously were exempt from those requirements) in rules that took effect in 2015.156 CMS policy guidance anticipated that the new DOL rules could affect self-directed Medicaid HCBS and observed that “many states will need to develop policies and consider programmatic changes to address the costs related to overtime and/or worker time spent traveling between worksites (i.e., individuals’ homes), to avoid or minimize negative impacts to individual [service] budgets, and to preserve the ability of individuals to self-direct services and supports effectively.”157
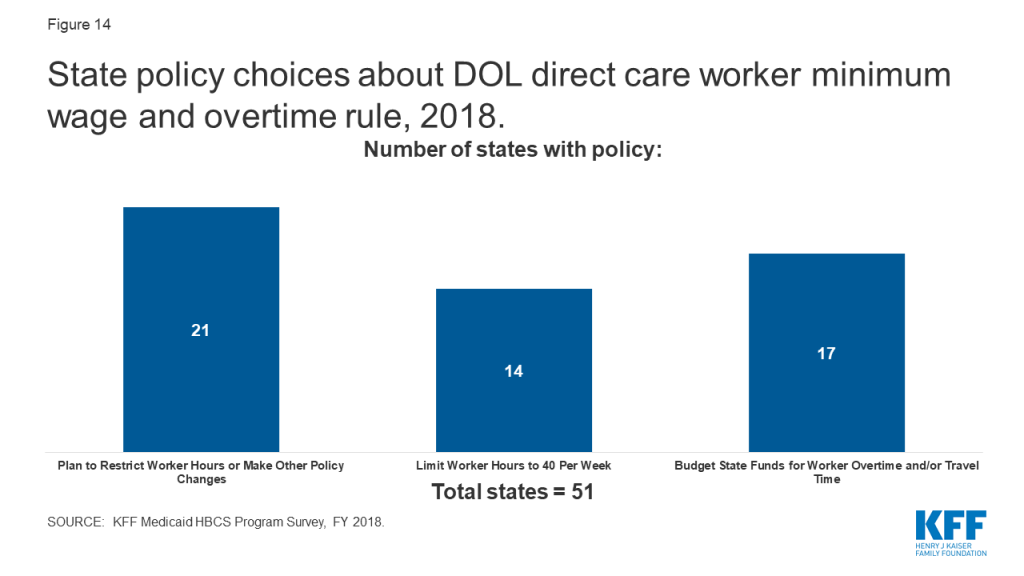
Among the states reporting policy changes in response to the DOL rules, 14 states limit worker hours to 40 per week (Figure 14 and Appendix Table 16). States newly restricting worker hours to 40 per week in FY 2018 include AL, DE, GA, KY, OR, and VA. Some states allow worker overtime if certain conditions are met. For example, New Jersey’s self-directed program allows workers to provide care over 40 hours by filing a live-in exemption. In Ohio, independent direct care workers are limited to 60 hours per week.
Seventeen states reported budgeting state funds for worker overtime and/or travel time pay in 2019 as a result of the DOL rule (Figure 14 and Appendix Table 16). Of these, 13 states (AZ, CA, CT, IL, MA, MS, ND, NE, OH, OR, SC, WA, and WI) budgeted funds for both direct care worker overtime and travel pay, and four states (LA, PA, UT, and VT) budgeted funds for overtime only.
The optional nature of most Medicaid HCBS and the substantial flexibility available to states in designing their programs results in considerable variation among states in eligibility, scope of benefits, and delivery systems. These state policy choices shape HCBS in important ways for the seniors and people with disabilities and chronic illnesses who rely on HCBS to live independently in the community. Today, Medicaid HCBS benefit packages vary among states, reflecting the optional nature of most HCBS. States continue to rely on waivers as the primary HCBS authority. Over three-quarters of states report an HCBS waiver waiting list, with state-level variation in waiting list enrollment trends. State use of capitated MLTSS delivery systems continues, with VBP for HCBS emerging as an area of state interest. States also are making policy changes in response to other federal laws and regulations related to HCBS, with a majority of states reporting challenges with meeting the new EVV requirements. States are further along in adopting policy changes to meet CMS’s home and community-based settings rule and the U.S. DOL minimum wage and overtime rules as they affect direct care workers.
The U.S. remains in the longest period of economic expansion in history. A future economic downturn could affect the availability of HCBS services. During the Great Recession and immediately afterward, the number of states reporting HCBS expansions declined slightly. A future economic downturn could potentially have similar implications for many optional services offered under Medicaid, including HCBS. States face increased budget pressures during times of economic recession, but regardless of economic outlook will face additional pressure to meet the health and LTSS needs of a growing elderly population in the near future. Understanding the variation in Medicaid HCBS state policies is important for analyzing the implications of this demographic change as well as the implications of a range of policy changes that could fundamentally restructure federal Medicaid financing or the larger U.S. health care system. For example, substantially cutting and capping the federal Medicaid funds available to states through a block grant or per capita cap could put pressure on states to eliminate optional covered populations and services, such as those that authorize and expand the availability of HCBS. While all states could face challenges in this scenario to varying degrees, those with certain characteristics – such as existing restrictive Medicaid policies; demographics like poverty, old age, or poor health status that reflect high needs; high cost healthcare markets; or low state fiscal capacity – could face greater challenges. On the other hand, moving to a Medicare-for-all system would eliminate existing state variation in favor uniform coverage of HCBS for all Americans. Unlike Medicaid, HCBS would be required and explicitly prioritized over institutional services under current Medicare-for-all proposals. As these policy debates develop, there will be continued focus on Medicaid’s role in providing HCBS for seniors and people with disabilities.
MaryBeth Musumeci and Priya Chidambaram are with KFF.Molly O’Malley Watts is with Watts Health Policy Consulting.
Appendix Table 1: State Adoption of Medicaid HCBS by Authority, FY 2018
Appendix Table 2: State Policy Choices About Medicaid Home Health State Plan Benefits, FY 2018
Appendix Table 3: State Policy Choices About Medicaid Personal Care State Plan Benefits, FY 2018
Appendix Table 4: Section 1915 (i) State Plan Services by State and Target Population, FY 2018
Appendix Table 5: Section 1915 (c) HCBS Waivers by Target Population, FY 2018
Appendix Table 6: Section 1115 HCBS Waivers by Target Population, FY 2018
Appendix Table 7: State Financial Eligibility Criteria for Medicaid HCBS Waivers by Target Population, FY 2018
Appendix Table 8: State HCBS Waiver Self-Direction and Provider Policy Choices, FY 2018
Appendix Table 9: Medicaid HCBS Waiver Waiting List Enrollment, by Target Population and by State, FY 2018
Appendix Table 10: Medicaid HCBS Waiver Waiting List Enrollment Change, FY 2017 to FY 2018
Appendix Table 11: Average Wait Time by Population for Medicaid HCBS Waivers with Waiting Lists, FY 2018
Appendix Table 12: State HCBS Waiver Utilization Control, Quality Measure, and Ombuds Policy Choices, FY 2018
Appendix Table 13: State Capitated MLTSS Policy Choices, FY 2018
Appendix Table 14: State Policy Choices About Electronic Visit Verification, FY 2018
Appendix Table 15: State Policy Choices About HCBS Settings Rule, FY 2018
Appendix Table 16: State Policy Choices About Direct Care Worker Minimum Wage and Overtime, FY 2018
| Appendix Table 1: State Adoption of Medicaid HCBS by Authority, FY 2018 | ||||||
| State | State Plan Services | Waivers | ||||
| Home health | Personal care | Community First Choice | Section 1915 (i) | Section 1915 (c) | Section 1115* | |
| Alabama | X | X | ||||
| Alaska | X | X | X | |||
| Arizona | X | X | ||||
| Arkansas | X | X | ^ | X | ||
| California | X | X | X | X | X | X |
| Colorado | X | X | X | |||
| Connecticut | X | X | X | X | ||
| Delaware | X | X | X | X | ||
| DC | X | X | X | X | ||
| Florida | X | X | X | |||
| Georgia | X | X | ||||
| Hawaii | X | X | X | |||
| Idaho | X | X | X | X | ||
| Illinois | X | X | ||||
| Indiana | X | X | X | |||
| Iowa | X | X | X | |||
| Kansas | X | X** | X | |||
| Kentucky | X | X | ||||
| Louisiana | X | X | X | |||
| Maine | X | X | X | |||
| Maryland | X | X | X | X | ||
| Massachusetts | X | X | X | |||
| Michigan | X | X | ^ | X | ||
| Minnesota | X | X | X | |||
| Mississippi | X | X | X | |||
| Missouri | X | X | X | |||
| Montana | X | X | X | X | ||
| Nebraska | X | X | X | |||
| Nevada | X | X | X | X | ||
| New Hampshire | X | X | X | |||
| New Jersey | X | X | X | X | ||
| New Mexico | X | X** | X | X | ||
| New York | X | X | X | X | X | |
| North Carolina | X | X | X | |||
| North Dakota | X | X | X | |||
| Ohio | X | X | X | |||
| Oklahoma | X | X | X | |||
| Oregon | X | X | X | X | ||
| Pennsylvania | X | X | ||||
| Rhode Island | X | X | X | |||
| South Carolina | X | X | ||||
| South Dakota | X | X | X | |||
| Tennessee | X | X | X | |||
| Texas | X | X | X | X | X | X |
| Utah | X | X | X | |||
| Vermont | X | X | X | |||
| Virginia | X | X | ||||
| Washington | X | X | X | X | X | |
| West Virginia | X | X | X | |||
| Wisconsin | X | X | X | |||
| Wyoming | X | X | ||||
| TOTAL(51 states): | 51 states | 34 states | 8 states | 11 states | 48 states | 12 states |
| NOTES: *Includes states with § 1115 waivers without any accompanying § 1915 (c) waivers. **KS and NM deliver personal care state plan services through their Section 1115 capitated managed care waivers and do not separately report on state plan personal care enrollment, spending, or program policies. ^AR began covering § 1915 (i) services in March 2019, and MI began covering § 1915 (i) services in Oct. 2018. | ||||||
| Appendix Table 2: State Policy Choices About Medicaid Home Health State Plan Benefits, FY 2018 | |||||||||
| State | Optional Therapy Services^ | Assistance with Household Activities | Self-Direction | Utilization Controls | Provider Reimbursement Rates(per visit, unless noted as per hour) | ||||
| Copay | |||||||||
| Cost Cap | Hour Cap | Agency | Registered Nurse | Home Health Aide | |||||
| Alabama | X | X | $27.00 | $27.00 | $27.00 | ||||
| Alaska | X | X | $269.54 | ||||||
| Arizona | X | X | X | $124.74 | $105.69 | $46.81 | |||
| Arkansas | X | $145.02 | $66.63 | ||||||
| California | X | X | X | $1/visit | $74.86 | $45.75 | |||
| Colorado | X | X | $144.54 | $ 146.92 | $148.12 | ||||
| Connecticut | X | X* | $95.20 | $ 6.16 | |||||
| Delaware | X | X* | NR | ||||||
| DC | X | X | $60.00 | $90.00 | $20.20/hr | ||||
| Florida | X | X | $2/day | $31.04 | $17.46 | ||||
| Georgia | X | X | $3/visit | $61.32 | $61.32 | $61.32 | |||
| Hawaii | X | $124.00 | |||||||
| Idaho | X | X* | $167.96 | $58.91 | |||||
| Illinois | X | $72.00 | $72.00 | $72.00 | |||||
| Indiana | X | $ 231.00 | |||||||
| Iowa | X | X* | $130.17 | $121.33 | $54.94 | ||||
| Kansas | X | $3/visit** | $50.00 | $80.00 | $40.50 | ||||
| Kentucky | X | $3/visit | $69.47 | $87.15 | $34.13 | ||||
| Louisiana | X | $147.20 | |||||||
| Maine | X | X | $3/day | NR | |||||
| Maryland | X | $115.46 | $121.97 | $60.59 | |||||
| Massachusetts | X | $89.21 | $89.12/hr | $24.40/hr | |||||
| Michigan | X | X* | $80.98 | $51.72 | |||||
| Minnesota | X | X | $75.02 | $57.57 | |||||
| Mississippi | X | X | $3/visit | $114.87 | $ 106.14 | $45.50 | |||
| Missouri | X | X* | $78.32 | $78.32 | $78.32 | ||||
| Montana | X | X* | $4/visit | $76.41 | $76.41 | $34.12 | |||
| Nebraska | X | X | X | $36.57/hr | $22.72/hr | ||||
| Nevada | X | $68.88/hr | $32.85/hr | ||||||
| New Hampshire | X | $87.36/hr | $23.56/hr | ||||||
| New Jersey | X | X | X* | $42.96 | $50.36 | $39.31 | |||
| New Mexico | X | X | $133.18 | $151.05 | $ 111.82 | ||||
| New York | X | X | NR | ||||||
| North Carolina | X | X | $99.86 | $101.08 | $44.82 | ||||
| North Dakota | X | $118.00 | $35.00 | $16.00 | |||||
| Ohio | X | X* | $47.40 | $23.57 | |||||
| Oklahoma | X* | $182.25 | |||||||
| Oregon | X | X | X | $ 193.63 | $53.59 | ||||
| Pennsylvania | X | X* | $93.99 | ||||||
| Rhode Island | X | X | X | $67.18 | $67.18 | $22.26 | |||
| South Carolina | X | X* | $3.30/visit | $98.71 | $93.69 | $43.17 | |||
| South Dakota | X | $59.60 | $27.80 | ||||||
| Tennessee | X | X* | NR | ||||||
| Texas | X | $3.14 | $54.99 | $46.09 | |||||
| Utah | X | NR | |||||||
| Vermont | X | X | $111.70 | $50.60/hr | |||||
| Virginia | X | X | $3/visit | $180.02 | $73.90 | ||||
| Washington | X | X | $95.45 | $63.50 | $55.32 | ||||
| West Virginia | X | X | NR | ||||||
| Wisconsin | X | $85.54 | $85.54 | $40.31 | |||||
| Wyoming | X | X | X | $87.75 | $45.50 | ||||
| TOTAL(51 states): | 50 states | 11 states | 3 states | 3 states | 25 states | 10 states | $102.85 average pay rate | $89.89 average pay rate | $46.80 average pay rate |
| NOTES: Blank cell indicates state does not elect policy option. NR indicates state did not respond to question. ^Optional therapy services include physical, occupational, and/or speech therapy. *State allows exceptions to hourly service cap. **KS’s $3 copay per skilled nursing visit only applies to fee-for-service enrollees (about 2% of the population) and not to capitated managed care enrollees. SOURCE: KFF Medicaid State Plan Home Health Program Survey, FY 2018. | |||||||||
| Appendix Table 3: State Policy Choices About Medicaid Personal Care State Plan Benefits, FY 2018 | |||||||||
| State | Service Site, Besides Home | Self-Dir. | Provider Type | Utilization Controls | Provider Reimb. Rate(per hr.) | ||||
| Work | Other Comm. Setting | Agency | Indep. | Cost Cap | Hour Cap | Agency | Provider | ||
| Alaska | X | X | X | X | X* | $24.40 | |||
| Arkansas | X | X | X | X | $18.00 | ||||
| California | X | X | X* | X | $11.25 | ||||
| Colorado | X | X | X | ` | $60.66 | $60.66 | |||
| DC | X | X | X | X | $20.08 | $13.84 | |||
| Florida | X | X | X | X | X | X | X | $15.00 | $15.00 |
| Idaho | X | X | X | X | X | $15.76 | |||
| Kansas | NR | NR | NR | NR | NR | NR | NR | NR | NR |
| Louisiana | X | X | X* | X | $11.40 | ||||
| Maine | X | X | X | $20.12 | |||||
| Maryland | X | X | X | $16.99 | |||||
| Massachusetts | X | X | X | X | X | $15.00 | |||
| Michigan | X | X | X | X | X | $14.50 | $9.25 | ||
| Minnesota | X | X | X | X | X* | X | $17.40 | ||
| Missouri | X | X | X | X | $18.12 | $15.76 | |||
| Montana | X | X | X | X | $19.44 | ||||
| Nebraska | X | X | X | X | X | $9.20 | $9.20 | ||
| Nevada | X | X | X | X | X | $17.00 | $17.00 | ||
| New Hampshire | X | X | X | NR | NR | ||||
| New Jersey | X | X | X | X | X | X | $15.00 | $15.00 | |
| New Mexico | NR | NR | NR | NR | NR | NR | NR | NR | NR |
| New York | X | X | X | X | NR | NR | |||
| North Carolina | X | X | $15.60 | ||||||
| North Dakota | X | X | X | X | X | $27.96 | $20.36 | ||
| Oklahoma | X | X | X | X | NR | NR | |||
| Oregon | X | X* | X | $24.61 | $14.65 | ||||
| Rhode Island | X | X | X | NR | NR | ||||
| South Dakota | X | X | X | X | $25.24 | ||||
| Texas | X | X | X | X | X | $12.44 | $12.44 | ||
| Utah | X | X | X | X | $19.08 | $11.64 | |||
| Vermont | X | X | X | X | X | N/A | N/A | ||
| Washington | X | X | X | X | X | $26.86 | $17.91 | ||
| West Virginia | X | X | X | X | $16.00 | ||||
| Wisconsin | X | X | $16.72 | ||||||
| TOTAL(34 states): | 25 states | 23 states | 20 states | 29 states | 16 states | 2 states | 20 states | $19.90 aver. | $17.26 aver. |
| No Personal Care Program (17 states) | |||||||||
| Alabama | |||||||||
| Arizona | |||||||||
| Connecticut | |||||||||
| Delaware | |||||||||
| Georgia | |||||||||
| Hawaii | |||||||||
| Illinois | |||||||||
| Indiana | |||||||||
| Iowa | |||||||||
| Kentucky | |||||||||
| Mississippi | |||||||||
| Ohio | |||||||||
| Pennsylvania | |||||||||
| South Carolina | |||||||||
| Tennessee | |||||||||
| Virginia | |||||||||
| Wyoming | |||||||||
| NOTES: NR = no response. Blank cell = state does not elect policy option. N/A = VT’s program is entirely self-directed, with enrollees setting payment rates, subject to a state-established minimum. *State allows legally responsible relative to be paid provider.SOURCE: KFF Medicaid State Plan Personal Care Program Survey, FY 2018. | |||||||||
| Appendix Table 4: Section 1915 (i) State Plan Services by State and Target Population , FY 2018 | ||||||||
| Target Population | Service Category | |||||||
| Case Management | Home-based Services | Day Services | Nursing/Therapy Services | Round-the-Clock Services | Supported Employment | Other Mental/Behavioral Health Services | Equipment/Technology/Modifications | |
| I/DD(4 states) | 2 states(DE, MS) | 3 states(CA, DE, ID^) | 3 states(CA, ID^, MS) | 1 state(CA) | 1 state(CA) | 3 states(CA, DE, MS) | 2 states(CA, ID^) | 2 states(CA, DE) |
| Seniors and/or Physical Disabilities(2 of 3 states responding*) | 2 states(CT, NV) | 2 states(CT, NV) | 2 states(CT, NV) | 1 state(NV) | 2 states(CT, NV) | 1 state(NV) | 1 state(NV) | 1 state(CT) |
| Mental Illness(4 states) | 3 states(IN^, IA, TX) | 3 states(IN^, IA, ,TX) | 2 states(IN^, IA) | 2 states(IN^, TX) | 1 state(IA) | 2 states(IA, TX) | 3 states(IN^, OH, TX) | 1 state(TX) |
| TOTAL(10 of 11 states responding*): | 7 states | 8 states | 7 states | 4 states | 4 states | 6 states | 6 states | 4 states |
| NOTES: Section 1915 (i) states include CA, CT, DE, DC, IA, ID, IN, OH, MS, NV, and TX. *DC did not respond to this survey question. ^ID and IN benefit packages vary by sub-population.SOURCE: KFF Medicaid HCBS Program Survey, FY 2018. | ||||||||
| Appendix Table 5: Section 1915 (c) HCBS Waivers by State and Target Population, FY 2018 | |||||||||
| State | Total Number of Waivers | Population Served | |||||||
| I/DD | Seniors | Seniors &AdultswithPhysicalDisabilities | Adults with Physical Disabilities | Med. Fragile/Tech Dep. Children | HIV/AIDS
| Mental Health | TBI/SCI | ||
| Alabama | 6 | X | X | X | |||||
| Alaska | 4 | X | X | X | |||||
| Arkansas | 4 | X | X | ||||||
| California | 7 | X | X | X | X | X | X | ||
| Colorado | 11 | X | X | X | X | X | |||
| Connecticut | 11 | X | X | X | X | X | X | ||
| Delaware | 1 | X | |||||||
| DC | 2 | X | X | ||||||
| Florida | 4 | X | X | X | |||||
| Georgia | 4 | X | X | X | |||||
| Hawaii | 1 | X | |||||||
| Idaho | 4 | X | X | ||||||
| Illinois | 9 | X | X | X | X | X | X | X | |
| Indiana | 4 | X | X | X | |||||
| Iowa | 7 | X | X | X | X | X | X | ||
| Kansas | 7 | X | X | X | X | X | X | ||
| Kentucky | 6 | X | X | X | X | ||||
| Louisiana | 7 | X | X | X | |||||
| Maine | 5 | X | X | X | |||||
| Maryland | 6 | X | X | X | X | ||||
| Massachusetts | 10 | X | X | X | |||||
| Michigan | 4 | X | X | X | |||||
| Minnesota | 5 | X | X | X | X | X | |||
| Mississippi | 5 | X | X | X | X | ||||
| Missouri | 9 | X | X | X | X | ||||
| Montana | 4 | X | X | X | |||||
| Nebraska | 5 | X | X | X | |||||
| Nevada | 3 | X | X | X | |||||
| New Hampshire | 4 | X | X | X | |||||
| New Jersey | 1 | X | |||||||
| New Mexico | 3 | X | |||||||
| New York | 9 | X | X | X | X | X | |||
| North Carolina | 3 | X | X | X | |||||
| North Dakota | 6 | X | X | X | X | ||||
| Ohio | 7 | X | X | X | |||||
| Oklahoma | 6 | X | X | X | |||||
| Oregon | 6 | X | X | X | |||||
| Pennsylvania | 10 | X | X | X | X | ||||
| South Carolina | 7 | X | X | X | X | X | X | ||
| South Dakota | 4 | X | X | X | |||||
| Tennessee | 3 | X | |||||||
| Texas | 6 | X | X | X | |||||
| Utah | 8 | X | X | X | X | X | X | ||
| Virginia | 5 | X | X | ||||||
| Washington | 8 | X | X | X | |||||
| West Virginia | 3 | X | X | X | |||||
| Wisconsin | 6 | X | X | ||||||
| Wyoming | 5 | X | X | X | X | ||||
| TOTAL(48 states): | 265 waivers | 48 states | 8 states | 37 states | 16 states | 18 states | 5 states | 11 states | 21 states |
| No Section 1915 (c) Waivers (3 states) | |||||||||
| Arizona | |||||||||
| Rhode Island | |||||||||
| Vermont | |||||||||
| NOTES: I/DD = intellectual and developmental disabilities. TBI = traumatic brain injury. SCI = spinal cord injury. States may offer more than one Section 1915 (c) waiver per target population category. Other states may serve these populations through Section 1115 waivers.SOURCE: KFF Medicaid HCBS Waiver Survey, FY 2018. | |||||||||
| Appendix Table 6: Section 1115 HCBS Waivers by State and Target Population, FY 2018 | |||||||||
| State | Total Number of Waivers | Population Served | |||||||
| I/DD | Seniors | Adults with Physical Disabilities | Med. Fragile/Tech Dep.Children | HIV/AIDS | Mental Health | TBI/SCI | TBI/SCI | ||
| Arizona | 1 | X | X | X | |||||
| California | 1 | X | X | ||||||
| Delaware | 1 | X | X | X | X | X | X | ||
| Hawaii | 1 | X | X | X | X | ||||
| New Jersey | 1 | X | X | ||||||
| New Mexico | 1 | X | X | ||||||
| New York | 1 | X | X | X | |||||
| Rhode Island | 1 | X | X | X | X | X | X | X | X |
| Tennessee | 1 | X | X | X | |||||
| Texas | 1 | X | X | ||||||
| Vermont | 1 | X | X | X | X | X | |||
| Washington | 1 | X | X | X | X | X | |||
| TOTAL(12 states): | 12 states | 5 states | 12 states | 12 states | 2 states | 3 states | 3 states | 4 states | 4 states |
| No Stand-Alone Section 1115 HCBS Waivers (39 states) | |||||||||
| Alabama | |||||||||
| Alaska | |||||||||
| Arkansas | |||||||||
| Colorado | |||||||||
| Connecticut | |||||||||
| DC | |||||||||
| Florida | |||||||||
| Georgia | |||||||||
| Idaho | |||||||||
| Illinois | |||||||||
| Indiana | |||||||||
| Iowa | |||||||||
| Kansas** | |||||||||
| Kentucky | |||||||||
| Louisiana | |||||||||
| Maine | |||||||||
| Maryland | |||||||||
| Massachusetts | |||||||||
| Michigan* | |||||||||
| Minnesota | |||||||||
| Mississippi | |||||||||
| Missouri | |||||||||
| Montana | |||||||||
| Nebraska | |||||||||
| Nevada | |||||||||
| New Hampshire | |||||||||
| North Carolina** | |||||||||
| North Dakota | |||||||||
| Ohio | |||||||||
| Oklahoma | |||||||||
| Oregon | |||||||||
| Pennsylvania | |||||||||
| South Carolina | |||||||||
| South Dakota | |||||||||
| Utah | |||||||||
| Virginia | |||||||||
| West Virginia | |||||||||
| Wisconsin | |||||||||
| Wyoming | |||||||||
| NOTES: I/DD = intellectual and developmental disabilities. TBI = traumatic brain injury. SCI = spinal cord injury. Other states serve these populations through Section 1915 (c) waivers. *MI has a § 1115 waiver for behavioral health services approved in April 2019. **KS and NC have joint § 1115/1915 (c) waivers.SOURCE: KFF Medicaid HCBS Waiver Survey, FY 2018. | |||||||||
| Appendix Table 7: State Financial Eligibility Criteria for Medicaid HCBS Waivers by Target Population, FY 2018 | ||||||||
| State | I/DD | Seniors | Seniors & Adultswith Physical Disabilities | Adults withPhysical Disabilities | Med. Fragile/Tech Dep.Children | HIV/AIDS | Mental Health | TBI/SCI |
| Alabama | 300% | 300% | 300% | 300% | ||||
| Alaska | 300% | 300% | 300% | |||||
| Arizona | 300% | 300% | ||||||
| Arkansas | 300% | 300% | ||||||
| California | 100% | 100% | 100% | 100% | 100% | 100% | ||
| Colorado | 300% | 300% | 300% | 300% | 300% | |||
| Connecticut | 300% | 300% | 300% | 300% | 300% | 300% | ||
| Delaware | 250% | 250% | 250% | 250% | 250% | 250% | 250% | |
| DC | 300% | 300% | ||||||
| Florida | 300% | 300% | 300% | |||||
| Georgia | 300% | 300% | 300% | |||||
| Hawaii | 100% FPL | 100% FPL | 100% FPL | 100% FPL | 100% FPL | 100% FPL | ||
| Idaho | 300% | 300% | ||||||
| Illinois | 100% FPL | 100% FPL | 100% FPL | 100% FPL | 100% FPL | 100% FPL | 100% FPL | |
| Indiana | 300% | 300% | 300% | |||||
| Iowa | 300% | 300% | 300% | 300% | 300% | 300% | ||
| Kansas | 300% | 300% | 300% | 300% | 300% | 300% | ||
| Kentucky | 300% | 300% | 300% | 300% | ||||
| Louisiana | 300% | 300% | 300% | |||||
| Maine | 300% | 300% | 300% | |||||
| Maryland | 300% | 300% | 300% | 300% | ||||
| Massachusetts | 300% | 300% | 300% | |||||
| Michigan | 100% FPL | 300% | 300% | |||||
| Minnesota | 100% FPL | 300% | 100% FPL | 100% FPL | 100% FPL | |||
| Mississippi | 300% | 300% | 300% | 300% | ||||
| Missouri | 300% | 170% | 300% | 300% | ||||
| Montana | 100% | 100% | 100% | |||||
| Nebraska | 100% | 100% FPL | 100% FPL | |||||
| Nevada | 300% | 300% | 300% | |||||
| New Hampshire | 300% | 300% | 300% | |||||
| New Jersey | 300% | 300% | ||||||
| New Mexico | 300% | 300% | 300% | |||||
| New York | 300% FPL | 84% FPL | 100% FPL | 100% FPL | 100% FPL | |||
| North Carolina | 100% FPL | 100% | 100% | |||||
| North Dakota | 83% FPL | 83% FPL | 83% FPL | 83% FPL | ||||
| Ohio | 300% | 300% | 300% | |||||
| Oklahoma | 300% | 300% | 300% | |||||
| Oregon | 300% | 300% | 300% | |||||
| Pennsylvania | 300% | 300% | 300% | 300% | ||||
| Rhode Island | 100% FPL | 100% FPL | 100% FPL | 100% FPL | 100% FPL | 100% FPL | 100% FPL | 100% FPL |
| South Carolina | 100% FPL | 300% | 300% | 300% | 300% | 300% | ||
| South Dakota | 300% | 300% | 300% | |||||
| Tennessee | 300% | 300% | 300% | 300% | ||||
| Texas | 300% | 300% | 300% | 300% | ||||
| Utah | 100% FPL | 100% FPL | 300% | 300% | 100% FPL | 100% FPL | ||
| Vermont | 300% | 300% | 300% | |||||
| Virginia | 300% | 300% | ||||||
| Washington | 300% | 300% | 300% | 300% | ||||
| West Virginia | 300% | 300% | 300% | |||||
| Wisconsin | 300% | 300% | ||||||
| Wyoming | 300% | 300% | 300% | 300% | ||||
| NOTES: Eligibility Limit as a % of SSI, unless otherwise noted. I/DD = intellectual and developmental disabilities. TBI = traumatic brain injury. SCI = spinal cord injury. Data include § 1915 (c) and § 1115 waivers. States may offer more than one § 1915 (c) waiver per target population category. Blank cell indicates state does not cover that population.SOURCE: KFF Medicaid HCBS Program Surveys, FY 2018. | ||||||||
| Appendix Table 8: State HCBS Waiver Self-Direction and Provider Policy Choices, FY 2018 | ||||||||
| State | Self-Direction Allowed | Scope of Self-Direction | Direct Care Provider Types | |||||
| Select/Dismiss Worker | Set Worker Schedule | Set Worker Pay | Allocate Service Budget | Agency | Indep. Providers | Legally Responsible Relative | ||
| Alabama | X | X | X | X | X | X | X | |
| Alaska | X | X | X | |||||
| Arizona | X | X | X | X | X | X | ||
| Arkansas | X* | X | X | X | X | X | ||
| California | X | X | X | X | X | |||
| Colorado | X | X | X | X | X | X | X | |
| Connecticut | X | X | X | X | X | X | X | |
| Delaware | X | X | X | X | X | X | X | |
| DC | X | X | X | X | X | X | ||
| Florida | X | X | X | X | X | X | X | X |
| Georgia | X | X | X | X | X | X | ||
| Hawaii | X | X | X | X | X | X | X | |
| Idaho | X | X | X | X | X | X | X | X |
| Illinois | X | X | X | X | X | X | X | X |
| Indiana | X | X | X | X | X | X | ||
| Iowa | X | X | X | X | X | X | X | X |
| Kansas | X | X | X | X | X | X | ||
| Kentucky | X | X | X | X | X | X | X | |
| Louisiana | X | X | X | X | X | X | X | X |
| Maine | X | X | X | X | X | X | ||
| Maryland | X | X | X | X | X | X | X | X |
| Massachusetts | X | X | X | X | X | X | X | |
| Michigan | X | X | X | X | X | X | X | |
| Minnesota | X | X | X | X | X | X | X | X |
| Mississippi | X | X | X | X | X | |||
| Missouri | X | X | X | X | X | X | X | X |
| Montana | X | X | X | X | X | X | X | X |
| Nebraska | X | X | X | X | X | X | X | |
| Nevada | X | X | X | X | X | |||
| New Hampshire | X | X | X | X | X | X | X | X |
| New Jersey | X | X | X | X | X | X | ||
| New Mexico | X | X | X | X | X | X | X | X |
| New York | X | X | X | X | X | X | X | X |
| North Carolina | X | X | X | X | X | X | X | |
| North Dakota | X | X | X | X | X | X | X | X |
| Ohio | X | X | X | X | X | X | X | X |
| Oklahoma | X | X | X | X | X | X | X | X |
| Oregon | X | X | X | X | X | |||
| Pennsylvania | X | X | X | X | X | X | X | X |
| Rhode Island | X | X | X | X | X | X | ||
| South Carolina | X | X | X | X | X | |||
| South Dakota | X | X | X | X | X | X | X | X |
| Tennessee | X | X | X | X | X | X | X | X |
| Texas | X | X | X | X | X | X | X | |
| Utah | X | X | X | X | X | X | ||
| Vermont | X | X | X | X | X | X | X | |
| Virginia | X | X | X | X | X | |||
| Washington | X | X | X | X | X | X | X | |
| West Virginia | X | X | X | X | X | X | X | X |
| Wisconsin | X | X | X | X | X | X | X | X |
| Wyoming | X | X | X | X | X | X | X | X |
| TOTAL(51 states): | 50 states | 50 states | 50 states | 39 states | 33 states | 51 states | 49 states | 30 states |
| NOTES: HCBS waivers include § 1915 (c) and § 1115. Some states may apply different self-direction policies to agency-employed vs. independent providers. *AR does not offer self-direction as a waiver service, but waiver enrollees can self-direct attendant services provided under a waiver through § 1915 (j) authority.SOURCE: KFF Medicaid HCBS Program Survey, FY 2018. | ||||||||
| Appendix Table 9: Medicaid HCBS Waiver Waiting List Enrollment, by Target Population and by State, FY 2018 | |||||||||
| State | Waiting List Enrollment by Target Population | Total Waiting List Enrollment: | |||||||
| I/DD | Seniors | Seniors & Adults with Physical Disabilities | Adults with Physical Disabilities | Med. Fragile/Tech Dep. Children | HIV/AIDS
| Mental Health | TBI/SCI | ||
| Alabama | 2,500 | 5,080 | 213 | 7,793 | |||||
| Alaska | 906 | 0 | 0 | 906 | |||||
| Arizona | 0 | 0 | 0 | ||||||
| Arkansas | 2,869 | 234 | 3,103 | ||||||
| California* | 0 | 1,539 | 3,295 | 3,600 | 0 | 76 | 8,510 | ||
| Colorado | 2,800 | 0 | 0 | 0 | 0 | 2,800 | |||
| Connecticut | 1,865 | 0 | 1,600 | 280 | 65 | 74 | 3,884 | ||
| Delaware | 0 | 0 | 0 | 0 | 0 | 0 | 0 | ||
| DC* | 0 | 0 | 0 | ||||||
| Florida | 21,864 | 49,798* | 0 | 71,662 | |||||
| Georgia | 5,939 | 820 | 0 | 6,759 | |||||
| Hawaii | 0 | 0 | 0 | 0 | 0 | 0 | 0 | ||
| Idaho | 0 | 0 | 0 | ||||||
| Illinois* | 19,354 | 0 | 0 | 0 | 0 | 0 | 0 | 19,354 | |
| Indiana | 1,495 | 0 | 19 | 1,514 | |||||
| Iowa | 1,802 | 2,860 | 0 | 688 | 1,224 | 6,574 | |||
| Kansas | 3,673 | 0 | 1,557 | 0 | 0 | 0 | 5,230 | ||
| Kentucky | 9,055 | 0 | 0 | 139 | 9,194 | ||||
| Louisiana | 27,509* | 36,743 | 666 | 64,918 | |||||
| Maine | 1,515* | 0 | 0 | 1,515 | |||||
| Maryland | 10,709 | 20,500 | 158 | 0 | 31,367 | ||||
| Massachusetts | 0 | 0 | 0 | 0 | |||||
| Michigan | 0 | 3,021 | 0 | 3,021 | |||||
| Minnesota | 31 | 0 | 0 | 0 | 0 | 31 | |||
| Mississippi | 1,794 | 10,224 | 1,411 | 81 | 13,510 | ||||
| Missouri | 0 | 0 | 100 | 0 | 100 | ||||
| Montana | 1,810 | 233 | 79 | 2,122 | |||||
| Nebraska | 1,627 | 0 | 0 | 1,627 | |||||
| Nevada | 378 | 566 | 215 | 1,159 | |||||
| New Hampshire | 105 | 0 | 0 | 105 | |||||
| New Jersey | NR | 0 | 0 | ||||||
| New Mexico | 5,030 | 15,325 | 20,355 | ||||||
| New York | 0 | NR | 0 | unknown | NR | unknown | |||
| North Carolina | 11,000 | 3,397 | 0 | 14,397 | |||||
| North Dakota | 17 | 0 | 0 | 0 | 17 | ||||
| Ohio* | 68,644 | 0 | 0 | 68,644 | |||||
| Oklahoma | 7,672 | 0 | 0 | 7,672 | |||||
| Oregon | 39 | 0 | 143 | 182 | |||||
| Pennsylvania | 16,532 | 0 | 0 | 0 | 16,532 | ||||
| Rhode Island | 0 | 0 | 0 | 0 | 0 | 0 | 0 | 0 | 0 |
| South Carolina | 11,292 | 0 | 0 | 0 | 0 | 0 | 11,292 | ||
| South Dakota* | 350 | 0 | 0 | 350 | |||||
| Tennessee | 7,263 | 0 | 7,263 | ||||||
| Texas | 323,434 | 35,224 | 26,550 | 0 | 385,208 | ||||
| Utah | 2,857 | 253 | 0 | 35 | 82 | 108 | 3,335 | ||
| Vermont | 0 | 0 | 0 | 0 | |||||
| Virginia | 13,215 | 0 | 13,215 | ||||||
| Washington | 0 | 0 | 0 | 0 | 0 | ||||
| West Virginia | 1,200 | 30 | 6 | 1,236 | |||||
| Wisconsin | 1,516 | 1,635 | 3,151 | ||||||
| Wyoming | 279 | 0 | 0 | 0 | 279 | ||||
| TOTAL: | 589,940 | 2,358 | 185,774 | 11,376 | 27,213 | 76 | 1,498 | 1,651 | 819,886 |
| NOTES: I/DD = intellectual and developmental disabilities. TBI = traumatic brain injury. SCI = spinal cord injury. Data include § 1915 (c) and § 1115 HCBS waivers. States may offer more than one § 1915 (c) waiver per target population category. NR indicates state did not respond to question. Blank cell indicates state does not have a waiver serving this population. *CA data include § 1915 (c) waivers only; CA did not report waiver waiting list enrollment for its § 1115 waiver for seniors and adults with physical disabilities. Data are for FY 2018 with the exception of DC, FL (seniors/physical disabilities only), IL, LA (I/DD only), ME (I/DD only), OH, and SD where FY 2017 data are reported.SOURCE: KFF Medicaid HCBS Waiver Program Survey, FY 2018. | |||||||||
| Appendix Table 10: Medicaid HCBS Waiver Waiting List Enrollment Change, FY 2017 to FY 2018 | |||
| State | FY 2017 | FY 2018 | Percent Change |
| Alabama | 4,194 | 7,793 | 86% |
| Alaska | 629 | 906 | 44% |
| Arizona | 0 | 0 | N/A |
| Arkansas | 2,834 | 3,103 | 9% |
| California | 7,683** | 8,510 | 11% |
| Colorado | 3,115 | 2,800 | -10% |
| Connecticut | 5,001 | 3,884 | -22% |
| Delaware | 0 | 0 | N/A |
| DC | 0 | 0* | N/A |
| Florida | 71,016 | 71,662* | 1% |
| Georgia | 7,810 | 6,759 | -13% |
| Hawaii | 0 | 0 | N/A |
| Idaho | 0 | 0 | N/A |
| Illinois | 19,354 | 19,354* | N/A |
| Indiana | 1,404 | 1,514 | 8% |
| Iowa | 8,004 | 6,574 | -18% |
| Kansas | 4,484 | 5,230 | 17% |
| Kentucky | 6,091 | 9,194 | 51% |
| Louisiana | 65,989 | 64,918* | -2% |
| Maine | 1,515 | 1,515* | N/A |
| Maryland | 35,143 | 31,367 | -11% |
| Massachusetts | 0 | 0 | N/A |
| Michigan | 3,223 | 3,021 | -6% |
| Minnesota | 237 | 31 | -87% |
| Mississippi | 13,465 | 13,510 | 0% |
| Missouri | 0 | 100 | N/A |
| Montana | 2,156 | 2,122 | -2% |
| Nebraska | 3,142 | 1,627 | -48% |
| Nevada | 1,173 | 1,159 | -1% |
| New Hampshire | 105 | 105 | 0% |
| New Jersey | 0 | 0 | N/A |
| New Mexico | 17,862 | 20,355 | 14% |
| New York | unknown | unknown | N/A |
| North Carolina | 14,487 | 14,397 | -1% |
| North Dakota | 11 | 17 | 55% |
| Ohio | 68,644 | 68,644* | N/A |
| Oklahoma | 7,701 | 7,672 | 0% |
| Oregon | 110 | 182 | 65% |
| Pennsylvania | 9,504 | 16,532 | 74% |
| Rhode Island | 0 | 0 | N/A |
| South Carolina | 10,409 | 11,292 | 8% |
| South Dakota | 350 | 350* | N/A |
| Tennessee | 7,428 | 7,263 | -2% |
| Texas | 281,381 | 385,208 | 37% |
| Utah | 2,974 | 3,335 | 12% |
| Vermont | 0 | 0 | N/A |
| Virginia | 12,266 | 13,215 | 8% |
| Washington | 0 | 0 | N/A |
| West Virginia | 2,092 | 1,236 | -41% |
| Wisconsin | 4,198 | 3,151 | -25% |
| Wyoming | 194 | 279 | 44% |
| TOTAL: | 707,378 | 819,886 | 16% |
| NOTES: Data include § 1915 (c) and § 1115 HCBS waivers. States with zero waitlist or unknown waitlist in FY 2017, and states that report full FY 2017 data in FY 2018 column are noted with N/A in percent change column. *FY 2017 data is used for DC, FL (seniors/physical disabilities only), IL, LA (I/DD only), ME (I/DD only), OH, and SD. **CA data include § 1915 (c) waivers only.SOURCE: KFF Medicaid HCBS Waiver Program Survey, FY 2017 and FY 2018. | |||
| Appendix Table 11: Average Wait Time by Population for Medicaid HCBS Waivers with Waiting Lists, FY 2018* | |||||||||
| Target Population: | I/DD | Seniors | Seniors & Adults with Physical Disabilities | Adults with Physical Disabilities | Med. Fragile/Tech Dep.Children | HIV/AIDS | Mental Health | TBI/SCI | All Populations |
| Average Number of Months Waiting: | 71 | 28 | 35 | 25 | 29 | 1 | 8 | 27 | 39 |
| NOTES: I/DD = intellectual and developmental disabilities. TBI = traumatic brain injury. SCI = spinal cord injury. Data include § 1915 (c) and § 1115 waivers. *Of the 41 states reporting one or more waivers with a waiting list in 2018, 30 states reported average wait time for at least one waiver with a waiting list (AL, AK, CA, CO, CT, IN, IA, KS, KY, LA, MD, MI, MN, MS, MO, MT, NE, NM, NC, ND, NV, OK, OR, PA, SC, SD, TN, TX, WV, and WY), and 11 states (AR, FL, GA, IL, ME, NH, NY, OH, UT, VA, and WI) did not report average wait time for any waivers with waiting lists.SOURCE: KFF Medicaid HCBS Waiver Program Survey, FY 2018. | |||||||||
| Appendix Table 12: State HCBS Waiver Utilization Control, Quality Measure and Ombuds Policy Choices, FY 2018 | |||||||||
| State | Utilization Controls | Quality Measures | Ombuds Programs Operated By: | ||||||
| Cost Cap | Hour Cap | Geo. Limit | Quality of Life | Community Integration | LTSS Rebalancing | State Gov’t | Community-based Agency | Another Entity | |
| Alabama | X | X | X | X | |||||
| Alaska | X | X | X | ||||||
| Arizona | X | X | X | ||||||
| Arkansas | X | X | X | ||||||
| California | X* | X* | X | X | X | X | |||
| Colorado | X | X | X | X | X | ||||
| Connecticut | X | X | X | X | X | ||||
| Delaware | X* | X* | X | X | X | X | |||
| DC | X | X | X | ||||||
| Florida | X* | X* | X | X | X | X | |||
| Georgia | X* | X | X | X | |||||
| Hawaii | X | X | X | X | X | ||||
| Idaho | X | X | X | X | |||||
| Illinois | X* | X | X | X | |||||
| Indiana | X | X | X | X | X | X | |||
| Iowa | X* | X | X | X | X | ||||
| Kansas | X | X | X | X | |||||
| Kentucky | X* | X* | X | X | X | ||||
| Louisiana | X* | X | X | X | X | X | |||
| Maine | X | X | X | X | NR | ||||
| Maryland | X* | X* | X | X | X | X | |||
| Massachusetts | X* | X* | X | X | X | X | |||
| Michigan | X | X | X | ||||||
| Minnesota | X* | X | X | X | X | ||||
| Mississippi | X | X | X | ||||||
| Missouri | X* | X* | |||||||
| Montana | X* | X* | X | X | |||||
| Nebraska | X | X | X | ||||||
| Nevada | X | X | X | X | |||||
| New Hampshire | X* | X | X | X | X | ||||
| New Jersey | X | X | NR | ||||||
| New Mexico | X* | X | X | X | |||||
| New York | X* | X* | X | X | X | ||||
| North Carolina | X | X* | X | ||||||
| North Dakota | X | X* | X | ||||||
| Ohio | X* | X* | X | X | X | X | |||
| Oklahoma | X* | X | X | ||||||
| Oregon | X | X | X | ||||||
| Pennsylvania | X | X | X | X | |||||
| Rhode Island | X | X | |||||||
| South Carolina | X* | X | X | X | |||||
| South Dakota | X* | X* | X | X | X | ||||
| Tennessee | X* | X* | X | X | X | X | X | ||
| Texas | X* | X* | X | X | X | X | |||
| Utah | X | X | X | ||||||
| Vermont | X* | X | X | X | |||||
| Virginia | X | X | X | X | |||||
| Washington | X* | X | X | X | X | ||||
| West Virginia | X | X | X | X | |||||
| Wisconsin | X | X | X | X | X | ||||
| Wyoming | X* | X | X | X | |||||
| TOTAL(51 states): | 34 states | 20 states | 4 states | 46 states | 44 states | 25 states | 36 states | 4 states | 5 states |
| NOTE: HCBS waivers include § 1915 (c) and § 1115. Blank cell indicates state does not adopt policy. NR indicates state did not respond to question. * indicates state allows exception to cost/hour cap.SOURCE: KFF Medicaid HCBS Program Survey, FY 2018. | |||||||||
| Appendix Table 13: State Capitated MLTSS Policy Choices, FY 2018 | |||||||
| State | Financial Incentives for HCBS Instead of Institutional Services^ | Value-Based Payment for HCBS | Independent Enrollment Options Counseling | Disenrollment if LTSS Provider Leaves Plan Network | Stakeholder Advisory Committee | ||
| Use Now | Future Plan to Use/Expand | State-Level | Health Plan Level | ||||
| Arizona | X | X | X | X | |||
| Arkansas* | NR | X | NR | X | X | X | |
| California | X | X | X | X | X | ||
| Delaware | X | X | X | X | X | X | |
| Florida | X | X | X | X | X | ||
| Hawaii | X | X | X | X | |||
| Idaho | NR | X | X | X | X | ||
| Illinois | NR | NR | X | X | X | ||
| Iowa | X | X | X | X | X | X | |
| Kansas | X | NR | X | X | X | X | |
| Louisiana | NR | X | X | X | |||
| Massachusetts | NR | NR | |||||
| Michigan | X | X | X | X | |||
| Minnesota | X | NR | X | X | X | ||
| New Jersey | NR | X | X | X | X | ||
| New Mexico | X | X | X | X | X | X | |
| New York | X | X | X | X | X | X | |
| North Carolina | NR | NR | NR | X | |||
| Ohio | X | NR | X | X | X | X | |
| Pennsylvania | X | X | X | X | X | X | |
| Rhode Island | NR | NR | X | X | X | ||
| South Carolina | X | NR | X | X | X | X | |
| Tennessee | X | X | X | X | X | X | X |
| Texas | NR | X | X | X | X | X | |
| Virginia | X | X | X | X | |||
| Wisconsin | X | X | X | X | X | X | |
| TOTAL(26 states): | 14 states | 7 states | 10 states | 19 states | 20 states | 23 states | 22 states |
| No MLTSS Program in FY 2018 (25 states): | |||||||
| Alabama | |||||||
| Alaska | |||||||
| Colorado | |||||||
| Connecticut | |||||||
| DC | |||||||
| Georgia | |||||||
| Indiana | |||||||
| Kentucky | |||||||
| Maine | |||||||
| Maryland | |||||||
| Mississippi | |||||||
| Missouri | |||||||
| Montana | |||||||
| Nebraska | |||||||
| Nevada | |||||||
| New Hampshire | |||||||
| North Dakota | |||||||
| Oklahoma | |||||||
| Oregon | |||||||
| South Dakota | |||||||
| Utah | |||||||
| Vermont** | |||||||
| Washington | |||||||
| West Virginia | |||||||
| Wyoming | |||||||
| NOTES: NR indicates state did not respond to question. Blank cell indicates state does not adopt policy. *The capitated portion of AR’s program began in FY 2019. **VT has a non-risk based MLTSS program as of Sept. 2017. ^FL and SC offer transition bonus payments, CA did not specify incentive type, all other states offer blended rates.SOURCE: KFF Medicaid HCBS Program Survey, FY 2018. | |||||||
| Appendix Table 14: State Policy Choices About Electronic Visit Verification (EVV), FY 2018 | |||||||
| State | EVV for Personal Care Services^ | EVV for Home Health State Plan Services | |||||
| In place in FY 2018^ | In place by January 2020^ | Plans to request good faith exemption^ | EVV Model Vendor Type | In place in FY 2018 | In place by year | EVV Model Vendor Type | |
| Alabama | X^ | X* | State mandated external | 2023 | Undecided | ||
| Alaska | X* | Open | Unknown | Undecided | |||
| Arizona | X | Open | 2020 | Open vendor | |||
| Arkansas | X^ | Other | NR | Other | |||
| California | X | Undecided | NR | NR | |||
| Colorado | X | X* | Other | 2020 | Other | ||
| Connecticut | X | X | X* | State mandated external | 2023 | State mandated external | |
| Delaware | X | Open | 2020 | Open vendor | |||
| DC | X* | NR | NR | NR | |||
| Florida | X | X | State mandated external | X | State mandated external | ||
| Georgia | X | Open | 2023 | Open | |||
| Hawaii | X | Open | 2020 | Open | |||
| Idaho | X | Other | Unknown | Other | |||
| Illinois | NR | NR | Undecided | 2023 | Undecided | ||
| Indiana | X | X | Open | 2023 | Open | ||
| Iowa | X* | Undecided | 2023 | Undecided | |||
| Kansas | X | State mandated external | Unknown | State mandated external | |||
| Kentucky | X | X* | Open | 2020 | State mandated external | ||
| Louisiana | X^ | Other | 2023 | State mandated in-house | |||
| Maine | X^ | X* | Provider choice | 2019 | Provider choice | ||
| Maryland | X | X | State mandated external | 2023 | Other | ||
| Massachusetts | X | Other | 2023 | Other | |||
| Michigan | X | Open | 2023 | Open | |||
| Minnesota | X | Open | Unknown | Open | |||
| Mississippi | X | X | Other | Unknown | NR | ||
| Missouri | X | X | X* | Provider choice | 2020 | Provider choice | |
| Montana | X | Other | 2023 | Other | |||
| Nebraska | X | X | Open | 2021 | Open | ||
| Nevada | X^ | Other | 2023 | Open | |||
| New Hampshire | X | X | Provider choice | NR | Provider choice | ||
| New Jersey | X | State mandated external | 2022 | State mandated external | |||
| New Mexico | X^ | X | X | Other | 2023 | Other | |
| New York | X | X | Undecided | NR | NR | ||
| North Carolina | X | Open | 2023 | Open | |||
| North Dakota | X | Open | 2021 | Provider choice | |||
| Ohio | X | X | X | Open** | X | Open | |
| Oklahoma | X | X | Other | X | Open | ||
| Oregon | X | Open | Unknown | NR | |||
| Pennsylvania | X | Open | 2023 | Open vendor | |||
| Rhode Island | X^ | X* | Provider choice | X | Provider choice | ||
| South Carolina | X | X | Other | 2022 | Open | ||
| South Dakota | X^ | Open | 2019 | Open | |||
| Tennessee | X | X | Other | 2023 | Other | ||
| Texas | X | X | X* | Other | 2023 | Other | |
| Utah | Provider choice | Unknown | Provider choice | ||||
| Vermont | X^ | X | Open | 2023 | Open | ||
| Virginia | X | Open | 2023 | Provider choice | |||
| Washington | X^ | X | Provider choice | Unknown | NR | ||
| West Virginia | X | X^ | X* | Other | Unknown | Other | |
| Wisconsin | X* | Other | 2023 | Other | |||
| Wyoming | X | State mandated external | 2023 | State mandated external | |||
| TOTAL(51 states): | 16 states | 27 states | 35 states | 4 states | |||
| NOTES: ^Personal care includes services delivered under the state plan option and HCBS waivers. AL, LA, NM, and RI have implemented EVV for all personal care services across all authorities, and AR, ME, NV, SD, VT, WA, and WV plan to do so by 2020; other states’ implementation dates and exemption plans apply to some but not all personal care authorities. *As of Feb. 2020, 13 states have received approval for a good faith exemption. **OH reported open vendor except that managed care plans must use the state vendor.SOURCE: KFF Medicaid HCBS Program Surveys, FY 2018. | |||||||
| Appendix Table 15: State Policy Choices About HCBS Settings Rule, FY 2018 | |||||
| State | State Rule/Policy Changed or Must Change | Settings Must Be Modified | Settings Cannot Be Modified | Settings Presumed Institutional Because Effectively Isolate Beneficiaries | Plans To Submit Or Has Submitted Information to Overcome Institutional Presumption |
| Alabama | X | X (1) | |||
| Alaska | X | X (613) | X (12) | ||
| Arizona | X | X (4) | X (5) | ||
| Arkansas | X | NR | NR | NR | NR |
| California | X | ||||
| Colorado | X | X (TBD) | X (TBD) | X (TBD) | |
| Connecticut | X | X (43) | X | X | |
| Delaware | X | X (460) | X (1) | X (1) | |
| DC | X | X | |||
| Florida | X | X (TBD) | X (1) | X (TBD) | X (TBD) |
| Georgia | X | X | |||
| Hawaii | X | X (1,760) | X (11) | ||
| Idaho | X | X (47) | X (3) | X | X |
| Illinois | X | X | X | ||
| Indiana | X | X (1,010) | |||
| Iowa | X | X (218) | X (2) | X (52) | X (45) |
| Kansas | X | ||||
| Kentucky | X | X (404) | X | X (95) | X (95) |
| Louisiana | X | X (90) | |||
| Maine | |||||
| Maryland | X (26) | X (2) | X (17) | X (17) | |
| Massachusetts | NR | ||||
| Michigan | X | X (1,479) | X (1,138) | ||
| Minnesota | X | X (51) | X (135) | X (265) | |
| Mississippi | X | ||||
| Missouri | X | X (241) | X (15) | X (127) | X |
| Montana | X | X | X | ||
| Nebraska | X | X (255) | X (2) | X | |
| Nevada | X | X | X | X (3) | |
| New Hampshire | X | X (1,984) | X | X (64) | X (54) |
| New Jersey | X | ||||
| New Mexico | X | ||||
| New York | X | X (311) | X | X | |
| North Carolina | X | X | X (20) | ||
| North Dakota | X | X (108) | X (6) | X (6) | |
| Ohio | X | X (397) | X (4) | X (69) | |
| Oklahoma | X | X (21) | X (4) | ||
| Oregon | X | X (1,678) | X | X (7) | X (16) |
| Pennsylvania | X | X | X | ||
| Rhode Island | X | X (14) | X | ||
| South Carolina | X | X (1,321) | X (3) | X (2) | |
| South Dakota | X | X (70) | X (14) | X (26) | |
| Tennessee | X | X | X | X | X |
| Texas | |||||
| Utah | X | X | X | X | |
| Vermont | X | ||||
| Virginia | X | ||||
| Washington | X | X (8) | X (1) | X (1) | |
| West Virginia | X | X (100) | X (100) | ||
| Wisconsin | X | X | X | X (TBD) | |
| Wyoming | X | X (2) | X (2) | ||
| TOTAL(51 states): | 47 states | 39 states | 20 states | 26 states | 22 states |
| NOTES: NR indicates state did not respond to question. Numbers in parentheses indicate number of settings. TBD indicates number of settings to be determined.SOURCE: KFF Medicaid HCBS Program Survey, FY 2018. | |||||
| Appendix Table 16: State Policy Choices About Direct Care Worker Minimum Wage and Overtime, FY 2018 | ||||
| State | Restrict Worker Hours or Other Policy Change (new in FY 2018 or continued from prior year) | Limit Worker Hours to 40 hours/week (new in FY 2018 or continued from prior year) | Budget State Funds for Worker Overtime Pay in 2019 | Budget State Funds for Worker Travel Time Pay in 2019 |
| Alabama | X | X | ||
| Alaska | ||||
| Arizona | X | X | ||
| Arkansas | ||||
| California | X | X | X | |
| Colorado | ||||
| Connecticut | X | X | X | |
| Delaware | X | X | ||
| DC | ||||
| Florida | ||||
| Georgia | X | X | ||
| Hawaii | ||||
| Idaho | ||||
| Illinois | X | X | ||
| Indiana | ||||
| Iowa | ||||
| Kansas | X | X | ||
| Kentucky | X | X | ||
| Louisiana | X | |||
| Maine | ||||
| Maryland | X | X | ||
| Massachusetts | X | X | ||
| Michigan | ||||
| Minnesota | ||||
| Mississippi | X | X | ||
| Missouri | ||||
| Montana | ||||
| Nebraska | X | X | ||
| Nevada | X | X | ||
| New Hampshire | X | |||
| New Jersey | X | |||
| New Mexico | X | X | ||
| New York | ||||
| North Carolina | ||||
| North Dakota | X | X | ||
| Ohio | X | X | X | |
| Oklahoma | X | X | ||
| Oregon | X | X | X | X |
| Pennsylvania | X | |||
| Rhode Island | ||||
| South Carolina | X | X | ||
| South Dakota | ||||
| Tennessee | X | |||
| Texas | ||||
| Utah | X | |||
| Vermont | X | X | X | |
| Virginia | X | X | ||
| Washington | X | X | X | X |
| West Virginia | ||||
| Wisconsin | X | X | X | |
| Wyoming | X | X | ||
| TOTAL(51 states): | 21 states | 14 states | 17 states | 13 states |
| SOURCE: KFF Medicaid HCBS Program Surveys, FY 2016-2018. | ||||
Medicaid fills in gaps in the overall health care system by serving as the primary source of coverage for long-term services and supports (LTSS), including home and community-based services (HCBS), as these services are typically unavailable and/or unaffordable through private insurance or Medicare. HCBS help seniors and people with disabilities and chronic illnesses live independently outside institutions by assisting with daily needs. This issue brief presents the latest (FY 2018) Medicaid HCBS enrollment and spending data from KFF’s 18th annual 50-state survey. Appendix Tables contain detailed state-level data. Key findings include the following:
State Medicaid programs will face increased pressure to meet the health and LTSS needs of a growing elderly population in the coming years, and their ability to do so could be affected by an economic downturn that could leave states with limited resources and require reductions in services offered at state option. In addition, if the ACA ultimately is struck down in Texas v. Azar, states would lose authority to offer some HCBS as well as some flexibility to design benefit packages. The 2020 elections also could have important implications for Medicaid and HCBS as policymakers may consider a range of proposals, from those that could cap federal Medicaid financing program-wide as in the President’s FY 2020 budget to proposals advocated by some Democrats to create a single, federal, universal health insurance program known as Medicare-for-all.
Medicaid continues to be the primary source of coverage for long-term services and supports (LTSS), financing over half of these services in 2018 (Figure 1). LTSS help seniors and people with disabilities with self-care, such as bathing and dressing, and household activities, such as preparing meals and managing medication. LTSS needs arise from a range of conditions, such as cognitive disabilities, like dementia or Down syndrome; physical disabilities, like multiple sclerosis or spinal cord injury; mental health disabilities, like depression or schizophrenia; and disabling chronic conditions, like cancer or HIV/AIDS.1

State Medicaid programs must cover LTSS in nursing homes, while most home and community-based services (HCBS) are optional.2 Spending on HCBS surpassed spending on institutional care for the first time in 2013, and comprises 57% of total Medicaid LTSS spending as of 2016 (Figure 2). Factors contributing to this trend include beneficiary preferences for HCBS, the fact that states are encouraging HCBS as an alternative to typically more costly institutional care, and states’ community integration obligations under the Americans with Disabilities Act and the Supreme Court’s Olmstead decision. In Olmstead, the Supreme Court held that the unjustified institutionalization of people with disabilities is illegal discrimination and violates the Americans with Disabilities Act.
This issue brief presents the latest (FY 2018)3 state-level Medicaid HCBS enrollment and spending data from KFF’s 18th annual survey of all 50 states and DC. The survey tracks Medicaid HCBS across four types of state plan benefits and two types of waivers, which are described in more detail in Table 1,4 and also presents enrollment and spending by target population where relevant. In general, state plan benefits are provided to all Medicaid beneficiaries for whom they are medically necessary. Waivers allow states to provide services to specific populations, set enrollment caps, and expand income and asset limits. State plan HCBS include home health; personal care; Section 1915 (i), which authorizes HCBS targeted to a particular population with functional needs that are less than an institutional level of care; and Community First Choice (CFC) attendant services and supports. HCBS waivers include Section 1915 (c) and Section 1115,5 both of which allow states to expand financial eligibility and offer HCBS to seniors and people with disabilities who would otherwise qualify for an institutional level of care, while limiting enrollment.6 The Appendix Tables contain detailed state-level data. A related brief presents the latest data and highlights themes in state HCBS policies.
| Table 1: Medicaid Home and Community Based Services (HCBS) Authorities | ||
| State Plan Benefits | ||
| Home Health Services |
| Required |
| Personal Care Services |
| Optional |
| Community First Choice |
| Optional |
| Section 1915 (i) |
| Optional |
| HCBS Waivers | ||
| Section 1915 (c) |
| Optional |
| Section 1115 |
| Optional |
Nearly all HCBS are provided at state option. Home health state plan services are the only HCBS that are required for states participating in Medicaid, covering 616,800 enrollees. Among the optional HCBS authorities, waivers continue to be the most commonly used. While some states have taken up Section 1915 (i) and/or CFC, these relatively newer state plan options have not supplanted waivers as the primary authority through which HCBS are provided. Personal care services are the most commonly used HCBS state plan option, offered in 34 states (Figure 3 and Appendix Table 1).
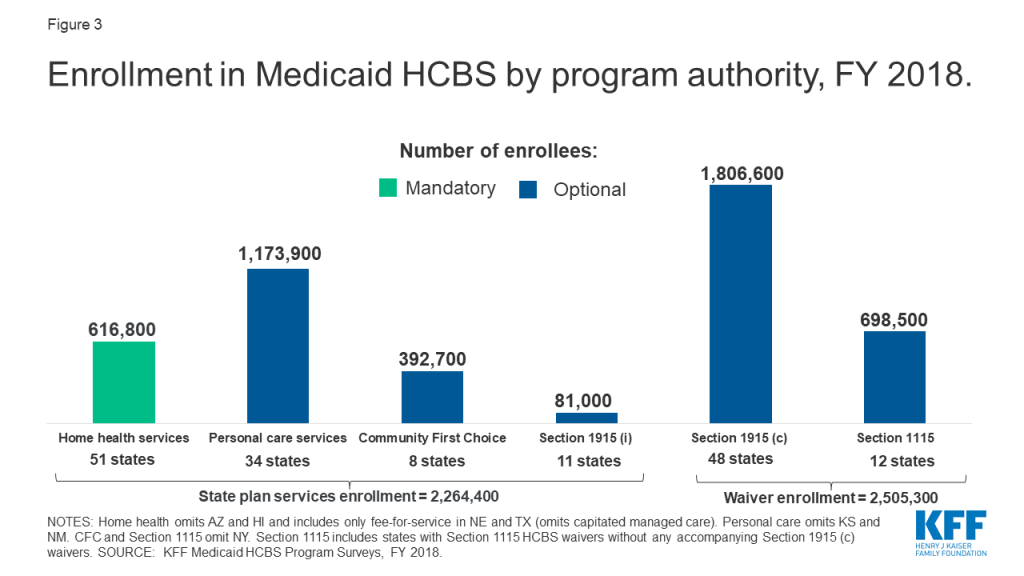
Enrollment across the various HCBS authorities ranges from 81,000 individuals receiving Section 1915 (i) state plan services to 1.8 million individuals receiving Section 1915 (c) waiver services (Figure 3 and Appendix Table 1). Most HCBS enrollees receive services provided through an optional authority. Over 2.5 million individuals receive HCBS through a Section 1915 (c) or Section 1115 waiver, and nearly 1.2 million individuals are served in the personal care state plan option, while about 600,000 individuals receive home health state plan services through the sole required HCBS benefit. Total home health state plan enrollment omits some or all individuals in four states (AZ,7 HI,8 NE,9 and TX)10 and total personal care state plan enrollment omits individuals in two states (KS11 and NM)12 that provide services through capitated managed care and cannot separately report enrollment data. In addition, New York is unable to report enrollment for CFC and Section 1115.13
HCBS enrollment under a state plan authority is slightly less than enrollment under a waiver authority (2.3 million vs. 2.5 million) (Figure 3). Total HCBS enrollment across all authorities is not presented as individuals may receive services under more than one authority. For example, in some states, an individual could receive some personal care hours through the state plan option and additional personal care hours through a Section 1915 (c) waiver. States can choose to allow enrollees to self-direct their personal care and/or home health services. Box 1 contains enrollment data for those services.
Box 1: Enrollment in Self-Directed Personal Care and Home Health State Plan Services
Nearly 700,000 people are self-directing personal care state plan services in 15 (of 20) states reporting this data.14 Self-direction typically allows enrollees to select and dismiss their direct care workers, determine worker schedules, set worker payment rates, and/or allocate their service budgets.15 The number of individuals self-directing services varies considerably from state to state. California has the greatest number of individuals (over 516,000) self-directing personal care state plan services, followed by Michigan (61,000) and Massachusetts (45,000). Self-direction of home health state plan services is less common. Among the three states that allow self-direction for home health state plan services, one state reports enrollment data (over 12,400 individuals in NJ).16
Medicaid HCBS spending totaled $92 billion in FY 2018, with nearly all spending for services provided at state option. Six percent of total HCBS spending is devoted to mandatory home health state plan services (Figure 4 and Appendix Table 2). Additionally, over two-thirds of all Medicaid HCBS spending is on services provided under a waiver authority compared to a state plan authority. Total spending under a state plan authority is under $30 billion, or about one-third of total Medicaid HCBS spending. Total home health state plan spending omits some or all spending in four states (AZ,17 HI,18 NE,19 and TX)20 and total personal care state plan spending omits two states (KS21 and NM0)22 that provide services through capitated managed care and cannot separately report spending data. In addition, New York is unable to report spending for CFC and Section 1115,23 and DC is unable to report spending for Section 1915 (i).
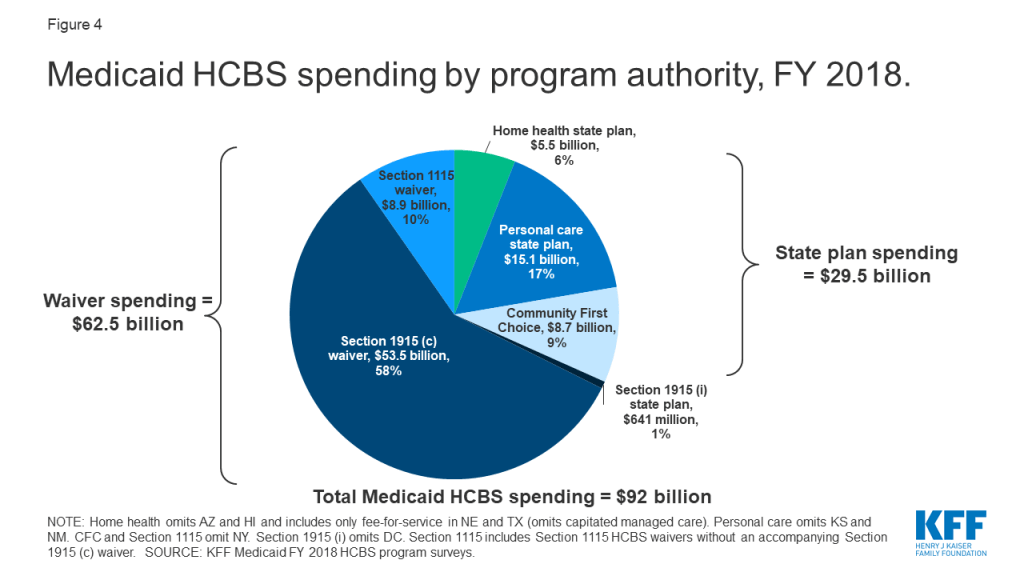
National per enrollee spending varies among the HCBS authorities, ranging from under $8,000 for Section 1915 (i) state plan services to nearly $30,000 for Section 1915 (c) waivers (Figure 5 and Appendix Table 3). This variation likely is due to the type and extent of services provided in the different HCBS authorities. For example:
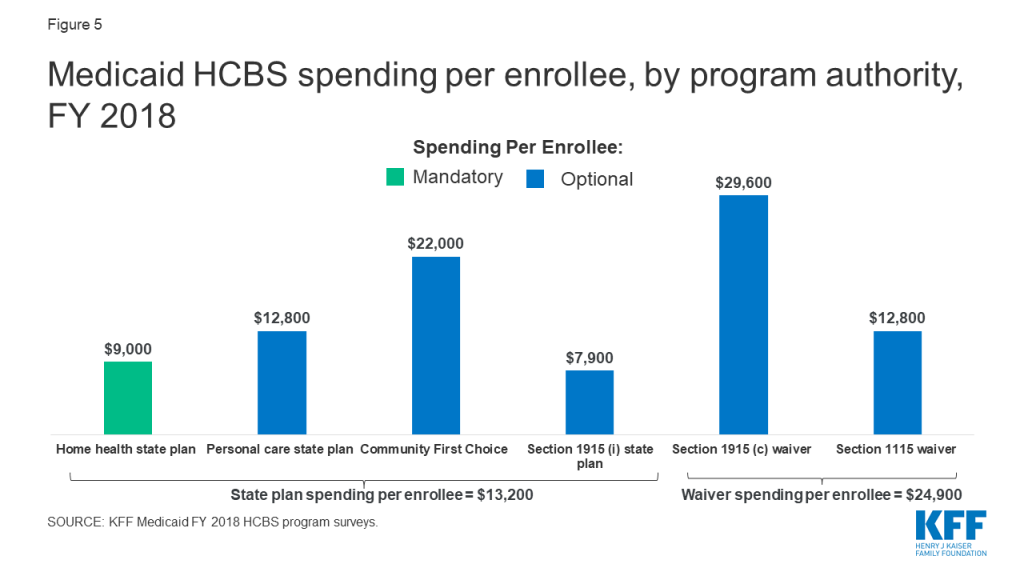
Enrollment and spending increased in each HCBS authority from FY 2017 to FY 2018, except home health state plan services (Table 2).25 The two authorities with the largest percent increases in total spending were CFC and personal care state plan services; spending increases in these authorities appear to be driven by increased per enrollee costs rather than by increased enrollment. Notable state-level changes from FY 2017 to FY 2018 include the following:
Home health state plan services is the only authority with both enrollment and spending declines, which could be attributable at least in part to increased enrollment in capitated managed care, and states’ inability to isolate home health enrollment and spending from other services included in the capitation payment. States with substantial home health state plan enrollment declines as a result of such data limitations include Texas (-55%) and Nebraska (-85%). Overall enrollment across all HCBS state plan authorities also decreased from FY 2017 to FY 2018, likely driven by the home health decrease.
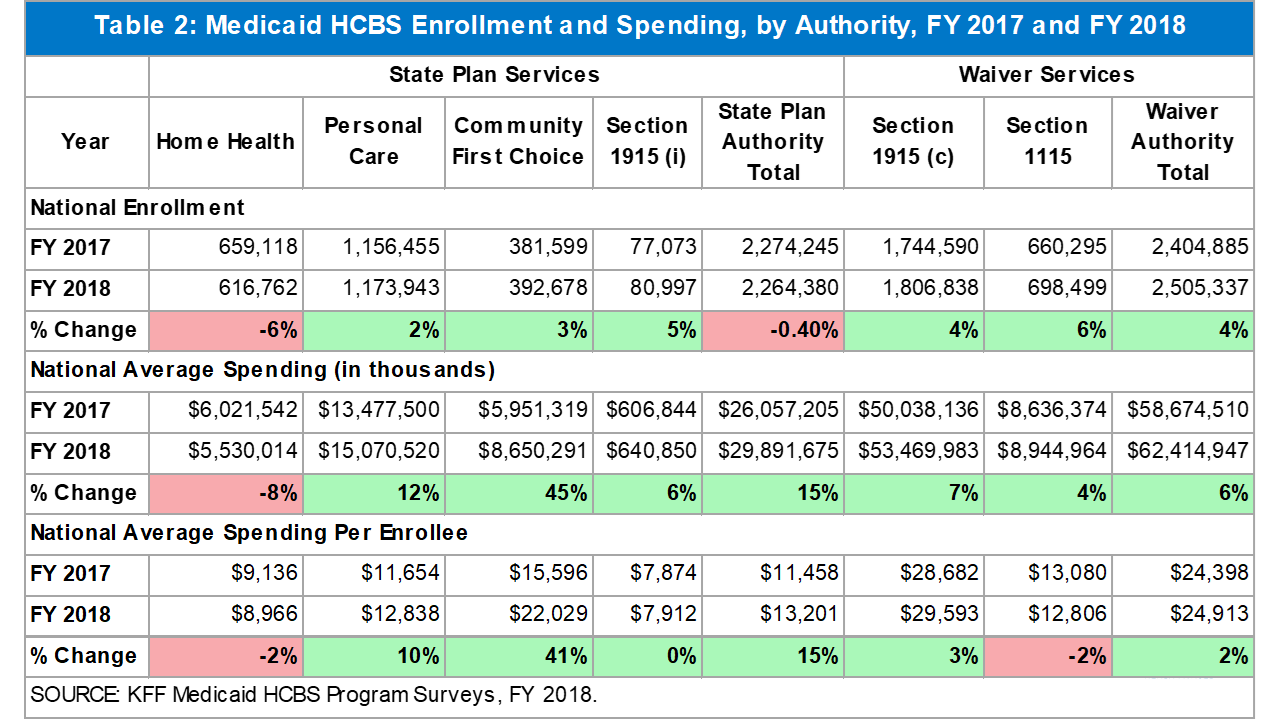
People with I/DD account for less than half of overall Section 1915 (c) waiver enrollment but more than two-thirds of spending (Figure 6 and Appendix Tables 4 and 5).27 Spending for this population is disproportionate to their enrollment as a result of their generally more intensive needs. By contrast, seniors and people with physical disabilities comprise over half of Section 1915 (c) waiver enrollment and over a quarter of spending.28 Other target populations, including people with mental health disabilities,29 people with traumatic brain or spinal cord injuries (TBI/SCI),30 children who are medically fragile or technology dependent,31 and people with HIV/AIDS,32 together account for a small share of Section 1915 (c) waiver enrollment and spending.
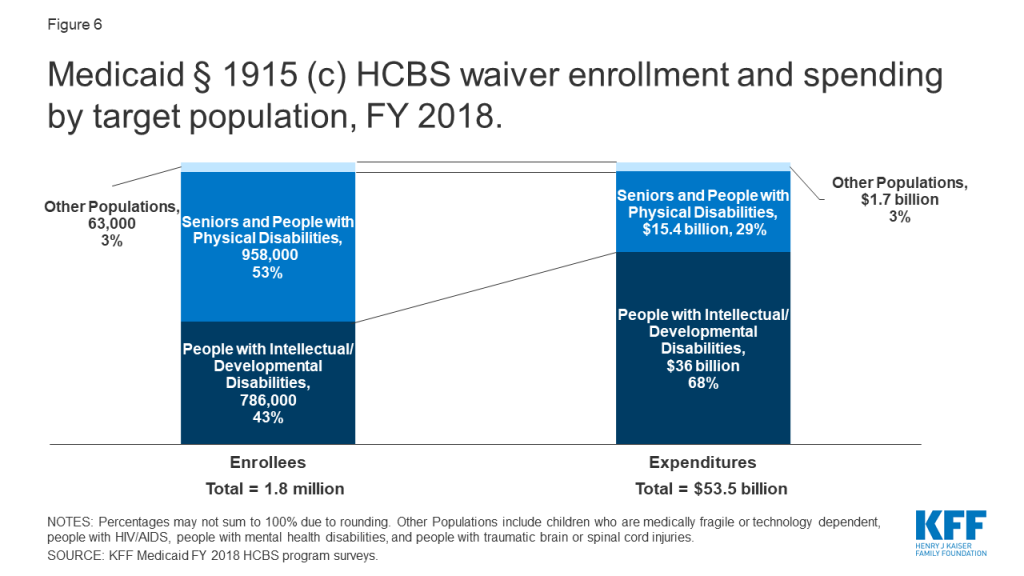
The fact that services for people with I/DD comprise over two-thirds of total Section 1915 (c) waiver spending reflects high per enrollee costs for this population. There is substantial variation in per enrollee spending among Section 1915 (c) waiver target populations, ranging from about $11,000 for people with HIV/AIDS to over $46,000 for people with I/DD (Figure 7 and Appendix Table 6). Per enrollee spending for people with I/DD is closely followed by the TBI/SCI population ($44,000) and medically fragile children ($35,000). In addition to people with HIV/AIDS, per enrollee spending is relatively lower for seniors and adults with physical disabilities ($16,000) and people with mental health disabilities ($13,000).
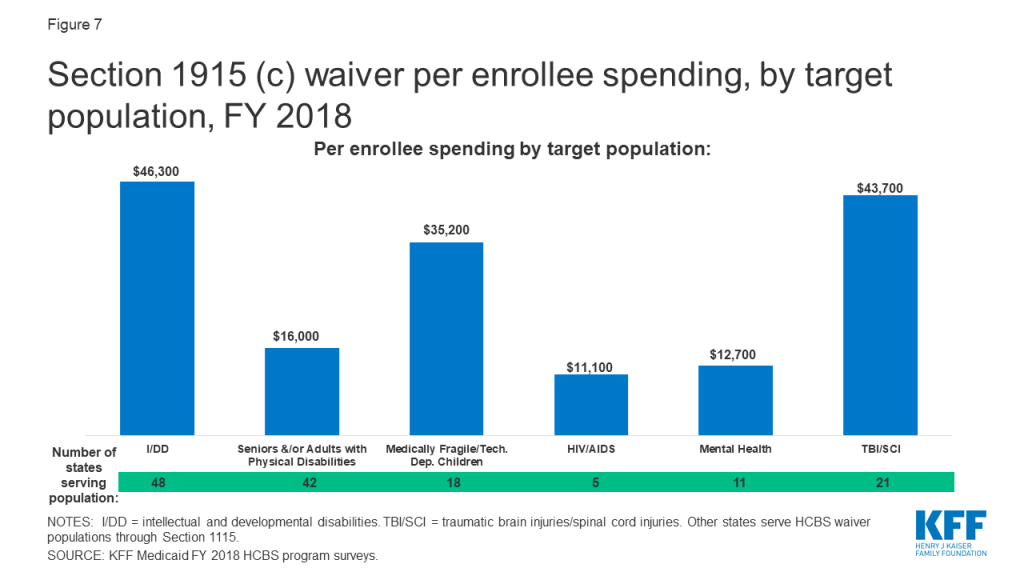
People with I/DD account for the vast majority of enrollment and spending in the Section 1915 (i) state plan option, largely due to California’s program (Figure 8).33 Unlike waivers which require an institutional level of care, Section 1915 (i) state plan HCBS are provided to people with functional needs that are less than an institutional level of care. The next largest Section 1915 (i) target population for both enrollment and spending is people with mental health disabilities.34 Nearly three-quarters of Section 1915 (i) enrollment for this population is in Iowa and Ohio, while Iowa’s program comprises most of the spending ($94 million). Seniors and adults with physical disabilities account for a very small share of Section 1915 (i) enrollment and spending.35
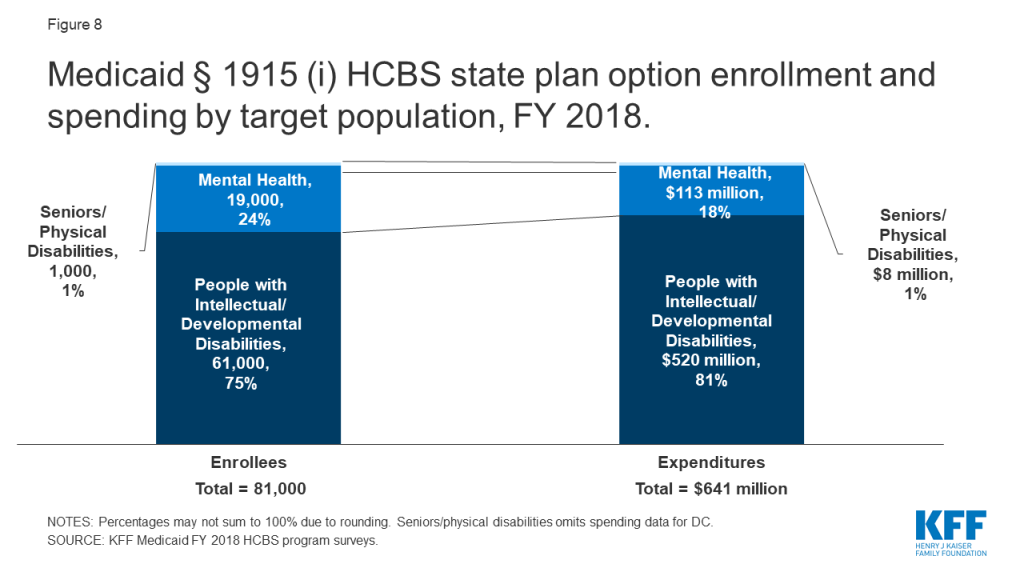
Per enrollee spending is similar across Section 1915 (i) state plan HCBS target populations. Section 1915 (i) state plan HCBS per enrollee spending was nearly $10,000 (in 2 of 3 states reporting)36 for seniors and adults with physical disabilities, less than $9,000 for people with I/DD (in 4 states),37 and under $6,000 for people with mental health disabilities (in 4 states).38 Lower per enrollee spending for Section 1915 (i) state plan HCBS compared to Section 1915 (c) waivers could reflect a more limited scope benefit package and/or the fact that Section 1915 (i) enrollees have fewer and/or less intensive needs (less than an institutional level of care) that Section 1915 (c) waiver enrollees (who must meet an institutional level of care).
Medicaid HCBS enrollment ranges from 81,000 individuals receiving Section 1915 (i) state plan services to 1.8 million individuals receiving Section 1915 (c) waiver services, with joint federal and state spending across all HCBS authorities totaling $92 billion in FY 2018. Medicaid HCBS promote independence and self-determination for seniors and people with disabilities and chronic conditions by enabling them to receive assistance with self-care needs and household activities outside an institution. Medicaid provides substantial federal funding to help states meet their community integration obligations under Olmstead and the Americans with Disabilities Act.
Most HCBS enrollees receive services provided through an optional authority, and nearly all HCBS spending is devoted to authorities provided at state option. Although home health state plan services are the only HCBS that states participating in Medicaid must offer, all states elect at least one optional HCBS authority. While nearly all Medicaid HCBS authorities are optional, Medicaid fills a gap by covering HCBS that are typically not available through private insurance or Medicare, and not affordable for many paying out-of-pocket, especially those with lower incomes. The optional nature of most HCBS results in substantial variation across states in enrollment and spending, reflecting states’ different choices about optional authorities, benefit package contents, and scope of covered services. States would lose some of their existing optional HCBS authorities and flexibility if the entire ACA ultimately is struck down in Texas v. Azar.39 Specifically, the option to offer CFC services would cease to exist, as would provisions that provide states with the flexibility to offer the current full scope of Section 1915 (i) services and to target those services to specific populations.40
The optional nature of most HCBS has implications for federal and state spending, especially during economic recessions. States face increasing pressures from revenue shortfalls during times of economic downturn. Optional Medicaid eligibility pathways and services, including HCBS, may be at risk for cuts as states must make difficult choices to balance their budgets.41
The 2020 elections also could have important implications for Medicaid and HCBS as policymakers may consider a range of proposals that could affect these populations and services. At one end of the spectrum, a Medicaid program-wide federal financing cap is proposed in President Trump’s FY 2020 budget, though efforts to repeal and replace the ACA and cap federal Medicaid funding through a block grant or per capita cap were narrowly defeated in Congress in 2017.42 In addition, Tennessee has submitted a proposal to CMS that seeks capped federal Medicaid funding through a Section 1115 waiver pursuant to state legislation that includes some seniors, nonelderly adults with physical disabilities, and children and adults with I/DD receiving HCBS.43 Depending on how they are structured, policies that would cap federal Medicaid funding could affect coverage, services, provider payment rates, and access to care for vulnerable populations.
At the other end of the policy spectrum, continued attention to Medicaid HCBS enrollment and spending is important to understanding proposals from some Democrats to create a single, federal, universal health insurance program known as Medicare-for-all. One of the most fundamental changes under Medicare-for-all would be uniform coverage of community-based long-term care services for all Americans. The current Medicare-for-all proposals would require and explicitly prioritize HCBS over institutional services, eliminating the state variation in eligibility, benefits, and payment and delivery systems that exists today under Medicaid, while also shifting responsibility for designing and implementing much of health policy from states to the federal government.44
While the economy, the litigation challenging the ACA, and the upcoming election all will have implications for Medicaid and HCBS, changing demographics also will result in increased pressure for states to meet the health and LTSS needs of a growing elderly population in the coming years. The number of adults age 65 and older is expected to more than double in size between 2014 and 2060, with the largest increase during this period (18 million) expected in this decade, from 2020 to 2030.45 With the aging of the baby boomers, one in five U.S. residents will be age 65 or older by 2030,46 and for the first time in U.S. history, older adults are projected to outnumber children by 2034.47 All of these factors make continued attention to Medicaid’s role in providing HCBS an important policy area to watch.
MaryBeth Musumeci and Priya Chidambaram are with KFF.Molly O’Malley Watts is with Watts Health Policy Consulting.
Appendix Table 1: Medicaid HCBS Enrollment, by State and Authority, FY 2018
Appendix Table 2: Medicaid HCBS Spending, by State and Authority, FY 2018
Appendix Table 3: Medicaid HCBS Spending Per Enrollee, by State and Authority, FY 2018
Appendix Table 4: Medicaid Section 1915 (c) HCBS Waiver Enrollment, by Target Population and State, FY 2018
Appendix Table 5: Medicaid Section 1915 (c) HCBS Waiver Spending, by Target Population and State, FY 2018
Appendix Table 6: Medicaid Section 1915 (c) HCBS Waiver Spending Per Enrollee, by Target Population and State, FY 2018
| Appendix Table 1: Medicaid HCBS Enrollment, By State and Authority, FY 2018 | ||||||
| State | State Plan Services | Waivers | ||||
| Home health | Personal care | Community First Choice | Section 1915 (i) | Section 1915 (c) | Section 1115 | |
| Alabama | 5,900 | 15,100 | ||||
| Alaska | 300 | 3,700 | 4,300 | |||
| Arizona | included in 1115 | 52,400 | ||||
| Arkansas | 5,000* | 13,700 | 15,500* | |||
| California | 37,500* | 273,800 | 228,200 | 55,800 | 149,500 | 474,300* |
| Colorado | 23,500 | 100 | 46,300* | |||
| Connecticut | 30,700 | 3,200 | 600 | 28,300 | ||
| Delaware | 14,000 | 400 | 1,200 | 6,900 | ||
| DC | 8,600* | 6,000* | 200* | 6,900* | ||
| Florida | 20,800 | 3,200 | 102,500 | |||
| Georgia | 6,200 | 42,600 | ||||
| Hawaii | included in 1115 | 2,900 | 8,500 | |||
| Idaho | 1,900 | 8,500 | 4,000 | 20,200 | ||
| Illinois | 14,400 | 161,600* | ||||
| Indiana | 16,300 | 4,700 | 49,100 | |||
| Iowa | 12,400 | 7,100 | 30,400* | |||
| Kansas | 3,300 | included in 1115 | 28,700 | |||
| Kentucky | 15,400 | 24,300* | ||||
| Louisiana | 6,600 | 14,200 | 20,600 | |||
| Maine | 1,900 | 3,300 | 7,500 | |||
| Maryland | 4,000 | 1,000 | 13,500 | 25,800 | ||
| Massachusetts | 52,200 | 45,000 | 30,600* | |||
| Michigan | 3,300 | 60,700 | 24,700 | |||
| Minnesota | 28,900 | 43,700 | 81,500 | |||
| Mississippi | 1,400 | 700 | 25,800 | |||
| Missouri | 4,100 | 65,600 | 33,900 | |||
| Montana | 600 | 500 | 3,400 | 5,700 | ||
| Nebraska | 200^ | 3,800 | 11,800 | |||
| Nevada | 1,300 | 10,300 | 200 | 5,700 | ||
| New Hampshire | 1,400* | 100* | 9,200 | |||
| New Jersey | 50,300 | 49,500 | 10,700* | 25,000 | ||
| New Mexico | 4,000 | included in 1115 | 5,100 | 28,000 | ||
| New York | 101,400* | 116,200* | NR | 98,000* | NR | |
| North Carolina | 9,900 | 44,700 | 25,300* | |||
| North Dakota | 1,100 | 1,300 | 5,800* | |||
| Ohio | 26,900 | 7,000 | 111,400 | |||
| Oklahoma | 3,600 | 3,800 | 26,200* | |||
| Oregon | 300 | 3,100 | 36,500 | 64,200* | ||
| Pennsylvania | 26,300 | 119,700 | ||||
| Rhode Island | 8,800 | 400 | 5,500 | |||
| South Carolina | 500 | 35,200* | ||||
| South Dakota | 11,200 | 1,600 | 5,900* | |||
| Tennessee | 11,200 | 7,800 | 17,500 | |||
| Texas | 11,600^ | 369,700 | 30,000 | 200 | 48,100 | 68,800 |
| Utah | 3,100 | 200 | 9,300 | |||
| Vermont | 3,700 | 1,400 | 10,600 | |||
| Virginia | 1,600 | 51,300* | ||||
| Washington | 4,600 | 1,200 | 77,900 | 64,500 | 1,000 | |
| West Virginia | 8,100 | 5,700 | 10,900 | |||
| Wisconsin | 5,900 | 17,900 | 89,900 | |||
| Wyoming | 400 | 5,300* | ||||
| U.S. TOTAL(51 states): | 616,800(51 states) | 1,173,900(34 states) | 392,700(8 states) | 81,000(11 states) | 1,806,600(48 states) | 698,500(12 states) |
| NOTES: Totals may not sum due to rounding. NR indicates state did not report data. Included in 1115 indicates that state was unable to report state plan services separately from Section 1115 waiver services. Blank cell indicates state does not elect option. Total HCBS enrollment across all authorities is not presented as individuals may receive services under more than one authority. *Data from year other than FY 2018, as noted in table endnotes. ^NE and TX home health data are fee-for-service only and exclude capitated managed care.SOURCE: KFF Medicaid HCBS Program Surveys, FY 2018. | ||||||
| Appendix Table 2: Medicaid HCBS Spending, By State and Authority, FY 2018 ($, in thousands) | |||||||
| State | State Plan Services | Waivers | Total HCBSSpending | ||||
| Home health | Personal care | Community First Choice | Section 1915 (i) | Section 1915 (c) | Section 1115 | ||
| Alabama | 30,700 | 437,500 | 468,200 | ||||
| Alaska | 1,400 | 61,900 | 265,100 | 328,400 | |||
| Arizona | included in 1115 | 1,544,700 | 1,544,700 | ||||
| Arkansas | 11,800* | 94,300 | 389,600* | 495,700 | |||
| California | 153,900* | 2,960,800 | 5,562,600 | 494,600 | 3,810,300 | 4,679,100* | 17,661,300 |
| Colorado | 345,800 | 1,200 | 903,700* | 1,250,700 | |||
| Connecticut | 203,700 | 85,300 | 6,100 | 1,358,600 | 1,653,700 | ||
| Delaware | 63,900 | 500 | 137,200 | 87,200 | 288,800 | ||
| DC | 229,500* | 254,000* | NR | 295,000* | 778,500 | ||
| Florida | 413,100 | 63,200 | 2,103,500 | 2,579,800 | |||
| Georgia | 4,700 | 1,212,900 | 1,217,600 | ||||
| Hawaii | included in 1115 | 135,600 | 104,200 | 239,800 | |||
| Idaho | 5,500 | 58,600 | 17,500* | 364,000 | 445,600 | ||
| Illinois | 73,400 | 1,285,500* | 1,358,900 | ||||
| Indiana | 115,800 | 10,600 | 1,083,500 | 1,209,900 | |||
| Iowa | 44,600 | 94,400 | 647,900 | 786,900 | |||
| Kansas | 7,300 | Included in 1115 | 1,198,300 | 1,205,600 | |||
| Kentucky | 30,500 | 805,100* | 835,600 | ||||
| Louisiana | 30,200 | 170,500 | 571,300 | 772,000 | |||
| Maine | 3,200 | 31,400 | 441,300 | 475,900 | |||
| Maryland | 2,900 | 7,300 | 300,400 | 1,145,200 | 1,455,800 | ||
| Massachusetts | 513,600 | 794,600 | 1,563,900* | 2,872,100 | |||
| Michigan | 3,900 | 328,200 | 789,200* | 1,121,300 | |||
| Minnesota | 67,800 | 1,017,200 | 2,911,800 | 3,996,800 | |||
| Mississippi | 1,600 | 7,600 | 400,800 | 410,000 | |||
| Missouri | 4,800 | 741,700 | 1,024,900 | 1,771,400 | |||
| Montana | 600 | 900 | 45,500 | 161,000 | 208,000 | ||
| Nebraska | 100^ | 15,400 | 365,700 | 381,200 | |||
| Nevada | 23,800 | 111,200 | 2,000 | 133,200 | 270,200 | ||
| New Hampshire | 6,500* | 4,300* | 315,700* | 326,500 | |||
| New Jersey | 61,400 | 557,900 | 605,000* | 183,000 | 1,407,300 | ||
| New Mexico | 12,000 | included in 1115 | 379,900 | 329,400 | 721,310 | ||
| New York | 2,306,700* | 3,274,500* | NR | 6,426,100* | NR | 12,007,300 | |
| North Carolina | 12,800 | 450,500 | 897,500* | 1,360,800 | |||
| North Dakota | 9,800 | 37,000 | 206,800* | 253,600 | |||
| Ohio | 216,700 | 3,200 | 2,871,200 | 3,091,100 | |||
| Oklahoma | 15,700 | 10,900 | 476,400* | 503,000 | |||
| Oregon | 300 | 7,100 | 673,700 | 100,700* | 781,800 | ||
| Pennsylvania | 30,200 | 6,023,100 | 6,053,300 | ||||
| Rhode Island | 115,400 | 6,300 | 71,800 | 193,500 | |||
| South Carolina | 4,200 | 657,700* | 661,900 | ||||
| South Dakota | 15,500 | 7,400 | 145,300* | 168,200 | |||
| Tennessee | 226,500 | 684,400 | 297,400 | 1,208,300 | |||
| Texas | 13,900^ | 3,637,700 | 550,300 | 4,400 | 1,946,400 | 1,245,100 | 7,397,800 |
| Utah | 21,000 | 800 | 357,600 | 379,400 | |||
| Vermont | 7,600 | 13,900 | 401,700 | 423,200 | |||
| Virginia | 1,900 | 1,684,800* | 1,686,700 | ||||
| Washington | 6,000 | 6,400 | 1,432,500 | 728,600 | 1,300 | 2,174,800 | |
| West Virginia | 9,400 | 69,400 | 406,300 | 485,100 | |||
| Wisconsin | 46,000 | 273,700 | 2,451,600 | 2,771,300 | |||
| Wyoming | 2,300 | 163,500* | 165,800 | ||||
| U.S. TOTAL: | 5,530,000(51 states) | 15,070,500(34 states) | 8,650,300(8 states) | 640,900(11 states) | 53,470,000(48 states) | 8,945,000(12 states) | 92,306,600 |
| NOTES: Totals may not sum due to rounding. NR indicates state did not report data. Included in 1115 indicates that state was unable to report state plan services separately from Section 1115 waiver services. Blank cell indicates state did not elect option. *Data from year other than FY 2018, as noted in table endnotes. ^NE and TX home health data are fee-for-service only and exclude capitated managed care.SOURCE: KFF Medicaid HCBS Program Surveys, FY 2018. | |||||||
| Appendix Table 3: Medicaid HCBS Spending Per Enrollee, By State and Authority, FY 2018 ($) | ||||||
| State | State Plan Services | Waivers | ||||
| Home health | Personal care | Community First Choice | Section 1915 (i) | Section 1915 (c) | Section 1115 | |
| Alabama | 5,200 | 29,000 | ||||
| Alaska | 4,500 | 16,900 | 61,100 | |||
| Arizona | included in 1115 | 29,500 | ||||
| Arkansas | 2,300* | 6,900 | 25,200* | |||
| California | 4,100* | 5,400 | 24,400 | 8,900 | 25,500 | 9,900* |
| Colorado | 14,700 | 11,100 | 19,500* | |||
| Connecticut | 6,600 | 26,600 | 9,800 | 48,100 | ||
| Delaware | 4,600 | 1,200 | 119,200 | 12,700 | ||
| DC | 26,800* | 42,000* | NR | 42,500* | ||
| Florida | 19,800 | 20,000 | 20,500 | |||
| Georgia | 800 | 28,500 | ||||
| Hawaii | included in 1115 | 47,400 | 12,200 | |||
| Idaho | 2,900 | 5,400 | 7,600* | 18,000 | ||
| Illinois | 5,100 | 8,000* | ||||
| Indiana | 7,100 | 2,200 | 22,000 | |||
| Iowa | 3,600 | 13,200 | 21,300* | |||
| Kansas | 2,200 | included in 1115 | 41,700 | |||
| Kentucky | 2,000 | 33,100* | ||||
| Louisiana | 4,500 | 12,000 | 27,700 | |||
| Maine | 1,700 | 9,500 | 59,200 | |||
| Maryland | 700 | 7,500 | 22,300 | 44,400 | ||
| Massachusetts | 9,800 | 17,600 | 51,100* | |||
| Michigan | 1,200 | 5,400 | 32,000* | |||
| Minnesota | 2,300 | 23,300 | 35,700 | |||
| Mississippi | 1,100 | 10,500 | 15,500 | |||
| Missouri | 1,200 | 11,300 | 30,300 | |||
| Montana | 1,000 | 1,800 | 13,200 | 28,200 | ||
| Nebraska | 300 | 4,000 | 31,100 | |||
| Nevada | 18,100 | 10,800 | 10,600 | 23,200 | ||
| New Hampshire | 4,700* | 35,200* | 34,300* | |||
| New Jersey | 1,200 | 11,300 | 56,500* | 7,300 | ||
| New Mexico | 3,000 | included in 1115 | 75,200 | 11,800 | ||
| New York | 22,700* | 28,200* | NR | 65,600* | NR | |
| North Carolina | 1,300 | 10,100 | 35,500* | |||
| North Dakota | 8,900 | 29,200 | 35,800* | |||
| Ohio | 8,100 | 500 | 25,800 | |||
| Oklahoma | 4,400 | 2,900 | 18,200* | |||
| Oregon | 1,000 | 2,300 | 18,500 | 1,600* | ||
| Pennsylvania | 1,200 | 50,300* | ||||
| Rhode Island | 13,100 | 15,200 | 13,000 | |||
| South Carolina | 7,900 | 18,700* | ||||
| South Dakota | 1,400 | 4,700 | 24,500* | |||
| Tennessee | 20,200 | 87,400 | 17,000 | |||
| Texas | 1,200 | 9,800 | 18,300 | 27,500 | 40,500 | 18,100 |
| Utah | 6,900 | 5,200 | 38,600 | |||
| Vermont | 2,100 | 9,700 | 37,900 | |||
| Virginia | 1,200 | 32,800* | ||||
| Washington | 1,300 | 5,300 | 18,400 | 11,300 | 1,300 | |
| West Virginia | 1,200 | 12,100 | 37,300 | |||
| Wisconsin | 7,800 | 15,300 | 27,300 | |||
| Wyoming | 5,900 | 30,900* | ||||
| U.S. TOTAL: | 9,000(51 states) | 12,800(34 states) | 22,000(8 states) | 7,900(11 states) | 29,600(48 states) | 12,800(12 states) |
| NOTES: Totals may not sum due to rounding. NR indicates state did not report data. Included in 1115 indicates that state was unable to report state plan services separately from Section 1115 waiver services. Blank cell indicates state did not elect option. *Data from year other than FY 2018, as noted in table endnotes.SOURCE: KFF Medicaid HCBS Program Surveys, FY 2018. | ||||||
| Appendix Table 4: Medicaid Section 1915 (c) HCBS Waiver Enrollment, by Target Population and by State, FY 2018 | |||||||||||
| State | Total No. of§ 1915 (c) Waivers | Enrollment by Target Population | Total | ||||||||
| I/DD | Seniors | Seniors & Adults with Physical Disabilities | Adults with Physical Disabilities | Med. Fragile/Tech Dep. Children | HIV/AIDS | Mental Health | TBI/SCI | ||||
| Alabama | 6 | 5,500 | 8,900 | 600 | 15,100 | ||||||
| Alaska | 4 | 2,200 | 2,000 | 200 | 4,300 | ||||||
| Arkansas | 4 | 4,500* | 11,000 | 15,500 | |||||||
| California | 7 | 129,100 | 10,500 | 4,600 | 3,800 | 300 | 1,200 | 149,500 | |||
| Colorado | 11 | 12,500* | 27,400* | 1,800* | 4,000* | 600* | 46,300 | ||||
| Connecticut | 11 | 10,200 | 15,300 | 1,100 | 300 | 800 | 600 | 28,300 | |||
| Delaware | 1 | 1,200 | 1,200 | ||||||||
| DC | 2 | 3,300* | 3,700* | 6,900 | |||||||
| Florida | 4 | 31,800 | 70,800 | < 50 | 102,500 | ||||||
| Georgia | 4 | 13,000 | 28,100 | 1,500 | 42,600 | ||||||
| Hawaii | 1 | 2,900 | 2,900 | ||||||||
| Idaho | 4 | 8,800 | 11,500 | 20,200 | |||||||
| Illinois | 9 | 22,800* | 84,700* | 10,800* | 36,100* | 900* | 1,500* | 4,900* | 161,600 | ||
| Indiana | 4 | 26,600 | 22,300 | 200 | 49,100 | ||||||
| Iowa | 7 | 12,600 | 12,600 | 2,800 | < 50 | 1,000 | 1,400 | 30,400 | |||
| Kansas | 7 | 9,600 | 6,000 | 6,700 | 600 | 5,300 | 500 | 28,700 | |||
| Kentucky | 6 | 14,800 | 9,000* | < 50 | 500 | 24,300 | |||||
| Louisiana | 7 | 12,100 | 5,900 | 2,600 | 20,600 | ||||||
| Maine | 5 | 5,300 | 1,900 | 200 | 7,500 | ||||||
| Maryland | 6 | 16,200 | 9,200 | 200 | 100 | 25,800 | |||||
| Massachusetts | 10 | 15,600* | 14,600* | 500* | 30,600 | ||||||
| Michigan | 4 | 8,700 | 15,300 | 700 | 24,700 | ||||||
| Minnesota | 5 | 19,900 | 30,300 | 29,400 | 600 | 1,300 | 81,500 | ||||
| Mississippi | 5 | 2,600 | 20,000 | 2,400 | 800 | 25,800 | |||||
| Missouri | 9 | 15,000 | 16,500 | 2,300 | 100 | 33,900 | |||||
| Montana | 4 | 2,700 | 2,600 | 400 | 5,700 | ||||||
| Nebraska | 5 | 4,900 | 6,900 | <50 | 11,800 | ||||||
| Nevada | 3 | 2,200 | 2,700 | 800 | 5,700 | ||||||
| New Hampshire | 4 | 5,100 | 3,900 | 300 | 9,200 | ||||||
| New Jersey | 1 | 10,700* | 10,700 | ||||||||
| New Mexico | 3 | 5,100 | 5,100 | ||||||||
| New York | 9 | 85,400* | 2,500* | 600* | 6,400 | 3,100* | 98,000 | ||||
| North Carolina | 3 | 12,500* | 10,000 | 2,900 | 25,300 | ||||||
| North Dakota | 6 | 5,500* | 300 | < 50 | < 50 | 5,800 | |||||
| Ohio | 7 | 40,200 | 64,600 | 6,600 | 111,400 | ||||||
| Oklahoma | 6 | 5,400* | 20,800 | 100* | 26,200 | ||||||
| Oregon | 6 | 22,500* | 41,400 | 300* | 64,200 | ||||||
| Pennsylvania | 10 | 40,300 | 44,700 | 33,800 | 1,000 | 119,700 | |||||
| South Carolina | 7 | 11,500 | 20,400* | 100* | 1,400 | 800* | 1,100 | 35,200 | |||
| South Dakota | 4 | 3,700* | 2,100 | 100* | 5,900 | ||||||
| Tennessee | 3 | 7,800 | 7,800 | ||||||||
| Texas | 6 | 39,600 | 6,200 | 2,300 | 48,100 | ||||||
| Utah | 8 | 5,500 | 600 | 2,300 | 100 | 700 | 100 | 9,300 | |||
| Virginia | 5 | 13,100 | 38,200* | 51,300 | |||||||
| Washington | 8 | 19,400 | 43,600 | 1,600 | 64,500 | ||||||
| West Virginia | 3 | 4,600 | 6,200 | 100 | 10,900 | ||||||
| Wisconsin | 6 | 28,800 | 61,100 | 89,900 | |||||||
| Wyoming | 5 | 2,600 | 2,500* | 100 | 200* | 5,300 | |||||
| TOTAL(48 states): | 265 | 785,800 (48 states) | 162,500 (8 states) | 667,000(37 states) | 128,200(16 states) | 17,100(18 states) | 3,600(5 states) | 25,100(11 states) | 17,500 (21 states) | 1,806,800 | |
| No Section 1915 (c) Waivers (3 states) | |||||||||||
| Arizona | |||||||||||
| Rhode Island | |||||||||||
| Vermont | |||||||||||
| NOTES: I/DD = intellectual and developmental disabilities. TBI = traumatic brain injury. SCI = spinal cord injury. Totals may not sum due to rounding. States may offer more than one Section 1915 (c) waiver per target population category. Programs with enrollment under 50 individuals are noted as < 50. Blank cell indicates state does not offer Section 1915 (c) waiver for that population. *Data from year other than FY 2018, as noted in table endnotes.SOURCE: KFF Medicaid HCBS Program Surveys, FY 2018. | |||||||||||
| Appendix Table 5: Medicaid Section 1915 (c) HCBS Waiver Spending, by Target Population and by State, FY 2018 ($, in thousands) | ||||||||||
| State | Total No. of § 1915 (c) Waivers | Spending by Target Population | Total | |||||||
| I/DD | Seniors | Seniors & Adults with Physical Disabilities | Adults with Physical Disabilities | Med. Fragile/Tech Dep. Children | HIV/AIDS | Mental Health | TBI/SCI | |||
| Alabama | 6 | 351,300 | 78,400 | 7,800 | 437,500 | |||||
| Alaska | 4 | 186,900 | 69,000 | 9,100 | 265,100 | |||||
| Arkansas | 4 | 240,100* | 149,500 | 389,600 | ||||||
| California | 7 | 3,474,900 | 39,800 | 108,900 | 175,400 | 2,600 | 8,700 | 3,810,300 | ||
| Colorado | 11 | 462,200* | 361,500* | 18,100* | 38,300* | 23,500* | 903,700 | |||
| Connecticut | 11 | 883,000 | 395,400 | 2,100 | 100 | 14,700 | 63,300 | 1,358,600 | ||
| Delaware | 1 | 137,200 | 137,200 | |||||||
| DC | 2 | 226,100* | 68,900* | 295,000 | ||||||
| Florida | 4 | 1,067,000 | 1,036,500 | < 50 | 2,103,500 | |||||
| Georgia | 4 | 639,200 | 493,300 | 80,400 | 1,212,900 | |||||
| Hawaii | 1 | 135,600 | 135,600 | |||||||
| Idaho | 4 | 266,900 | 97,000 | 364,000 | ||||||
| Illinois | 9 | 71,600* | 429,400* | 127,800* | 558,200* | 1,900* | 24,000* | 72,600* | 1,285,500 | |
| Indiana | 4 | 812,100 | 266,700 | 4,700 | 1,083,500 | |||||
| Iowa | 7 | 520,600* | 60,500* | 23,600* | 300* | 10,300 | 32,500 | 647,900 | ||
| Kansas | 7 | 523,400 | 210,900 | 304,300 | 55,900 | 79,000 | 24,900 | 1,198,300 | ||
| Kentucky | 6 | 670,900 | 86,100* | 2,600 | 45,600 | 805,100 | ||||
| Louisiana | 7 | 454,900 | 112,500 | 3,900 | 571,300 | |||||
| Maine | 5 | 385,100 | 40,000 | 16,100 | 441,300 | |||||
| Maryland | 6 | 994,900 | 135,400 | 2,700 | 12,200 | 1,145,200 | ||||
| Massachusetts | 10 | 1,301,200* | 211,900* | 50,900* | 1,563,900 | |||||
| Michigan | 4 | 444,600* | 339,900 | 4,700* | 789,200 | |||||
| Minnesota | 5 | 1,403,400 | 435,600 | 932,600 | 42,400 | 97,900 | 2,911,800 | |||
| Mississippi | 5 | 104,300 | 233,900 | 44,100 | 18,400 | 400,800 | ||||
| Missouri | 9 | 924,200 | 63,300 | 35,000 | 2,400 | 1,024,900 | ||||
| Montana | 4 | 113,600 | 42,000 | 5,400 | 161,000 | |||||
| Nebraska | 5 | 252,700 | 112,400 | 700 | 365,700 | |||||
| Nevada | 3 | 114,400 | 13,900 | 4,900 | 133,200 | |||||
| New Hampshire | 4 | 243,700* | 48,900 | 23,100 | 315,700 | |||||
| New Jersey | 1 | 605,000* | 605,000 | |||||||
| New Mexico | 3 | 379,900 | 379,900 | |||||||
| New York | 9 | 5,970,300* | 158,500* | 5,400* | 97,300 | 194,600* | 6,426,100 | |||
| North Carolina | 3 | 652,100* | 196,000 | 49,500 | 897,500 | |||||
| North Dakota | 6 | 199,500* | 6,900 | 200 | 100 | 206,800 | ||||
| Ohio | 7 | 1,968,100* | 777,500 | 125,600 | 2,871,200 | |||||
| Oklahoma | 6 | 305,900* | 165,900 | 4,600* | 476,400 | |||||
| Oregon | 6 | 58,500* | 41,600 | 600* | 100,700 | |||||
| Pennsylvania | 10 | 3,177,600 | 1,481,600 | 1,331,200 | 32,700 | 6,023,100 | ||||
| South Carolina | 7 | 423,300 | 192,200* | 1,800* | 3,300 | 4,700* | 32,600 | 657,700 | ||
| South Dakota | 4 | 121,000* | 20,600 | 3,700* | 145,300 | |||||
| Tennessee | 3 | 684,400 | 684,400 | |||||||
| Texas | 6 | 1,545,300 | 390,400 | 10,712 | 1,946,400 | |||||
| Utah | 8 | 275,400 | 7,200 | 50,900 | 2,600 | 14,900 | 6,600 | 357,600 | ||
| Virginia | 5 | 908,100 | 776,700* | 1,684,800 | ||||||
| Washington | 8 | 650,100 | 24,700 | 53,800 | 728,600 | |||||
| West Virginia | 3 | 305,400 | 99,400 | 1,500 | 406,300 | |||||
| Wisconsin | 6 | 632,800 | 1,818,800 | 2,451,600 | ||||||
| Wyoming | 5 | 118,100 | 37,400* | < 50 | 7,900* | 163,500 | ||||
| TOTAL(48 states): | 265 | 36,386,500 (48 states) | 1,592,700 (8 states) | 10,132,900 (37 states) | 3,629,900 (16 states) | 604,000(18 states) | 40,000(5 states) | 318,100 (11 states) | 765,900 (21 states) | 53,470,200 |
| No Section 1915 (c) Waivers (3 states) | ||||||||||
| Arizona | ||||||||||
| Rhode Island | ||||||||||
| Vermont | ||||||||||
| NOTES: I/DD = intellectual and developmental disabilities. TBI = traumatic brain injury. SCI = spinal cord injury. Totals may not sum due to rounding. States may offer more than one Section 1915 (c) waiver per target population category. Programs with enrollment under 50 individuals are noted as < 50. Blank cell indicates state does not offer Section 1915 (c) waiver for that population. *Data from year other than FY 2018, as noted in table endnotes.SOURCE: KFF Medicaid HCBS Program Surveys, FY 2018. | ||||||||||
| Appendix Table 6: Medicaid Section 1915 (c) HCBS Waiver Spending Per Enrollee, by Target Population and by State, FY 2018 ($) | ||||||||||
| State | Total No. of Waivers | Per Enrollee Spending by Target Population | Total | |||||||
| I/DD | Seniors | Seniors & Adults with Physical Disabilities | Adults with Physical Disabilities | Med. Fragile/Tech Dep. Children | HIV/AIDS | Mental Health | TBI/SCI | |||
| Alabama | 6 | 63,600 | 13,800 | 12,700 | 29,000 | |||||
| Alaska | 4 | 86,400 | 35,100 | 42,900 | 61,100 | |||||
| Arkansas | 4 | 53,500* | 13,600 | 25,200 | ||||||
| California | 7 | 26,900 | 3,800 | 23,600 | 45,800 | 8,900 | 7,200 | 25,500 | ||
| Colorado | 11 | 37,000* | 13,200* | 9,900* | 9,600* | 41,300* | 19,500 | |||
| Connecticut | 11 | 86,600 | 25,900 | 2,000 | 200 | 17,900 | 106,128 | 48,100 | ||
| Delaware | 1 | 119,200 | 119,200 | |||||||
| DC | 2 | 69,000* | 18,800* | 42,500 | ||||||
| Florida | 4 | 33,600 | 14,600 | 2,600 | 20,500 | |||||
| Georgia | 4 | 49,000 | 17,600 | 53,700 | 28,500 | |||||
| Hawaii | 1 | 47,400 | 47,400 | |||||||
| Idaho | 4 | 30,500 | 8,500 | 18,000 | ||||||
| Illinois | 9 | 3,100* | 5,100* | 11,900* | 15,500* | 2,300* | 15,800* | 14,800* | 8,000 | |
| Indiana | 4 | 30,500 | 12,000 | 24,700 | 22,000 | |||||
| Iowa | 7 | 41,400* | 4,800* | 8,300* | 9,600* | 10,600 | 22,700 | 21,300 | ||
| Kansas | 7 | 54,500 | 35,200 | 45,400 | 93,200 | 14,900 | 46,400 | 41,700 | ||
| Kentucky | 6 | 45,300 | 9,600* | 66,300 | 92,700 | 33,100 | ||||
| Louisiana | 7 | 37,500 | 19,100 | 1.500 | 27,700 | |||||
| Maine | 5 | 72,300 | 20,700 | 80,700 | 59,200 | |||||
| Maryland | 6 | 61,200 | 14,700 | 12,600 | 126,800 | 44,900 | ||||
| Massachusetts | 10 | 83,500* | 14,600* | 108,000* | 51,100 | |||||
| Michigan | 4 | 51,400* | 22,200 | 6,400* | 32,000 | |||||
| Minnesota | 5 | 70,600 | 14,400 | 31,700 | 69,700 | 76,100 | 35,700 | |||
| Mississippi | 5 | 40,200 | 11,700 | 18,200 | 22,500 | 15,500 | ||||
| Missouri | 9 | 61,800 | 3,800 | 15,100 | 31,300 | 30,300 | ||||
| Montana | 4 | 41,400 | 16,100 | 15,000 | 28,200 | |||||
| Nebraska | 5 | 51,800 | 16,400 | 33,400 | 31,100 | |||||
| Nevada | 3 | 51,100 | 5,200 | 5,900 | 23,200 | |||||
| New Hampshire | 4 | 47,900* | 12,700 | 88,600 | 34,300 | |||||
| New Jersey | 1 | 56,500* | 56,500 | |||||||
| New Mexico | 3 | 75,200 | 75,200 | |||||||
| New York | 9 | 69,900* | 63,000* | 9,000* | 15,300 | 62,100* | 65,600 | |||
| North Carolina | 3 | 52,300* | 19,700 | 17,100 | 35,500 | |||||
| North Dakota | 6 | 36,500* | 23,900 | 214,500 | 6,000 | 35,800 | ||||
| Ohio | 7 | 48,900 | 12,000 | 19,100 | 25,800 | |||||
| Oklahoma | 6 | 56,700* | 8,000 | 52,100* | 18,200 | |||||
| Oregon | 6 | 3,800* | 1,000 | 1,900* | 1,600 | |||||
| Pennsylvania | 10 | 78,900 | 33,200 | 39,400 | 33,900 | 50,300 | ||||
| South Carolina | 7 | 36,900 | 9,400* | 30,300* | 2,300 | 5,900* | 30,400 | 18,700 | ||
| South Dakota | 4 | 32,300* | 9,900 | 34,500* | 24,500 | |||||
| Tennessee | 3 | 87,400 | 87,400 | |||||||
| Texas | 6 | 39,000 | 63,500 | 4,600 | 40,500 | |||||
| Utah | 8 | 50,200 | 12,400 | 22,600 | 23,800 | 21,300 | 47,100 | 38,600 | ||
| Virginia | 5 | 69,300 | 20,300* | 32,800 | ||||||
| Washington | 8 | 33,500 | 600 | 33,700 | 11,300 | |||||
| West Virginia | 3 | 65,900 | 16,100 | 18,300 | 37,300 | |||||
| Wisconsin | 6 | 22,000 | 29,800 | 27,300 | ||||||
| Wyoming | 5 | 46,000 | 15,200* | 300 | 48,500* | 30,900 | ||||
| TOTAL(48 states): | 265 | 46,300 (48 states) | 9,800 (8 states) | 15,200(37 states) | 28,300(16 states) | 35,200(18 states) | 11,100(5 states) | 12,700 (11 states) | 43,700 (21 states) | 29,600 |
| No Section 1915 (c) Waivers (3 states) | ||||||||||
| Arizona | ||||||||||
| Rhode Island | ||||||||||
| Vermont | ||||||||||
| NOTES: I/DD = intellectual and developmental disabilities. TBI = traumatic brain injury. SCI = spinal cord injury. Totals may not sum due to rounding. States may offer more than one Section 1915 (c) waiver per target population category Programs with enrollment under 50 individuals are noted as < 50. Blank cell indicates state does not offer Section 1915 (c) waiver for that population. *Data from year other than FY 2018, as noted in table endnotes. SOURCE: KFF Medicaid HCBS Program Surveys, FY 2018. | ||||||||||
Arkansas: Home health data are from 2017. Wavier data are from 2015 (#936 I/DD).
California: Home health data are from 2016. Section 1115 waiver data are from 2015.
Colorado: Waiver data are from 2017 (#6 seniors/adults with physical disabilities, #7 I/DD, #268 mental health, #288 TBI/SCI, #293 I/DD, #305 I/DD, #450 children, #961 TBI/SCI, #4157 children, #4180 I/DD.)
District of Columbia: Home health, personal care, CFC, 1915 (i), and waiver data are from 2017.
Idaho: Section 1915 (i) spending and per enrollee spending data include only the adult DD program and exclude data for the children’s DD program. The state reported 1,700 children with DD enrolled in 2017, but did not report corresponding spending data.
Illinois: Waiver data are from 2015 (#143 seniors), 2016 (#278 children), and 2017 (#142 adults with physical disabilities, #202 HIV/AIDS, #326 seniors/adults with physical disabilities, #329 TBI/SCI, #350 I/DD, #464 I/DD, #473 I/DD).
Iowa: Waiver enrollment data are from 2016 (#345 adults with physical disabilities, #4111 adults with physical disabilities, #4155 seniors) and 2017 (#213 HIV/AIDS, #242 I/DD).
Kentucky: Waiver data are from 2017 (#144 seniors/adults with physical disabilities).
Massachusetts: Waiver data are from 2016 (#59 seniors/adults with physical disabilities) and 2017 (#359 TBI/SCI, #826 I/DD, #827 I/DD, #828 I/DD, #1027 seniors/adults with physical disabilities, #1028 seniors/adults with physical disabilities, #40207 I/DD, #40701 TBI/SCI, #40702 TBI/SCI).
Michigan: Waiver spending data are from 2016 (#167 I/DD, #438 mental health, #4119 I/DD).
New Hampshire: Home health and personal care data are from 2015. Waiver spending data are from 2016 (#397 I/DD).
New Jersey: Waiver data are from 2011 (#31 I/DD).
New York: Home health and personal care data are from 2017. Waiver data are from 2016 (#40176 children) and 2017 (#269 spending-only TBI/SCI, #444 spending-only seniors/adults with physical disabilities, #470 I/DD, and #471 children).
North Carolina: Waiver data are from 2016 (#432 I/DD).
North Dakota: Waiver data are from 2017 (#842 spending-only I/DD, #37 I/DD).
Oklahoma: Waiver data are from 2017 (#179 I/DD, #343 I/DD, #351 I/DD, #399 I/DD, #811 children).
Oregon: Waiver data are from 2017 (#117 I/DD, #375 I/DD, #565 children, #40193 children, #40194 I/DD).
South Carolina: Waiver data are from 2016 (#40181 adults with physical disabilities) and 2017 (#186 HIV/AIDS, #405 seniors/adults with physical disabilities).
South Dakota: Waiver data are from 2016 (#44 I/DD, #264 TBI/SCI, #338 I/DD).
Virginia: Waiver data are from 2017 (#321 seniors/adults with physical disabilities).
Wyoming: Waiver data are from 2017 (#236 seniors/adults with physical disabilities, #370 TBI/SCI).
The Trump Administration has issued guidance permitting state Medicaid programs to apply for waivers to institute work requirements as a condition of Medicaid eligibility, a departure from the program’s history. To date, 20 states have sought approval for such waivers, which remain controversial and face challenges in court.1 (For up to date information on state status of Medicaid work requirement waivers, see the Kaiser Medicaid Waiver Tracker.)
A separate KFF analysis of data on the general Medicaid population found that most (63%) non-dual, non-SSI, non-elderly Medicaid beneficiaries were already working and many others faced barriers to work that could make them exempt from the requirements.2 Additionally, large numbers of beneficiaries could face difficulties demonstrating that they were in compliance with or exempt from work requirements and as a result could lose coverage. For example, early state experience with work requirements has resulted in significant disenrollment from the state program, including among those who failed to demonstrate that they qualified for an exemption or were already fulfilling the requirement.3 ,4 In this data note, we assess the potential implications of work requirements for people with HIV, a population that relies heavily on Medicaid and for whom there are particularly important clinical and public health reasons for maintaining consistent access to insurance coverage and HIV care.
Medicaid is the largest source of insurance coverage for non-elderly adults with HIV, covering an estimated 42% of this group, about three times the rate of the adult population overall.5 The number of Medicaid beneficiaries with HIV has grown over time as people with HIV are living longer, new infections continue to occur, and as the program has expanded.6 Medicaid covers a broad range of services, many of which are important for people with and at risk for HIV, including prescription drugs, inpatient and outpatient care, and preventive services. Sustained engagement in care and treatment significantly reduces morbidity and mortality for people with HIV.7 Additionally, when someone with HIV has an undetectable viral load, typically achieved through antiretroviral treatment, HIV cannot be transmitted to others.8 As such, ensuring that people with HIV remain on coverage and engaged in care and treatment has critical clinical individual and public health benefits.
We analyzed data from the Centers for Disease Control and Prevention’s Medical Monitoring Project (MMP), a national surveillance system which reports representative estimates of characteristics among adults with diagnosed HIV. We assessed working status and other characteristics of those covered by Medicaid among adults with diagnosed HIV during the 2017 MMP data cycle, the most recent data available. We excluded beneficiaries receiving SSI (i.e., those who qualify for Medicaid through a disability pathway), those over age 65, and those dually eligible for Medicaid and Medicare as these populations are not included in work requirements under federal guidance.
Overall, we found that 44% of non-SSI, non-dual, nonelderly Medicaid adults with HIV are already working full or part-time.9
Most state waivers require individuals to work at least 80 hours per month (or 20 hours per week) to satisfy the work requirement.10 Using these criteria, we found that one-third (33%) of non-dual, non-SSI, nonelderly Medicaid beneficiaries with HIV were working at least 20 hours a week, thus likely meeting the work requirement. In addition, beneficiaries with a disability (beyond those already excluded due to SSI eligibility), those with care-giving responsibilities, and students have also been exempt from work requirements under most state waivers. Using these criteria, we found that another half (50%) of Medicaid beneficiaries with HIV would likely qualify for an exemption on the basis of disability, which we defined as having either a functional disability (e.g. difficulty climbing stairs, dressing oneself, etc.) or an AIDS (stage III HIV) diagnosis. Smaller shares would likely qualify for exemptions due care-giving responsibilities (4%) (defined as having a dependent under 18 in the home) or being a student (1%). This leaves 13% who could be targeted by Medicaid work requirement policies, if implemented nationwide and not otherwise exempt.
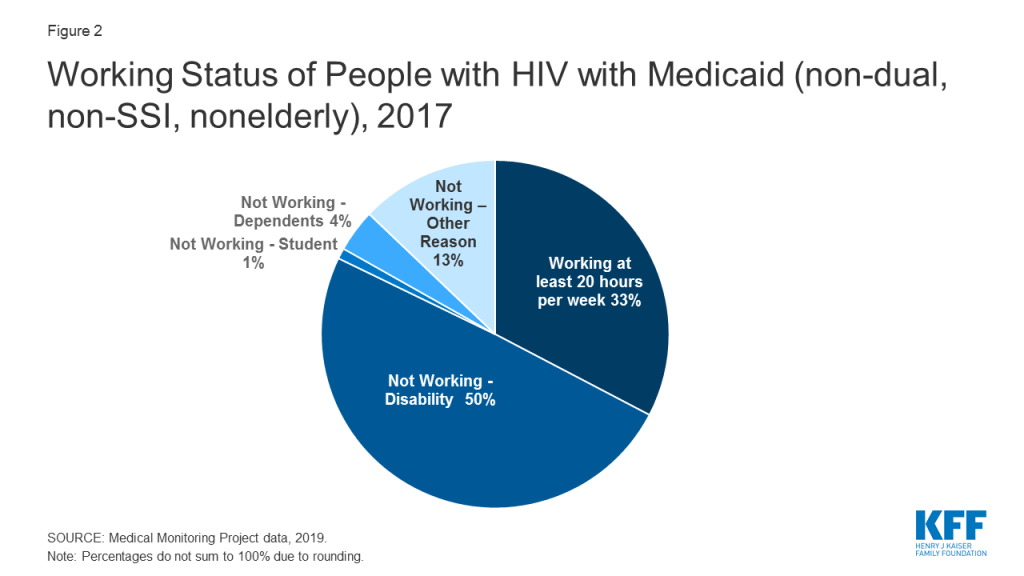
While most non-SSI non-dual adults nonelderly Medicaid beneficiaries with HIV would likely already meet work requirements or could qualify for an exemption because they face barriers to work, we find an estimated 13% could be targeted by such requirements, if rolled out nationwide (unless states add other protections for individuals with HIV, as some have done). To the extent that beneficiaries with HIV experience challenges in obtaining work, they could face disenrollment and, therefore, lose coverage. In addition, as studies have shown, the 87% of individuals who might already meet the requirement or could qualify for an exemption may find it difficult to document their compliance or verify their exempt status, which would also jeopardize their access to continuous coverage.11 ,12 While such challenges could affect Medicaid beneficiaries more generally, there are particular concerns in the case of a life threatening infectious disease such as HIV, where coverage interruptions and lapses could result in adverse health outcomes and increased HIV infections. Recognizing these challenges and their potential implications, three states (as of November 2019) have included specific exemptions for people with HIV under their definition of “medical fragility,” another required exemption category.13 However, most states have not done so and beneficiaries could still need to apply for and secure an exemption.
The future landscape in this area is uncertain. Currently, only one state (Michigan) is implementing its approved work requirement program while others have delayed implementation due to pending litigation. However, 10 states still have waivers pending. If additional states move ahead with implementation and more states receive approval from the federal government, it will be important to monitor how specific policies impact access to care and coverage for people with and at risk for HIV.
This analysis relies on data from the Medical Monitoring Project (MMP), a CDC surveillance system designed to produce nationally representative estimates of behavioral and clinical characteristics of adults (aged 18 and older) with diagnosed HIV in the United States. During 2017–2018, MMP employed a two-stage, complex sampling design. In the first stage, 16 states in the U.S. and Puerto Rico were sampled. During the second stage, simple random samples of adults (aged 18 years and older) with diagnosed HIV were sampled from the National HIV Surveillance System (NHSS), a census of US persons with diagnosed HIV.
Data used in this analysis were collected by the CDC via telephone or face-to-face interviews and medical record abstractions between June 1, 2017 and May 31, 2018. All sampled areas participated in MMP.3
In 2017, of 9,700 sampled persons, 4,222 participated. The overall adjusted response rate was 46%. Data were weighted based on known probabilities of selection at state or territory and participant levels. In addition, data were weighted to adjust for non-response using predictors of person-level response. Although characteristics associated with nonresponse varied among states and territories, the weighting classes for the national data were informed by sex at birth, MSM HIV exposure category, and the person’s frequency of receipt of care (as indicated by NHSS records). This analysis includes information on 820 participants who represent all non-elderly adults with diagnosed HIV and Medicaid coverage but without SSI or Medicare coverage in the United States and Puerto Rico. All data within this brief were self-reported.
The authors wish to thank Dr. Sharoda Dasgupta and Dr. Linda Beer of the CDC and Wen Zhou of ICF International, Inc., who were instrumental in this work in providing access to data, guidance, and conducting statistical analysis.
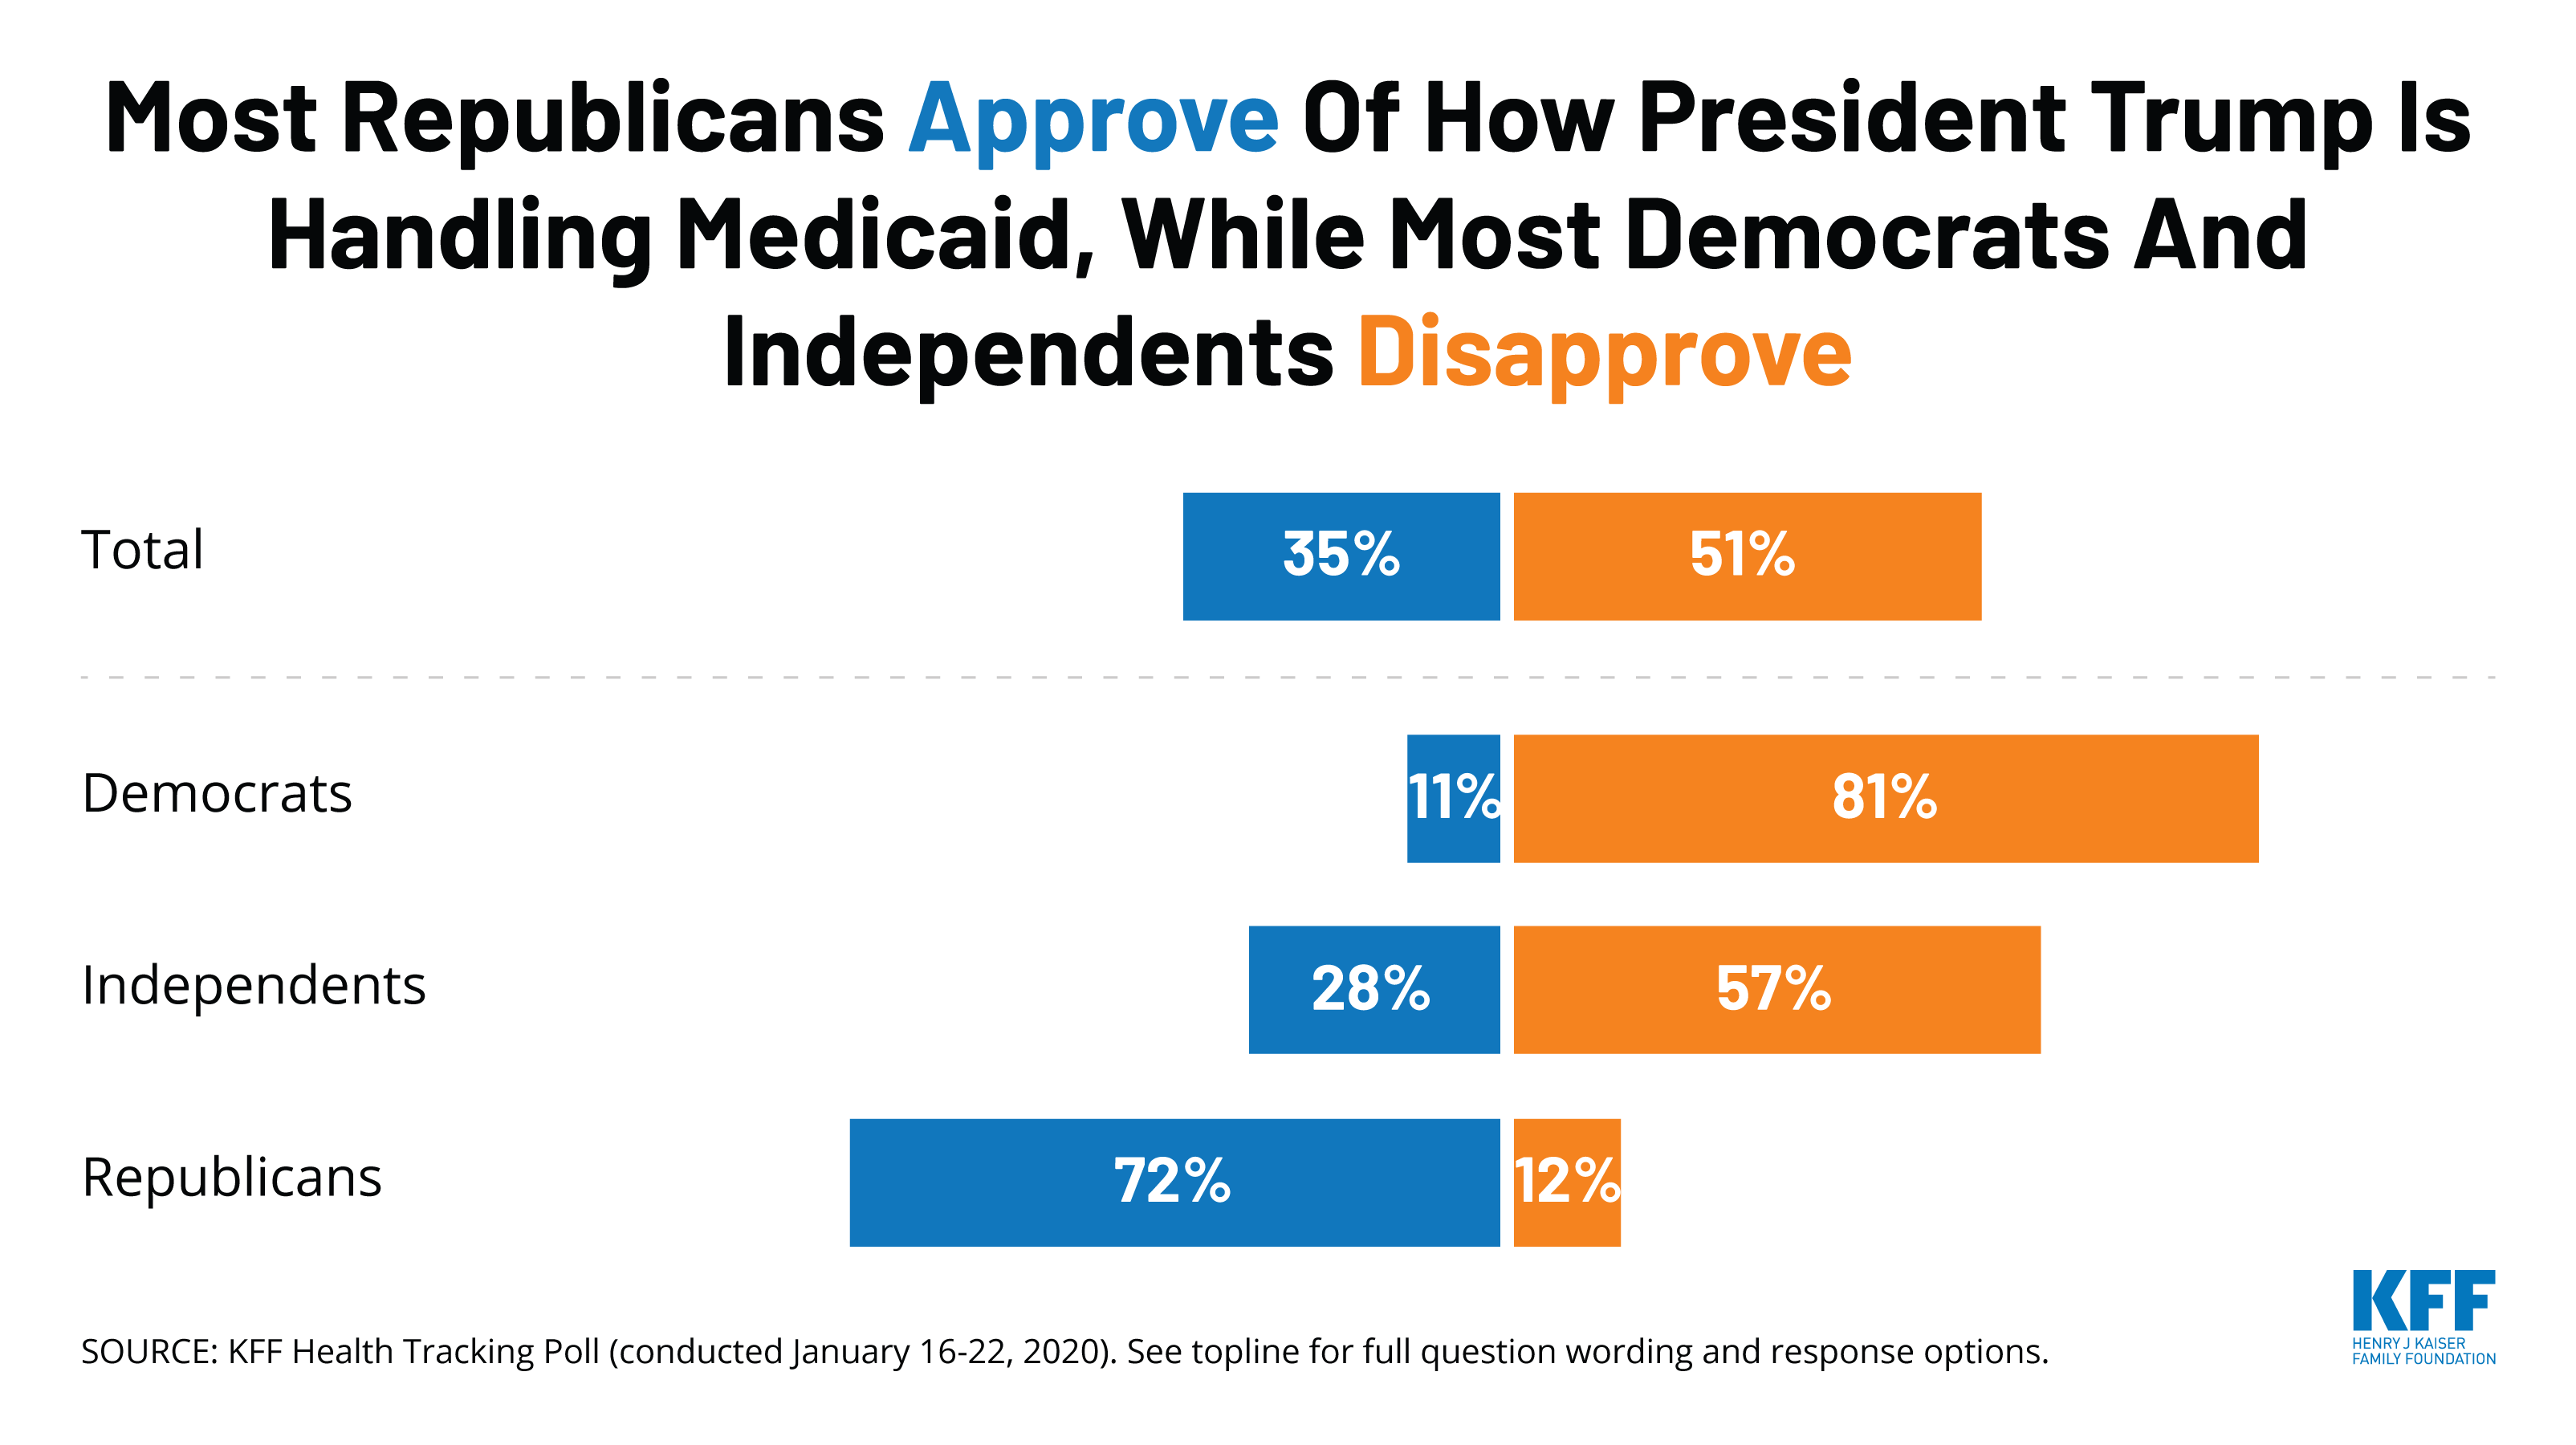
This month’s poll finds that majorities favor a national Medicare-for-all health plan (56%) and favor a “public option” (68%) in which a government-administered plan would compete with private health insurance and be available to all Americans.
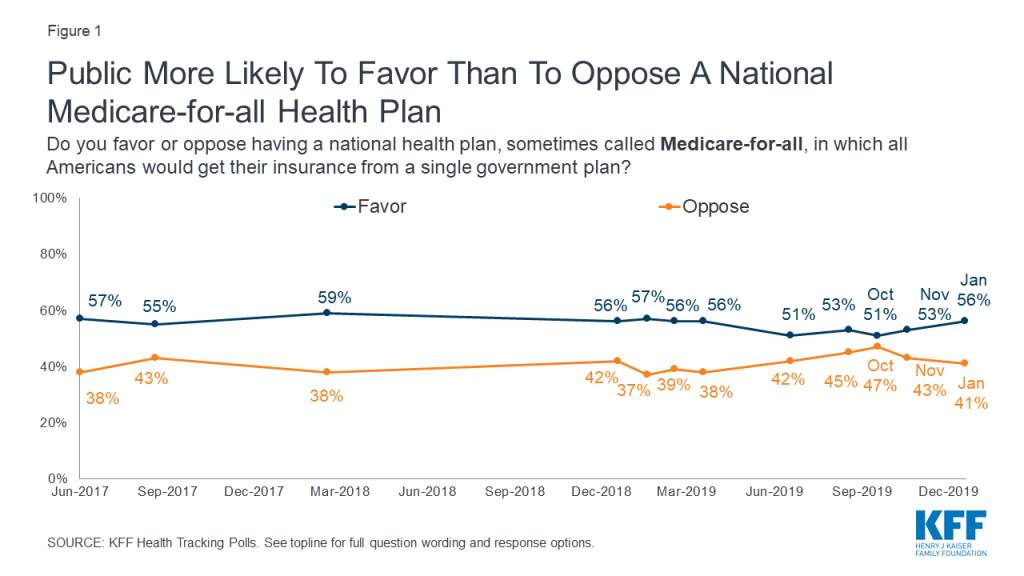
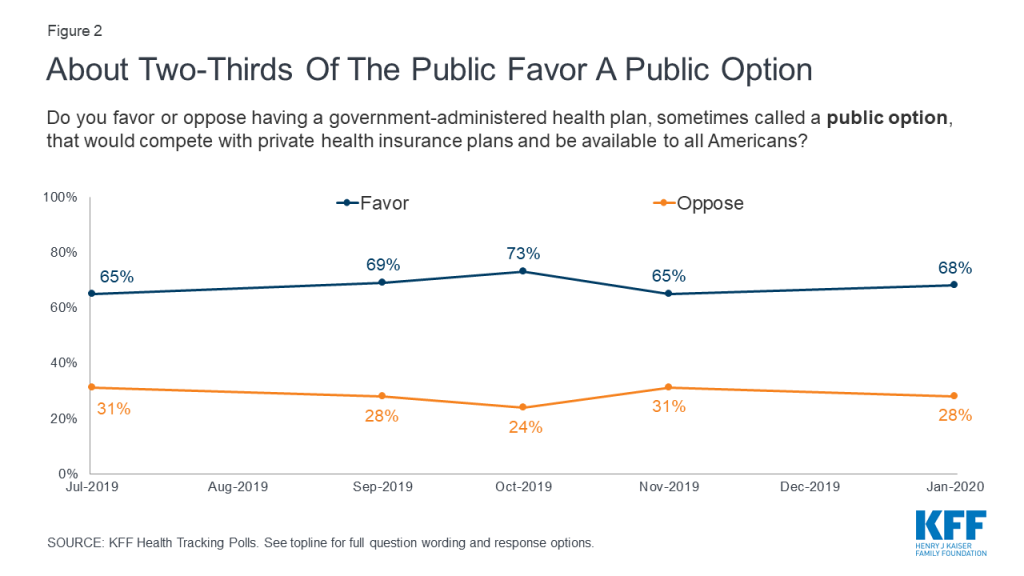
Though both proposed changes to the nation’s health care system have majority support, a public option that would compete with private health insurance plans continues to garner more support than the more sweeping change presented in a Medicare-for-all plan (Click here to see a side-by-side comparison of the competing proposals). Large majorities of Democrats favor both proposals (77% Medicare-for-all, 85% public option), as do majorities of independents (61% Medicare-for-all, 73% public option). Among Republicans, one in four (24%) support a national Medicare-for-all plan and four in ten (42%) favor a public option.
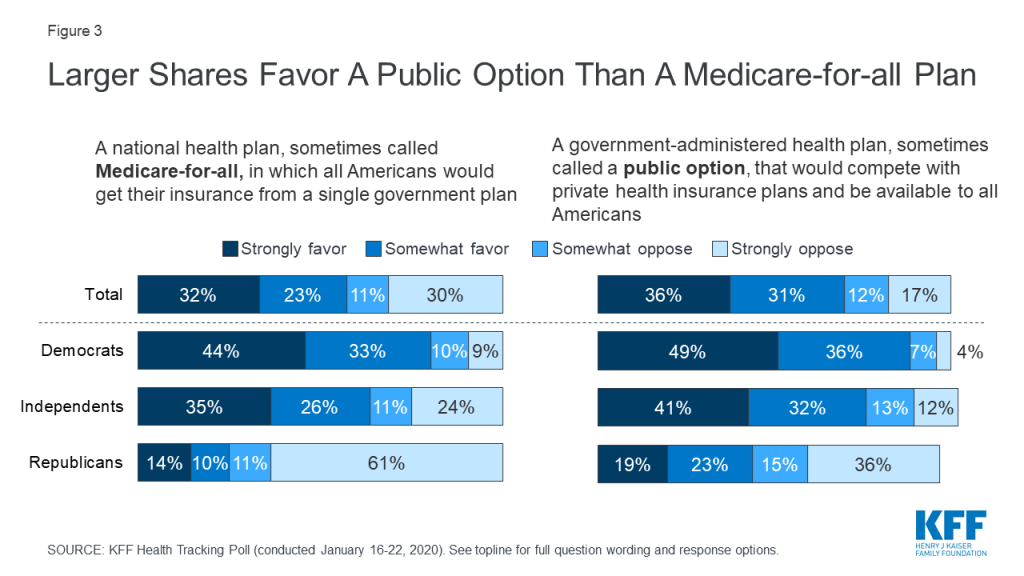
While both proposals aim to expand the role of the federal government in health care, the two plans are very different – which has been highlighted during the recent Democratic presidential primary debates. Yet, nearly half of adults (48%) favor both of these proposals while 22% oppose both. Few (6%) say they favor Medicare-for-all but oppose a public option while 17% favor a public option, but oppose Medicare-for-all.
When those who favor a public option but oppose Medicare-for-all are asked to explain their reasoning in their own words, the most common responses indicate that people like that a public option is not forced, but instead is an option that allows choice (32% of those who were asked, or 5% of the total public). Thirteen percent of those who were asked (2% of total) mentioned competition among private plans as the reason they support a public option but not Medicare-for-all. Smaller shares mention that it would allow people to keep their current plans, concerns about cost and increased taxes for a Medicare-for-all plan, or concerns about government involvement in health care (each named by 7% of those who were asked, or 1% of the total public).
Most Americans think the two major health care reform proposals being discussed by Democratic presidential candidates, as well as the 2010 Affordable Care Act, are all mostly intended to extend health care coverage to all Americans, rather than mostly intended to lower people’s health care costs. About two-thirds of Americans think Medicare-for-all (68%) is intended mostly to provide health care coverage to all Americans. Fewer, but still majorities, say the Affordable Care Act (59%) and a government-administered public option plan (58%) are intended mostly to provide coverage for all Americans rather than mostly intended to lower health care costs (26% and 29% respectively). For each of these health care reform proposals, majorities across partisans say they are intended mostly to provide coverage to all Americans.
Overall, the public does not perceive major differences in how a public option or a Medicare-for-all plan would impact taxes and personal health care costs. Eight in ten (81%) think taxes for most people would increase under a public option which is similar to the share who say taxes would increase under a Medicare-for-all plan (83%). In addition, majorities say people would continue to pay deductibles and co-pays when they use health care services under both a public option and a Medicare-for-all plan (68% and 61%, respectively). About half say individuals and employers would continue to pay premiums under both proposals (50% vs. 44%). However, there are some differences in perceptions of how the proposals would impact those with private health insurance coverage. Larger shares say people who buy their own coverage or get their coverage through their employer would be able to keep their current plans under a public option (59% and 60%), than say the same about a national Medicare-for-all plan (48% and 47%).
There has been some shift in the public’s perception of how things would or would not change under Medicare-for-all since the first Democratic presidential debate. Compared to six months ago, larger shares of adults now say that, under Medicare-for-all, people with employer-sponsored insurance would not be able to keep their current coverage (45% vs. 38% in June 2019) and people who purchase their own plans would not be able to keep their current coverage (44% vs. 39%). Additionally, larger shares now say that individuals and employers would not continue to pay health insurance premiums (50% vs. 39%) and that people would not continue to pay deductibles and co-pays when they use health care services (33% vs. 27%).
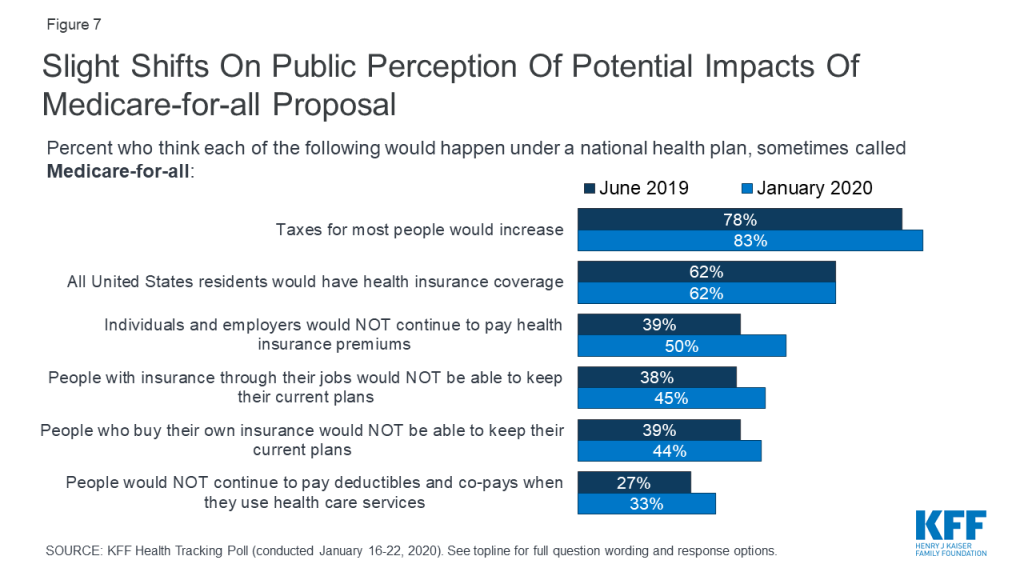
Democrats, in particular, are now more likely to be familiar with some of the potential impacts of a Medicare-for-all plan than they were in the June 2019 Tracking Poll. With the Democratic presidential primary campaign featuring extensive debates over Medicare-for-all, Democrats are now more likely than they were six months ago to say that under a Medicare-for-all plan individuals and employers would not continue to pay health insurance premiums (53% vs. 31%). Similarly, compared to six months ago, Democrats are now more likely to say that under Medicare-for-all people with employer-sponsored insurance would not be able to keep their current health plans (41% vs. 25% in June 2019), that people who purchase their own insurance would not be able to keep their current plans (40% vs. 24%), and that people would not continue to pay deductibles and co-pays when they use health care services (36% vs. 25%).
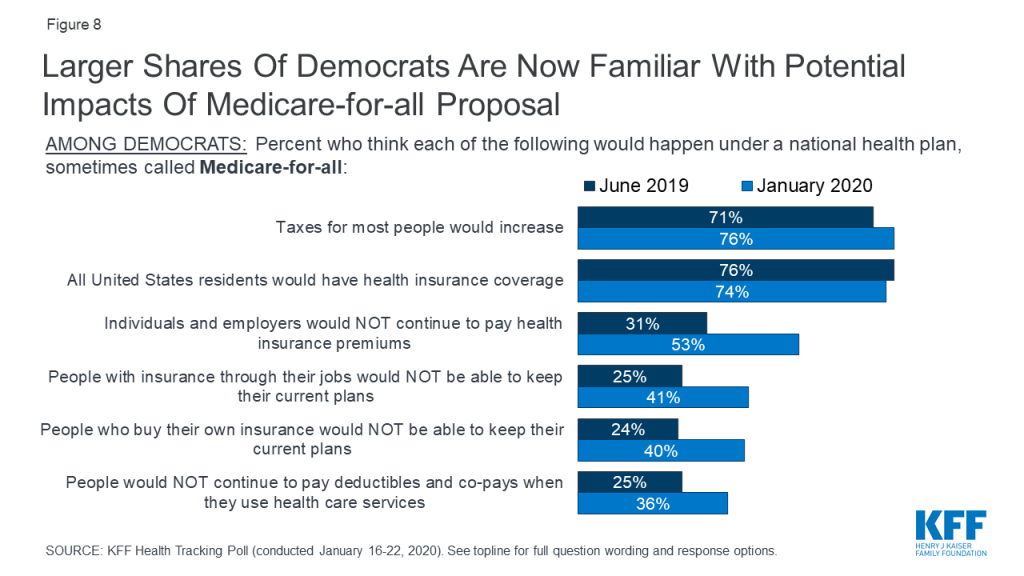
When asked about a list of potential health care priorities for Congress to address, majorities say it is at least very important that Congress work on lowering prescription drug costs for as many Americans as possible (87%), making sure the ACA’s protections for people with pre-existing health conditions continue (83%), protecting people with health insurance from surprise high out-of-network medical bills (80%), doing more to address the heroin and opioid addition epidemic (75%) and to work on addressing the rise of vaping and e-cigarette use among teenagers (61%).
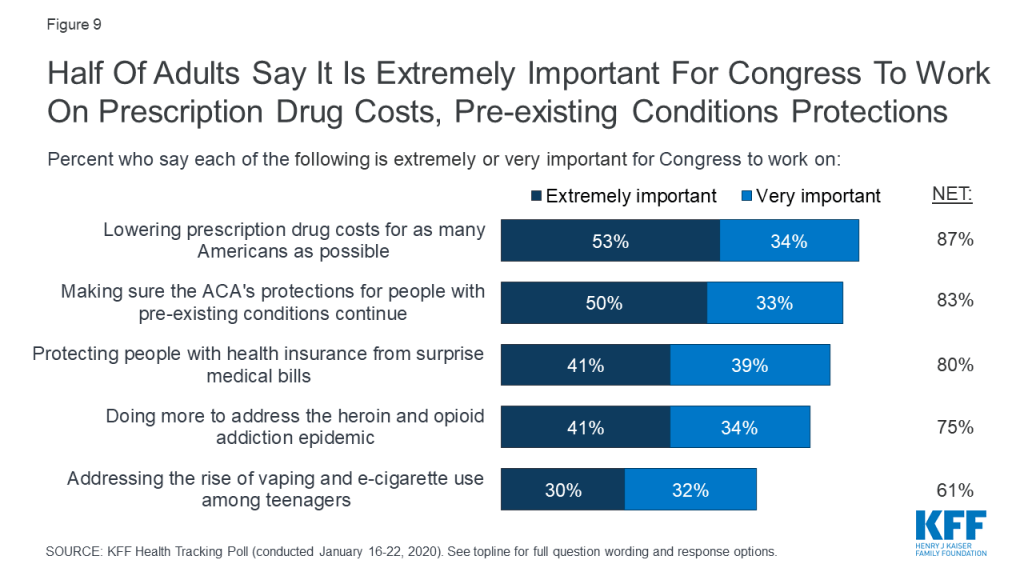
When asked to choose their top health care priority, lowering prescription drug costs (22%) and continuing the ACA’s pre-existing condition protections (19%) top the list of most important priorities for Congress to work on. About one-fifth (21%) said none of these health care issues were extremely important for Congress to work on. Notably, lowering prescription drug cost and continuing the ACA’s pre-existing condition protections were also the public’s top health care priorities for Congress one year ago.
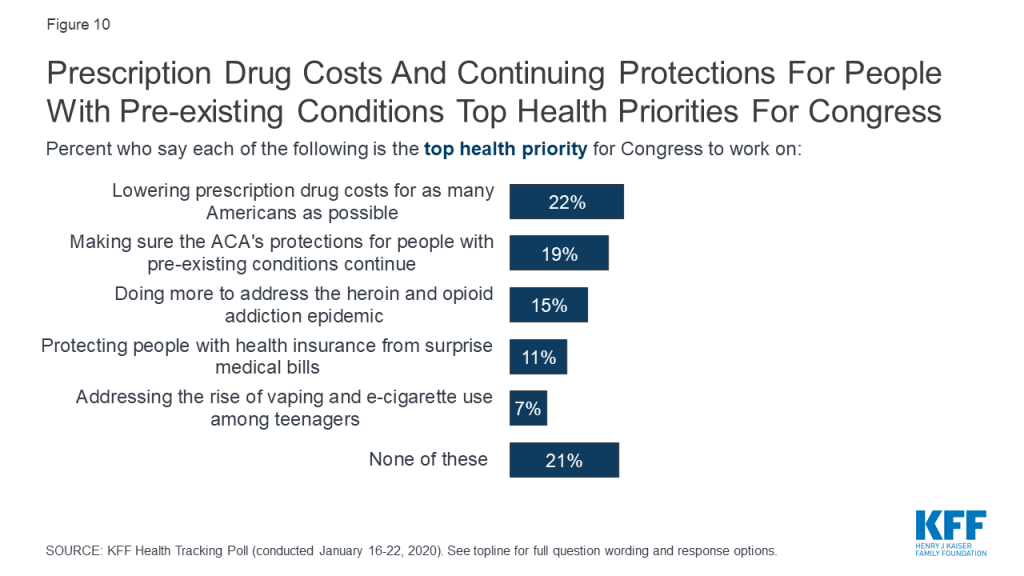
Lowering the cost of prescription drugs is the only health care priority that tops the list for Democrats (26%), independents (21%) and Republicans (19%). While making sure the ACA’s pre-existing condition protections continue is among the top priorities for Democrats (31%) and independents (19%), it ranks lower among Republicans (10%). Independents and Republicans are about twice as likely as Democrats to say doing more to address the opioid epidemic is their top priority for Congress of the health care issues presented.
| Table 1: Pre-Existing Condition Protections and Prescription Drug Costs Top Public’s Health Care Priorities for Congress | |||
| Percent who say the following is the top priority for Congress to work on: | Democrats | Independents | Republicans |
| Lowering prescription drug costs for as many Americans as possible | 26% | 21% | 19% |
| Making sure the ACA’s pre-existing condition protections continue | 31 | 19 | 10 |
| Doing more to address the heroin and opioid addiction epidemic | 8 | 18 | 19 |
| Protecting people from surprise high out-of-network medical bills | 11 | 11 | 10 |
| Addressing the rise of vaping and e-cigarette use among teenagers | 4 | 9 | 7 |
| NOTE: If more than one priority was chosen as “extremely important,” respondent was asked to choose which priority was the “most important.” | |||
In December 2019, the U.S. House of Representatives passed a bill that would require the government to negotiate the prices of a minimum of 25 Medicare Part D drugs annually and would cap out-of-pocket drug costs for Medicare beneficiaries.1 The House bill aimed at addressing drug costs would also provide dental, vision, and hearing benefits to older adults on Medicare. Two in ten adults are aware that the House has passed legislation to address the cost of prescription drugs and that the House passed legislation to address these additional benefits (21% each).
Though there was an effort by House Democrats to pass legislation to address surprise medical bills, ultimately, the House did not pass legislation to address this issue last year. A majority of the public (56%) are aware that the House had not passed legislation to address surprise medical bills while 14% say the House has indeed passed a bill and 29% say they “don’t know.”
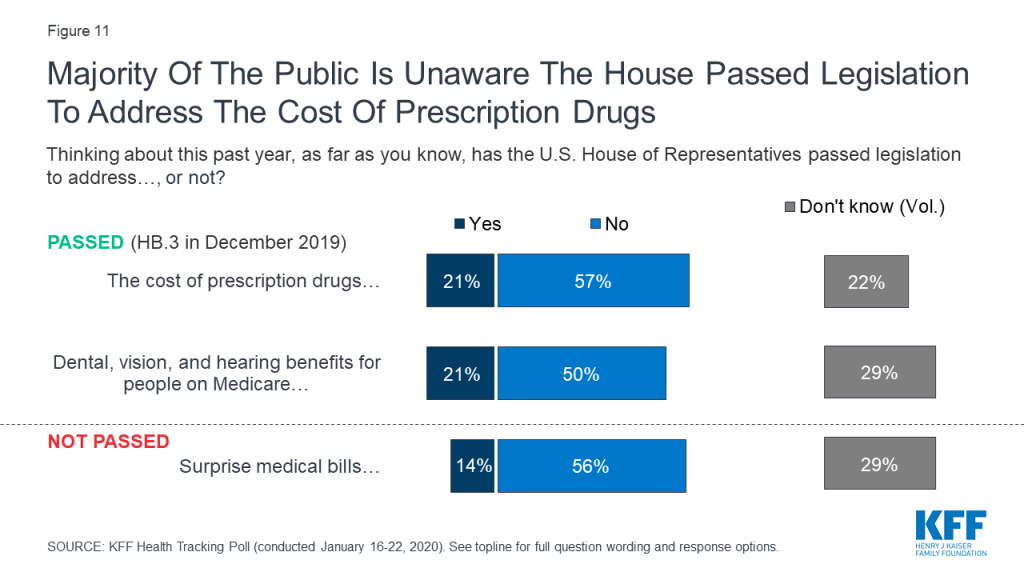
The latest KFF poll finds about four in ten adults (42%) approve of the way President Trump is handling his job as president, while a slight majority (56%) disapprove.
The President’s net overall job approval (measured as the share who approve minus the share who disapprove) among adults stands at -14 percentage points, and his net approval is also negative when it comes to handling various health care programs and issues. Among health issues, President Trump receives his lowest net approval ratings on his handling of the cost of prescription drugs (-24 percentage points) and on his handling of the Affordable Care Act (-21 percentage points), whereas his net approval on his handling of Medicare is somewhat higher at -10 percentage points. While President Trump receives his lowest net approval rating on his handling of prescription drug costs, KFF’s November 2019 tracking poll found that one-fourth of adults (26%) – including just one in four Democrats and independents and just three in ten Republicans – think it is likely that legislation to lower the costs of prescription drugs will pass this year.
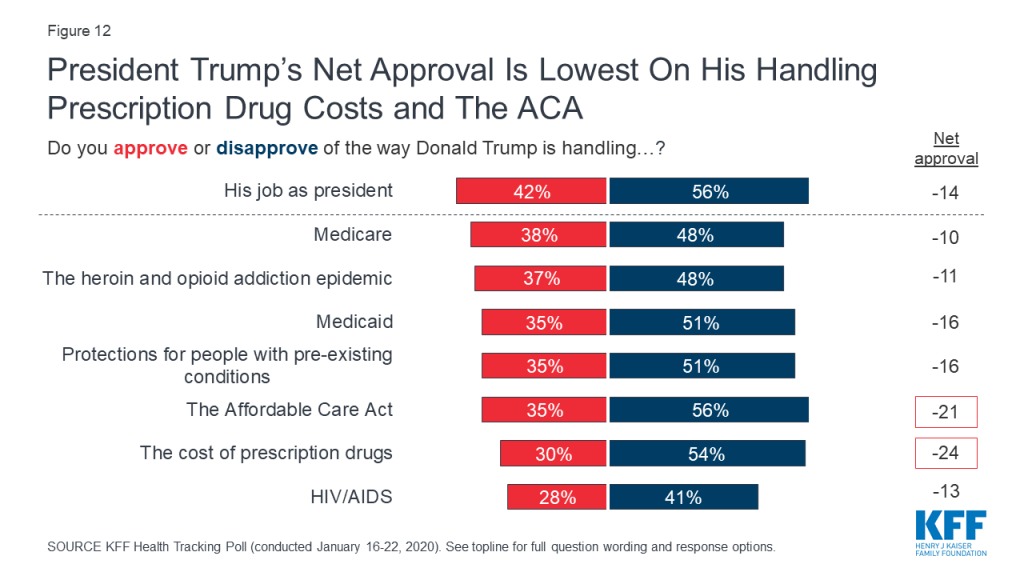
There are stark partisan differences in President Trump’s approval ratings on various health care programs and issues. Democrats and independents give the President negative net approval ratings on all the health care issues asked. However, the President’s position with his base appears strong when it comes to his handling of health care issues, as Republicans give the President positive net approval ratings on each of the health care programs and issues included in the poll.
| Table 2: Republicans Give Positive Ratings On Health Issues to the President While Democrats and Independents Give President Trump Negative Net Approval Ratings | ||||
| Net approval for President Trump’s handling of: | Total | Democrats | Independents | Republicans |
| His job as president | -14 | -85 | -24 | +85 |
| Medicare | -10 | -64 | -25 | +68 |
| Medicaid | -16 | -70 | -29 | +60 |
| HIV/AIDS | -13 | -59 | -25 | +48 |
| Protections for people with pre-existing conditions | -16 | -70 | -32 | +63 |
| The heroin and opioid addition epidemic | -11 | -57 | -23 | +57 |
| The Affordable Care Act | -21 | -74 | -36 | +56 |
| The cost of prescription drugs | -24 | -68 | -35 | +44 |
Overall opinions of the Affordable Care Act (ACA) have continued relatively unchanged for the past two years since the Republican efforts to repeal the 2010 health care law. Half of the public (53%) this month hold favorable opinions of the ACA while 37% hold a negative opinion of the law. Partisans remain divided on the ACA as eight in ten Democrats (84%) have a favorable view of the ACA compared to a slight majority of independents (55%) and about one in five Republicans (19%).
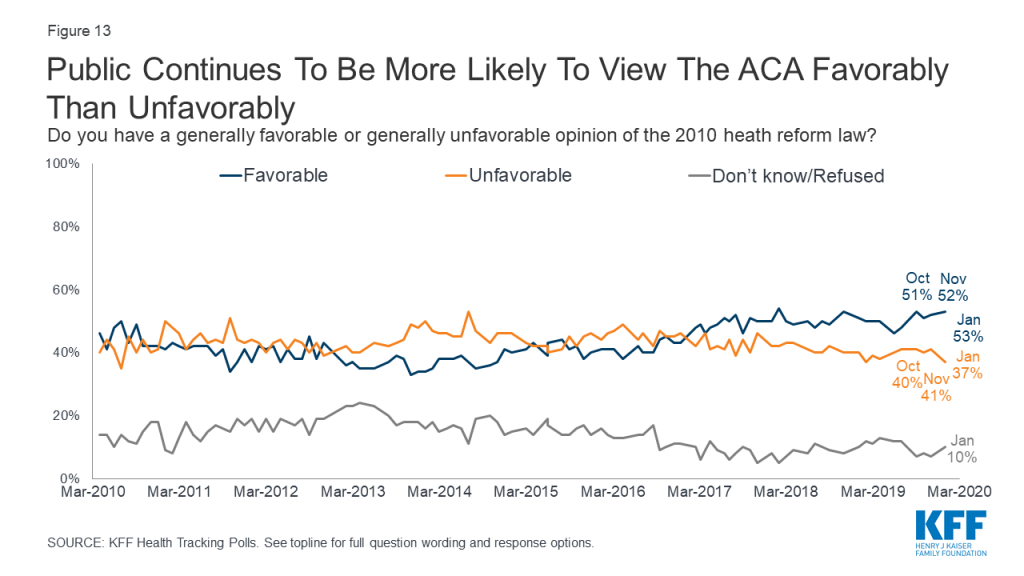
In December 2019, the U.S. Court of Appeals for the 5th Circuit in Texas issued a ruling siding with a lower court judge’s decision that the Affordable Care Act’s individual mandate is unconstitutional since Congress zeroed out the penalty for not having health insurance. The case was sent back to the lower court to decide how much of the ACA should be allowed to stand and many expect it to make its way to the U.S. Supreme Court.2 While about two-thirds (64%) of the public say they have heard at least “a little” about this ongoing case, just one in ten (9%) say they have heard “a lot.”
Recent KFF polling has found that a majority of the public do not want to see the Supreme Court overturn the ACA’s pre-existing condition protections; however, they are more divided on whether they want the Supreme Court to overturn the entire law. The January 2020 poll finds that a majority of adults say they are “very” or “somewhat” worried that they or someone in their family will lose health insurance coverage in the future if the Supreme Court eventually overturns either the ACA’s protections for people with pre-existing conditions (57%) or the entire health care law (58%). There are some notable differences across partisans with majorities of Democrats and independents saying they are at least somewhat worried that they or someone in their family will lose coverage if the Supreme Court overturns the ACA’s protections for people with pre-existing conditions (77% and 59% respectively) or the entire health care law (84% and 58% respectively), while majorities of Republicans say they are “not too worried” or “not at all worried” about the loss of coverage if the ACA’s protections pre-existing conditions (63%) or the entire health care law are overturned (70%).
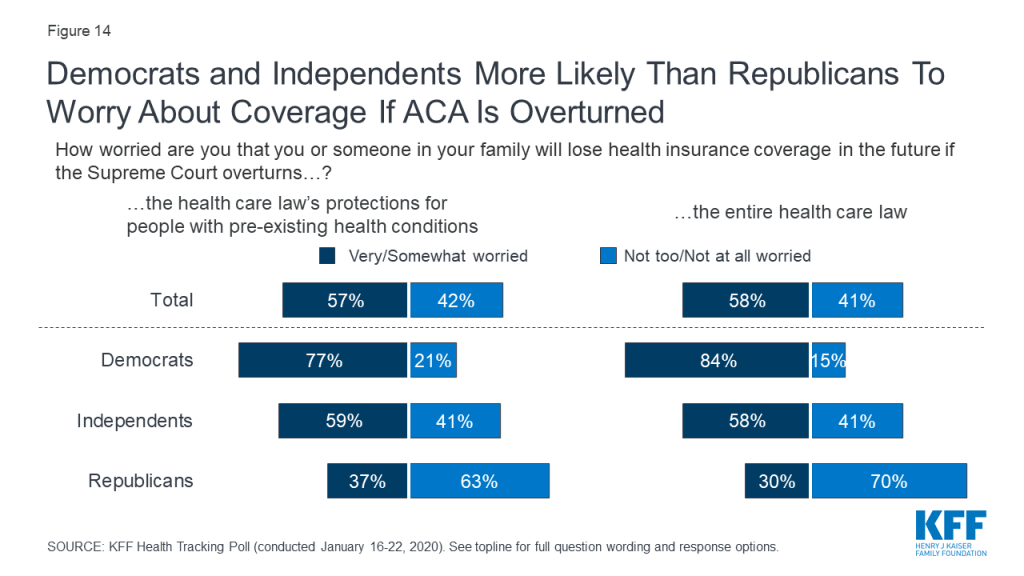
This KFF Health Tracking Poll was designed and analyzed by public opinion researchers at the Kaiser Family Foundation (KFF). The survey was conducted January 16th -22nd, 2020, among a nationally representative random digit dial telephone sample of 1,212 adults ages 18 and older, living in the United States, including Alaska and Hawaii (note: persons without a telephone could not be included in the random selection process). The sample included 290 respondents reached by calling back respondents that had previously completed an interview on the KFF Tracking poll at least nine months ago. Computer-assisted telephone interviews conducted by landline (303) and cell phone (909, including 616 who had no landline telephone) were carried out in English and Spanish by SSRS of Glen Mills, PA. To efficiently obtain a sample of lower-income and non-White respondents, the sample also included an oversample of prepaid (pay-as-you-go) telephone numbers (25% of the cell phone sample consisted of prepaid numbers) as well as a subsample of respondents who had previously completed Spanish language interviews on the SSRS Omnibus poll (n=14). Both the random digit dial landline and cell phone samples were provided by Marketing Systems Group (MSG). For the landline sample, respondents were selected by asking for the youngest adult male or female currently at home based on a random rotation. If no one of that gender was available, interviewers asked to speak with the youngest adult of the opposite gender. For the cell phone sample, interviews were conducted with the adult who answered the phone. KFF paid for all costs associated with the survey.
The combined landline and cell phone sample was weighted to balance the sample demographics to match estimates for the national population using data from the Census Bureau’s 2018 American Community Survey (ACS) on sex, age, education, race, Hispanic origin, and region along with data from the 2010 Census on population density. The sample was also weighted to match current patterns of telephone use using data from the July-December 2018 National Health Interview Survey. The weight takes into account the fact that respondents with both a landline and cell phone have a higher probability of selection in the combined sample and also adjusts for the household size for the landline sample, and design modifications, namely, the oversampling of prepaid cell phones and likelihood of non-response for the re-contacted sample. All statistical tests of significance account for the effect of weighting.
The margin of sampling error including the design effect for the full sample is plus or minus 3 percentage points. Numbers of respondents and margins of sampling error for key subgroups are shown in the table below. For results based on other subgroups, the margin of sampling error may be higher. Sample sizes and margins of sampling error for other subgroups are available by request. Note that sampling error is only one of many potential sources of error in this or any other public opinion poll. Kaiser Family Foundation public opinion and survey research is a charter member of the Transparency Initiative of the American Association for Public Opinion Research.
| Group | N (unweighted) | M.O.S.E. |
| Total | 1,212 | ±3 percentage points |
| Party Identification | ||
| Democrats | 391 | ±6 percentage points |
| Republicans | 332 | ±6 percentage points |
| Independents | 394 | ±6 percentage points |
With the first votes of the 2020 Democratic presidential primary season approaching, large majorities of Democrats – and most of the public overall – support both of the major approaches primary candidates have put forward to expand coverage and make health care more affordable, though a public option remains significantly more popular than Medicare-for-all, the latest KFF Health Tracking Poll finds.
A “public option”, in which a government-administered health plan would compete with private health insurance and be available to all Americans, garners support from 85% of Democrats and 68% of Americans overall. Smaller majorities favor a national Medicare-for-all health plan (77% of Democrats and 56% of Americans overall).
Most independents also favor both approaches (73% public option, 61% Medicare-for-all). While most Republicans oppose both, 42% support a public option.
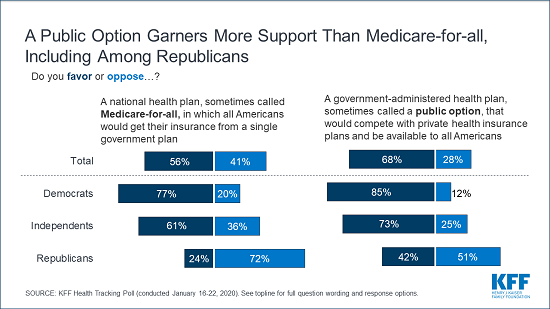
“After months of debate, Democratic voters support both a public option and Medicare-for-all, but more independents and Republicans are open to the public option,” KFF President and CEO Drew Altman said. “That support could become important in the general election and beyond.”
Large majorities think that taxes for most people would increase under both a Medicare-for-all plan (83%) and a public option (81%). People are more likely to say that all Americans would have health coverage under Medicare-for-all (62%) than under a public option (53%), while larger shares expect people with employer-sponsored coverage or who buy their own insurance to be able to keep their plans under a public option than under Medicare-for-all.
Following six months of news coverage of the Democratic presidential debates and campaign, the poll finds that the public – especially Democrats – are more aware of the potential impacts of Medicare-for-all now than they were in June.
Democrats are now more likely to say that individuals and employers would not continue to pay health insurance premiums under Medicare-for-all (53% now vs. 31% in June), and that people would not face deductibles or other cost sharing (36% vs. 25%). Similarly, Democrats are now more likely to say that under Medicare-for-all people with employer-sponsored insurance would not be able to keep their current plans (41% vs. 25%) and that people who purchase their own plans would not be able to keep their current coverage (40% vs. 24%).
On Drug Prices, President Trump Garners Low Marks from the Public, But Base Remains Supportive
Recent news reports suggest President Trump has raised concerns about polling showing higher marks for Democrats than for him on health care issues, including his efforts to lower prescription drug prices. The new poll finds his job approval on addressing drug costs (30% approve) lags his overall job approval (42% approve).
While polls generally show President Trump gets his highest marks for handling of the economy, the poll finds the public gives him lower-than-average approval numbers on most health issues, including the Affordable Care Act, protecting people with pre-existing conditions, and Medicaid (35% approve of each).
Majorities of Republicans approve of President Trump’s performance on health care issues – while Democrats overwhelmingly disapprove. Independents are more likely to disapprove than approve overall and on each health care issue.
Lowering Drug Costs, Pre-Existing Condition Protection Top Health Priorities for Congress
“It’s becoming abundantly clear that the high price of prescription drugs is the top health care priority that the public, across the political spectrum, wants Congress to take on,” said Mollyann Brodie, a KFF executive vice president and executive director of public opinion and survey research.
Other findings include:
Designed and analyzed by public opinion researchers at KFF, the poll was conducted January 16-22, 2020 among a nationally representative random digit dial telephone sample of 1,212 adults. Interviews were conducted in English and Spanish by landline (303) and cell phone (909). The margin of sampling error is plus or minus 3 percentage points for the full sample. For results based on subgroups, the margin of sampling error may be higher.