KFF designs, conducts and analyzes original public opinion and survey research on Americans’ attitudes, knowledge, and experiences with the health care system to help amplify the public’s voice in major national debates.
States Have Made Progress in Vaccinating Older Adults Against COVID-19 in Recent Weeks, But No State Has Vaccinated At Least Half of its Older Population
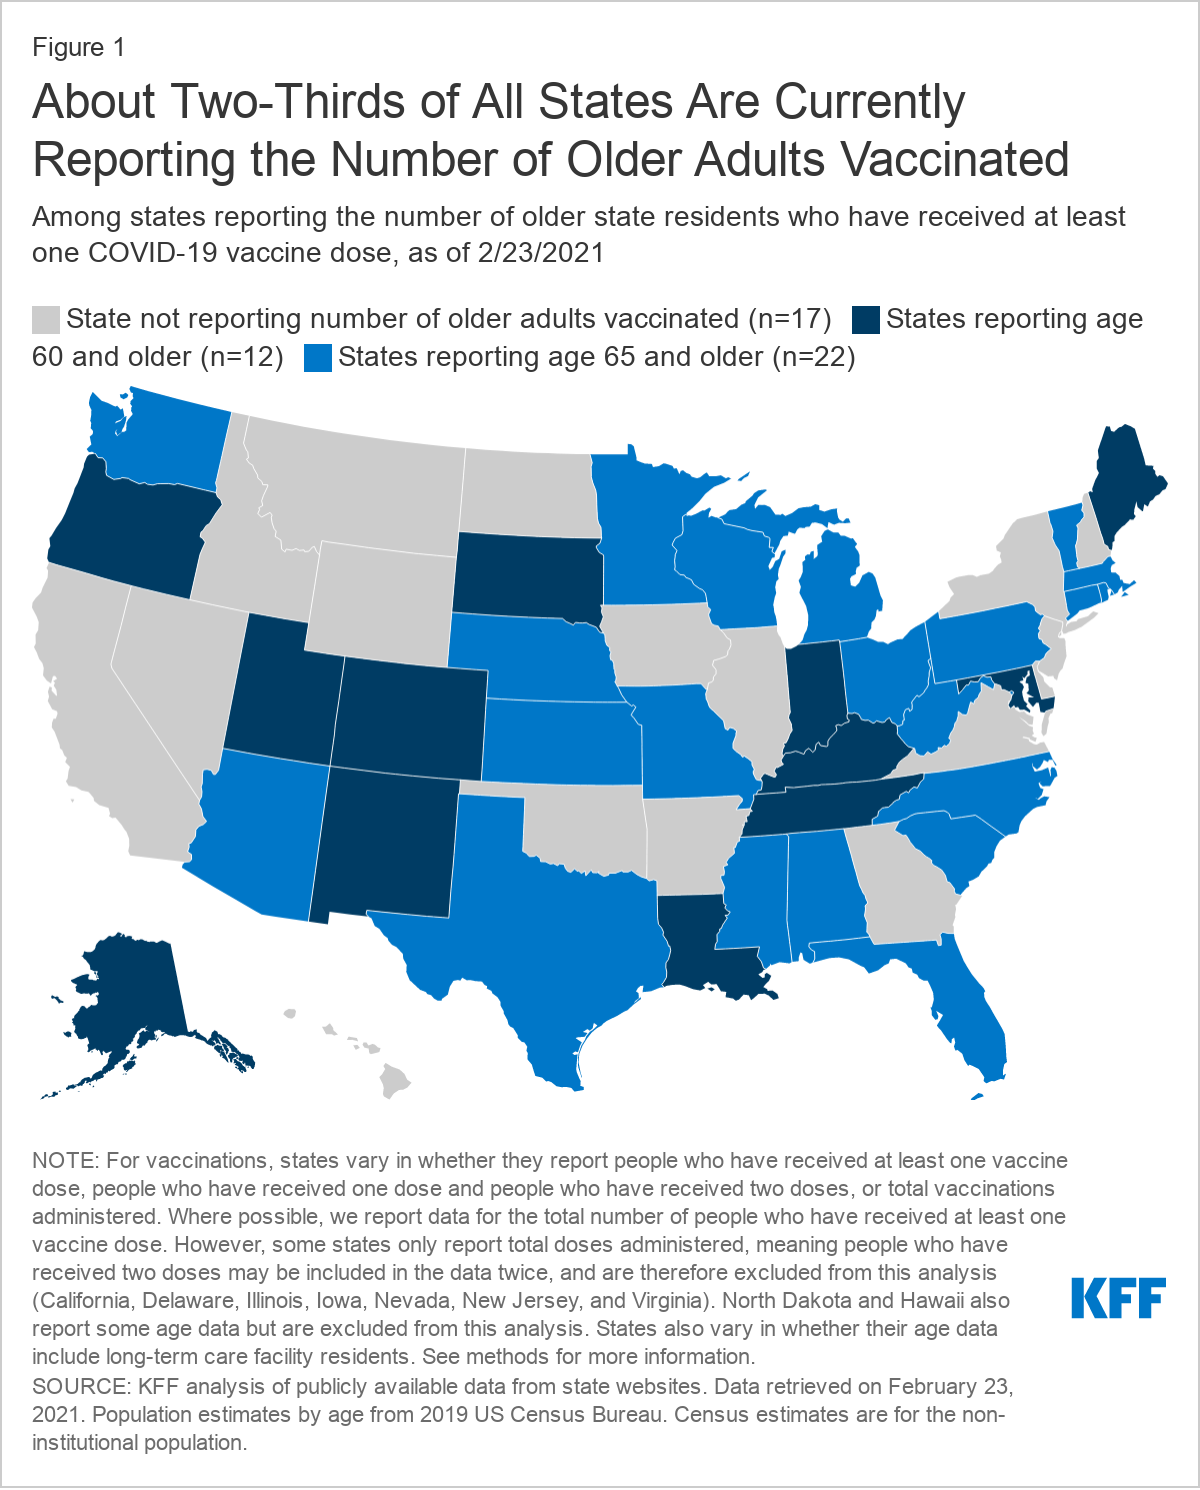
Twenty-two states and the District of Columbia have vaccinated at least one-third of their residents who are 65 and older against COVID-19, an updated KFF analysis finds, but no state has crossed the threshold of vaccinating 50 percent or more of its older population.
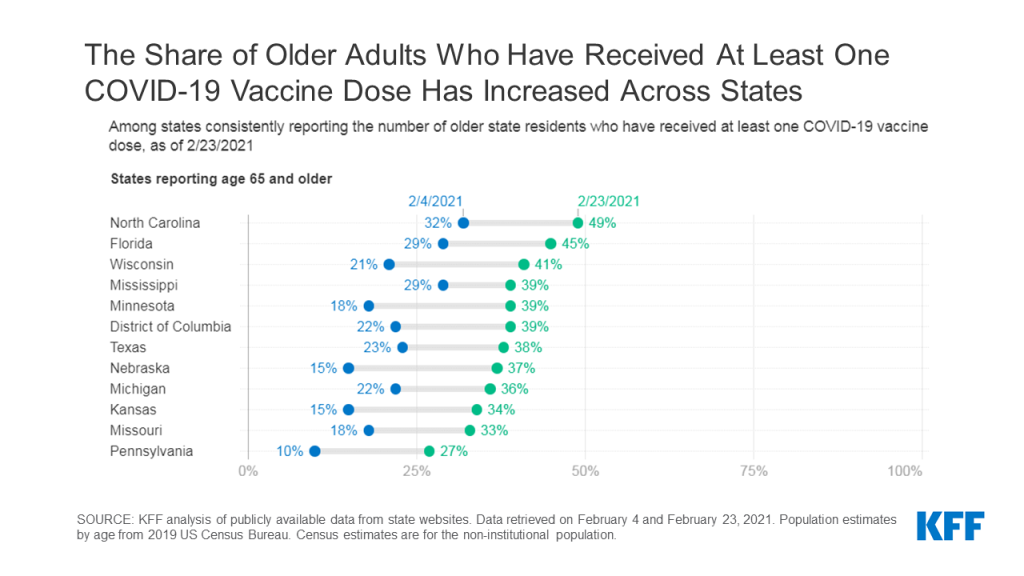
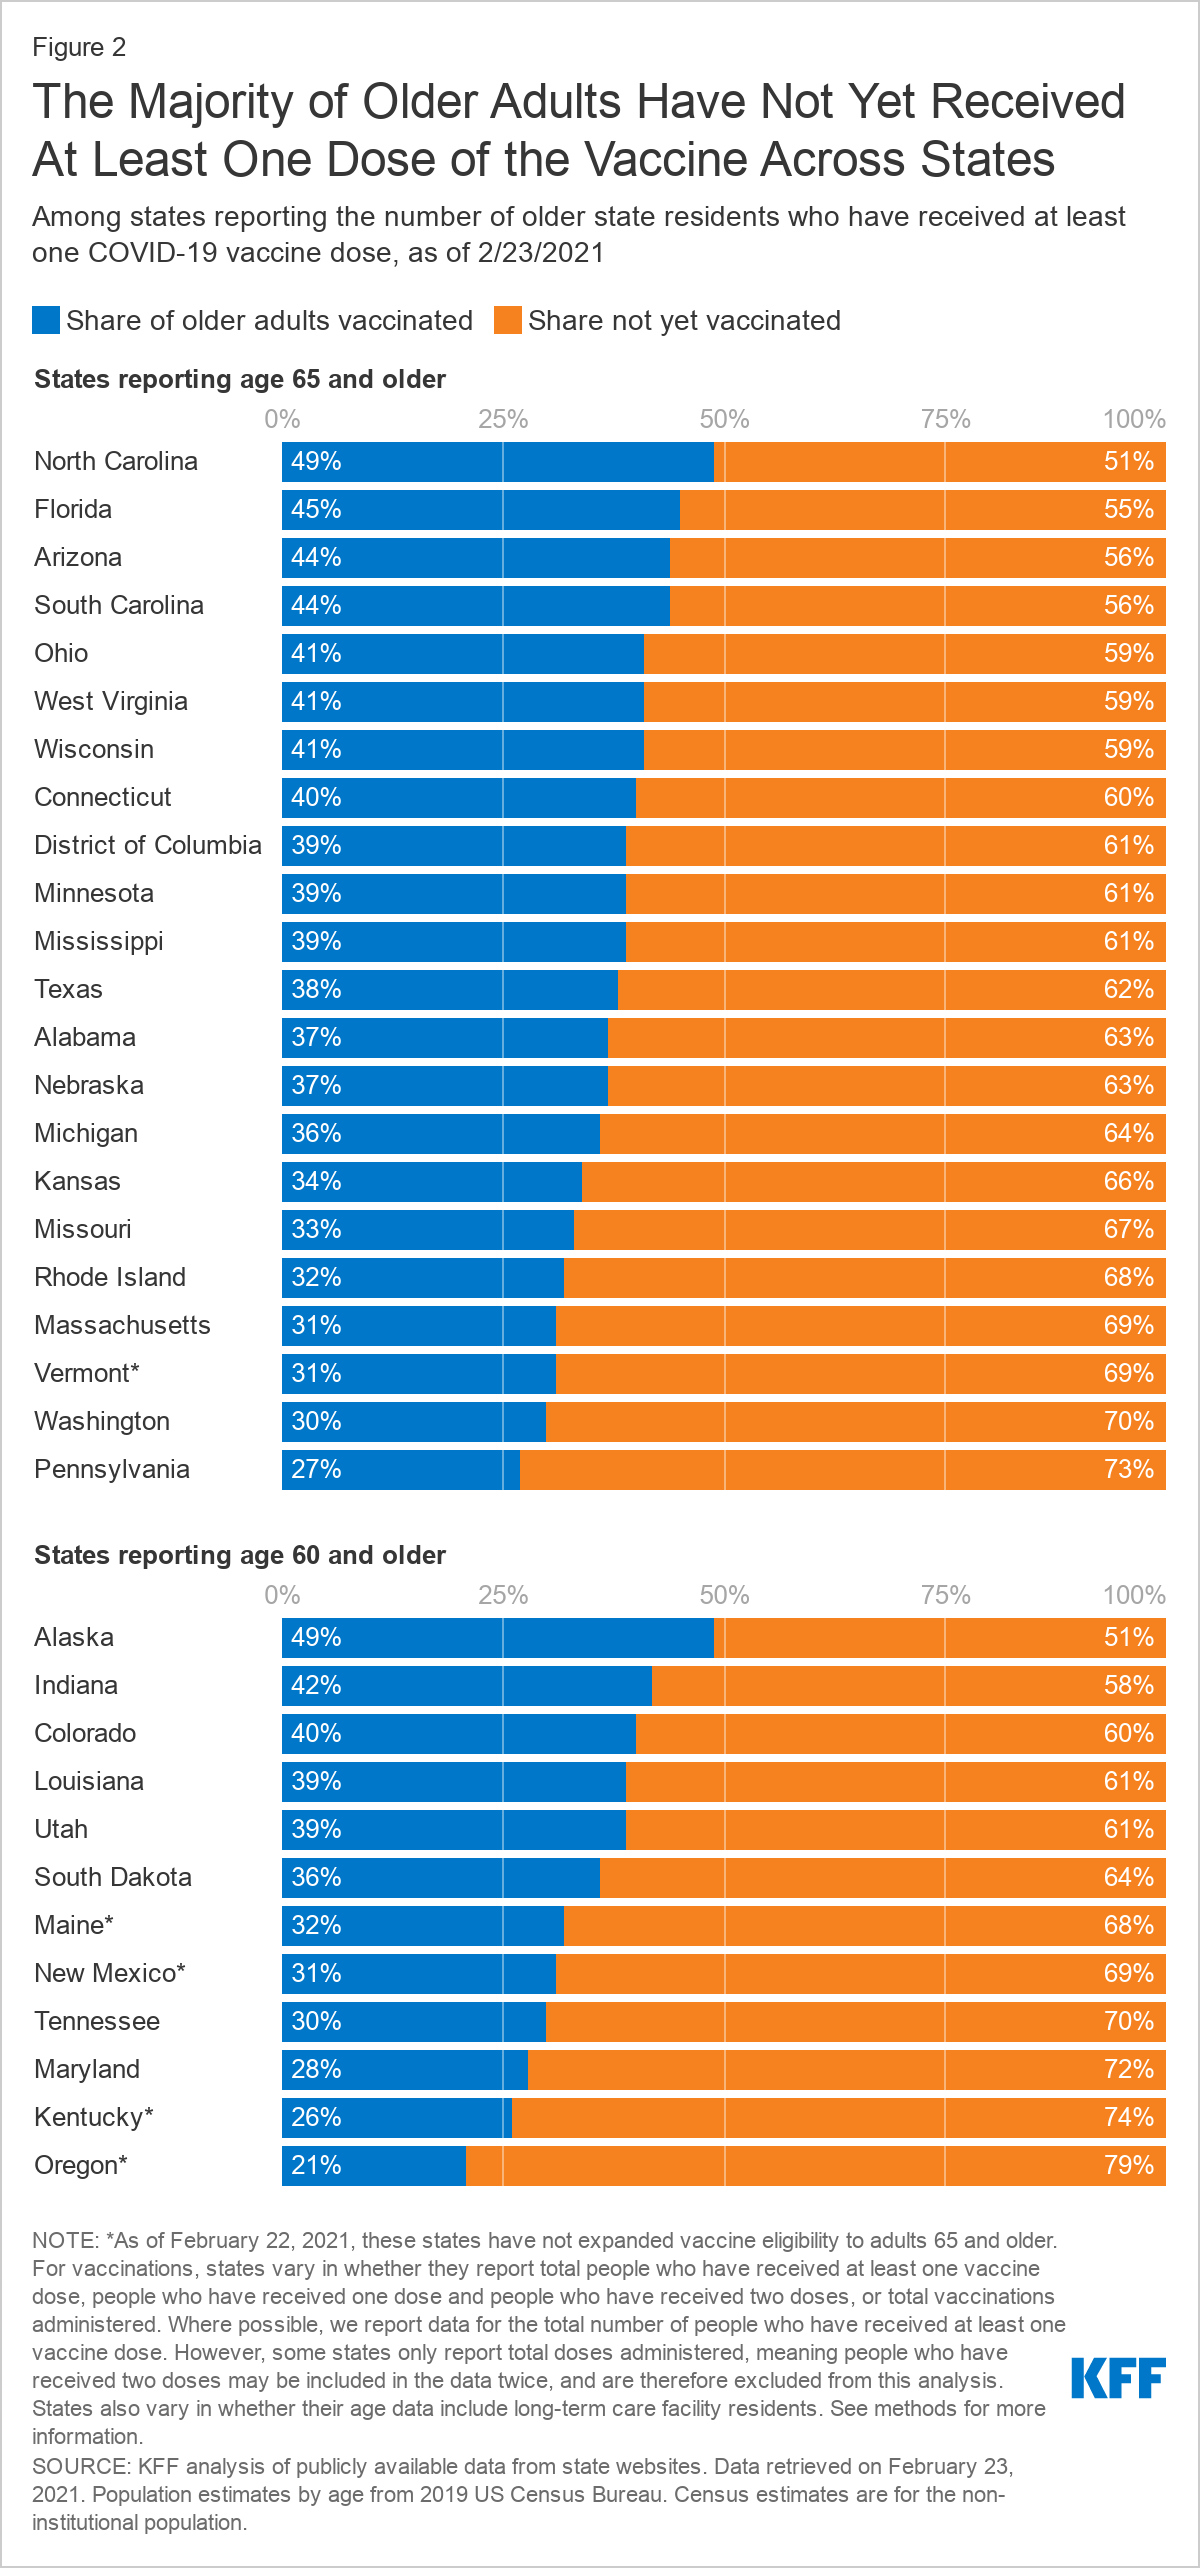
The share of adults 65 and older who have received at least one dose of a vaccine ranges from 49 percent in North Carolina to 27 percent in Pennsylvania. (The relatively low rate in Pennsylvania is partly explained by data not included from Philadelphia county.) The analysis examines COVID-19 vaccination rates among older adults in the 33 states and DC that reported such data at the person-level as of February 23, 2021.
Moreover, between February 4 and February 23, vaccination rates among older adults have increased across each state that reported consistently at both points in time, with increases ranging from 10 to 22 percentage points.
Nationally, about 41 percent of adults 65 and older have received at least one dose of a COVID-19 vaccine, according to the federal Centers for Disease Control and Prevention and KFF estimates. That’s a considerably higher rate than the 14 percent of the overall U.S. population that has received at least one dose of a vaccine.
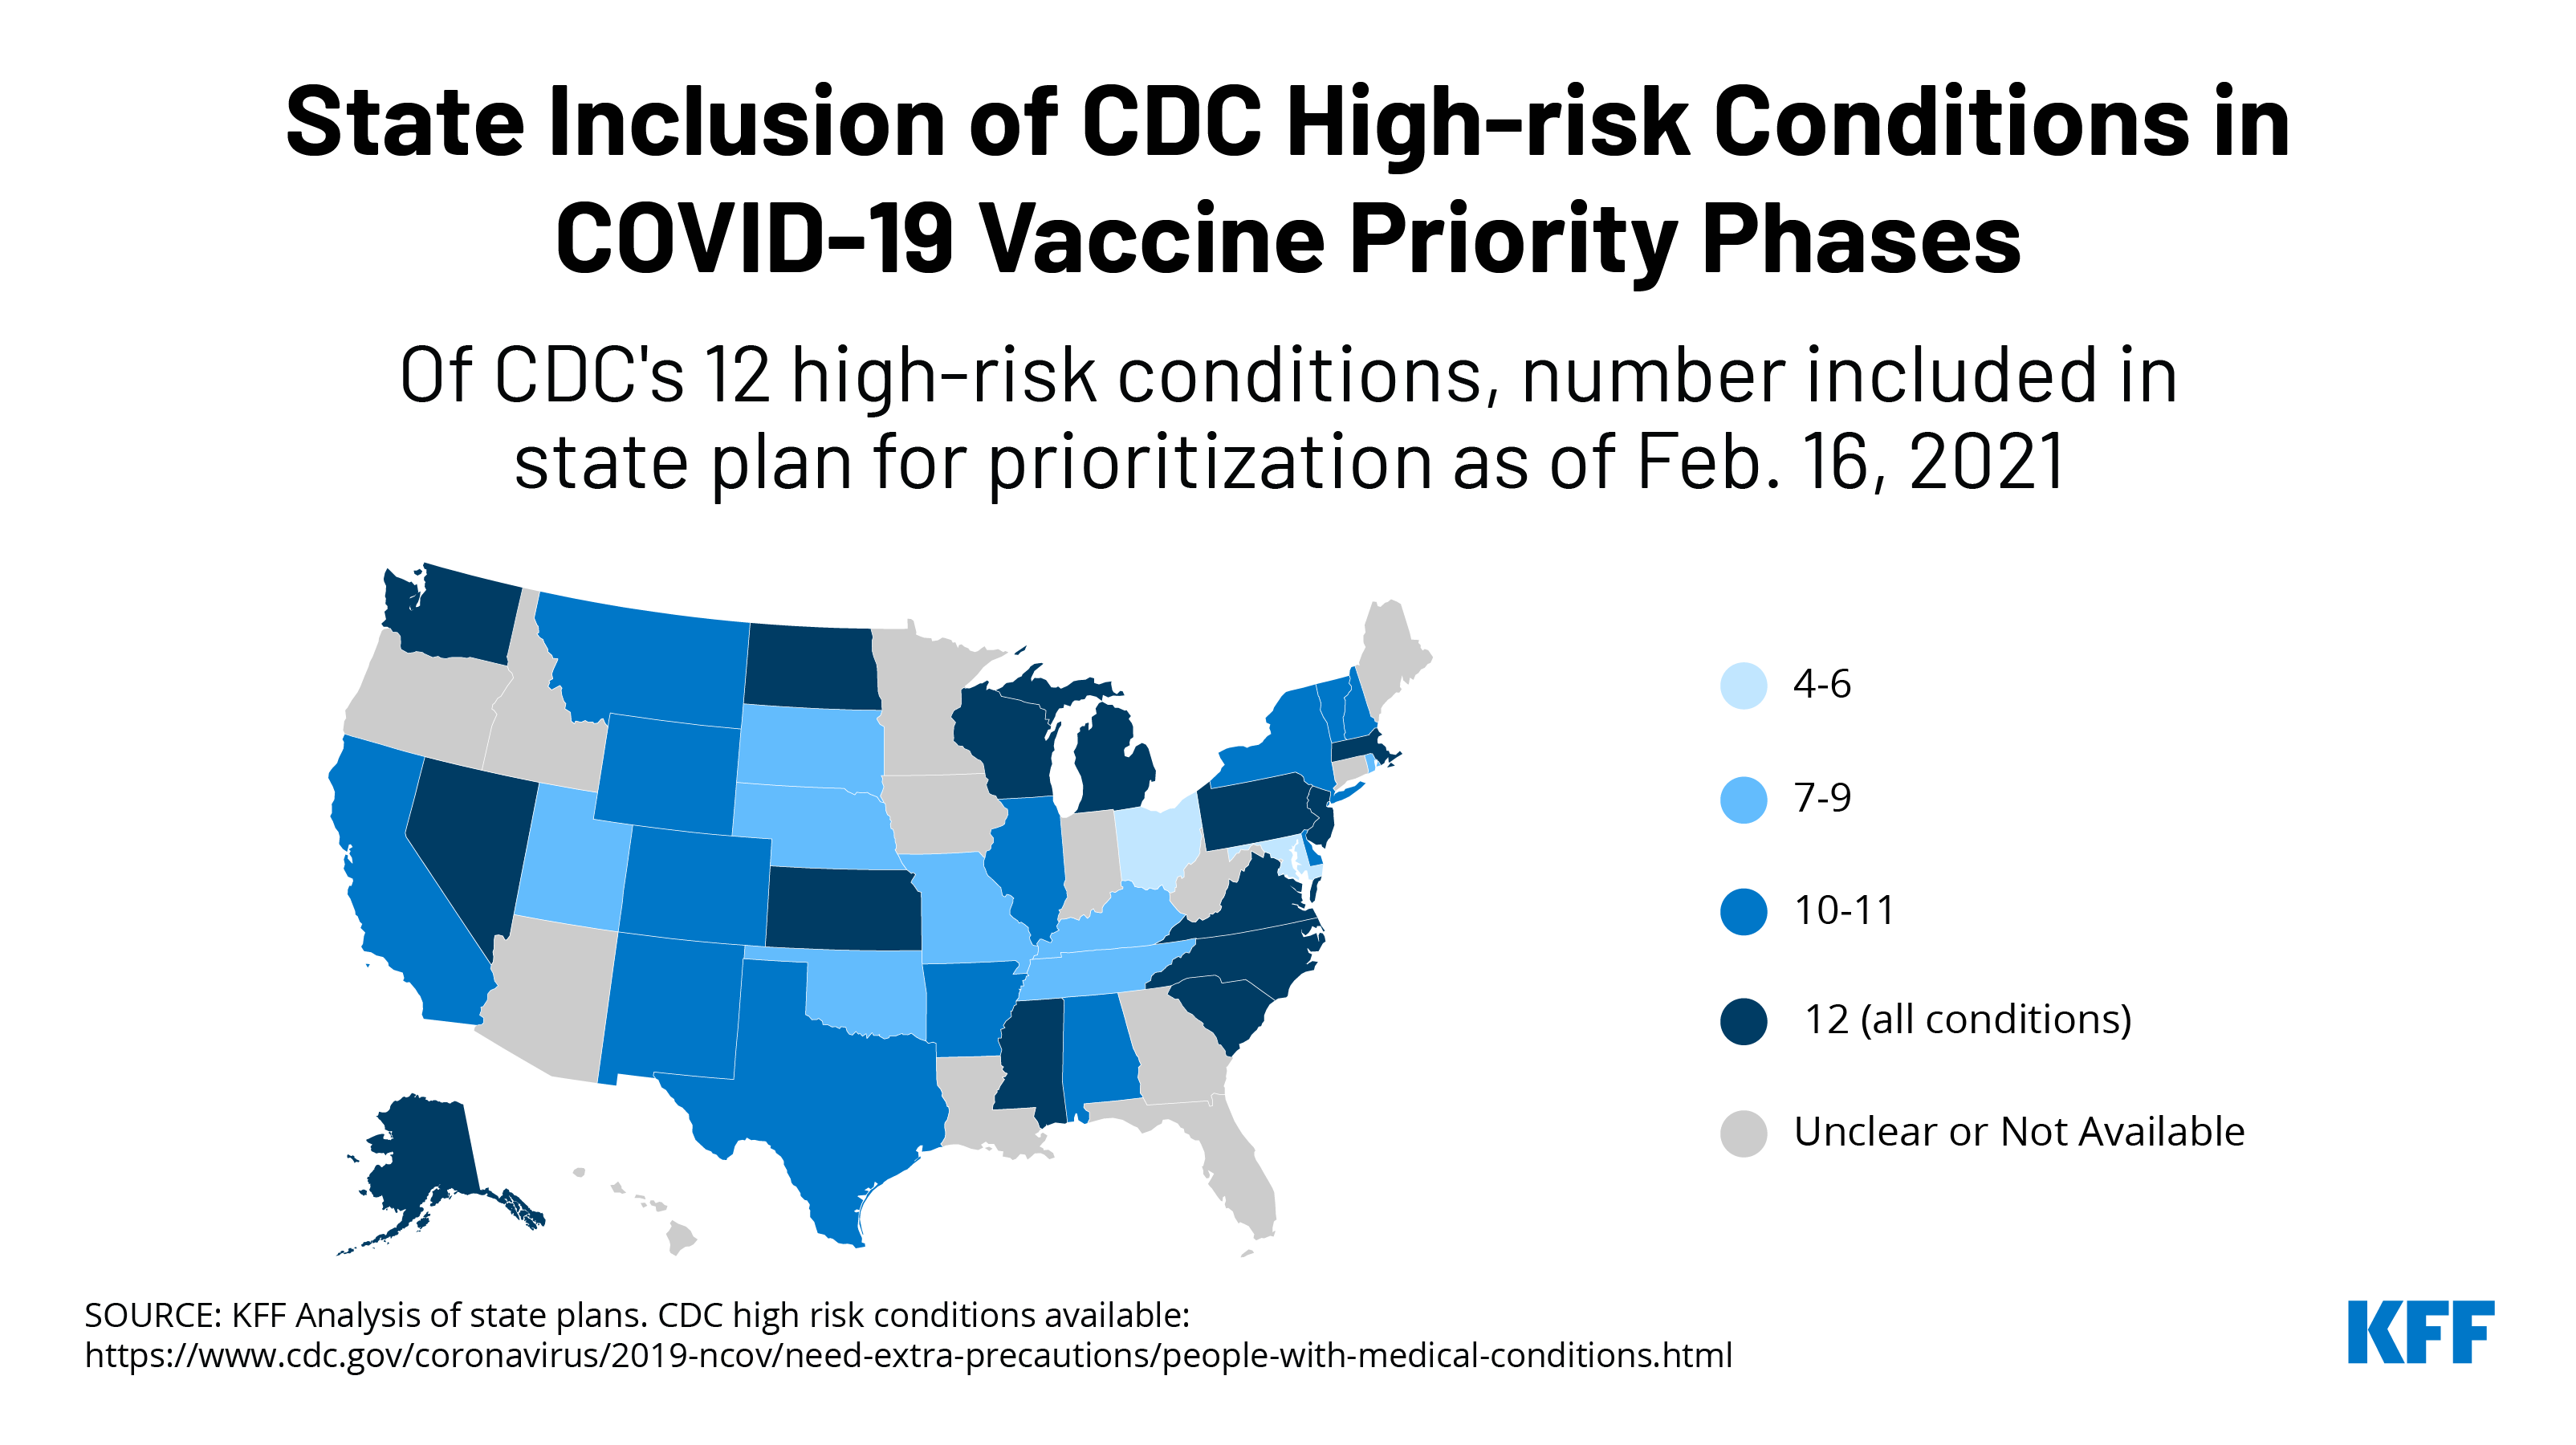
While 33 states and DC report vaccinations by age at the person level, just two states — South Carolina and Washington — report the data by both age and race/ethnicity, the new analysis finds. In these states, the data shows that larger shares of older White adults have been vaccinated than older Black and Hispanic adults.
Older adults are more vulnerable to serious illness and death from the novel coronavirus. Since January 12, the federal government has recommended that states expand vaccine eligibility to anyone 65 and older. As of February 22, 41 states and the District of Columbia had done so.
For more data and analyses regarding COVID-19 and vaccination efforts, including KFF’s Vaccine Monitor project, visit kff.org.
The KFF COVID-19 Vaccine Monitor is an ongoing research project tracking the public’s attitudes and experiences with COVID-19 vaccinations. Using a combination of surveys and qualitative research, this project tracks the dynamic nature of public opinion as vaccine development and distribution unfold, including vaccine confidence and acceptance, information needs, trusted messengers and messages, as well as the public’s experiences with vaccination.
Key Findings
As COVID-19 vaccination distribution efforts continue across the United States, the latest KFF COVID-19 Vaccine Monitor reports that a majority (55%) of U.S. adults now say they have received at least one dose of the vaccine (18%) or that they will get it as soon as they can (37%), up from 47% in January and 34% in December. The share that wants to “wait and see” how the vaccine is working for others before getting vaccinated themselves decreased from 31% in January to 22% in February, while a persistent one in five say they will get the vaccine “only if required for work, school, or other activities” (7%) or will “definitely not” get vaccinated (15%).
While the share that is most enthusiastic to get vaccinated increased across racial and ethnic groups, Black and Hispanic adults continue to be more likely than White adults to say they will “wait and see” before getting vaccinated. Nearly four in ten Republicans and three in ten rural residents say they will either “definitely not” get vaccinated or will do so “only if required,” as do one-third (32%) of those who have been deemed essential workers in fields other than health care.
With the potential arrival of a one-dose COVID-19 vaccine to the U.S. market, most of those who have not yet been vaccinated say the number of doses doesn’t make a difference in their own intentions, but about a quarter (26%) of those in the “wait and see” group say they’d be more likely to get a vaccine if only one dose was required.
Having a close relationship with someone who’s been vaccinated is correlated with individuals’ own intentions to get the COVID-19 vaccine. Among those who have not yet been vaccinated, seven in ten of those with a household member who’s been vaccinated and about half of those who say a close friend or family member has been vaccinated say they want the vaccine “as soon as possible,” compared to about a third of those who don’t have a close relationship to someone who’s gotten the vaccine. Black and Hispanic adults, those with lower incomes, and those without a college degree are less likely than their counterparts to say someone close to them has gotten the vaccine, reflecting other KFF analysis showing similar disparities.
The perceived side effects of the vaccine continue to be a top concern for the public, with eight in ten in the “wait and see” group saying they are concerned they might experience serious side effects if they get vaccinated. Large shares of those who want to “wait and see” – including majorities of Black and Hispanic adults – also say they are concerned that they might get COVID-19 from the vaccine, they might have to miss work if the side effects make them feel sick, they may have to pay an out-of-pocket cost to get vaccinated (despite the fact that the vaccine is available for free to everyone), or they won’t be able to get the vaccine from a place they trust.
Half of Black adults and about one-third Hispanic adults (35%) say they are not confident that the COVID-19 vaccines have been adequately tested for safety and effectiveness among members of their own racial or ethnic group, and those who aren’t confident in this type of testing are much less likely to say they’ve already been vaccinated or want the vaccine as soon as they can get it.
COVID-19 Vaccine Uptake and Intentions
Trends Among Key Groups
More than half of U.S. adults (55%) now say they have already received at least one dose of the COVID-19 vaccine (18%) or they want it as soon as possible (37%). This is an increase from 47% in mid-January and up from 34% in early December before vaccine distribution began. About one in five adults (22%) say they will “wait and see” how the vaccine is working for others before getting vaccinated themselves, a share that is down from 31% in January and 39% in December. The remaining public say they will get the vaccine “only if required for work, school, or other activities” (7%) or that they will “definitely not” get vaccinated (15%), shares that have not changed much over the past two months.
Across racial and ethnic groups, there was a steady increase from December to February in the share of adults who say they’ve already been vaccinated for COVID-19 or want the vaccine as soon as possible, and a corresponding decrease in the share who say they will “wait and see” before getting vaccinated. Despite this movement, differences in vaccine enthusiasm between members of different racial and ethnic groups persist. For example, six in ten White adults (61%) say they have already gotten the vaccine or want it as soon as possible compared to about half (52%) of Hispanic adults and four in ten Black adults (41%).
The Monitor also reports changes in vaccine enthusiasm across partisans, with large gaps in enthusiasm remaining between groups. Between December and February, there was a large increase in the share of Democrats who report being vaccinated or wanting to do so as soon as possible (from 47% to 75%) and a more modest increase among Republicans (from 28% to 41%). A substantial share of Republicans remain more resistant to getting vaccinated, with 28% saying they will “definitely not” get the shot.
Similarly, there has been an increase in COVID-19 vaccine enthusiasm across residents of urban, suburban, and rural areas since December, and now at least half of each group say they have already gotten the vaccine or want it as soon as possible (55% of urban, 56% suburban, and 53% of rural residents). Still, a larger share of rural (24%) compared to urban (13%) and suburban (14%) adults say they will “definitely not” get the vaccine.
Which Groups Are Most Enthusiastic/Cautious/Resistant?
While there has been an overall shift towards greater enthusiasm for getting a COVID-19 vaccination, the demographic groups that are the most enthusiastic, most cautious, and most resistant remain similar to those reported in January. About three-quarters of adults ages 65 and over (77%) and a similar share of Democrats (75%) say they have either already gotten at least one dose of the vaccine or will do so as soon as they can. About two-thirds of college graduates (67%) and those who work in health care delivery settings (65%) also fall into this most enthusiastic group.
About one in five adults overall (22%) say they want to “wait and see” how the vaccine is working for other people before getting vaccinated themselves, including about a third of Black adults (34%) and those between the ages of 18-29 (33%), and about a quarter of Hispanic adults (26%), those without college degrees (25%), and essential workers in non-health fields (25%).
Four in ten Republicans (38%) say they will get a COVID-19 vaccine “only if required” or will “definitely not” get vaccinated, as do about three in ten (28%) of adults living in rural areas. Notably, about one-third of those who say they’ve been deemed “essential workers” and are required to work outside their homes during the pandemic (excluding those who work in health care settings) say they will get the vaccine “only if required” (9%) or will “definitely not” get it (24%).
Demographic Differences In Vaccine Intentions
Looking at patterns of vaccine intentions across demographic groups, it’s notable that lower levels of enthusiasm among Black adults compared to White adults persist even after controlling for education levels. For example, among White adults without a college degree, 54% say they’ve already gotten the vaccine or will get it as soon as they can, compared to 38% of Black adults without a college degree. Similarly, among those who have graduated from college, vaccine uptake and enthusiasm is higher among White adults (72%) compared to their Black counterparts (48%).
Adults ages 65 and over are one of the target groups for early vaccination, and one of the groups most likely to say they’ve already been vaccinated or want the vaccine as soon as possible. Looking at vaccine intentions by a combination of race and age, large majorities of both Black and White adults ages 65 and over fall into the most enthusiastic categories. However, while nearly half of older White adults (46%) say they they’ve already gotten the vaccine, about one-third of Black older adults say the same (35%). Half (46%) of Black adults 65 and older say they will get it as soon as they can.
Among younger age groups, Black adults are nearly twice as likely as White adults to say they will “wait and see” before getting vaccinated (35% vs. 18% among those ages 50-64 and 41% vs. 23% among those ages 18-49).
Two-Dose Versus Single-Dose Vaccine
With the potential arrival of a single-dose vaccine to the U.S. market, the Vaccine Monitor probed people’s willingness to get a vaccine that required only one dose as opposed to the currently available two-dose vaccines. A large majority (83%) of those who have not yet been vaccinated say that the number of doses doesn’t make a difference in their own intentions to get vaccinated. However, about a quarter of (26%) of those who want to “wait and see” before getting vaccinated say they’d be more likely to get a vaccine if only one dose was required (including 20% of Black adults, 28% of Hispanic adults, and 29% of White adults in the “wait and see” group).
Personal Experiences With COVID-19 Vaccination
Having a close relationship with someone who’s been vaccinated is correlated with individuals’ own intentions to get the COVID-19 vaccine. Among those who have not yet gotten the vaccine but live in a household with someone who has been vaccinated, about seven in ten (69%) say they will get the vaccine as soon as they can. Similarly, about half (49%) of those who say a close friend or family member outside of their household has been vaccinated are in the “as soon as possible” group. Among those who have only a casual connection or no connection to someone who’s been vaccinated, about one-third say they want the vaccine as soon as they can get it, while larger shares (compared to those with a close personal connection to someone who’s been vaccinated) say they want to “wait and see” before getting vaccinated.
Given this association between having a close relationship to someone who has gotten the vaccine and an individual’s personal level of vaccine enthusiasm, it’s notable that Black and Hispanic adults, those with lower incomes, and those without college degrees are less likely than their counterparts to report having these connections. For example, three-quarters of White adults have a close personal connection to someone who has gotten the vaccine (including themselves) compared to 57% of Black and Hispanic adults. Similarly, 83% of those with incomes of $90,000 or more report a close personal connection to someone who has been vaccinated compared to 59% of those with incomes under $40,000, as do 86% of college graduates compared to 64% of adults without college degrees.
Personal Concerns About COVID-19 Vaccination
The February COVID-19 Vaccine Monitor probed a variety of personal concerns people might have when it comes to receiving a vaccine. As reported previously, side effects remain a prominent concern; over half (56%) of those who have not yet been vaccinated, including 80% of those in the “wait and see” group, say they are “very concerned” or “somewhat concerned” that they might experience serious side effects from the vaccine. Other concerns cited by about a third of the unvaccinated and about half of those in the “wait and see” group” are that they might have to pay out of pocket for the vaccine (despite the fact that the vaccine is available at no cost), they might have to miss work if the vaccine’s side effects make them feel sick, or that they might get COVID-19 from the vaccine.
While the possibility of experiencing serious side effects from the vaccine is a top concern across racial and ethnic groups, larger shares of Black and Hispanic adults compared to White adults in the “wait and see” category express concern that they might get COVID-19 from the vaccine, might miss work due to side effects, or have to pay out of pocket to get vaccinated (despite the fact that the vaccine is free for everyone). Among those who want to “wait and see,” about six in ten Hispanic adults (58%) and about half of Black adults (52%) are concerned that they won’t be able to get the vaccine from a place they trust, compared with about one-third of White adults (32%). In addition, about four in ten Hispanic adults in this group are concerned that they might need to take time off work to get vaccinated (43%) or they will have difficulty traveling to a vaccination site (39%).
Confidence In Vaccine Development And Testing Among Black And Hispanic Adults
Concerns about COVID-19 vaccination among Black and Hispanic adults may be linked to perceptions of whether people of color were represented in clinical trials and other vaccine research. In fact, half of Black adults say they are “not too confident” or “not at all confident” that the COVID-19 vaccines were adequately tested for safety and effectiveness specifically among Black people, and about a third of Hispanic adults (35%) say the same thing about testing among Hispanic people.
Confidence in adequate testing among one’s own racial or ethnic group is related to vaccine intentions and enthusiasm among Black and Hispanic adults. Those who are at least somewhat confident that the vaccines have been adequately tested for safety and effectiveness among their own racial or ethnic group are about twice as likely to say they’ve already been vaccinated or want the vaccine as soon as they can get it compared to those who are not confident (58% vs. 24% among Black adults, 63% vs. 30% among Hispanic adults).
Methodology
This KFF COVID-19 Vaccine Monitor was designed and analyzed by public opinion researchers at the Kaiser Family Foundation (KFF). The survey was conducted February 15-23, 2021, among a nationally representative random digit dial telephone sample of 1,874 adults ages 18 and older (including interviews from 506 Hispanic adults and 507 non-Hispanic Black adults), living in the United States, including Alaska and Hawaii (note: persons without a telephone could not be included in the random selection process). Phone numbers used for this study were randomly generated from cell phone and landline sampling frames, with an overlapping frame design, and disproportionate stratification aimed at reaching Hispanic and non-Hispanic Black respondents. Stratification was based on incidence of the race/ethnicity subgroups within each frame. Specifically, the cell phone frame was stratified as: (1) High Hispanic: Cell phone numbers associated with rate centers from counties where at least 35% of the population is Hispanic; (2) High Black: Cell phone numbers associated with remaining rate centers from counties where at least 35% of the population is non-Hispanic Black; (3) Else: numbers from all remaining rate centers. The landline frame was stratified as: (1) High Black: landline exchanges associated with Census block groups where at least 35% of the population is Black; (2) Else: all remaining landline exchanges. The sample also included 190 respondents reached by calling back respondents that had previously completed an interview on the KFF Health Tracking poll at least nine months ago. Another 387 interviews were completed with respondents who had previously completed an interview on the SSRS Omnibus poll (and other RDD polls) and identified as Hispanic (n = 180; including 50 in Spanish) or non-Hispanic Black (n=207). Computer-assisted telephone interviews conducted by landline (339) and cell phone (1,535, including 1,143 who had no landline telephone) were carried out in English and Spanish by SSRS of Glen Mills, PA. To efficiently obtain a sample of lower-income and non-White respondents, the sample also included an oversample of prepaid (pay-as-you-go) telephone numbers (25% of the cell phone sample consisted of prepaid numbers) Both the random digit dial landline and cell phone samples were provided by Marketing Systems Group (MSG). For the landline sample, respondents were selected by asking for the youngest adult male or female currently at home based on a random rotation. If no one of that gender was available, interviewers asked to speak with the youngest adult of the opposite gender. For the cell phone sample, interviews were conducted with the adult who answered the phone. KFF paid for all costs associated with the survey.
The combined landline and cell phone sample was weighted to balance the sample demographics to match estimates for the national population using data from the Census Bureau’s 2019 U.S. American Community Survey (ACS), on sex, age, education, race, Hispanic origin, and region, within race-groups, along with data from the 2010 Census on population density. The sample was also weighted to match current patterns of telephone use using data from the January- June 2020 National Health Interview Survey. The weight takes into account the fact that respondents with both a landline and cell phone have a higher probability of selection in the combined sample and also adjusts for the household size for the landline sample, and design modifications, namely, the oversampling of prepaid cell phones and likelihood of non-response for the re-contacted sample. All statistical tests of significance account for the effect of weighting.
The margin of sampling error including the design effect for the full sample is plus or minus 3 percentage points. Numbers of respondents and margins of sampling error for key subgroups are shown in the table below. For results based on other subgroups, the margin of sampling error may be higher. Sample sizes and margins of sampling error for other subgroups are available by request. Note that sampling error is only one of many potential sources of error in this or any other public opinion poll. Kaiser Family Foundation public opinion and survey research is a charter member of the Transparency Initiative of the American Association for Public Opinion Research.
This work was supported in part by a grant from the Chan Zuckerberg Initiative DAF, an advised fund of Silicon Valley Community Foundation. We value our funders. KFF maintains full editorial control over all of its policy analysis, polling, and journalism activities.
Group
N (unweighted)
M.O.S.E.
Total
1,874
± 3 percentage points
COVID-19 Vaccination Status
Have gotten at least one dose of the COVID-19 vaccine
Since the beginning of the coronavirus pandemic, older adults have been at greater risk of serious illness, hospitalization, and death due to COVID-19. In December 2020, the FDA issued Emergency Use Authorizations for two COVID-19 vaccines. At the time, the CDC Advisory Committee on Immunization Practices (ACIP) issued recommendations to give the highest priority to health care workers, and residents and staff in long-term care facilities. In mid-January 2021, the Trump Administration advised states to expand vaccine eligibility to people ages 65 and older – a population totaling more than 54 million, in addition to residents of long-term care facilities – in order to reach a broader population of high-risk individuals. This recommendation was reinforced by the Biden Administration. In response, many states changed their vaccination plans and started vaccinating adults 75 and older (consistent with ACIP recommendations), before expanding to include adults 65 and older. As of February 22, 2021, most states (41) and the District of Columbia have expanded eligibility for COVID-19 vaccines to include people 65 and older (Appendix Table 1).
Although demand for COVID-19 vaccines continues to outstrip supply, the pace of COVID-19 vaccinations nationwide is increasing, with average daily vaccinations rising from 1.1 million per day in mid-January to 1.7 million per day as of February 17, 2021. According to the CDC, more than 45 million people, or about 14% of the US population, have received at least one dose of a COVID-19 vaccine. Among adults 65 and older, the vaccination rate is considerably higher at about 41%, according to the CDC and our estimates based on 2019 Census data and long-term care facility data. In fact, people 65 and older, including residents of long-term care facilities who are primarily in this age group, account for more than half (54%) of all people who have received at least one COVID-19 vaccine dose to date.
This analysis examines COVID-19 vaccination rates among older adults in the 33 states and DC that reported these data at the person-level as of February 23, 2021 (Figure 1). It also looks at the change in vaccination rates between February 4 and February 23 among a subset of these states (18 and DC) that reported consistently at both points in time. The analysis includes states reporting vaccination data by age where the data reflect the number or share of people who have received at least one dose of the vaccine; we exclude states that report the number or share of doses administered (California, Delaware, Illinois, Iowa, Nevada, New Jersey, and Virginia; see methods). Of the 33 states and DC in our analysis, 28 states plus DC have expanded vaccinations to adults 65 and older; five states have not expanded eligibility to people ages 65 and older (Kentucky, Maine, New Mexico, Oregon, and Vermont). Most of these states (21 and DC) report vaccinations among adults 65 and older, while 12 report for adults 60 and older. We report results separately for these two groups.
Findings
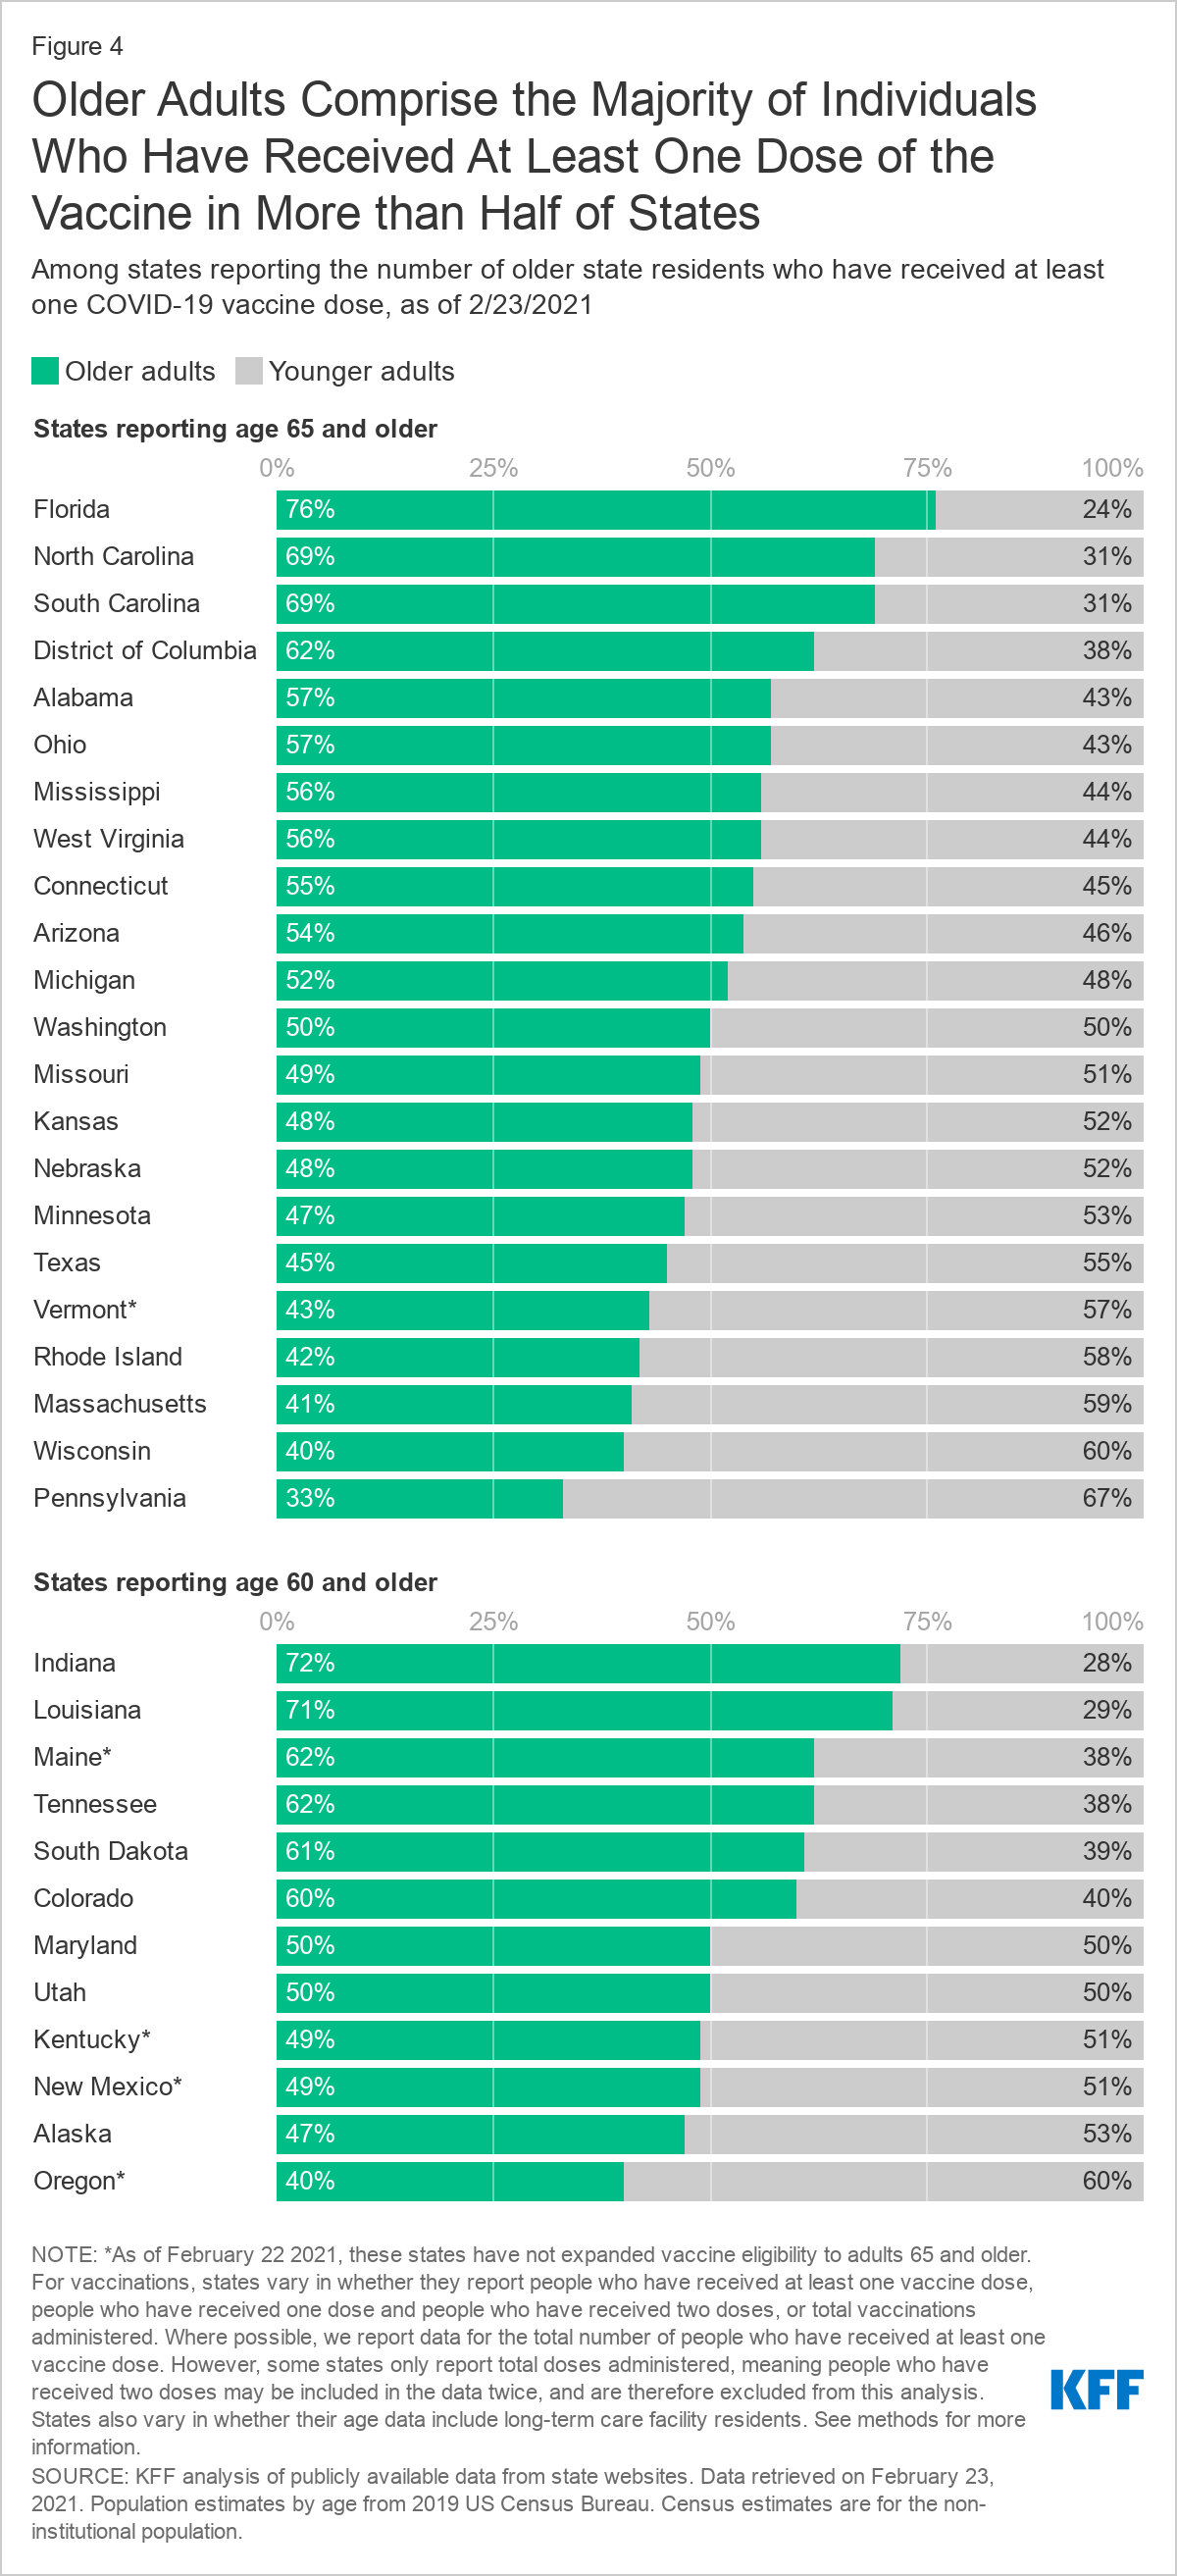
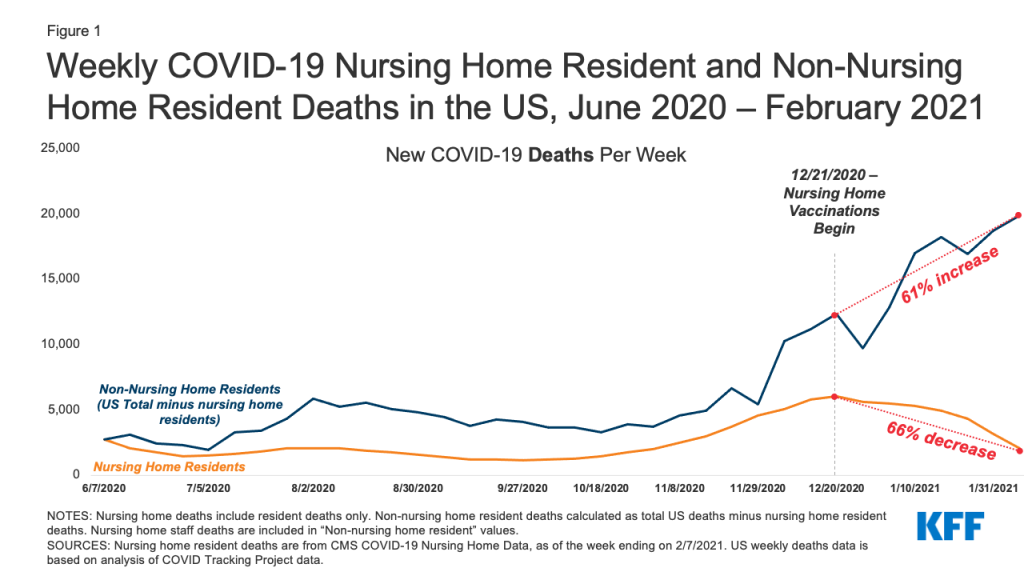
Of the 33 states and DC in our analysis, 22 states and the District of Columbia have vaccinated at least one-third of older adults, but no state has reported crossing the 50% threshold (Figure 2). Among the 21 states and DC reporting data for people 65 and older, 4 states report vaccinating a larger share of their 65 and older population than the national average, which is 41% (North Carolina, Florida, Arizona, South Carolina). The share of adults 65 and older who have received at least one dose of the vaccine ranges from 49% in North Carolina to 27% in Pennsylvania. The relatively low rate in Pennsylvania may be partly explained by data not included from Philadelphia county.
Two states – Florida and Texas – included people ages 65 and older in the initial prioritization group (that is, before the federal government advised including them) and report vaccination rates by age. (A third state, Georgia, also vaccinated older adults from the outset but does not report vaccination rates among older adults.) As of February 23, Florida has a higher vaccination rate among older adults than Texas (45% vs. 38%). The lower rate in Texas may be due in part to delays resulting from the recent winter storm that wreaked havoc on the state.
Among the 12 states that report COVID-19 vaccinations for people ages 60 and older, two states (Alaska and Indiana) report vaccinating more than 41% of people 60 and older. The share of adults 60 and older who have received at least one dose ranges from 49% in Alaska to 21% in Oregon.
Between February 4 and February 23, vaccination rates among older adults have increased across states that reported consistently at both points in time, with increases ranging from 10 to 22 percentage points (Figure 3). The share of adults ages 65 and older who have received at least one dose of the vaccine has increased by 20 percentage points or more in Nebraska (15% to 37%), Minnesota (18% to 39%), and Wisconsin (21% to 41%). Over this time period, Mississippi had the smallest increase among states reporting vaccinations for people 65 and older, at 10 percentage points (29% to 39%). We were able to track trends for 18 states and DC but were unable to track trends for all states that report vaccination rates (for additional information, see methods).
Among the states reporting vaccination rates among people 60 and older, South Dakota had the largest increase in the share of older adults vaccinated (16% to 36%), while Oregon had the smallest increase (11% to 21%).
Older adults account for a majority of people who have received vaccines in more than half of the states in our analysis, based on the total number of people in the state who have received at least one dose (Figure 4). Among the 21 states and DC reporting vaccinations among people 65 and older, this population accounts for half or more of all people receiving at least one dose in DC and 11 states (Florida, North Carolina, South Carolina, Alabama, Mississippi, West Virginia, Connecticut, Arizona, Ohio, Michigan, Washington). The share of all people who have received a first dose who are 65 and older ranges from 76% in Florida – which likely reflects Florida’s decision to prioritize the 65 and older population before the revised federal guidance was announced – to 33% in Pennsylvania. The relatively low rate in Pennsylvania may be partly explained by data not included from Philadelphia county.
In the 12 states reporting vaccinations by age for adults 60 and older, this age cohort accounts for half or more of all people who have received one or more doses in 8 states (Indiana, Louisiana, Maine, Tennessee, South Dakota, Colorado, Maryland, Utah) ranging from 72% in Indiana to 40% in Oregon.
Very few states report vaccination rates among older adults by race/ethnicity or gender. Among the 33 states and DC that report vaccinations by age at the person level, just two (South Carolina and Washington) report both age and race/ethnicity. Based on data from South Carolina and Washington State, older White adults have been vaccinated at higher rates than older Black adults. In South Carolina, 37% of White adults ages 65 and older have received at least one dose of a COVID-19 vaccine, as compared to 28% of Black adults ages 65 and older. In Washington State, 23% of all White adults 65 and older have received at least one dose of the vaccine, but only 16% of Black older adults and 19% of Hispanic older adults have been vaccinated.
The dearth of vaccination data for older adults by race/ethnicity in most states makes it more difficult to determine how best to direct resources to people who are disproportionately affected by the pandemic or are currently experiencing vaccine access issues. Only three states (Arizona, South Carolina, and Texas) report vaccination rates among the 65 and older population by gender.
Discussion
As of February 23, 2021, the majority of states have expanded eligibility for COVID-19 vaccines to include people ages 65 and older, and according to CDC and our estimates, about 41% of older adults have had at least one dose. Our analysis of state-level data shows a fair amount of variation across states that are reporting vaccination data by age. At the high end, 4 states report that more than four in 10 adults ages 65 and older have received a COVID vaccine dose, above the national average. Among states that have reported vaccination rates among older adults consistently over the past few weeks, it is clear that progress is being made in vaccinating older adults, with some states making more headway than others, as supply remains a concern.
The variation in vaccination rates among older adults across states may be due to a number of factors, including timing (when they first expanded eligibility to people 65 and older), the supply of vaccines received relative to their older population, the ability of states to increase the number of vaccinations per day, and sign-up procedures that vary across states, and within states across counties. These variations contribute to a host of problems older adults have encountered getting vaccinated, including not knowing how to schedule appointments or where to get vaccinated, waiting in long lines, or arriving for an appointment to find vaccines no longer available. Underlying inequities in resources, such as access to technology and transportation, may further increase barriers to vaccination for seniors of color.
In general, our analysis shows that states have made progress in vaccinating older adults in recent weeks amidst ongoing concerns about an insufficient supply of vaccine, but there is still a way to go before a large majority of this population has been vaccinated.
Methods
This analysis uses publicly available data from state websites pertaining to vaccine administration retrieved on February 23, 2021. Population estimates by age for each state come from the 2019 US Census Bureau.
There are some data limitations. States report vaccinations differently. States vary in whether they report the number of people who have received at least one vaccine dose, people who have received one dose and people who have received two doses, or total vaccinations administered. Where possible, we report data for the total number of people who have received at least one vaccine dose. However, some states only report total doses administered for age data, meaning people who have received two doses may be included in the data twice, and therefore are excluded from this analysis. It is not possible to calculate the overall share of older adults in the US who have received at least one dose of the COVID-19 vaccine based on state-level data in California, Delaware, Illinois, Iowa, Nevada, New Jersey, and Virginia. Further, North Dakota only reports percentages and not data on underlying counts of people vaccinated, and are also excluded from this analysis. As of 2/23/21, Pennsylvania's vaccine dashboard data does not include data from Philadelphia county due to differences in reporting criteria.
States also vary in the age increments they report, with some reporting data for those 65 and older with others reporting 60 and older. Tennessee reports data for adults 61 and older. Hawaii reports age data for adults 75 and older and are not included in this analysis.
We were not able to track the share of older adults who have received at least one dose of the vaccine from February 4 to February 23 in all states, either because the methodology used to report vaccination rates changed over time (Colorado, Indiana, West Virginia), the age cohort reported changed over time (Massachusetts, Ohio, Rhode Island, Vermont) or because they did not report vaccination rates among older adults as of February 4 (Alabama, Arizona, Connecticut, Kentucky, New Mexico, South Carolina, Utah, Washington).
State-level data may or may not include doses delivered and administered from the Retail Pharmacy Program, the Federally Qualified Health Centers Program, and Federal Emergency Management Agency (FEMA) community vaccination sites. States also vary in whether their age data include long-term care facility residents. Currently, only six states (Alabama, Kentucky, Massachusetts, Maine, Mississippi, Nebraska) explicitly state that their age data include data from the Pharmacy Partnership for Long-Term Care and other long-term care facilities. Michigan specifies that data on long-term care vaccinations are not fully captured in their age data. North Carolina also specifies that data on doses administered as part of the Partnership are not reflected in their age data. The remainder of the states either do not specify whether their age data include data from long-term care facilities, or in others, it was unclear based on the description. According to CDC data, nearly 2 million residents of long-term care facilities received at least one dose of the vaccine nationwide, most of whom are presumably older than age 65. If states do not take into account long-term care residents who have been vaccinated, the shares reported here may somewhat understate the total share of older adults that have received at least one dose in those states. Finally, it is possible that the estimates of vaccination rates based on state websites may be low if there is a lag in reporting by states.
An updated version of this report was released on June 21, 2023 and can be foundhere.
Introduction
Access to sexual and reproductive health (SRH) care in the U.S. is influenced by a variety of factors, including patients’ coverage, social determinants of health, as well as federal, state, local, and institutional level policies. We have also seen that health care providers play a large role in the care patients receive. To better understand how the provision of SRH care varies across the U.S., and how delivery of care has been influenced by changes in reproductive health policy, KFF conducted a nationally representative survey of OBGYNs across the United States. While we acknowledge that many types of clinicians are critical sources of SRH care — from midwives, to advance practice clinicians to primary care physicians— obstetrician-gynecologists (OBGYNs) comprise the largest subset of providers in this field.
This survey asked OBGYNs about a wide range of issues, including their provision of contraception, abortion, and STI care, the role of Medicaid in the delivery of SRH, screening practices for psychosocial needs, and the impact of federal and state policies on health care quality and access.
Key Findings
Contraception:
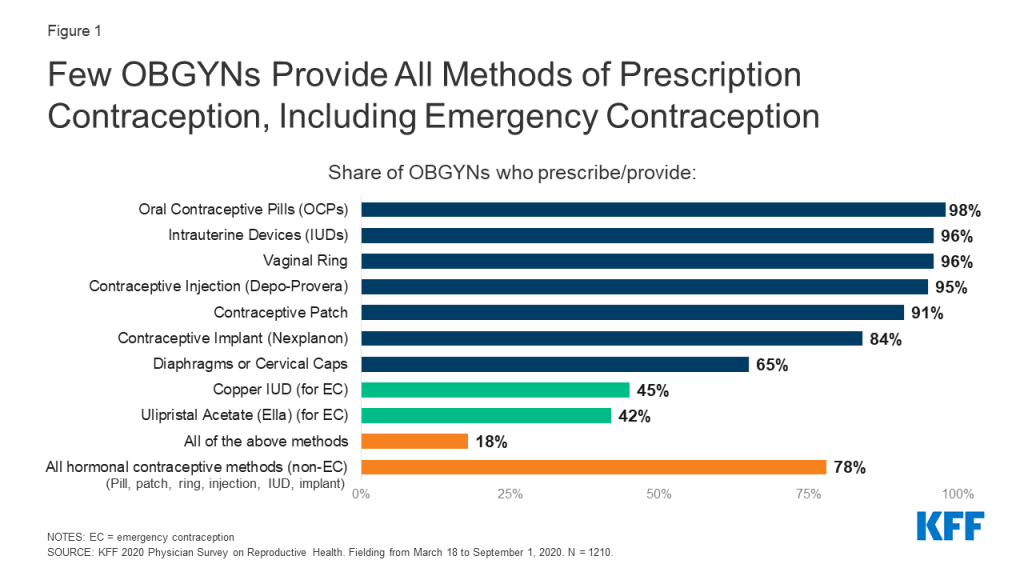
Nearly all OBGYNs offered their patients some forms of contraceptive care, but just 18% of OBGYNs offered their patients all methods of non-permanent contraception that must be either prescribed or provided by a clinician. These methods include the pill, patch, ring, diaphragm or cervical cap, intrauterine devices (IUDs), contraceptive implants (Nexplanon), contraceptive injections (Depo-Provera) and emergency contraception (Copper IUD and Ulipristal Acetate/Ella). Those that offered all methods tended to be younger and work in large practices, with more than 10 clinicians.
While the vast majority of OBGYNs provided both types of long-acting reversible contraception (LARCs) — IUDs (96%) and implants (84%) — only four in ten of those who provided these methods offered same-day placement. This means that at the majority of OBGYN practices, patients must make more than one visit to obtain a LARC.
Less than half of OBGYNs reported that they provided prescription forms of emergency contraception, which can prevent pregnancy after unprotected sex or in the event that a condom breaks. 45% provided the copper IUD and 42% provided Ella (the prescription “morning after pill”). Nearly four in ten reported that they do not provide either of these forms of emergency contraception.
Abortion:
Most OBGYNs (75%) reported their practices did not provide abortions for pregnancy termination, but over one in five (23%) worked in practices that do. Abortion provision was more common among OBGYNs in urban and suburban locations compared to rural, and in the Northeast and West compared to the Midwest and South.
The majority of OBGYNs who do not offer abortions refer their patients to other providers for this service, but just over one in ten (13%) neither provide nor refer for abortions. Among those who do not provide abortions, the most commonly cited reasons for not doing so included their practice having a policy against it (49%), saying that services are readily available elsewhere (45%) and personal opposition to the practice (31%). A higher share of OBGYNs in the Midwest and South cited legal regulations as a reason for not providing abortions, compared to those in the Northeast and West.
Other Sexual and Reproductive Health Services:
The vast majority of OBGYNs provide onsite testing for gonorrhea and chlamydia (99%), syphilis (90%) and HIV (87%) at their practices. About half of OBGYNs said they always or often prescribe expedited partner therapy (EPT) for sex partners of patients with gonorrhea or chlamydia. Fewer than one in five (18%) prescribe pre-exposure prophylaxis (PrEP) for the prevention of HIV.
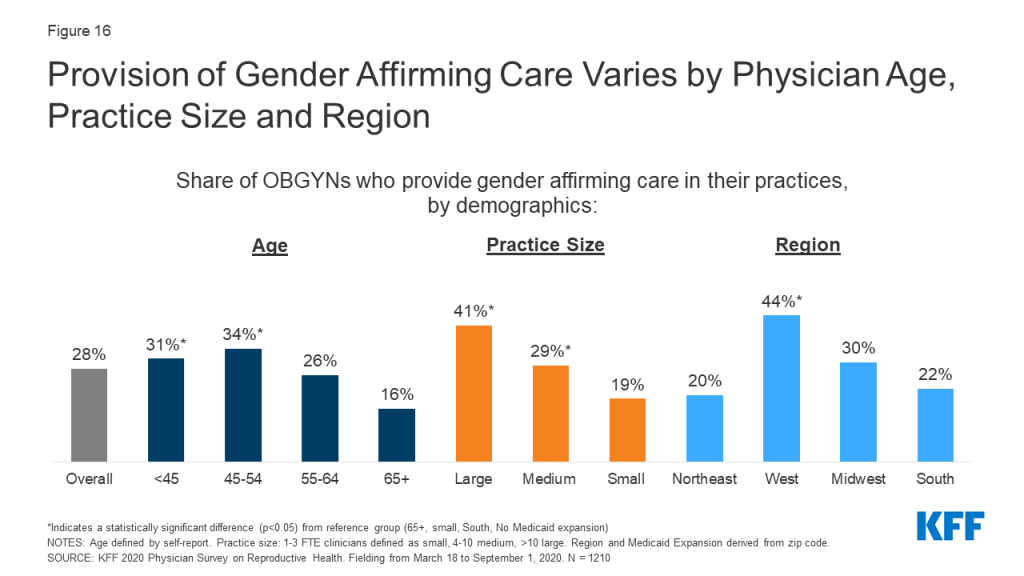
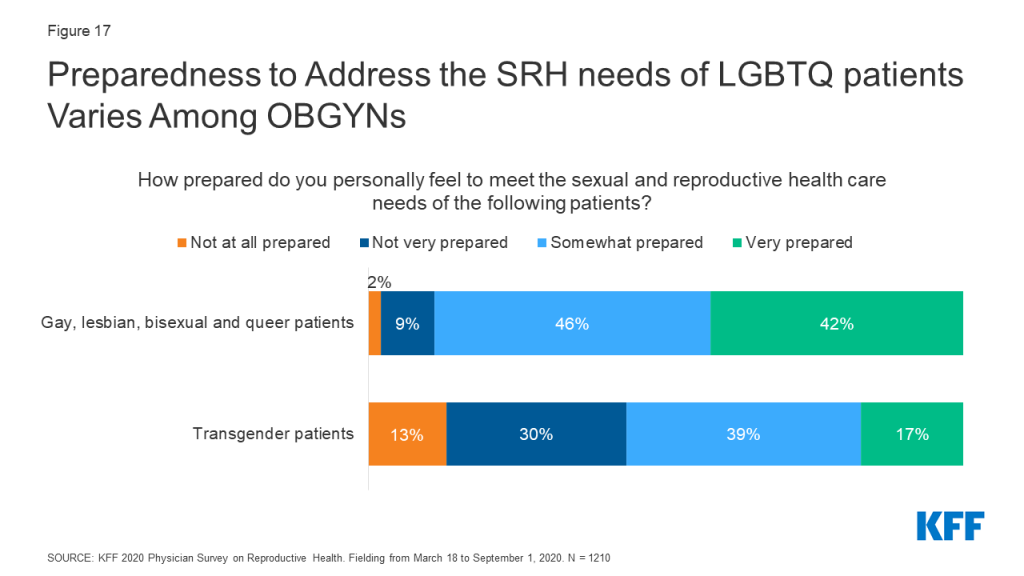
About a quarter of OBGYNs (28%) work at practices that provide gender affirming care, including hormone therapy or gender affirming surgery. While the vast majority of OBGYNs reported they felt somewhat or very prepared to meet the SRH needs of lesbian, gay, bisexual and queer patients (88%), just over half felt the same for transgender patients (56%).
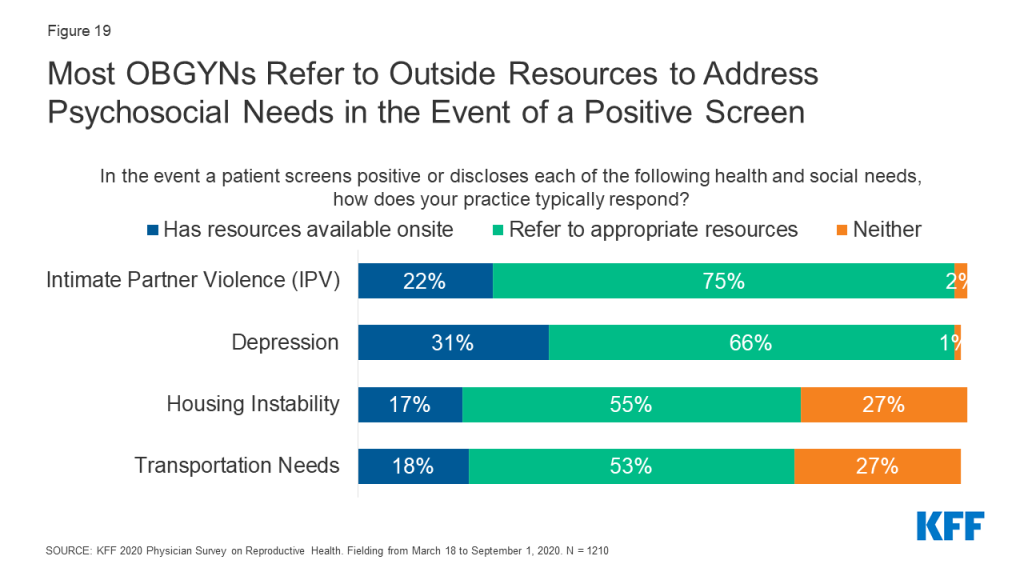
Screening for psychosocial needs varied tremendously, with far more OBGYNs reporting they screen all patients for intimate partner violence (70%) and depression (71%) than transportation (17%) and housing (19%) needs. In the event of a positive screen, few OBGYNs said they had access to resources onsite to address these needs.
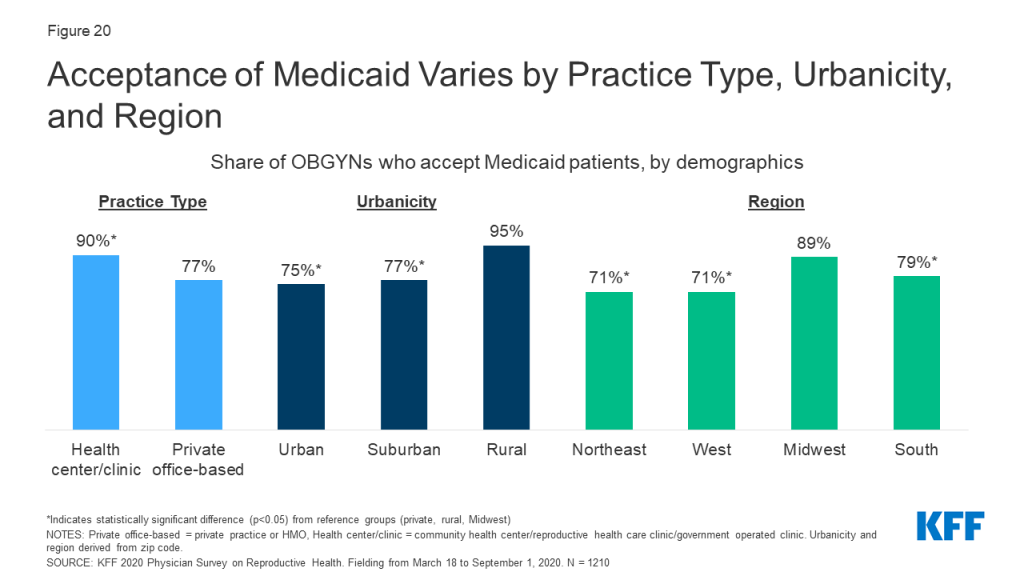
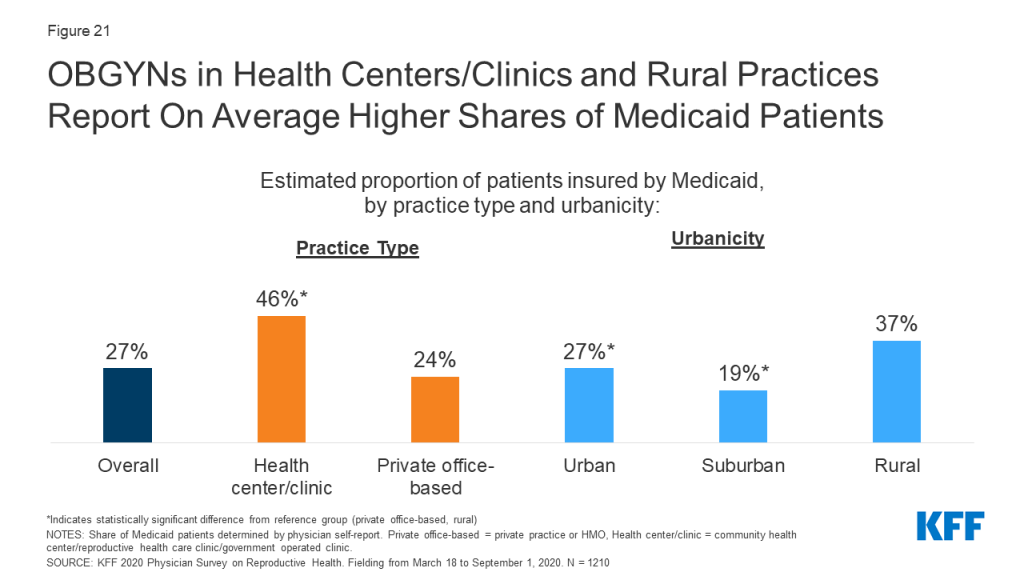
Medicaid:
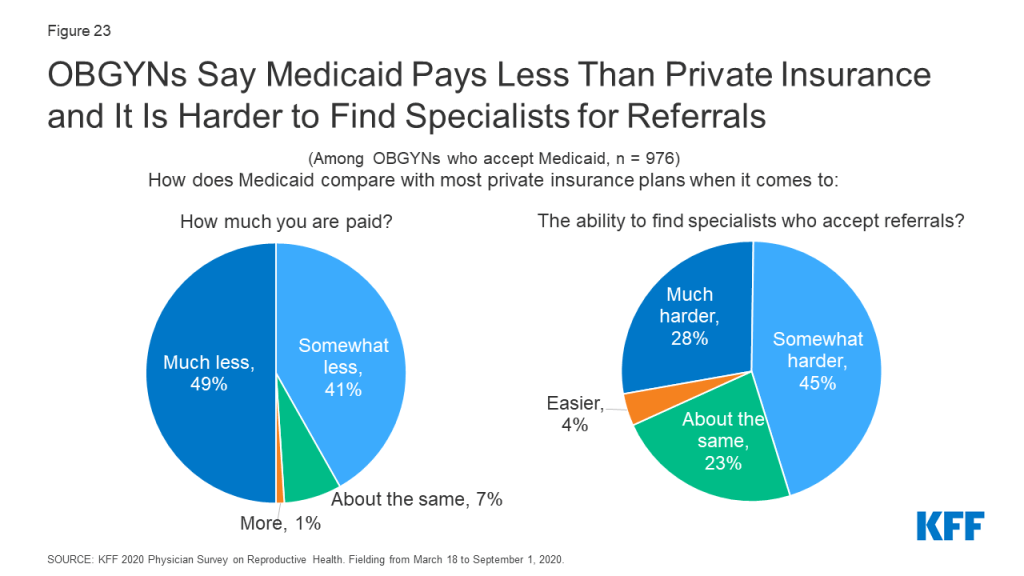
Nearly four out of five (78%) OBGYNs reported their practice accepts Medicaid. Many noted challenges associated with providing care for Medicaid patients, including difficulty finding specialists to accept referrals (73%), and being reimbursed at a lower rate than under private insurance (90%).
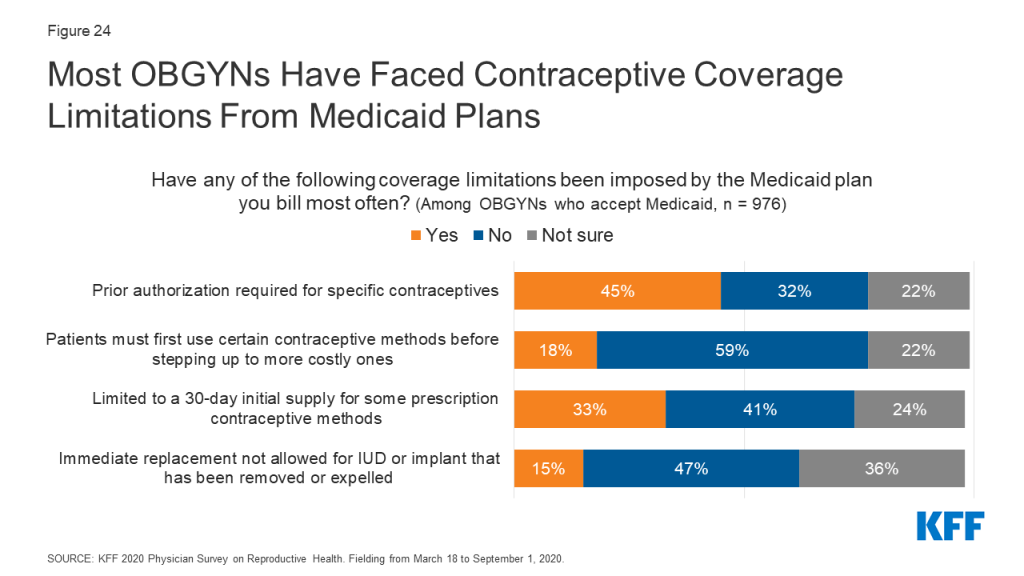
A sizeable minority said they had encountered at least one Medicaid restriction regarding contraceptive care, including needing to obtain prior authorization (45%), being limited to an initial contraceptive supply of 30 days (33%), requiring “step-therapy” (15%) or being denied immediate replacement of expelled or removed LARCs (15%).
Policy Perspectives:
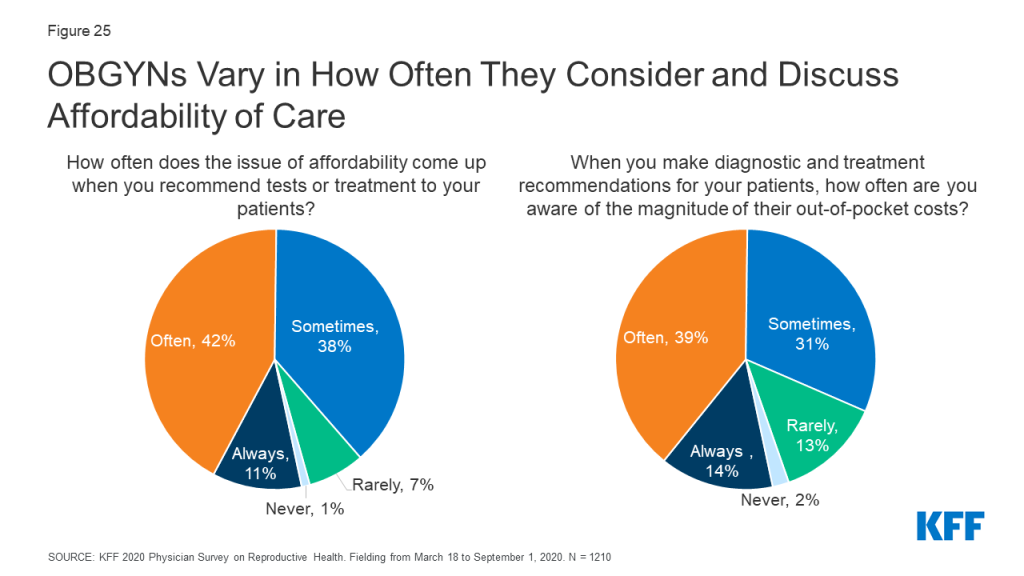
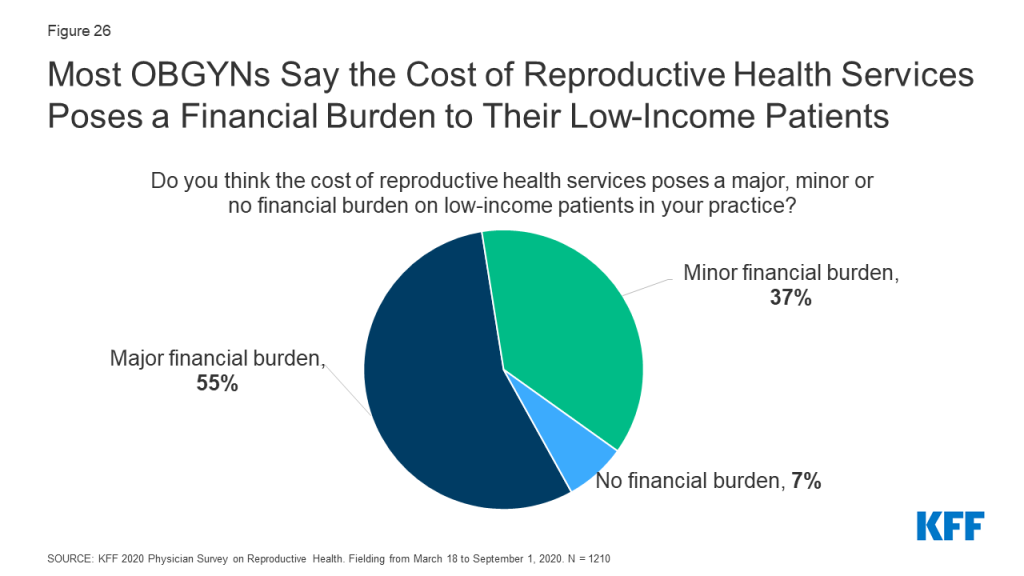
Many OBGYNs are aware of the impact of out-of-pocket costs on their patients. About half of OBGYNs (53%) said the issue of affordability comes up always or often when they recommend tests or treatments to patients, and a similar share of OBGYNs (53%) said they were always or often aware of the magnitude of their patients’ out-of-pocket costs. Nearly all (92%) reported that the cost of reproductive health care poses a burden for low-income patients in their practices.
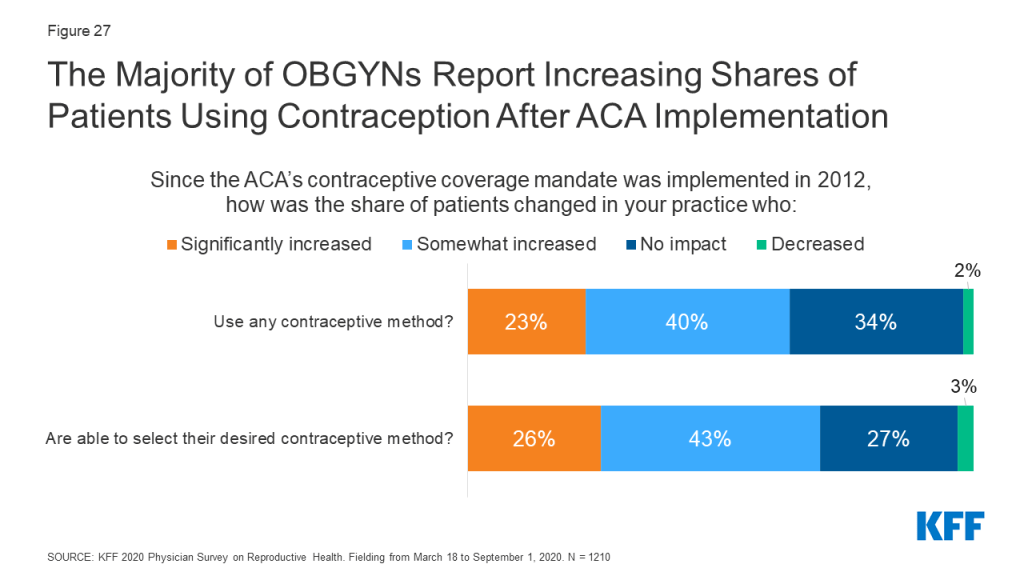
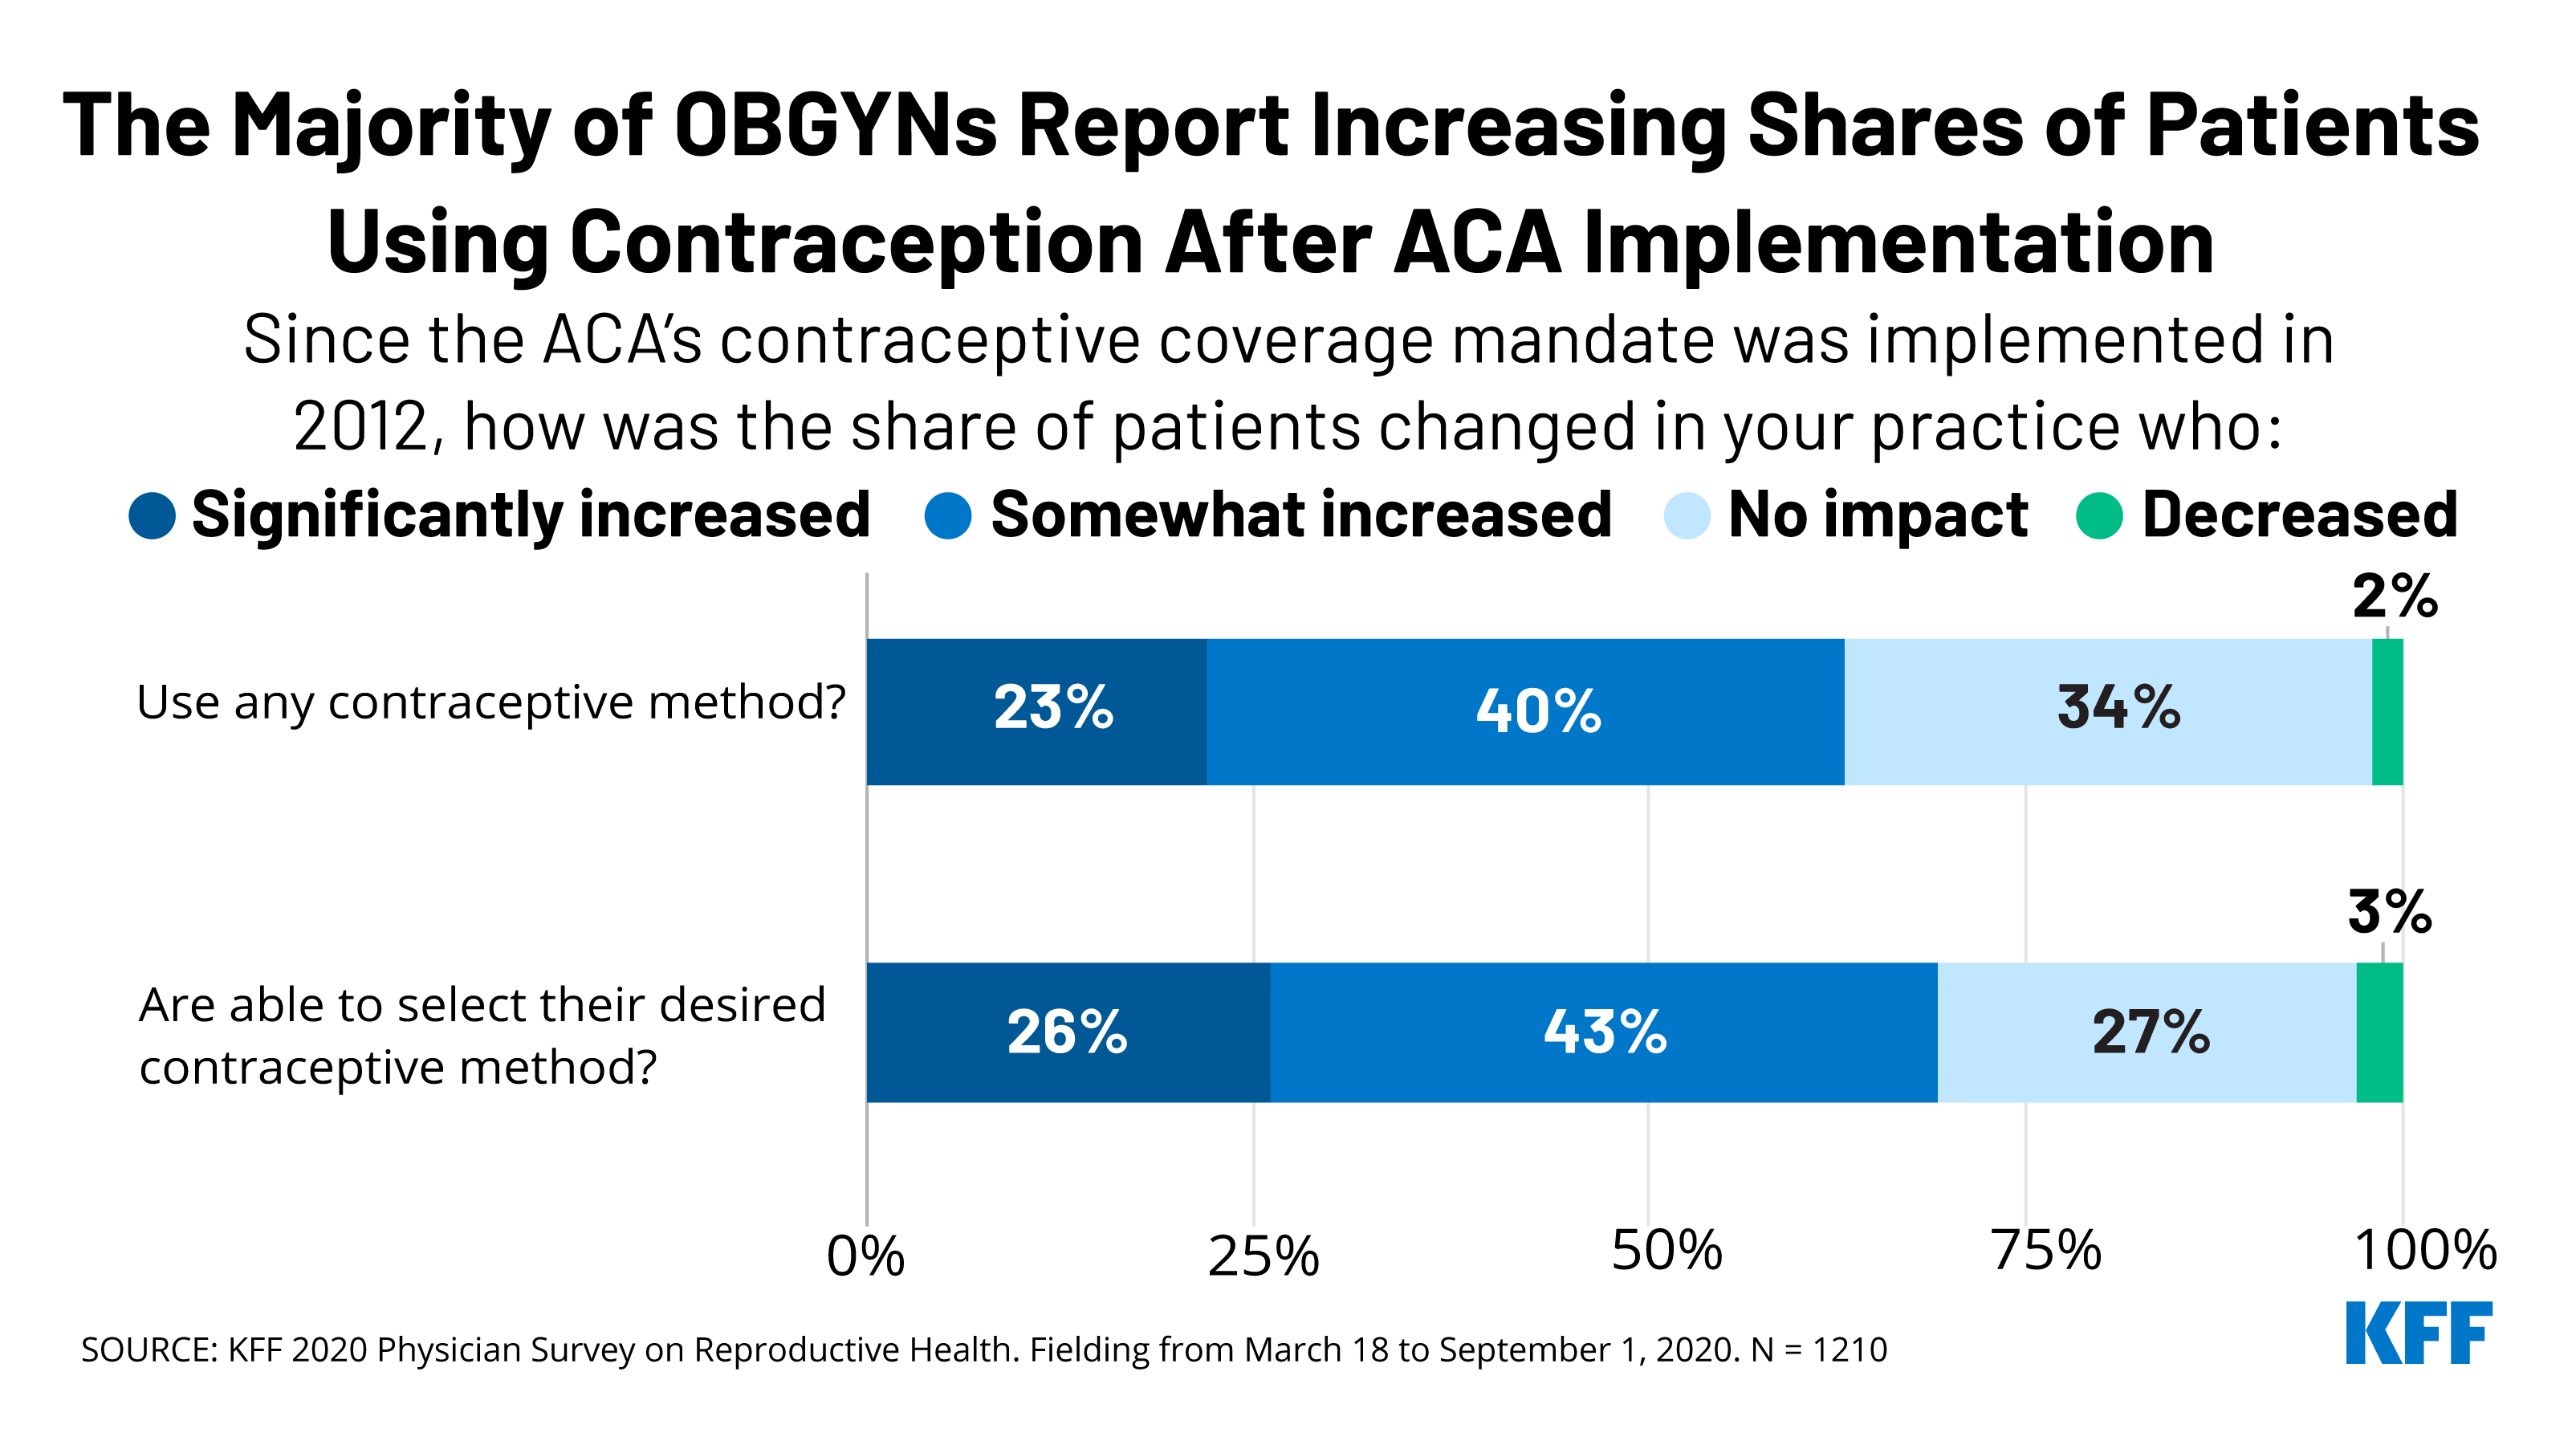
Over six in ten OBGYNs reported an increase in the share of their patients who were using any contraceptive method (63%) as well as their desired contraceptive method (69%) since implementation of the ACA’s contraceptive coverage requirement in 2012.
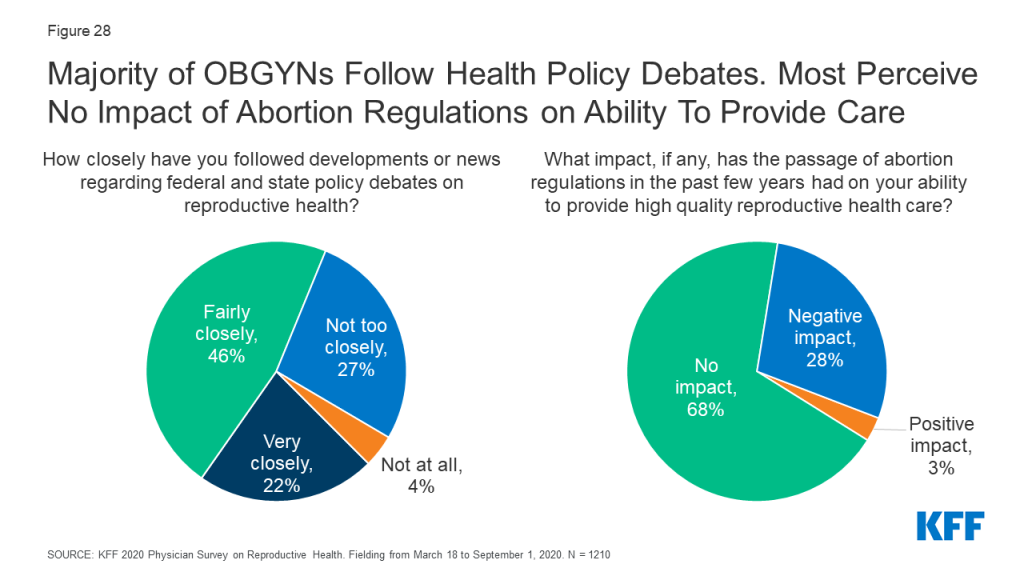
Over one in four (28%) reported that recent state-level abortion regulations including gestational age limits and regulations of providers have had a negative impact on their ability to provide quality reproductive health care; the majority (68%), however, reported that new abortion regulations have had no impact on care. Only 3% said that they improved care.
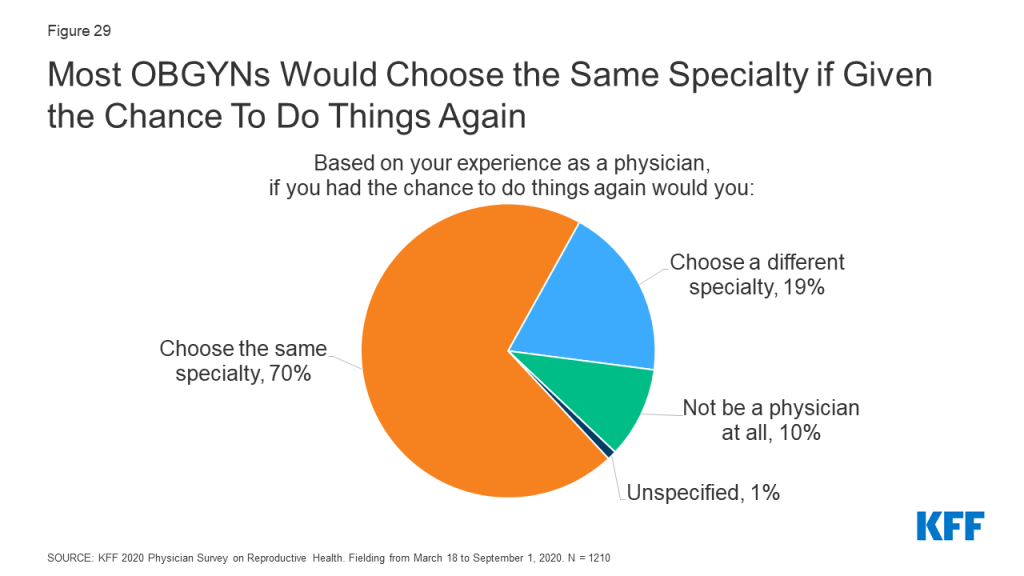
When asked about career satisfaction, 70% of OBGYNs reported they would choose the same medical specialty, while a minority said they would choose a different specialty (19%) or not be a physician at all (10%).
Conclusions and Implications
Our findings suggest that patients may experience gaps in the availability of comprehensive SRH care provision depending on where they seek care and the providers they see. The vast majority of OBGYNs provided most forms of hormonal contraception, STI testing, cervical cancer screening, basic infertility diagnostics and prenatal care, but only a minority provided emergency contraception, abortion care, PrEP for HIV prevention, gender affirming care and resources to address psychosocial needs. This may reflect differences in training, personal preferences, and resource availability among OBGYNs.
Regional variation in SRH provision were was observed, particularly regarding the availability of same-day LARC insertions, abortion provision, and preparedness to meet the needs of LGBTQ patients. This could suggest that differences in state-level policies around SRH care, including the decision to expand Medicaid or not, may be influencing practice.
Variations in service provision were also observed by physician age. Younger physicians more often reported providing all methods of contraception, same-day LARCs, PrEP for HIV prevention, prenatal care and gender affirming care compared to the oldest group of OBGYNs.
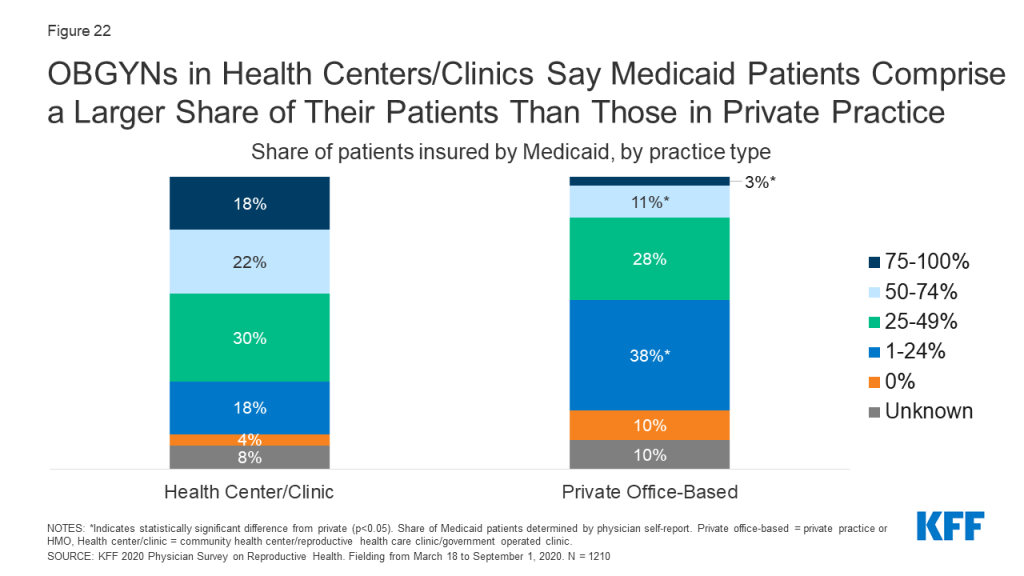
Across several measures, a more comprehensive array of SRH services was available from OBGYNs who practiced in health centers/clinics rather than private office-based practices. While the reason for this difference is unknown based on this survey, it could perhaps reflect adherence to guidelines set out by the Health Resources & Services Administration’s Bureau of Primary Health Care Health Center Program and the Office of Population Affairs’ (OPA) Quality Family Planning Guidelines. It is notable that the vast majority of OBGYNs reported they accept Medicaid patients in their practice, and OBGYNs who served a large share of Medicaid patients had similar practice patterns compared to those who do not serve many Medicaid patients.
Most OBGYNs reported following reproductive health policy debates closely but had mixed perspectives on how health policy changes influenced their practices. For example, most OBGYNs perceived increases in the share of their patients using contraception since implementation of the ACA contraceptive coverage mandate, but a minority perceived any impact of recent abortion regulations on their ability to provide quality reproductive health care. This could be attributed to the sizable variation across the country in the adoption of abortion restrictions compared to the impact of the ACA’s contraceptive requirement that affected most women with private coverage regardless of their state of residence.
Overall, we observed heterogeneity in which SRH services OBGYNs provide, varying by both physician and practice characteristics. Gaps in SRH provision that have been highlighted from this survey warrant attention at the provider, institutional and policy level, in order to continue to strive for improved patient outcomes and experiences.
Methods Summary
Methods Summary
The 2020 KFF National Physician Survey on Reproductive Health obtained responses from a nationally representative sample of OBGYNs practicing in the United States who provide SRH care to patients in office-based settings. The survey was designed and analyzed by researchers at KFF, and an independent research company, SSRS, carried out the fieldwork and collaborated on questionnaire design, pretesting, sample design, and weighting. Survey responses were collected via paper and online questionnaires from March 18 to September 1, 2020 from 1,210 OBGYNs.
The initial sample release in March 2020 corresponded with the emergence of the COVID-19 pandemic. As such, after the initial sample release, a supplement of questions were added regarding the impact of the COVID-19 pandemic on providers and their practices. Among the 1,210 OBGYNs who completed the main survey, 855 OBGYNs completed the supplemental questions related to COVID-19. The full results from the COVID-19 supplemental questionnaire can be found on the KFF website here.
In this report, we present findings on issues within SRH care provision by OBGYNs, including the range of services provided (contraception, abortion, STI care), as well as the impact of payors, particularly Medicaid, on the services they offer, and how changes in reproductive health policy have impacted their practices.
The samples were weighted to match known demographics. Taking into account the design effect, the margin of sampling error for the total sample is +/- 4 percentage points at the 95% confidence level. All comparisons noted in this brief are statistically significant (p <0.05). Please see the attached topline for the full methodology report.
Sample Overview
We surveyed a nationally representative sample of 1,210 U.S. OBGYNs currently in clinical practice. Eligible physicians were board-certified OBGYNs, spent at least 60% of their time providing direct patient care, and provided sexual and reproductive health care to at least 10% of their patients in an office-based setting. We compared survey responses by key physician and practice characteristics. Gender, age and race were determined by physician self-report. For practice type, those who indicated they work in a private practice or a health maintenance organization (HMO) were classified as “private office-based,” while those who indicated they work in a community health center (e.g., FQHC, rural health center), a reproductive health care or family planning clinic (e.g., Planned Parenthood) or a government operated clinic (e.g., VA, state/county health department) were classified as “health center/clinic.” Practice size was determined by the number of full-time equivalent (FTE) physicians or advance practice clinicians (small ≤ 3, medium 4-10, large >10). Urbanicity and region were determined by the ZIP code of the practice, using U.S. Census definitions. Practicing in a Medicaid Expansion state was determined by zip code and the KFF list of states that had implemented Medicaid expansion by March 2020. OBGYNs were asked to estimate the share of patients with different insurance coverage types, including Medicaid, Medicare, private insurance, and uninsured patients.
Characteristics of Survey Respondents
Table 1 shows the demographics of the survey respondents. The majority of OBGYNs surveyed worked in private office-based practices (77% in solo, group or hospital owned private practice, 6% in HMOs and 3% in other private practices). A minority practiced in what was defined as a health center/clinic (7% in a community clinic or health center, 1% in a reproductive health care clinic, 1% in a government operated clinic, and 3% in another type of publicly-funded clinic). Half of OBGYNs worked in medium size practices with 4-10 clinicians, and the majority practiced in urban locations. OBGYNs were split fairly evenly by region, and the majority practiced in a state with Medicaid Expansion.
Table 1: Demographics of Survey Respondents
Overall OBGYNs
N= 1,210
Characteristic
Unweighted Distribution (%)
Weighted Distribution (%)
Gender
Female
51%
64%
Male
49%
36%
Age
<45
22%
36%
45-54
28%
25%
55-64
33%
22%
65+
15%
16%
Race and Ethnicity
White
71%
70%
Black
8%
10%
Asian
12%
12%
Other
10%
9%
Practice type
Health Center/Clinic
14%
12%
Private Office-Based
85%
86%
Practice size
Large (>10 FTE)
19%
20%
Medium (4-10 FTE)
46%
50%
Small (≤ 3 FTE)
33%
28%
Urbanicity
Urban
55%
59%
Suburban
21%
23%
Rural
21%
13%
Region
Northeast
17%
21%
West
24%
23%
Midwest
23%
20%
South
37%
35%
Medicaid Expansion State
Yes
66%
68%
No
34%
32%
Share of Medicaid Patients
≥ 25%
47%
45%
<25%
51%
53%
A small percentage of respondents left demographic questions blank or their responses were unspecified, including unweighted n= 3 (0.2%) for gender, 18 (1%) for age, 14 (1%) for practice type, 26 (2%) for practice size, 35 (3%) for urbanicity, and 16 (1%) for share of Medicaid patients.NOTES: Gender, age, race and share of Medicaid patients defined by self-report. Practice type was also based on self-report: private office-based = private practice/HMO, health center/clinic = community health center/reproductive health care clinic/government operated clinic. Practice size defined by number of full-time equivalent physicians and advance practice clinicians that physicians reported in their practice (small ≤3 FTE, medium 4-10, large >10). Urbanicity, region and Medicaid Expansion state derived from zip-code.SOURCE: KFF 2020 Physician Survey on Reproductive Health. Fielding from March 18 to September 1, 2020. N = 1210
Report: Clinical Care
An updated version of this report was released on June 21, 2023 and can be foundhere.
Contraception
Provision of Contraception
The vast majority of OBGYNs prescribe/provide oral contraceptive pills (OCPs) (98%), intrauterine devices (IUDs) (96%), vaginal rings (96%), contraceptive injections (Depo-provera) (95%), and the patch (91%). Slightly fewer provide contraceptive implants (Nexplanon) (84%); of note, providers must complete a 2-hour live training from the manufacturer in order to provide Nexplanon, which may serve as a hurdle to some in delivering this method of contraception. Notably fewer OBGYNs provide diaphragms or cervical caps (65%) than other methods of non-emergency contraceptives (Figure 1).
Figure 1: Few OBGYNs Provide All Methods of Prescription Contraception, Including Emergency Contraception
The majority of OBGYNs (78%) provided all hormonal methods of contraception, including the contraceptive pill, patch, ring, injection, IUD and implant (Figure 1). Fewer (54%) provided all hormonal methods, plus diaphragms or cervical caps as a barrier method. About half (51%) provided all hormonal methods, plus at least one form of prescription emergency contraception, either the copper IUD or ulipristal acetate/Ella. Just 18% of OBGYNs reported prescribing all nine of the contraceptive methods asked about, including all hormonal methods (pill, patch, ring, injection, IUD and implant), a barrier method (diaphragm or cervical cap) and both methods of prescription emergency contraception (copper IUD and ulipristal acetate/Ella).
A higher share of OBGYNs who are female compared to male, younger compared to older, and work in large practices compared to small reported providing all methods of contraception (Table 2).
Table 2: Characteristics of OBGYNs who Provide All Methods of Contraception
Characteristic
Share of OBGYNs who Provide all Methods of Contraception
Overall
18%
Gender
Female
21*
Male
12
Age
<45
28*
45-54
19*
55-64
13*
65+
5
Practice Size
Large
24*
Medium
19
Small
13
*Indicates a statistically significant difference (p<0.05) from reference group in boldNOTES: “All methods contraception” defined as providing/prescribing hormonal contraceptive pills, patch, ring, diaphragm or cervical caps, IUDs, implants, injectables and emergency contraception (Copper IUD and Ulipristal Acetate/Ella). Gender and age defined by physician self-report. Practice size defined by number of full-time equivalent physicians and advance practice clinicians (small ≤3 FTE, medium 4-10, large >10).SOURCE: KFF 2020 Physician Survey on Reproductive Health. Fielding from March 18 to September 1, 2020. N = 1210
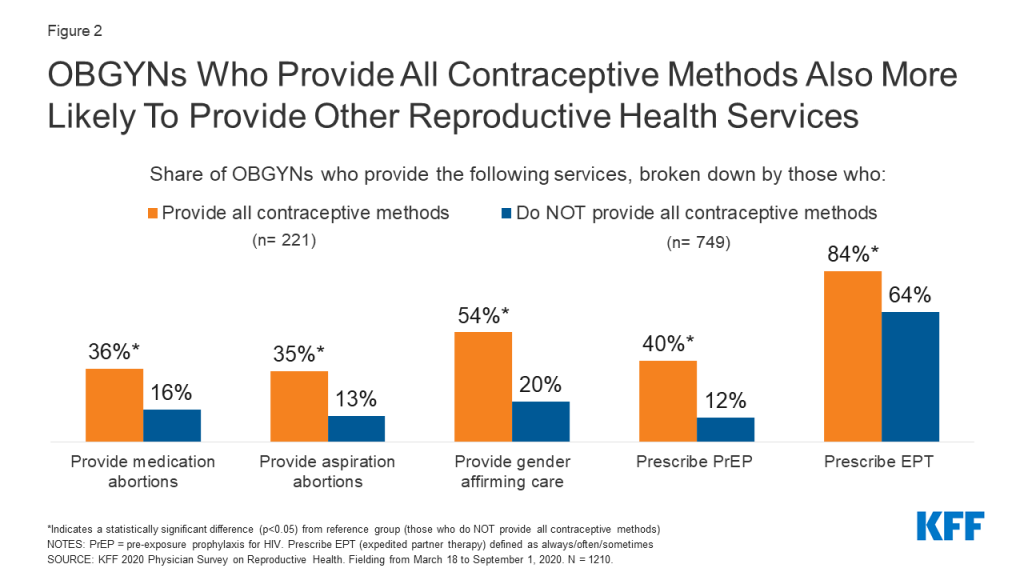
Provision of other SRH services seemed to cluster among OBGYNs who provided all contraceptive methods. For example, OBGYNs who provided all methods of contraception were more likely to provide abortions, gender affirming care, pre-exposure prophylaxis (PrEP) for HIV and expedited partner therapy (EPT) for gonorrhea and chlamydia compared to OBGYNs who do not provide all methods of contraception (Figure2).
Figure 2: OBGYNs Who Provide All Contraceptive Methods Also More Likely To Provide Other Reproductive Health Services
Provision of Emergency Contraception
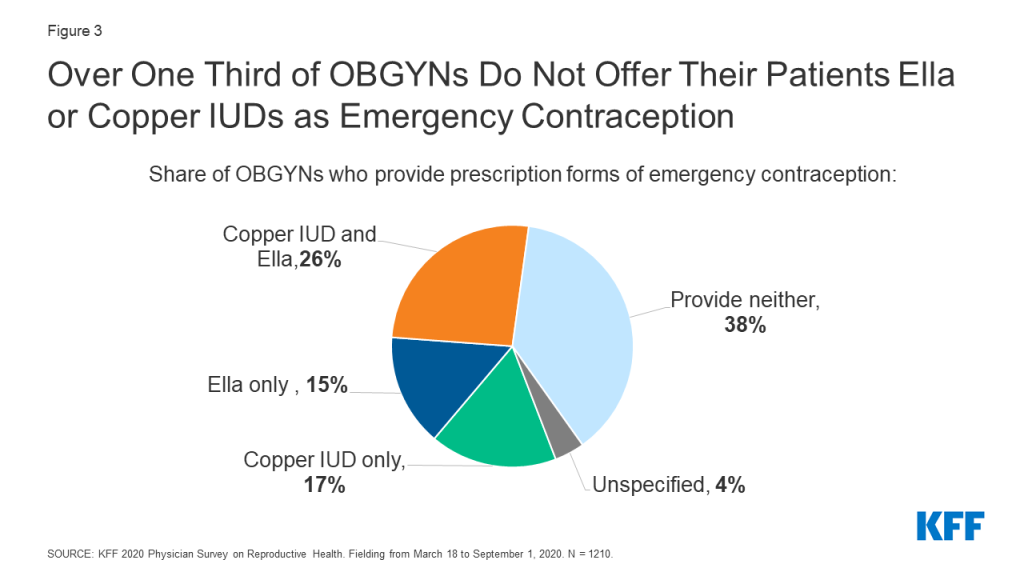
Among the three commonly used methods of emergency contraception (EC), the copper IUD and ulipristal acetate (Ella) must be prescribed, and levonorgestrel (Plan B) can be purchased over the counter. For the two methods that must be prescribed/provided by a clinician, fewer than half of OBGYNs provided copper IUDs (45%) and Ella (42%) as forms of emergency contraception (Figure 1); 38% provided neither, 26% provided both methods, 17% provided the copper IUD only and 15% provided Ella only (Figure 3).
Figure 3: Over One Third of OBGYNs Do Not Offer Their Patients Ella or Copper IUDs as Emergency Contraception
A higher share of female OBGYNs provided copper IUDs and Ella compared to male OBGYNs, as did younger OBGYNs (age <55) compared to older OBGYNs (age 65+). Geographically, a higher percentage of OBGYNS in the Northeast and West offered copper IUDs and Ella for emergency contraception compared to the South, as did OBGYNs in states that have expanded Medicaid compared to those that have not. A larger share of abortion providers offered the copper IUD as EC and Ella compared to non-abortion providers (Table 3).
Table 3: Emergency Contraception (EC) Provision
Characteristic
Provides following forms of EC:
Copper IUD
Ulipristal Acetate (Ella)
Overall
45%
42%
Gender
Female
51*
46*
Male
33
36
Age
<45
65*
51*
45-54
45*
43*
55-64
29
37
65+
22
30
Region
Northeast
47*
47*
West
58*
55*
Midwest
47*
40
South
34
32
Practice in Medicaid Expansion State
Yes
52*
47*
No
30
32
Provide Abortions
Yes
59*
61*
No
42
37
*Indicates statistically significant difference (p<0.05) from reference group in boldNOTES: Gender, age and provides abortions defined by self-report. Region and Medicaid Expansion derived from zip code.SOURCE: KFF 2020 Physician Survey on Reproductive Health. Fielding from March 18 to September 1, 2020. N = 1210
Considerations for LARCs and injectables
The majority of OBGYNs (84%) reported they provide both types of LARCs (IUDs and implants) and 11% provided just one type. However, among those who provide IUDs and implants respectively, only about two in five provided same-day placement for IUDs (40%) and implants (39%). This means that at the majority of OBGYN practices, patients must make more than one trip to the clinic to obtain a LARC.
Provision of same-day LARCs was more common among OBGYNs who are younger, work in health centers/clinics, in large practices, and outside the South (Table 4). Additionally, a larger share of OBGYNs who provided all methods of contraception offered same-day IUD (64% vs. 33%) and implant (62% vs. 32%) insertions compared to those who did not offer all contraceptive methods. A higher percentage of abortion providers provided same-day IUD (56% vs. 36%) and implant (54% vs. 35%) insertions compared to non-abortion providers, which may be important for some patients as part of post-abortion care.
Table 4: Provision of same-day LARCs, by demographics
Characteristic
Provides same-day placement of:
IUDs
Implants
Overall
40%
39%
Age
<45
44*
45*
45-54
46*
41
55-64
36
35
65+
27
28
Practice type
Health center/clinic
62*
61*
Private office-based
37
36
Practice size
Large
61*
60*
Medium
39*
36
Small
28
29
Region
Northeast
43*
41
West
49*
49*
Midwest
43*
45*
South
30
29
*Indicates statistically significant difference (p<0.05) from reference group in boldNOTES: Age defined by self-report. Private office-based = private practice or HMO, Health center/clinic = community health center/reproductive health care clinic/government operated clinic. Practice size: 1-3 FTE clinicians small, 4-10 medium, >10 large. Region derived from zip code.SOURCE: KFF 2020 Physician Survey on Reproductive Health. Fielding from March 18 to September 1, 2020. N = 1210
Insurance restrictions and requirements around prior authorization for contraception likely play a role in whether or not providers offer same-day LARCs. We asked OBGYNs whether the Medicaid plan they bill most often required them to obtain prior authorization for specific contraceptives; a higher share of those who had not been required to obtain prior authorization for contraceptives provided same day placement of IUDs (52% vs. 31%) and implants (52% vs. 32%) compared to OBGYNs that reported prior authorization had been required.
Beyond insurance hurdles, practices may not offer same-day LARC insertion if they do not have the contraceptive methods stocked onsite. Among those that provide IUDs, four in five (79%) stock IUDs onsite; nearly three in four implant providers (73%) stock implants onsite; and about half (51%) of OBGYNs who provide injectables stock them on site. Stocking these contraceptive methods onsite was more common among OBGYNs in health centers/clinics than private office-based practices, in large and medium size practices rather than small, and among OBGYNs who provide all methods of contraception compared to those who do not (Table 5).
Additionally, a larger share of OBGYNs who reported prior authorization was not required for specific contraceptives stocked IUDs (90% vs. 75%) and implants (87% vs. 65%) compared to OBGYNs who reported prior authorization was required for specific contraceptives. This suggests that requirements around prior authorization could play a role limiting the availability of same-day LARC insertion.
Table 5: Stocking Contraceptive Methods Onsite Varies by Practice Characteristics
Characteristic
Among OBGYNs who provide these methods of contraception, share who stock:
IUDs
Implants
Injectables
Overall
79%
73%
51%
Practice type
Health center/clinic
92*
93*
84*
Private office-based
77
69
46
Practice size
Large
94*
89*
72*
Medium
83*
73*
50*
Small
62
58
38
Provides All Methods of Contraception
Yes
94*
91*
74*
No
74
67
45
*Statistically significant difference from reference group in boldNOTES: Practice type: Private office-based = private practice or HMO, Health center/clinic = community health center/reproductive health care clinic/government operated clinic. Practice size: 1-3 FTE clinicians small, 4-10 medium, >10 large. Medicaid Expansion derived from zip code. All contraception = pill, patch, ring, IUD, implant, injection, diaphragm, Copper IUD and Ella for ECSOURCE: KFF 2020 Physician Survey on Reproductive Health. Fielding from March 18 to September 1, 2020. N = 1210.
Fertility Awareness-Based Methods
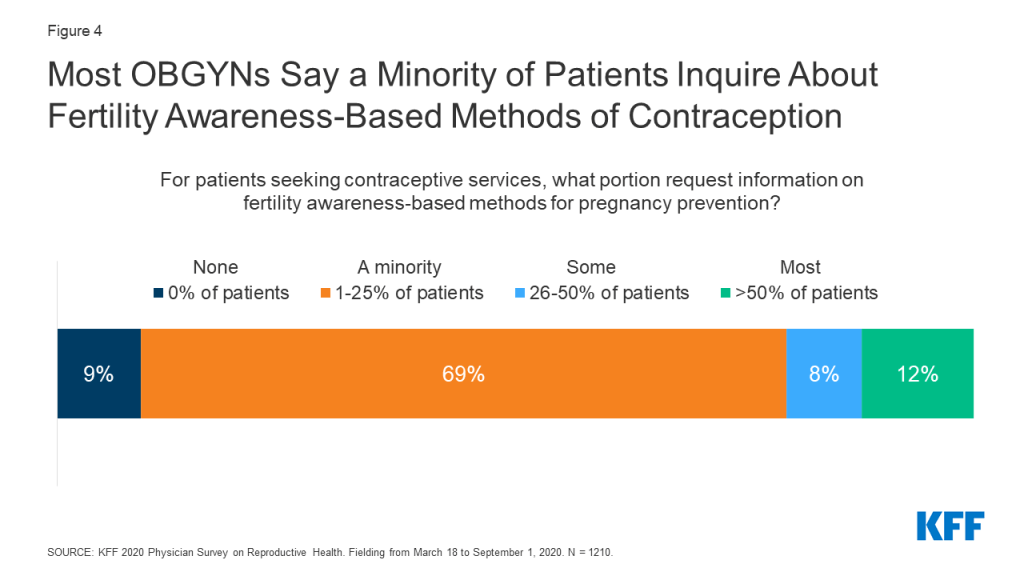
Under the Trump Administration, there was increased federal support for and attention to fertility awareness-based methods (FABM) of contraception – that is tracking ovulation. This includes instruction on monitoring basal body temperature, cervical mucus, hormone production, cervical position, and calendar tracking. For patients seeking contraceptive services, most OBGYNs reported that a minority of patients request information on FABM. More than three fourths (78%) of OBGYNs said less than a quarter of patients requested this information (Figure 4).
Figure 4: Most OBGYNs Say a Minority of Patients Inquire About Fertility Awareness-Based Methods of Contraception
Abortion
Abortion provision by U.S. OBGYNs
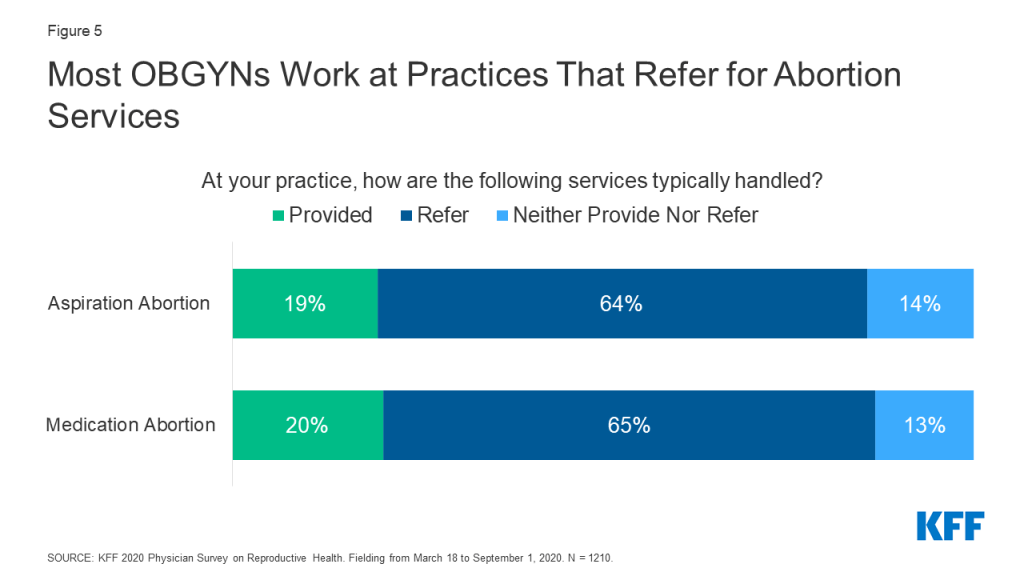
One in five OBGYNs said their practice provides medication abortions (20%) and aspiration abortions (19%), but the majority of OBGYNs did not provide abortions for pregnancy termination in their practices. Nearly two-thirds referred patients to outside providers for these services, and a minority neither provided nor referred for these services (Figure 5). These data are fairly consistent with prior estimates of abortion provision in the U.S. (Stulberg et al. 2012, Grossman et al. 2019).
Figure 5: Most OBGYNs Work at Practices That Refer for Abortion Services
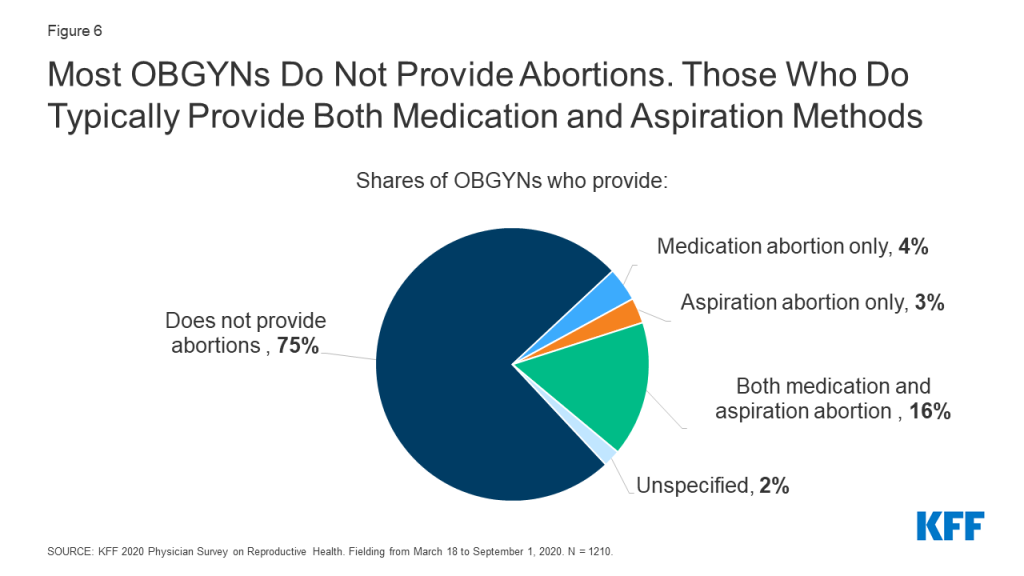
While 75% of OBGYNs surveyed did not provide abortions within their practices, 23% provided at least one type of abortion; 16% offered both medication and aspiration abortions in their practices, 4% provided medication abortions only and 3% provided aspiration abortions only (Figure 6). Among abortion providers, seven in ten (71%) provided both medication and aspiration abortions, suggesting that most OBGYNs who choose to provide abortions offer more than one method of pregnancy termination. Having this option is important to many people seeking abortion care, who may prefer one method over another.
Figure 6: Most OBGYNs Do Not Provide Abortions. Those Who Do Typically Provide Both Medication and Aspiration Methods
Characteristics of OBGYNs who provide abortions
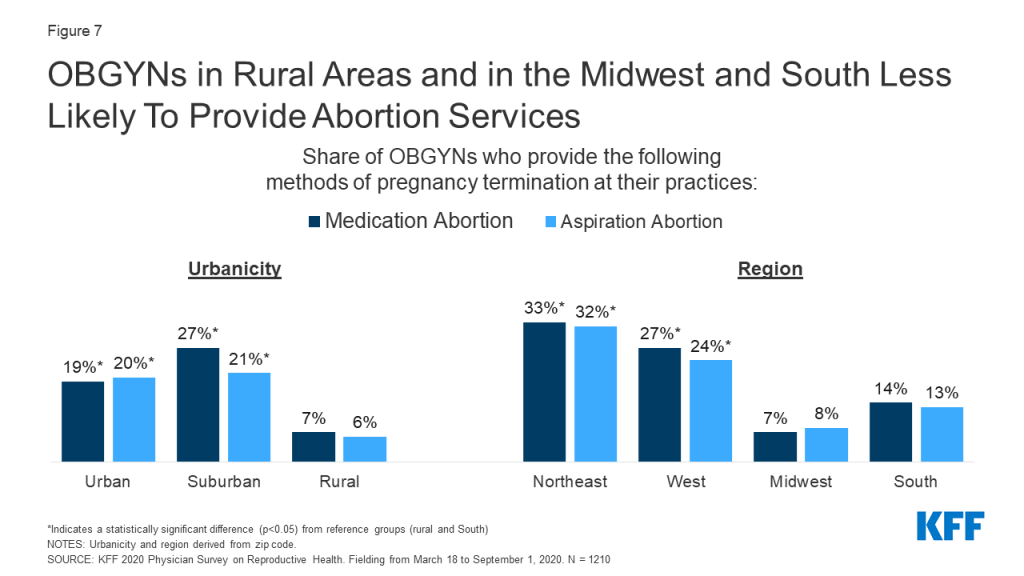
The provision of abortion services varied by region and urbanicity. A larger percentage of OBGYNs in urban and suburban locations than those in rural locations provided medication and aspiration abortions, while a larger share of OBGYNs in the Northeast and West reported providing both types of abortions compared to OBGYNs in the Midwest and South (Figure 7). Similar trends by urbanicity and region were found by Stulberg et al. in their 2008 survey of U.S. OBGYNs.
Figure 7: OBGYNs in Rural Areas and in the Midwest and South Less Likely to Provide Abortion Services
Additionally, a higher share of the youngest group of OBGYNs, age <45, provided medication abortions within their practices compared to older physicians, age 65+. More OBGYNs at large practices offered aspiration abortions than those at medium and small practices. No differences were seen by practice size for medication abortions (Table 6).
Table 6: Abortion Provision Varies by Physician and Practice Characteristics
Share of OBGYNs who provide:
Medication abortions
Aspiration abortions
Overall
20%
19%
Age
<45
25*
22
45-54
22
20
55-64
14
15
65+
13
14
Practice type
Health Centers/Clinics
23
22
Private Office-Based
19
18
Practice Size
Large
23
27*
Medium
21
18
Small
15
15
Urbanicity
Urban
19*
20*
Suburban
27*
21*
Rural
7
6
Region
Northeast
33*
32*
West
27*
24*
Midwest
7
8
South
14
13
*Statistically significant difference (p<0.05) from reference group in boldNOTES: Age defined by self-report. Practice type: private = private practice/HMO, public = community health center/reproductive health care clinic/government operated clinic. Practice size defined by number of full-time equivalent physicians and advance practice clinicians (small ≤3 FTE, medium 4-10, large >10). Urbanicity and region derived from zip-code.SOURCE: KFF 2020 Physician Survey on Reproductive Health. Fielding from March 18 to September 1, 2020. N = 1210
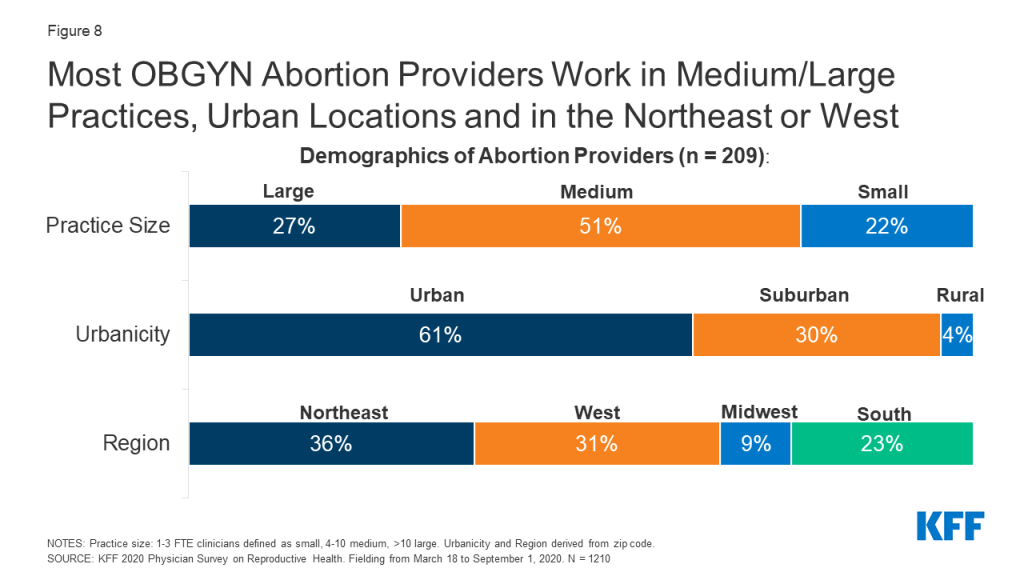
Among abortion providers, similar demographic patterns held true. The majority of abortion providers worked in medium or large size practices compared to small. Six in ten abortion providers worked in urban areas, three in ten in suburban areas and just 4% in rural practices. Approximately one-third of OBGYNs who work in practices providing abortions were in the Northeast (36%), another third in the West (31%), with much fewer in the more conservative Midwest (9%) and Southern (23%) regions (Figure 8). These findings are consistent with prior research by Stulberg et al. that found abortion provision is clustered in urban areas and scarce in the Midwest and South.
Figure 8: Most OBGYN Abortion Providers Work in Medium/Large Practices, Urban Locations and in the Northeast or West
When looking at practice type, the share of OBGYNs who provided medication and aspiration abortions did not differ between health centers/clinics and private office-based practices (Table 6). However, a smaller share of those in health centers/clinics referred for both medication (51% vs. 66%) and aspiration abortions (51% vs. 66%) compared to those in private office-based practice; for health centers/clinics participating in the Title X Family Planning program, fewer referrals may be due to changes to the program regulations which did not permit Title X recipients to refer patients for abortions at the time the survey was fielded.
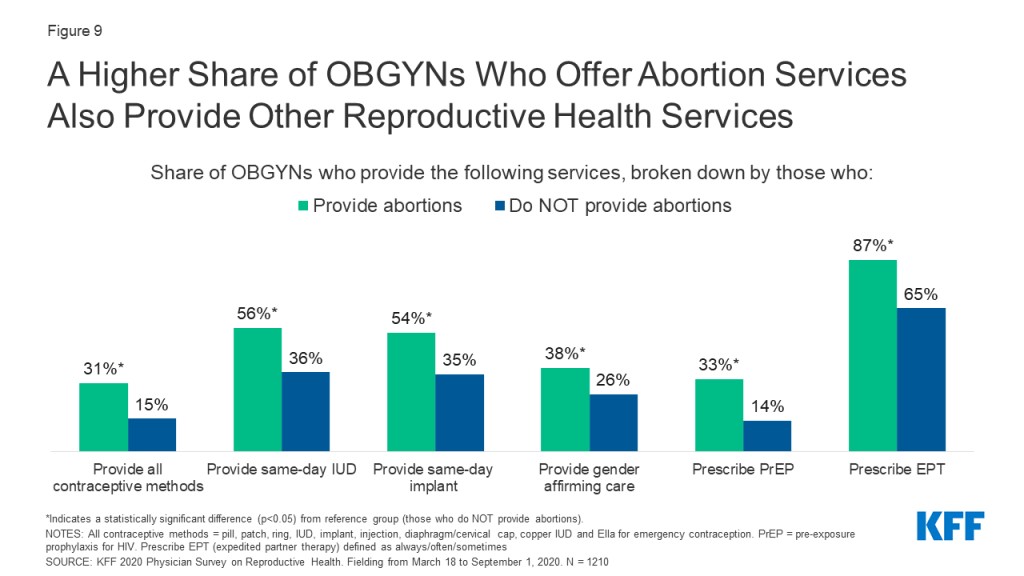
Compared to OBGYNs who do not provide abortions, a larger percentage of those who offered abortions provided a choice of all methods of contraception including emergency contraception, and provided same-day IUD and implant placement; this is notable given post-abortion contraception is an important component of abortion care for some women. A higher share of abortion providers also provided a wide range of STI services compared to non-abortion providers, including prescription of PrEP for HIV prevention and prescription of expedited partner therapy (EPT). It was also more common for abortion providers to provide gender affirming care compared to OBGYNs who did not provide abortions at their practice (Figure 9).
Figure 9: A Higher Share of OBGYNs Who Offer Abortion Services Also Provide Other Reproductive Health Services
characteristics of OBGYNs who DO NOT provide Abortions
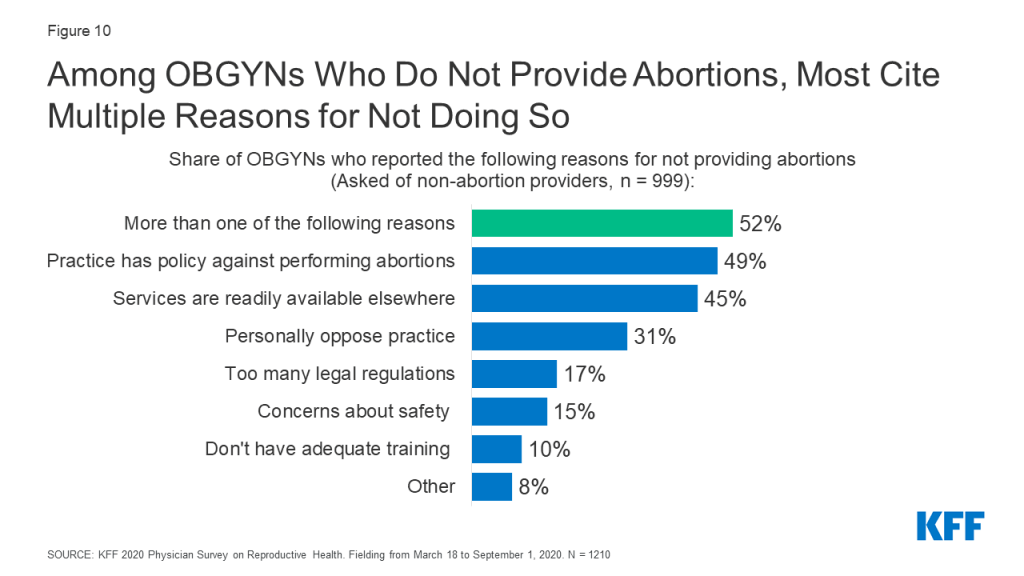
Among OBGYNs who do not provide abortions in their practices, most cited more than one reason for not providing abortions. About half (49%) say their practice has a policy against abortions, 45% say services are readily available elsewhere, 31% personally oppose the practice, 17% say there are too many legal regulations and 15% cite safety concerns for staff as their reasons for not providing abortions (Figure 10).
Figure 10: Among OBGYNs Who Do Not Provide Abortions, Most Cite Multiple Reasons for Not Doing So
Only 10% reported they did not have adequate training to be providing this service, however this number was higher among the youngest group of physicians, age <45, compared to all older groups (age <45: 20%, 45-54: 7%, 55-64: 3%, 65+: 3%). This may reflect changes to abortion training over time. In 1996, the accrediting organization for OBGYN, the ACGME, instituted a training requirement for OBGYN residency programs to provide training in abortion provision, with opt out options for those with religious or moral objections. In a 2002 study of U.S. OBGYNs, it was found that younger OBGYNs were more likely than older OBGYNs to provide abortion, which was attributed to this change in medical training. However, a study by the National Academies of Sciences, Engineering and Medicine pointed out that not all residency programs follow the ACGME requirement, and that abortion training may have become more limited in recent years due to institutional policies, state laws, and mergers with religiously-affiliated hospitals.
Among those who do not provide abortions, more male OBGYNs personally oppose the practice than female (39 vs. 27%). Additionally, among those who do not provide abortions, 61% of OBGYNs in health centers/clinics say their practice has a policy against performing abortions compared to 47% in private office-based practice; this could reflect federal and state level restrictions on the use of public funds for the provision of or referral for abortion found in the federal Title X program, the Hyde amendment and state laws.
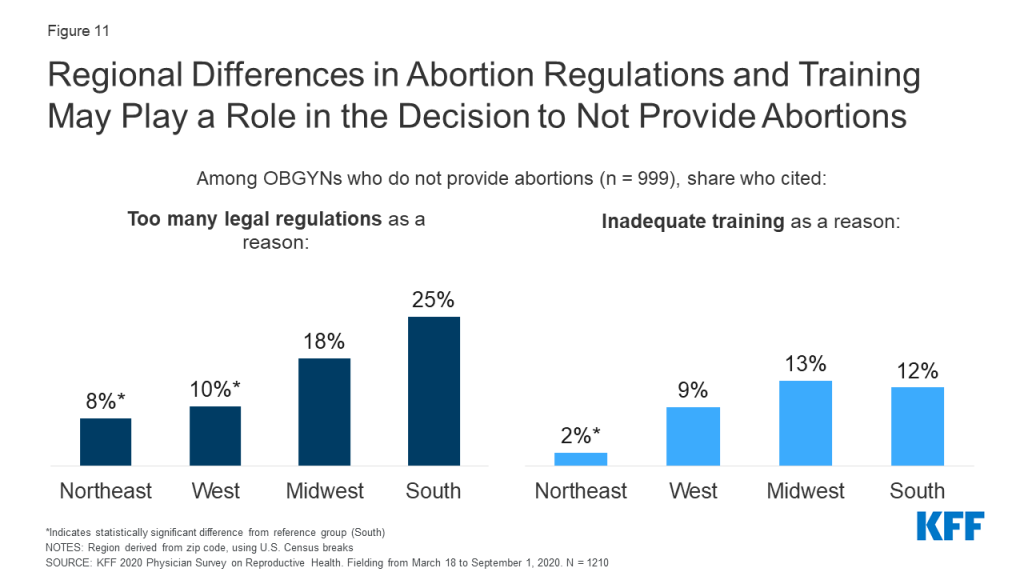
By region, a higher share of OBGYNs in the South reported that the high number of legal regulations associated with abortion (25%) was a reason they didn’t offer abortion compared to OBGYNs in the Northeast (8%) and West (10%). A higher share of OBGYNs in the Midwest (13%) and South (12%) also reported not having enough adequate training to provide abortion compared to OBGYNs in the Northeast (2%) (Figure 11).
Figure 11: Regional Differences in Abortion Regulations and Training May Play a Role in the Decision to Not Provide Abortions
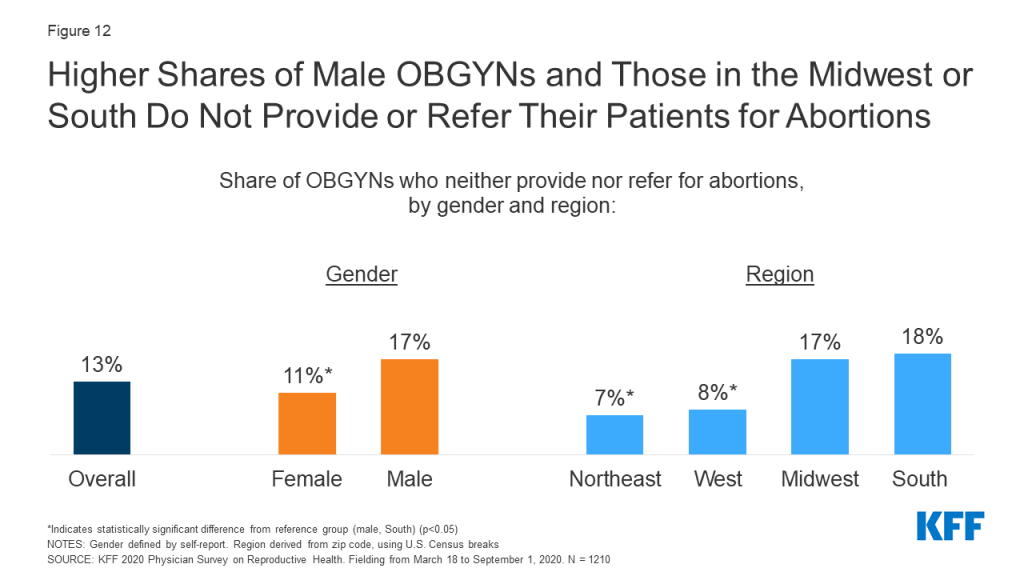
Most OBGYNs who did not provide abortions, however, referred patients for these services (Figure 5). A small share of OBGYNs (13%) neither provided abortions nor referrals for patients to obtain abortions at another practice or clinic. This was more common among OBGYNs who are male compared to female, and work in practices in the South and Midwest compared to the West and Northeast (Figure 12). No differences were identified by age, practice type, practice size or urbanicity.
Figure 12: Higher Share of Male OBGYNs and Those in the Midwest or South Do Not Provide or Refer Their Patients for Abortions
Other Sexual and Reproductive Health Services
Care for Sexually Transmitted infections
The United States Preventive Services Task Force (USPSTF) recommends testing for gonorrhea, chlamydia, HIV and syphilis at differing points in people’s lives. The vast majority of OBGYNs provide onsite testing at their practice for gonorrhea and chlamydia (99%), syphilis (90%) and HIV (87%) (Table 7). About a third have onsite have lab processing as well for these STIs (38%/34%/34% respectively), rather than sending samples to outside labs.
Table 7: Share of OBGYNs Who Provide Onsite STI Testing
Is onsite testing available at your practice for the following STIs?
Yes
No
Gonorrhea and Chlamydia
99%
<1%
Syphilis
90%
9%
HIV
87%
12%
SOURCE: KFF 2020 Physician Survey on Reproductive Health. Fielding from March 18 to September 1, 2020. N = 1210
While testing for gonorrhea and chlamydia was near universal, a small share of OBGYNs did not provide onsite testing for syphilis (9%) or HIV (12%) (typically collected via blood draws), meaning a patient would need to visit a separate facility for testing. This is important to note given the rising rates of congenital syphilis, primary and secondary syphilis among women, and HIV among certain groups of women in recent years. A higher share of OBGYNs in private office-based practices compared to health centers/clinics, and in small practices compared to medium and large did not test offer onsite testing for syphilis and HIV (Figure 13).
Figure 13: OBGYNs in Private Practices and Small Practices Less Likely to Offer Onsite Testing for Syphilis and HIV
Pre-Exposure Prophylaxis (PrEP) Provision
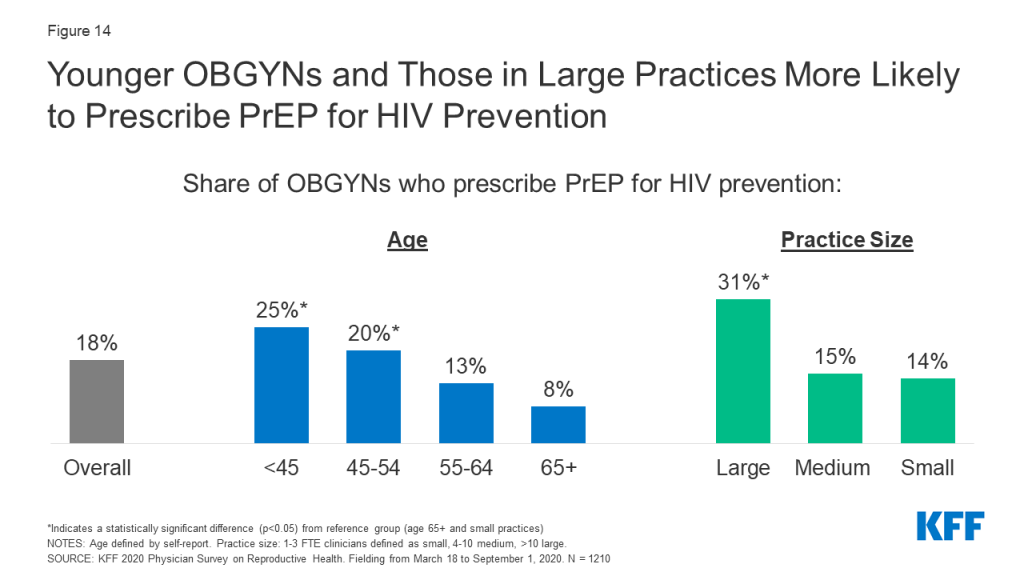
According to the CDC, there remains a substantial gap, particularly among women, between the number of people with indications to be on the HIV prevention medication known as PrEP, and those who have been prescribed this medication. This may be in part due to a limited number of providers who prescribe PrEP. In our sample of OBGYNs, fewer than one in five (18%) prescribe PrEP for the prevention of HIV. This varied some by physician and practice characteristics; PrEP prescription was more common among younger OBGYNs ages compared to older, and among those in large practices compared to medium and small (Figure 14).
Figure 14: Younger OBGYNs and Those in Large Practices More Likely to Prescribe PrEP for HIV Prevention
Expedited Partner Therapy
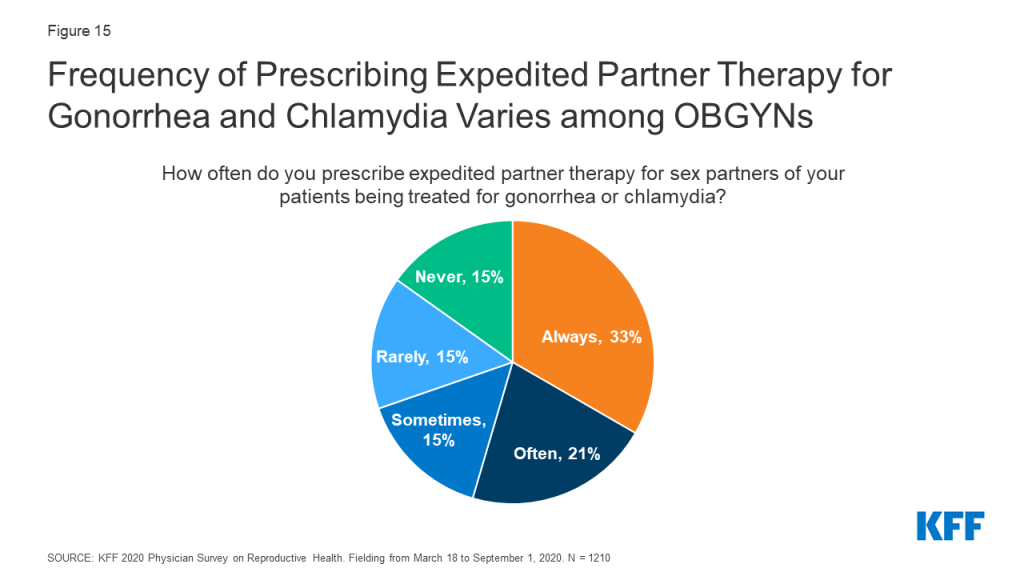
OBGYNs varied in how often they prescribed expedited partner therapy (EPT) for sex partners of patients being treated for gonorrhea or chlamydia. EPT describes the practice of prescribing STI treatment for a patient’s sex partner(s) without an in-person medical evaluation of their partner(s). About half of OBGYNs said they always (33%) or often (21%) prescribe EPT for gonorrhea and chlamydia, while some said they do so sometimes (15%). Nearly third said that they rarely (15%) or never (15%) prescribe EPT (Figure 15).
Figure 15: Frequency of Prescribing Expedited Partner Therapy for Gonorrhea and Chlamydia Varies among OBGYNs
Additional SRH Services
Beyond contraception, STIs and abortion care, OBGYNs reported providing a range of other sexual and reproductive health services within their practices, while a small percentage refer their patients to other providers for these services (Table 8). Almost all OBGYNs reported they provide pap smears and human papillomavirus (HPV) testing (98%), colposcopies for abnormal pap smears (96%), basic infertility diagnostic services (90%) and prenatal care for low risk pregnancies (88%) within their practices, however some notable differences in service provision emerged. For example, fewer OBGYNs in health centers/clinics provided basic infertility diagnostics (e.g., lab testing, pelvic ultrasound, semen analysis) as compared to those in private office-based practices (78% vs. 92%). Additionally, provision of prenatal care was less common among older doctors (age 65+) compared to younger doctors, and those in small practices compared to medium or large (Table 9).
Table 8: Health Care Services Provided by OBGYNs
Service
Provided within their practice
Referred to another provider
Pap Smears and HPV Testing
98%
1%
Colposcopies
96%
3%
Basic Infertility Diagnostic Services
90%
8%
Prenatal Care for Low Risk Pregnancies
88%
11%
Gender Affirming Care
28%
55%
NOTES: Responses do not total 100%, as they leave out those who answered that they neither provide nor refer for these services, and those who left the question unspecifiedSOURCE: KFF 2020 Physician Survey on Reproductive Health. Fielding from March 18 to September 1, 2020. N = 1210
Table 9: Provision of Low-Risk Prenatal Care by OBGYNs
Provides prenatal care for low-risk pregnancies
Overall
88%
Age
<45
92*
45-54
89*
55-64
89*
65+
75
Practice Size
Large
95*
Medium
93*
Small
74
*Statistically significant difference (p<0.05) from reference group in boldNOTES: Age defined by self-report. Practice size defined by number of full-time equivalent physicians and advance practice clinicians (small ≤3 FTE, medium 4-10, large >10).SOURCE: KFF 2020 Physician Survey on Reproductive Health. Fielding from March 18 to September 1, 2020. N = 1210
Notably the provision of gender affirming care was less commonly reported than other SRH services. About one in four (28%) OBGYNs reported that gender affirming services were provided at their practice (e.g. hormone therapy or gender affirming surgery) (Table 8). Another 55% refer patients for this care, while approximately one in ten OBGYNS (9%) neither provide nor refer for these services.
A higher share of OBGYNs in younger age groups compared to older worked at a practice offering gender affirming care, as did those who worked at large and medium practices compared to small. Regionally, provision of gender affirming care was more common among OBGYN practices in the West than in the Northeast, Midwest, and South (Figure 16).
Figure 16: Provision of Gender Affirming Care Varies by Physician Age, Practice Size and Region
Preparedness to Address SRH Needs of LGBTQ Patients
Providers varied in how prepared they felt to meet the sexual and reproductive health care needs of sexual and gender minority patients. Nearly nine in ten (88%) OBGYNs said they were very or somewhat prepared to meet the SRH needs of lesbian, gay, bisexual and queer patients, while the same was true for only 56% of OBGYNs when it came to transgender patients (Figure 17).
Figure 17: Preparedness to Address the SRH needs of LGBTQ patients Varies Among OBGYNs
Perceived preparedness was higher among certain groups of OBGYNs. OBGYNs more often reported feeling very or somewhat prepared to meet the SRH needs of LGBTQ patients if they were female compared to male, and if they offered gender affirming care at their practices compared to not. Regionally, more OBGYNs in the West felt prepared to meet the SRH needs of transgender patients compared to those in the Midwest or South (Table 10).
Table 10: Perceived preparedness to meet SRH needs of LGBTQ patients, by physician characteristics
Characteristics
Share of OBGYNs reported feeling very or somewhat prepared to meet the sexual and reproductive health needs of:
Gay, lesbian, bisexual and queer patients
Transgender patients
Overall
88%
56%
Gender
Female
90*
61*
Male
84
48
Region
Northeast
87
56
West
89
66*
Midwest
87
54
South
89
51
Practice provides gender affirming care
Yes
93*
81*
No
87
47
*Indicates statistically significant difference from reference group in bold (p<0.05)NOTES: Gender and provision of gender affirming care defined by self-report. Region derived from zip code, using U.S. census breaks.SOURCE: KFF 2020 Physician Survey on Reproductive Health. Fielding from March 18 to September 1, 2020. N = 1210
Psychosocial Needs
In recent years, emphasis has been placed on incorporating screening for the social determinants of health and mental health needs into routine clinical care. We asked OBGYNs about their screening and intervention practices for four psychosocial needs—intimate partner violence (IPV), depression, housing and transportation. Nearly all OBGYNs screened patients for IPV and depression. A very small share of OBGYNs reported they do not screen any of their patients for IPV (4%) or depression (2%). This is perhaps not surprising given there are formal recommendations from USPSTF and ACOG to screen for both IPV and depression.
For social needs without formal screening recommendations however, screening was more variable. Almost half of OBGYNs said that they do not screen any of their patients for unmet housing needs (47%) or transportation barriers (45%) (Figure 18).
Figure 18: More OBGYNs Screen Patients for IPV and Depression Than Housing and Transportation Needs
In the event a patient discloses or screens positive for one of these needs, most OBGYNs referred patients to outside resources for IPV (75%), depression (66%), housing (55%) and transportation (53%). Few had resources or a social worker onsite to address these needs (Figure 19). More than one in four OBGYNs (27%) said they neither have internal resources nor refer to external resources if a patient screens positive for unmet housing or transportation needs.
Figure 19: Most OBGYNs Refer to Outside Resources to Address Psychosocial Needs in the Event of a Positive Screen
Report: Medicaid
Medicaid is a significant source of coverage for many people of reproductive age, covering 17% of non-elderly adult women in 2019 and financing in the U.S. and the majority of publicly-funded family planning services. Given the prominence of Medicaid as a payor for reproductive age women and services, it’s not surprising that many practices accept Medicaid. Nearly four out of five (78%) OBGYNs reported their practice accepts Medicaid, and 72% said that their practice is accepting new Medicaid patients. More OBGYNs in health centers/clinics accepted Medicaid patients compared to those in private office-based practices (90% vs. 77%). Additionally, a higher share of OBGYNs who practiced in rural areas compared to suburban or urban, and in the Midwest than the Northeast, South, and West accepted Medicaid (Figure 20). On average, OBGYNs who accept Medicaid estimated about half of their Medicaid patients (54%) were enrolled in managed care arrangements.
Figure 20: Acceptance of Medicaid Varies by Practice Type, Urbanicity, and Region
OBGYNs who practiced in health centers/clinics reported that, on average, 46% of their practices’ patients were on Medicaid, nearly double the rate of those who practice in private office-based settings (24%). On average, OBGYNs in health centers/clinics also saw a larger share of uninsured patients than private office-based practices (17% vs. 5%), as well as patients on other forms of public insurance like TRICARE and CHAMPUS (18% vs. 5%). OBGYNs in rural practices also reported, on average, higher shares of patients on Medicaid than those in urban and suburban practices (Figure 21).
Figure 21: OBGYNs in Health Centers/Clinics and Rural Practices Report on Average Higher Shares of Medicaid Patients
Some 40% of OBGYNs practicing in health centers/clinics reported that Medicaid patients accounted for over half of the patients seen in their practice, compared to 14% of those in private office-based practices (Figure 22).
Figure 22: OBGYNs in Health Centers/Clinics Say Medicaid Patients Comprise a Larger Share of Their Patients Than Those in Private Practice
Medicaid Coverage Limitations
While most OBGYNs see patients with Medicaid, many reported payor challenges that came along with providing care for these patients. The vast majority of OBGYNs whose practice accepts Medicaid also reported that Medicaid pays much less (49%) or somewhat less (41%) than most private insurance plans (Figure 23). It was more common for OBGYNs in private office-based practice to say Medicaid pays less compared to those in health centers/clinics (91% vs. 82%), but providers in both settings reported lower payment rates compared to private plans.
Additionally, among OBGYNs who said their practice accepts Medicaid, nearly three in four said it was much harder (28%) or somewhat harder (45%) to find specialists who accept referrals for Medicaid compared with most private insurance plans (Figure 23). This challenge was reported by more than eight in ten OBGYNs in the South (83%), compared to lower shares in the Northeast (60%), West (72%), and Midwest (68%). OBGYNs in states that have not expanded Medicaid were also more commonly found to report this challenge compared to those in Medicaid Expansion states (84% vs. 68%), as were those in urban areas compared to rural areas (77% vs. 63%).
Figure 23: OBGYNs Say Medicaid Pays Less Than Private Insurance and It Is Harder to Find Specialists for Referrals
Most OBGYNs said they also faced Medicaid limitations specific to providing contraceptive care. Many had been required to obtain prior authorization for specific contraceptives (45%). About a third had been limited to prescribing a 30-day initial supply for some contraceptive methods (33%). Fewer had experienced their patients having to use certain contraceptive methods before stepping up to more costly ones, known as “step therapy” (18%), or replacement barriers for LARCs that had been removed or expelled (15%) (Figure 24). A sizable share of OBGYNs were not sure if these limitations had affected their practices or not.
Figure 24: Most OBGYNs Have Faced Contraceptive Coverage Limitations From Medicaid Plans
The majority of OBGYNs who accept Medicaid (60%) said they had encountered at least one of the Medicaid limitations asked about with respect to Medicaid coverage of contraceptives; 28% reported one of the four limitations, 16% reported two limitations, 12% reported three limitations but very few reported all four limitations (4%).
Report: Policy Considerations
Cost of Care
OBGYNs reported that affordability comes up commonly when talking to patients. Nine in ten OBGYNs said the issue of affordability always (11%), often (42%) or sometimes (38%) comes up when they recommend tests or treatment to their patients. Few said affordability came up rarely (7%) or never (1%).
Despite the topic of affordability arising frequently in patient-provider interactions, OBGYNs were not always aware of the out-of-pocket (OOP) costs patients were facing. When making diagnostic and treatment recommendations for patients, 14% said they were always aware of the magnitude of patients’ out of pocket costs. The rest said they were often (39%), sometimes (31%), rarely (13%) or never (2%) aware of these costs (Figure 25).
Figure 25: OBGYNs Vary in How Often They Consider and Discuss Affordability of Care
The issue of affordability and awareness of OOP costs varied by certain practice characteristics. OBGYNs in small practices compared to medium or large were more commonly found to report the issue of affordability always arising when recommending care to patients (small 18%, medium 9%, large 7%), and to report always be aware of the magnitude of OOP costs (small 23%, medium 11%, large 10%). There was no difference in how often the issue of affordability arises or awareness of OOP costs by practice type or share of Medicaid patients (25%+ vs. <25%).
Nearly all OBGYNs acknowledged the cost burden that can be associated with seeking reproductive health care. Almost all OBGYNs said the cost of reproductive health services poses a major (55%) or minor (37%) financial burden for low-income patients in their practices, while only 7% believed it poses no financial burden (Figure 26). A higher share of OBGYNs in states without Medicaid expansion reported these services pose a major financial burden for low-income patients compared to OBGYNs in states with Medicaid expansion (63% vs. 52%).
Figure 26: Most OBGYNs Say the Cost of Reproductive Health Services Poses a Financial Burden to Their Low-Income Patients
Impact of the ACA on Contraceptive Use
The passage of the Affordable Care Act (ACA) had several implications for women’s health care, and SRH care more broadly. Beginning in 2012, the law required nearly all private insurance plans to cover prescription contraceptive services and supplies without cost sharing to women. Since this regulation was implemented, over six in ten OBGYNs (63%) reported a significantly or somewhat increased share of their patients using any contraceptive method, while fewer reported no impact (34%) or a decreased share of patients using contraception (2%). In a similar vein, nearly seven in ten (69%) OBGYNs said the share of their patients who are able to select their desired contraceptive has increased significantly or somewhat since 2012 (Figure 27). Overall, these findings are consistent with other research documenting increases in contraceptive use, like IUD and implant use, since the contraceptive coverage requirement was implemented.
Figure 27: The Majority of OBGYNs Report Increasing Shares of Patients Using Contraception After ACA Implementation
A higher share of OBGYNS in private office-based practices reported increased contraceptive use as compared to those working in health centers/clinics (any contraceptive use 66% vs. 47%, desired contraceptive 72% vs. 51% respectively). This could reflect the fact that those in private practice saw on average more patients with private insurance than those in health centers/clinics (60% vs. 28%); those in health centers/clinic on average saw a higher share of Medicaid patients who are already covered for contraceptive services, but many of their formerly uninsured patients could now be covered as result of the ACA’s Medicaid expansion and have better access to contraceptive services and supplies.
Impact of Reproductive Health Policy Debates on Practice
Over the last year, several reproductive health policy debates have made their way into the news and judicial system. This includes changes to the Title X Family Planning program, debates over federal- and state-level abortion regulations and rulings on contraceptive coverage for religious employers. [For context, 27% of OBGYNs surveyed identified as Republicans, 40% as Democrats, 25% as Independents, and 6% as something else.]
Two thirds OBGYNs reported following developments or news regarding federal and state policy debates on reproductive health very closely (22%) or fairly closely (46%). The other third of OBGYNs reported they have followed these debates not too closely (27%) or not at all (4%) (Figure 28). It was more common for OBGYNs who provide abortions compared to non-abortion providers to report following reproductive health policy news very closely (36% vs. 18%), as it was for providers at practices that offer gender affirming services compared to those who do not (29% vs. 19%). This is perhaps not surprising given that access to abortion and care for transgender individuals have been the targets of a number of policy changes over the past year.
Figure 28: Majority of OBGYNs Follow Health Policy Debates. Most Perceive No Impact of Abortion Regulations on Ability to Provide Care
Several states across the country have passed an increasing number of laws regulating abortion in recent years, including gestational age limits and regulations on abortion providers and facilities. Most OBGYNs (68%) reported these new regulations did not impact their ability to provide quality reproductive health care to their patients, although about a quarter reported a negative impact (28%). Very few (3%) believed these regulations had a positive impact on their ability to provide quality reproductive health care (Figure 28). A higher share of the youngest group of OBGYNs perceived a negative impact of these regulations on provision of care compared to all other age groups (age <45: 40%, age 45-54: 23%, age 55-64: 19%, age 65+: 21%), as did OBGYNs in the Midwest (35%) and South (35%) compared to the Northeast (17%) and West (21%). Of note, abortion providers were just as likely to report a negative impact of these regulations as non-abortion providers (32% vs. 27%).
Career Satisfaction
It is well documented that many physicians suffer from burnout and career dissatisfaction. When asked if they could do things again based on their experience as a physician, 70% of OBGYNs reported they would choose the same specialty. A minority said they would choose a different specialty (19%), and few said they would not be a physician at all (10%) (Figure 29). There were no differences seen by physician age, race, practice type, urbanicity or practice size, however a higher share of men said they would choose a different specialty if they could do things again compared to women (24% vs. 16%). A higher share of abortion providers said they would choose the same specialty again compared to non-abortion providers (79% vs. 68%). A larger share of OBGYNs in the West said they would choose the same specialty compared to OBGYNs in the Northeast (76% vs. 63%) (Table 11).
Figure 29: Most OBGYNs Would Choose the Same Specialty if Given the Chance To Do Things Again
Table 11: Career Satisfaction of OBGYNs
Characteristics
Based on your experience as a physician, if you had the chance to do things again would you:
Choose the same specialty
Choose a different specialty
Not be a physician at all
Overall
70%
19%
10%
Gender
Female
72
16*
11
Male
68
24
8
Age
<45
69
17
13
45-54
68
24
8
55-64
73
18
8
65+
70
20
9
Race and ethnicity
Asian
68
20
11
Black
66
20
14
Other
70
17
11
White
71
19
10
Practice type
Health Center/Clinic
66
24
9
Private Office-Based
70
19
10
Practice size
Large (>10 FTE)
73
17
10
Medium (4-10 FTE)
72
19
8
Small (≤3 FTE)
64
22
13
Urbanicity
Urban
73
18
8
Suburban
64
24
12
Rural
71
14
14
Region
South
71
17
11
West
76*
16
7
Midwest
69
18
11
Northeast
63
25
10
Practice provides abortions
Yes
79*
16
5*
No
68
20
11
*Indicates statistically significant difference from reference group in bold (p<0.05)NOTES: Region derived from zip code, using U.S. census breaksSOURCE: KFF 2020 Physician Survey on Reproductive Health. Fielding from March 18 to September 1, 2020. N = 1210
Survey: OBGYNs Report That the Affordable Care Act Has Increased Use of Contraceptives Among Patients, but the Cost of Reproductive Health Care Still a Burden for Their Low-Income Patients
As the nation awaits the Supreme Court ruling on the future of the Affordable Care Act (ACA), a 2020 KFF survey of obstetrician-gynecologists (OBGYNs) finds that since implementation of the ACA’s contraceptive coverage requirement, nearly two-thirds of OBGYNs (63%) reported an increase in contraceptive uptake from their patients and 69% reported an increase in their patients use of their desired contraceptive method. However, nearly all OBGYNs (92%) reported the cost of reproductive health care services still presents a challenge for low-income patients.
The survey highlights issues of patient affordability and access to care. About half of OBGYNs found the issue of affordability comes up always or often when discussing treatment or test options with patients. While 78% of OBGYN practices accept Medicaid, physicians report challenges with specialists accepting Medicaid referrals and being reimbursed at a lower rate by the program compared to private insurance.
The survey found that a majority of OBGYNs provided some form of contraceptive care, but just 18% offered all non-permanent contraceptive methods to their patients. Notably, less than half of OBGYNs provide their patients with prescription forms of emergency contraception (copper IUD and Ella).
A limited number of OBGYNs (23%) provide abortions, but they were more commonly offered by OBGYNs in urban areas, the Northeast, and the West. The most frequently reported reasons for not providing abortion included their practice had policies against it (49%), that abortion services were available elsewhere (45%), and personal opposition (31%).
When asked about career satisfaction, 70% of OBGYNs reported they would choose the same medical specialty, while a minority reported they would choose a different specialty (19%) or not be a physician at all (10%).
The 2020 KFF National Physician Survey on Reproductive Health surveyed 1,210 OBGYNs from March 18 to September 1, 2020. The survey received responses from a nationally representative sample of OBGYNs practicing in the U.S. who provide sexual and reproductive health care to patients. Following the beginning of the COVID-19 pandemic, additional questions were added regarding the impact of COVID-19. You can find the results here: How OBGYNs Adapted Provision of Sexual and Reproductive Health Care During the COVID-19 Pandemic.
Individuals with certain medical conditions are at increased risk of severe illness if they become infected with SARS-CoV-2, the virus that causes COVID-19, and as such are recommended by the Centers for Disease Control and Prevention (CDC) for vaccination in the first phases of vaccine roll-out. Most states have not yet opened up vaccine eligibility to those with high-risk medical conditions, although they represent some of the next in line.
A recent KFF analysis assessed how states are defining “high-risk medical conditions,” including whether they follow CDC’s recommendations or deviate in some way. This point in time analysis reflects information available as of February 16, 2021. Overall, there is wide variation across the country, including in the conditions listed by states, whether these are limited or allow for additional conditions to be considered, and how clearly the information is presented.
Among the 50 states and DC, 37 have provided explicit information on what conditions they consider “high risk” (Figure 1):
14 include all twelve of the conditions on CDC’s list.
Almost all include the following conditions: cancer (35), chronic kidney disease (34), COPD (37), heart conditions (35), immunocompromised due to solid organ transplant (36), sickle cell disease (35), and Type 2 diabetes (34).
There is less consistent inclusion of other conditions: severe obesity (32 states), obesity (29), Down Syndrome (32), pregnancy (27), and smoking (16).
Given the challenges and confusion with vaccine roll-out thus far, this variation and lack of clarity could have significant bearing on the ability of those with high-risk medical conditions, some of whom may be among the most vulnerable, to access the vaccine in early phases.
As COVID-19 vaccine distribution continues, the impact of the coronavirus on people moving into and out of the criminal justice system and the staff who work with justice-involved individuals is a key issue. This issue brief explores the impact of COVID-19 on justice-involved populations, examines how states have prioritized these populations for vaccination, and highlights the significance of Medicaid coverage for this population as well as proposals to expand access to Medicaid coverage. Looking ahead, key issues to watch include continued data on COVID-19 cases, deaths, and vaccinations among incarcerated populations as well as ongoing state and federal efforts to expand Medicaid access for this population. These efforts include the bipartisan Medicaid Reentry Act to allow Medicaid coverage for inmates 30 days prior to release, introduced in the Senate and also included in the House of Representatives COVID-19 relief budget reconciliation bill. This bill also includes funding for COVID-19 testing, contact tracing, and mitigation activities in congregate settings, including correctional facilities.
What does the data show about COVID-19 cases and deaths in prisons?
Although the Centers for Disease Control and Prevention (CDC) has published evidence that broad testing strategies in correctional facilities can help control transmission and provides considerations for such strategies, coronavirus testing policies vary across prison systems. Further, reporting of coronavirus cases and deaths data varies across states and prison systems and is often incomplete. In a February 9, 2021 letter to Congressional leadership, a group of Democrats indicated plans to reintroduce the COVID-19 in Corrections Data Transparency Act, a bill that would require correctional facilities to collect and publicly report detailed data on COVID-19 (including tests, cases, and deaths) and to disaggregate this data by demographics including sex, race, and disability. The group also urged leadership to include additional provisions related to correctional facilities in the upcoming COVID-19 relief package, including a requirement for routine diagnostic testing in correctional facilities.
Coronavirus infection rates among incarcerated populations have been higher than overall infection rates in nearly all states (Figure 1). Data shows 388,168 reported cases of coronavirus among people incarcerated in state and federal prisons as of February 22, 20211 , meaning that about 28% of this population has tested positive for the virus as compared to about 9% of the total US population. These case rates vary across states, ranging from 6% of prisoners in Alabama to 68% in Michigan. This variation in case rates may reflect variation in the number of prisoners being tested in addition to the prevalence of the virus. In all but three states, the coronavirus case rate among prisoners is higher than the case rate for the total population. The total coronavirus case rate among prisoners also reflects high case rates among the population detained by Immigration and Customs Enforcement (ICE) (69%) and among the population detained by the Federal Bureau of Prisons (29%). Additionally, since the start of the pandemic, an estimated 93,190 prison staff members have tested positive for coronavirus (22% of this population); however, data for staff is more limited as not all states report staff infections and even where this data is reported, prisons are less likely to systematically test staff and thus these counts may only include staff members who voluntarily report a positive diagnosis.
More than 2,300 deaths from coronavirus have been reported among prisoners, with death rates among prisoners higher than overall death rates in most states (Figure 2). A few states have not reported coronavirus deaths among prisoners2 , and the data that is available is subject to variation and limitations noted previously. This coronavirus death total includes deaths among the population detained by the Federal Bureau of Prisons (236 deaths) and by ICE (9 deaths). Coronavirus death rates vary across states, ranging from 4.1 deaths per 10,000 prisoners in Wyoming to 43.7 per 10,000 prisoners in Nevada. These rates among prisoners are higher than overall coronavirus death rates in 26 states, lower than overall rates in 15 states, and about the same (within one percentage point) in 9 states. Given the high case rates among prisoners, it is unsurprising that death rates are also high; however, coronavirus deaths in prisons are likely partially mitigated by the fact that on average, just over 10% of prisoners are over age 55 (as compared to just over 30% of the general population) and it is well-documented that older adults are at higher risk of dying if diagnosed with COVID-19. Since the start of the pandemic, 152 deaths from coronavirus have been reported among prison staff.
How are inmates in correctional facilities reflected in state vaccine prioritization plans?
Although not all states have fully defined the populations prioritized for receiving the COVID-19 vaccine in their state vaccination plans, of those that have, just over half include inmates in their Phase 1a, 1b or 1c groups and almost all include corrections officers. Vaccine recommendations from the CDC’s Advisory Committee on Immunization Practices (ACIP) classify corrections officers as frontline essential workers who should be eligible for the vaccine following Phase 1a. While ACIP does not explicitly recommend inmates as an early priority group, it does note that states may choose to vaccinate those residing in congregate living facilities, such as correctional/detention facilities, at the same time as frontline staff). Accordingly, state vaccine plans vary in their prioritization of inmates in correctional facilities, and states also vary widely in the number of incarcerated individuals who have been vaccinated thus far.3As of February 22, 2021, inmates in correctional facilities are eligible for the COVID-19 vaccine in just 15 states. An additional three states are allowing vaccination for inmates only in some counties and an additional 15 states are allowing vaccination of staff but not inmates. Some (including members of Congress and current inmates) have argued that incarcerated individuals should be higher priority for the vaccine, while others have critiqued state policymakers for prioritizing incarcerated individuals ahead of others in their states.
Why is vaccine access particularly important for inmates?
Justice-involved populations may have a greater need for vaccines due to underlying health conditions and increased risk of transmission in correctional facilities. Coronavirus and other infectious diseases spread easily among people in jails and prisons given close quarters and shared spaces within correctional facilities, as is demonstrated by high coronavirus infection rates (Figure 1). Policies related to COVID-19 in prisons such as quarantining, isolation, and masking vary across states. In recognition of the increased risk of transmission in these types of facilities, the House of Representatives COVID-19 relief budget reconciliation bill includes funding for COVID-19 testing, contact tracing, and mitigation activities in congregate settings, including correctional facilities. Although on average younger than the general population, many incarcerated people are at risk for experiencing complications from coronavirus due to higher rates of chronic disease among this population as compared to the general population. Further, people of color are disproportionately likely to be incarcerated in jails and prisons, and data shows racial disparities in COVID-19 outcomes in part due to higher rates of underlying health conditions. Despite increased risks for the justice-involved population, reporting from some states suggests that inmates are reluctant to take the COVID-19 vaccine, citing concerns about side effects as well as distrust of the prison health care system.
What current and future options do justice-involved individuals have for accessing health care?
Correctional facilities are required to provide health services to incarcerated individuals, and Medicaid can help cover the costs of inpatient hospital care for this population. The provision of health care to incarcerated individuals varies significantly across states and types of correctional facilities, and may include on-site infirmaries and/or contracts with outside health care providers. In fiscal year 2015, state departments of correction on average spent $5,720 per inmate to provide health care services. Current rules allow individuals to be enrolled in Medicaid while incarcerated, but the Medicaid Inmate Exclusion Policy limits Medicaid reimbursement for incarcerated individuals to inpatient care provided at facilities that meet certain requirements, including hospitals. States can facilitate access to Medicaid coverage for incarcerated individuals by suspending rather than terminating Medicaid coverage for enrollees who become incarcerated, which over 40 states reported doing as of January 2019. Suspending eligibility expedites access to federal Medicaid funds if an individual receives inpatient care while incarcerated. Although data on prisoner hospitalizations due to coronavirus is largely unavailable, Medicaid would be an important payer for any such hospitalizations.
The Affordable Care Act (ACA) and its expansion of Medicaid provided new coverage options for individuals upon release from correctional facilities. Although incarcerated individuals are not eligible to buy private health insurance through the Health Insurance Marketplace established by the ACA, they can access a Special Enrollment Period to sign up for private health coverage within 60 days of release even if there is not currently a Marketplace Open Enrollment Period. Further, particularly in states that have adopted the ACA’s Medicaid expansion, many justice-involved individuals could be eligible for Medicaid coverage. Justice-involved individuals are disproportionately low-income, with a median income prior to incarceration 41% lower than the median income of non-incarcerated counterparts. Though incarcerated people in all gender, race, and ethnicity groups have substantially lower incomes as compared to their non-incarcerated counterparts, median incomes prior to incarceration are particularly low for women of color. In the 39 states that have adopted Medicaid expansion under the Affordable Care Act, nearly all adults with incomes up to 138% of the federal poverty level (FPL) ($17,774 for an individual in 2021) are eligible for Medicaid; however, eligibility for adults remains very limited in the remaining 12 states. In states which suspend Medicaid coverage for incarcerated individuals, individuals can have their coverage active immediately upon release, which facilitates access to health care services in the community. This policy is of particular importance during the coronavirus pandemic, as some prisons have implemented early or temporary release policies to reduce prison density and viral transmission. Researchers have urged states to establish and/or strengthen systems to help enroll individuals in Medicaid upon release to protect their health and that of the general population during the pandemic.
Looking ahead, policy proposals at the state and federal level could further expand Medicaid access and increase continuity of care for justice-involved populations during and beyond the pandemic. A few states are attempting to expand the scope of services provided to incarcerated individuals that can qualify for reimbursement through Section 1115 waiver requests. For example, Utah and Kentucky have pending requests that would provide limited benefits to certain inmates with substance use disorders prior to release. At the federal level, the Medicaid Reentry Act is a legislative proposal which would allow states to cover services for Medicaid beneficiaries who are incarcerated during the 30 days preceding their release, which could facilitate coverage and access to care post-release. This proposal is included in the House of Representatives COVID-19 relief budget reconciliation bill (to be funded for five years) and a bipartisan group of Senators has introduced similar legislation. The Congressional Budget Office (CBO) has estimated that the proposal in the reconciliation bill would increase federal costs by $3.7 billion over the five-year period and result in about 55% of all inmates being enrolled in Medicaid at the end of this period.
This includes data from all 50 US states, Puerto Rico, the Federal Bureau of Prisons, and Immigration and Customs Enforcement (ICE). For more info, see https://covidprisonproject.com/↩︎
However, a different dataset (from The Marshall Project) reports at least one coronavirus death among prisoners in every state except Vermont. ↩︎
State counts of the number of incarcerated individuals who have been vaccinated may include inmates who receive the vaccine based on other eligibility criteria, even if they live in states where inmates are not currently priority populations themselves. ↩︎
The number of residents contracting and dying of COVID-19 in nursing homes has declined markedly following the introduction of vaccination efforts in long-term care facilities, a KFF analysis finds.
Resident deaths from COVID-19 in nursing homes have decreased by two-thirds (66%) since vaccination efforts began in late December. New cases of the novel coronavirus among residents have fallen even more sharply, by 83 percent.
At the same time, deaths from COVID-19 in the general population (excluding nursing home residents) have spiked by 61 percent in the weeks since December 20. New cases have declined in recent weeks, but by only 45 percent, far less than the decline seen among nursing home residents.
The new analysis compares trends in new COVID-19 cases and deaths among nursing facility residents with trends in new COVID-19 cases and deaths among non-nursing facility residents through February 7, 2021.
It’s still unclear how much the decline in cases and deaths can be attributed directly to the vaccine, the analysis finds, but the timing suggests that vaccination efforts are having an impact and improving the safety of long-term care settings. As of February 22, 2021, at least 4.5 million residents and staff in long-term care facilities had received one or more dose of vaccine, including over 2 million residents and staff who had received both doses.
The final months of 2020 were the deadliest months of the pandemic for many long-term care facilities (LTCFs) across the country, with over 26,000 COVID-19 deaths in LTCFs reported between Thanksgiving weekend and December 31, 2020. The end of 2020 also saw the approval of the first coronavirus vaccines and the launch of vaccine administrations in LTCFs through the Pharmacy Partnership for Long-Term Care on December 21st, 2020 (Pfizer-BioNTech) and December 28th, 2020 (Moderna). As of February 22, 2021, about 4.5 million residents and staff have received one or more dose through the Partnership; over 2 million residents and staff have received both doses. In addition, some states and some LTCFs have vaccinated residents or staff outside the Partnership. Vaccinations have increased outside of LTCFs as well, though at a significantly lower rate.
This analysis compares trends in new COVID-19 cases and deaths among nursing facility residents with trends in all other new COVID-19 cases and deaths excluding nursing facility residents through February 7, 2021. Our prior analysis of trend data going from April 2020 through December 2020 found similar patterns in cases and deaths in long-term care facilities and in the general population. This updated analysis with more recent data shows a marked divergence in new cases and deaths per week between nursing facility residents and the rest of the US population since December 2020. This drop in new cases and deaths in nursing facility residents coincides with the start of vaccine administration in LTCFs, suggesting a link between the two, although the trends could also be influenced by other factors. See Methods for more details on data sources and analysis.
Weekly new deaths among nursing home residents have decreased by 66% since long-term care vaccination efforts started at the end of December, compared to a 61% increase in all other new deaths not among nursing home residents during the same period (Figure 1 and Table 1). In the period leading up to initiation of vaccination efforts in LTCFs, new deaths among nursing homes residents and non-nursing home residents had generally been increasing since late Fall 2020, peaking in the week ending December 20, 2020. Starting December 21, 2020, the week LTCF vaccination efforts began, weekly nursing home resident deaths began a steady decrease, which has continued through the most recent week of data available, dropping from 6,019 for the week ending December 20, 2020 to 2,054 for the week ending February 7th, 2021. The rate of decrease appears to have accelerated in recent weeks, as more LTCF residents got fully vaccinated. In contrast, non-nursing facility resident deaths increased overall (from 12,325 to 19,848 weekly deaths between the weeks ending December 20th 2020 and February 7th, 2021), with a slight drops the weeks ending December 27th and January 24th.
Figure 1: Weekly COVID-19 Nursing Home Resident and Non-Nursing Home Resident Deaths in the US, June 2020 – February 2021
Similarly, weekly new cases among nursing home residents have been steadily declining since December 20, 2020 and decreased faster than cases among non-nursing home residents (-83% and -45%, respectively) (Table 1). As has been widely reported, overall cases in the US have dropped precipitously in recent weeks. While cases have dropped both within and outside nursing facilities, new nursing facility resident cases peaked earlier (week ending December 20, 2020) as compared to in the general non-nursing facility resident population (week ending January 10, 2021) and declined at a faster rate in nursing facilities than outside nursing facilities.
While timing of vaccine initiation in LTCFs and declines in cases and deaths coincide and suggest a link between the two, it is still unclear how much of the decline in cases and deaths can be attributed directly to the vaccine. In particular, cases and deaths started declining upon rollout of the Partnership, but first vaccine clinics did not happen immediately in all locations. According to the CDC, there has been strong evidence that the vaccines prevent severe illness and death, and the sharp divergence in deaths inside and outside of LTCFs is consistent with that evidence. In addition, given the emerging research around the vaccines’ ability to prevent transmission of the virus, there is reason to believe that the vaccine may be playing a part in reducing virus transmission within nursing homes, contributing to the more rapid decline in new cases in nursing facility residents than in the overall population.
Table 1: Weekly COVID-19 Nursing Home Resident and Non-Nursing Home Resident Cases and Deaths in the US,June 2020-February 2021
Week Ending
Weekly New Cases
Weekly New Deaths
Nursing Home Resident
Non-Nursing Home Resident*
Nursing Home Resident
Non-Nursing Home Resident*
6/7/2020
16,396
129,022
2,750
2,748
6/14/2020
12,998
133,847
2,078
3,082
6/21/2020
12,128
172,346
1,725
2,400
6/28/2020
13,440
254,681
1,468
2,291
7/5/2020
13,940
331,146
1,472
1,946
7/12/2020
16,837
387,405
1,612
3,266
7/19/2020
18,442
441,362
1,802
3,403
7/26/2020
18,918
440,663
2,050
4,312
8/2/2020
17,180
408,973
2,073
5,850
8/9/2020
16,737
346,790
2,081
5,252
8/16/2020
15,970
341,317
1,879
5,565
8/23/2020
13,585
280,810
1,730
5,073
8/30/2020
12,476
273,774
1,543
4,829
9/6/2020
11,458
265,877
1,364
4,462
9/13/2020
10,226
227,709
1,219
3,754
9/20/2020
10,513
267,305
1,176
4,233
9/27/2020
10,546
295,021
1,139
4,080
10/4/2020
10,815
287,727
1,186
3,618
10/11/2020
11,927
330,372
1,247
3,628
10/18/2020
14,781
367,899
1,468
3,297
10/25/2020
16,350
464,261
1,736
3,881
11/1/2020
18,760
613,883
2,012
3,690
11/8/2020
23,673
775,164
2,464
4,584
11/15/2020
30,164
1,014,806
2,982
4,940
11/22/2020
32,665
1,165,545
3,721
6,624
11/29/2020
27,641
1,094,863
4,582
5,424
12/6/2020
32,031
1,345,600
5,043
10,229
12/13/2020
33,428
1,448,948
5,762
11,170
12/20/2020
33,601
1,468,084
6,019
12,325
Nursing Home Vaccinations Begin
12/27/2020
28,815
1,240,812
5,586
9,679
1/3/2021
27,144
1,459,024
5,474
12,853
1/10/2021
25,887
1,683,067
5,326
16,984
1/17/2021
21,349
1,489,336
4,958
18,206
1/24/2021
17,383
1,163,988
4,341
16,926
1/31/2021
11,084
1,012,715
3,164
18,738
2/7/2021
5,672
812,362
2,054
19,848
Percent Change From 12/20/2020 to 2/7/2021
-83%
-45%
-66%
61%
NOTES: Nursing home cases/deaths include resident cases and deaths only. *Non-nursing home resident cases and deaths calculated as total US cases and deaths minus nursing home resident cases and deaths. These figures include nursing home staff cases and deaths.SOURCES: Nursing home cases and deaths are from CMS COVID-19 Nursing Home Data, as of the week ending on 2/7/2021. US weekly cases and deaths data is based on analysis of COVID Tracking Project data.
Methods
This analysis uses federal data on coronavirus cases and deaths in nursing facilities, which includes weekly data as of mid-May 2020 through February 7th, 2021. This analysis defines nursing facility cases and deaths as cases and deaths among nursing facility residents. Cases and deaths among nursing home staff are included in “non-nursing home resident” group. Data on non-nursing home cases and deaths are calculated based on the number of nationwide cases and deaths from the COVID Tracking Project minus nursing home resident cases and deaths; we make this adjustment to account for possible endogeneity (that is, cases or deaths in nursing homes contributing to the patterns in COVID-19 cases and deaths nationwide), particularly for deaths where long-term care deaths account for approximately 37% of overall COVID-19 deaths. The federal data includes only data on federally certified nursing facilities. This analysis therefore does not include data on other long-term care settings, such as assisted living facilities, residential care facilities, group homes, or intermediate care facilities.
A updated issue brief examines the most recent data on deaths from COVID-19 and other causes, and finds that COVID-19 is currently the number one cause of death in the United States.
As of February 20, 2021, an average of more than 2,400 people per day died of COVID-19 in the U.S. during February 2021 – a number nearly 20% higher than the next leading cause. Heart disease, which is typically the number one cause of death in the U.S. each year, leads to the death of about 2,000 Americans per day, and cancer claims about 1,600 American lives per day.
The issue brief is available in full on the Peterson-KFF Health System Tracker, an online information hub dedicated to monitoring and assessing the performance of the U.S. health system.