KFF designs, conducts and analyzes original public opinion and survey research on Americans’ attitudes, knowledge, and experiences with the health care system to help amplify the public’s voice in major national debates.
Inside the $1.9 trillion American Rescue Plan Act of 2021 is a less noticed provision that makes a major change to Medicaid coverage for low-income pregnant and postpartum women, addressing a long-standing gap for people who have had their maternity care covered by Medicaid, especially those in states that have not expanded Medicaid as permitted by the ACA. While the Act adds new incentives for states to take up the ACA Medicaid expansion, it also now gives all states the new option to extend the postpartum coverage period under Medicaid from 60 days following pregnancy to a full year. This post explains the new policy and raises some questions that policymakers are likely to grapple with as the implementation unfolds.
What does the new policy do?
The American Rescue Plan Act of 2021 gives states a new option to extend Medicaid postpartum coverage from 60 days to 12 months. Currently, Medicaid covers almost half of births nationally, with eligibility levels ranging from 138% to 380% of poverty across states. States must cover pregnant women with incomes up to 138% of the federal poverty level (FPL) through 60 days postpartum (the end of the month of the 60th postpartum day). The American Rescue Plan Act allows states to extend the postpartum period to a year by filing a State Plan Amendment (SPA) to their Medicaid program.
Under the new law, the postpartum coverage duration can also be lengthened under the CHIP program. Currently, six states cover some low-income pregnant women through their CHIP programs. If a state takes up the new option to extend the postpartum period, this will apply to their CHIP coverage in addition to Medicaid.
States that elect the new option must provide full Medicaid benefits during pregnancy and the extended postpartum period. Currently, states are permitted to cover a more narrow set of pregnancy-related benefits to those who qualify under the pregnancy pathway, although most align their benefits with other Medicaid eligibility groups. States that elect this new option however would have to provide full Medicaid benefits.
The new option can take effect starting April 1, 2022 and would be available to states for five years. While the new option takes effect next year, currently postpartum women covered by Medicaid can remain on the program beyond 60 days because of a Maintenance of Effort requirement enacted in 2020 that lasts through the COVID public health emergency.
Questions going forward
Which states will take up this option? While we do not know which states will take up the option, several have shown interest in extending the postpartum coverage period beyond 60 days. Some states have applied and have waivers pending at CMS to extend postpartum coverage. This includes expansion states like Illinois and New Jersey as well as non-expansion states like Georgia (which applied for extension through 180 days postpartum). These states could now file a SPA instead of waiting for approval of their waivers. Some states may decide to change earlier proposals. For example, Missouri has submitted a waiver application to CMS that would extend postpartum coverage to a year just for substance use and mental health services. That proposal would not qualify for the new SPA option because it would not cover full benefits.
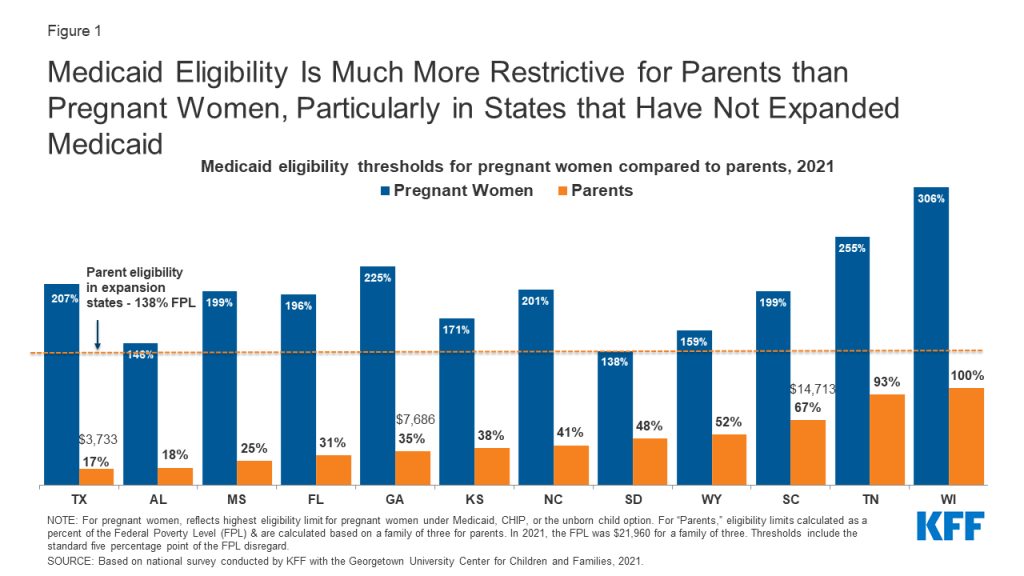
What will be the impact on women’s coverage in non-expansion states? Non-expansion states that take up the option could see a decrease in the share of low-income mothers who are uninsured. Medicaid income eligibility levels for parents are much lower than for pregnant people (Figure 1). Currently, in non-expansion states, some new mothers fall into the coverage gap where their incomes are too high for Medicaid parent eligibility yet too low for Marketplace subsidies (which are available only at the poverty level or above), putting them at risk for becoming uninsured.
Figure 1: Medicaid Eligibility Is Much More Restrictive for Parents than Pregnant Women, Particularly in States that Have Not Expanded Medicaid
Will this option be adopted by expansion states? In states that have expanded Medicaid under the ACA, most postpartum women have a pathway to coverage – either Medicaid or subsidized private insurance through the ACA Marketplaces, but a longer postpartum period could allow for greater continuity with Medicaid providers. Studies have documented that new moms who have Medicaid funded childbirths experiencing significant churning in coverage.
What will be the impact on federal and state budgets? The Congressional Budget Office (CBO) estimates that by 2024, about a quarter of postpartum beneficiaries will live in states that elect the new option. CBO estimates that extended Medicaid coverage will result in almost $6.1 billion in federal spending over the first ten years. States that adopt this extension would also incur costs as the extended coverage would remain at the same federal matching level, which ranges from 56.2% to 84.51%. These estimates take into account potential shifts in private insurance enrollment, including lower ACA subsidy costs. It is not clear if the estimates account for factors such as greater access to preventive services like contraception, which could avert unintended pregnancies that would otherwise be covered by Medicaid.
What will be the impact on health outcomes? Part of the motivation for postpartum extension is the nation’s high rate of preventable pregnancy-related mortality and morbidity, particularly the stark disparities among Black and Native American women. There is also growing recognition that the postpartum period extends far beyond 60 days. Many of the conditions that account for a significant share of pregnancy-related mortality and morbidity, such as cardiovascular diseases, hypertension, and depression often require care over a longer-term. Providing Medicaid access to low-income mothers for a longer period also promotes continuity and access to preventive services such as contraception and intrapartum care.–The role of coverage as a key element of reproductive health care access is well understood. However, maternal health is also heavily connected to a complex set of issues, particularly poverty and systemic racism that pervade the health care system.
Ensuring widespread global access to COVID-19 vaccines, which is necessary for preventing cases and deaths and contributing to global population immunity, is a critical challenge and one that could threaten the ability to control the pandemic. Despite efforts to address vaccine access, most notably through the creation of COVAX, which aims to support the development and delivery of COVID-19 vaccines with a particular focus on assisting low- and middle-income countries, significant disparities remain. The latest data from the Duke Global Health Innovation Center Launch and Scale Speedometer, which monitors COVID-19 vaccine purchases, finds that high-income countries already own more than half of all global doses purchased, and it is estimated that there will not be enough vaccine doses to cover the world’s population until at least 2023.
To further examine the current global distribution of COVID-19 vaccine doses, we used data from the Duke Launch and Scale Speedometer to calculate the share of doses purchased by country income group compared to their share of the global adult population (focusing on adults, ages 18+, because most COVID-19 vaccines are thus far only available for the adult population). In addition, we calculated potential vaccine coverage rates – that is, the share of the adult population that could be fully vaccinated – by country income group. To do so, we reapportioned doses secured through regional agreements to their respective country recipients and added these to individual country totals where bilateral agreements were also in place. While it is not possible to allocate most COVAX doses purchased to individual countries at this time, since COVAX has yet to release its full distribution plan, we did assess how allocating all COVAX doses to low- and middle-income countries (LMICs) would affect these distributions (see Methodology for more detail). Ultimately, we find that without redistribution of doses already purchased by high-income countries (through donations or other means) and/or increased support for manufacturing or production of additional doses, more than four in ten (41%) adults in the world will not be able to be vaccinated, even after allocating all COVAX doses to LMICs.
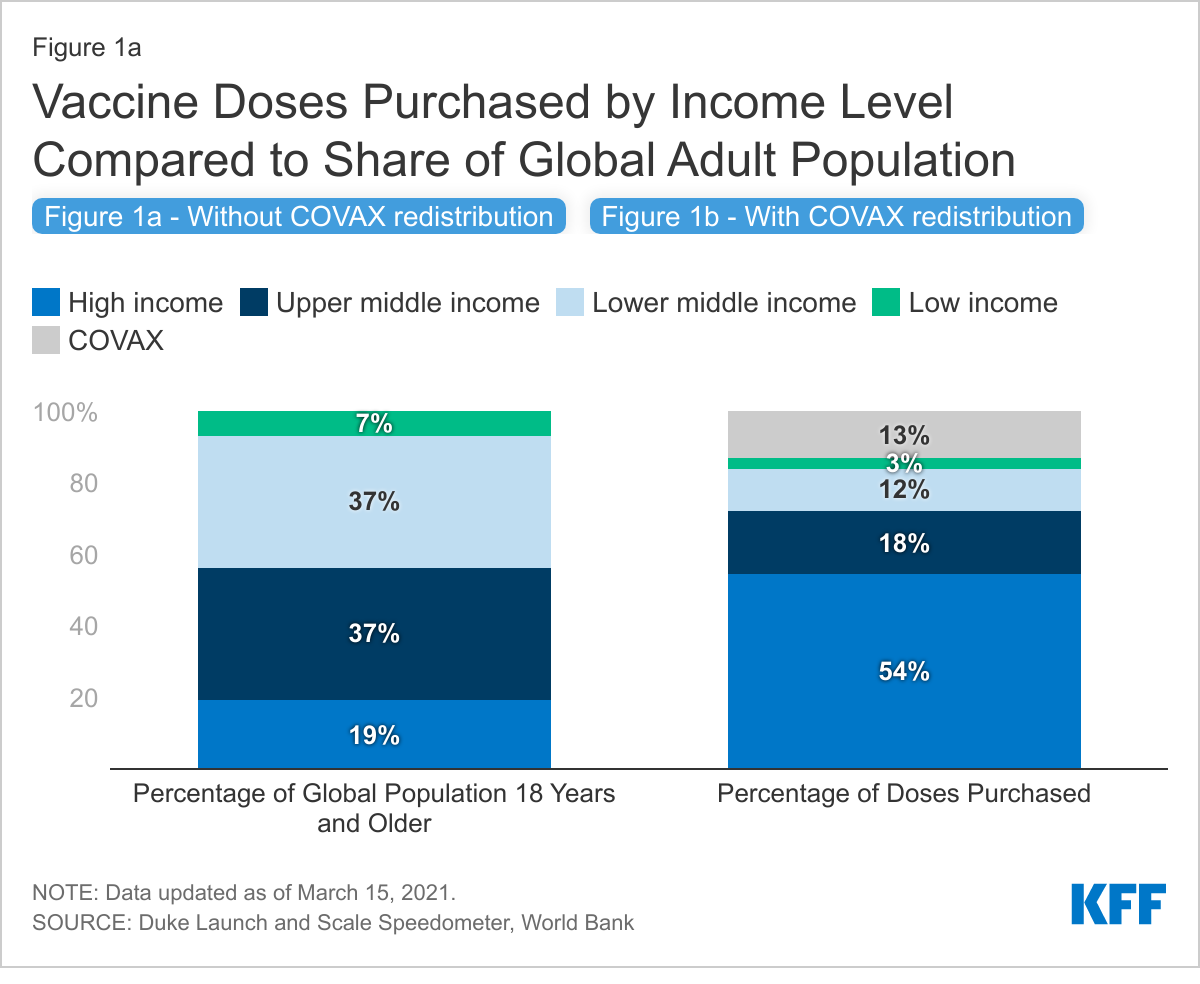
High-income countries, representing just a fifth of the global adult population, have purchased more than half of all vaccine doses, resulting in disparities between adult population share and doses purchased for all other country income groups. We find that although high-income countries only account for 19% of the global adult population, collectively, they have purchased more than half (54%, or 4.6 billion) of global vaccine doses purchased to date. Of the remaining doses, 33% have been purchased by LMICs, who account for 81% of the global adult population; an additional 13% have been purchased by COVAX. Looking by country income group, the largest disparity between doses purchased and population share is for lower-middle-income countries (37% of the global population vs. 12% of purchased doses, or 989 million doses), followed closely by upper-middle-income countries (37% vs. 18%, or 1.5 billion doses). The disparity for low-income countries is smaller (3% vs. 7%, or 263 million doses) (see Figure 1a).
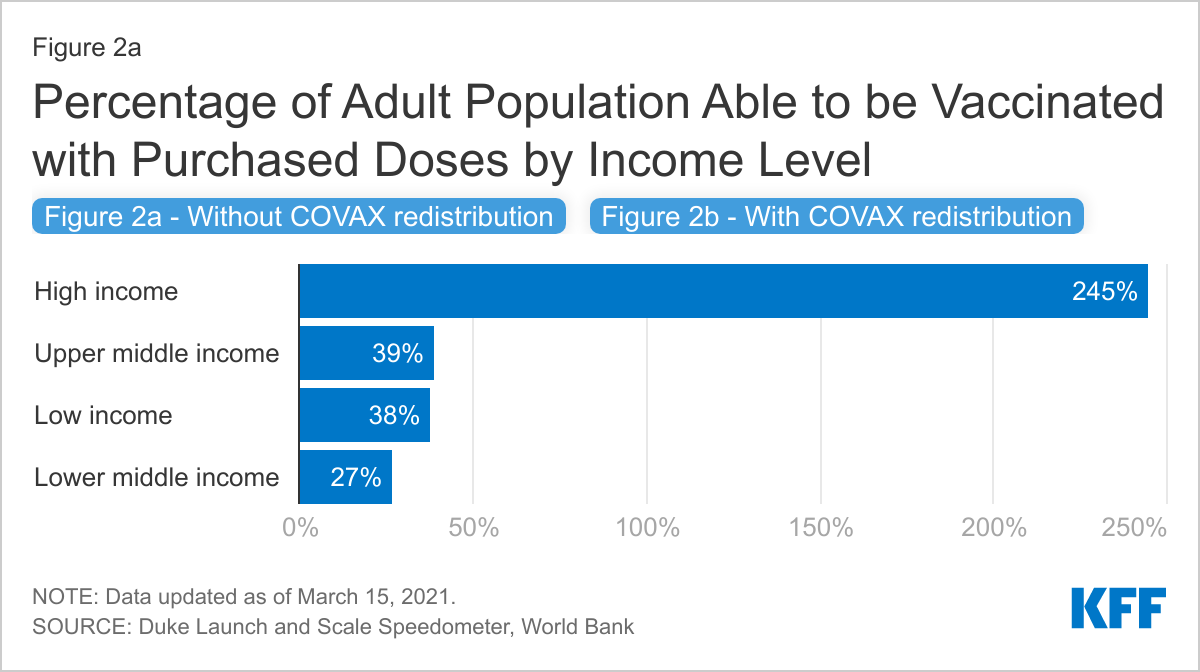
The disparity is even more pronounced when looking at the share who could be vaccinated. While enough vaccine doses have been purchased to cover more than 80% of the adult population, high-income countries own enough doses to vaccinate more than twice their populations while LMICs can only cover one-third.
High-income countries currently have enough vaccine doses to cover more than twice their adult populations (245% see Figure 2a). Meanwhile, LMICs currently only have enough vaccine doses to reach approximately one-third of their populations, with upper-middle-income countries able to cover 39% of their adult population, low-income countries 38%, and lower-middle-income countries 27%.
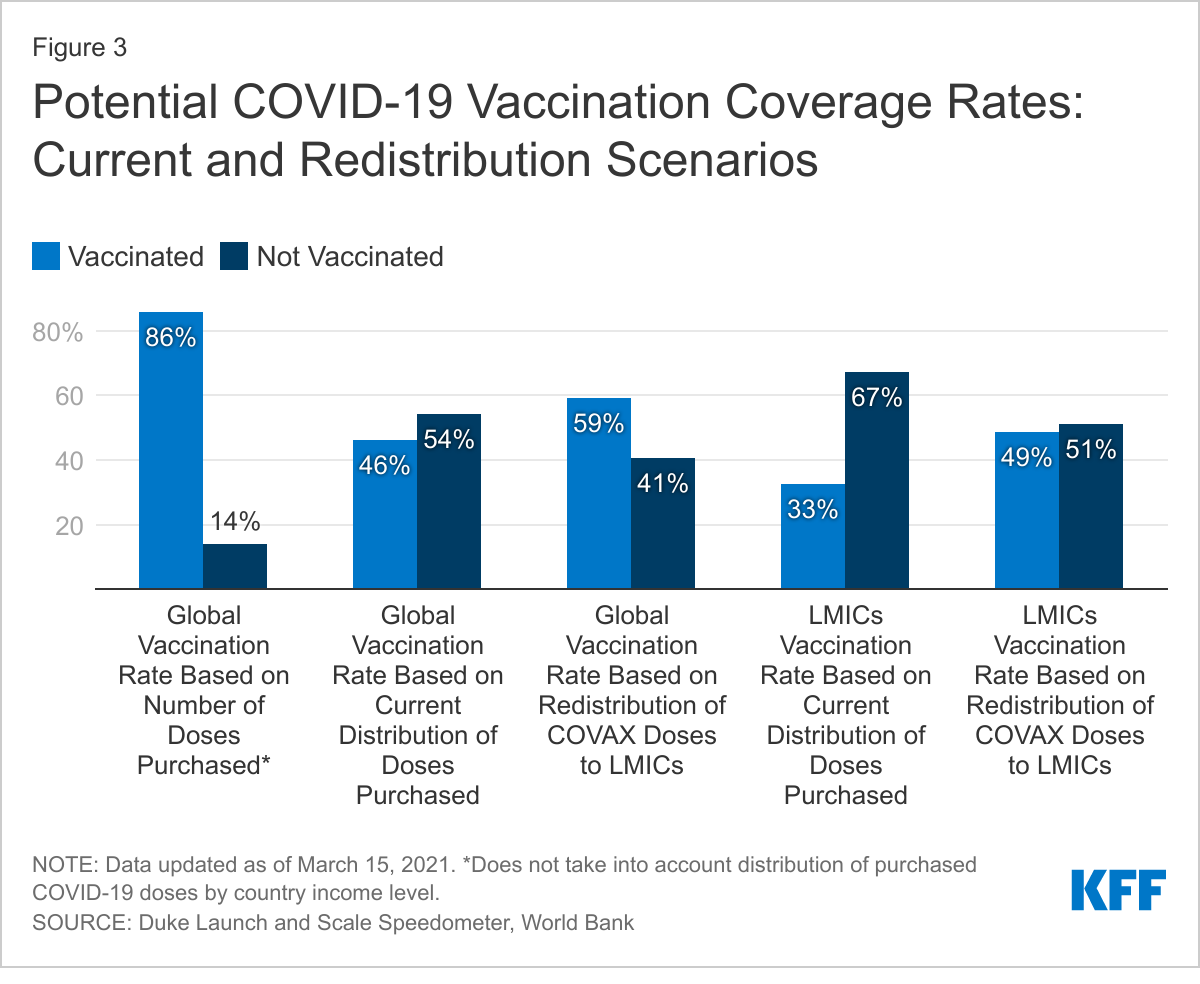
Providing all COVAX doses to LMICs could help but would still leave vaccines out of reach for most of the global population. COVAX, which currently accounts for 13% (1.12 billion) of the total number of global doses purchased, has not yet finalized the distribution plan for its full supply, though most doses are expected to be distributed to LMICs. We looked at what would happen to global distribution, relative to population and to vaccine coverage, if all 1.12 billion COVAX doses were provided to LMICs (which is not going to be the case since some will go to high-income countries). While this would result in the share of doses purchased for LMICs increasing from 33% to 46%, it would still be well below their share of the global adult population (81%) (see Figure 1b). Moreover, even with the COVAX doses, less than half (49%) of the adult population in LMICs would be able to be vaccinated (see Figure 2b). Looking at potential global coverage rates, allocating all COVAX doses to LMICs only slightly improves the picture, increasing the percentage of adults globally that can be vaccinated from 46% to 59%. This is well below the percentage of adults globally that could be vaccinated based on the total number of doses purchased (86%) (see Figure 3).
The disparity between vaccines purchased and country income level is significant, but could be addressed in large part through redistribution of doses, as some high-income countries have said they would do. However, such a strategy is highly dependent on the as-of-yet unknown outcomes of several vaccine candidate trials or a significant increase in the manufacturing and production of already authorized vaccines. This analysis demonstrates the significant disparity in vaccine access across much of the world, at least of doses purchased to date. While high-income countries have secured enough doses for more than twice their adult population, LMICs currently have only enough doses to vaccinate just a third, or, if all COVAX doses were allocated to them, still less than a half. Although there are currently enough purchased doses to vaccinate more than 80% of the global adult population, unless these doses are redistributed, huge inequities in vaccine distribution will persist, presenting a major challenge to achieving global population immunity. Some high-income countries have indicated that they will donate their excess doses, including France, Norway, the U.K., and the U.S. government, which has said it will do so only after it has vaccinated the U.S. population. Still, even if such donations were to occur, their ability to fully address these disparities is in part dependent on the success of some vaccine candidates still in clinical trials or the ability to support the increased manufacturing of or production capacity for already successful vaccine products.
Methodology
We obtained data on COVID-19 vaccine purchases by country from the Duke Global Health Innovation Center Launch and Scale Speedometer. Country income classifications were obtained from the World Bank. Redistributing regional purchases by member country population size was used in order to account for differing income-levels of member countries. Doses secured through regional agreements (made by the African Union, European Union, and Latin America) were reapportioned to their member countries based on adult population size, based on information released about the African Union and European Union. This same method was used for Latin America, although information on how vaccines would be distributed has not been made available. For the Latin America agreement, we included all countries classified as “Latin America and the Caribbean” by the United Nations Department of Economic and Social Affairs, excluding Brazil as specified in the agreement. Territory population totals were not included in our calculations. Population data were obtained from the United Nations Department of Economic and Social Affairs. Since vaccines are currently only being authorized or approved for and provided to adults, with the exception of the Pfizer vaccine which has been approved for individuals 16 years and older, we used population estimates for those 18 years and older. Finally, to estimate potential vaccine coverage by country, we took into account the number of doses needed for full vaccination, depending on the product. For the COVAX reapportionment scenarios, we assumed that all doses currently purchased by COVAX will be allocated to LMICs, even though some of these doses will be distributed to high-income countries, to provide a hypothetical “best-case scenario” for LMICs.
As of February 2021, 12 states have not adopted the Affordable Care Act (ACA) provision to expand Medicaid to adults with incomes through 138% of poverty. Millions of people in these states remain without an affordable coverage option. Currently, the federal government covers 90% of the cost of Medicaid coverage for adults covered through the ACA expansion, a higher share than it does for other Medicaid enrollees. The American Rescue Plan Act of 2021 encourages non-expansion states to take up the expansion by providing an additional temporary fiscal incentive for states to newly implement the ACA Medicaid expansion. This brief provides illustrative estimates of the net fiscal benefit to states from these incentives relative to state costs under the expansion. We review the methods underlying these estimates in the Methods section at the end of the brief.
How does the fiscal incentive work?
Under the law, states would receive the 90% ACA match for the expansion population. Under the ACA, states currently receive a 90% federal matching rate (FMAP) for adults covered through the ACA expansion (this amount was 100% in 2014 and phased down to 90% over time). In states that have not expanded to date, adults who could be covered under expansion include about 4 million uninsured people (2.2 million with incomes under poverty in the “coverage gap” and 1.8 million currently eligible for marketplace coverage because their incomes are between 100% and 138% of poverty level). In addition, individuals with incomes 100-138% of the federal poverty level (FPL) who are currently enrolled in marketplace coverage would become eligible for Medicaid.
Under the law, states that do not have expansion in place when the bill was enacted would be eligible for a 5 percentage point increase in the state’s regular, or traditional, match rate (FMAP) for two years if they implement the expansion. The traditional FMAP applies to most services for non-expansion groups, including children, non-expansion adults, seniors, and people with disabilities. Even in states that have already adopted the expansion, the traditional Medicaid program is much larger – representing 79% of Medicaid spending overall in these states — and per enrollee costs are relatively higher than the expansion group. So, under this new incentive, states could draw down additional funds for a large share of their Medicaid population and spending if they newly expand. In addition to the 12 states that have not adopted the expansion, the increase in the match rate also applies to Missouri and Oklahoma because the bill was enacted before they implement the expansion in July 2021. Further, if states newly adopt the expansion in the near term, the new 5 percentage point increase would be in addition to the current 6.2 percentage point increase in the match rate provided under the Families First Coronavirus Response Act (FFCRA) that is tied to the Public Health Emergency (PHE). Based on a January 2021 letter from the Biden Administration to Governors, the 6.2 percentage point increase in the match will be in place at least through March 2022, halfway through federal FY 2023. While the enhanced match would be in place for two years after a state implements the Medicaid expansion, states can take advantage of this new option at any time.
What is the estimated effect on state spending?
We estimate that the increase in the traditional match rate would more than offset the increased state costs of the expansion in every state. Nationally, the increase in federal support from the 5 percentage point increase in the traditional match rate to the 12 non-expansion states could total $16.4 billion over two years if all states implemented the expansion starting in FY 2022. These new federal funds to states would be offset by new state costs tied to the 10% share of expansion. We estimate that new state costs for expansion could be $6.8 billion over two years across current non-expansion states, assuming all eligible people enroll. The result would be an estimated fiscal benefit to states of $9.6 billion over the two year period (Figure 1).1 Put another way, new federal funds under the 5 percentage point bump are more than two times larger than new state expansion costs; this ratio varies slightly across states, from more than one a half times larger in Texas to over four times larger in South Carolina (Table 1).
Figure 1: New Financial Incentive for States To Implement the Expansion Would More Than Offset New Costs
After the two years, states would continue to receive the 90% match for the expansion group and the traditional match without the 5 percentage point increase for the traditional population. These estimates do not include additional federal funds that states would draw down through the 90% federal match on expansion spending, which would continue as long as the expansion is in place. States would continue to fund the 10% share of expansion and would lose the added fiscal incentive after two years. Research shows there are often savings in other state programs related to expanding Medicaid as well as revenue increases due to the infusion of federal funds associated with the 90% match on expansion spending. In addition, states could fund these ongoing costs with funds from the temporary enhanced FMAP that exceeded the cost of expansion; however, as states generally balance their budgets annually and may use the additional funds for other purposes, applying these funds to a later year may be difficult in practice.
These are illustrative estimates and subject to uncertainty. For example, the estimate of increased federal support from the enhanced match rate could be low if traditional Medicaid enrollment grows faster than our estimates assume, which may be possible given the pandemic and economic effects. In addition, the estimates of costs for new coverage could be high as we do not model take up but rather estimate costs for all eligible people; alternatively, the estimate for expansion could be low as it is based on national survey data that typically undercounts lower income people. Even with some uncertainty in the estimates, the magnitude clearly shows that the federal support would significantly outweigh the new costs of expansion while the temporary expansion incentive is in place. These estimates are not comparable to estimates from the Congressional Budget Office (CBO) that are capturing changes in federal spending over the next 10 years and incorporating behavioral responses that assume not all states would adopt the new option. The CBO estimates account for increased federal spending and reduced costs for federal subsidies in the Marketplace for states that adopt the expansion. CBO assumes that the option could increase federal spending by a net of $16.1 billion over the 2021-2030 period.
Medicaid expansion in the remaining 12 non-expansion states has the potential to reach millions of people. A comprehensive literature review of Medicaid expansion studies shows that expansion helps to expand coverage and reduce the uninsured, improve access to and utilization of care, reduce uncompensated care costs, improve affordability of care and reduce racial and ethnic disparities in coverage. The provisions in the American Rescue Plan Act would also provide substantial fiscal incentives for states to expand, which could be attractive given recent state revenue declines. However, given that the expansion incentive would be temporary, its effect may be limited.
Table 1: Cumulative Fiscal Impact of a 5 Percentage Point Increase in FMAP, FYs 2022-2023 (In Millions of Dollars)
Increased Federal Funds from FMAP Increase on Traditional Populations
New State Cost Due to ACA Medicaid Expansion
Net Effect for State Spending
Total*
$16,410
-$6,830
$9,590
Alabama
740
-200
540
Florida
3,080
-1,260
1,810
Georgia
1,360
-640
710
Kansas
450
-210
250
Mississippi
690
-290
400
North Carolina
1,700
-490
1,210
South Carolina
790
-190
600
South Dakota
110
-50
60
Tennessee
1,260
-360
900
Texas
5,020
-3,090
1,930
Wisconsin**
1,140
**
1,140
Wyoming
70
-40
30
Adopted Expansion but Not Implemented
Missouri*
1,150
*
1,150
Oklahoma*
520
*
520
NOTES: Figures may not sum to total due to rounding. *Total excludes OK and MO because these states were scheduled to implement the expansion in July 2021 and thus do not face new state costs under the policy change. **We do not calculate new state costs for expansion for WI because the state currently provides Medicaid eligibility to childless adults earning up to the poverty level under a state waiver, at the regular FMAP; thus, even with additional costs due to covering currently marketplace-eligible people, the state would likely see fiscal gain under expansion by moving waiver enrollees from the regular state match to the 90% expansion match.SOURCE: KFF estimates and analysis.
Methodology
Expansion Eligibility and Cost Estimates for Non-Expansion States
We calculate the number of people potentially eligible for Medicaid based on KFF 2019 estimates of the number of uninsured people who could be eligible for Medicaid if their state expanded plus estimates of people enrolled in Marketplace coverage who could become Medicaid eligible if their state expanded. We estimate Marketplace enrollees who could shift to Medicaid based on 2019 Marketplace enrollment data from the Centers for Medicare and Medicaid Services (CMS) Open Enrollment Period Files, and KFF analysis of the Census Bureau’s 2019 American Community Survey (ACS). We use Marketplace data on enrollees with income below 150% FPL, adjusted to the share with income through 138% FPL using KFF ACS estimates of income of people with nongroup coverage. To project spending on expansion adults for these states, we use our projected estimate of per enrollee costs for non-expansion adults in these states (described below) and apply the median ratio of spending per expansion enrollee to spending per non-expansion adult using data for expansion states for which we had a full year of data in FY2019.
We did not calculate additional state costs from expanding Medicaid for Missouri and Oklahoma because these states were scheduled to implement expansion in July 2021 and thus do not face new state costs due to expansion under the policy; rather, these costs are already assumed in the state Medicaid budget. Although we calculated the increased federal fiscal relief for Missouri and Oklahoma, we did not include them in the figures or nationwide estimates. We do not calculate new state costs for expansion in Wisconsin because the state currently provides Medicaid eligibility to childless adults earning up to the poverty level under a state waiver, at the regular FMAP; thus, even with additional costs due to covering currently marketplace-eligible people, the state would likely see fiscal gain under expansion by moving waiver enrollees from the regular state match to the 90% expansion match.
FY 2020 through FY 2023 Spending and Enhanced FMAP
We first estimate baseline spending without the new enhanced match rate. Our methods for baseline spending draw on those used in a previous brief on FMAP changes, updated to use more recent data sources where possible. We estimated baseline spending by using data from the 2019 Medicaid Budget Expenditure System (MBES), the Congressional Budget Office (CBO), the CMS Office of the Actuary (OACT), and the Medicaid and CHIP Payment Access Commission (MACPAC). Medicaid spending and enrollment do not include CHIP expenditures and do not include spending or enrollment changes due to economic effects from the coronavirus pandemic.
We use 2019 MBES data for baseline enrollment and spending for the expansion group and traditional Medicaid groups. For more information on how we calculate enrollment and spending from the MBES, please see our brief on expansion spending and enrollment. We distributed the enrollment and spending among traditional Medicaid groups (children, disabled, aged, and non-expansion adults) using MACPAC’s MACStats reports (Exhibits 14 and 21) based on 2018 TMSIS data. Then, we inflated enrollment from FY 2020 through FY 2023 using growth rates for each eligibility group from the OACT 2018 Actuarial Report on the Financial Outlook for Medicaid. We also inflate spending per enrollee through FY 2023 using an average of growth rates from OACT and the CBO March 2020 Baseline estimates. We averaged spending per enrollee growth from the CBO and OACT because the two estimates had substantial differences in annual growth rates for some enrollment groups, especially for 2019-2020. Finally, we multiplied enrollment and per enrollee spending estimates for each enrollment group to calculate a total spending baseline in FY 2020 and FY 2023, and then applied the FMAP adjustments to the total spending by state and eligibility group.
Endnotes
Total estimates do not include new federal funds or state costs for Missouri and Oklahoma, as these states already had plans to implement the expansion starting in July 2021 and thus do not face new state costs as a result of this policy. Further, we do not include new state expansion costs for Wisconsin, which has a waiver providing eligibility to childless adults earning up to the poverty level at the regular FMAP; thus, even with additional costs due to covering currently marketplace-eligible people, the state would likely see fiscal gain under expansion by moving waiver enrollees from the regular state match to the 90% expansion match. ↩︎
The American Rescue Plan (ARP), recently signed into law by President Biden, increases and expands eligibility for Affordable Care Act (ACA) premium subsidies for people enrolled in marketplace health plans. The law also creates new, temporary premium subsidies for COBRA continuation coverage; and it temporarily changes the rules for year-end tax reconciliation of marketplace premium subsidies. These changes will improve the affordability of coverage for individuals who are already enrolled in marketplace health plans, and will provide millions more an opportunity to newly sign up for coverage with increased financial assistance this year. The law also made changes to the Medicaid program designed to increase coverage, expand benefits, and adjust federal financing.
Expanded Marketplace Premium Subsidies
Under ARP, ACA marketplace premium subsidies are substantially enhanced for people at every income level and, for the first time, offered to those with income above 4 times the federal poverty level (FPL).
People up to 150% FPL can now get silver plans for zero premium with vastly reduced deductibles. Previously, marketplace premium subsidies were partial; no matter how poor, people had to contribute something toward the cost of the benchmark silver plan (i.e., the second lowest cost silver plan in their area). Those with income at 100% FPL had to contribute 2.07% of household income ($264 per year in 2021) toward a benchmark plan; at 150% FPL that amount increased to 4.14% of household income( $792 per year). Now under ARP, the benchmark marketplace plan will be fully subsidized for people earning up to 150% FPL. Cost sharing subsidies were already most generous at this income level (the average silver plan deductible for people at 150% FPL is $177 this year). As a result, low income people now can qualify for premium-free silver plans with modest deductibles for covered health benefits.
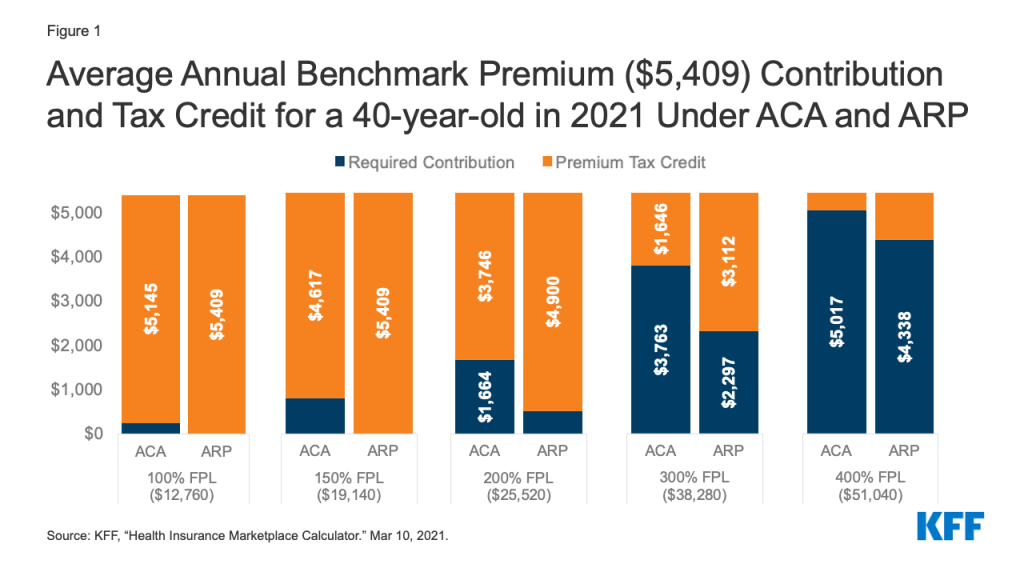
Premium subsidies will also increase for people at higher income levels among those currently eligible for help with incomes up to 400% of the poverty level. Premium tax credits will increase for people at every income level. (Figure 1) People with income of 200% FPL had been required to contribute $1,664 toward the cost of the benchmark marketplace plan this year; now under the ARP they will have to contribute just $510. At income of 400% FPL, people were required to contribute up to $5,017 toward the benchmark plan premium, now they will be required to contribute no more than $4,338 toward that plan.
Figure 1: Average Annual Benchmark Premium ($5,409) Contribution and Tax Credit for a 40-year-old in 2021 Under ACA and ARP
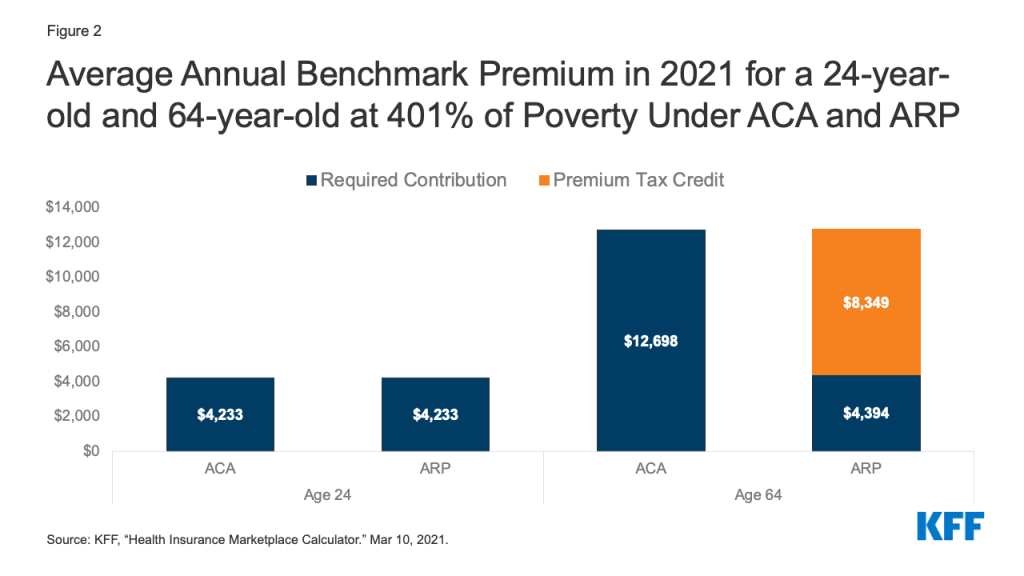
People with income above 400% FPL will be newly eligible for marketplace premium subsidies. Under the ACA, people with income above 400% FPL were not eligible for marketplace premium subsidies. Now, they will be required to contribute no more than 8.5% of household income toward the benchmark plan. This change will provide limited relief to younger marketplace participants – for example, for 24-year-olds in most areas, the unsubsidized age-rated benchmark plan premium already costs less than 8.5% of income for someone at 401% FPL – but will offer substantial relief for older individuals, where the unsubsidized premium averages nearly 25% of household income for someone at that same income level who is 64 years old. (Figure 2) Before this change, when they were ineligible for premium subsidies, some people with income above 400% FPL bought their insurance outside of the marketplace, or bought non-ACA compliant plans (such as short term policies). These individuals may want to return to the marketplace where coverage may now be more affordable and more comprehensive. The Biden Administration has reopened marketplace enrollment through May 15.
The ARP premium subsidy enhancements are effective during 2021 and 2022. These changes to marketplace premium subsidies are temporary, in effect only during calendar years 2021 and 2022. The specifics and timeline for implementation of these changes is yet to be determined. However, once implemented, current enrollees may be able to sign into their marketplace account to increase the amount of advanced premium tax credit (APTC) they receive, thereby lowering their monthly health plan premium payment for the remainder of this year. Subsidies for current enrollees are retroactive to the beginning of this calendar year and can also be claimed as tax refunds when people file their 2021 tax return next year.
In HealthCare.gov states, current enrollees will also be able to change plans during the COVID enrollment period, which currently extends through May 15, 2021. People covered in state-based marketplaces should check with their marketplace for information about their ability to change plans as the new premium subsidies are implemented. Presently, some state-based marketplaces offer a COVID enrollment period when only uninsured individuals can sign up.
Figure 2: Average Annual Benchmark Premium in 2021 for a 24-year-old and 64-year-old at 401% of Poverty Under ACA and ARP
Enhanced Subsidies for Unemployed People
The ARP provides for enhanced marketplace subsidies for people who receive or are approved to receive unemployment insurance (UI) benefits during any week in 2021. The ARP also extends the current federal supplement ($300 per week) to state UI benefits through September 6, 2021. The federal UI supplement is not taken into account in determining eligibility for Medicaid or CHIP.
When UI recipients apply for marketplace subsidies, special rules will be in effect during 2021.
Household income in excess of 133% FPL will be disregarded for purposes of determining eligibility for marketplace premium and cost sharing subsidies in 2021. As a result, people who receive UI benefits at any time in 2021 will be eligible for a zero-premium benchmark silver plan with comprehensive cost sharing subsidies this year.
People receiving UI benefits will be considered “applicable taxpayers” during 2021. Normally under the ACA, to be eligible for marketplace subsidies, a person must qualify to be an “applicable taxpayer” which requires having an income of at least 100% FPL. Under the ARP, for 2021 only, people who receive UI benefits are defined to be an applicable taxpayer. That can help some UI recipients with income below the federal poverty level who live in states that have not adopted the ACA Medicaid expansion; they were otherwise in the “coverage gap,” ineligible for both Medicaid and marketplace subsidies.
These enhanced marketplace subsidies for UI recipients are only for the 2021 coverage year.Congress would need to enact further legislation to extend UI subsidy enhancements beyond this year.
People receiving UI benefits will still have to meet other requirements to be eligible for marketplace subsidies. In particular, married individuals must file a joint return to be eligible for subsidies. Using the married-filing-separately filing status generally makes a person ineligible for subsidies, though an exception is available for people who experience domestic abuse.
In addition, people receiving UI benefits may still be ineligible for marketplace subsidies if they have access to job-based health benefits that meet ACA standards for affordability and minimum value. The affordability of job-based coverage will continue to be measured based on household income, including UI benefits and amounts above 133% FPL.
Premium Tax Credit Repayment Holiday for 2020
When people apply for marketplace premium subsidies, they do so based on their estimated annual income for that tax year. Later, when they file federal tax returns for that year, people must reconcile their actual income with the amount of premium tax credit they received based on estimated income, and repay some or all of any excess premium tax credit (or receive an additional credit if actual income was lower than anticipated). Caps on the repayment amount apply, but if actual income exceeds 400% FPL, people must repay the entire amount of excess premium tax credit they received during the year.
Recognizing that the pandemic caused greater-than-usual economic disruption and uncertainty in 2020, the ARP waives repayment of any excess premium tax credit received by marketplace participants during that year.
Implementation questions remain to be addressed. Before the ARP was enacted, the Internal Revenue Service (IRS) had already finalized 2020 tax forms and schedules, which provide for APTC reconciliation and repayment of excess credits. Further action by the IRS will likely be forthcoming to educate the public about this new protection, advise on how to use it when filing the 2020 tax return, and to refund amounts to people who may have already filed their 2020 tax return with repayments.
Temporary COBRA Premium Subsidies for 2021
The ARP provides for temporary COBRA premium subsidies for up to 6 months during 2021. Subsidies will cover 100% of the monthly cost of COBRA while people are eligible. The law requires the former employer to pay the COBRA premium for subsidy-eligible individuals; the federal government will then reimburse the former employer for this cost.
The COBRA premium subsidies can be paid for coverage months no earlier than April 1, 2021 and no later than September 30, 2021. The subsidy can end earlier than September 30 in some circumstances. It ends when COBRA coverage is exhausted; so for example, someone who first became eligible for COBRA due to a job layoff on March 1, 2020 could continue in that plan for 18 months, or through August 2021. That person could claim the COBRA premium subsidy starting in April 2021, but the subsidy would stop when COBRA exhausts at the end of August. People also lose eligibility for the COBRA premium subsidy once they become eligible for other job-based coverage. If this happens, people must notify their COBRA plan administrator or risk owing a penalty.
The subsidy is for people whose COBRA qualifying event involves termination of employment or reduction in hours worked. People are not eligible for the COBRA subsidy if they quit voluntarily. Nor are they eligible for subsidies if COBRA resulted from other qualifying events, including death of or divorce from the covered employee, the covered employee becoming entitled to Medicare, or loss of dependent child status.
People who became eligible for COBRA earlier in the pandemic can still elect it. Normally, people have up to 60 days from their qualifying event to elect COBRA continuation coverage. During the pandemic, however, people have additional time to elect COBRA, thanks to a COVID disaster relief notice issued by the Departments of Labor and Treasury. Their new COBRA election deadline will be the earlier of (1) one year from the date the person’s election period would otherwise have ended, or (2) 60 days after the announced end of the COVID National Emergency. For example, a person who was laid off early in 2020 and whose deadline for electing COBRA was April 1, 2020 can now take until April 1, 2021 to elect COBRA. Going forward, a person who becomes newly eligible for COBRA can have her election period extended by up to 1 year (or until 60 days following the end of the National Emergency, whichever is earlier.) This emergency rule applies to election of COBRA arising from all qualifying events.
People who became eligible for COBRA earlier in the pandemic can have coverage start prospectively. Normally, once elected, COBRA coverage dates back to the qualifying event and premiums have to be paid retroactive to that point in time. This will remain the rule for subsidy-eligible people whose qualifying event occurs on or after April 1, 2021
However, under the ARP a special rule applies for subsidy-eligible individuals whose COBRA qualifying event pre-dates enactment of the ARP and who have not yet elected COBRA; or for such individuals if they previously elected COBRA but subsequently discontinued it, and who otherwise remain eligible for COBRA. When these individuals elect COBRA, coverage will commence on the first day of April 2021. Their COBRA coverage will not extend back in time before that date and they will not owe COBRA premiums prior to that date.
Eligible individuals who were already paying for COBRA when the law passed can also claim the subsidy.
COBRA premium subsidies are not counted as income to the individual. Subsidies will not affect a person’s tax liability or eligibility for other income-related benefits.
People eligible for COBRA subsidies may also be eligible for marketplace subsidies or Medicaid. Just being eligible for COBRA does not affect a person’s eligibility for marketplace subsidies or Medicaid. Those who have a choice will want to weigh their out of pocket costs (for premiums and cost sharing, net of subsidies), as well as any differences in plan provider networks, covered benefits, and other plan features. Generally, once a person enrolls in COBRA, she won’t have an opportunity to choose marketplace coverage again until the earlier of the next open enrollment period or the date when she exhausts COBRA coverage.
When COBRA premium subsidies end, people can continue unsubsidized enrollment in COBRA. Of course, for many, unsubsidized COBRA may prove unaffordable. Generally, if a person terminates (or stops paying the premium for) COBRA before it exhausts, this loss of coverage does not make a person eligible for a special enrollment period (SEP) in the marketplace.
However, the marketplace has broad authority to recognize new SEP qualifying events. It remains to be seen if HealthCare.gov and state-based marketplaces will recognize termination of COBRA premium subsidies as a qualifying event and allow people the option to switch to more affordable marketplace plans and subsidies at that time.
Other ARP Changes and Affordability
Stimulus payments – The ARP provides for stimulus payments up to $1,400 for qualifying individuals in 2021. These payments are considered tax credits and are not counted as income for purposes of tax liability or eligibility for income-based programs and benefits.
Exemption of UI benefits from federal income tax in 2020 – The ARP also included a provision exempting the first $10,200 in UI benefits paid to an individual in 2020 from inclusion in that individual’s adjusted gross income for that year, which will also lower countable income for the purposes of marketplace premium subsidies. As a result of this change, people who participated in the marketplace in 2020 may find they were eligible for greater premium tax credits than they claimed during the year. If so, people can receive unclaimed 2020 APTC as a refundable tax credit when they file their 2020 federal income tax return. People who already filed their 2020 return before the law was enacted should be able to claim the refund, as well.
Next steps?
These significant changes to make private coverage more affordable were enacted after many people had already enrolled in 2021 marketplace plans, after HealthCare.gov and state-based marketplaces had announced a time-limited special COVID enrollment opportunity, and after the 2020 tax filing season was underway. It will take time for federal and state agencies to implement these changes, including updates to marketplace subsidy eligibility systems, drafting of model notices, and revision of tax forms. The Department of Health and Human Services has announced that the enhanced ACA premium subsidies will be available through HealthCare.gov beginning April 1, but other changes in the ARP may take more time. Under the current special COVID enrollment period, people will have until May 15 to newly sign up for coverage or change plans to take advantage of the additional help.
On March 11, 2021, President Biden signed the American Rescue Plan Act of 2021 (P.L. 117-2), a $1.9 trillion stimulus package, into law. Among other things, this latest relief bill, the nation’s sixth, infuses new funding for critical COVID-19 public health activities, including vaccine distribution, testing, contact tracing, surveillance, and the public health workforce, building on prior emergency relief funding provided by Congress (other provisions of the bill expand the Affordable Care Act by making marketplace and private health insurance more affordable and by providing new incentives to states that have not yet expanded their Medicaid programs to do so). Funding for COVID-19 public health focused activities in the bill totals almost $93 billion, most of which has been made available until expended. The main public health provisions are as follows:
$7.5 billion (Section 2301) to the Secretary of Health and Human Services (HHS) to provide to the Centers for Disease Control and Prevention (CDC) for COVID–19 vaccine distribution and administration, including support for State, local, Tribal, and territorial public health departments. Activities include the establishment and expansion of community vaccination centers and mobile vaccination units, particularly in underserved areas; reporting enhancements; communication efforts; and transportation of individuals to vaccination, particularly underserved populations.
$1 billion (Section 2302) to HHS to provide to CDC for vaccine confidence, information, and education activities.
$6.05 billion (Section 2303) to HHS to support the supply chain for COVID-19 vaccines, therapeutics, and ancillary medical products through research, development, manufacturing, production, and purchasing
$500 million (Section 2304) to the Food and Drug Administration (FDA) for activities related to COVID-19 vaccines, therapeutics, and diagnostics, including for evaluation of their continued performance, safety, and effectiveness and facilitation of advanced continuous manufacturing.
$47.8 billion (Section 2401) to HHS for testing, contact tracing, surveillance, and mitigation activities, including for the development of a national evidence-based strategy, support for State, local, and territorial public health departments, support for development, manufacturing, procurement, distribution, and administration of tests, and to establish and expand Federal, State, local, and territorial testing and contact tracing capabilities.
$1.75 billion (Section 2402) to HHS to be provided to CDC for SARS-CoV-2 genomic sequencing and surveillance, including support for State, local, Tribal, or territorial public health departments or public health laboratories.
$500 million (Section 2404) to CDC for data modernization and forecasting.
$7.66 billion (Section 2501) to HHS for the public health workforce, including support for State, local, and territorial public health departments to hire case investigators, contact tracers, social support specialists, community health workers, public health nurses, disease intervention specialists, epidemiologists, program managers, laboratory personnel, informaticians, communication and policy experts, and any other positions as may be required to prevent, prepare for, and respond to COVID–19 and to provide PPE.
$100 million (Section 2502) to HHS for the medical reserve corps.
$7.6 billion (Section 2601) to HHS for community health centers for activities including COVID-19 vaccine distribution and administration, testing, contact tracing, mitigation, workforce enhancement, and community outreach and education.
$10 billion (Section 3101) to enhance use of the Defense Production Act for the purchase, production, or distribution of medical supplies and equipment for COVID-19 including for testing, PPE, vaccines and other drugs and biological products.
$2.34 billion (Section 11001) to the Indian Health Service for COVID-19 vaccine distribution and administration ($600 million); testing, contact tracing and mitigation ($1.5 billion); and public health workforce for COVID-19 ($240 million).
The Affordable Care Act (ACA) made premium tax credits available to people purchasing health coverage on the Marketplaces, but generally only when their incomes fall between 100% and 400% of the federal poverty level. These subsidies work by capping what an enrollee must spend on a silver benchmark plan premium at no more than a certain percentage of the enrollee’s household income. The premium tax credit amount equals the difference between the actual benchmark plan premium for that individual and the required contribution. The tax credit can be applied to any metal level plan.
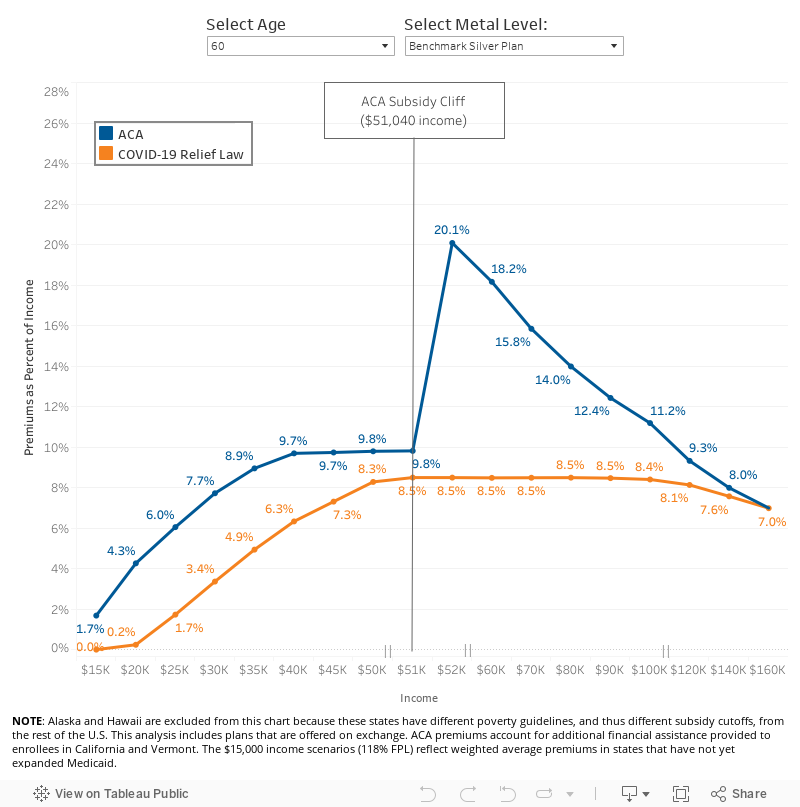
However, a sharp cliff exists at 400% of the poverty level. Under the ACA before any legislative changes, a 60-year-old making $50,000 per year (392% of poverty) would pay no more than $410 per month for a benchmark silver plan (9.83% of her income, after receiving an average subsidy of $548 per month). However, if her income crossed above $51,040 per year (400% of poverty), health insurance would become much more expensive. For example, at an income of $52,000 per year (408% of poverty), a 60-year-old would pay the full-priced premium, which, for a benchmark silver plan, averages $957 per month nationwide (22% of her income). This doubling of the premium payment for people with incomes just over 400% of poverty has been called the “subsidy cliff,” as shown in the blue line in Figure 1 below.
Additionally, there are millions of uninsured people who could be getting subsidized coverage on the ACA Marketplaces, but have not taken advantage of this financial help. In many cases, it may be that the financial help available to them is not sufficient to make the premium or the deductible affordable.
COVID-19 Relief Marketplace Subsidy Expansions
The American Rescue Plan Act of 2021 (COVID-19 relief) law passed in March 2021 expands Marketplace subsidies above 400% of poverty and also increases subsidies for those making between 100% and 400% of the poverty level, for two years (2021 and 2022), consistent with what President Biden proposed during his campaign.
These additional subsidies will yield substantially lower premium payments for the vast majority of the nearly 15 million uninsured people who are eligible to buy on the Marketplace and the nearly 14 million people insured on the individual market. With some exceptions (in the case of the highest income enrollees whose premiums may not be high enough to qualify for a subsidy), most of these 29 million people could see lower health insurance premiums as a result of these subsidies, and many could also afford lower deductible plans. However, it is far from certain how many people will take advantage of the new financial assistance.
Table 1 below compares the ACA and COVID-19 relief subsidy schedule, both of which are benchmarked to the premium of the second-lowest cost silver plan. The COVID-19 relief subsidy schedule increases subsidies across the board, notably extending them for the first time to people with incomes over 400% of the poverty level and guaranteeing access to a plan with a zero dollar premium payment for people with incomes between 100-150% of poverty. The COVID-19 relief law also expands Marketplace subsidies to people receiving unemployment insurance (UI), which we discuss more below.
Table 1: Percent of Income Paid for Marketplace Benchmark Silver Premium, by Income
Income (% of poverty)
Affordable Care Act(before legislative change)
COVID-19 Relief (current law 2021-2022)
Under 100%
Not eligible for subsidies*
Not eligible for subsidies**
100% – 138%
2.07%
0.0%
138% – 150%
3.10% – 4.14%
0.0%
150% – 200%
4.14% – 6.52%
0.0% – 2.0%
200% – 250%
6.52% – 8.33%
2.0% – 4.0%
250% – 300%
8.33% – 9.83%
4.0% – 6.0%
300% – 400%
9.83%
6.0% – 8.5%
Over 400%
Not eligible for subsidies
8.5%
NOTES: *Lawfully present immigrants whose household incomes are below 100% FPL and are not otherwise eligible for Medicaid are eligible for tax subsidies through the Marketplace if they meet all other eligibility requirements.**In the COVID-19 relief law, lawfully present immigrants in states that have not expanded Medicaid would continue to be eligible for marketplace subsidies. In addition, people receiving Unemployment Insurance (UI) are treated as though their income is no more than 133% of poverty for the purposes of the premium tax credit. This could extend premium tax credits to some individuals with incomes below poverty.SOURCE: KFF
Removing the Subsidy Cliff
We estimate that there are about 8 million people who either are buying unsubsidized plans or faced paying full-price for ACA coverage before the COVID-19 relief legislation went into effect. This included an estimated 3.4 million uninsured people who fell into the subsidy cliff (i.e. had incomes too high to qualify them for subsidies under the ACA). Additionally, it included about 3.3 million people buying off-exchange coverage and 1.4 million people buying unsubsidized on-exchange plans, presumably because many were ineligible to buy subsidized coverage.
By extending eligibility for Marketplace subsidies above 400% of poverty, the COVID-19 relief law flattens out the ACA’s subsidy cliff and lowers premiums for virtually everyone already eligible for Marketplace subsidies. As shown in Figure 1, older people with incomes just above 400% of poverty ($51,040 for a single individual) would receive substantial new subsidies. The benefit would gradually phase out at higher incomes, as benchmark silver premiums no longer cross the 8.5% of income threshold.
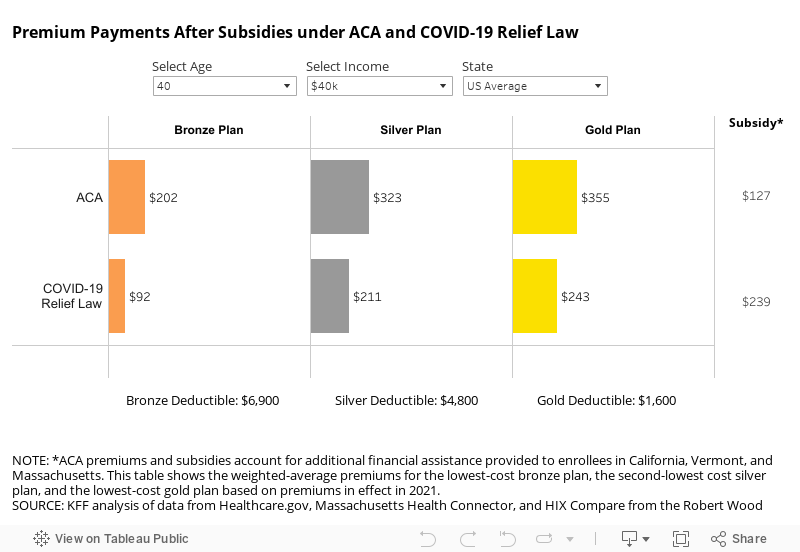
As noted above, older adults with incomes above 400% of poverty would generally see some of the most significant savings from the COVID-19 relief law. Uninsured people in the subsidy cliff tend to be older, on average, than those eligible for subsidies, because premiums were so high for this group under the ACA. Figure 2 below shows the amount of savings available to older enrollees currently falling in the subsidy cliff. Compared to current premium payments, a 60-year-old with a $55,000 income would pay 77% less for a bronze plan ($146 vs. $634 per month), 56% less for a benchmark silver plan ($390 vs. $887 per month), and 52% less for a gold plan ($453 vs. $951 per month), on average, under the COVID-19 Relief law. Many young adults with incomes above 400% of poverty who are currently in the subsidy cliff would also see savings under the COVID-19 relief law, but those savings would be more modest (a 6-9% drop, depending on the metal level, for an average 27 year old).
Expanded Subsidies for Those Already Eligible
While removing the subsidy cliff would provide some of the largest drops in premium payments, the COVID-19 relief’s additional subsidies to those already eligible are also substantial, particularly because they would guarantee zero-premium silver plans to millions of low-income enrollees. At least 3.4 million of the lowest income enrollees would see a 100% decrease in their premium contribution.
The COVID-19 relief sets benchmark silver premium contributions at $0 of income for all enrollees with incomes below 150% of poverty. These zero-premium silver plans would also come with cost-sharing reductions that lower deductibles substantially. Enrollees with incomes between 100-150% of poverty would become eligible for a zero-premium silver plan with an average deductible of $177.
Most of these enrollees would have already been eligible for a zero-premium bronze plan under the ACA, but bronze plans have a typical deductible of about $6,900. For the same $0 premium, the lowest-income Marketplace enrollees could have a deductible that is 97% lower under COVID-19 relief law.
People Receiving Unemployment Insurance
The COVID-19 relief law makes special considerations for people approved to receive or receiving unemployment compensation at any point in 2021. Under the COVID-19 relief law, if a person is receiving unemployment compensation and she qualifies to purchase insurance on the Marketplace, she and any eligible dependents can get a silver plan with a $0 premium. That is because, under the proposal, any household income above 133% of poverty is not considered in the calculation of her premium tax credit if she receives unemployment insurance.
For people receiving unemployment compensation at any point in 2021, their income up to 133% of poverty is counted in determining eligibility for a cost-sharing reduction, which is only available to people with incomes between 100% and 250% of poverty. That is, a person with income, including unemployment compensation, of 260% of poverty would receive a premium and cost-sharing reduction subsidy as if her income is 133% of poverty. A person receiving unemployment income would still need to attest that they do not have an affordable offer of employer-sponsored insurance from their spouse or other family member. As the COVID-19 relief law does not change the so-call “family glitch” in the ACA, if an employer offer is deemed affordable (9.83% of household income for 2021 for self-only coverage), this may disqualify people receiving unemployment income from receiving ACA subsidies if they still have a working family member with an employer offer.
State-Level Differences
As is the case under the ACA, the amount of the subsidy in the COVID-19 relief law would vary by age, income, and geography. Tables in the Appendix show premium payment at the national level for various age and income scenarios, and at the state level for a 60-year-old currently in the ACA subsidy cliff. Note that all tables take into account additional state subsidies that are already provided in California and Vermont, so the typical savings would be even greater if those state were excluded.
Older adults in the ACA subsidy cliff who are living in states with high premiums would see the largest premium savings from the COVID-19 relief law. As shown in the map below, a 60-year-old making $55,000 per year living in Wyoming, West Virginia, South Dakota, Nebraska, Connecticut, or Alabama would save over 70% on the benchmark silver plan, on average. Older adults previously in the ACA subsidy-cliff in several states would even become eligible for free bronze plans, as shown in the state-level Appendix table.
Implications for Federal Government Costs and the Uninsured Rate
The Congressional Budget Office (CBO) and Joint Committee on Taxation (JCT) project that the enhanced premium tax credits in the original House COVID-19 relief proposal would increase federal deficits by $34.2 billion over ten years (including an increase in direct federal spending of $22.0 billion and a reduction in revenues of $12.2 billion). Additionally, CBO and JCT expect the enhanced subsidies for people receiving unemployment insurance to add another $4.5 billion over the next ten years (including an increase in outlays of $2.4 billion and a decrease in revenues of $2.1 billion).
CBO projections are generally over a 10-year period. Because the enhanced subsidies only last two years, though, most of the costs would be concentrated in 2021 and 2022. However, CBO and JCT expect some new enrollees to continue purchasing subsidized Marketplace coverage for a few years, even if those enrollees are no longer receiving enhanced subsidies.
The CBO and JCT estimate that, in 2022, 1.7 million people would gain coverage through the Marketplace. They estimate that new enrollees will account for $13.0 billion in federal costs, with the remaining going to enhanced premium tax credits for existing enrollees.
Methods
We analyzed data from the 2021 Individual Market Medical files to determine premiums and the benchmark amounts to calculate premium tax credits for the scenarios presented. Premiums for state-based Marketplaces are from KFF analysis of data received from Massachusetts Health Connector, Covered CA, and KFF analysis of data published by HIX Compare from the Robert Wood Johnson Foundation. This analysis only includes on-exchange plans. The premium caps used to model premiums under the ACA and the COVID-19 relief law are shown in Table 1 above.
All averages are weighted by county-level 2020 plan selections. 2020 plan selections come from the 2020 Marketplace Open Enrollment Period County-Level Public Use file provided by CMS. In states running their own exchanges, we gathered county-level plan selection data where possible and otherwise estimated county plan selections based on the county population in the 2010 Census and total state plan selections in the 2020 OEP State-Level Public Use File provided by CMS.
Premium Interactive
Appendix
Appendix Table 1: Change in Monthly Benchmark Premium under COVID-19 Relief Law
27-year-old
40-year-old
60-year-old
Income
FPL
ACA
COVID-19 Relief
ACA
COVID-19 Relief
ACA
COVID-19 Relief
$20,000
157%
$72
$4
$72
$4
$72
$4
$25,000
196%
$126
$37
$126
$37
$126
$37
$30,000
235%
$193
$85
$193
$85
$193
$85
$35,000
274%
$261
$145
$261
$145
$261
$145
$40,000
313%
$316
$211
$323
$211
$324
$211
$45,000
353%
$341
$274
$362
$274
$366
$274
$50,000
392%
$354
$330
$394
$344
$408
$346
$60,000
470%
$373
$357
$450
$404
$909
$425
$70,000
549%
$373
$367
$450
$430
$924
$496
$80,000
627%
$373
$371
$450
$442
$933
$566
$90,000
705%
$373
$373
$450
$447
$933
$636
$100,000
784%
$373
$373
$450
$449
$933
$701
NOTES: This table shows enrollment-weighted average premiums for the lowest-cost bronze plan. ACA premiums account for additional financial assistance provided to enrollees in California, Vermont, and Massachusetts.SOURCE: KFF analysis of data from Healthcare.gov, Massachusetts Health Connector, and HIX Compare from the Robert Wood Johnson Foundation.
Appendix Table 2: Change in Monthly Bronze Premium under the COVID-19 Relief Law
27-year-old
40-year-old
60-year-old
Income
FPL
ACA
COVID-19 Relief
ACA
COVID-19 Relief
ACA
COVID-19 Relief
$20,000
157%
$4
$0
$2
$0
$1
$0
$25,000
196%
$37
$0
$24
$0
$3
$0
$30,000
235%
$92
$7
$74
$3
$12
$0
$35,000
274%
$158
$49
$139
$33
$42
$2
$40,000
313%
$215
$111
$202
$92
$89
$17
$45,000
353%
$240
$172
$240
$153
$124
$50
$50,000
392%
$253
$229
$272
$222
$163
$107
$60,000
470%
$272
$256
$328
$282
$656
$178
$70,000
549%
$272
$266
$328
$308
$671
$246
$80,000
627%
$272
$270
$328
$320
$680
$315
$90,000
705%
$272
$272
$328
$325
$680
$384
$100,000
784%
$272
$272
$328
$327
$680
$449
NOTES: This table shows enrollment-weighted average premiums for the lowest-cost bronze plan. ACA premiums account for additional financial assistance provided to enrollees in California, Vermont, and Massachusetts.SOURCE: KFF analysis of data from Healthcare.gov, Massachusetts Health Connector, and HIX Compare from the Robert Wood Johnson Foundation.
Appendix Table 3: Change in Monthly Gold Premium under the COVID-19 Relief Law
27-year-old
40-year-old
60-year-old
Income
FPL
ACA
COVID-19 Relief
ACA
COVID-19 Relief
ACA
COVID-19 Relief
$20,000
157%
$96
$33
$101
$40
$137
$80
$25,000
196%
$150
$62
$155
$68
$190
$106
$30,000
235%
$220
$112
$225
$118
$259
$154
$35,000
274%
$287
$172
$293
$177
$326
$212
$40,000
313%
$343
$238
$355
$243
$388
$277
$45,000
353%
$368
$300
$393
$306
$430
$339
$50,000
392%
$381
$357
$426
$375
$472
$410
$60,000
470%
$400
$384
$482
$436
$972
$489
$70,000
549%
$400
$394
$482
$462
$988
$560
$80,000
627%
$400
$398
$482
$474
$996
$630
$90,000
705%
$400
$400
$482
$479
$996
$699
$100,000
784%
$400
$400
$482
$481
$996
$765
NOTES: This table shows enrollment-weighted average premiums for the lowest-cost bronze plan. ACA premiums account for additional financial assistance provided to enrollees in California, Vermont, and Massachusetts.SOURCE: KFF analysis of data from Healthcare.gov, Massachusetts Health Connector, and HIX Compare from the Robert Wood Johnson Foundation.
Appendix Table 4: Average Change in Monthly Premium for Enrollee at $55,000 Income (430% of Poverty) Under the COVID-19 Relief Law, by State
Lowest-Cost Bronze
Benchmark Silver
Lowest-Cost Gold
State
ACA
COVID-19 Relief
ACA
COVID-19 Relief
ACA
COVID-19 Relief
Alabama
$852
$1
$1,253
$390
$1,421
$558
Arizona
$726
$198
$925
$390
$1,175
$640
Arkansas
$684
$238
$836
$390
$1,059
$613
California
$349
$176
$566
$390
$605
$428
Colorado
$579
$223
$746
$390
$813
$458
Connecticut
$781
$0
$1,349
$390
$1,116
$157
DC
$726
$221
$894
$390
$929
$424
Delaware
$850
$94
$1,146
$390
$1,098
$342
Florida
$720
$144
$968
$390
$1,038
$459
Georgia
$738
$162
$966
$390
$982
$406
Idaho
$701
$41
$1,051
$390
$1,117
$456
Illinois
$716
$210
$897
$390
$1,016
$509
Indiana
$706
$212
$883
$390
$1,257
$763
Iowa
$660
$13
$1,110
$390
$941
$221
Kansas
$793
$170
$1,013
$390
$1,063
$440
Kentucky
$726
$107
$1,009
$390
$1,229
$609
Louisiana
$871
$121
$1,154
$390
$1,304
$539
Maine
$738
$196
$932
$390
$1,049
$507
Maine
$534
$271
$653
$390
$769
$506
Maryland
$471
$123
$738
$390
$695
$347
Massachusetts
$467
$238
$619
$390
$707
$478
Michigan
$542
$196
$738
$390
$785
$437
Mississippi
$864
$279
$974
$390
$1,153
$569
Missouri
$738
$116
$1,016
$390
$1,125
$498
Montana
$701
$89
$1,001
$390
$1,026
$415
Nebraska
$932
$4
$1,485
$390
$1,340
$247
Nevada
$594
$150
$834
$390
$1,003
$559
New Hampshire
$525
$207
$707
$390
$770
$453
New Jersey
$677
$207
$859
$390
$1,404
$934
New Mexico
$501
$171
$719
$390
$687
$358
New York
$430
$223
$597
$390
$709
$502
North Carolina
$742
$64
$1,095
$390
$1,101
$395
North Dakota
$579
$0
$1,047
$390
$918
$261
Ohio
$595
$213
$772
$390
$910
$527
Oklahoma
$780
$63
$1,177
$390
$1,065
$287
Oregon
$675
$141
$923
$390
$973
$439
Pennsylvania
$635
$99
$927
$390
$881
$344
Rhode Island
$491
$139
$742
$390
$719
$367
South Carolina
$697
$86
$1,005
$390
$1,090
$474
South Dakota
$965
$57
$1,312
$390
$1,385
$463
Tennessee
$722
$152
$983
$390
$1,197
$604
Texas
$640
$113
$917
$390
$911
$383
Utah
$578
$22
$956
$390
$980
$413
Vermont
$491
$212
$669
$390
$674
$394
Virginia
$760
$134
$1,016
$390
$984
$358
Washington
$595
$163
$821
$390
$895
$463
West Virginia
$1,266
$281
$1,375
$390
$1,752
$767
Wisconsin
$718
$140
$970
$390
$1,020
$439
Wyoming
$1,103
$0
$1,679
$390
$1,369
$80
NOTES: This table shows enrollment-weighted average premiums for the lowest-cost bronze plan, the second-lowest cost silver plan, and the lowest-cost gold plan in each county, based on premiums in effect in 2021. ACA premiums account for additional financial assistance provided to enrollees in California, Vermont, and Massachusetts.SOURCE: KFF analysis of data from Healthcare.gov, Massachusetts Health Connector, and HIX Compare from the Robert Wood Johnson Foundation.
Even as the COVID-19 vaccine roll-out is accelerating across the country, the public health and economic effects of the pandemic continue to put pressure on Medicaid spending and enrollment. In mid-February 2021, the Kaiser Family Foundation (KFF) and Health Management Associates (HMA) fielded a two-part rapid, mini-survey of Medicaid directors in all 50 states and the District of Columbia as a follow-up to the annual Medicaid Budget Survey conducted last summer. This brief provides insights into the current status of Medicaid enrollment and spending trends in FY 2021 and state projections for FY 2022. See separate brief for findings from Part II of this mini-survey, related to state Medicaid agency involvement with the COVID-19 vaccination roll-out. A total of 38 states responded to the Part I enrollment and spending survey, although not all of these states answered all of the survey questions. These states accounted for over three-quarters of total Medicaid enrollment.1 For most states, the state fiscal year begins on July 1. Key findings include the following:
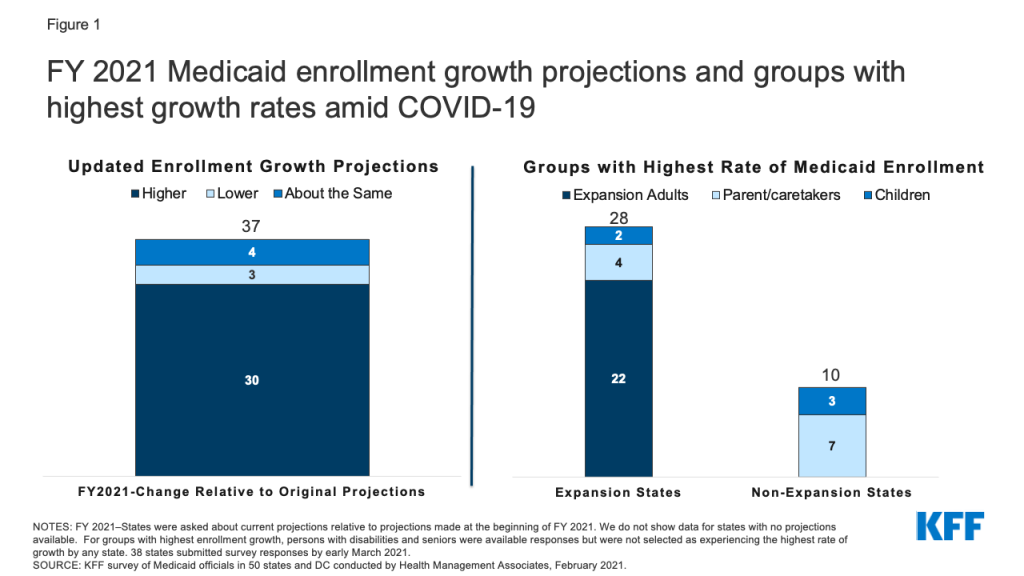
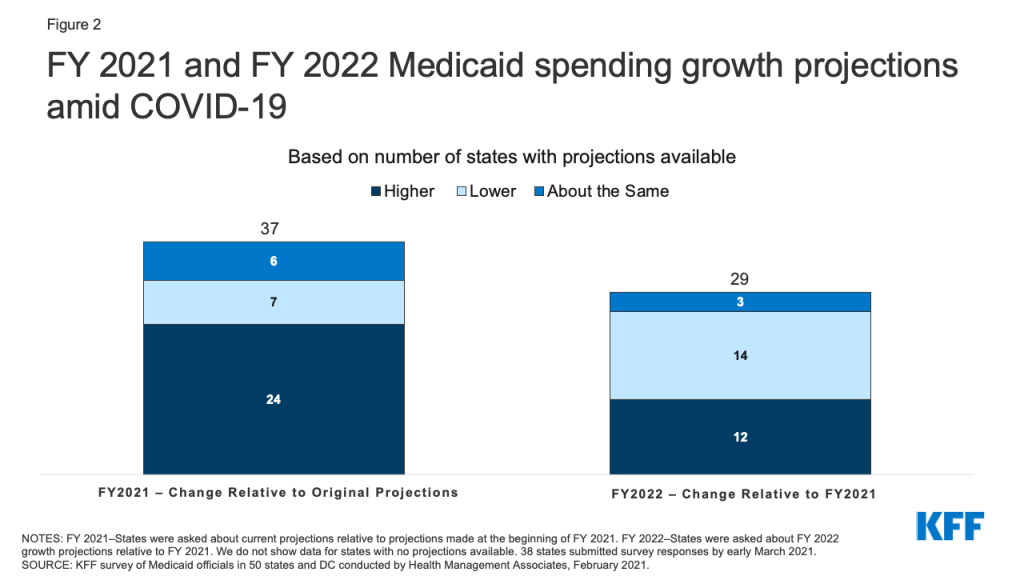
Most states with updated Medicaid enrollment projections expect overall FY 2021 enrollment to exceed original projections (30 of 37 states). Most states reported that expansion adults and other adults had the highest rates of growth. Two-thirds of states with updated Medicaid expenditure projections for FY 2021 (24 of 37 states) also expect total FY 2021 Medicaid expenditures to exceed original projections.
Looking ahead to FY 2022, just under half of responding states (12 of 29) are projecting a highertotal Medicaid expenditure growth rate in FY 2022 compared to FY 2021, while just over half (14 of 29) are expecting the growth rate to be lower. While fewer states reported specific FY 2022 spending growth rate percentages, the median rate for 21 reporting states was 5.6% while the median projected enrollment growth rate for 17 reporting states was 5.5%. Most states with updated projections assumed that the public health emergency (PHE) would remain in effect through CY 2021, part-way through the state fiscal year.
Medicaid spending and enrollment trends will continue to depend on the trajectory of the pandemic and the economic downturn as well as the duration of the PHE. In particular, the expiration of the PHE and the enhanced FMAP will have implications for state spending during the 2022 fiscal year.
Background/Context
The coronavirus pandemic has generated both a public health crisis and an economic crisis, with major implications for Medicaid, a countercyclical program. During economic downturns, more people enroll in Medicaid, increasing program spending at the same time state tax revenues may be falling. To help support states as Medicaid enrollment grows and ensure continuous coverage for enrollees, the Families First Coronavirus Response Act (FFCRA) authorized a 6.2 percentage point increase in the federal match rate (“FMAP”) for states that meet certain “maintenance of eligibility” (MOE) requirements. The additional funds were retroactively available to states beginning January 1, 2020 and continue through the quarter in which the PHE period ends. While the current PHE declaration expires on April 21, 2021, the Biden Administration has notified states that the PHE will likely remain in place throughout CY 2021 and that states will receive 60 days-notice before the end of the PHE to allow states time to prepare for the end of emergency authorities and the resumption of pre-PHE rules.
After relatively flat Medicaid enrollment growth in FY 2020 (0.4%), states responding to KFF’s annual Medicaid Budget Survey conducted in June-August 2020, projected, on average, that Medicaid enrollment would increase 8.2% in FY 2021 (over FY 2020) and total spending would increase by 8.4%. Preliminary national data show that total Medicaid and CHIP enrollment grew to 77.3 million in September 2020, an increase of 6.1 million, or 8.6%, from February 2020. This growth likely reflects both changes in the economy, as more people experience income and job loss and become eligible and enroll in Medicaid coverage, and the FFCRA MOE provisions that require states to ensure continuous coverage for current Medicaid enrollees through the end of the month in which the PHE ends. This growth represents a reversal of recent Medicaid enrollment trends in 2016 through 2019, when the rate of total Medicaid and CHIP enrollment growth was declining or negative.
All states are experiencing fiscal stress tied to the pandemic, although individual state experiences vary. The impact of the pandemic on states depends on a variety of factors including the composition of state economies, tax structures, and virus transmission levels, among other factors. For example, states that are more dependent on tourism and the energy sector have seen larger economic and state revenue impacts. Overall, however, state revenues declined in FY 2020 and greater declines are expected in FY 2021. As a result, states’ enacted budgets for FY 2021 reflect the first general fund spending decrease in more than ten years as states make reductions to meet balanced budget requirements. While the state fiscal relief provided by FFCRA has undoubtedly helped states avoid more severe budget cuts, some states still face budget gaps that they must address. While states often turn to provider rate and benefit restrictions to constrain Medicaid spending during economic downturns, these cost containment approaches may not be as viable with providers facing revenue shortfalls and enrollees facing increased health risks due to the pandemic.
KEY FINDINGS
Enrollment
Most states with updated Medicaid enrollment projections expect overall FY 2021 enrollment to exceed original projections (30 of 37 states) with higher growth rates reported for expansion and other adults. We asked states to identify the eligibility group (children, parent/caretakers, expansion adults, persons with disabilities, or seniors) that has experienced the highest rate of enrollment growth in FY 2021 (Figure 1). A majority of responding states that had implemented the ACA Medicaid expansion as of February 2021 (22 of 28) indicated “expansion adults” have experienced the highest rate of enrollment growth in FY 2021 while four expansion states identified “parent/caretakers” and two expansion states identified “children.” Among the 10 responding non-expansion states, seven states indicated “parent/caretakers” have experienced the highest enrollment growth in FY 2021 while three states indicated “children.” No states reported seniors or persons with disabilities as groups experiencing the highest rate of enrollment growth. Nonelderly adults are more likely to be affected by changes in the economy and more likely to experience churn on and off the program that the FFCRA MOE has eliminated during the PHE.
Figure 1: FY 2021 Medicaid enrollment growth projections and groups with highest growth rates amid COVID-19
The median growth rate for the 17 states reporting Medicaid enrollment growth projections for FY 2022 over FY 2021 is 5.5%. We asked states whether their projections accounted for the likelihood that the PHE and continuous coverage requirements would remain in place through CY 2021 as indicated in a January 2021 Biden administration letter to Governors. More than half of the responding states indicated that their projections reflect the PHE remaining in place throughout 2021, followed by a gradual enrollment decline beginning in CY 2022 after the expiration of continuous coverage requirements (during the second half the state fiscal year for most states). Several states indicated that their projections did not assume that the PHE and continuous coverage requirements would remain in place through the end of CY 2021 suggesting that the projections were developed prior to the release of the Biden Administration letter or that some states may not consider the letter to reflect enough certainty. Based on these assumptions, these states generally reported lower expected enrollment growth for FY 2022 than states that assumed the PHE would continue through CY 2021. To the extent that the PHE remains in place longer, actual enrollment could be higher than projected. In addition to uncertainty regarding the PHE end date, states cited other currently unknown factors that could significantly affect the accuracy of current FY 2022 enrollment projections such as future trends in unemployment and the Medicaid enrollment impacts of the ACA special enrollment period.
Expenditures
Almost two-thirds of states with updated Medicaid expenditure projections for FY 2021 (24 of 37) expect total FY 2021 Medicaid expenditures to exceed original projections (Figure 2). Nearly all of these states (23 of 24) indicated higher enrollment as the most significant driver of FY 2021 Medicaid expenditures so far. States attributed increases in enrollment to both the economic downturn and to the FFCRA MOE requirements. In contrast, about one third of states with updated FY 2021 projections expect total Medicaid expenditures to be lower than (7 of 37) or about the same as (6 of 37) earlier projections. Four states expecting lower FY 2021 total Medicaid expenditures attribute decreases to net decreases in utilization; three of these states deliver Medicaid services to enrollees through fee-for-service delivery systems where net decreases in utilization immediately result in lower Medicaid expenditures. While utilization may have been initially depressed in FY 2021 due to enrollees foregoing or providers limiting non-urgent care, some states commented that utilization was starting to rebound. Decreases in utilization in heavily capitated managed care states may not result in lower expenditures unless states adjust capitation rates.
Although many states’ updated FY 2021 total Medicaid expenditure projections exceed the projections originally made at the beginning of the state fiscal year, nine of 38 states reported mid-year cost containment policy actions. Three states indicated implementing mid-year provider rate cuts, and although not specifically asked about provider taxes, one state reported that they implemented a new provider tax in 2021. Eight states indicated making mid-year managed care plan rate adjustments. However, several states also commented that MCO contracts were amended to add risk mitigation strategies (e.g., risk corridors). One state reported implementing mid-year benefit restrictions, and one state reported several benefit expansions passed by the state legislature in 2020 were removed before implementation. The survey did not ask about the effects of the federal fiscal relief, but states had reported in an earlier survey that the fiscal relief helped to mitigate Medicaid cuts and address Medicaid shortfalls.
Of the 29 states with expenditure projections for next fiscal year, half anticipate that total Medicaid expenditure growth in FY 2022 will slow down compared to FY 2021 while just under half expect the rate to accelerate (Figure 2). Three states expect the rate of spending growth to be “about the same.” The median growth rate for the subset of states (21) reporting actual growth rates for FY 2022 is 5.6% (over FY 2021). While we only asked about total spending projections, state spending growth is likely to accelerate in FY 2022 when the PHE and enhanced FMAP expire, as states will need to replace the expiring federal funds with state funds.
About one-third of responding states (12 of 38) reported plans to introduce cost containment policy actions in FY 2022. Six states plan to introduce provider rate cuts in FY 2022, seven states plan to make MCO rate adjustments, and three states plan to introduce benefit restrictions. Other planned FY 2022 cost containment strategies/actions reported by states include expansion of value-based payment initiatives, new utilization management strategies, and the introduction of risk-based managed care. Similar to the mid-year cost containment strategies reported for FY 2021, several states reported plans to introduce (or continue) capitated managed care plan risk mitigation strategies (e.g., risk corridors) and at least one state plans to implement revenue generating provider fees. Fourteen states reported that no cost containment policy actions are planned for FY 2022, nine states reported that FY 2022 actions are undetermined, and three states responded, “don’t know.”
As states approach the end of FY 2021 and adopt budgets for FY 2022 (that begins in July for most states), they must account for the ongoing impacts of the pandemic and resulting economic downturn on Medicaid spending and enrollment trends. While substantial enrollment growth has already occurred across all states, more growth is possible as individuals continue to struggle with the economic downturn and due to the decision to open enrollment in the federal ACA Marketplaces from February 15 through May 15, combined with $50 million in federal spending on outreach and education about ACA coverage options. This outreach has the potential to reach millions of people who became uninsured prior to or during the pandemic and will likely result in more eligible low-income people enrolling in Medicaid. State spending and enrollment projections must also account for the expiration of the PHE. At that time, states will resume eligibility renewals and redeterminations, possibly leading to slower enrollment growth and decreased total spending growth. The end of the PHE, however, will also end the enhanced FMAP requiring states to increase state spending to replace the expiring federal funds. Finally, even if total Medicaid spending growth is lower in FY 2022 relative to 2021, median growth rates in excess of 5 percent may difficult to absorb, depending on how quickly the economy and state revenues recover.
The 13 states that did not respond were: Arkansas, the District of Columbia, Georgia, Hawaii, Idaho, Louisiana, New Hampshire, New Jersey, New Mexico, Ohio, Texas, Utah, and Vermont. ↩︎
As of February 2021, there are three COVID-19 vaccines approved for emergency use in the U.S. and states are playing a central role in their timely distribution and prioritizing eligible populations. Because Medicaid covers for over 77 million enrollees, including groups disproportionately at risk of contracting COVID-19 as well as hard-to-reach groups, Medicaid agencies can be important partners for the public health agencies that are typically leading the state COVID-19 vaccination efforts. In mid-February 2021, the Kaiser Family Foundation (KFF) and Health Management Associates (HMA) fielded a two-part rapid, mini-survey of Medicaid directors in all 50 states and the District of Columbia. Of the 32 states that responded to Part II of the survey, 29 reported that Medicaid agencies were involved in at least one vaccine roll-out activity (Figure 1). This brief provides insights regarding how state Medicaid agencies are assisting with the COVID-19 vaccine roll-out including specific actions taken. (See separate brief for findings from Part I of the mini-survey related to Medicaid enrollment and spending trends.)
Figure 1: States reported taking specific actions related to vaccine roll-out in state
Three-quarters of responding states (24 of 32) reported partnering with public health or other agencies to plan and implement the vaccine roll-out. Several states indicated close coordination with their state departments of public health that are taking the lead on vaccine distribution and roll-out. For example, one state commented that it amplifies the public health department’s messaging and communications, but also periodically relays back concerns from key Medicaid stakeholders (e.g., behavioral providers not included in the Phase 1a priority group for health care workers). Fewer states, however, reported being involved with determining state vaccination priority lists (11 of 32).
Over three-quarters of responding states indicated their state Medicaid agencies are providing technical assistance to providers (25 of 32). States reported communicating directly with Medicaid providers regarding the roll-out of COVID-19 vaccinations through, for example, provider bulletins and dedicated webpages that include information on COVID-19 vaccination coverage, reimbursement, and billing and a dedicated email address/inbox for provider questions. One state also reported that it has worked to ensure that there is an expedited process for vaccinators to enroll in Medicaid (if not already enrolled).
Over half of responding states reported conducting outreach to Medicaid enrollees to encourage COVID vaccination take-up (19 of 32). Several states discussed working with Medicaid managed care plans on vaccine roll-out activities including: messaging to address member vaccine hesitancy; clarifying the availability of MCO care coordination and transportation services that could reduce vaccine access barriers; coordinating COVID vaccine appointments; calling high-risk members, and making vaccination appointment reminder calls. Over half of responding states (17 of 32) are expanding services to assist with vaccine roll-out. For example, a few states specifically mentioned authorizing nonemergency medical transportation (NEMT) services for vaccine appointments. A number of states (12 of 32) also reported planning or authorizing new or expanded Medicaid administrative supports. One state, for example, commented that its existing nurse advice line will provide general information to callers regarding vaccine administration.
The majority of responding states reported that the Medicaid agency is involved with specific activities to assist with vaccine roll-out to groups disproportionately covered by Medicaid. About two-thirds of responding states (22 of 32) reported that their state Medicaid agencies are involved with specific activities to assist with vaccine roll-out to HCBS recipients. About half of responding states also reported assisting with vaccine roll-out efforts for residents of non-nursing home institutions, communities of color, and people in rural areas (Figure 2). Several states commented on a number of specific activities underway including:
Data sharing with the public health agency on seniors receiving HCBS who are not in a nursing facility or alternative living facility. The public health agency matched the data provided against its vaccine registry and is now conducting outreach to those not yet vaccinated.
Developing quality measures focused on closing vaccination disparities between whites and communities of color.
Proactively outreaching to NEMT drivers to get vaccinated and drive to vaccination events.
Requesting federal approval to provide COVID-19 vaccines to populations who are in limited benefit programs (e.g., family planning program, COVID-19 uninsured group, and restricted scope programs where only emergency and pregnancy related services are offered).
Partnering with Rite Aid to provide vaccinations to long-term care facilities not covered by the federal pharmacy partnership program.
Encouraging MCOs to utilize community health workers to conduct outreach to individuals that are transient or difficult to reach, including individuals experiencing homelessness, people with disabilities, or individuals with substance use disorders.
Figure 2: States reported taking specific actions to assist with vaccine roll-out to groups disproportionately covered by Medicaid
More than three-quarters of states (26 of 32) indicated at least one way in which partnerships between public health and Medicaid had been or could be further developed to assist with vaccine roll-out efforts. The most common areas of opportunity reported were coordinating outreach, data sharing, and holding daily or weekly meetings between agencies. States described other activities that could assist in vaccine roll-out efforts including: creating opportunities to have staff work across agencies; coordinating to assist individuals without internet access and individuals whose first language is not English in scheduling vaccination appointments, and working to help ensure and promote equity regarding the vaccine roll-out.
Early data suggest significant racial disparities in COVID-19 vaccinations, with higher vaccination rates among White people compared to Hispanic and Black people as of early March, based on available state-reported data. The Biden administration has identified equity as a key priority in its national COVID-19 response strategy. One action the administration is pursuing to advance equity in vaccinations is to increase distribution through community health centers.
Community health centers are a national network of safety net primary care providers and are a primary source of care for many low-income populations and people of color. This analysis examines the extent to which early vaccination efforts through community health centers are reaching people of color using data from the federal government’s weekly Health Center COVID-19 Survey. We include data from the survey weeks of January 8 through February 26, 2021, largely before the start of the federal health center COVID-19 vaccination program.
Just over half (54%) of people who received their first dose of the COVID-19 vaccine from health centers were people of color, including 26% who were Hispanic and 12% who were Black. These shares are higher than the shares of nationwide vaccinations; show that 9% of people receiving one more dose of vaccine as of March 7, 2021 were Hispanic and 7% were Black. The shares of vaccinations received by people of color at community health centers increased in more recent weeks compared to vaccinations in January 2021.
The shares of people receiving the first dose of the COVID-19 vaccine at health centers who were Black, Hispanic, and Asian generally matched or exceeded their shares of the total population. However, their shares of vaccinations were similar or slightly lower than their shares of the overall health center patient population. Patterns of health center vaccinations by race/ethnicity compared to their population distributions varied widely by state.
While vaccinations at health centers represent a relatively small share of total vaccinations administered nationally to date, further ramping up health centers’ involvement in vaccination efforts at the federal, state, and local levels will likely be a meaningful step in reaching people of color and advancing equity on a larger scale.
The latest report from the KFF COVID-19 Vaccine Monitor examines how the COVID-19 pandemic has impacted the lives of lesbian, gay, bisexual and transgender (LGBT) people and finds that larger shares of LGBT adults report economic losses and mental health struggles than their non-LGBT counterparts.
Based on data gathered on self-identified LGBT and non-LGBT individuals over two months, some of the key differences include:
Economic impact. Most LGBT adults say that they or a household member lost a job or income due to the pandemic (56%), which compares to 44% of non-LGBT adults.
Mental health. Three quarters (74%) of LGBT people say worry and stress from the pandemic has had a negative impact on their mental health, compared to half (49%) of non-LGBT people. LGBT people are also more than twice as likely to say this negative impact has been major (49% to 23%).
Vaccine intentions. LGBT people are about as eager to get vaccinated as other Americans but more view it as a part of everyone’s responsibility to protect the public health (75%) rather than a personal choice (24%). Non-LGBT individuals are about as equally likely to say it is part of everyone’s responsibility (48%) and a personal choice (49%).
Differences in the experiences of LGBT and non-LGBT individuals likely reflect a number of factors. Other research has found that LGBT individuals are more likely to work in health care, restaurants and other industries highly impacted by the pandemic; have lower average incomes; and may experience discrimination and stigma, including in accessing health care.
This analysis is based on interviews conducted in December and January among a nationally representative random digit dial telephone sample of 3,239 adults, including 174 who identified as lesbian, gay, bisexual, or transgender. The margin of sampling error is plus or minus 9 percentage points for the full LGBT sample and 2 percentage points for the non-LGBT sample. For results based on subgroups, the margin of sampling error may be higher. Detailed methodology can be found in the toplines for the December and January KFF COVID-19 Vaccine Monitor.
The KFF COVID-19 Vaccine Monitor is an ongoing research project tracking the public’s attitudes and experiences with COVID-19 vaccinations. Using a combination of surveys and qualitative research, this project tracks the dynamic nature of public opinion as vaccine development and distribution unfold, including vaccine confidence and acceptance, information needs, trusted messengers and messages, as well as the public’s experiences with vaccination.