Key Questions About Nursing Home Cases, Deaths, and Vaccinations as Omicron Spreads in the United States

Published: Jan 20, 2022

Staff and residents at long-term care facilities were hit hard by the pandemic, reporting over 195,000 deaths as of the end of 20211 , or about 23% of all COVID-19 deaths in the U.S. After a dramatic surge, cases and deaths in long-term care facilities (including nursing homes, assisted living facilities, ICF/IIDs, and other settings) dropped following the vaccine rollout in the Winter of 2020-2021, according to a KFF analysis. Since then, nursing home cases and deaths have mostly risen and fallen in tandem with national cases and deaths, although they are once again on the rise as Omicron has taken hold in the U.S.

This data note analyzes federal nursing home data as of January 2nd, 2022 to determine the impact of the pandemic on COVID-19 cases and deaths among staff and residents, amid the recent surge of national cases due to the Omicron variant. The data on overall U.S. and nursing home cases and deaths in this analysis reflects data reported over the holiday season, which may include delayed, disrupted, or otherwise anomalous reporting. Additionally, since increases in deaths lag increases in cases, it is not yet clear the extent to which the surge in Omicron will affect mortality. See methods box for more details.

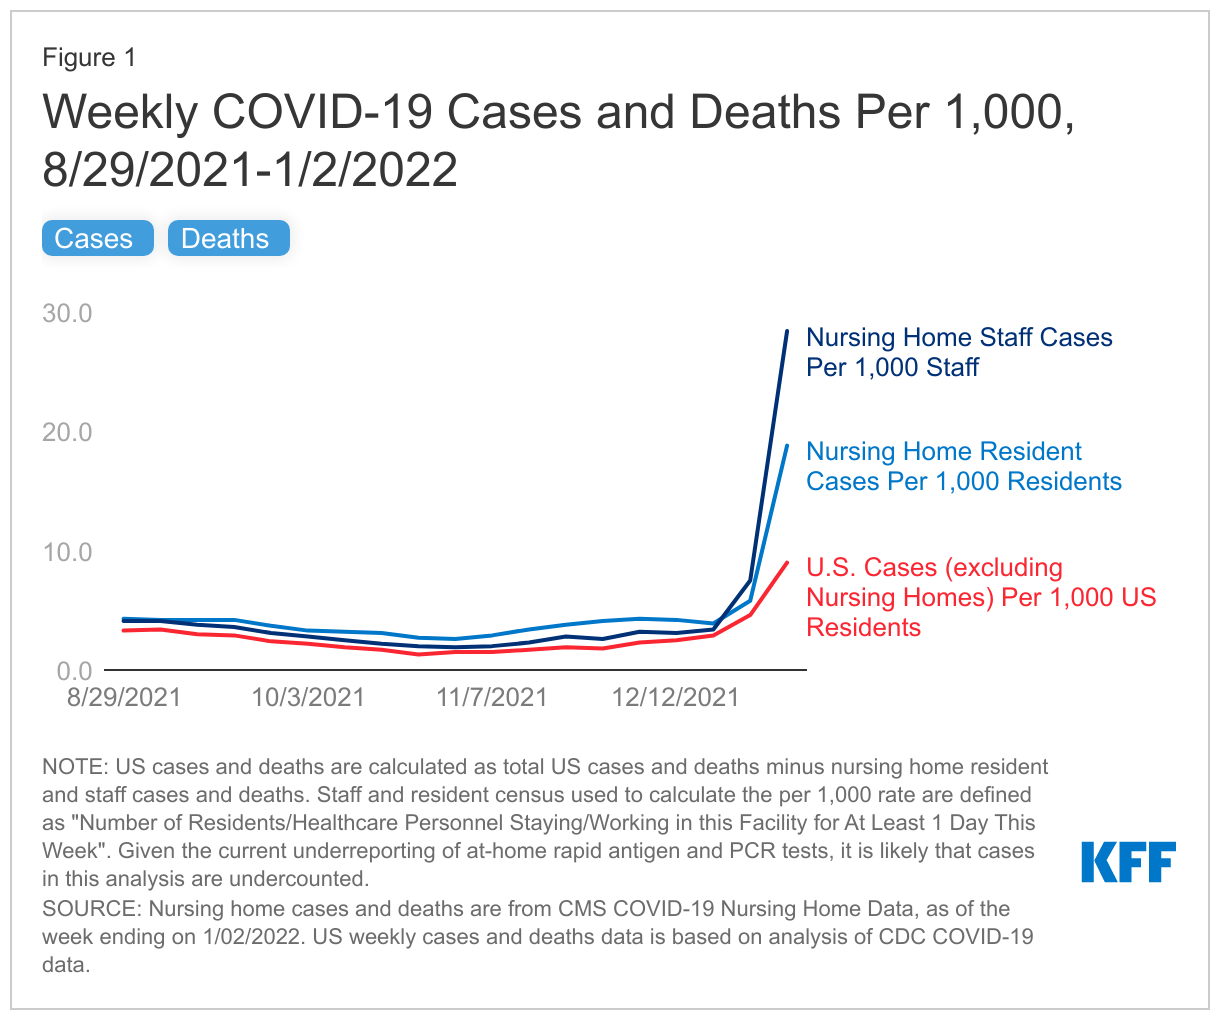
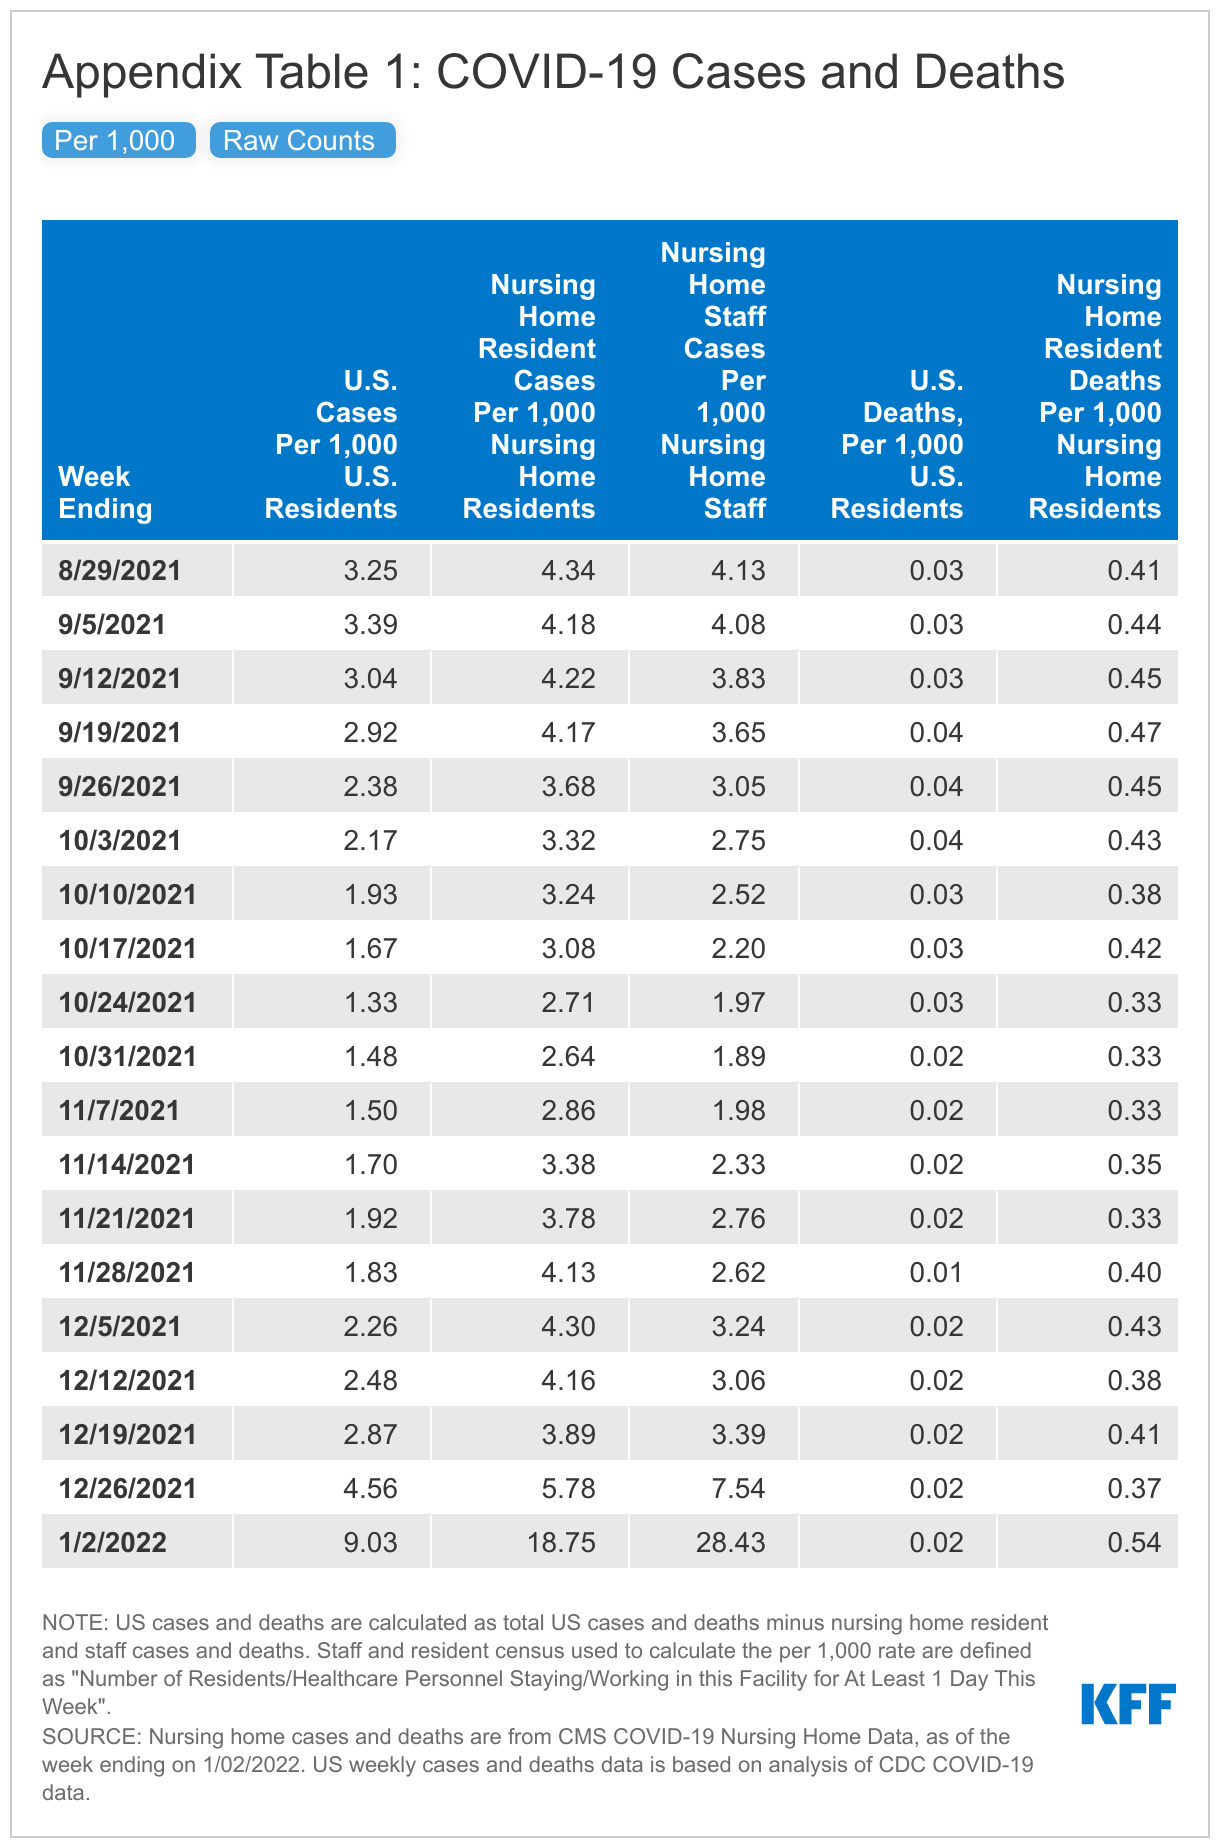
Cases and deaths in nursing homes are rising, generally mirroring current trends in the overall U.S., though rates have recently started to rise faster in nursing homes (Figure 1 and Appendix Table 1). In the week ending January 2nd, 2022, nursing homes reported 18.75 resident cases per 1,000 residents, a 225% increase from the week prior, and 0.54 resident deaths per 1,000 residents, a 48% increase from the week prior.

Cases among nursing home staff have increased at an even steeper rate, with staff cases per 1,000 staff increasing by 277%. These patterns look mostly similar to the current rise in cases and deaths across the U.S., aligning with the general pattern observed over the course of the pandemic.

In the week ending January 2nd, nursing home residents and staff reported higher case rates (per 1,000) than the overall U.S. population, and higher death rates (per 1,000) among nursing home residents (Figure 1 and Appendix Table 1). According to the most recent data available, the case rate was higher for nursing home staff (28.43 per 1,000) than for nursing residents (18.75 per 1,000), both of which were higher than the overall U.S. average (9.03 cases per 1,000). Nursing homes reported 0.54 resident deaths per 1,000 residents, which is over 25 times the death rate reported in the general population (0.02 deaths per 1,000). Higher case rates may be attributed to the highly transmissible nature of Omicron and the nature of congregate care settings. Higher death rates may be attributed to the high-risk status of those who reside in nursing homes.

Weekly COVID-19 Cases and Deaths Per 1,000, 8/29/2021-1/2/2022

How have vaccination rates changed over time for nursing home residents and staff?

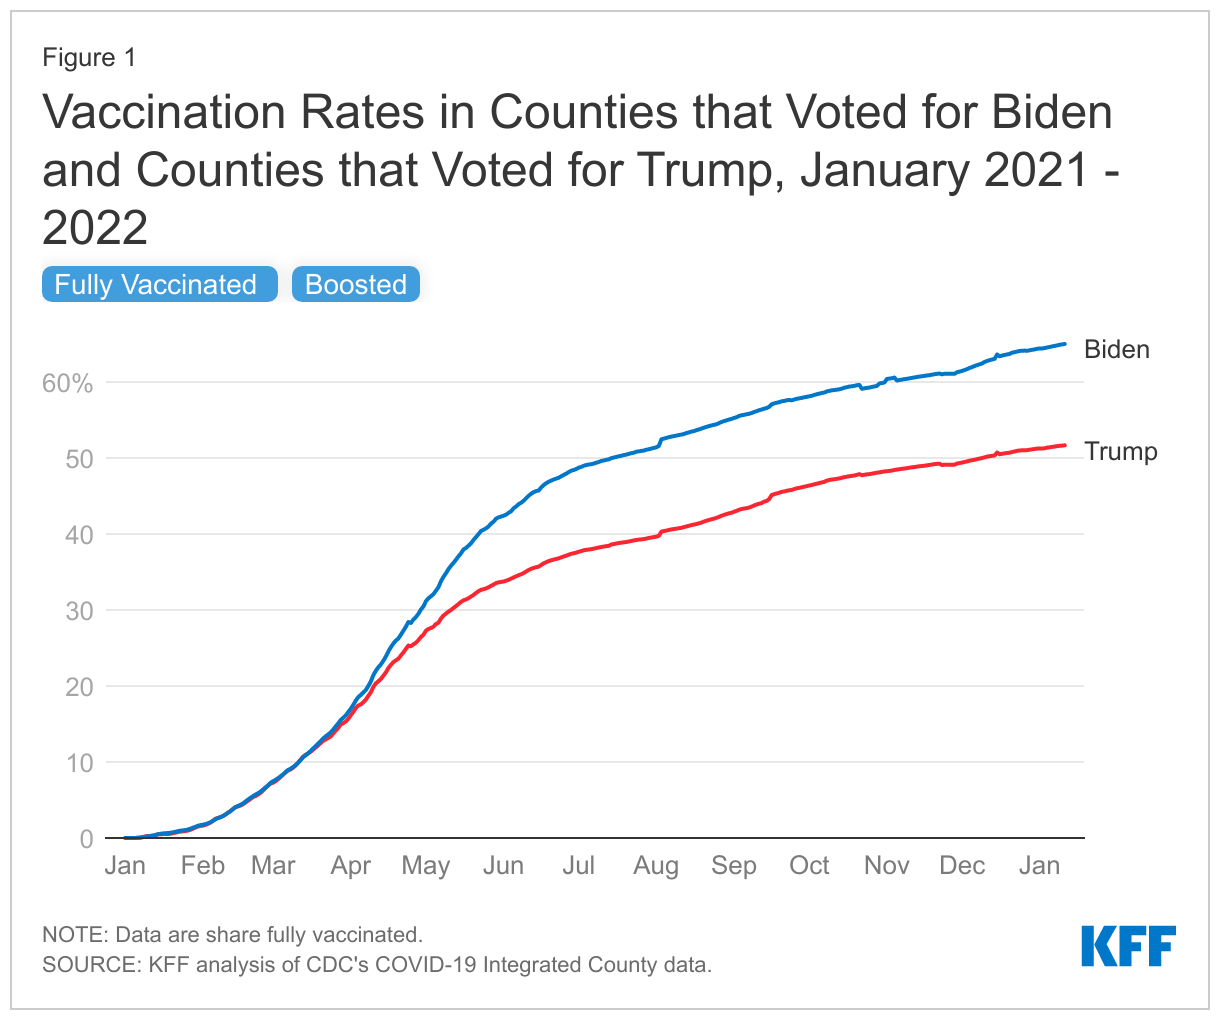
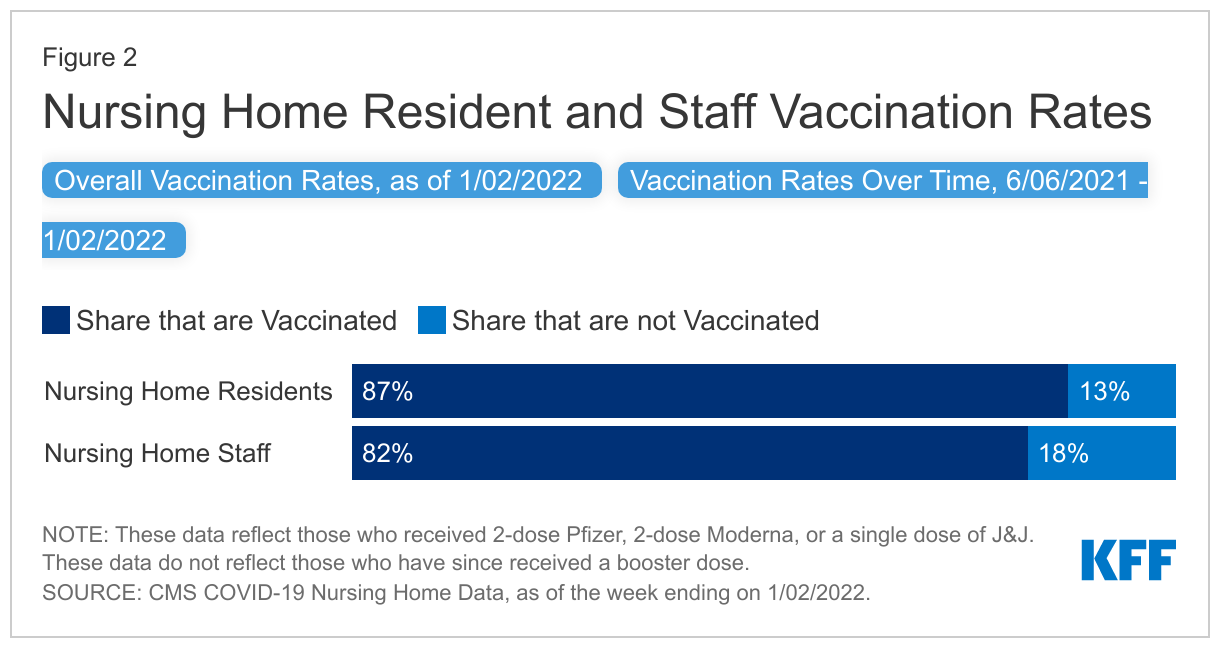
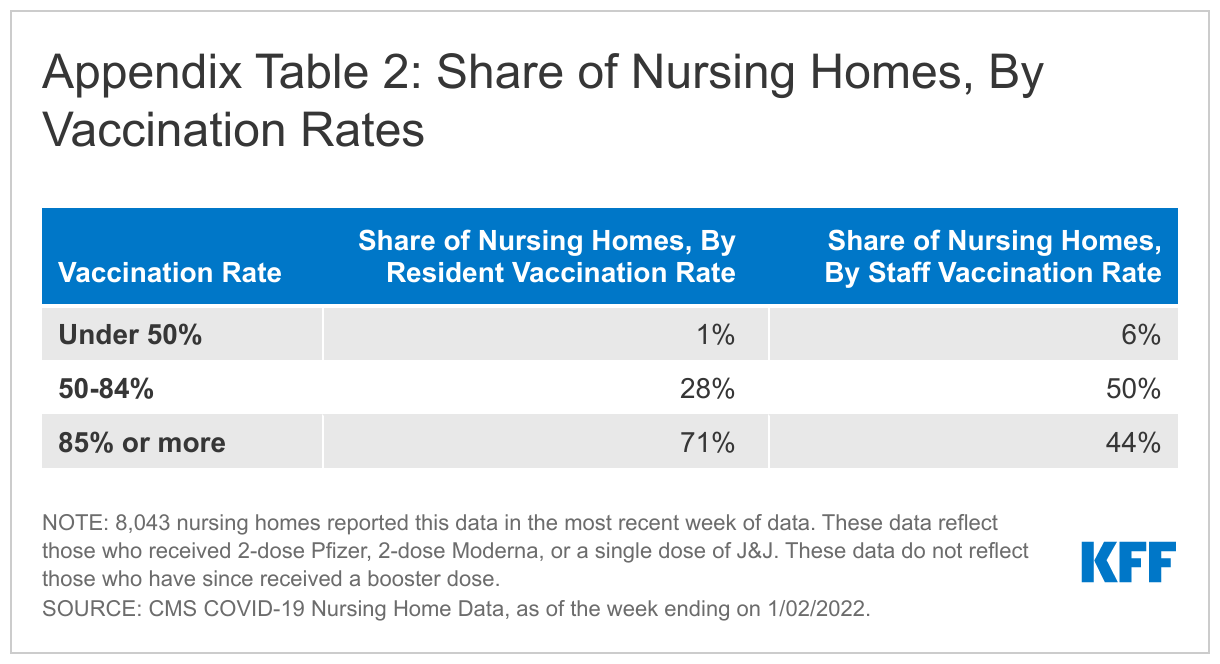
Staff vaccination rates remained five percentage points lower than resident vaccination rates as of the week ending January 2nd (87% vs. 82%), though staff vaccination rates increased by nearly 26 percentage points between June and early January 2022 (Figure 2). Residents and staff started receiving vaccinations in December 2020 through the Pharmacy Partnership for Long-Term Care. Resident uptake was initially higher than that of staff, leading to higher early vaccination rates. When nursing home vaccination data first became available in June 2021, a much larger share of residents (79%) than staff (56%) were vaccinated. A key reason staff vaccination may have increased since June 2021 is that the Biden administration announced a nursing home staff vaccine mandate in August 2021 as a condition for facilities to continue receiving Medicare and Medicaid funding2 . Lawsuits have been filed challenging the mandate, but Supreme Court has ruled that the mandate can take effect while the cases play out in the lower courts.  The increase in staff vaccination rates may also be partially attributed to unvaccinated staff leaving their positions. For the most recent period, a larger share of facilities reports very high (85%+) vaccination rates among residents (in 71% of facilities) than among staff (in 44% of facilities) (Appendix Table 2).

Nursing Home Resident and Staff Vaccination Rates

What do we know about the boosters for nursing home residents and staff?

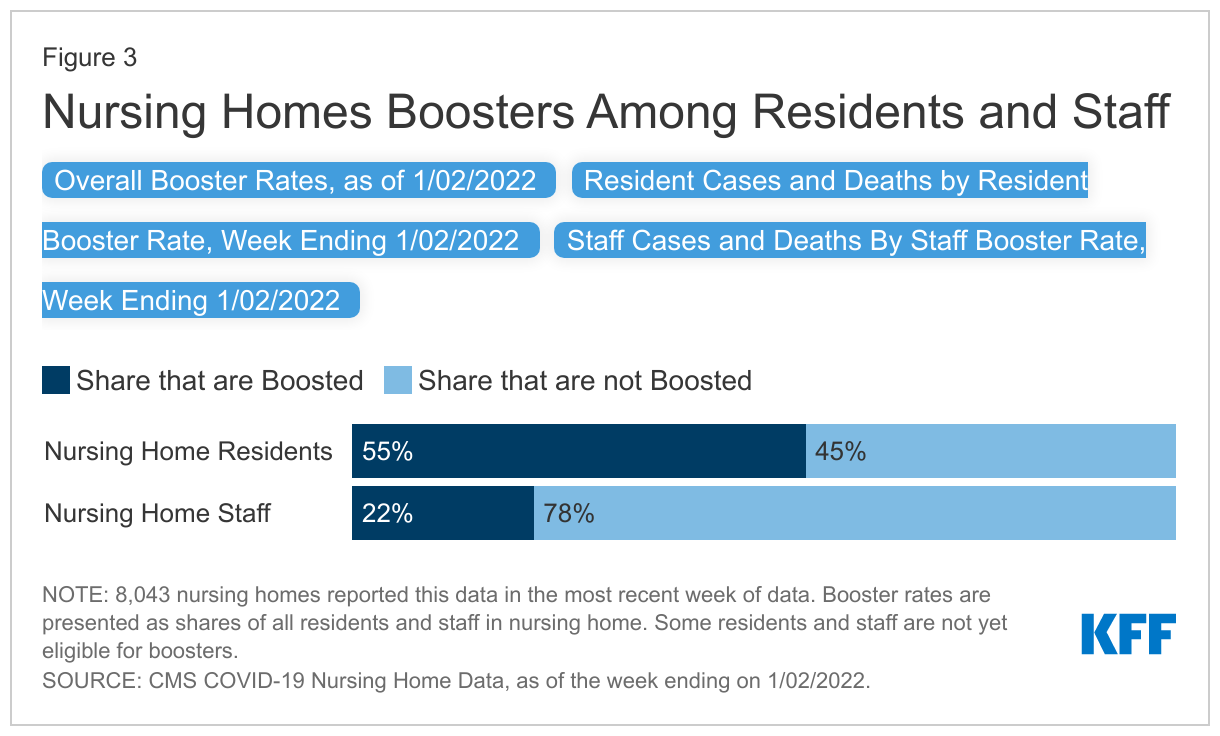
In the week ending January 2nd, about 54% of nursing homes (8,043) reported data on cases, deaths, and boosters. In this sample of nursing homes, about 55% of residents had received a booster compared to just 22% of staff (Figure 3). These values represent the share of all residents and staff who have received their booster, although some may not have been eligible for their booster by January 2nd. Individuals who received the Pfizer-BioNTech or Moderna vaccines become eligible for boosters five months after completing their primary vaccination series. Individuals who received Johnson & Johnson’s Janssen vaccine are eligible for boosters two months after receiving their shot. Since many residents received their vaccinations earlier than the staff, residents were likely eligible and received their booster earlier than staff. The share of residents and staff who are boosted will continue to increase as more residents and staff become eligible, though data on vaccinations suggests that staff booster rates may not reach levels of resident boosters regardless of eventual eligibility.

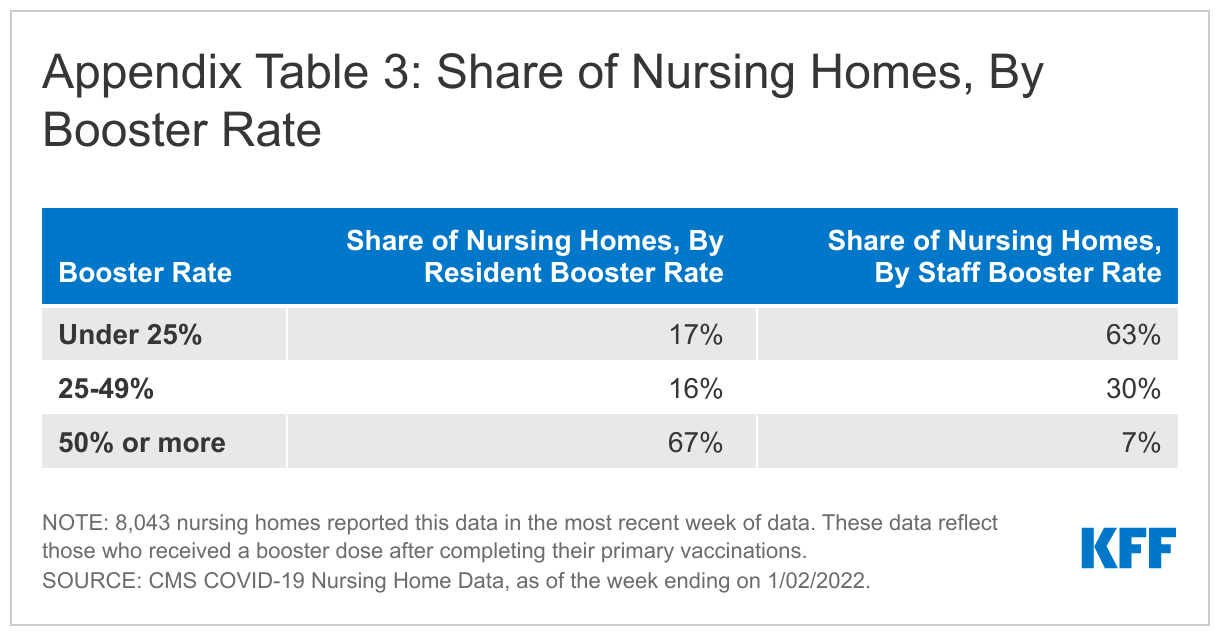
Among the nursing homes in the sample reporting data for the week ending January 2nd, a small share (7%) reported staff booster rates of 50% or higher, while over two thirds (67%) of these nursing homes reported resident booster rates of 50% or higher (Appendix Table 2). Previous research suggests a myriad of factors impact cases and deaths in nursing homes including, but not limited to, resident acuity, surrounding community spread, and facility size. Recent hospital data showing higher levels of severe illness and death among those who are unvaccinated suggests that vaccination and booster rates may be a key consideration as well. Our analysis found that nursing homes with low resident booster rates reported higher average resident cases and higher average resident deaths in the week of data analyzed. Similarly, facilities with low staff booster rates reported higher average staff cases (Figure 3). While vaccination and booster rates should be considered alongside other factors, they likely play a key role in protecting those who live and work in these congregate care settings.

Nursing Homes Boosters Among Residents and Staff

Looking Ahead

This data notes suggests that the Omicron variant has made its way into nursing homes, once again raising concerns about the impact on residents and staff. While there is growing evidence that Omicron is less likely to cause severe illness than previous variants, older adults and those with other health conditions are still at greater risk. Given the particularly high-risk nature of residents in these settings and the experience of residents and staff earlier in the pandemic, nursing homes may see a significant increase in deaths following this increase in cases. Numerous studies have shown that those that are fully vaccinated and boosted are highly protected against the new variant, a finding which increases the urgency to increase vaccination and booster rates among unvaccinated and unboosted residents and staff in nursing homes. Lawsuits have been filed challenging the vaccine mandate for health care staff, a key policy lever that policymakers and other stakeholders can use to increase vaccination rates among unvaccinated staff. However, the Supreme Court has ruled that the mandate can take effect while the cases play out in lower courts. As Omicron continues to break case and hospitalization records, increasing vaccination and booster rates will be an important protection against illness and death for nursing home residents and staff.

Appendix Tables

Appendix Table 1: COVID-19 Cases and Deaths
Appendix Table 2: Share of Nursing Homes, By Vaccination Rates
Appendix Table 3: Share of Nursing Homes, By Booster Rate

Methods

This analysis uses federal data on coronavirus cases and deaths in nursing homes, which includes weekly data as of mid-May 2020 through January 2nd, 2022. These data are updated regularly to reflect revised data from previous weeks, so future versions of this dataset reflecting the same time period may output different values. This analysis excludes suspected cases from the definition of nursing home cases among residents and staff. Data on U.S. cases and deaths are calculated based on the number of nationwide cases and deaths from the CDC minus nursing home cases and deaths; we make this adjustment to account for possible endogeneity (that is, cases or deaths in nursing homes contributing to the patterns in COVID-19 cases and deaths nationwide). Given the current underreporting of at-home rapid antigen and PCR tests, it is likely that cases in this analysis are undercounted. The federal data includes only data on federally certified nursing homes. This analysis therefore does not include data on other long-term care settings, such as assisted living facilities, residential care facilities, group homes, or intermediate care facilities.

Previous analysis used state-reported data on long-term care facility cases and deaths, which represented a more comprehensive set of facilities. Due to a drop-off in reporting regularity and lack of consistency in states overtime, this analysis uses federal data to be able to trend cases and deaths in nursing homes since June 2020.

  1. This statistic was calculated by adding the nearly 187,000 long-term care COVID-19 deaths identified from KFF data collection efforts that ended June 30th, 2021 with the approximately 8,700 COVID-19 deaths nursing homes have reported to CMS since June 30th, 2021. This death count is an undercount since CMS data does not account for deaths in non-nursing home settings and not all nursing homes report complete data. ↩︎
  2. The new rule applies to Medicare and Medicaid providers that are directly regulated by CMS and therefore does not reach all Medicaid providers, such as certain home and community-based services (HCBS) providers. The rule applies to nursing homes, hospitals, outpatient rehab facilities, federally qualified health centers, rural health centers, and home health agencies, among other provider types. ↩︎

Update on COVID-19 Vaccination of 5-11 Year Olds in the U.S.

Published: Jan 20, 2022

It’s been more than two months since the Centers for Disease Control and Prevention (CDC) recommended Pfizer’s COVID-19 vaccine for children, ages 5-11, in the United States. We previously assessed pediatric vaccination uptake, finding that, after initial high demand, it had already slowed significantly. We also found a wide range in vaccination rates by state. Since that time, Omicron has become the dominant variant in the U.S. and COVID-19 cases, hospitalizations, and deaths are rising again.

Here, we provide an update on the vaccination status of 5-11 year-olds, through January 18, 2022. It is based on analysis of national and state-level vaccination data obtained from the CDC’s Data Tracker (see methods below). Overall, we find that the number of first doses newly administered to 5-11 year-olds remains far below its early peak and although there was a slight uptick for a period in December, it has again declined. There also remains a large gap – of 52 percentage points – between the most vaccinated and least vaccinated states. Specific findings include:

  • Nationally, more than a quarter (28.1%) of 5-11 year-olds had received at least one COVID-19 vaccine dose as of January 18, 2022. This represents just over 8 million of the approximately 28 million children in this age group in the United States. Given the two dose Pfizer regimen, administered three weeks apart, and the need for a two-week period afterward to be considered to have completed the vaccine series, just 18.8% of children have reached this point.
  • The rate of vaccination among 5-11 year-olds reached its peak before Thanksgiving and then dropped steeply. Vaccination rates among 5-11 year-olds, as measured by first doses administered daily, rose sharply for the two-week period after the recommendation was first made on November 2, hitting its high point on November 14, at 264,000 (based on the 7-day rolling average). It then dropped steeply through the beginning of December. After a slight uptick over the next two weeks, it dropped again and has hovered between 50,000 and 75,000 new doses administered per day, based on the 7-day rolling average, since the holiday period (Figures 1 and 2).
  • Significant variation remains at the state level with a 52 percentage point difference between the top and bottom ranking states in the share of children with at least one dose. This difference is much larger than the span for adults (27 percentage points). The share of children having received at least one COVID-19 vaccine dose ranged from 63.1% in Vermont to just 11.2% in Mississippi (Table 1). The top ten states have vaccinated more than a third of 5-11 year-olds, with three states at more than 50%; the bottom ten states have vaccinated fewer than 20%. The spread between top and bottom ranking states for those fully vaccinated is 47 percentage points, and ranges from 52% in Vermont to 5.3% in Alabama.
  • Some regional differences persist. Five of the top ten states, by share of 5-11 year-olds with at least one vaccine dose, are in New England (Vermont, Rhode Island, Massachusetts, Maine, and Connecticut). Eight of the ten states with the lowest vaccine coverage among 5-11 year-olds are in the South (South Carolina, Georgia, West Virginia, Oklahoma, Tennessee, Louisiana, Alabama, and Mississippi). Similar patterns are also seen among the share fully vaccinated.
Cumulative Share of Children Ages 5-11 Who Have Received At Least One Dose of a COVID-19 Vaccine
New Daily Doses Administered to 5-11 Year Olds, Number and 7-Day Rolling Average

More than two months following authorization of the COVID-19 vaccine for children ages 5-11, the vaccination rate for this group is quite low, and there is significant variation across the country, with a more than 50 percentage point gap between the highest and lowest ranking states among those having received at least one dose. This likely reflects a complicated interplay between the efforts made by state and county governments, schools, and pediatricians to vaccinate children, and the makeup of the citizenry itself and its interest in vaccination. With the highly transmissible Omicron variant surging across the U.S., the vaccine, which has proven very safe for children, offers the most effective protection against severe disease and hospitalization. In addition, while vaccination during the Omicron surge may not prevent all school disruptions, it does help to mitigate them. Identifying opportunities to reach parents and caregivers, many of whom have been reluctant to get their younger children vaccinated, with information about vaccination and providing multiple, accessible, avenues for pediatric vaccination, will continue to be important.

Table 1: Number and Share of Children, Ages 5-11, Who Have Received At Least One Dose of a COVID-19 Vaccine or Are Fully Vaccinated Against COVID-19

Methods

National data were used to calculate daily changes in the number of 5-11 year-olds vaccinated as well as the seven-day rolling average. To calculate the number of 5-11 year-olds who had received at least one COVID-19 vaccine dose or who were fully vaccinated by state, we calculated the difference between the number of those aged 5+ with at least one dose (or fully vaccinated) and the number of those aged 12+ with one dose (or fully vaccinated). Population estimates for 5-11 year-olds by state were obtained from the American Community Survey. We included data from federal entities, territories and associated jurisdictions in our national totals, but only the 50 states and DC in our state analysis. Data from Idaho were not available for this age group.

Surprise Medical Bills are Ending, But Controversy Continues

Author: Larry Levitt
Published: Jan 20, 2022

In this column for the JAMA Health Forum, Larry Levitt examines how the No Surprises Act that prohibits unexpected out-of-network charges for patients could lead to lower payment rates and revenues for some doctors and other care providers.

News Release

Biden Counties Continue to Have Higher Vaccination Rates Compared to Trump Counties, As the Omicron Variant Surges Across the U.S.

Published: Jan 19, 2022

An updated KFF analysis finds that counties that voted for Biden continue to have higher COVID-19 vaccination rates compared to counties that voted for Trump. As of January 11, 65% of those in Biden counties were fully vaccinated versus 52% of those in Trump counties. Even with the Omicron variant spreading across the country, the gap between Biden and Trump counties has widened from 9 percentage points in June to 13.2 percentage points currently.

There is currently no gap between Biden and Trump counties in the share of those who are fully vaccinated and who have gotten booster doses. However, because of the underlying gap in vaccination rates, there is also a gap in the share who are boosted across the two groups, and that gap has been widening over time.

Vaccines and boosters have shown to be effective against COVID-19, including against the Delta and Omicron variants. With rising hospitalization rates, those unvaccinated remain at greater risk for more severe COVID-19.

The Red/Blue Divide in COVID-19 Vaccination Rates Continues: An Update

Published: Jan 19, 2022

Not only has COVID-19 vaccination divided along partisan lines, our polling has found that political partisanship is a stronger national predictor of vaccination than other demographic factors. Partisanship in vaccination rates has borne out at the county level. In our tracking of COVID-19 vaccination rates in counties that voted for Trump compared to counties that voted for Biden, we found a widening gap between April and September of last year.

This update examines vaccination rates since the vaccination effort began, and through January 11, 2022. It also looks at booster dose rates since December 15 (when such data first became available at the county level). It is based on analysis of data on the share of the population fully vaccinated and share of the fully vaccinated who have received a booster dose by county from the Centers for Disease Control and Prevention’s (CDC) COVID-19 Integrated County View and data on the 2020 Presidential election results by county from here (for more detailed methods, see: https://www.kff.org/coronavirus-covid-19/issue-brief/vaccination-is-local-covid-19-vaccination-rates-vary-by-county-and-key-characteristics/). We find that:

  • Biden counties continue to have higher COVID-19 vaccination rates than Trump counties. Although overall vaccination rates have risen over time, people living in Biden counties continue to be more likely to be fully vaccinated than those in Trump counties. As of January 11, 65% of those in Biden counties were fully vaccinated compared to 52% of those in Trump counties.
  • The gap between Biden and Trump counties has widened over time. The current gap of 13.2 percentage points between the share fully vaccinated in Biden counties versus Trump counties is the highest to date. The difference was about 12 percentage points in the last few months of 2021 and less than 9 percentage points last June.
  • There is no gap between Biden and Trump counties in the share of the fully vaccinated with booster doses. At the same time, the share of fully vaccinated individuals who have received a booster dose is the same (37%) in each group. Furthermore, the gap in booster rates between Biden and Trump counties has been very small since December 15, with the largest gap being a 1 percentage point difference. This could reflect a greater inclination on the part of those already vaccinated to get a booster shot, especially given the spread of the Omicron variant, as suggested by recent polling. The same poll found that the unvaccinated remained unmoved.
  • Still, given the underlying gap in vaccination rates, there is also a gap in the share who are boosted across the two groups, and that gap has been widening over time. On December 15, the share of those in Biden counties with boosters was 16% compared to 14% in Trump counties, a 2 percentage point difference. By January 11, it had widened to a 6 point difference, with 25% of those in Biden counties with boosters compared to 19% of those in Trump counties.
Vaccination Rates in Counties that Voted for Biden and Counties that Voted for Trump, January 2021 - 2022
The Gap in Vaccination Rates Between Counties that Voted for Biden and Counties that Voted for Trump, January 2021 – 2022

Vaccinations, and boosters in particular, have been shown to be effective in providing protection against COVID-19, including the Omicron variant. Lower levels of vaccination leave communities more vulnerable to severe illness, especially as cases are surging. In several states, data have demonstrated that hospitalizations and deaths are higher among unvaccinated individuals compared to those who are vaccinated, both during the earlier Delta wave and during the current Omicron surge. The ongoing disparity in vaccination rates across Biden and Trump counties continues to put some communities at greater risk of more severe COVID-19 disease.

News Release

New Season of “American Diagnosis” Podcast to Explore the Resilience of Indigenous Peoples in the Face of Adversity, Social Inequity, and Health Injustice

The Podcast, Now in Season 4, is Becoming Part of KFF’s Kaiser Health News

Published: Jan 18, 2022

The new season of the “American Diagnosis” podcast will explore the impact of hundreds of years of adversity on the health of Indigenous peoples in America, examining the resilience of the Navajo Nation during the covid-19 pandemic as an entry point into this history.

Early in the coronavirus pandemic, the Navajo Nation made headlines for having the nation’s highest covid infection rates. And yet the Navajo people, also known as the Diné, rebounded spectacularly. They rallied around their elders. They banded together to make sure their communities had the food, water, and protective equipment they needed. And they’ve led the way in getting their people vaccinated.

In “Rezilience: Surviving Manifest Destiny,” a 12-episode series premiering Tuesday, Jan. 18, host Dr. Céline Gounder investigates how covid is but the latest chapter in a long history of Indigenous resilience to adversity—on the “rez” (reservation) and beyond. The series will feature conversations with Indigenous leaders, scholars, health workers, activists, historians, and poets.

With this season, its fourth, “American Diagnosis” is becoming part of KFF’s Kaiser Health News (KHN). New episodes will be available every two weeks here. Topics will include (among others):

  • The largest accidental release of radioactive material in U.S. history and why you’ve likely never heard of it
  • The push to restore Indigenous food sovereignty
  • How greater tribal sovereignty could help protect Native women from gender-based violence

The extraordinary lengths some go to provide clean drinking water for their community

KHN also created and produces the popular “What the Health?” podcast, in which host Julie Rovner leads a panel of top reporters, all of them women from leading media outlets, in a weekly discussion about health policy news in Washington, D.C. KHN also co-produces the podcast “Where It Hurts” with St. Louis Public Radio, which examines health system failures in overlooked parts of America, and “An Arm and a Leg,” a podcast created and hosted by former Marketplace reporter Dan Weissmann that focuses on the cost of health care. In addition, KHN has collaborated with This American Life as well as Reveal to produce episodes of these popular podcasts. You can check out these other podcasts produced by KHN here.

About KFF and KHN

KHN (Kaiser Health News) is a national newsroom that produces in-depth journalism about health issues. Together with Policy Analysis and Polling, KHN is one of the three major operating programs at KFF (Kaiser Family Foundation). KFF is an endowed nonprofit organization providing information on health issues to the nation.

The Helms Amendment and Abortion Laws in Countries Receiving U.S. Global Health Assistance

Published: Jan 18, 2022

Key Facts

  • The Helms Amendment, signed into law almost fifty years ago, as an amendment to the Foreign Assistance Act of 1961, prohibits the use of foreign assistance to pay for the performance of abortion as a method of family planning or to motivate or coerce any person to practice abortion.
  • In practice, the Helms Amendment has also been used to prohibit the use of federal funding for all abortions even in the circumstances of rape, incest, or risk to the life of the pregnant person, exceptions that have been allowed in other areas of U.S. international abortion law and policy.
  • There has been growing debate about the Helms Amendment, with some advocates and legislators supporting efforts to clarify the application of the Helms Amendment to allow for exceptions and, more recently, to repeal it. To better understand the implications of the Helms Amendment for abortion access globally and to inform ongoing discussions, we examined abortion laws in countries that received U.S. foreign assistance, looking specifically at funding for family planning and reproductive health (FP/RH), maternal and child health (MCH), and PEPFAR.
  • We find that of the 56 countries receiving such U.S. global health assistance, most (86%, or 48 countries) allow for abortion in at least one circumstance.
  • These 48 countries account for 95% ($4.53 billion) of U.S. global health assistance for FP/RH, MCH, and PEPFAR. Most are in Africa (30 countries). PEPFAR funding reaches the most countries (36), followed by MCH (35) and FP/RH (29).
  • Of the 48 countries, 14 (or 25% of those receiving U.S. support) allow abortion in only one or more exceptional circumstances, while the remainder (34 countries) allow for abortion beyond these exceptions.
  • Given that the U.S. is often the largest funder of health efforts in low- and middle-income countries, these findings suggest that the outcome of debates about the Helms Amendment stands to significantly affect access to legal abortion in a large number of countries, primarily those in Africa. Repeal of the Helms Amendment would expand the ability of U.S. global health assistance to support legal abortion in many countries, while clarifying Helms to allow such support in exceptional circumstances would also expand the ability of U.S. global health assistance to support legal abortion but in more limited circumstances.

Introduction

The Helms Amendment, signed into law almost fifty years ago, as an amendment to the Foreign Assistance Act of 1961, prohibits the use of foreign assistance to pay for the performance of abortion as a method of family planning or to motivate or coerce any person to practice abortion. In practice, it has also been used to prohibit the use of federal funding for all abortions even in the circumstances of rape, incest, or risk to the life of the pregnant person, exceptions that have been allowed in other areas of U.S. international abortion law and policy, such as the Mexico City Policy when it has been in place. There has been growing debate about the Helms Amendment, with some advocates and legislators supporting efforts to clarify the application of the Helms Amendment to allow for exceptions and, more recently, to repeal it. Last year, the U.S. House of Representatives passed the FY 2022 State and Foreign Operations (SFOPS) appropriations bill without language reiterating the Helms Amendment,1  and legislation has been introduced that would permanently repeal the Helms Amendment by striking its language from the Foreign Assistance Act of 1961 (see the KFF global health legislation tracker).2 

Still, the prospects of repeal of the Helms Amendment are challenging. While the Biden administration has called for repeal of the Hyde Amendment (the domestic law restricting federal funding for abortion),3  its stance on Helms is unclear. It has not taken a public position on repeal, and its first budget request to Congress included the Helms language. Moreover, both chambers of Congress would have to agree to excluding Helms Amendment language from annual appropriations legislation as well as from the permanent statute, the Foreign Assistance Act of 1961. Even if repealed, it would not necessarily lead to more funding for abortion, especially if U.S. funding for global health remains level.

To better understand the implications of the Helms Amendment for access to abortion services globally and to inform ongoing discussions, we examined abortion laws in countries that received U.S. foreign assistance. We sought to identify the number of countries in which abortion is legal but U.S. funding is not permitted, even in the exceptional circumstances noted above.4  While the Helms Amendment applies to all U.S. foreign assistance, we focused our analysis on assistance for family planning and reproductive health (FP/RH), maternal and child health (MCH), and HIV, through PEPFAR, since these are the technical areas of USAID’s health work to which Helms and other FP/RH restrictions “most often apply,” according to USAID.5   We placed countries receiving bilateral U.S. global health assistance in FY 2019 (the most recent publicly-available complete data) into three categories according to their abortion laws:

  • abortion not legal in any circumstance;
  • abortion legal in one or more of the following circumstances: where the pregnancy poses a risk to a pregnant person’s life, is the result of rape or is the result of incest; and
  • abortion legal in any circumstance beyond the preceding ones (e.g., to preserve the physical or mental health of a pregnant person or for social or economic reasons).

Findings

In FY 2019, the U.S. provided bilateral global health assistance for FP/RH, MCH, and/or HIV (PEPFAR) to 56 countries. Together, funding across these three areas totaled $4.77 billion. Funding for PEPFAR and MCH was directed to the greatest number of countries (40 and 39, respectively), followed by FP/RH (35). More than half (33) of the 56 countries reached were in Africa, followed by East Asia and the Pacific (8), South and Central Asia (7), Latin American and the Caribbean (4), the Near East (3), and Europe and Eurasia (1).

Abortion is legal in at least one circumstance in almost all – 48 of 56 (or 86%) – of the countries receiving U.S. support. These 48 countries accounted for 95% ($4.53 billion) of U.S. global health assistance for FP/RH, MCH, and PEPFAR. Most were in Africa (30), and PEPFAR reached the largest number (36), followed by MCH (35) and FP/RH (29). See Figure 1 and Tables 1 and 2.

Figure 1: Abortion Laws in Countries Receiving Bilateral U.S. Global Health Assistance for FP/RH, MCH, and/or HIV, FY 2019

In 14 countries (25% of countries receiving U.S. support) abortion is legal only in at least one exceptional circumstance (where the pregnancy poses a risk to the life of a pregnant person, is the result of rape, or is the result of incest). These countries accounted for 34% ($1.63 billion) of U.S. global health assistance for FP/RH, MCH, and PEPFAR. Half of these countries (7) were in Africa, and the other half were in East Asia and the Pacific (3), South and Central Asia (2), Latin American and the Caribbean (1), and the Near East (1). The MCH program reached the largest number (13), followed by FP/RH (10) and PEPFAR (9).

The remaining 34 countries (61% of countries receiving U.S. support) allow for legal abortion beyond one or more of these exceptions. This includes circumstances where abortion is allowed to preserve the physical or mental health of a pregnant person, for social or economic reasons, or because of fetal impairment. These countries accounted for 61% ($2.9 billion) of U.S. global health assistance for FP/RH, MCH, and PEPFAR. Most of these countries (23) were in Africa, and the remainder were in South and Central Asia (5), East Asia and the Pacific (3), Europe and Eurasia (1), Latin America and the Caribbean (1), and the Near East (1). PEPFAR reached the largest number (27), followed by MCH (22) and FP/RH (19).

There are only 8 countries (14% of countries receiving U.S. support) where abortion is not legal under any circumstance. These accounted for 5% ($238 million) of U.S. global health assistance for FP/RH, MCH, and PEPFAR. Several were in Africa (3), while the remainder were in East Asia and the Pacific (2), Latin America and the Caribbean (2), and the Near East (1). The FP/RH program reached the largest number (6), followed by MCH and PEPFAR (4 each).

Table 1: Number of Countries Receiving Selected FY 2019 Bilateral U.S. Global Health Assistance,by Program Area and Abortion Law Status
Program Area# of Countries Reached# of Countries Where Abortion Is Legal In Additional Circumstances Beyond Poses Risk to Life or Due to Rape or Incest# of Countries Where Abortion Is Legal Only One or More of These Circumstances: Poses Risk to Life or Due to Rape or Incest# of Countries Where Abortion Is Not Legal
FP/RH3519106
MCH 3922134
HIV (PEPFAR) 402794
NOTES:  FP/RH means Family Planning & Reproductive Health. MCH means Maternal & Child Health. PEPFAR is the U.S. President’s Emergency Plan for AIDS Relief. Abortion legal in only one or more circumstances refers to circumstances where pregnancy poses a risk to the life of the pregnant person or results from rape or incest. Additional circumstances allowed beyond those might include, for example, to preserve the physical or mental health of a pregnant person or for social or economic reasons.

SOURCES: KFF analysis of data from the U.S. Foreign Assistance Dashboard (foreignassistance.gov/), accessed Jan. 2021, and data from World Health Organization (WHO), Global abortion policies database, 2018, https://abortion-policies.srhr.org/, accessed Dec. 13, 2019, and Center for Reproductive Rights, The World’s Abortion Laws Database, http://worldabortionlaws.com/, accessed Aug. 3, 2021.

Discussion

As members of Congress, advocates, and others continue to debate the future of the Helms Amendment, this analysis finds that the outcome of these discussions stands to significantly affect access to legal abortion in a large number of countries, primarily those in Africa. Indeed, since most countries receiving U.S. global health assistance (86%) allow for abortion in at least one circumstance, including 25% that allow abortion in only one or more exceptional circumstances, repeal of the Helms Amendment would expand the ability of U.S. global health assistance to support legal abortion in many countries; clarifying Helms to allow such support in exceptional circumstances would also expand the ability of U.S. global health assistance to support legal abortion but in more limited circumstances, such as when a pregnancy poses a risk to a pregnant person’s life. Given that the U.S. is the largest global health donor in most countries, whether or not U.S. lawmakers ultimately decide to repeal Helms or modify it to allow for exceptions will likely have an outsized effect on access to legal abortion in low- and middle-income countries.

Table 2: Countries Receiving Selected Bilateral U.S. Global Health Assistance,by Program Presence and Abortion Law Status, with Total FY 2019 Funding
RegionCountryUSG Program PresenceTotal FY 2019 Funding Across These Programs*(U.S. $)
FP/RHMCH HIV (PEPFAR) # of USG Programs
TOTAL NUMBER OF COUNTRIES56353940$4,770,715,000
Abortion Legal in Additional Circumstances Beyond Poses Risk to Life or Due to Rape or Incest (34 Countries)
AfricaAngolaXX26,932,000
AfricaBeninXX28,000,000
AfricaBotswanaX138,667,000
AfricaBurkina FasoXXX312,023,000
AfricaBurundiXXX325,310,000
East Asia/PacificCambodiaXXX38,005,000
AfricaCameroonX1139,728,000
AfricaCentral African RepublicX11,000,000
Latin America/CaribbeanColombiaX13,000,000
AfricaDemocratic Republic of the CongoXXX3132,679,000
AfricaEswatiniX169,028,000
AfricaEthiopiaXXX3145,119,000
AfricaGhanaXXX330,076,000
AfricaGuineaXX28,000,000
South/Central AsiaIndiaXXX323,491,000
East Asia/PacificIndonesiaXX219,596,000
Near EastJordanX121,000,000
AfricaKenyaXXX3276,972,000
South/Central AsiaKyrgyzstanX16,279,000
AfricaLesothoX184,617,000
AfricaLiberiaXXX319,500,000
AfricaMozambiqueXXX3314,904,000
AfricaNamibiaX169,135,000
South/Central AsiaNepalXXX340,427,000
AfricaNigerXX216,119,000
South/Central AsiaPakistanX13,000,000
AfricaRwandaXXX380,861,000
AfricaSouth AfricaX1718,285,000
South/Central AsiaTajikistanXX27,731,000
AfricaTogoX11,632,000
Europe/EurasiaUkraineX127,200,000
East Asia/PacificVietnamX127,084,000
AfricaZambiaXXX3371,446,000
AfricaZimbabweXXX3147,094,000
Abortion Legal in Only One or More of These Circumstances: Poses Risk to Life or Due to Rape or Incest (14 Countries)
South/Central AsiaAfghanistanXX231,468,000
South/Central AsiaBangladeshXX248,123,000
East Asia/PacificBurmaXX218,450,000
AfricaCôte d’IvoireXXX355,629,000
AfricaMalawiXXX3170,935,000
AfricaMaliXXX336,300,000
AfricaNigeriaXXX3486,417,000
East Asia/PacificPapua New GuineaX14,901,000
AfricaSouth SudanXXX359,536,000
AfricaTanzaniaXXX3325,338,000
East Asia/PacificTimor-LesteXX22,000,000
AfricaUgandaXXX3381,320,000
Latin America/CaribbeanVenezuelaX15,000,000
Near EastYemenX13,500,000
Abortion Not Legal (8 Countries)
Latin America/CaribbeanDominican RepublicX126,482,000
Near EastEgyptX110,000,000
Latin America/CaribbeanHaitiXXX3125,011,000
East Asia/PacificLaosX1780,000
AfricaMadagascarXX228,200,000
East Asia/PacificPhilippinesX113,000,000
AfricaSenegalXXX330,385,000
AfricaSierra LeoneXX24,000,000
NOTES: FP/RH means Family Planning & Reproductive Health. MCH means Maternal & Child Health. PEPFAR is the U.S. President’s Emergency Plan for AIDS Relief. Abortion legal in only one or more circumstances refers to circumstances where pregnancy poses a risk to the life of the pregnant person or results from rape or incest. Additional circumstances allowed beyond those might include, for example, to preserve the physical or mental health of a pregnant person or for social or economic reasons. X indicates country receiving bilateral assistance through USAID and the Department of State in FY 2019.  * indicates total does not include funding for regional or “worldwide” program efforts that may reach additional countries not reflected in this table. “–” indicates country-level funding is not available on ForeignAssistance.gov.

SOURCES: KFF analysis of data from the U.S. Foreign Assistance Dashboard (foreignassistance.gov/), accessed Jan. 2021, and data from World Health Organization (WHO), Global abortion policies database, 2018, https://abortion-policies.srhr.org/, accessed Dec. 13, 2019, and Center for Reproductive Rights, The World’s Abortion Laws Database, http://worldabortionlaws.com/, accessed Aug. 3, 2021.

  1. See: U.S. Congress, Department of State, Foreign Operations, and Related Programs Appropriations Act, 2022 (H.R. 4373), 117th Congress. ↩︎
  2. The Abortion is Healthcare Everywhere Act would amend the Foreign Assistance Act to remove this language from permanent law. On the other hand, the American Values Act would restate the Helms Amendment as included in the amended Foreign Assistance Act of 1961. See: U.S. Congress, Abortion is Health Care Everywhere Act of 2021 (H.R. 1670), 117th Congress; U.S. Congress, S.239 – American Values Act (S. 239), 117th Congress. ↩︎
  3. President Biden supports repeal of the Hyde amendment and did not include it in its budget request to Congress. See: Colby Itkowitz, “Biden budget plan removes decades-old ban on federal funds for abortions,” Washington Post, May 28, 2021, https://www.washingtonpost.com/politics/biden-budget-abortion-hyde-amendment/2021/05/28/7b248838-bfde-11eb-b26e-53663e6be6ff_story.html. ↩︎
  4. In all instances, the U.S. continues to provide U.S. funding to support post-abortion care (PAC). See: USAID, “Memo from Duff Gillespie on Post-Abortion Care,” Sept. 10, 2001, https://www.usaid.gov/sites/default/files/documents/1864/duff_memo.pdf. ↩︎
  5. USAID, Guidance on the Definition and Use of the Global Health Programs Account: A Mandatory Reference for ADS Chapter 201, partial revision as of Dec. 12, 2014, https://www.usaid.gov/ads/policy/200/201mau. ↩︎

Medicaid: What to Watch in 2022

Authors: Robin Rudowitz, Jennifer Tolbert, MaryBeth Musumeci, and Elizabeth Hinton
Published: Jan 18, 2022

As 2022 kicks off, a number of issues are at play that could affect coverage and financing under Medicaid, the primary program providing comprehensive health and long-term care coverage to low-income Americans.  New COVID variants are surging and the fate of the Build Back Better Act (BBBA), a reconciliation bill that includes significant changes to health coverage and Medicaid, is hanging in the balance.  In addition, Governors are poised to release proposed budgets amid continued uncertainty about the health and economic trajectory of the pandemic while the Biden Administration continues to use its authority to address the pandemic and to further strategic goals to expand coverage and access and to improve equity.  Within this context, this issue brief examines key issues to watch in Medicaid in 2022.

Medicaid Coverage and Enrollment

Enrollment and the pandemic.  Since the start of the coronavirus pandemic, enrollment in Medicaid and the Children’s Health Insurance Program (CHIP) grew to 83.2 million in June 2021, an increase of 12.0 million (16.8%) from February 2020. Enrollment growth reflects downturns in the economy due to the pandemic and provisions in the Families First Coronavirus Response Act (FFCRA) that require states to ensure continuous coverage for current Medicaid enrollees to access a temporary increase in the Medicaid match rate during the Public Health Emergency (PHE) period, recently extended to April .  Continuous enrollment has helped to preserve coverage and halted Medicaid churn, however, when these requirements end, states will begin processing redeterminations and renewals and millions of people could lose coverage if they are no longer eligible or face administrative barriers during the process despite remaining eligible. The Centers for Medicare and Medicaid Services (CMS) has released guidance and strategies for states to help maintain coverage of eligible individuals after the end of continuous enrollment requirements.  The BBBA also includes provisions that would phase-out the continuous enrollment requirement beginning April 1, 2022 with rules about disenrolling people tied to a phased down enhanced match rate.  Within the parameters set by the Administration, or BBBA if enacted, states will largely be responsible for managing the unwinding of the continuous enrollment requirement, which could lead to variation in practices and in how many people are able to maintain coverage.

State decisions around Medicaid coverage.  Beyond the pandemic and continuous enrollment requirements, the American Rescue Plan Act (ARPA) included new coverage options for states.  ARPA provides a two-year fiscal incentive to encourage states to newly adopt the Medicaid expansion.  Over  2 million individuals living in the 12 states that have not adopted the Affordable Care Act’s (ACA) Medicaid expansion fall into the coverage gap because they do not qualify for Medicaid and have incomes below poverty, making them ineligible for premium subsidies in the ACA Marketplace. A KFF analysis shows that all non-expansion states would see a net fiscal benefit from the ARPA incentive for two years if they adopt the expansion.  The ARPA federal incentive reignited discussion around Medicaid expansion in a few non-expansion states during the last state legislative session, but no state newly voted to adopt the expansion. South Dakota will have a Medicaid expansion constitutional amendment on the November 2022 ballot.  Six states have adopted the expansion by ballot initiative (Idaho, Maine, Missouri, Nebraska, Oklahoma, and Utah). ARPA also includes an option to allow states to extend postpartum coverage from 60 days to 12 months.  Under current law, after the 60 days of postpartum coverage, individuals in states that have adopted the Medicaid expansion may continue to be eligible for Medicaid, but in non-expansion states many may become uninsured because Medicaid eligibility levels for parents are much lower than for pregnant people. The new option starts in April 2022 and as of last year, more than half of the states had taken steps to extend postpartum coverage.

BBBA and Medicaid coverage provisions. The version of the BBBA that passed the House would create a temporary pathway to coverage for people in the coverage gap by allowing them to purchase subsidized coverage (with no premiums and minimal cost sharing) in the ACA Marketplace starting in 2022 through 2025. To discourage states that have adopted the ACA Medicaid expansion from dropping that coverage, the BBBA would also increase the federal match rate for the expansion population in these states from 90% to 93% in 2023 through 2025. The CBO estimates that provisions to address the coverage gap would result in 1.7 million fewer uninsured people with a net federal cost of $57 billion over the next decade. In addition, the BBBA would require states to provide 12 months continuous coverage for postpartum people and children, which could help reduce churn among these populations.  The BBBA would also partially lift the inmate exclusion (current policy that prohibits Medicaid from covering services provided during incarceration, except for inpatient services) by allowing federal Medicaid money to be used to pay for Medicaid-covered services 30 days prior to release for people who are incarcerated.

Administrative actions to maintain and expand coverage.  In January 2021, the Biden Administration issued an Executive Order that called for efforts to “protect and strengthen Medicaid” and directed a review of waivers that may reduce coverage or undermine Medicaid.  As part of that effort, the Administration issued final withdrawals of waivers, promoted under the Trump Administration, that conditioned Medicaid eligibility on work requirements. More recently, the Biden Administration took steps to withdraw or phase out waivers that included premiums in Medicaid. The Administration also approved some waivers to expand postpartum coverage and, in November 2021, issued a strategic vision for Medicaid and CHIP that includes expanding coverage and access as a key priority.

The Administration has also issued an Executive Order focused on streamlining eligibility and enrollment processes and increased efforts to reach uninsured individuals who are eligible for Medicaid or Marketplace coverage. In 2020, seven million uninsured people were eligible for Medicaid but not enrolled. Most of these individuals were adults and nearly two-thirds were people of color. For the 2022 Marketplace open enrollment period, the Biden Administration launched an expansive advertising and outreach campaign to educate consumers on the availability of both Marketplace and Medicaid coverage. It also increased funding for Navigators in the federal Marketplace seven-fold from $10 million in 2020 to $80 million in 2021. The enhanced Navigator funding will mean more staff to assist both Marketplace and Medicaid applicants.

What to Watch:

  • What will happen to Medicaid enrollment when the continuous enrollment requirement ends? Will many people lose Medicaid coverage due to administrative barriers despite remaining eligible? Will people no longer eligible for Medicaid successfully transition to subsidized Marketplace coverage?
  • If the BBBA passes, how will that affect Medicaid coverage and coverage options for those who are uninsured?
  • If the BBBA is not enacted, will states use existing options and authority to expand Medicaid coverage?

Institutional and Home and Community Based Long-Term Care

Staff and residents at long-term care facilities have been disproportionately affected by the pandemic.  In the first year of the pandemic, long-term care facilities accounted for 31% of all COVID-19 deaths in the US as of June 30, 2021. KFF analysis found that, following vaccine rollout in winter 2020-2021, weekly cases and deaths in long-term care facilities (including nursing homes, assisted living facilities, ICF/IIDs, and some congregate community-based settings) dropped, reaching an all-time low in June 2021, prior to new surges due to the Delta and most recently omicron variants. The pandemic has also affected the long-term care workforce.  Unlike past recessions, the health sector saw a big drop in employment in early 2020, similar to other sectors as the COVID-19 pandemic shut down much of the nation’s economy and remains below expected employment levels through November 2021.  Data show that the number of workers in nursing care and elder care facilities has continued to decline even after other health settings experienced a rebound. As of November, nursing care facilities and elder care facilities employed 15% and 11.1% fewer workers than they did in February 2020.  The health and long-term care workforce could continue to be strained as some workers are vaccine hesitant and the new vaccine mandate for health care workers has been challenged in the federal courts. The Supreme Court recently allowed the rule to take effect  while lawsuits proceed in 24 Republican-led states challenging it.

The COVID-19 pandemic brought new focus to the long-standing unmet need for home and community-based services (HCBS) among seniors and people with disabilities and direct care workforce shortages. The Medicaid HCBS provider infrastructure declined during the pandemic, with two-thirds of states responding to a KFF survey reporting a permanent closure of at least one provider. Additionally, important data gaps remain with just under half of responding states tracking COVID-19 vaccination rates among Medicaid HCBS enrollees. Recognizing Medicaid as the primary payer for HCBS, recent legislation has increased federal funding to support Medicaid HCBS. The American Rescue Plan Act (ARPA) temporarily increases federal matching funds for Medicaid HCBS by an estimated $11.4 billion, and the BBBA passed by the House in November 2021 would provide $150 billion in new federal funds for Medicaid HCBS, including a permanent increase in the federal matching rate. The BBBA also includes new nursing facility staffing requirements, including a requirement to have a at least one registered nurse on duty 24 hours a day, seven days per week.

What to Watch:

  • How will institutional and community based long-term care congregate settings continue to be impacted by the pandemic in terms of cases, deaths and staffing? How will providers and staff respond now that the Supreme Court has allowed CMS’s health care staff vaccine mandate to take effect, and how will litigation challenging the rule ultimately be resolved?
  • Will states retain policies adopted under emergency authorities that expanded access to HCBS after the PHE ends?
  • How will existing investments help states address the need to continue to expand access to HCBS?
  • If BBBA passes, how will states use additional Medicaid HCBS funding to further expand eligibility and services and bolster the direct care workforce?

Access, Social Determinants of Health, and Health Equity

In response to the pandemic, states took action to increase the use of telehealth to expand access to care and also to increase the scope of coverage (and availability of telehealth) for behavioral health services. In response to the COVID-19 pandemic, many states expanded Medicaid telehealth coverage for a number of services and using multiple modalities (audio-visual and audio-only).  Post-pandemic telehealth coverage and reimbursement policies are being evaluated in most states, with states weighing expanded access against quality concerns, especially for audio-only telehealth.  In addition to telehealth, states continue to expand behavioral health services.  Behavioral health conditions—including mental illnesses and substance use disorder (SUD)—are  especially common among Medicaid enrollees and have worsened during the COVID-19 pandemic. The proposed Build Back Better Act (BBBA) passed by the House of Representatives on November 19, 2021 would expand funding for HCBS and community mental health services. Also, CMS under the Biden Administration has identified behavioral health policy and investments as a key federal Medicaid priority.

In KFF’s 50-state budget survey, most states reported that the COVID-19 pandemic prompted them to expand Medicaid programs to address social determinants of health, especially related to housing supports. States also reported existing initiatives in this area in managed care organization (MCO) contracts (e.g., requirements for MCOs to screen and refer enrollees for social needs). Social determinants of health (SDOH) are the conditions in which people are born, grow, live, work, and age that shape health.  In response to the pandemic, federal legislation has been enacted to provide significant new funding to address the health and economic effects of the pandemic including direct support to address food and housing insecurity as well as stimulus payments to individuals, federal unemployment insurance payments, and expanded child tax credit payments. While measures like these have a direct impact in helping to address SDOH, health programs like Medicaid can also play a supporting role. Although federal Medicaid rules prohibit expenditures for most social needs, such as rent, state Medicaid programs have been developing strategies to identify and address enrollee social needs both within and outside of managed care.

The Administration and the majority of state Medicaid programs are implementing initiatives to address disparities in health care by race/ethnicity in Medicaid.  Key state initiatives are focused on specific health outcomes including maternal and infant health, behavioral health, and COVID-19 outcomes and vaccination rates. In addition, the Administration issued a Request for Information to federal agencies to assess barriers and opportunities to advance equity for historically underserved individuals and communities.  The COVID-19 pandemic exacerbated already existing health disparities for a broad range of populations, but specifically for people of color. Early analyses of available federal, state, and local data show that people of color were experiencing a disproportionate burden of COVID-19 cases and deaths, but more recent data show racial disparities in cases and death rates have narrowed for Black and Hispanic people compared to earlier in the pandemic, while American Indian/Alaska Native people continue to experience higher rates of infection and death.  In addition to worse health outcomes, data from the Census Bureau’s Household Pulse Survey show that during the pandemic, Black and Hispanic adults have fared worse than White adults across nearly all measures of economic and food security.

State Medicaid agencies and Medicaid MCOS are implementing a variety of activities aimed at promoting the take-up of COVID-19 vaccinations. Given the large number of people covered by Medicaid, including groups disproportionately at risk of contracting COVID-19 as well as many individuals facing access challenges, state Medicaid programs and Medicaid MCOs (which enroll over two-thirds of all Medicaid beneficiaries) can help in COVID-19 vaccination efforts. MCOs are using member and provider incentives, member outreach and education, provider engagement, assistance with vaccination scheduling and transportation coordination, and partnerships with state and local organizations. Medicaid agencies are taking actions such as partnering with public health agencies, providing technical assistance to providers, and conducting outreach to facilitate vaccine take-up.  States were also implementing policies to help facilitate access to vaccines for HCBS enrollees by partnering with public health agencies, using non-emergency transportation services and enlisting HCBS providers in outreach.  More broadly, the BBBA would require state Medicaid programs to cover all approved vaccines recommended by Advisory Committee on Immunization Practices (ACIP) and vaccine administration, without cost sharing, for adults (and receive a 1 percentage point FMAP increase for 8 quarters).

What to watch? 

  • How will states continue to leverage Medicaid to help address SDOH and racial equity and how will the Administration support these efforts through investments, guidance and demonstration waivers?
  • How will Medicaid agencies continue to work with public health agencies, providers, managed care plans and enrollees to facilitate access to vaccines and boosters?

A Federal Covid Testing Plan Finally Ramps Up. Strings Are Attached.

Published: Jan 14, 2022

In this commentary for Barron’s, Cynthia Cox and Lindsey Dawson examine the cost and availability of at-home COVID-19 tests and how the new Biden administration policy requiring private insurances to cover their costs may work.

News Release

Why Medicare’s Aduhelm Coverage Decision Could Increase Pressure on Officials to Roll Back the Record Part B Premium Increase for 2022

Published: Jan 14, 2022

In a new Policy Watch, KFF experts explain why Medicare’s preliminary decision to cover a new Alzheimer’s drug only for a limited group of beneficiaries is likely to intensify pressure on officials to reconsider the increase in the Medicare Part B premium for 2022.

Earlier this week, CMS issued a preliminary National Coverage Determination that would limit coverage of the new drug, Aduhelm, to beneficiaries with mild cognitive impairment who participate in approved clinical trials – a decision that is expected to result in a relatively small number of Medicare beneficiaries receiving Aduhelm over the next several years.

Medicare officials cited the high price of the drug as a key reason for a 14.5 percent increase in the Part B premium, from $148.50 in 2021 to $170.10 in 2022. But that was before Biogen, the drug’s manufacturer, announced a 50 percent reduction in the drug’s price at the end of 2021, and before the proposed coverage decision was made. Together, these factors suggest that Medicare Part B spending on this drug is not expected to be as large as previously forecast.

Medicare beneficiaries who use Aduhelm, however, will still face thousands of dollars in coinsurance costs if they do not have supplemental coverage to help defray the cost.

The Policy Watch and other analyses related to Aduhelm and Medicare spending are available at kff.org.