Medicare’s Coverage Decision for the New Alzheimer’s Drug and Why It Matters

Published: Jan 14, 2022

After much anticipation, the Centers for Medicare & Medicaid Services (CMS) has announced that Medicare will cover the new Alzheimer’s drug, Aduhelm, subject to evidence development. This preliminary National Coverage Determination (NCD) comes after months of handwringing over the potential impact of this new high-priced drug on Medicare spending and a substantial Medicare Part B premium increase that took effect in January 2022. CMS proposes to cover Aduhelm and similar FDA-approved antiamyloid monoclonal antibody treatments under Coverage with Evidence Development (CED) for patients participating in CMS-approved or NIH-supported randomized clinical trials, which will help to generate the evidence that CMS suggests is currently lacking regarding whether Aduhelm is reasonable and necessary for the treatment of Alzheimer’s disease.

While this decision, which will be finalized in April 2022, proposes the terms of Medicare coverage of these treatments for Alzheimer’s disease, the Aduhelm story is not likely to end here. Only one day before the preliminary NCD was issued, HHS Secretary Becerra directed CMS to reassess the monthly Medicare Part B premium for 2022 in light of the announcement from Biogen, the drug’s manufacturer, that it was slashing the price of Aduhelm by 50% from $56,000 to $28,200 in response to anemic demand for the new drug.

Back in November 2021, prior to the release of the preliminary national coverage determination and the drop in the price of Aduhelm, CMS announced a 14.5% hike in the Medicare Part B premium for 2022. The increase in the premium – from $148.50 in 2021 to $170.10 in 2022 – was based on a “high-cost” scenario that took into account the potential increase in Medicare Part B spending for Aduhelm, among other factors (Figure 1). CMS attributed about half of the premium increase to the need to boost revenues to cover higher projected Part B spending for this one drug alone.

Interactive DataWrapper Embed

While only a small fraction of Medicare beneficiaries are likely to use the drug, all but the very lowest income Medicare beneficiaries will pay the higher Medicare Part B premium this year. For many beneficiaries, the Part B premium is not a trivial share of income. For example, a senior living on an income at 175% of the federal poverty level (~$23,000 for an individual) will spend nearly 9% of her income this year on the Part B premium alone, before factoring in other expenses, like Part D drug plan premiums or cost sharing for Medicare covered services. And for low-income Medicare beneficiaries who have coverage from both Medicare and Medicaid, the Part B premium increase will have implications for Medicaid spending because Medicaid pays their Medicare premiums.

CMS is now considering a possible adjustment in the 2022 Medicare Part B premium, a change which would be unprecedented – with the Part B premium already determined for the year and being deducted from Social Security payments – but perhaps not unwarranted in this case. Yet even if CMS rolls back a portion of the Part B premium for 2022, Medicare beneficiaries who use Aduhelm could still be on the hook for the Part B coinsurance, which is 20% of the drug’s total cost, or more than $5,000. While most beneficiaries have supplemental coverage to help them pay their Medicare cost-sharing requirements, many do not. This group includes nearly 6 million beneficiaries with no supplemental coverage and most of the 26 million enrollees in Medicare Advantage plans, which typically charge the same 20% coinsurance rate that beneficiaries in traditional Medicare face for Part B drugs (though out-of-pocket costs for Medicare Advantage enrollees would be limited to their plan’s out-of-pocket maximum, which averaged $5,091 for in-network services and $9,208 for both in-network and out-of-network services (in PPOs) in 2021).

In terms of Medicare spending, it appears that Medicare will not experience as large an increase in Part B spending associated with Aduhelm as was originally forecast and that CMS projected when setting the Part B premium for 2022, based on the drug’s initial high price and relatively high expected utilization. For example, in the summer of 2021, just after the FDA approved aducanumab, we estimated that the drug’s initial price tag of $56,000 could boost annual Medicare spending by roughly $30 billion if used by 500,000 Medicare beneficiaries. Considering the reduction in the price of Aduhelm and the likelihood of lower utilization based on the preliminary NCD, it is likely that Medicare spending on this drug will be substantially lower, at least in the near term.

In addition to Medicare, the Aduhelm coverage decision could have implications for Medicaid. While Medicaid must cover FDA-approved drugs under the Medicaid Rebate program, states may be able to impose medical necessity criteria as well as strict prior authorization requirements based on the Medicare coverage determination limiting utilization. The magnitude of the financial implications for Medicaid could hinge on further coverage guidance from CMS.

It is not hard to imagine a future scenario where a combination of a high-priced drug and high utilization actually do generate billions of dollars in additional Medicare spending annually and contribute to sizable increases in Medicare premiums. Given that Medicare has no authority under current law to lower drug prices or limit drug price growth, this raises the stakes for ongoing policy discussions around prescription drug price proposals in the Build Back Better Act. These proposals include allowing the federal government to negotiate the price of certain high-cost drugs, requiring drug companies to pay rebates if drug prices rise faster than the rate of inflation, and capping out-of-pocket costs under Medicare Part D. While these proposals could result in a very modest reduction in the number of new drugs coming to market in the U.S. over the next few decades, according to CBO, and would not affect spending associated with Aduhelm, they could provide meaningful savings on other high-cost drugs down the road.

Assessing Online Availability of At-Home COVID-19 Tests Ahead of Private Insurance Reimbursement

Author: Lindsey Dawson
Published: Jan 13, 2022

This week, the Biden Administration announced that individuals in the United States with private insurance would be able to get the cost of at-home COVID-19 tests covered by their plans. While this could significantly improve affordability, and therefore accessibility, for many people, the success of the policy rests in part on test availability. In the U.S. test availability has been constrained due to a number of factors, as we outlined here. We also examined at-home test availability in September and November and while we found some improvement by November, tests were generally still hard to come by.

Now, in the week leading up to the private insurance coverage announcement, we again examined test availability. We searched for 10 tests1  across 6 retailer websites for home delivery over an 8-day period (January 3, 2022 through January 10, 2022). In total, this provided 480 opportunities to buy a test (6 x 10 x 8). We found that tests were available less than 10% of the time. In addition, certain tests were never available and some retailers never had any tests available for online purchase. Prices for tests ranged from $17.98 for two tests ($8.99 per test) to $49.99 for a single test. In most cases, among the limited tests that were available, shipping dates for tests were over a week out. Additional details in Table 1. Full search data available here.

Table 1: Test Cost and Availability Findings (1/3/2022-1/10/2022)
NumberPercent
Number of opportunities to purchase a test (10 tests X 6 retailers X 8 days)480100%
Tests available (times/%)439%
Tests unavailable (times/%)43791%
Finding
Price range$17.98 (2 test pack) on 7 occasions – $49.99 (1 test pack) on 5 occasions
Mode price$24.88 on 9 occasions
Tests never available in searches4 (Abbott BinaxNow, Orasure InteliSwab, Ellume COVID-19 Home Test, Access Bio)
Retailers with no tests available in searches3 (Target, CVS, Walgreens)

Overall, we find that despite efforts to increase test production by manufacturers and the administration, test availability remains limited. This has posed a challenge for consumers looking to purchase home tests to date, especially when looking for a test without a lengthy delivery timeline. Continued challenges with home test availability could limit the reach of the new reimbursement policy and if the policy drives additional demand for these tests, could exacerbate the problem. As more tests are authorized and production hopefully ramps up, shortages may ease.

  1. We searched for the 10 tests that appeared on the websites of the retailers surveyed. ↩︎

State Delivery System and Payment Strategies Aimed at Improving Outcomes and Lowering Costs in Medicaid

Authors: Elizabeth Hinton, Lina Stolyar, Madeline Guth, and Mike Nardone
Published: Jan 12, 2022

Issue Brief

State Medicaid programs are using managed care and an array of other service delivery and payment system reforms, financial incentives, and managed care contracting requirements to help achieve better outcomes and lower costs. Common delivery and payment reform models used by state Medicaid programs include patient-centered medical homes (PCMHs), ACA Health Homes, accountable care organizations (ACOs), and episodes of care. However, there is variation in which models are most widely used, how states combine and implement these models, and how long states have been engaged in efforts to transform payment and delivery systems. Some models may be implemented in Medicaid fee-for-service (FFS) delivery systems while other payment and delivery system reform models are implemented through managed care. Although the literature is not conclusive regarding the impact of these initiatives and more research is needed, states have seen successes and many models have evolved over time in response to state experience and evaluation findings.1 ,2 ,3 ,4 ,5  Across delivery systems, states are also using an array of financial incentives to improve quality including linking performance bonuses or penalties, capitation withholds, or value-based state-directed payments to quality measures. Additionally, as part of delivery and payment reform efforts and/or through managed care plan contract requirements, states have also been focused on adjusting provider payment models to incentivize quality – through the use of “alternative payment models” (APMs). While there is some evidence of positive impacts from state use of financial incentives to engage managed care plans around quality and outcomes, the results are more mixed and limited at the provider level.6 ,7 ,8 

While many payment and delivery system reform efforts remain in place and states continue to use financial incentives tied to quality measures, the COVID-19 pandemic has profoundly affected state Medicaid programs, providers, and enrollees in a variety of ways. For example, some states have paused or modified their financial quality incentive programs, as the pandemic has affected clinical practices and timely reporting of quality data, or made adjustments to managed care contracts and capitation rates to provide financial protection and limit financial risk. In addition, changes in utilization and financial strain for some providers may make it difficult to begin or carry-out certain provider payment reform initiatives.

KFF’s 21st annual budget survey surveyed Medicaid officials in all 50 states and DC about certain policies in place in state fiscal year (FY) 2021 and policy changes implemented or planned for FY 2022, which began on July 1, 2021 for most states.9  This brief summarizes Medicaid budget survey data to answer three key questions:

  • What delivery system and payment reform initiatives are in place across states?
  • How are states using financial incentives and non-financial incentives as part of efforts to improve quality and outcomes?
  • How are states leveraging managed care plan contracts to advance delivery system and payment reform initiatives?

What delivery system and payment reform initiatives are in place across states?

In addition to expanding the use of risk-based, comprehensive managed care, state Medicaid programs have expanded their use of other service delivery and payment system reforms in recent years. There is interest among public and private payers alike in restructuring delivery systems to be more integrated and patient-centered and to help achieve better outcomes and lower costs. Although the literature is not conclusive regarding the impact of these payment and delivery system reform efforts, states and payers have seen some successes and continue to pursue reforms where evidence offers promise or potential for improving outcomes. State Medicaid programs utilize a range of delivery and payment reform; however, there is wide state variation in Medicaid health care delivery and payment systems, as states design and combine service delivery models and payment approaches in different ways. Common Medicaid initiatives include patient-centered medical homes (PCMHs), ACA Health Homes, accountable care organizations (ACOs), episode of care payments, and All-Payer Claims Databases (which often help support state payment reform efforts) (defined in Appendix A).

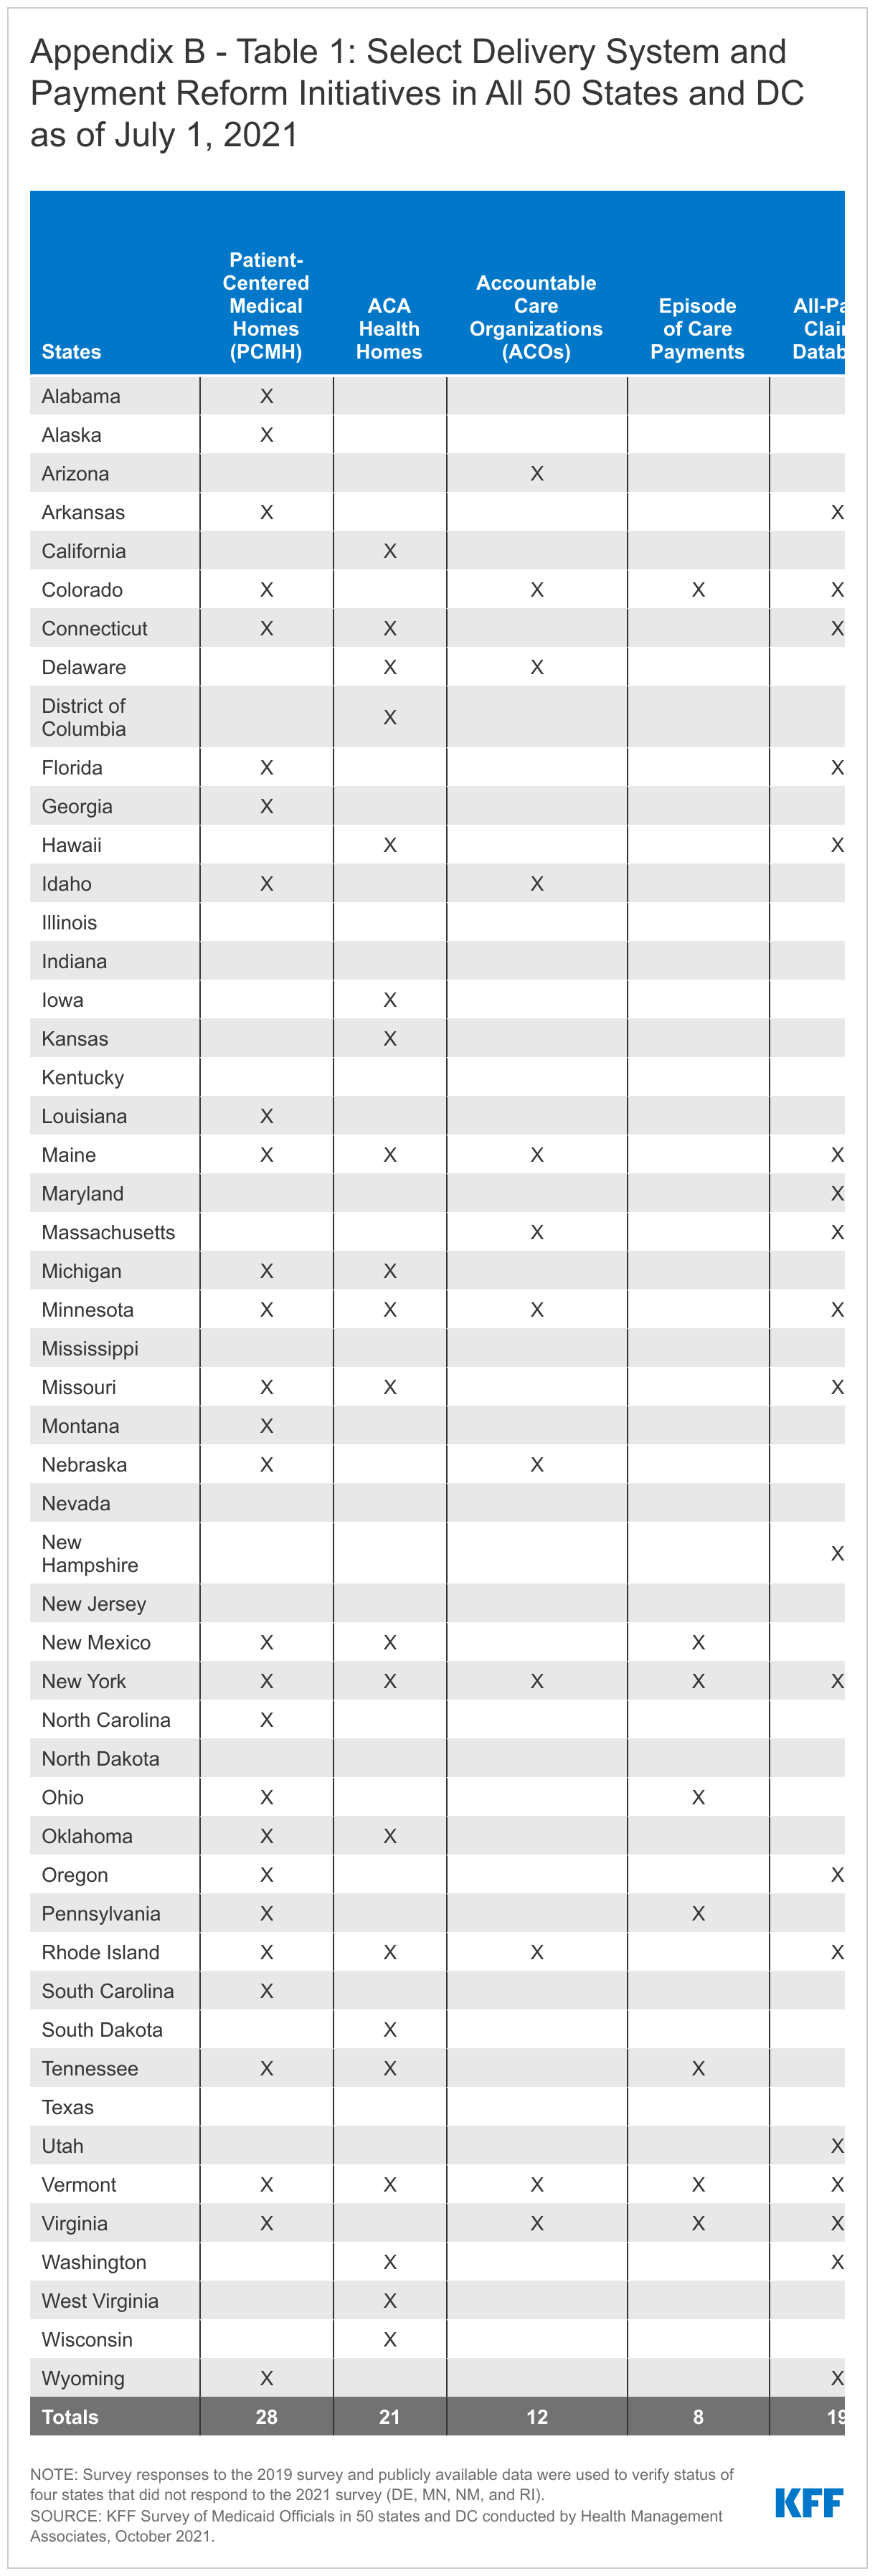
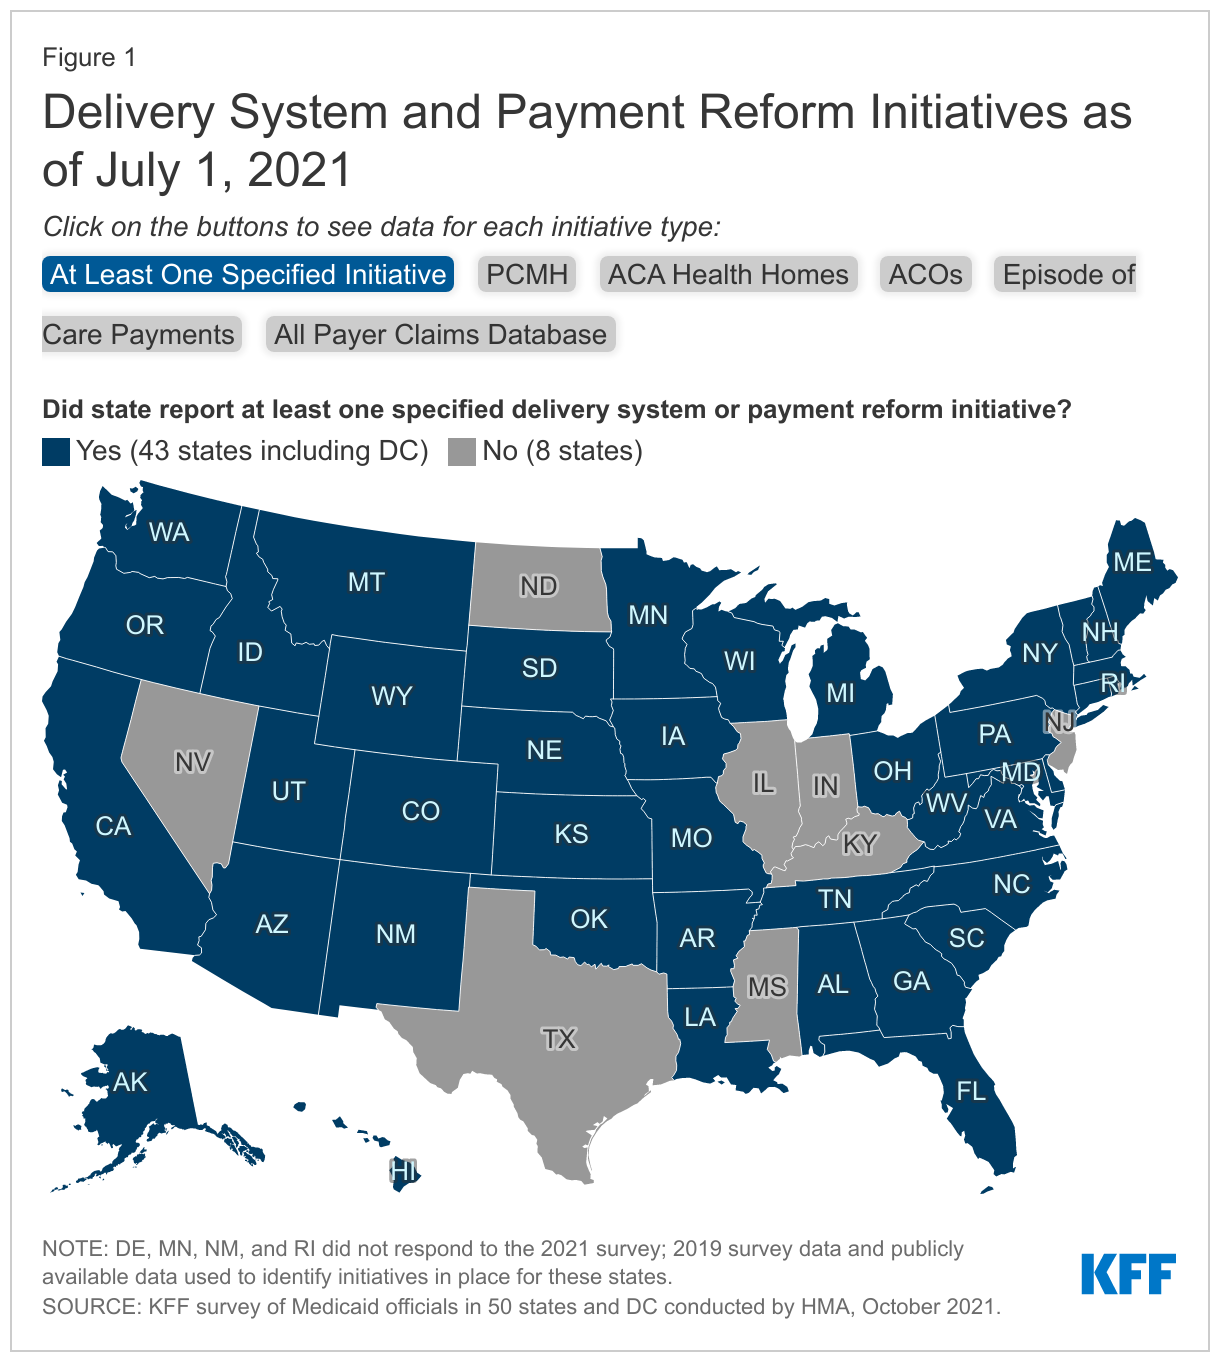
The vast majority of states (43 of 51) had at least one specified delivery system and payment reform initiative10  designed to address Medicaid cost and quality in place as of July 2021 and nearly half (25) had multiple initiatives in place (Figure 1 and Appendix B: Table 1).11  Two states (New York and Vermont) had implemented initiatives in all five specified areas. For example, Vermont is participating in an All-Payer ACO Model with CMS, has in place a multi-payer advanced primary care initiative, including PCMH and community health teams through the state’s Blueprint for Health, a “Hub and Spoke” Health Home model for people experiencing opioid dependence, episodic payments for its residential substance use disorder (SUD) program, and has a mature all-payer claims data base. Total states with each initiative include:

  • Patient-Centered Medicaid Home – 28 states
  • ACA Health Home – 21 states
  • All-Payer Claims Database – 19 states
  • Accountable Care Organization – 12 states
  • Episode of Care – 8 states

Many of these delivery system and payment reform initiatives are longstanding and have been in place for many years. Although the survey did not ask for details regarding each initiative, several states identified changes to initiatives as well as plans to implement in the near future. For example, California is transitioning from its ACA Health Home program to an “Enhanced Care Management” managed care benefit which will be available statewide. This initiative is part of a framework for broad-based delivery system, program, and payment reform across the Medi-Cal program, called California Advancing and Innovating Medi-Cal (CalAIM).12  Although Nevada does not currently have an APCD in place, one was approved for implementation in the 2021 legislative session with an anticipated go-live date of January 2023. New Jersey is currently developing (but does not yet have in place) a perinatal episode of care payment.

Delivery System and Payment Reform Initiatives as of July 1, 2021

How are states using financial incentives and non-financial incentives as part of efforts to improve quality and outcomes?

Across delivery systems (fee-for-service and managed care), states incorporate quality metrics into the ongoing monitoring of their programs, including linking financial incentives like performance bonuses or penalties, capitation withholds, or value-based state-directed payments to quality measures. In particular, the expansion of comprehensive, risk-based managed care in Medicaid has been accompanied by greater attention to incentivizing and measuring quality and managed care plan performance. States use other non-financial methods to incentivize managed care plan performance including the use of Quality Rating Systems (QRSs), which allow states and beneficiaries to compare performance across plans, and the auto-assignment of Medicaid enrollees based on managed care plan quality/performance. These methods/models are discussed in more detail below.

Quality Payment Incentives

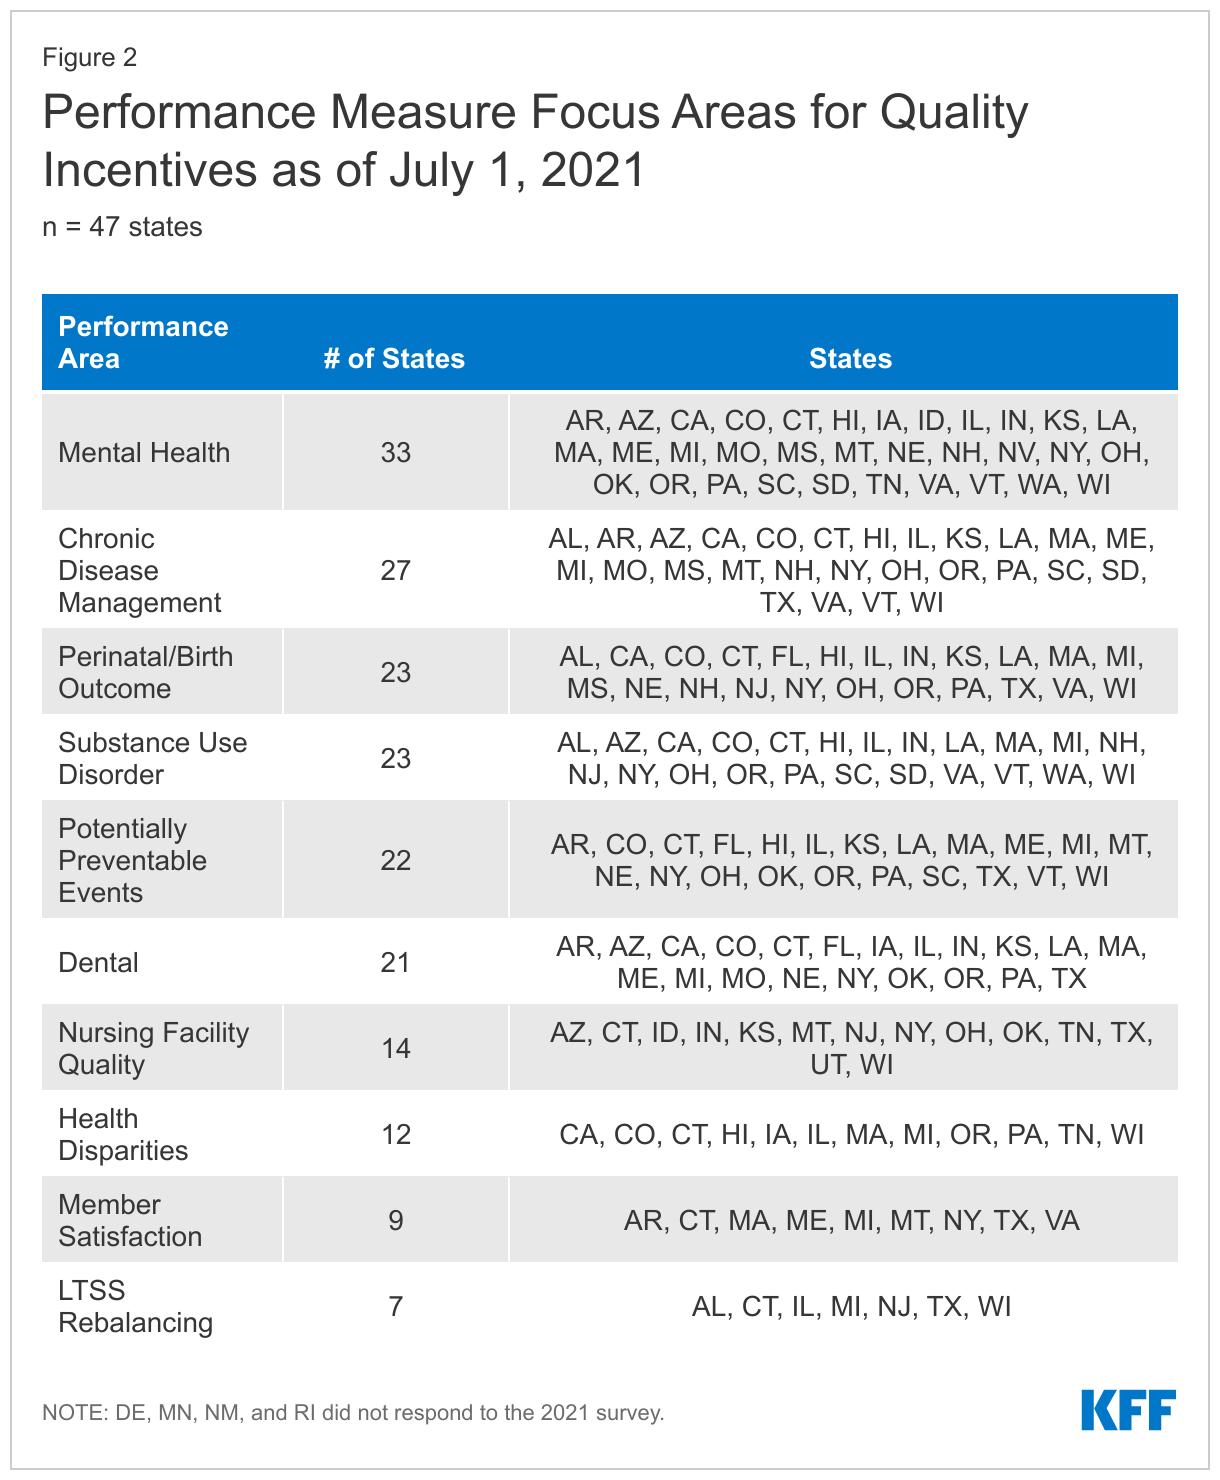
The overwhelming majority of states surveyed (38 of 47) use at least one specified financial incentive to promote quality of care (Figure 2). States implement financial incentives across delivery systems including comprehensive, risk-based managed care organizations (MCOs), limited benefit prepaid health plans (PHPs), and/or primary care case management (PCCM) programs or fee-for-service. Financial quality incentives could include MCO or provider performance bonuses or penalties, quality add-on payments, managed care capitation withholds, or state-directed value-based payments, among other arrangements.

Financial incentive performance areas most frequently targeted by states include behavioral health (mental health and/or SUD), chronic disease management, and perinatal/birth outcomes (Figure 2). States’ focus on behavioral health metrics is not surprising given that Medicaid is the single largest payer of behavioral health services in the United States and individuals with a behavioral health disorder also utilize significant health care services. Medicaid plays an important role in serving beneficiaries with chronic physical health needs and funds a significant share of the nation’s births. Additionally, the number of states that link financial incentives to health disparities metrics represents a significant increase from our survey two years ago. The results from this year’s survey likely indicate states’ recognition that addressing disparities is critical to moving the needle on quality in the Medicaid program.

Performance Measure Focus Areas for Quality Incentives as of July 1, 2021

A number of states made changes to their quality incentive programs due to the COVID-19 pandemic, as the pandemic has likely affected clinical practices and timely reporting of quality data. Many of these states paused or modified their program or will evaluate data on performance during the pandemic to determine if additional modifications are required. For example, Iowa rescinded its MCO pay-for-performance (P4P) program based on HEDIS measures after the first half of SFY 2021, replacing it with a metric related to assuring MCO submission of quality data on social determinants of health. Illinois released January to September 2020 P4P withhold funds to MCOs with a requirement that it be reinvested to serve enrollees and providers, including efforts to address social determinants of health or other needs of members during the COVID-19 pandemic, among other initiatives. Additionally, a few states had or were in the process of implementing financial incentives tied to performance on increasing COVID-19 vaccination rates.

Quality Rating Systems

A quality rating system (QRS) provides beneficiaries with a mechanism to compare quality across managed care plans and can be used to help make informed decisions about their choice of MCOs. It can also be a tool in state quality improvement efforts, facilitating state oversight of MCOs and providing actionable information to the state and its managed care plans to improve the quality of Medicaid services.13 

In 2016, CMS issued regulations for the first time requiring that all states contracting with a MCO or PHP adopt a CMS-developed quality rating system or an alternative state-developed QRS approved by CMS. Once fully effective, states will be required to collect data and issue annual quality ratings for each of its MCOs and PHPs. Under revisions to the 2016 rule that were finalized in 2020, a state’s alternative QRS must include the mandatory performance measures to be established by CMS, although the alternative QRS has to yield information substantially comparable to the CMS-developed QRS only to the extent feasible. CMS plans to issue a proposed rule to receive public comment prior to issuing a final rule detailing the QRS specifications but as of this writing has not done so. States will have three years from the date of the final rule to implement the Medicaid QRS system.14 

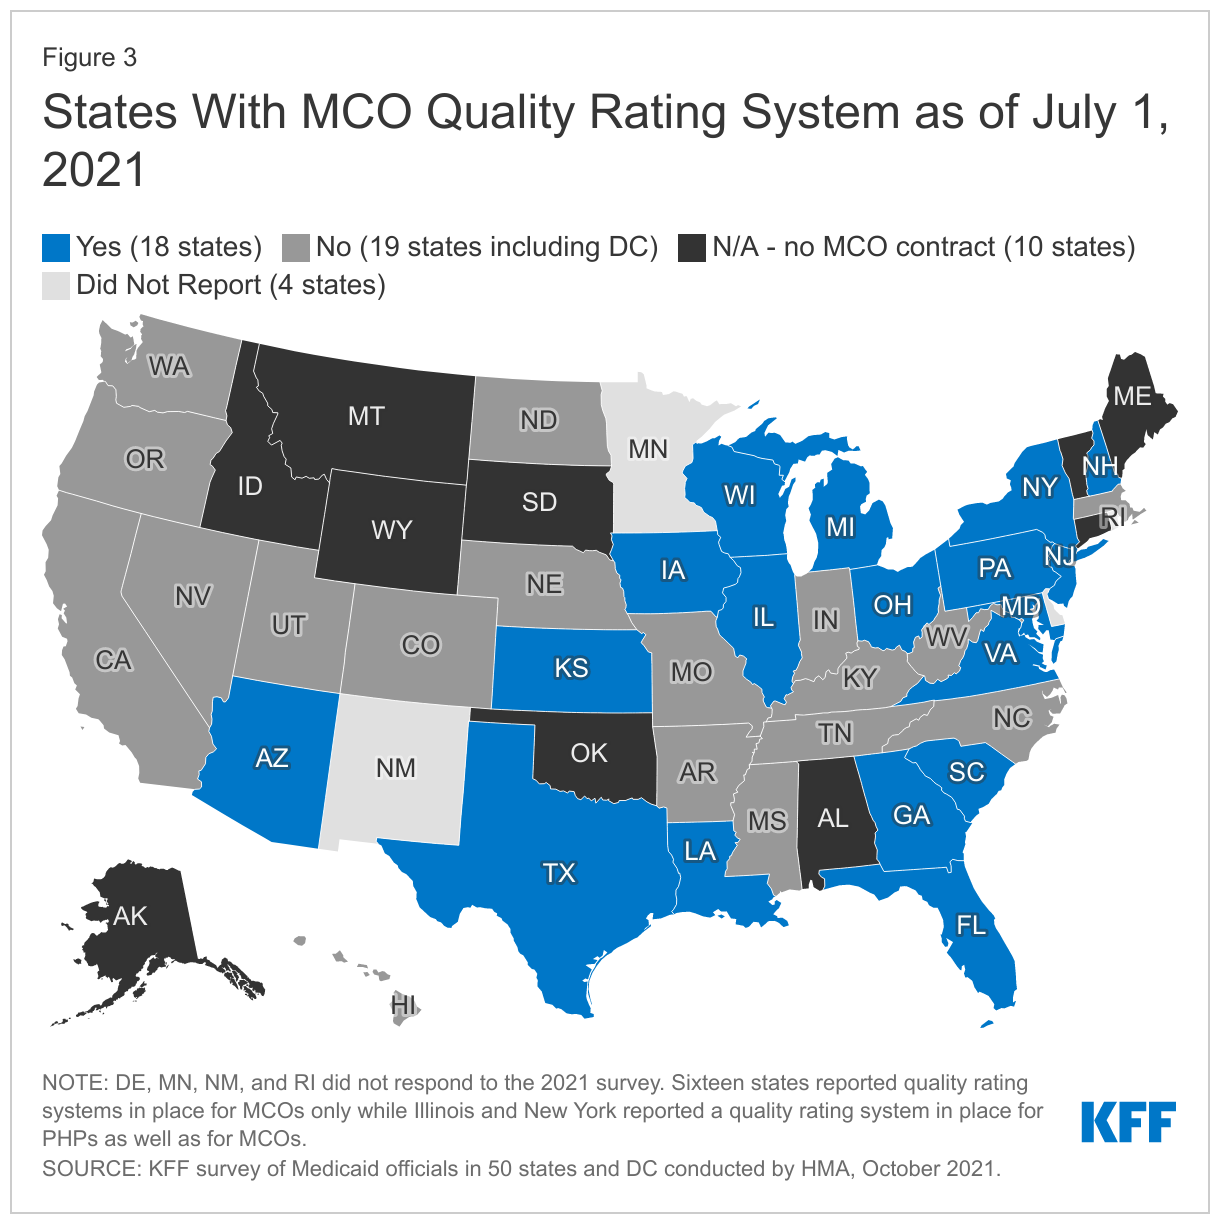
Eighteen of the 37 responding MCO states have a quality rating system in place to assess the relative performance of the states’ managed care plans (Figure 3). Two states (Illinois and New York) have a quality rating system (QRS) in place for PHPs as well as for MCOs. The state quality rating systems efforts implemented by these 18 states are a forerunner of efforts at the federal level to implement a more standardized national framework for assessing Medicaid managed care plans across states. With further guidance on the horizon with respect to QRS, states reported little new activity on this front for FY 2022. Michigan plans to implement a QRS system for its Healthy Kids Dental (PHP) program. Two states (North Carolina and West Virginia) are moving towards development of a QRS in FY 2023.

States With MCO Quality Rating System as of July 1, 2021

Auto-Assignment Based on Quality

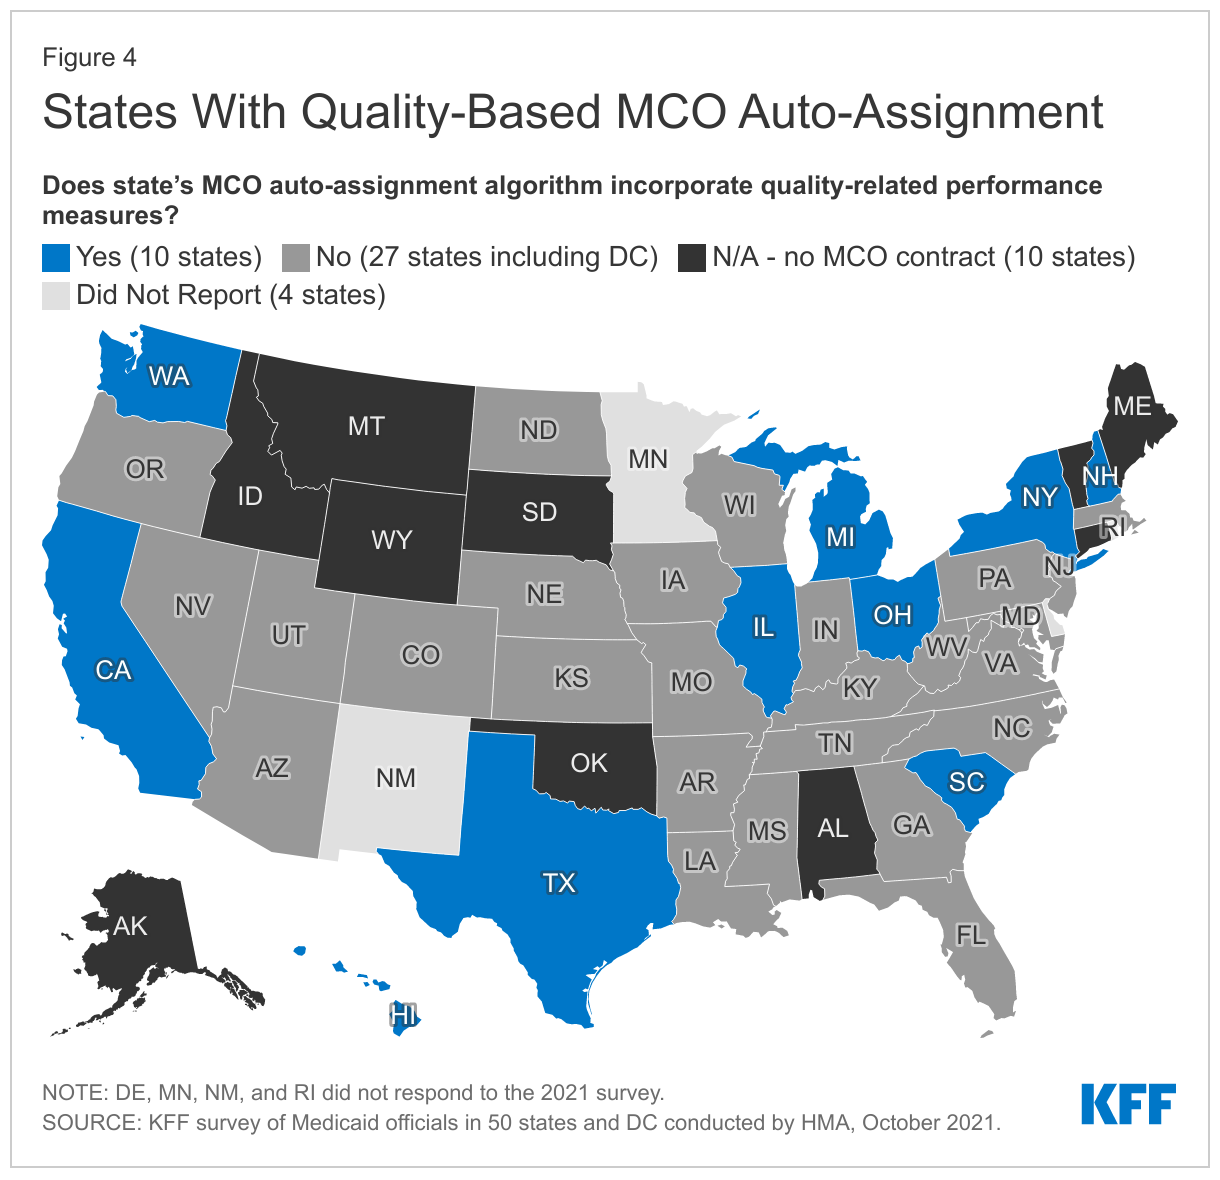
Ten of the 37 responding MCO states incorporate quality into their algorithm for auto-assigning enrollees who do not choose a health plan (Figure 4). Although Medicaid enrollees required to enroll in a managed care program must have an opportunity to choose their MCO under federal managed care rules,15  not all members make a plan selection. States, therefore, develop methods for assigning members who do not choose a plan. States have been able to use the method or algorithm for auto-assigning members as a tool to leverage higher quality and increase enrollment of members into higher performing plans. For example, in South Carolina members who either do not select a health plan or do not have a recent affiliation with a health plan through a family member or their own previous enrollment are assigned to health plans based in part on MCOs overall score on NCQA’s Medicaid Health Insurance Plan Ratings.16 

States With Quality-Based MCO Auto-Assignment

How are states leveraging managed care plan contracts to advance delivery system and payment reform initiatives?

As part of managed care plan contract requirements, state Medicaid programs have also been focused on the use of alternative payment models (APMs) to reimburse providers and incentivize quality. APMs lie along a continuum, ranging from arrangements that involve limited or no provider financial risk (e.g., pay-for-performance (P4P) models) to arrangements that place providers at more financial risk (e.g., shared savings/risk arrangements or global capitation payments). States may also include other requirements in their contracts with managed care plans which direct plans to develop or participate in other value-based payment (VBP) initiatives (e.g., Accountable Care Organizations (ACOs), episodes of care etc.).17 

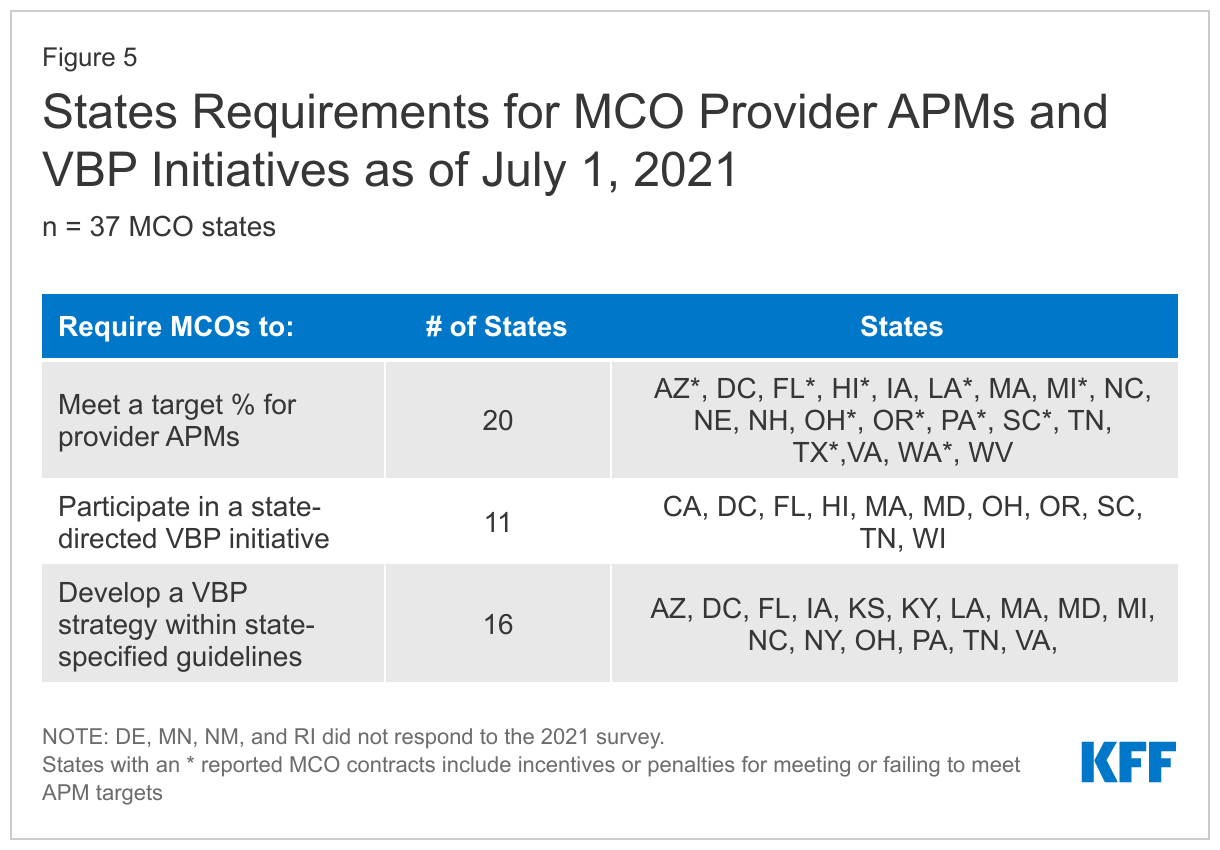
As of July 2021, more than half of responding MCO states (20 of 37) identified a specific target in their MCO contracts for the percentage of provider payments or plan members that MCOs must cover via APMs (Figure 5). Of these states, about half (11 states) reported that their MCO contracts included incentives or penalties for meeting or failing to meet APM targets. States with targets linked to expenditures reported a wide range of required APM percentage targets from a high of 85% (Washington) to a low of 10% (West Virginia). For most states, the requirements for APMs were in the 25 - 50% range. States reported setting different percentage requirements depending on the services and population served under the managed care contract.18  Thirteen states19  reported that their APM targets were linked to the Health Care Payment Learning & Action Network’s (LAN’s) APM Framework that categorizes APMs in tiers.20 

Eleven states had contracts that required MCOs to participate in a CMS-approved state-directed value-based payment initiative21  (e.g., state-administered or directed episode of care or ACO initiative) in July 2021 (Figure 5). For example, Ohio requires MCOs to participate in its episode of care payment model and Comprehensive Primary Care Program; Maryland requires MCOs to provide enhanced payments to state-owned academic health center physicians and other eligible providers; and several states require specific pay for performance arrangements in their MCO contracts.

Sixteen states required MCOs to develop a VBP strategy within state-specified guidelines as of July 1, 2021 (Figure 5). For example, Arizona requires its MCOs to develop strategies within the Health Care Payment Learning and Action Network’s (LAN’s) APM framework;22  Louisiana ties withheld capitation payments to the use of VBP arrangements; and both Michigan and Virginia require MCOs to develop and implement a plan for increasing the adoption of VBPs over the contract period.

States Requirements for MCO Provider APMs and VBP Initiatives as of July 1, 2021

Although the survey question on APMs was specifically asked in relation to managed care, Maine and Vermont both have efforts to increase utilization of alternative payment models in their fee-for-service programs. Maine noted that it has an APM target of reaching 40% of MaineCare payments tied to APMs by the end of 2022. Vermont reported on several of the APMs it has implemented in its Medicaid program.23 

Looking Ahead

Uncertainty remains regarding the future course of the pandemic. Lack of stability in utilization patterns, labor shortages, provider capacity, and the appropriateness of pre-pandemic performance measures, among other factors, will continue to affect how states can advance delivery system and payment reform initiatives as well as efforts to monitor and incentivize managed care plan and provider performance. Despite disruptions caused by the pandemic, these initiatives have long been underway across states and have often undergone many iterations. Delivery system and payment reform efforts may help further goals to create more patient-centered delivery systems, improve outcomes, and lower costs. Additional research on the impact of these initiatives will help continue to inform the evolution of these models. As more than two-thirds of Medicaid enrollees receive most or all of their care through managed care plans, initiatives that measure and incentivize plan performance are key to program monitoring and may offer transparency important to continue to improve quality for enrollees.

This brief draws on work done under contract with Health Management Associates (HMA) consultants Kathleen Gifford, Aimee Lashbrook, Sarah Barth, and Mike Nardone.

Appendices

Appendix A

Delivery System Reform Initiatives Defined

  • Patient-Centered Medical Home (PCMH). Under a PCMH model, a physician-led, multi-disciplinary care team holistically manages the patient’s ongoing care, including recommended preventive services, care for chronic conditions, and access to social services and supports. Generally, providers or provider organizations that operate as a PCMH seek recognition from organizations like the National Committee for Quality Assurance (NCQA).24  PCMHs are often paid (by state Medicaid agencies directly or through MCO contracts) a per member per month (PMPM) fee in addition to regular FFS payments for their Medicaid patients.
  • ACA Health Home. The ACA Health Homes option, created under Section 2703 of the ACA, builds on the PCMH concept. By design, Health Homes must target beneficiaries who have at least two chronic conditions (or one and risk of a second, or a serious and persistent mental health condition), and provide a person-centered system of care that facilitates access to and coordination of the full array of primary and acute physical health services, behavioral health care, and social and long-term services and supports. This includes services such as comprehensive care management, referrals to community and social support services, and the use of health information technology (HIT) to link services, among others. States receive a 90% federal match rate for qualified Health Home service expenditures for the first eight quarters under each Health Home State Plan Amendment; states can (and have) created more than one Health Home program to target different populations. For substance use disorder (SUD) Health Homes approved on or after October 1, 2018, the SUPPORT Act extends the enhanced federal match rate from eight to ten quarters.
  • Accountable Care Organization (ACO). While there is no uniform, commonly accepted federal definition of an ACO, an ACO generally refers to a group of health care providers or, in some cases, a regional entity that contracts with providers and/or health plans, that agrees to share responsibility for the health care delivery and outcomes for a defined population. An ACO that meets quality performance standards that have been set by the payer and achieves savings relative to a benchmark can share in the savings. States use different terminology in referring to their Medicaid ACO initiatives, such as Regional Accountable Entities25  in Colorado and Accountable Entities in Rhode Island.
  • Episode of Care Initiatives. Unlike fee-for-service (FFS) reimbursements, where providers are paid separately for each service, or capitation, where a health plan receives a PMPM payment for each enrollee intended to cover the costs for all covered services, episode of care payments provide a set dollar amount for the care a patient receives in connection with a defined condition or health event (e.g., heart attack or knee replacement). Episode-based payments usually involve payment for multiple services and providers, creating a financial incentive for physicians, hospitals, and other providers to work together to improve patient care and manage costs.
  • All-Payer Claims Database (APCD). All-payer claims databases are state databases that include medical claims, pharmacy claims, dental claims (typically, but not always), and eligibility and provider files collected from private and public payers in a state. Through the aggregation of data across all public and private payers, APCDs can provide states with a perspective on cost, service utilization and quality of health care services across the full spectrum of payers in a state, representing a tool that can support state efforts to control health care costs and promote value-based care.
Appendix Table 1: Select Delivery System and Payment Reform Initiatives in All 50 States and DC, as of July 1, 2021

Endnotes

  1. Center for Health Care Strategies, “Medicaid Accountable Care Organizations: State Update,” (Hamilton, NJ: Center for Health Care Strategies, February 2018), https://www.chcs.org/media/ACO-Fact-Sheet-02-27-2018-1.pdf ↩︎
  2. Michael Wilson et al., “The impacts of accountable care organizations on patient experience, health outcomes, and cost: a rapid review,” Journal of Health Services Research & Policy 25 no. 2 (April 2020): 130-138, https://journals.sagepub.com/doi/full/10.1177/1355819620913141 ↩︎
  3. Office of the Assistant Secretary for Planning and Evaluation (ASPE), Evaluation of the Medicaid Health Home Option for Beneficiaries with Chronic Conditions: Evaluation of Outcomes of Selected Health Home Programs Annual Report - Year Five, Washington, DC: Office of the Assistant Secretary for Planning and Evaluation, May 2017, https://aspe.hhs.gov/basic-report/evaluation-medicaid-health-home-option-beneficiaries-chronic-conditions-evaluation-outcomes-selected-health-home-programs-annual-report-year-five ↩︎
  4. Office of the Assistant Secretary for Planning and Evaluation (ASPE), Report to Congress on the Medicaid Health Home State Plan Option, Washington, DC: Office of the Assistant Secretary for Planning and Evaluation, May 2018, https://www.medicaid.gov/state-resource-center/medicaid-state-technical-assistance/health-home-information-resource-center/downloads/medicaidhomehealthstateplanoptionrtc.pdf ↩︎
  5. Kevin Grumbach, Thomas Bodenheimer, and Paul Grundy, “The Outcomes of Implementing Patient-Centered Medical Home Interventions: A Review of the Evidence on Quality, Access and Cost from Recent Prospective Evaluation Studies, August 2009,” (Washington DC: Patient-Centered Primary Care Collaborative, August 2009), https://pcmh.ahrq.gov/sites/default/files/attachments/The%20Outcomes%20of%20Implementing%20Patient-Centered%20Medical%20Home%20Interventions.pdf ↩︎
  6. Aaron Mendelson et al., “The Effects of Pay-for-Performance Programs on Health, Health Care Use, and Processes of Care: A Systematic Review,” Annals of Internal Medicine 166 no. 5 (March 2017): 341-353, doi:10.7326/M16-1881 ↩︎
  7. California Health Care Foundation, “Making Quality Matter in Medi-Cal Managed Care: How Other States Hold Health Plans Financially Accountable for Performance,” (Sacramento, CA: California Health Care Foundation, February 2019), https://www.chcf.org/wp-content/uploads/2019/02/MakingQualityMatterMediCalManagedCare.pdf ↩︎
  8. New York State Department of Health, 2017 Quality Incentive for Medicaid Managed Care Plans, Albany, NY: New York State Department of Health, 2017, https://www.health.ny.gov/health_care/managed_care/reports/docs/quality_incentive/quality_incentive_2017.pdf ↩︎
  9. State fiscal years begin on July 1 except for these states: New York on April 1; Texas on September 1; Alabama, Michigan, and District of Columbia on October 1. ↩︎
  10. States were asked to indicate whether the following specified delivery system and payment reform initiatives (including multi-payer initiatives that Medicaid is a part of) were in place as of July 1, 2021: patient-centered medical home (PCMH); Health Home (under ACA section 2703); Accountable Care Organization (ACOs); episode of care; and all-payer claims database. ↩︎
  11. Delaware, Minnesota, New Mexico, and Rhode Island did not respond to the 2021 survey; 2019 survey data and publicly available data were used to identify delivery system and payment reform initiatives in place for these states. ↩︎
  12. Building off the experience of Health Homes and California’s Whole Person Pilots, the goal of this new benefit is to bring a whole person focus to the care of certain high-need Medi-Cal beneficiaries, e.g., children/youth with complex physical, behavioral, developmental, and oral health needs, individuals who are homeless or at risk of homelessness, among other target populations, to address both their clinical and non-clinical needs. For more information, see: State of California – Health and Human Services Agency, CalAIM Enhanced Care Management Policy Guide, Sacramento, CA: State of California – Health and Human Services Agency, September 2021, https://www.dhcs.ca.gov/Documents/MCQMD/ECM-Policy-Guide-September-2021.pdf ↩︎
  13. Centers for Medicare and Medicaid Service, Health Insurance Exchange Quality Ratings System 101, Baltimore, MD: Department of Health and Human Services, August 15, 2019, https://www.cms.gov/newsroom/fact-sheets/health-insurance-exchange-quality-ratings-system-101 ↩︎
  14. Center for Medicaid and CHIP Services, 2020 Medicaid and CHIP Managed Care Final Rule, Baltimore, MD: Department of Health and Human Services, November 9, 2020, https://www.medicaid.gov/medicaid/managed-care/guidance/medicaid-and-chip-managed-care-final-rules/index.html ↩︎
  15. Under 42 U.S.C. 1396u–2 §(a)(3) ↩︎
  16. South Carolina Healthy Connections Medicaid, Policy and Procedure Guide for Managed Care Organizations, Columbia, SC: South Carolina Health Connections Medicaid, April 2021, https://msp.scdhhs.gov/managedcare/sites/default/files/MCO%20PP%20April%202021%20Final.pdf ↩︎
  17. National Association of Medicaid Directors, “Medicaid Value-Based Purchasing: What Is It & Why Does It Matter?” (Washington, DC: National Association of Medicaid Directors, January 2017), http://medicaiddirectors.org/wp-content/uploads/2017/01/Snapshot-2-VBP-101_FINAL.pdf. ↩︎
  18. For example, in Pennsylvania, the APM target for the HealthChoices physical health MCO program and the behavioral health managed care program is 50% and 20%, respectively, for calendar year 2021. Likewise, Virginia sets a lower percentage (10%) for its MLTSS program, Commonwealth Coordinated Care Plus, than for its Medallion 4.0 Medicaid physical and behavioral health managed care program that serves the state’s low-income children and families and the APM target is set at 25%. ↩︎
  19. The thirteen states are Arizona, District of Columbia, Hawaii, Louisiana, Michigan, New Hampshire, North Carolina, Oregon, Pennsylvania, South Carolina, Texas, Virginia, and Washington. ↩︎
  20. Health Care Payment Learning & Action Network, “Alternative Payment Model (APM) Framework,” (McLean, VA: The MITRE Corporation, 2017), https://hcp-lan.org/workproducts/apm-refresh-whitepaper-final.pdf. CMS launched the LAN in 2015 to encourage alignment across public and private sector payers by providing a forum for sharing best practices and developing common approaches to designing and monitoring of APMs, as well as by developing evidence on the impact of APMs. ↩︎
  21. Under 42 CFR §438.6(c) ↩︎
  22. Health Care Payment Learning & Action Network, “Alternative Payment Model (APM) Framework: Fact Sheet,” accessed at: http://hcp-lan.org/workproducts/apm-factsheet.pdf. CMS launched the LAN in 2015 to encourage alignment across public and private sector payers by providing a forum for sharing best practices and developing common approaches to designing and monitoring of APMs, as well as by developing evidence on the impact of APMs. ↩︎
  23. These efforts include the Vermont Medicaid Next Generation Accountable Care Organization (ACO) program under the Vermont All-Payer Accountable Care Organization Model agreement with CMS. Fifty-four percent of Vermont’s FFS Medicaid payments are reported to be in LAN Categories 3 and 4 APM models. For information on Vermont’s All-Payer Agreement with CMS, see: Centers for Medicare and Medicaid Service, Vermont All-Payer ACO Model, Baltimore, MD: Department of Health and Human Services, last updated August 31, 2021, https://innovation.cms.gov/innovation-models/vermont-all-payer-aco-model ↩︎
  24. National Committee on Quality Assurance, “Patient-Centered Medical Home Recognition,” (Washington, DC: National Committee on Quality Assurance, accessed October 10, 2019), http://www.ncqa.org/Programs/Recognition/Practices/PatientCenteredMedicalHomePCMH.aspx ↩︎
  25. Colorado Department of Health Care Policy and Financing, Accountable Care Collaborative Phase II, Denver, CO: Colorado Department of Health Care Policy and Financing, accessed September 12, 2021, https://www.colorado.gov/pacific/hcpf/accphase2 ↩︎

Monthly Part B Premiums and Annual Percentage Increases

Published: Jan 12, 2022

In November 2021, CMS announced the monthly Medicare Part B premium would rise from $148.50 in 2021 to $170.10 in 2022, a 14.5% ($21.60) increase. This is the largest increase in dollar terms since the start of the program, even though premiums have risen faster in percentage terms on three other occasions in the last 20 years – 2016 (16.1%), 2010 (14.6%), and 2005 (17.4%).

CMS explained that the increase for 2022 was due in part to the potential costs associated with the new Alzheimer’s drug, Aduhelm (aducanumab), manufactured by Biogen, which had an initial annual price tag of $56,000. The increase in the Part B premium was to allow for a “high-cost scenario” of Aduhelm coverage based on assumptions about utilization months before the scheduled announcement of a National Coverage Determination (NCD).

A proposed NCD was announced on Tuesday, January 11, that will be followed by a 30-day comment period and a final decision to be announced by April 11, 2022. The NCD proposes to cover Aduhelm and other similar FDA-approved antiamyloid monoclonal antibodies under Coverage with Evidence Development (CED) in approved randomized controlled trials that satisfy particular coverage criteria. In effect, these drugs will not be covered for people on Medicare unless they are part of a qualifying clinical trial.

On January 10, HHS Secretary Xavier Becerra instructed CMS to reassess the amount of the 2022 Medicare B premium to account for a 50% price reduction in Aduhelm announced by Biogen in late December 2021. Becerra’s order to reassess the Part B premium after it had been announced was highly unusual.

Before New Ban, the Prevalence of Surprise Bills

Author: Jason Millman
Published: Jan 7, 2022

New federal protections that took effect Jan. 1 will bar insured patients from receiving surprise medical bills when they unexpectedly receive care from an out-of-network provider.

These bills have been a major concern for Americans for years. About 1 in 5 emergency visits and about 1 in 6 inpatient admissions at in-network facilities result in an out of network charge, putting patients at risk of a surprise bill, and the prevalence of surprise bills varies by condition, we have found.

More than any other type of hospitalizations, surgery admissions are more likely to result in an out-of-network charge (21%), followed by admissions for mental health and/or substance abuse (20%). Nearly a quarter (23%) of inpatient admissions for heart attacks resulted in an out-of-network bill, and 21% of women undergoing mastectomiess had an out-of-network charge.

Even if there’s widespread compliance with the new protections under the No Surprises Act, problems with surprise bills could still arise each year. Consumers should be aware of the new protections and know how to seek out help if they have improperly received a surprise bill.

Source


‘In Focus with KFF’: What to Know About the New Ban on Surprise Bills

Published: Jan 5, 2022

Following years of bipartisan outcry over surprise medical bills, a new federal law that took effect Jan. 1 shields patients from receiving potentially large bills when they unexpectedly receive care out of network. In this new video, KFF Senior Fellow Karen Pollitz explains why surprise bills have been such a major problem for patients, how the new law works, potential gaps in the protections, and what patients can do if they believe they have received a surprise bill.

“This is a really important new protection,” Pollitz says in the video. “People are more worried about unexpected medical bills than just about any other affordability concern.”

Patients with a complaint about a surprise bill can contact a new federal hotline, the “No Surprises Help Desk,” at 1-800-985-3059.

Unvaccinated COVID patients cost the U.S. health system billions of dollars

Published: Dec 22, 2021

This analysis seeks to quantify the number of hospitalizations that could have been prevented by vaccination and the total cost of these hospitalizations. It estimates that there were a total of 690,000 vaccine-preventable COVID-19 hospitalizations form June through November 2021, a period that overlaps with the delta variant surge.  It estimates that the preventable costs of treating these patients iat $13.8 billion during the six-month period.

The analysis is available on the Peterson-KFF Health System Tracker, an online information hub dedicated to monitoring and assessing the performance of the U.S. health system.

A Year of Vaccine Inequity

Published: Dec 22, 2021

Earlier this year, the World Health Organization and other international institutions set global COVID-19 vaccination targets with the goal of providing equitable access to vaccines and preventing the emergence of worrisome variants. These targets included a goal of vaccinating 40% of the population by the end of 2021 and 70% by mid-2022. Additionally, the U.S. has set a 70% coverage target by the next United Nations General Assembly in September 2022.

However, as 2021 comes to an end, global COVID-19 vaccine coverage remains inequitable. By income-level, high- and middle-income countries have surpassed the 40% target for this year, with low-income countries at just 7% of their populations having received at least one dose of a COVID-19 vaccine as of December 20. While vaccine supplies are expected to ramp up early next year, the vaccination pace in these countries would have to greatly increase just to hit 40% coverage by the end of 2022.

To assess global COVID-19 vaccination equity by income level, region, and country, and to compare vaccination to global targets, visit our tracker.

Poll Finding

KFF COVID-19 Vaccine Monitor: Differences in Vaccine Attitudes Between Rural, Suburban, and Urban Areas

Authors: Grace Sparks, Liz Hamel, Ashley Kirzinger, Mellisha Stokes, and Mollyann Brodie
Published: Dec 22, 2021

Findings

Key Findings

  • Throughout the past year, the KFF COVID-19 Vaccine Monitor has provided a look into how the coronavirus pandemic has impacted people living in different areas of the U.S., including analyses of the vaccine intentions of rural residents. This latest report draws on two surveys conducted in November (before news of the omicron variant) – one of adults and one of parents – and shows that those living in different types of communities hold very different views of COVID-19 vaccines, particularly when it comes to children. In addition, parents living in different community types report getting different levels of information regarding COVID-19 vaccines from their children’s schools and pediatricians.
  • Rural and suburban adults continue to lag somewhat behind those living in urban areas in terms of vaccine uptake. As of November, eight in ten urban residents (79%) say they have gotten at least one dose of a COVID-19 vaccine compared to seven in ten suburban adults and 67% of rural adults. One in five (21%) of those living in rural areas and one in six (16%) of those living in suburban areas say they will “definitely not” get a COVID-19 vaccine, at least twice the share of urban residents who say the same (8%).
  • The rural-urban gap in vaccination intention is even larger when it comes to children. About half of rural parents say they will definitely not get their 12-17 year-old children or their 5-11 year-old children vaccinated for COVID-19. A quarter of rural parents (26%) say they have vaccinated their 12-17 year-old, compared to nearly two-thirds of parents in urban areas (64%) and about half of those living in suburban areas (47%) areas. One in ten rural parents and a similar share of suburban parents (14%) report that their 5-11 year-old child is vaccinated, compared to about a quarter (23%) of urban parents who say the same.
  • Four in ten parents overall say they have spoken to their child’s pediatrician about the COVID-19 vaccine. Yet, those living in rural areas are more likely than those living in suburban or urban areas to report their child’s pediatrician did not recommend the vaccine for their child. More than one-third of rural parents say they had a conversation with their child’s health care provider and the provider did not recommended they get their child vaccinated (compared to around one in ten urban and one in seven suburban parents).
  • Around half of all parents say their child’s school has provided them with information on how to get a COVID-19 vaccine for their child, but smaller shares of rural than urban parents say their child’s school has encouraged parents to get their child vaccinated (36%) compared to parents in suburban (44%) and urban (50%) areas.
  • Views on COVID-19 vaccine mandates also differ across communities. A majority of urban residents support the federal government requiring large employers to either have their employees be vaccinated or get tested weekly, while rural and suburban residents are more divided on this Biden administration guideline. In addition, most workers living in urban areas say their employer already requires employees to be vaccinated for COVID-19 or that they support such a requirement, while six in ten rural workers and half of suburban workers do not want their employer to issue a vaccine mandate. Opposition to schools requiring eligible students to be vaccinated for COVID-19 is also higher among rural and suburban parents compared to urban parents.
  • While differing partisanship and demographics may contribute to differences in vaccine attitudes between people living in urban, suburban, and rural communities, multivariate analysis suggests that there is a relationship between community type and COVID-19 vaccine uptake that exists even when controlling for party identification and demographics. Using a statistical technique called logistic regression, we find that rural and suburban adults are less likely than urban adults to report being vaccinated for COVID-19, even after controlling for age, race, ethnicity, education, income, party identification, and ideology.

Rural and Suburban Residents Lag Behind Urban Residents In COVID-19 Vaccination

Since around May 2021, adults living in rural areas (and to a lesser extent, those living in suburban areas) have lagged behind those living in urban areas in terms of self-reported COVID-19 vaccine uptake. As of November 2021 (before news of the omicron variant), eight in ten urban residents (79%) say they have gotten at least one dose of a COVID-19 vaccine compared to seven in ten suburban adults and 67% of rural adults.

Rural Adults Continue To Lag Behind Urban Adults In COVID-19 Vaccine Uptake

At the same time, rural adults have consistently been among the groups most likely to express strong resistance to getting a COVID-19 vaccine. As of November, one in five of those living in rural areas (21%) and one in six suburban residents (16%) say they will “definitely not” get a COVID-19 vaccine, at least twice the share of urban residents who say the same (8%).

Rural and suburban residents also view vaccine safety slightly differently than their urban counterparts. While majorities across these three groups are confident the COVID-19 vaccines are safe for adults, smaller shares of rural residents (65%) and suburban residents (70%) believe this compared to urban residents (79%).

Rural Adults Are Twice As Likely To Say They “Definitely Won’t” Get Vaccinated As Those In Urban Areas

At least some of the differences in vaccination intention and uptake by community type may be due to underlying demographic and political differences between people living in different communities. Adults living in rural areas are more likely than those living in urban to identify as Republicans (33% vs. 16%), which might partially explain the differing vaccination intentions given that Republicans have been slower to embrace COVID-19 vaccines than Democrats. However, rural residents are also older on average than urban residents (33% vs. 17% are ages 65 and older), which would suggest potentially higher uptake in rural areas since older adults report getting vaccinated at higher rates than younger adults.

Multivariate analysis suggests that despite these differences between communities, there is a relationship between community type and COVID-19 vaccine uptake that exists even when controlling for partisanship and demographics. Using a statistical technique called logistic regression, we find that rural and suburban adults are less likely than urban adults to report being vaccinated for COVID-19, even after controlling for age, race, ethnicity, education, income, party identification, and ideology.

Booster Intentions

Despite significant differences in initial COVID-19 vaccination uptake between community types, there was no significant difference in uptake or intention for booster shots as of November, prior to news of the omicron variant. As recommendations for all adults to get boosted initially got made, fully vaccinated rural and suburban residents acted like their urban counterparts in terms of booster uptake, with 14% of all rural adults, 14% of all suburban adults, and 18% of all urban adults reporting having received a booster shot after being fully vaccinated, according to the November COVID-19 Vaccine Monitor.

Half of rural and suburban adults say they are vaccinated and either already have received a booster dose or plan to get one, compared to about six in ten (57%) of those living in urban areas.

COVID-19 Booster Uptake Steady Across Community Types, Despite Overall Vaccination Differences

Rural Parents Report Lower COVID-19 Vaccine Uptake Among Their Children Compared To Urban And Suburban Parents

Rural parents report lower intent to vaccinate both children 12-17 years old, who have been eligible for vaccinations for the past several months, as well as 5-11 year-olds who just became eligible last month, with about half of rural parents saying they will definitely not vaccinate their child in either age group, before news of the Omicron variant became widespread.

A quarter of rural parents (26%) say they have gotten their 12-17 year-old vaccinated, compared to nearly two-thirds of parents in urban areas (64%) and about half of those living in suburban areas (47%). About half of rural parents (53%) say they definitely won’t get their 12-17 year-old vaccinated, compared to 29% of suburban parents and 20% of urban parents.

A Quarter Of Rural Parents Say Their Teenager Is Vaccinated, Compared To More Suburban And Urban Parents

For children ages 5-11, one in ten rural parents and a similar share of suburban parents (14%) say their child has received at least one dose of a COVID-19 vaccine, compared to about a quarter (23%) of urban parents of children ages 5-11. An additional 12% of suburban parents say they will get their child 5-11 vaccinated right away, while about a third say they want to wait and see before they make that decision (36%). On the other hand, half (49%) of rural parents say they definitely won’t get their 5-11 year-old vaccinated compared to 22% of urban parents and 27% of suburban parents.

Half Of Rural Parents Of Children Ages 5-11 Say They Definitely Won't Get Child Vaccinated

It is notable that these differing intentions to vaccinate children for COVID-19 do not appear to reflect broader differences in attitudes towards vaccines generally between parents living in different types of communities. Nine in ten parents across community types (88% of urban parents, 90% of suburban parents, and 92% of rural parents) say they normally keep their children up to date with recommended childhood vaccines such as the MMR vaccine, while about one in ten in each type of community say they have ever delayed or skipped some childhood vaccines for their children.

There are not major differences in parents’ level of concern about their child getting sick from COVID-19 based on the type of community in which they live. Less than half of rural parents (44%) and suburban parents (46%) say they’re worried their child will get seriously sick from the coronavirus, as do 55% of urban parents.

Concerns ABOUT covid-19 vaccine SAFETY for children

Compared to their urban and suburban counterparts, rural parents are less likely to say they are confident that the COVID-19 vaccines are safe for children, which may be one driver of why they are more likely to say they won’t get their children vaccinated. About one-third (35%) of rural parents say they are very or somewhat confident the vaccines are safe for children ages 12-17, compared to 50% of suburban parents and 62% of urban parents. Around three in ten rural parents (29%) are confident that vaccines are safe for children between the ages of 5-11, compared to 43% of suburban and 50% of urban parents who say the same.

Urban Parents Are More Confident In Safety Of COVID-19 Vaccines Than Suburban Or Rural Parents

Rural parents also appear to be more concerned about the vaccine than the virus itself when it comes to their children. Six in ten rural parents think that getting vaccinated would be a bigger risk to their 12-17 year old teen’s health than getting COVID, even though scientific bodies have concluded the opposite is the case. Majorities of suburban and urban parents say they believe becoming infected poses a bigger risk to their 12-17 year-old. Similarly, about half (53%) of rural parents think the vaccine is a bigger risk to their 5-11 year-olds’ health than getting infected with COVID, compared to about half of suburban parents (52%) and nearly seven in ten urban parents (69%) who believe the virus poses a greater risk to their younger children than the vaccine.

Over Half Of Rural Parents Say Getting Their Child Vaccinated Against COVID-19 Is A Bigger Risk Than Getting Infected

While vaccine safety concerns are higher among rural parents compared to urban parents, the opposite is true when it comes to some concerns that might indicate an access barrier to getting their children vaccinated. Among parents of unvaccinated children, urban parents are more likely than rural parents to say they are concerned about needing to take time off work to get their child vaccinated (38% vs. 21%). Three in ten suburban parents are concerned about taking time off work to get their child vaccinated for COVID-19. Some parents across community types are also concerned about other access issues including not being able to get their child vaccinated from a place they trust (15% rural, 23% suburban, 24% urban) and having difficulty traveling to a place to get their child vaccinated (14% rural, 17% suburban, 21% urban).

More Urban Parents Of Unvaccinated Kids Than Rural Are Concerned About Taking Time Off Work To Get Their Child Vaccinated Or Deal With Side Effects

the role of pediatricians

Pediatricians are the top trusted source for information about the COVID-19 vaccines for children among parents across community types, with around three-quarters of each group saying they trust their child’s pediatricians a great deal or a fair amount. While majorities of urban and suburban parents also trust their local health department and the CDC, rural parents are somewhat less trusting of some of these sources (50% trust their local public health department and 45% trust the CDC). Fewer parents say they trust their child’s school or daycare or other parents they know for reliable information on the COVID-19 vaccine for children.

Pediatricians Are Top Trusted Source Of Child Vaccine Information For Parents Across Community Types

Similar shares of parents across community types say they have spoken to their child’s pediatrician about the COVID-19 vaccine, with more than half of parents saying they had not yet talked to a health care provider about the vaccine for their child as of mid-November. However, there are big divides between community types in terms of whether parents say their child’s pediatrician recommended their child get vaccinated or not. More than one-third of rural parents of both teens and younger children say their child’s health care provider did not recommend they get their child vaccinated.

Among rural parents of teenagers, 37% say they talked to their child’s health care provider about the vaccine and the provider did not recommend the vaccine for their teen, compared to 14% of suburban parents and 8% of urban parents who said the same. Similarly, 35% of rural parents of children ages 5-11 say they spoke to their child’s health care provider, and the health care provider did not recommend the vaccine for their younger child (compared to 13% suburban parents and 8% urban parents). By contrast, a larger share of parents living in urban areas compared to rural areas say their child’s health care provider recommended vaccination for both their 12-17 year-old (33% vs. 18%) and their 5-11 year-old (25% vs. 12%).

What is unclear from the survey data is whether parents who say their pediatrician did not recommend that their child get vaccinated for COVID-19 felt the provider was providing an active recommendation against vaccinating their child, or whether they did not provide a recommendation one way or the other. Either way, this differential communication from providers may be one contributing factor to the fact that rural parents appear less willing to get their child vaccinated than those living in urban and suburban settings.

Larger Shares Of Rural Parents Report Pediatrician Did Not Recommend COVID-19 Vaccine For Children

Survey findings also indicate that rural parents are more likely than urban or suburban parents to report having conversations with health care providers that made them less willing to vaccinate their child for COVID-19. Among rural parents of children ages 5-17, about equal shares report having conversations with their child’s health care provider that make them more willing (12%) and less willing (14%) to get their child vaccinated. For urban and suburban parents, conversations with their pediatricians were more like to make them more willing (14% suburban, 17% urban) than less willing (1% suburban, 2% urban) to get their child vaccinated. As of November, about one in five in each group say their conversation with a health care provider did not have an impact on their decision about vaccinating their child, while at least half say they did have not talked to their child’s pediatrician about the vaccine yet.

More Rural Parents Say Talking To Their Child's Pediatrician Made Them Less Willing To Get Them Vaccinated

THE ROLE OF SCHOOLS

Around half of all parents across community types say their child’s school has provided them with information on how to get a COVID-19 vaccine for their child. However, smaller shares of rural parents say their child’s school has encouraged them to get their child vaccinated (36%) compared to parents in urban areas (50%). This difference may play an important role in vaccine uptake for children across communities, as we have previously reported that parents whose children’s schools encouraged vaccination are more likely than those whose schools did not encourage vaccination to say their child was vaccinated for COVID-19.

One Third Of Rural Parents Say Their Child's School Has Encouraged Parents To Get Their Kid Vaccinated, Half Of Urban Parents Say The Same

Views Of Vaccine Mandates Across Communities

In addition to different attitudes towards the COVID-19 vaccines themselves, rural, suburban, and urban residents have different views on vaccine mandates in workplaces and in schools. A majority of urban residents support the federal government requiring large employers to either have their employees be vaccinated or get tested weekly, while rural and suburban communities are more divided on this Biden administration guideline. Six in ten urban residents (62%) say they support the requirement, while suburban and rural residents are split with about half supporting the requirement (47% and 46%, respectively) and opposing the requirement (51%, respectively).

Majority Of Urban Adults Support Vaccination Mandate On Larger Employers While Rural And Suburban Residents Are More Divided

While the federal mandate for large employers is stalled due to court challenges, many private businesses have already begun requiring their workers to get vaccinated. About a quarter of workers in rural areas and suburban areas say their employer has required them to get vaccinated for COVID-19, compared to one-third of urban workers (35%). Rural workers are the most likely to oppose their own employer instituting a mandate with 61% saying they do not want their employer to require them to get vaccinated, similar to the share of suburban workers (50%) and larger than the share of urban (41%) workers who say the same.

Six In Ten Rural Workers Don't Want Their Employer To Require COVID-19 Vaccination

In addition to differing views on vaccine workplace mandates, rural, suburban, and urban parents have differing views on whether schools should require all eligible students to be vaccinated for COVID-19. While majorities of parents of school aged children (ages 5-17) across community types say schools should not require all eligible students to be vaccinated for COVID-19, opposition is much stronger among parents living in rural areas (82%) and suburban areas (69%) compared to urban areas (57%).

Majorities Of Parents Say Schools Shouldn't Require Students To Get Vaccinated, With Eight In Ten Rural Parents Who Say So

Methodology

This poll finding draws from data from the November KFF COVID-19 Vaccine Monitor and the Winter 20201 Update On Parents' Views Of Vaccines For Kids, surveying 1,820 adults and 1,196 parents. The full methodologies are available at the links below:

https://www.kff.org/report-section/kff-covid-19-vaccine-monitor-november-2021-methodology/

https://www.kff.org/report-section/kff-covid-19-vaccine-monitor-winter-2021-update-on-parents-views-of-vaccines-for-kids-methodology/

GroupN (unweighted)M.O.S.E.
Rural adults259± 8 percentage points
Suburban adults854± 5 percentage points
Urban adults707± 5 percentage points
Rural parents168± 11 percentage points
Suburban parents587± 6 percentage points
Urban parents439± 7 percentage points
News Release

Omicron Variant Increases Worries and Gives Momentum to COVID-19 Booster Shots; May Motivate a Small Share of Unvaccinated Adults to Get an Initial Shot

1 in 4 Adults Do Not Know that Booster Shots are Recommended for All Adults After Six Months

Published: Dec 21, 2021

The emergence of the omicron COVID-19 variant is encouraging many already vaccinated adults to get a recommended booster shot but is providing only a little motivation for unvaccinated adults to get an initial shot, a new KFF COVID-19 Vaccine Monitor quick response survey finds.

Fielded from Dec. 15-20 to provide an early look at omicron’s potential impact on the public’s vaccination intentions, the survey finds that about half (54%) of vaccinated adults who haven’t gotten a booster dose say news of the omicron variant will make them more likely to do so.

Omicron’s emergence appears to be having a much smaller, but not insignificant, effect on unvaccinated adults. The survey finds that 12% of those who are unvaccinated say it makes them more likely to get an initial shot, but a much larger share (87%) say it does not make them more likely to do.

The public also appears to be increasingly concerned about getting seriously ill amid the omicron wave. The new survey shows that half (50%) of the public is now worried that they will get seriously sick from coronavirus, up from 30% in November’s full Vaccine Monitor report. Vaccinated adults are more likely than unvaccinated ones to worry about personally getting sick from COVID-19 (52% vs. 42%).

While about three-fourths (77%) of the public say they are aware that the Centers for Disease Control and Prevention (CDC) now recommends that all adults get a booster shot, almost one in four say that they are not sure (19%) or incorrectly believe that the CDC does not recommend booster shots for all adults (4%).

Among vaccinated adults, one in five (21%) are either unsure or incorrect about the CDC’s recommendation. About 3 in 10 Hispanic adults (31%), Black adults (28%), and those under age 30 (39%) are also unsure or incorrect.

When people who are unvaccinated were asked, what, if anything, could convince them to get a shot, about half (48%) say that nothing could. Other responses include if there was more research and transparency (12%), if it were required for work or otherwise became mandatory (6%), if they received a large sum of money to get the vaccine (5%), if their doctor recommended it (3%), or if the vaccine prevented 100% of all infections (3%).

Designed and analyzed by public opinion researchers at KFF, the KFF Vaccine Monitor: Early Omicron Update was conducted online and via phone from Dec. 15-20 among a nationally representative sample of 1,065 adults. Interviews were conducted in English and Spanish by phone (80) and online (985). The margin of sampling error is plus or minus 4 percentage points for the full sample. For results based on subgroups, the margin of sampling error may be higher.

The KFF COVID-19 Vaccine Monitor is an ongoing research project tracking the public’s attitudes and experiences with COVID-19 vaccinations. Using a combination of surveys and qualitative research, this project tracks the dynamic nature of public opinion as vaccine development and distribution unfold, including vaccine confidence and hesitancy, trusted messengers and messages, as well as the public’s experiences with vaccination.