Over 200,000 Residents and Staff in Long-Term Care Facilities Have Died From COVID-19

Published: Feb 3, 2022

More than 200,000 long-term care facility (LTCF) residents and staff have died due to COVID since the start of the pandemic (Figure 1). The CDC’s latest update reporting data on nursing home deaths as of January 30th pushes the reported number of deaths over this bleak milestone. This finding comes at a time when the national surge in cases due to the Omicron variant has started to subside, deaths are rising nationwide, and nursing homes have been working to increase vaccination and booster rates among residents and staff, particularly in light of the new federal rule requiring staff vaccination recently allowed to take effect by the Supreme Court. As of January 16th, approximately 82% of nursing home staff and 87% of nursing home residents are fully vaccinated.

This death count is based on state and federal data sources. For the period between March 2020 and June 2021, the total number of deaths is based on state-reported data on LTCFs, including nursing homes, assisted living, and group homes, that summed to 187,000 resident and staff deaths. For the subsequent period between July 2021 and January 2022, we incorporated data reported to the federal government by nursing facilities (excluding other types of LTCFs), adding another 14,000 resident and staff deaths to the total. The total number of resident and staff deaths from these two sources, roughly 201,000, is likely an undercount of the true number of resident and staff deaths in LTCFs since it excludes deaths in long-term care settings other than nursing homes after June 30th, 2021. Additionally, not all states reported data on all types of LTCFs prior to June 2021.

COVID-19 deaths in LTCFs make up at least 23% of all COVID-19 deaths in the US (Figure 1). This share has decreased since the start of the pandemic, when LTCF deaths were nearly half of all deaths nationally. This share has dropped over time for a number of reasons, including high rates of vaccination among residents, rising vaccination rates among staff, an increased emphasis on infection control procedures, declining nursing home occupancy, and the lack of data on deaths in assisted living and LTCFs other than nursing homes in recent months. Despite this drop as a share of total deaths, nursing homes have continued to experience disproportionately high case and death rates in the country during the recent surge. Higher case rates may be attributed to the highly transmissible nature of Omicron and the nature of congregate care settings. Higher death rates may be attributed to the high-risk status of those who reside in nursing homes.

Long-Term Care Facility Residents and Staff Account for More Than 201,000 COVID-19 Deaths, and At Least 23% of All COVID-19 Deaths in the U.S., As of 1/30/2022.

COVID-19 data that includes settings across the care continuum is essential to comprehensively assess the impact of COVID-19 on seniors and people with disabilities. To date, the federal government only requires data on COVID-19 cases, deaths, testing, and vaccinations from Medicare and Medicaid-certified nursing facilities. However, there is ample research suggesting that that LTSS users in congregate community based settings outside of nursing homes also face elevated risks of COVID-19 infection due to health conditions and the higher levels of infection transmission in some non-nursing facility congregate settings such as assisted living facilities and group homes. Nearly one million people live in assisted living facilities, a population roughly the size of the nursing home population, but one that lacks comparable data. The data gap for all settings across the care continuum makes it difficult to assess the full impact of the pandemic on seniors and people with disabilities residing outside of nursing homes. Additionally, the federal health care worker vaccine mandate does not apply to all settings across the care continuum, possibly leading to COVID-19 infections with resulting staff shortages in these settings.

Data is not available on the demographics of those who died in long-term care settings, making it difficult to understand the impact of race/ethnicity, age, vaccination status, and other key characteristics on infection severity or likelihood of mortality in LTCFs. While federally available data provides insight into the numbers of cases, deaths, and vaccinations as reported by nursing homes, gaps in data limit the ability to assess the impact more directly among residents and staff, by patient characteristics. Overall, cases and deaths in nursing homes appear to be declining. However, this analysis confirms the disproportionate toll of COVID-19 on people living and working in LTCFs and highlights the importance of comprehensive, timely, and accurate data.

‘In Focus with KFF’: A Look at the State of COVID-19 Vaccinations

Published: Feb 2, 2022

In these brief videos, KFF Director of Public Opinion and Survey Research Liz Hamel examines Vaccine Monitor data to show how uptake of COVID-19 vaccines has changed over time, including the latest push for booster shots. The videos are the latest in the In Focus with KFF series, which features insights from our experts on health care issues in the news.

How has the makeup of who is vaccinated changed over time?

What has convinced people who were initially hesitant to get a COVID-19 vaccine?

Who is likely to have received a COVID-19 booster dose?

News Release

Vaccine Monitor: 6 in 10 Parents of Teens and One-Third of Parents of 5-11 Year-Olds Say Their Child is Vaccinated for COVID-19, Both Up Since November

Published: Feb 1, 2022

3 in 10 of Those with Children Under 5 Expect to Get Them a Shot Right Away Once Eligible

1 in 4 Parents Say Their Student Had to Quarantine in January Due to COVID-19 Infection or Exposure; Overall 4 in 10 Report Some Education Disruption

Growing shares of parents say that their eligible children have gotten at least one dose of a COVID-19 vaccine, and three in ten parents with children under age 5 say they want to get their child vaccinated immediately once they become eligible, a new KFF COVID-19 Vaccine Monitor report shows.

Among parents with children ages 12-17, 61% now say that their child is vaccinated, up from 49% in November. Another 3% now say they plan to get their child vaccinated as soon as possible, and 6% say they want to “wait and see” how it works for others before doing so. Nearly a quarter (23%) of parents with adolescent children say they definitely will not get them vaccinated, while a small share (4%) say they will only do so if it is required for school.

Adolescents and teenagers in this age group are also encouraged to get a booster shot six months after their initial vaccination. One in five (21%) parents with vaccinated children in that age range say their child has already received a booster, while most others say they definitely (41%) or probably (24%) will get them a booster shot.

Among parents of children ages 5-11, who became eligible for a COVID-19 vaccine in early November, a third (33%) say their child is now vaccinated, twice the share that said so in November (16%). In addition, 13% now say they want to get their child vaccinated “right away”, and 19% say they want to “wait and see” before doing so. Others are more resistant, with a quarter (24%) saying they “definitely will not” get their child vaccinated and 9% saying they would “only do so if required for school.

While children under age 5 are not yet eligible to receive any COVID-19 vaccine, three in ten (31%) parents of children that age say they would get their child vaccinated “right away” when able. A similar share says they would want to “wait and see” how it works for other young children first, while a quarter (26%) say they would “definitely not,” and 12% say they would do so “only if required.

Since schools reopened in January after the holidays, more than a quarter (27%) of parents say their child has had to quarantine at home because they tested positive for COVID-19 or were exposed to someone who tested positive, the new Vaccine Monitor survey finds.

In addition, one in five parents (20%) say their school shut down in-person classes or switched to virtually learning at some point in January, and 14% say they kept their child home from school because of the risks of getting COVID-19.

Combined, 41% of parents report at least one of those three types of disruption with their child’s education. This includes half (49%) of Black and Hispanic parents, who are much more likely than White parents to say they kept a child home from school because of the COVID-19 risks (28% and 7%, respectively).

Overall half (50%) say they are worried their child will get seriously ill from COVID-19, including a quarter (25%) who say they are “very worried.” Black and Hispanic parents are also much more likely to be worried about this than White parents (70% and 39%, respectively).

Other findings include:

  • About one in seven (14%) parents of unvaccinated children ages 5-17 say that news about the omicron variant makes them more likely to get their vaccinated, while a large majority (79%) say that it makes no difference.
  • 3 in 10 (30%) parents of children enrolled in school say their child’s school provided COVID-19 tests for students to take either in person or at home before returning to school after the winter holidays. In addition, about 4 in 10 (39%) parents of children enrolled in school say they tried to purchase an at-home test kit in the past month.

Designed and analyzed by public opinion researchers at KFF, the KFF Vaccine Monitor survey was conducted from January 11-23, 2022 among a nationally representative random digit dial telephone sample of 1,536 adults, including 420 parents or guardians of children under 18. Interviews were conducted in English and Spanish by landline (165) and cell phone (1,371). The margin of sampling error is plus or minus 3 percentage points for the full sample, and plus or minus 6 percentage points for parents of children under 18. For results based on subgroups, the margin of sampling error may be higher.

The KFF COVID-19 Vaccine Monitor is an ongoing research project tracking the public’s attitudes and experiences with COVID-19 vaccinations. Using a combination of surveys and qualitative research, this project tracks the dynamic nature of public opinion as vaccine development and distribution unfold, including vaccine confidence and acceptance, information needs, trusted messengers and messages, as well as the public’s experiences with vaccination.

Poll Finding

KFF COVID-19 Vaccine Monitor: January 2022 Parents And Kids Update

Authors: Liz Hamel, Grace Sparks, Lunna Lopes, Mellisha Stokes, and Mollyann Brodie
Published: Feb 1, 2022

Findings

The KFF COVID-19 Vaccine Monitor is an ongoing research project tracking the public’s attitudes and experiences with COVID-19 vaccinations. Using a combination of surveys and qualitative research, this project tracks the dynamic nature of public opinion as vaccine development and distribution unfold, including vaccine confidence and acceptance, information needs, trusted messengers and messages, as well as the public’s experiences with vaccination.

Key Findings

  • In the midst of the latest surge of the omicron COVID-19 variant, the share of parents who say their child has gotten at least one shot of a COVID-19 vaccine increased between November and January. Six in ten parents of 12-17 year-olds now say their child has received at least one shot (61%, up from 49% in November), as do one-third of parents of 5-11 year-olds (33%, up from 16% in November). Three in ten parents of children under 5 say they’ll get their child vaccinated right away once a vaccine is approved for their age group, up somewhat from one in five in July.
  • One in five (21%) parents of vaccinated teens say their child has already received a COVID-19 booster, and around two-thirds (65%) say they will “definitely” or “probably get” one. Just one in seven parents of vaccinated 12-17 year-olds say their teen “probably” or “definitely won’t” get the booster (14%).
  • Half of parents report being worried about their child becoming seriously sick from the coronavirus, including substantially higher shares among parents who are Black or Hispanic and those with lower incomes.
  • Four in ten parents of school-age children report some type of disruption to their child’s in-person learning in the first month of the year, including needing to quarantine, schools shutting down in-person classes, or parents choosing to keep children home due to safety concerns. Most (63%) say their child’s school did not provide access to COVID-19 testing before returning to classes in January.

Parents’ Intentions Regarding COVID-19 Vaccines For Children

The latest KFF COVID-19 Vaccine Monitor reports an uptick this month in the share of parents who says their child is or will be vaccinated for COVID-19, across child age groups.

After holding fairly steady for several months, the share of parents who say their 12-17 year-old has gotten at least one shot of a COVID-19 vaccine increased, from 49% in November to 61% in January. At the same time, the share of parents who say they want to “wait and see” before getting their teen vaccinated fell to a new low of 6%. One-quarter (23%) of parents still say they will “definitely not” get their 12-17 year-old vaccinated for COVID-19, while a further 4% say they will only get their teen vaccinated if they are required to do so for school.

Increase In Parents Reporting Their 12-17 Year Old Has Gotten Vaccinated Since November

The CDC recently expanded eligibility of COVID-19 Pfizer-BioNTech booster doses to those ages 12-17, and 21% of parents of vaccinated 12-17 year-olds report their teenager has already received the booster shot. Around two-thirds of parents say their vaccinated teenager will “definitely” or “probably get” their booster shot (65%), with a much small number saying they “probably” or “definitely won’t” get the booster (14%).

One In Five Parents Report Their Vaccinated Teenager Has Already Gotten A Booster COVID-19 Vaccine Dose, With Majority Saying They Will Get It

COVID-19 vaccine uptake also appears to have increased for younger children over the past two months, though remaining much lower than among teens. One-third of parents of 5-11 year-olds now say their child is vaccinated (33%), double the share of parents who said so in November (16%). The biggest change comes in the share who say they will “wait and see” before getting their child vaccinated, decreasing from 32% in November to 19% now. Another 13% say they’ll get their 5-11 year-old vaccinated right away, while 24% will “definitely not” get them vaccinated, and 9% will only do it if required.

Double The Share Of Parents Of Children Ages 5-11 Say Their Child Has Been Vaccinated Since November, With Decreases In "Wait And See" Group

Despite many parents being worried about their child getting sick from COVID-19, 79% of parents of unvaccinated children ages 5-17 say news of the Omicron variant doesn’t make a difference in the likelihood that they’ll get their child vaccinated. Around one in seven (14%) parents of unvaccinated kids say the news makes them “more likely” to get their child vaccinated and 6% say it makes them “less likely.”

Three Quarters Of Parents Of Unvaccinated Kids Say Omicron COVID-19 Variant Doesn't Make A Difference In Likelihood Of Vaccinating Their Child

While there is not yet a COVID-19 vaccine authorized for use in children under the age of five, 31% of parents of children in this age range say they’ll get their child vaccinated right away when a vaccine  is authorized, up from 20% last July. Another 29% say they will “wait and see” before getting their child under 5 vaccinated, down from 40% in July. Around one in ten parents say they’ll vaccinate their child under five “only if required” (12%), while a quarter (26%) say they will “definitely not” vaccinate their young child.

Three In Ten Parents Say They'll Get Their Child Under The Age Of Five Vaccinated ASAP When A COVID-19 Vaccine Is Authorized For Their Age Group

Parents’ Concerns And Experiences As Children Returned To School

With children going back to school in January, many after travel and holiday gatherings amid the omicron surge, many parents report concerns about illness, exposures, and shutdowns.

Half of parents report being worried that their child will become seriously sick from the coronavirus, with 25% saying they are “very worried.” Despite the omicron surge, this level of worry is similar to the level of worry parents reported in October (when 24% said they were very worried and 21% somewhat worried). Significantly more parents who have a household income of less than $75,000 a year are worried about serious illness (65%) than those who earn $75,000 or more (37%). Similarly, parents who are Hispanic or Black are more likely than White parents to say they are worried about their child getting seriously ill  (70% vs. 39%). Echoing differing level of personal worries among adults by vaccination status, 57% of vaccinated parents are worried about their kid becoming seriously sick, compared to 32% of unvaccinated parents.

Half Of Parents Are Worried About Their Child Getting Seriously Sick From COVID-19, Significantly More Among Lower Income, Vaccinated, And Hispanic Parents

Many parents of school-aged children say their child has experienced some disruption in their schooling during January, including having to quarantine, having the school shut down or move to online learning, or parents choosing to keep their child home due to COVID-19 concerns.

Since returning to school in January, a quarter of parents (27%) report that their child has had to quarantine at home because they tested positive or were exposed to someone who tested positive for COVID-19. Another one in five say their child’s school shut down in-person classes or switched to virtual learning because of COVID-19, and 14% say they’ve kept their child home from school because they were worried about their risk of getting COVID-19. Overall, 41% of parents say at least one of these disruptions has happened in January.

Notably, four times the share of parents who are Black or Hispanic (28%) say they’ve kept a child home from school because of concerns about their COVID-19 risk, compared to 7% of White parents.

Over A Quarter Of Parents Have Had To Quarantine Their Child Because Of COVID-19 Exposure Or Had Their Child's School Shut Down In-Person Classes

With many adults across the U.S. reporting difficulty finding tests over the past month, access to COVID-19 testing is also an issue for parents and children. Notably, 39% of parents of school-age children say they tried to purchase an at-home test kit in the past month compared to 24% of adults without children. Around two-thirds of parents who tried to purchase an at-home testing kit had difficulty doing so (64%).

While three in ten parents of children who attend school say their child’s school provided access to in-person or at-home testing before returning to school in January, the majority (63%) say the school did not provide either before returning to school in January.

Around A Quarter Of Parents Say Their Kids Schools Provided Them With COVID-19 Tests Before Returning In January

Methodology

This KFF COVID-19 Vaccine Monitor was designed and analyzed by public opinion researchers at the Kaiser Family Foundation (KFF). The survey was conducted January 11-23, 2022, among a nationally representative random digit dial telephone sample of 1,536 adults ages 18 and older (including interviews from 327 Hispanic adults and 303 non-Hispanic Black adults), living in the United States, including Alaska and Hawaii (note: persons without a telephone could not be included in the random selection process). Phone numbers used for this study were randomly generated from cell phone and landline sampling frames, with an overlapping frame design, and disproportionate stratification aimed at reaching Hispanic and non-Hispanic Black respondents as well as those living in areas with high rates of COVID-19 vaccine hesitancy. Stratification was based on incidence of the race/ethnicity subgroups and vaccine hesitancy within each frame. High hesitancy was defined as living in the top 25% of counties as far as the share of the population not intending to get vaccinated based on the U.S. Census Bureau’s Household Pulse Survey.  The sample also included 98 respondents reached by calling back respondents that had previously completed an interview on the KFF Tracking poll six months ago or more. Another 82 interviews were completed with respondents who had previously completed an interview on the SSRS Omnibus poll (and other RDD polls) and identified as Hispanic (n=33; including 12 in Spanish) or non-Hispanic Black (n=49). Computer-assisted telephone interviews conducted by landline (165) and cell phone (1,371; including 1,070 who had no landline telephone) were carried out in English and Spanish by SSRS of Glen Mills, PA. To efficiently obtain a sample of lower-income and non-White respondents, the sample also included an oversample of prepaid (pay-as-you-go) telephone numbers (25% of the cell phone sample consisted of prepaid numbers) Both the random digit dial landline and cell phone samples were provided by Marketing Systems Group (MSG). For the landline sample, respondents were selected by asking for the youngest adult male or female currently at home based on a random rotation. If no one of that gender was available, interviewers asked to speak with the youngest adult of the opposite gender. For the cell phone sample, interviews were conducted with the adult who answered the phone. KFF paid for all costs associated with the survey.

The combined landline and cell phone sample was weighted to balance the sample demographics to match estimates for the national population using data from the March 2021 U.S. Current Population Survey (CPS) on sex, age, education, race, Hispanic origin, region, and marital status, within race-groups, along with data from the 2010 Census on population density. The sample was also weighted to match current patterns of telephone use using data from the January-June 2021 National Health Interview Survey. The sample is also weighted to account for the possibility of partisan nonresponse based on three months of KFF national polls and this current survey. The weight takes into account the fact that respondents with both a landline and cell phone have a higher probability of selection in the combined sample and also adjusts for the household size for the landline sample, and design modifications, namely, the oversampling of potentially undocumented respondents and of prepaid cell phone numbers, as well as the likelihood of non-response for the recontacted sample. All statistical tests of significance account for the effect of weighting.

The margin of sampling error including the design effect for the full sample is plus or minus 3 percentage points. Numbers of respondents and margins of sampling error for key subgroups are shown in the table below. For results based on other subgroups, the margin of sampling error may be higher. Sample sizes and margins of sampling error for other subgroups are available by request. Sampling error is only one of many potential sources of error and there may be other unmeasured error in this or any other public opinion poll. Kaiser Family Foundation public opinion and survey research is a charter member of the Transparency Initiative of the American Association for Public Opinion Research.

This work was supported in part by grants from the Chan Zuckerberg Initiative DAF (an advised fund of Silicon Valley Community Foundation), the Ford Foundation, and the Molina Family Foundation. We value our funders. KFF maintains full editorial control over all of its policy analysis, polling, and journalism activities.

GroupN (unweighted)M.O.S.E.
Total Parents420± 6 percentage points
Child Age Groups
Has child/children ages 12-17232± 8 percentage points
Has child/children ages 5-11212± 9 percentage points
Has child/children under the age of 5162± 10 percentage points


Community Health Centers Are A Key Source of COVID-19 Rapid At-Home Self-Tests For Hard-To-Reach Groups

Authors: Bradley Corallo and Jennifer Tolbert
Published: Jan 31, 2022

Across the country, many Americans are having difficulty accessing COVID-19 tests amid the ongoing surge in cases driven by the new Omicron variant. The Biden administration has taken a multi-pronged approach to increase access to COVID-19 tests that includes allowing every household to order up to four free at-home tests, increasing testing in schools, expanding the number of federal testing sites, and requiring private insurers to cover the costs of at-home tests. In addition, under the American Rescue Plan Act (ARPA), state Medicaid and Children’s Health Insurance Program (CHIP) programs are required to cover FDA-authorized at-home COVID-19 tests without cost-sharing. As part of an effort to promote equitable access to tests, the administration also launched a testing supply program in late December that has set aside 25 million rapid at-home self-test kits (or 50 million tests because there are two tests per kit) for distribution by the more than 1,300 community health centers.

Health centers are a national network of safety-net primary care providers that have played a significant role in the COVID-19 response, including facilitating equitable access to vaccinations. To date, health centers have administered nearly 19 million doses of the vaccine, of which more than two-thirds (68%) have gone to people of color. While health centers make up a relatively small proportion (4%) of total vaccinations administered nationally (roughly 530 million doses administered as of mid-January), health centers’ role has focused on vaccinating and providing primary care to some of the hardest-to-reach populations.

Like the vaccine program, the objective of the health center COVID-19 testing supply program is to provide COVID-19 rapid self-tests to communities that are currently facing difficulties accessing COVID-19 tests. Under the program, health centers will be distributing self-tests to patients and community members, with a focus on populations at greatest risk from adverse outcomes related to COVID-19. While the 25 million test kits set aside by the administration for the program is notably less than 28.6 million patients served by health centers in 2020, the federal government expects the number of test kits for the program to last through May 2022. The self-tests provided through the new federal program should supplement other testing services that health centers have been providing throughout the pandemic. Beyond the supply of free self-tests available through the new program, health center patients with Medicaid, CHIP, or other coverage may have other options to access these free tests through pharmacies or other sources and health centers may be able to seek reimbursement from public and private payers, including Medicaid/CHIP reimbursement, for self-tests ordered for patients covered by these programs depending on state rules.

Data collected through a biweekly survey conducted by the Health Resources and Services Administration (HRSA) show that health center patient demand for COVID-19 tests has increased recently (as it has across the US). In the two weeks ending January 14, 2022, health centers reported administering an average of 794 PCR and antigen tests per responding health center, more than double the number reported in the December 17, 2021 survey. Notably, roughly two-thirds (64%) of tests were provided to people of color. These data indicate that supplying health centers with self-test kits should further increase access to testing in underserved communities during the current period of high demand.

HSRA’s most recent biweekly survey also shows how health centers are distributing the self-test kits through the federal partnership program as of early January. In the two weeks ending January 14, 27% of responding health centers reported distributing 1.08 million kits to community members (or roughly 2 million tests because each kit includes two tests). That number is expected to increase as more health centers register for the program and begin placing orders. Health centers also reported that they distributed the self-tests in a variety of ways (Figure 1). Most reported passing out the test kits to existing health center patients (83%) or to others in the community who came to the health center (61%). Roughly one-third (32%) of health centers reported distributing tests through direct outreach to underserved populations, such as individuals experiencing homelessness, migrant farmworkers, and low-income populations.

How Health Centers Are Providing Tests As Part Of The Health Center COVID-19 Testing Supply Program

Looking ahead, health centers are expected to participate in other efforts to slow the spread and lessen the severity of COVID-19 disease. HRSA has begun the initial phase for a separate program that supplies health centers with oral antiviral pills to treat patients who recently tested positive for COVID-19 to lower their risk of more serious illness. The initial phase of this program includes 200 health centers; HRSA will include more participants as supply of the antivirals increases. In the most recent biweekly survey of health centers (as of January 14), 59 health centers had begun distributing antiviral pills through the new program, a number that we expect will grow as the program ramps up. In addition to supplying self-tests and antiviral pills, the administration recently began distributing N95 masks through community health centers alongside retail pharmacies, another program that should be ramping up in coming weeks.

Health centers are growing their role in the nation’s pandemic response efforts (in addition to state and local efforts) and have been important players in coordinating response efforts quickly and more equitably. Taken together, health centers’ federal partnership programs to administer vaccinations, distribute self-test kits, provide free N95 masks (in the coming weeks), and eventually prescribe and distribute oral antivirals should strengthen health centers’ ability to help prevent, detect, and treat COVID-19 in underserved communities.

Marketplace Sign-ups Increased by 21% in 2022

Authors: Krutika Amin and Jason Millman
Published: Jan 28, 2022

The Biden Administration announced 14.5 million people have signed up for Affordable Care Act Marketplace coverage for 2022. This represents a 21% increase in Marketplace sign-ups over last year. Three states (Massachusetts, Kentucky, and Hawaii) and Washington, DC, saw enrollment decrease from 2021 to 2022. The remaining 47 states saw Marketplace enrollment increase, ranging from 1% in Rhode Island to 42% in Texas. In 20 states, enrollment increased by more than 20%.

In terms of numbers of people, Florida saw the biggest increase with 603,000 more sign-ups than last year. That was followed by Texas (549,000) Georgia (184,000), California (156,000), and North Carolina (134,000). In the places where enrollment shrunk, sign-ups decreased by 31,000 in Massachusetts, followed by Kentucky (-4,000), Washington, DC (-1,000), and Hawaii (less than 600).

The increase in Marketplace enrollment is due to expanded premium subsidies for 2021 and 2022 passed through the American Rescue Plan Act (ARPA), and increased efforts to enroll eligible people. ARPA increased premium subsidies for eligible enrollees and made premium subsidies available to middle-income enrollees to purchase coverage through Marketplaces. Additionally, the Biden Administration increased marketing and outreach efforts, including by increasing navigator funding and extending open enrollment by 30 days.

Of note, the reported enrollment is based on the number of people who signed up for coverage on state and federal Marketplaces through January 15, 2022. Open enrollment is ongoing beyond January 15 in some state Marketplaces (including California, Kentucky, Maryland, New Jersey, New York, Rhode Island, and DC). Colorado, Maryland, New York, and DC have also established special enrollment periods for the COVID-19 pandemic that allow uninsured people to buy coverage outside of the open enrollment period. Therefore, final Marketplace sign-ups for 2022 may be higher.

News Release

42% of Adults, and 70% of Those Likely Booster-Eligible, Now Say They’ve Gotten a COVID-19 Booster Shot; The Share Who Received At Least One Dose Inches Up to 77% in Omicron’s Wake

Published: Jan 28, 2022

6 in 10 Who Tried to Purchase an At-Home Test and a Third Who Sought an In-Person Test Say It Was Difficult to Find, Though Most Were Eventually Able to Get a Test

Black and Hispanic Adults are More Likely Than White Adults to Worry About Omicron’s Effects, Including Becoming Seriously Ill or Missing Work Due to Infection

The latest KFF COVID-19 Vaccine Monitor report shows that 42% of all adults nationwide have received a COVID-19 booster and more than three quarters (77%) have received at least one dose of a COVID-19 vaccine, up slightly since November (73%) before the omicron variant triggered a surge in cases, hospitalizations and deaths.

The small shift comes after vaccination rates stagnated in the fall but leaves relatively few unvaccinated adults who are open to getting a shot. Just 1% plan to do so right away, 4% want to wait and see how it works for others, and 3% who say they would only do so if required for work, school or other activities. About 1 in 7 adults (14%) say they “definitely will not” get a vaccine, a share that is largely unchanged since December 2020.

The survey also finds most vaccinated people are getting recommended booster shots. Overall, 42% of the public (and 55% of all vaccinated adults) say they’ve received a booster dose.

Mirroring their early uptake of the initial vaccine, two thirds (66%) of all adults ages 65 and older and half (50%) of adults ages 50-64 received a booster. Similarly, Democrats (62%) are more likely than independents (37%) and Republicans (32%) to have received a booster.

Among the population likely to be booster-eligible (those who either received a booster or completed a full initial course of vaccination at least 6 months ago), 7 in 10 (70%) have gotten a booster. This rises to 86% among those ages 65 and over and 77% among those ages 50-64 who are likely booster-eligible.

Across racial and ethnic groups, White adults (46%) are more likely than Black (31%) and Hispanic (37%) adults to have received a booster. This may at least partially reflect some Black and Hispanic adults not yet being eligible for a booster if their initial course of vaccination was completed recently. However, there is evidence that booster uptake and access may be lagging among the booster-eligible population of Black adults. Among the likely booster-eligible population, 57% of Black adults compared with 69% of Hispanic adults and 72% of White adults have gotten a booster.

Amid the Omicron Surge, Many Report Challenges to Accessing COVID-19 Tests

With COVID-19 cases surging to unprecedented levels, nearly half (48%) of adults say that in the past month they tried to get either an in-person COVID-19 test (33%) and/or an at-home test (28%).

Fielded as the Biden administration began to encourage more widespread testing and put forward policies to improve access, the report highlights people’s struggles to obtain tests when needed.

While most (65%) who tried to find an in-person test in the past month say it was easy to do, a third (35%) say it was difficult. Rapid at-home tests presented even more of a challenge, with most (62%) who tried to get one saying it was difficult and a little more than a third (38%) saying it was easy.

Importantly, the vast majority (89%) of those who attempted to get an in-person COVID-19 test in the past month say they were able to get one. Still 11% of those who tried to get such a test (4% of all adults) say they were unable to get an in-person test, and 23% (7% of all adults) say they had to wait two days or more to be tested.

One-third of those who tried to get an at-home test (9% of all adults) say they were unable to get one, mainly because tests were not available rather than being too expensive (91% vs. 2% among those who tried but could not get an at-home test).

When asked who is responsible for the limited availability of COVID-19 tests, about half say the U.S. Food and Drug Administration (FDA) deserves at least a fair amount of blame. Slightly fewer think President Biden (44%) or test manufacturers (41%) deserve at least a fair amount of blame. The survey was in the field when President Biden announced that people could begin to order free at-home tests on January 19.

Black and Hispanics Adults Are More Worried than White Adults About Omicron’s Impact on Them

About 4 in 10 adults (42%) say they are at least somewhat worried about getting the omicron variant, though fewer worry about having to miss work (36%), becoming serious ill (34%), or being hospitalized (27%) as a result of a coronavirus infection.

Black and Hispanic adults, as well as people with lower incomes, are more likely to worry about each of these. For example, most Hispanic (59%) and Black (54%) adults say they are worried about becoming infected with the omicron variant, while about a third (35%) of White adults are. Similarly, Hispanic (57%) and Black (43%) adults are much more likely than White (27%) adults to say they are worried about missing work due to an infection.

Two Years into the Pandemic, Most of the Public is Tired and Frustrated

Two years into the pandemic, three quarters of the public say they are both tired (75%) and frustrated (73%) by the state of the pandemic, with more than 7 in 10 Democrats, Republicans and independents reporting these emotions. Fewer people say they are optimistic (42%), angry (40%) or confused (29%). 

In addition, a large majority (77%) also says it is inevitable that most people across the country will get COVID-19 eventually. This includes similar shares among those who are vaccinated (77%) and those who are not (74%), as well as among Democrats (74%), independents (78%) and Republicans (78%). 

Despite widespread reports of vaccinated people testing positive for the omicron variant, a substantial majority (62%) say they believe the vaccines are working because “most vaccinated people who become infected with COVID-19 do not require hospitalization.”

Far fewer (34%) say the vaccines are not working because “some vaccinated people are becoming infected.” The share who see these breakthrough infections as a sign the vaccines are not working has increased slightly since September (26%), driven by shifts among Republicans and unvaccinated adults. 

A third (34%) of the public currently views the pandemic as the country’s biggest problem, slightly more than the share who say rising prices due to inflation (28%) is the biggest problem. Fewer identify climate change (9%), racial inequality (8%) crime (6%) or shortages due to supply-chain issues (5%). 

Partisans rank these problems differently, with three times as many Republicans (44%) as Democrats (13%) saying inflation is the nation’s biggest problem, and more than twice as many Democrats (51%) as Republicans (19%) saying the pandemic is. Roughly equal shares of independents name inflation (30%) and the pandemic (28%) as the nation’s biggest problem.

Other highlights include:

  • Nearly a quarter (23%) of adults nationwide say they’ve personally tested positive for COVID-19 at some point during the pandemic, including 8% who say they’ve tested positive in the past month. Among those who tested positive in the past month, 16% (representing 1% of all adults) say they used only an at-home test, indicating the result is unlikely to be captured on official case counts.
  • About 1 in 5 adults (19%) say they’ve personally had difficulty in the past few months figuring out whether they needed to isolate or limit their normal activities either after being exposed to COVID-19, receiving a positive test result, or experiencing symptoms. Most (58%) say federal public health authorities’ guidelines for testing and isolation are confusing.
  • Most of the public says that COVID-19 vaccinations should be required for people traveling on airplanes internationally (62%) and domestically (55%). Majorities of Democrats and independents support such requirements, though most Republicans do not.
  • About 7 in 10 (71%) adults say they worry that restrictions aimed at stopping the spread of omicron will hurt local businesses in their area. Majorities across partisans express worry about the impact of restrictions on local businesses.

Designed and analyzed by public opinion researchers at KFF, the KFF Vaccine Monitor survey was conducted from January 11-23, 2022 among a nationally representative random digit dial telephone sample of 1,536 adults. Interviews were conducted in English and Spanish by landline (165) and cell phone (1,371). The margin of sampling error is plus or minus 3 percentage points for the full sample. For results based on subgroups, the margin of sampling error may be higher.

The KFF COVID-19 Vaccine Monitor is an ongoing research project tracking the public’s attitudes and experiences with COVID-19 vaccinations. Using a combination of surveys and qualitative research, this project tracks the dynamic nature of public opinion as vaccine development and distribution unfold, including vaccine confidence and hesitancy, trusted messengers and messages, as well as the public’s experiences with vaccination.

Poll Finding

KFF COVID-19 Vaccine Monitor: January 2022

Published: Jan 28, 2022

Findings

The KFF COVID-19 Vaccine Monitor is an ongoing research project tracking the public’s attitudes and experiences with COVID-19 vaccinations. Using a combination of surveys and qualitative research, this project tracks the dynamic nature of public opinion as vaccine development and distribution unfold, including vaccine confidence and acceptance, information needs, trusted messengers and messages, as well as the public’s experiences with vaccination.

Key Findings

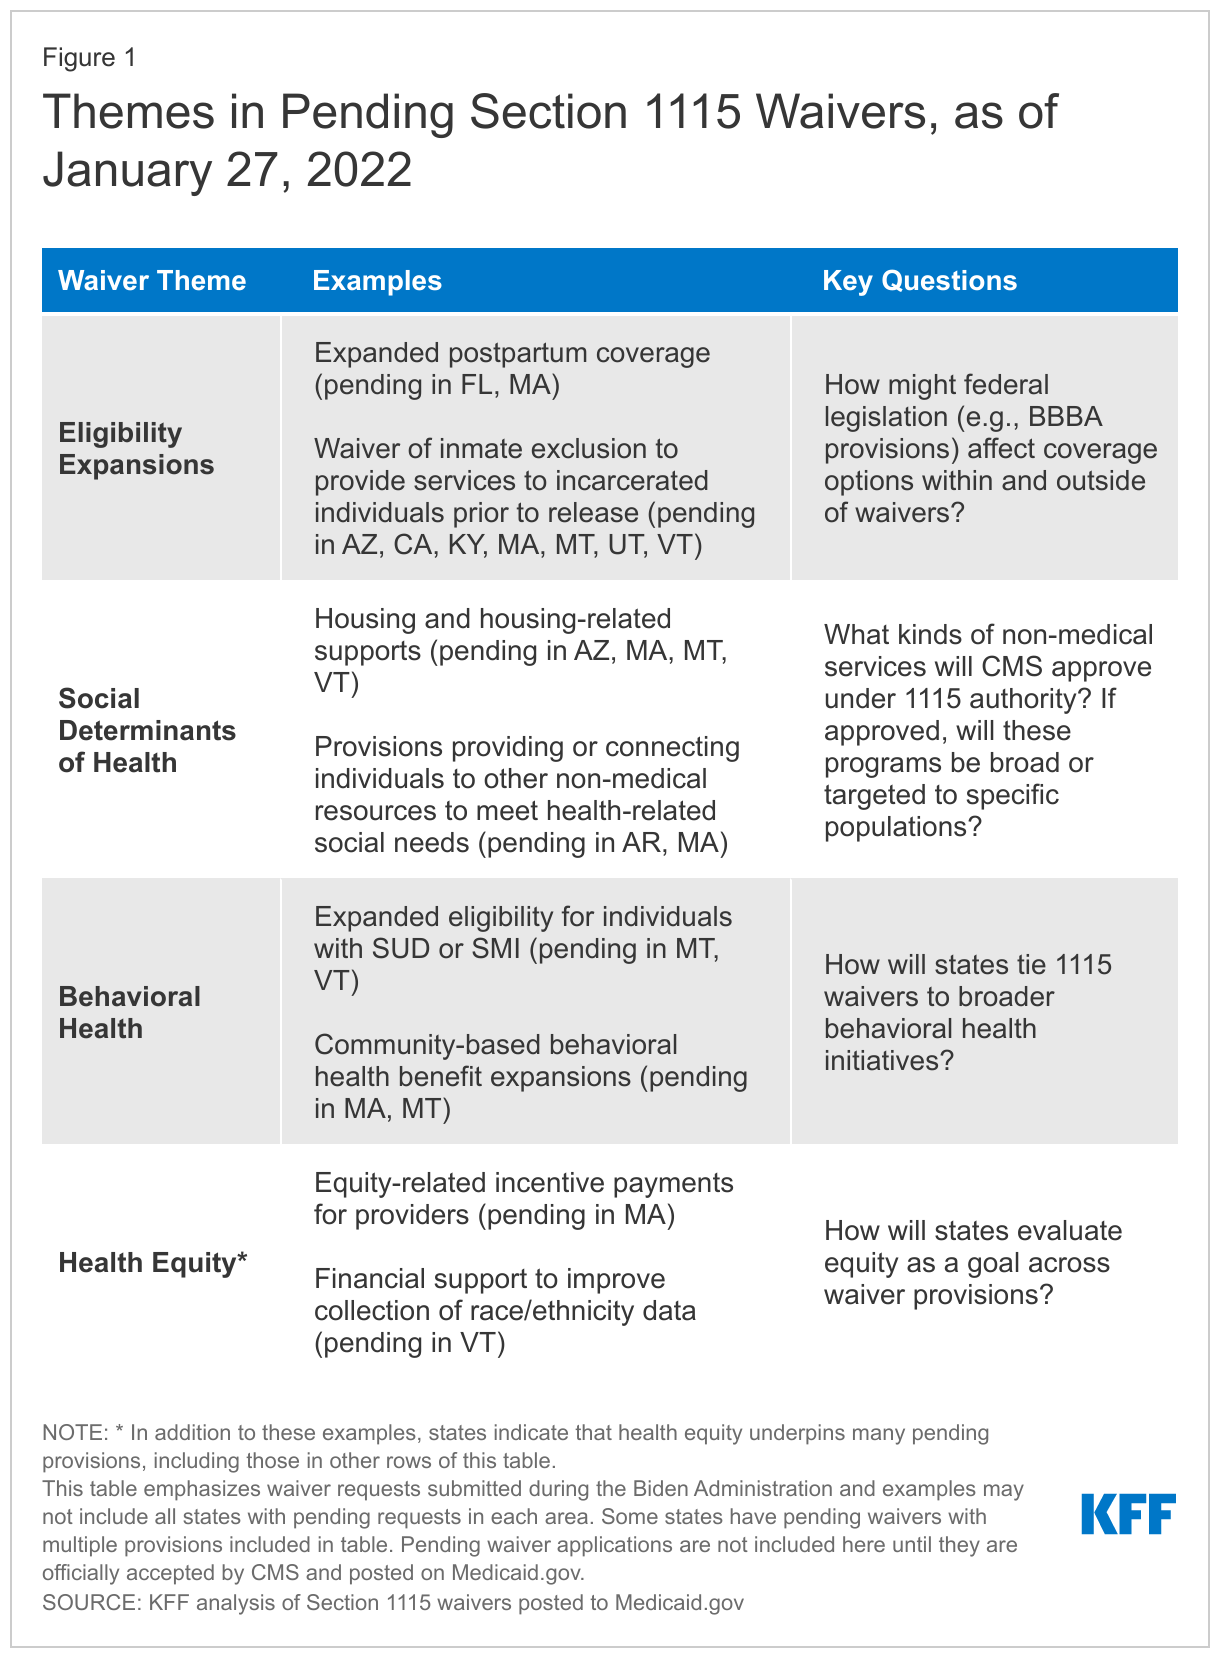
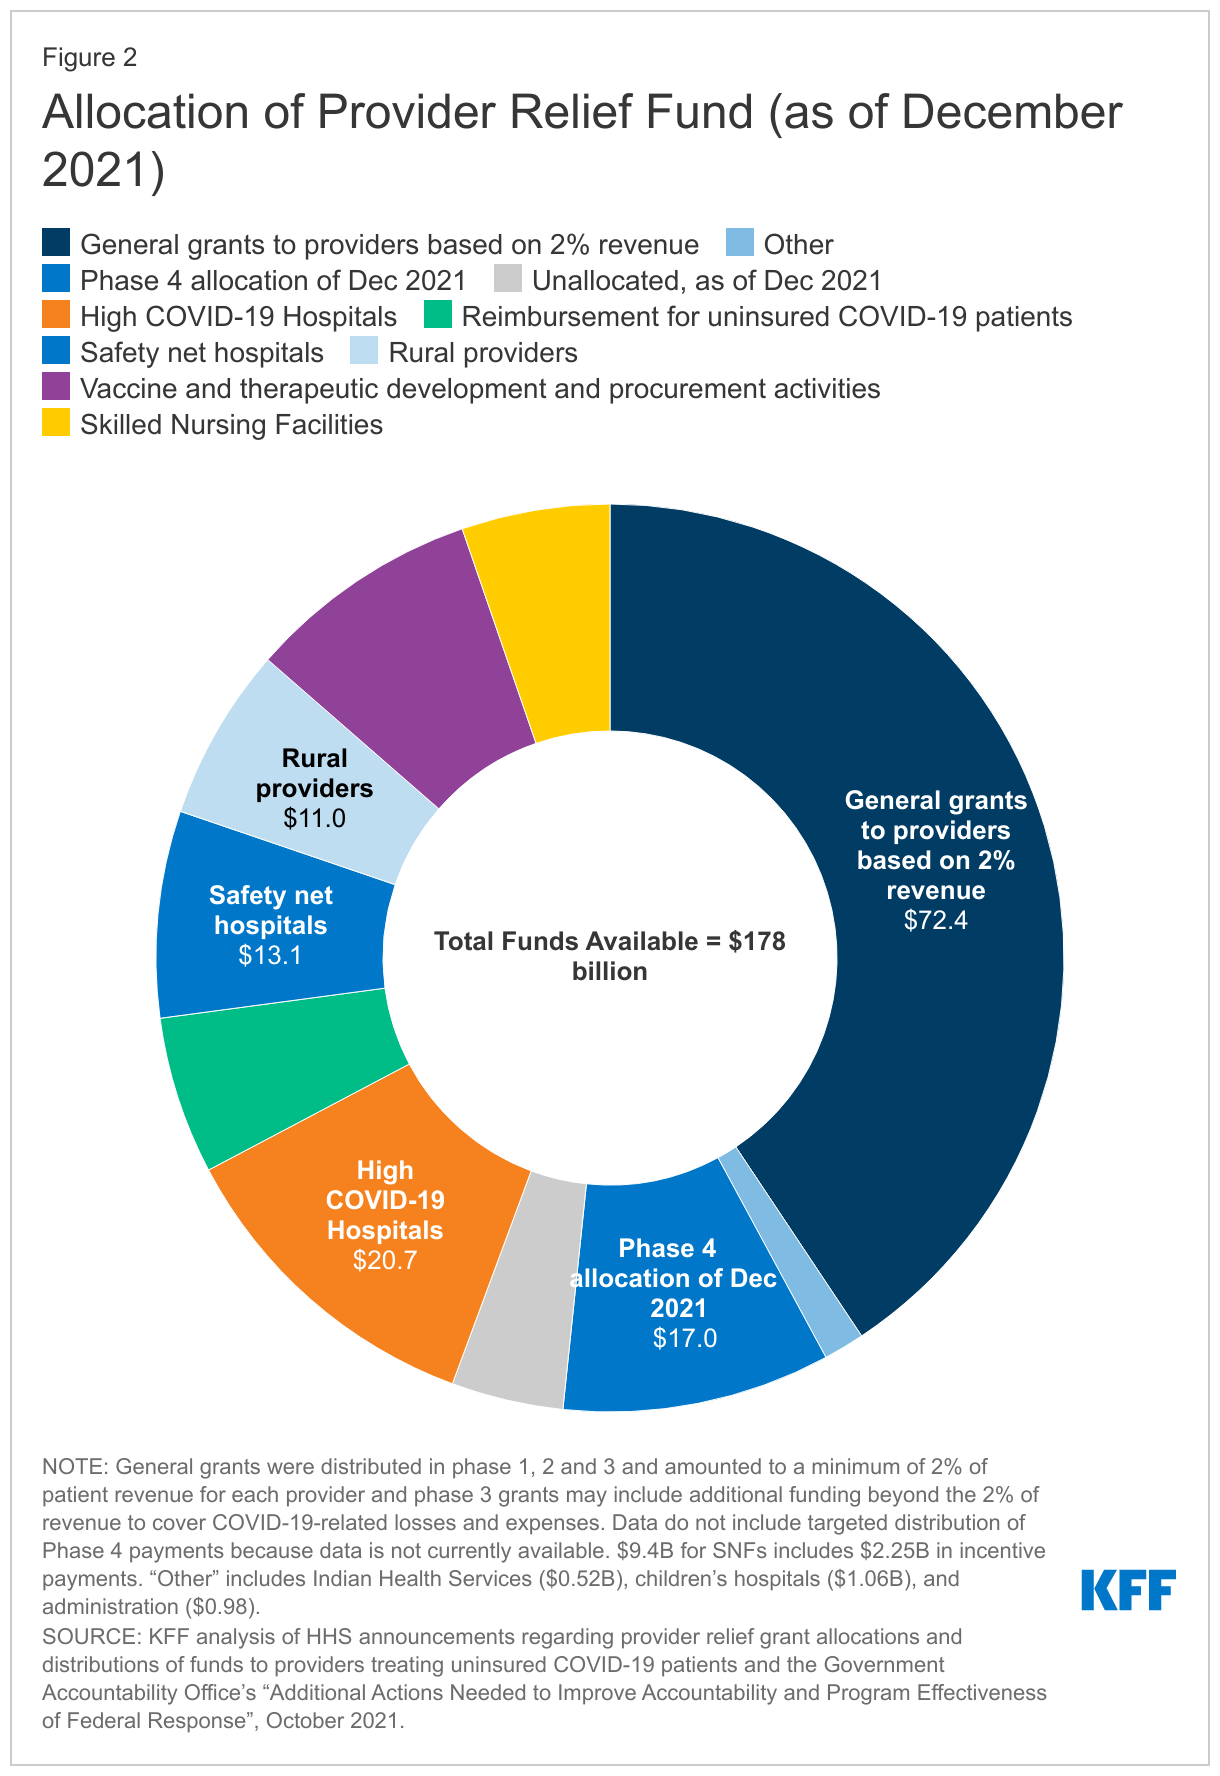
  • The latest KFF COVID-19 Monitor finds that fatigue and frustration dominate the public’s mood as the U.S. nears the pandemic’s two-year anniversary. While partisans have often been split in their pandemic attitudes, roughly three in four Democrats, independents, and Republicans say they feel “tired” and “frustrated,” and similar shares say they think it is likely that most people in the U.S. will eventually get infected with COVID-19. Partisans do divide, however, on whether the pandemic is the most important issue facing the country, with about half of Democrats choosing COVID-19 as the most important among 6 different issues and a similar share of Republicans choosing inflation as the top issue.
  • The public overall says that compared to previous waves of the virus, they are now “more worried” about the impact of the omicron surge on the U.S. economy and on their local hospitals, but “less worried” about the impact in their own personal lives. Notably, however, Black and Hispanic adults and those with lower incomes report higher levels of worry than their counterparts when it comes to missing work due to COVID-19 or becoming seriously ill or hospitalized, reflecting the increased burden the pandemic has placed on people of color over the past two years.
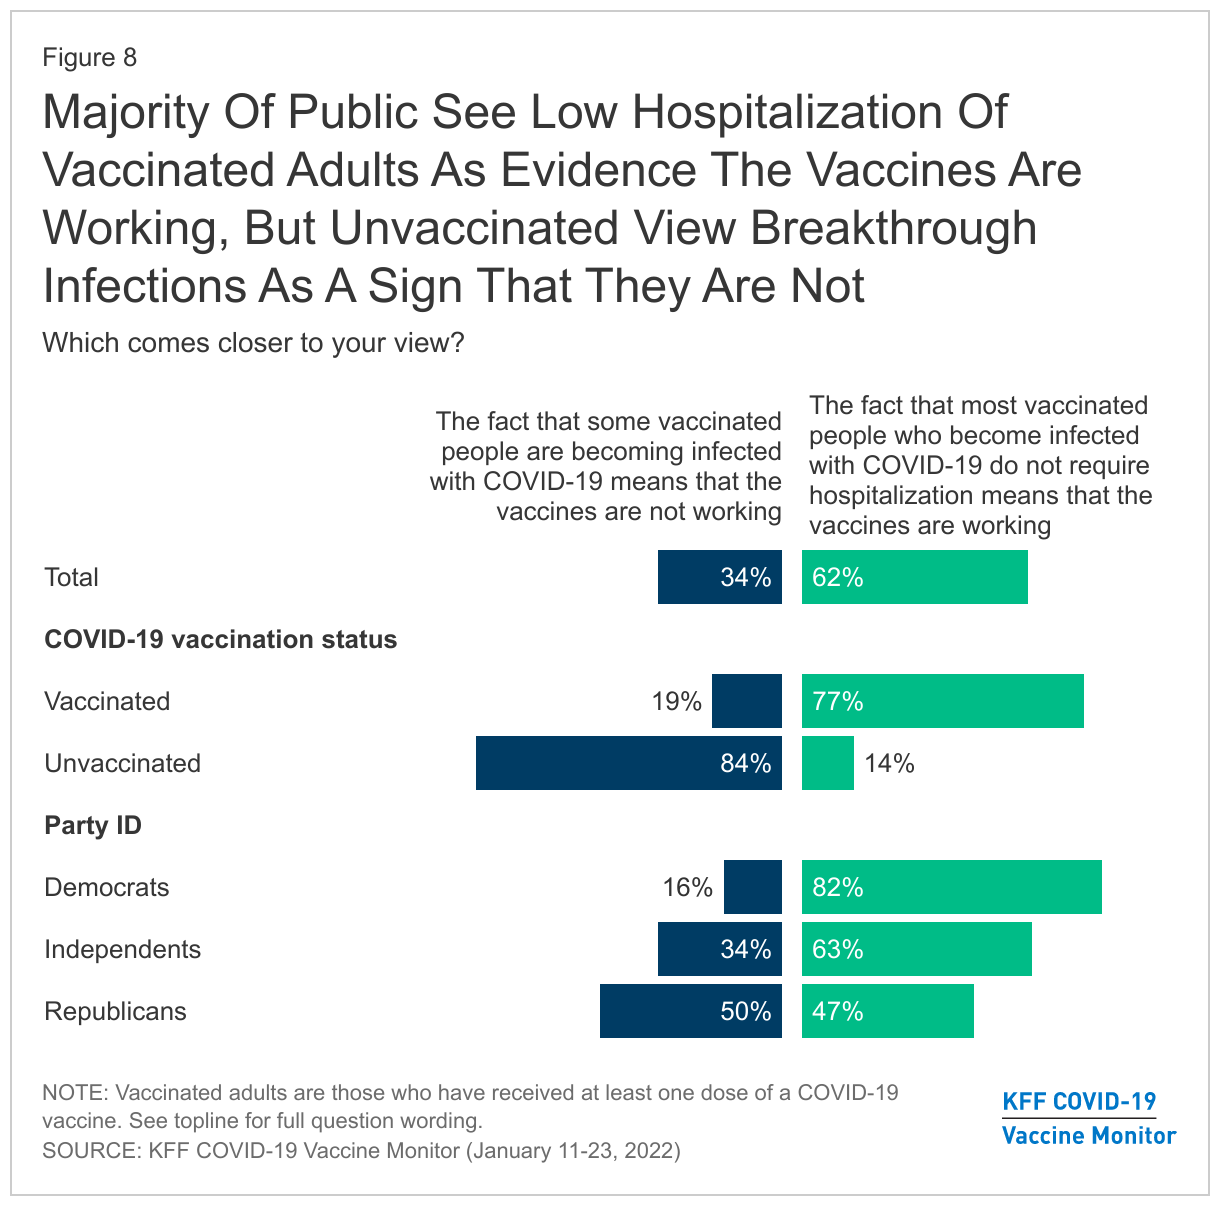
  • While many vaccinated people have become infected with the omicron variant, a majority of the public (62%) continue to see the fact that most vaccinated people who get COVID-19 do not require hospitalization as a sign that the vaccines are working. However, the share who see breakthrough infections as a sign that the vaccines are not working has increased slightly since September (from 26% to 34%).
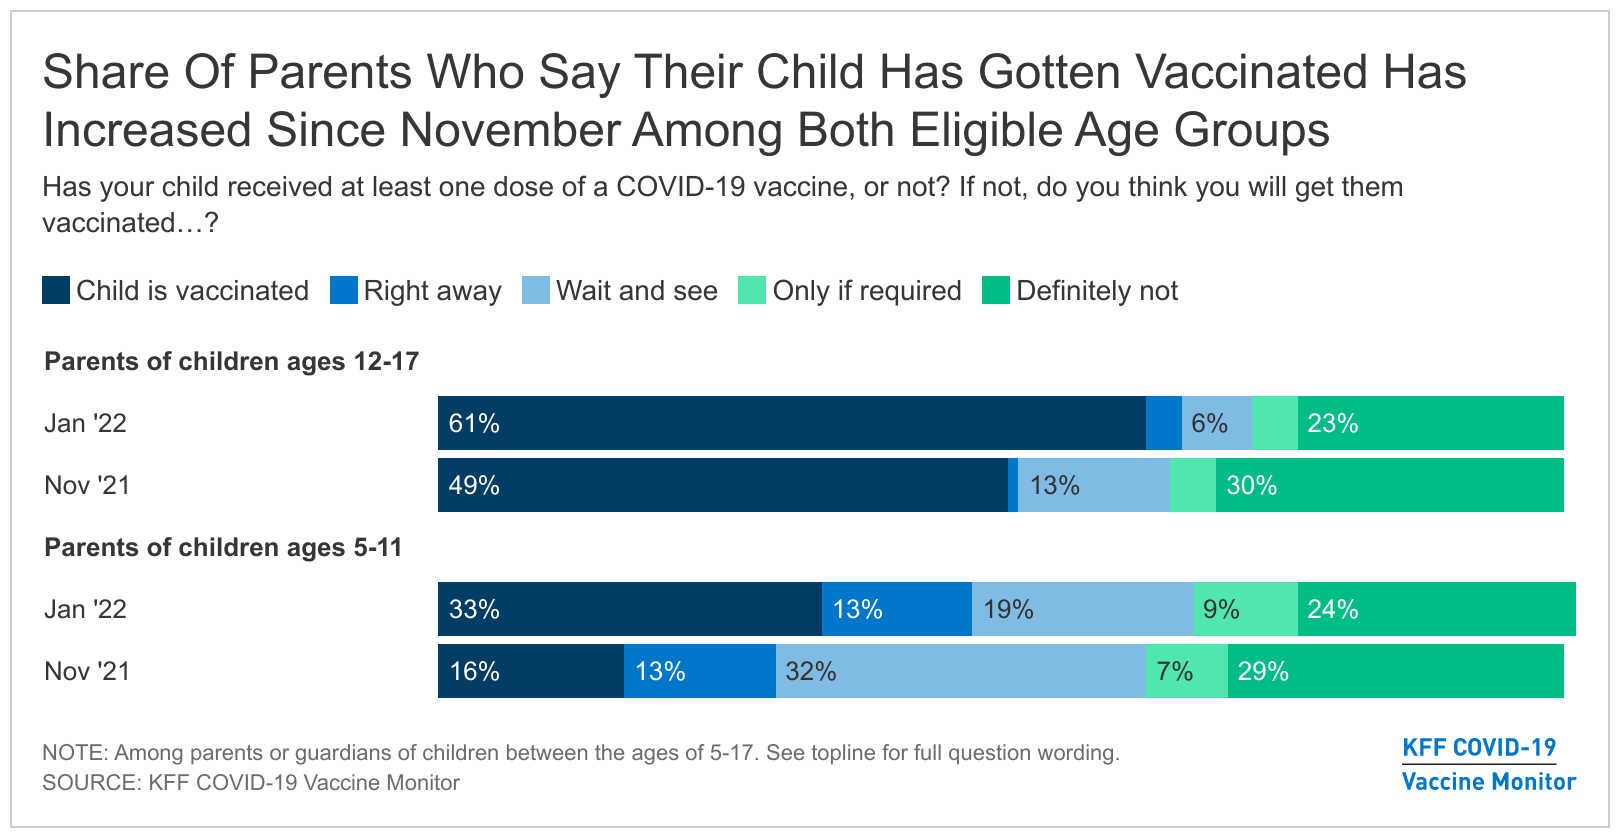
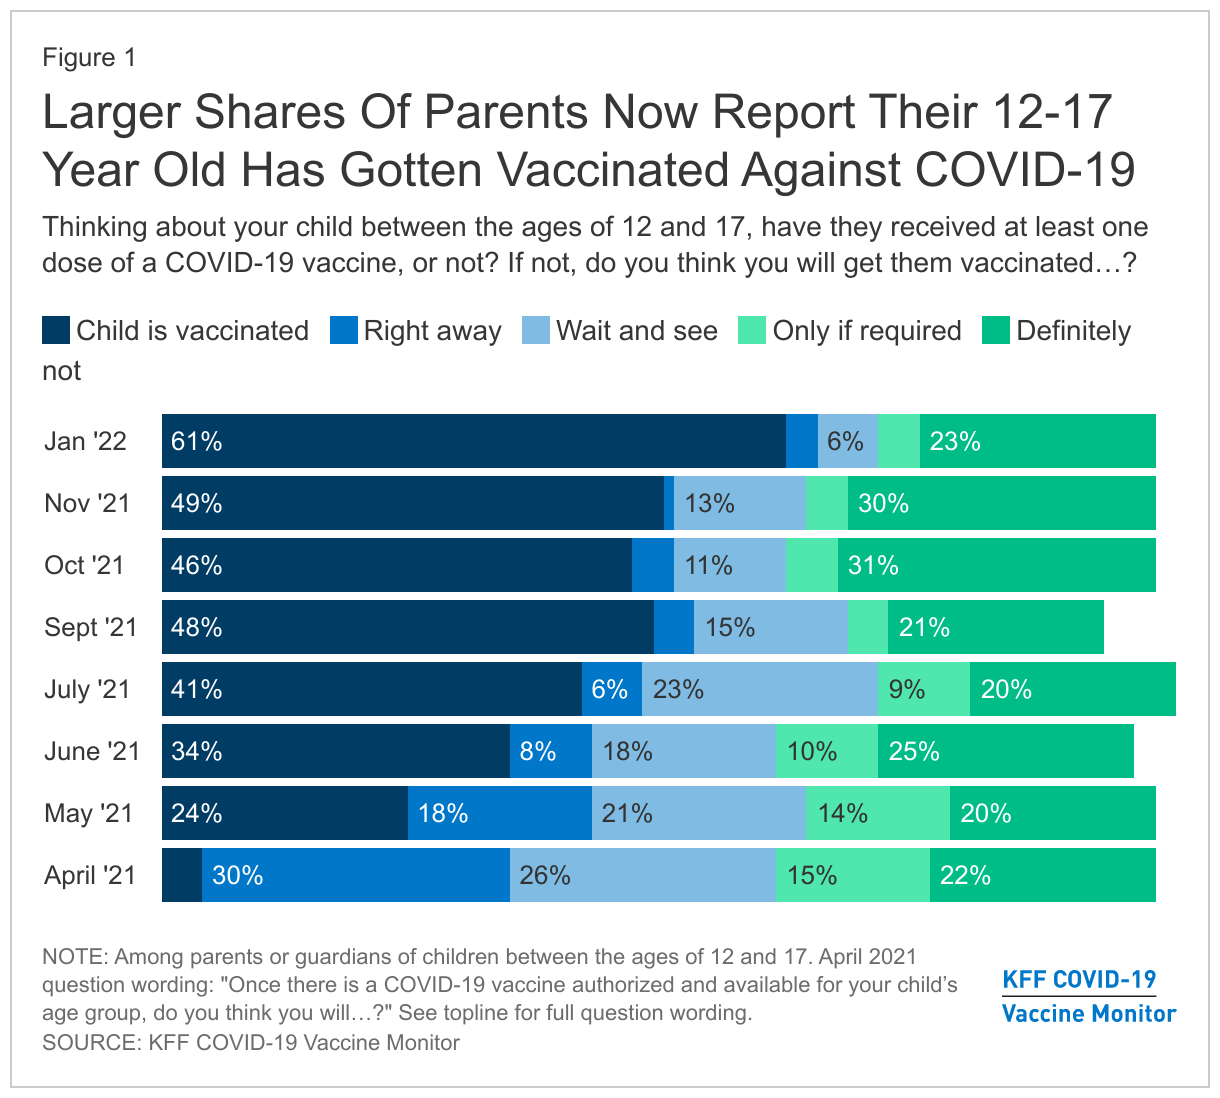
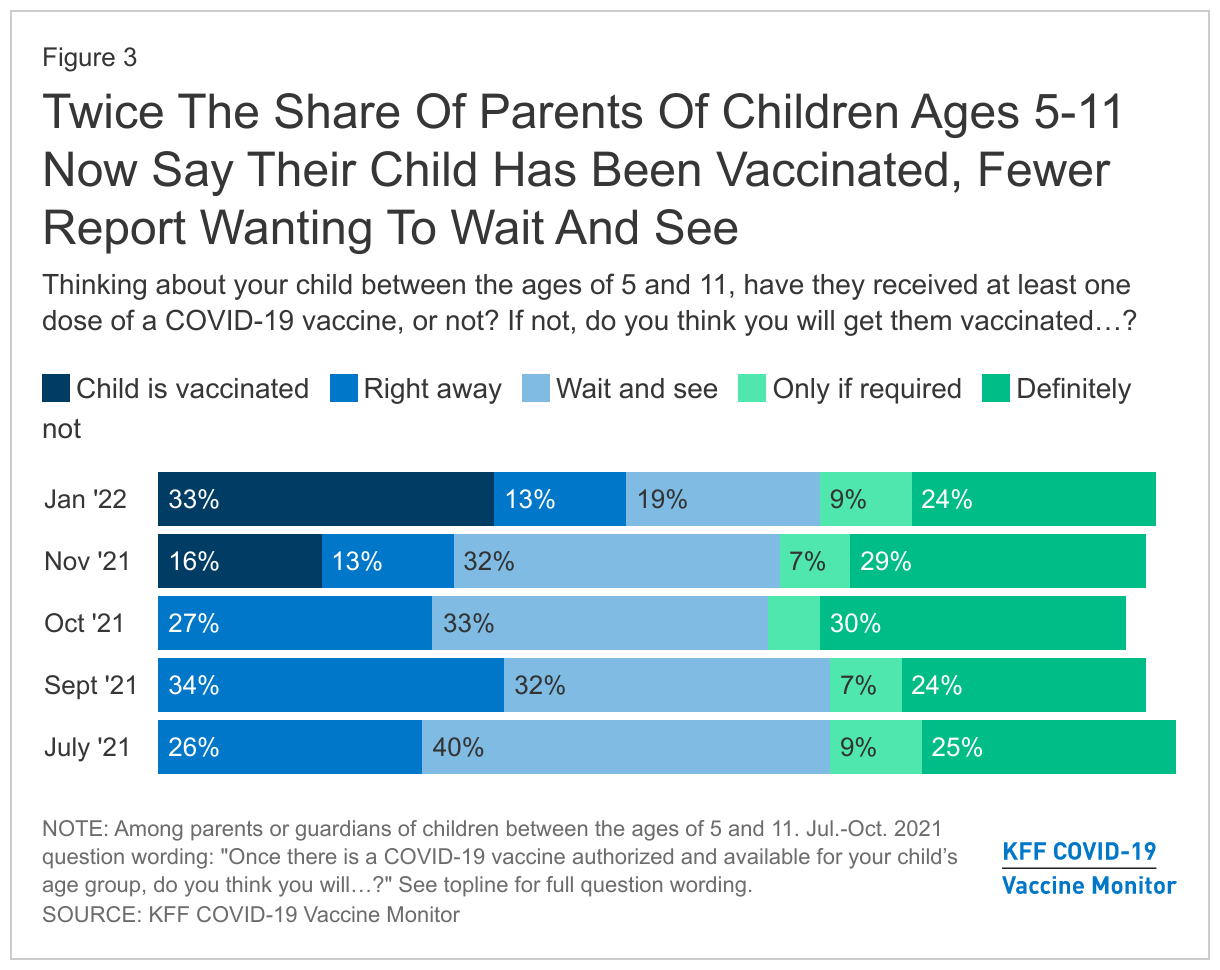
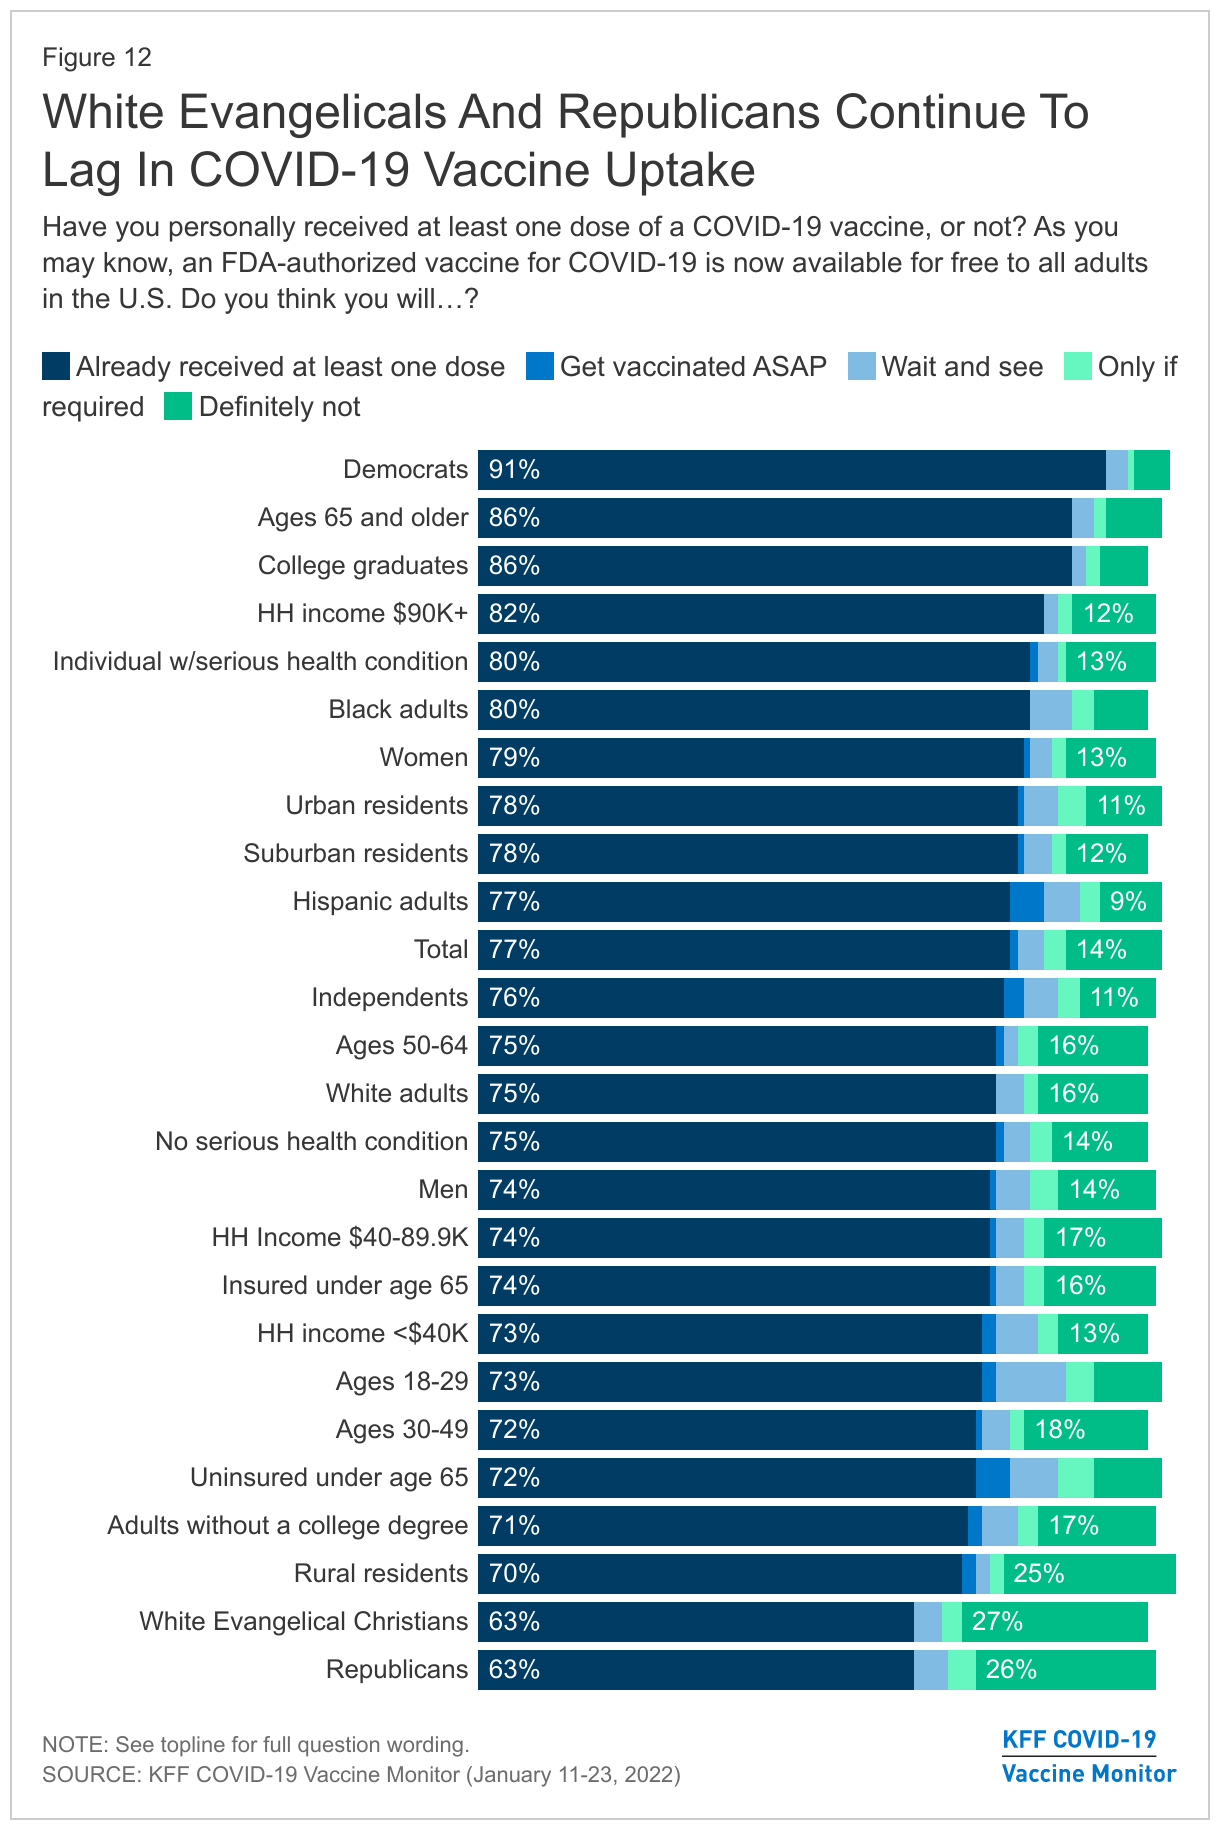
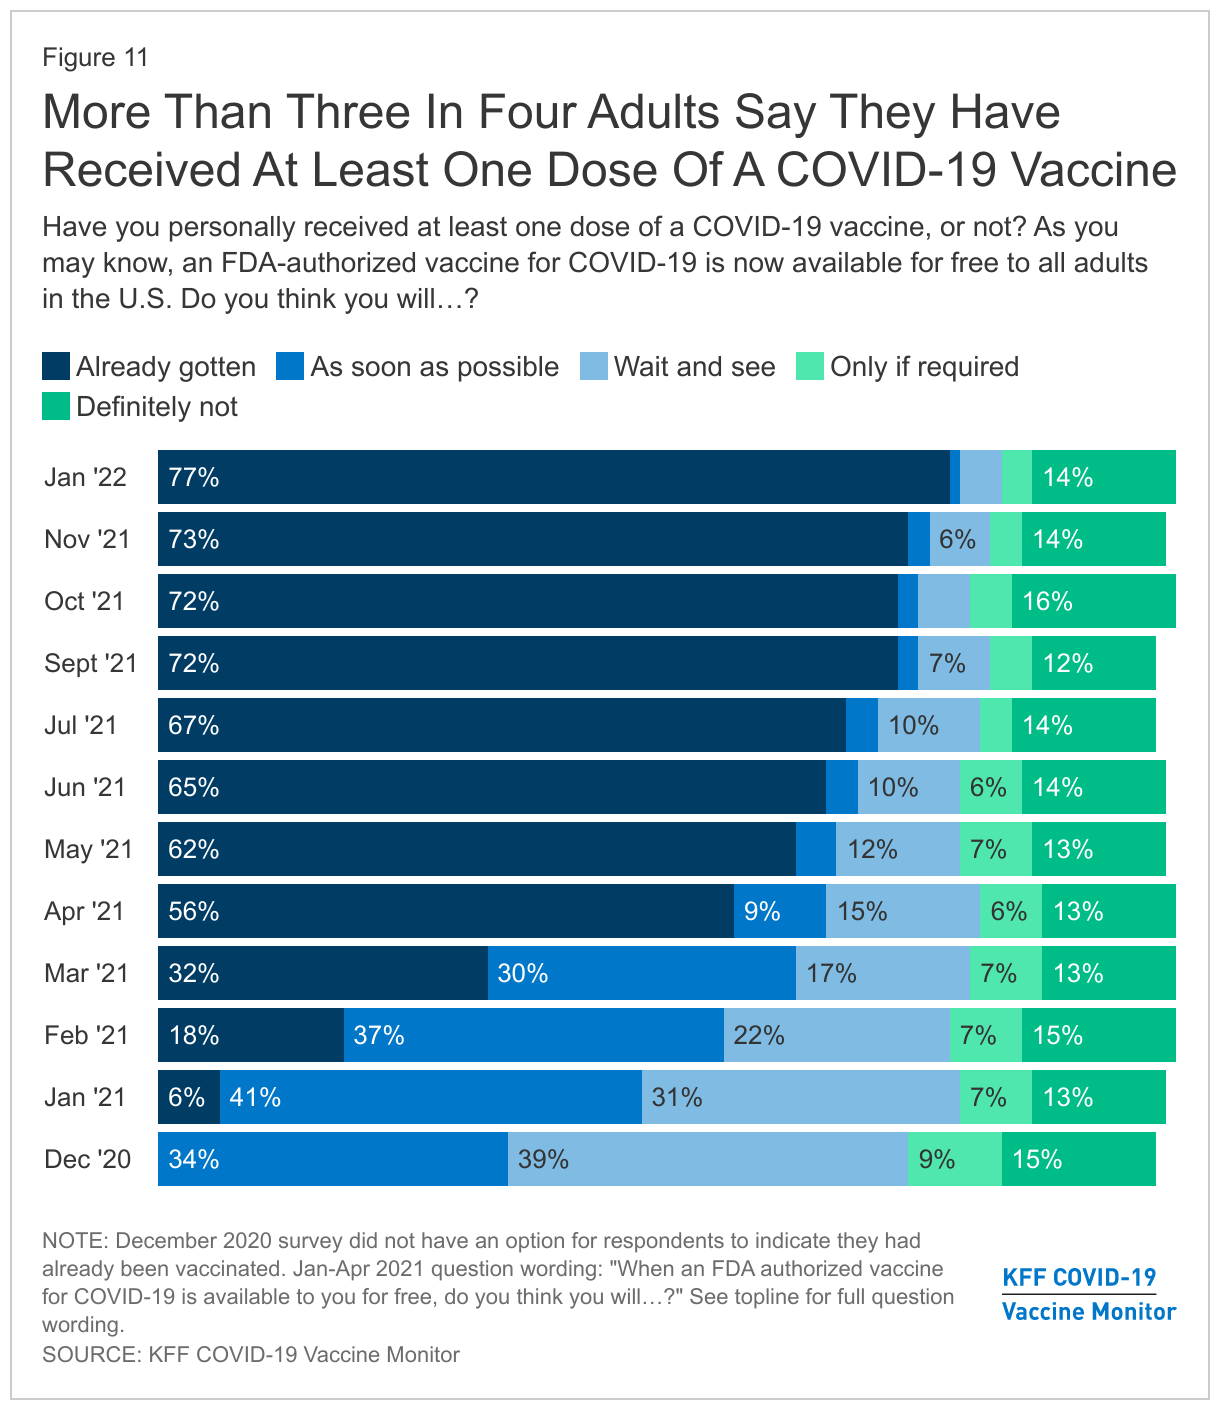
  • After holding relatively steady for several months, vaccine uptake inched up in January, with 77% now saying they have received at least one dose of a COVID-19 vaccine (up from 73% in November 2021). This movement seems to have come from a chipping away at the shares who say they will get vaccinated right away, will “wait and see” or will get vaccinated only if required. The share saying they will “definitely not” get vaccinated currently stands at 14% and has not moved in a statistically significant way since December 2020.
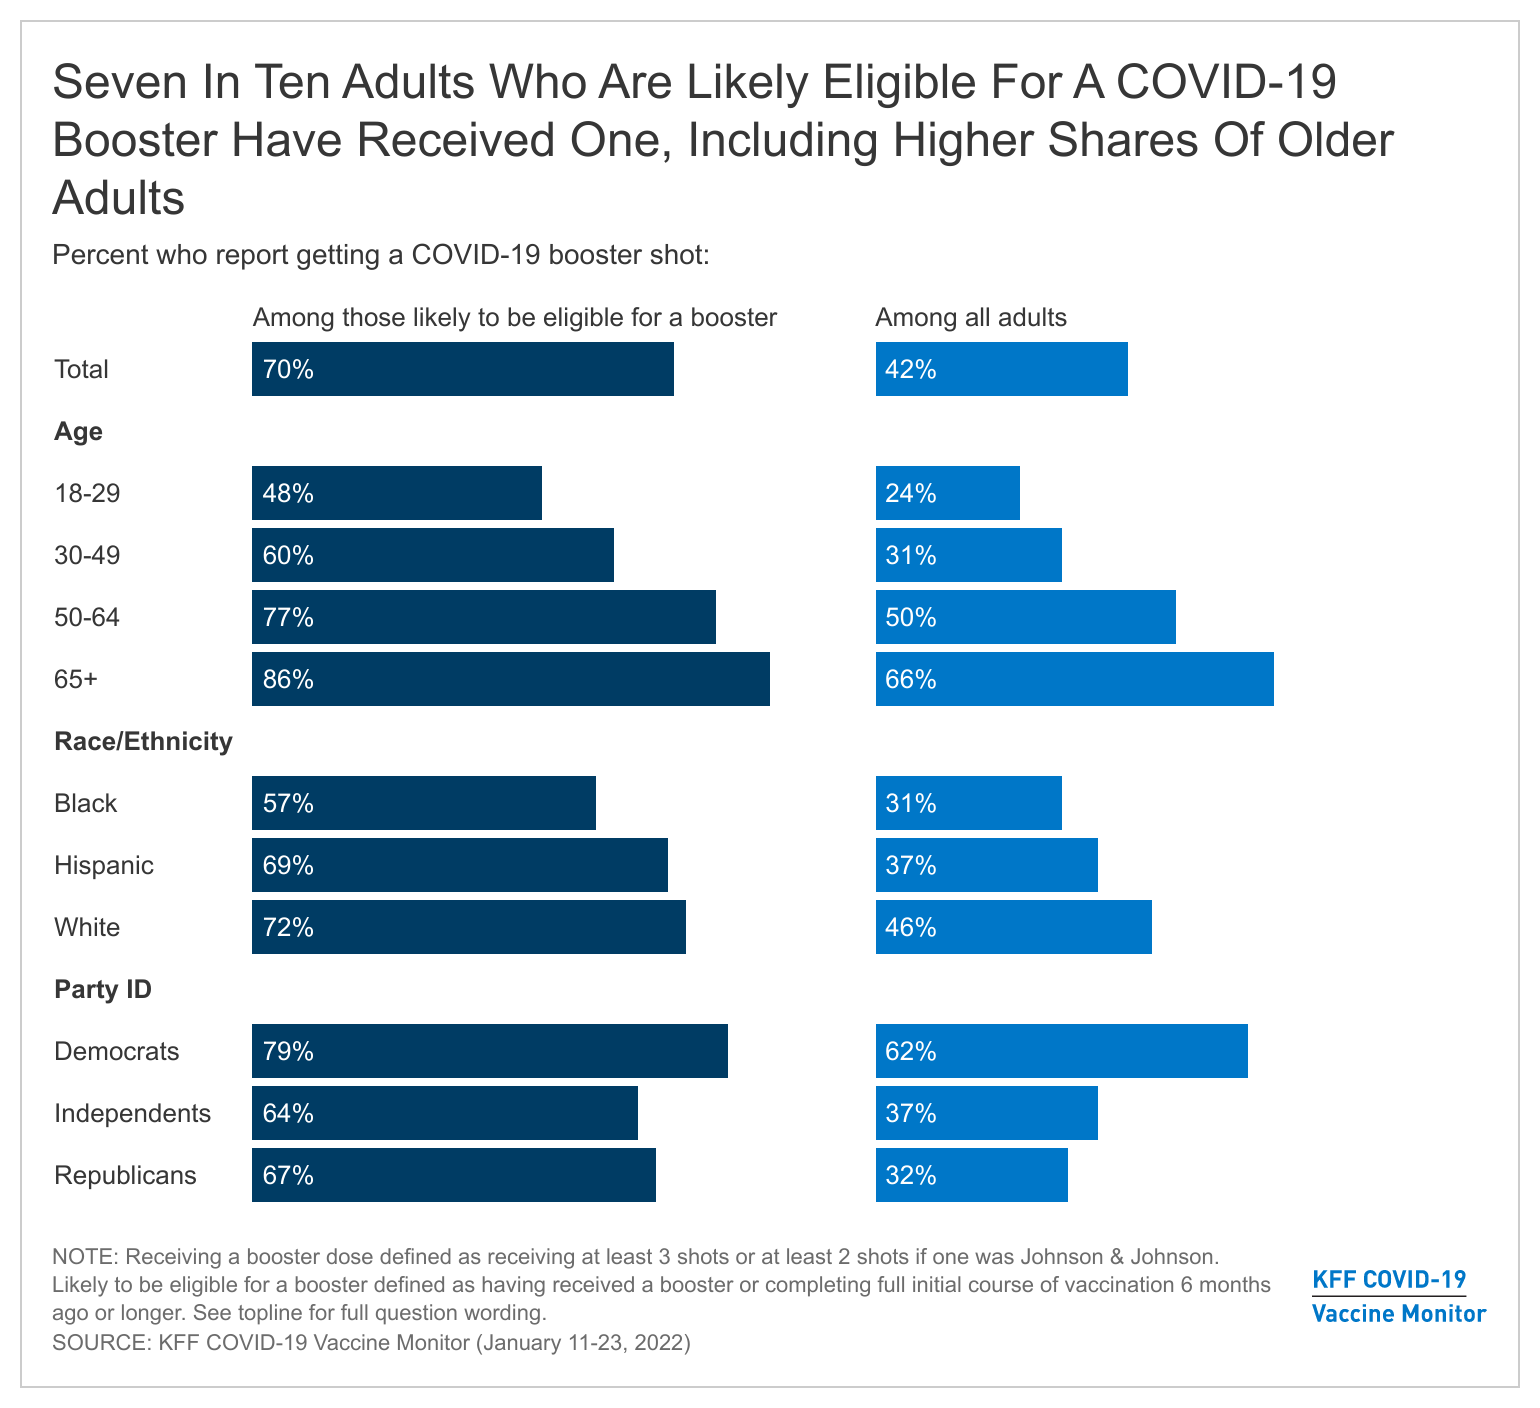
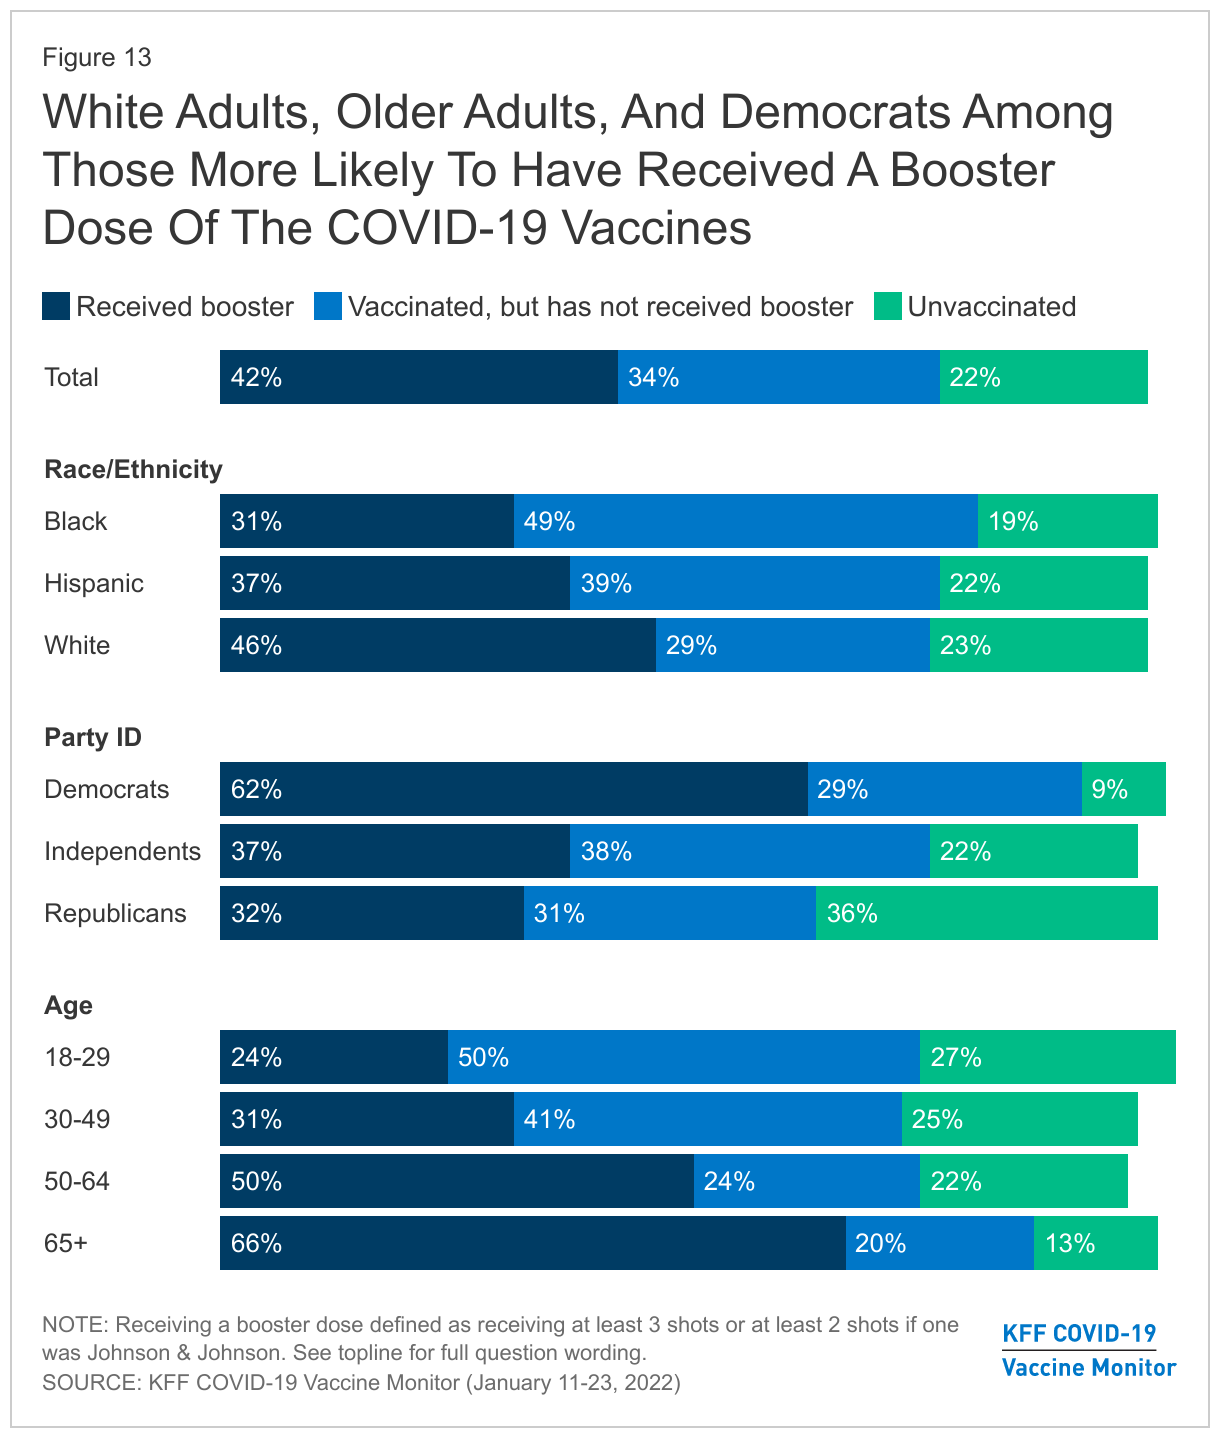
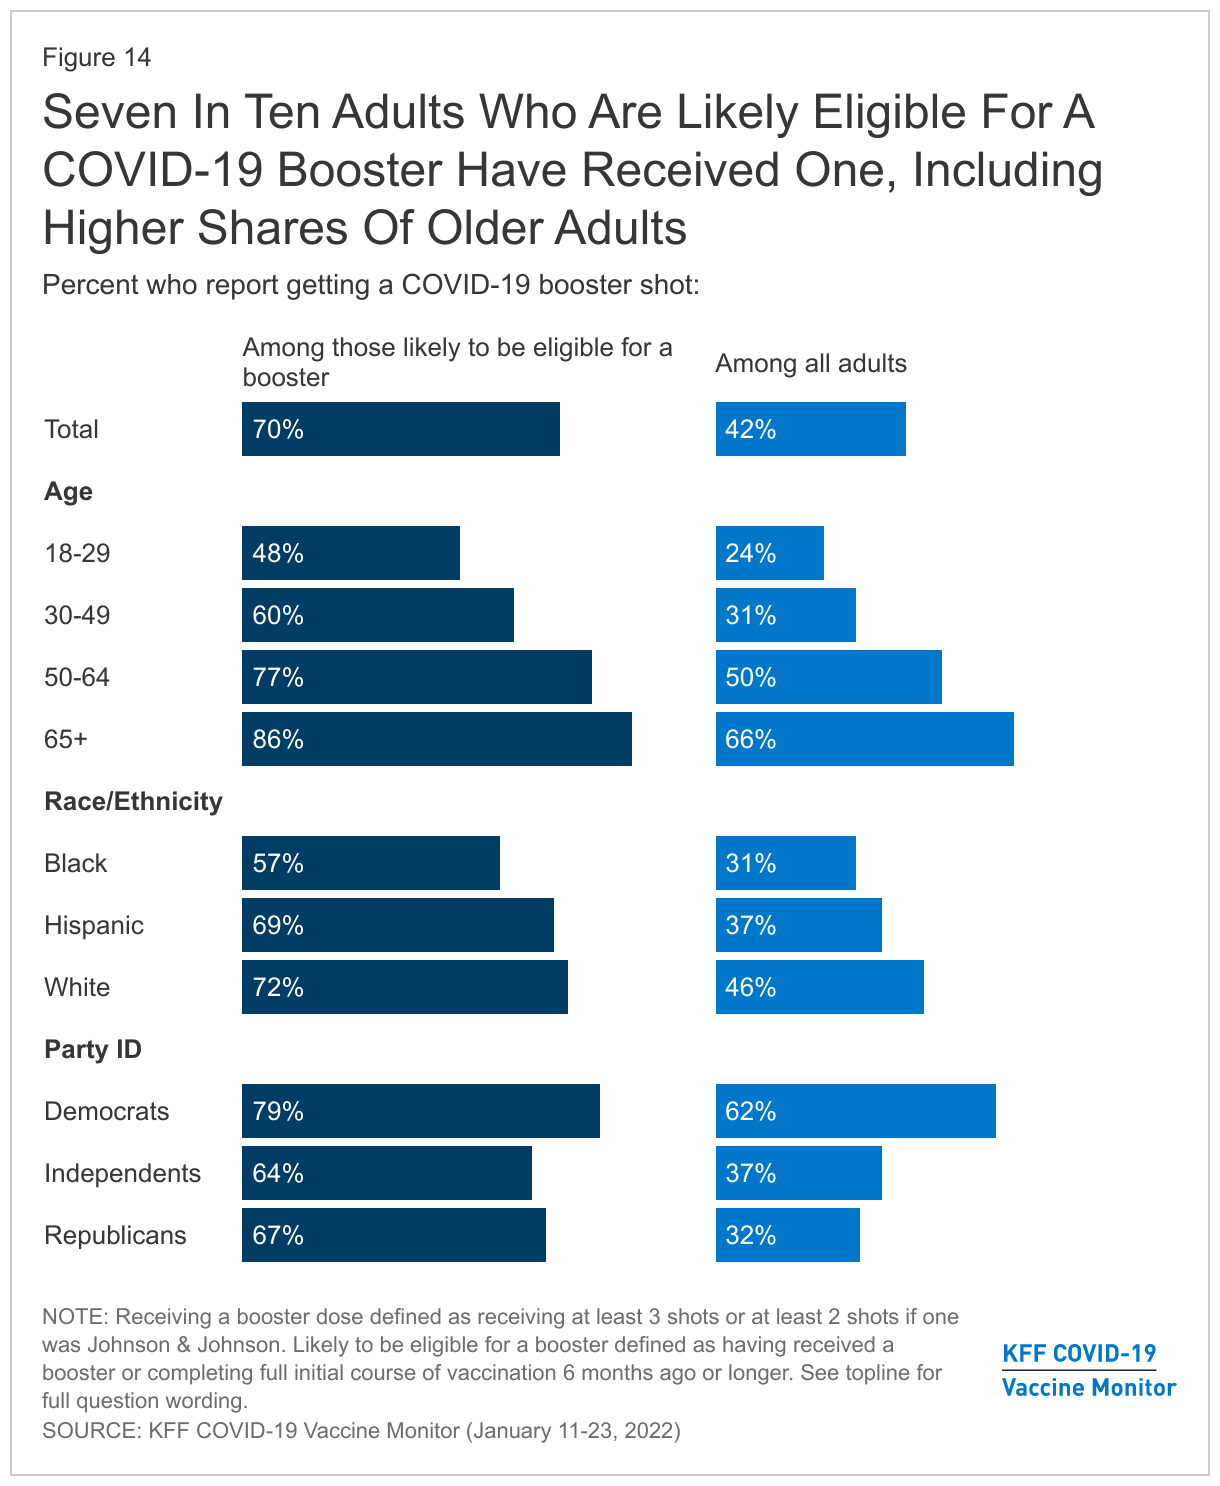
  • With the CDC now recommending that all eligible adults get a COVID-19 booster shot, we find that about four in ten (42%) of all adults say they have received a booster dose, a third (34%) have received at least one vaccine dose but are not boosted, and 22% remain unvaccinated. Among the population likely to be booster-eligible (those who either received a booster or completed a full initial course of vaccination 6 months ago or longer), seven in ten have gotten a booster.
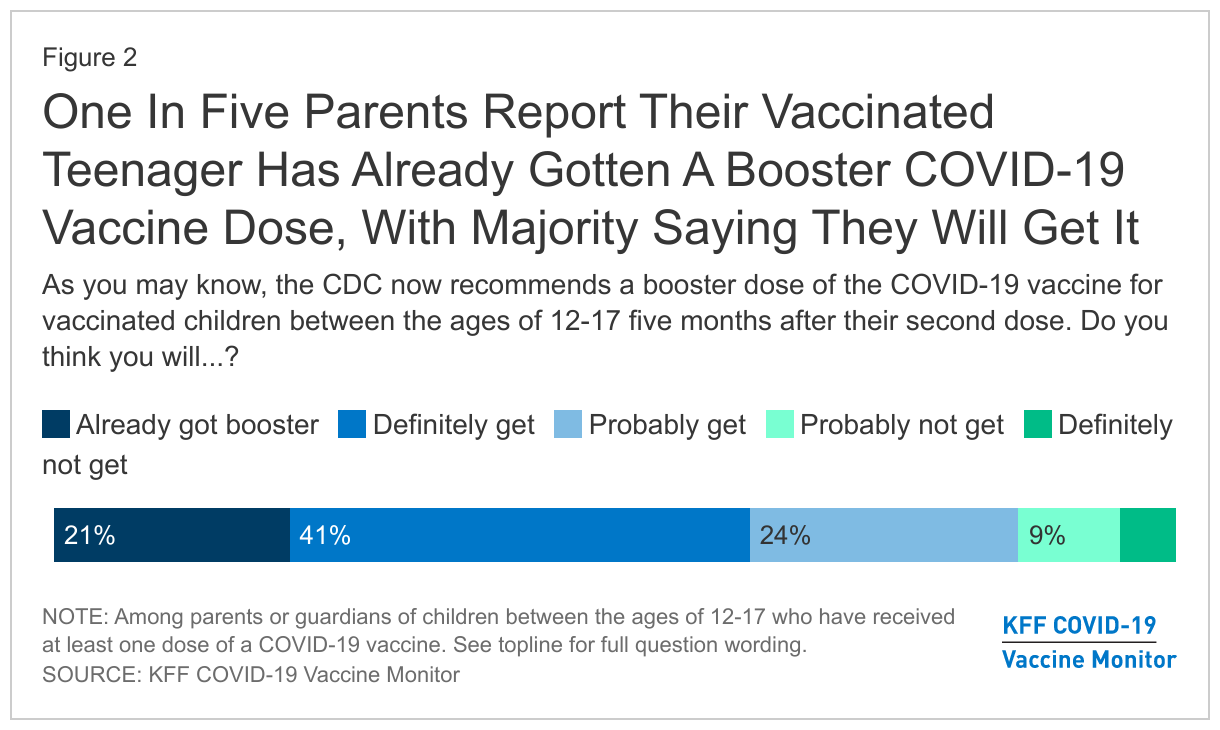
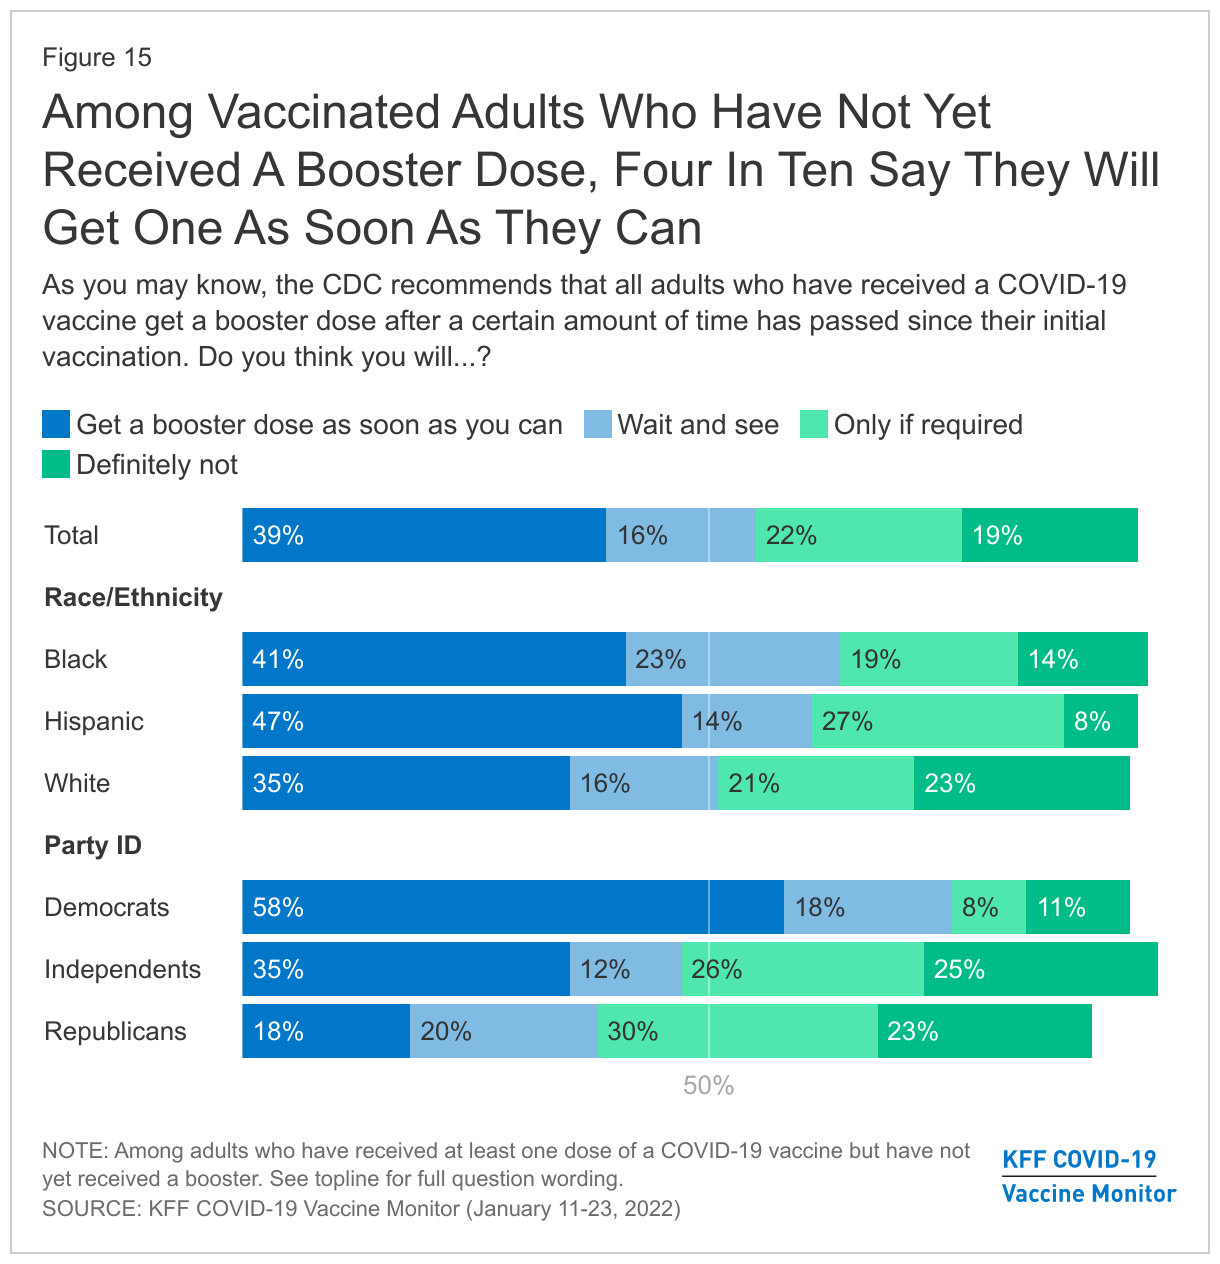
  • Gaps in booster uptake are mirroring early gaps in initial vaccination uptake, with adults 65 and older (66%) and Democrats (62%) among the most likely to have received a booster and Black and Hispanic adults lagging behind White adults in booster uptake (31%, 37%, and 46%, respectively). Among those who are vaccinated but not boosted, four in ten (39%) say they want to get a booster as soon as they can, however a similar share say they will either definitely not get a booster (19%) or only do so if required (22%).
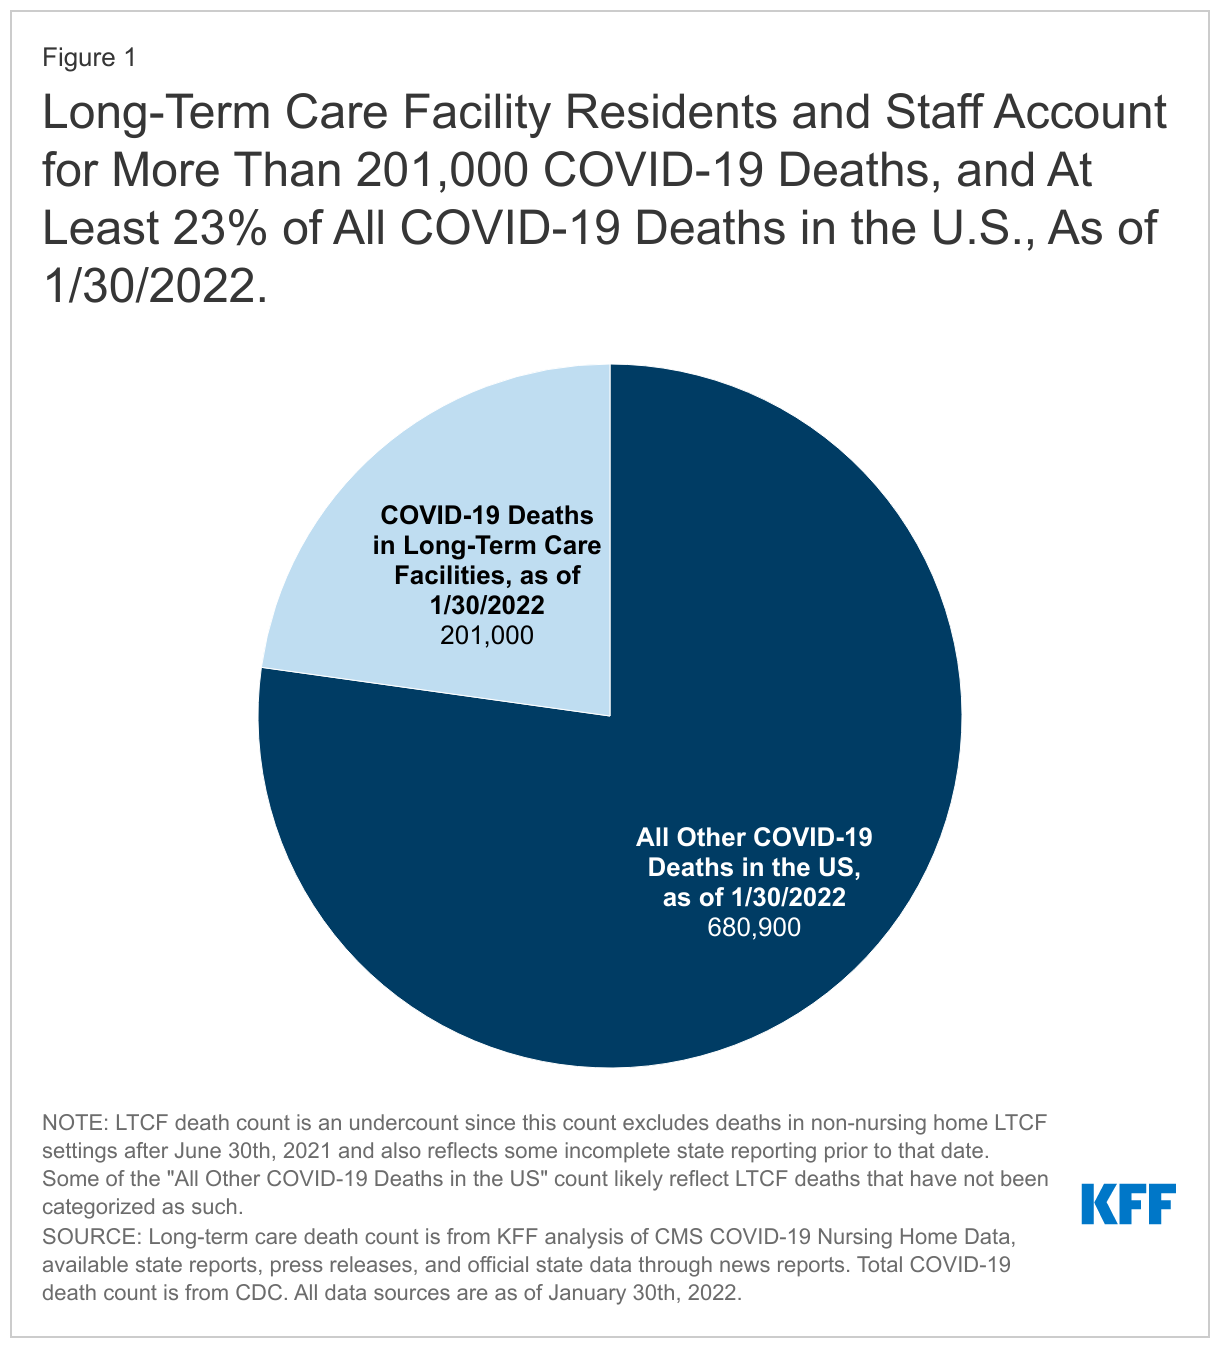
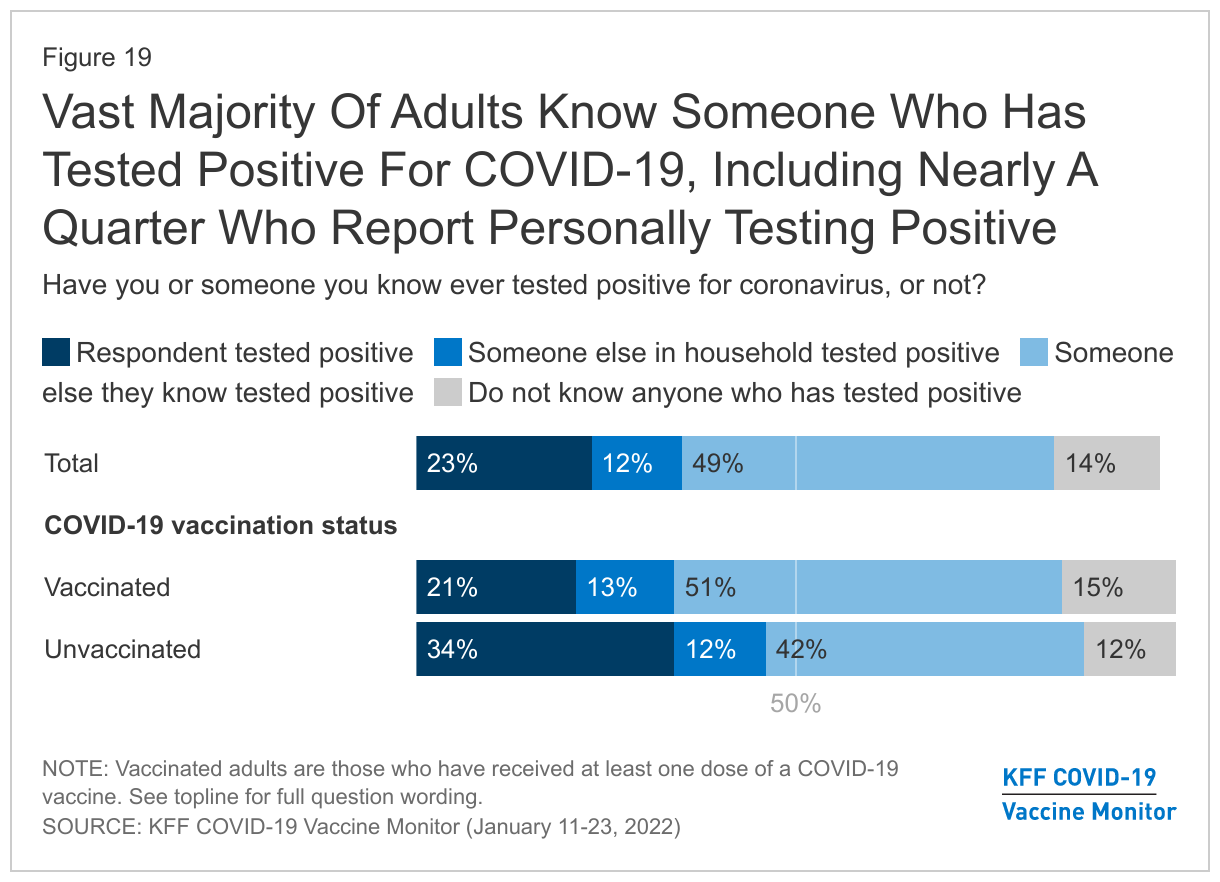
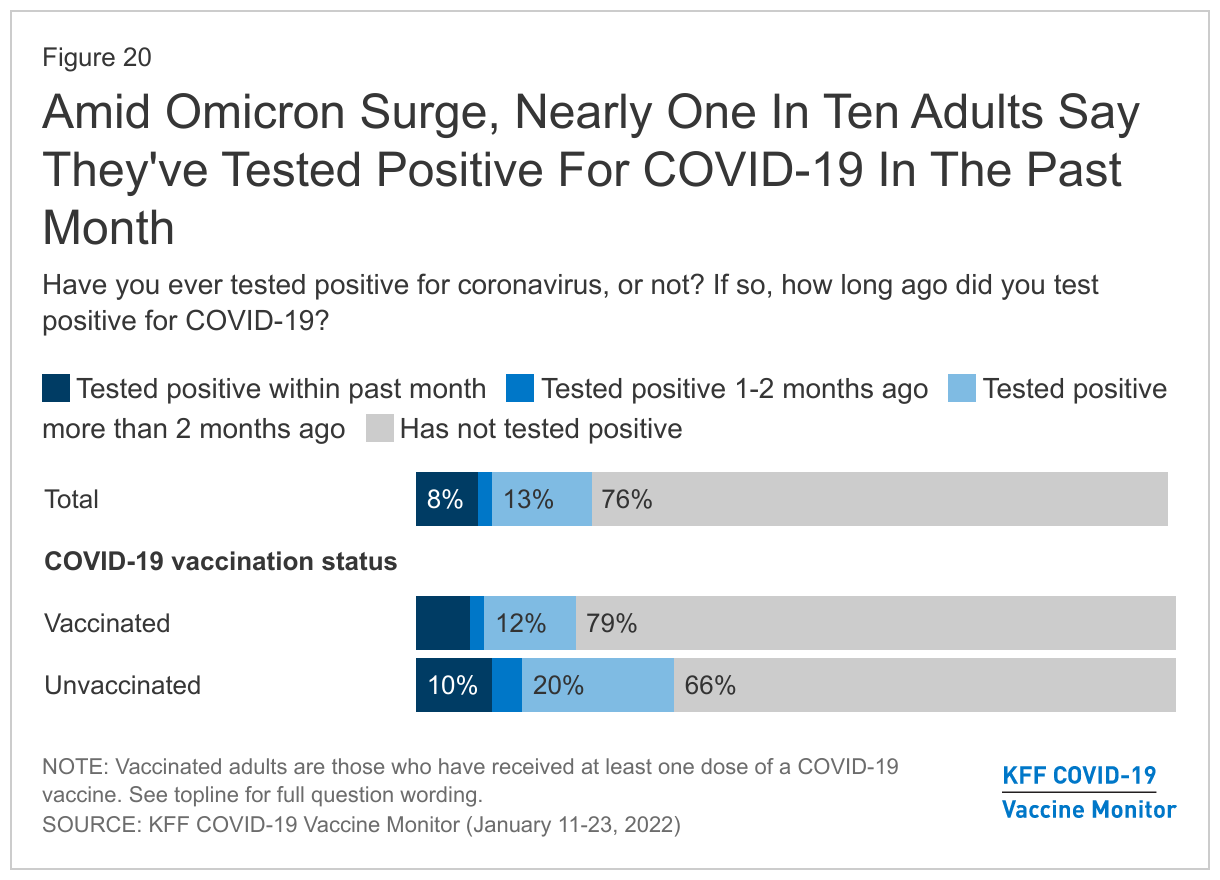
  • Nearly one-quarter of adults (23%) now say they’ve tested positive for COVID-19 at some point, including 8% who say they’ve tested positive in the past month. Among those who tested positive in the past month, 16% say their positive result was on an in-home test only, which is unlikely to be recorded in official COVID-19 case counts. Difficulty accessing COVID-19 tests is likely further contributing to an undercount of cases.
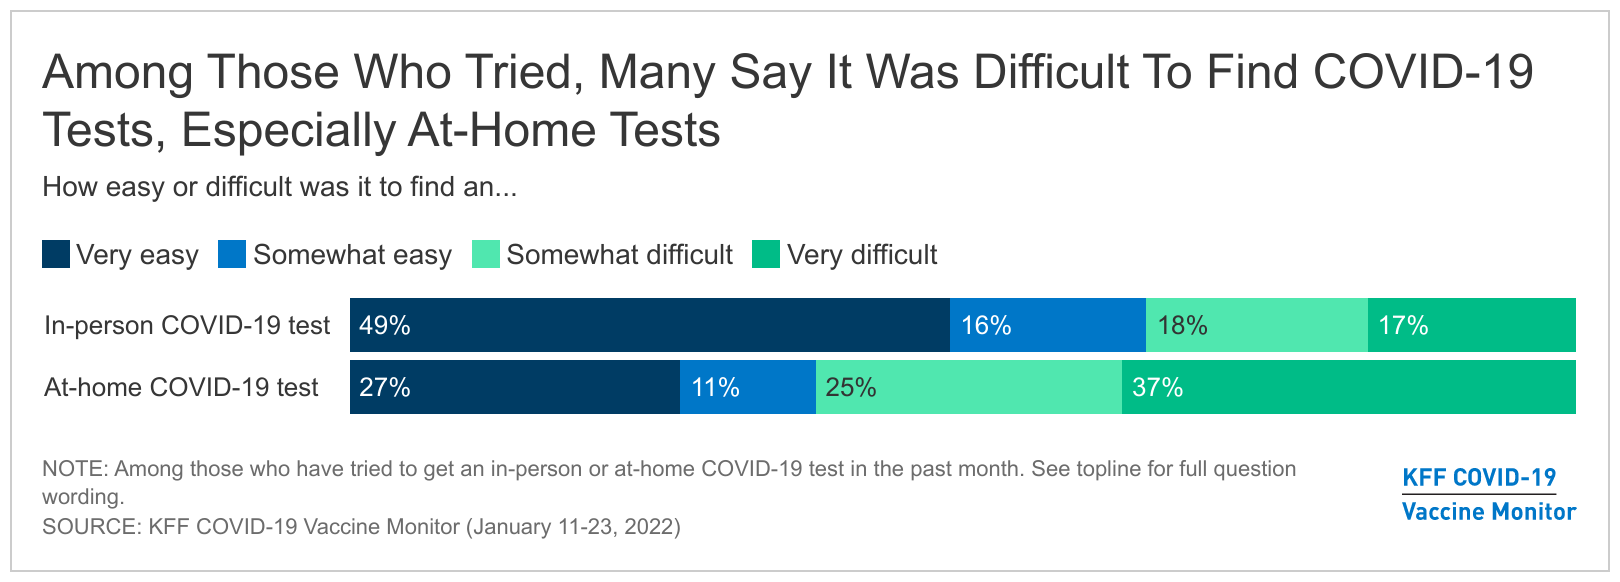
  • Amid the omicron surge, about six in ten of those who tried to purchase an at-home COVID-19 test say the tests were difficult to find, and one-third (35%) of those who tried to find an in-person test similarly report difficulty. Overall, nearly a quarter (23%) of all adults say they tried to find either type of test and faced difficulty. More broadly, about half of adults say there are not enough COVID-19 tests available in their local area for those who want them. In addition, while about eight in ten are confident the results of COVID-19 tests at a medical facility or testing site are usually accurate, just over half (54%) are similarly confident in the accuracy of home tests.
  • About half of adults say the FDA deserves at least a fair amount of blame for the limited availability of tests, while about four in ten assign blame to each President Joe Biden and the test manufacturers. President Biden announced on January 14th that Americans could order free at-home tests beginning on January 19th, while the survey was still in the field.
  • Around one in five adults (19%) report they’ve personally had difficulty in the past three months figuring out whether they needed to isolate or limit their normal activities due to a COVID-19 exposure, positive test, or symptoms. This is even higher among those who say they tested positive for COVID-19 in the last month (38%) and those who reported difficulty finding a COVID-19 test (37%).

Mood Of The Country

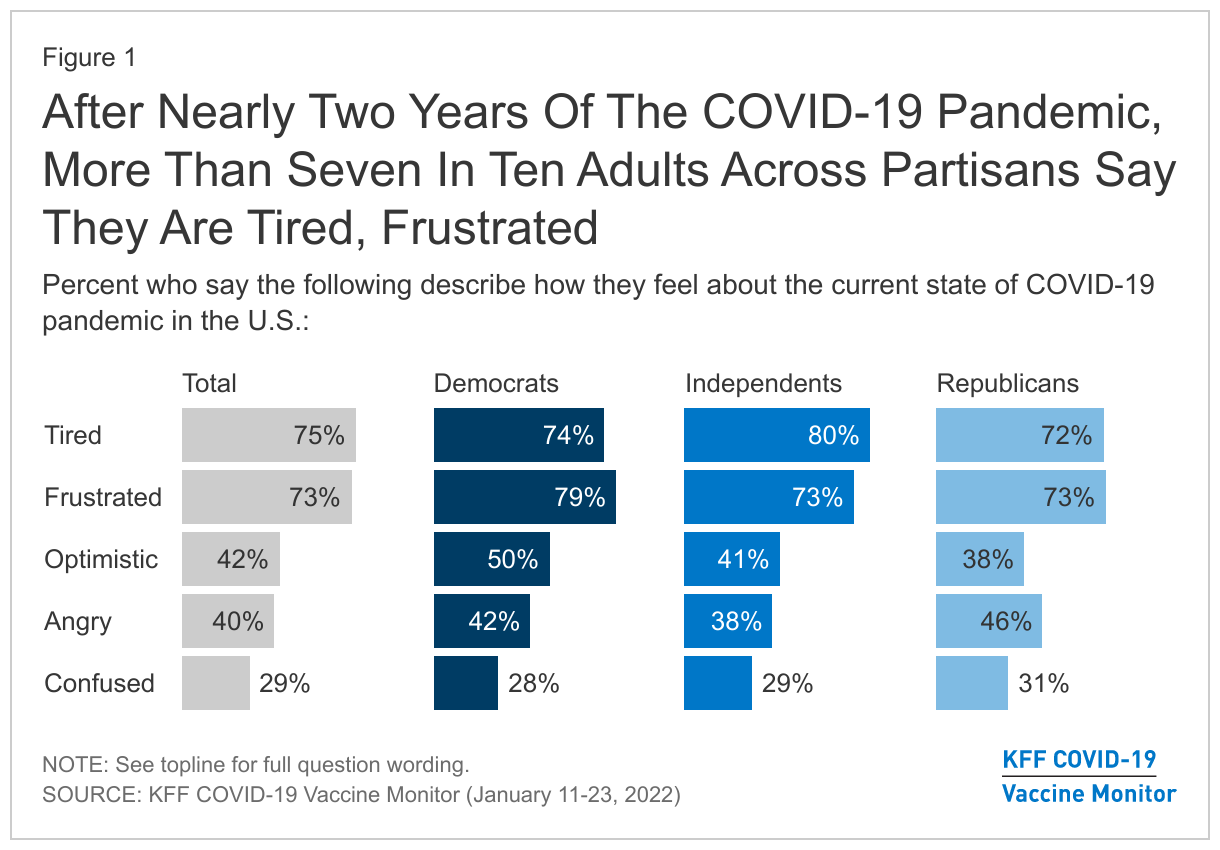
Nearly two years into the COVID-19 pandemic, the public’s mood is dominated by fatigue and frustration. About three in four adults including majorities across age, gender, race and ethnicity, and income groups say that “tired” and “frustrated” describe how they feel about the current state of the pandemic in the U.S., while about four in ten each say they are “optimistic” or “angry” and three in ten say they feel “confused.”

While previous KFF research has shown that most attitudes toward COVID-19 tend to diverge along partisan lines, “tired” and “frustrated” are the dominant emotions expressed across partisans, with at least seven in ten Democrats, independents, and Republicans saying each word describes how they feel about the current status of the pandemic.

After Nearly Two Years Of The COVID-19 Pandemic, More Than Seven In Ten Adults Across Partisans Say They Are Tired, Frustrated

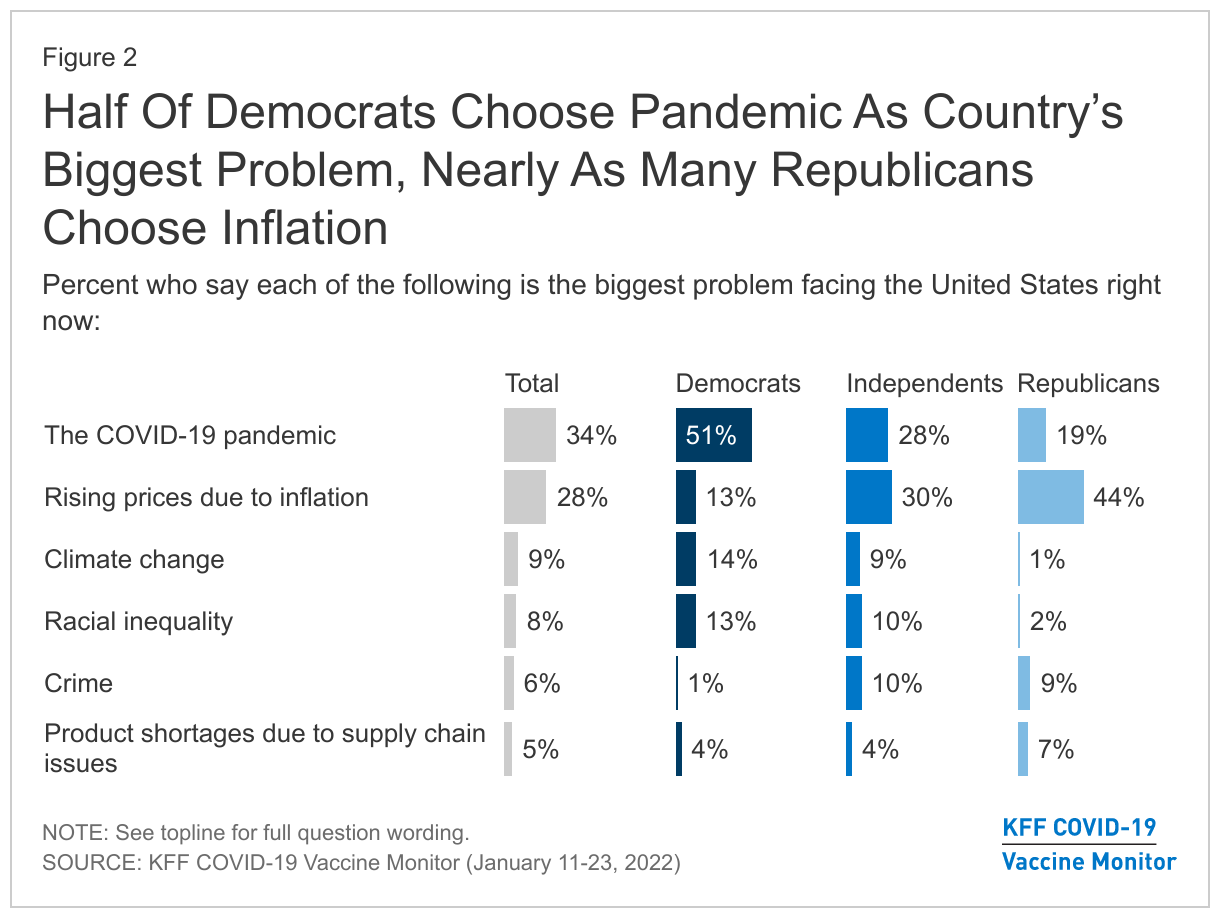
Despite feeling fatigued about the current state of the pandemic, about a third of adults (34%) continue to see the pandemic as the biggest problem facing the country right now, ranking slightly ahead of rising prices due to inflation (28%). About one in ten say climate change (9%) and racial inequality (8%) are the biggest problems facing the country, while 6% choose crime and 5% choose product shortages due to supply chain issues as the country’s biggest problems. Partisans have differing views as a half of Democrats (51%) say the pandemic is the biggest problem, while a similar share of Republicans (44%) cite inflation. Among independents, about equal shares say the pandemic (28%) and inflation (30%) are the biggest problem facing the United States right now.

Half Of Democrats Choose Pandemic As Country’s Biggest Problem, Nearly As Many Republicans Choose Inflation

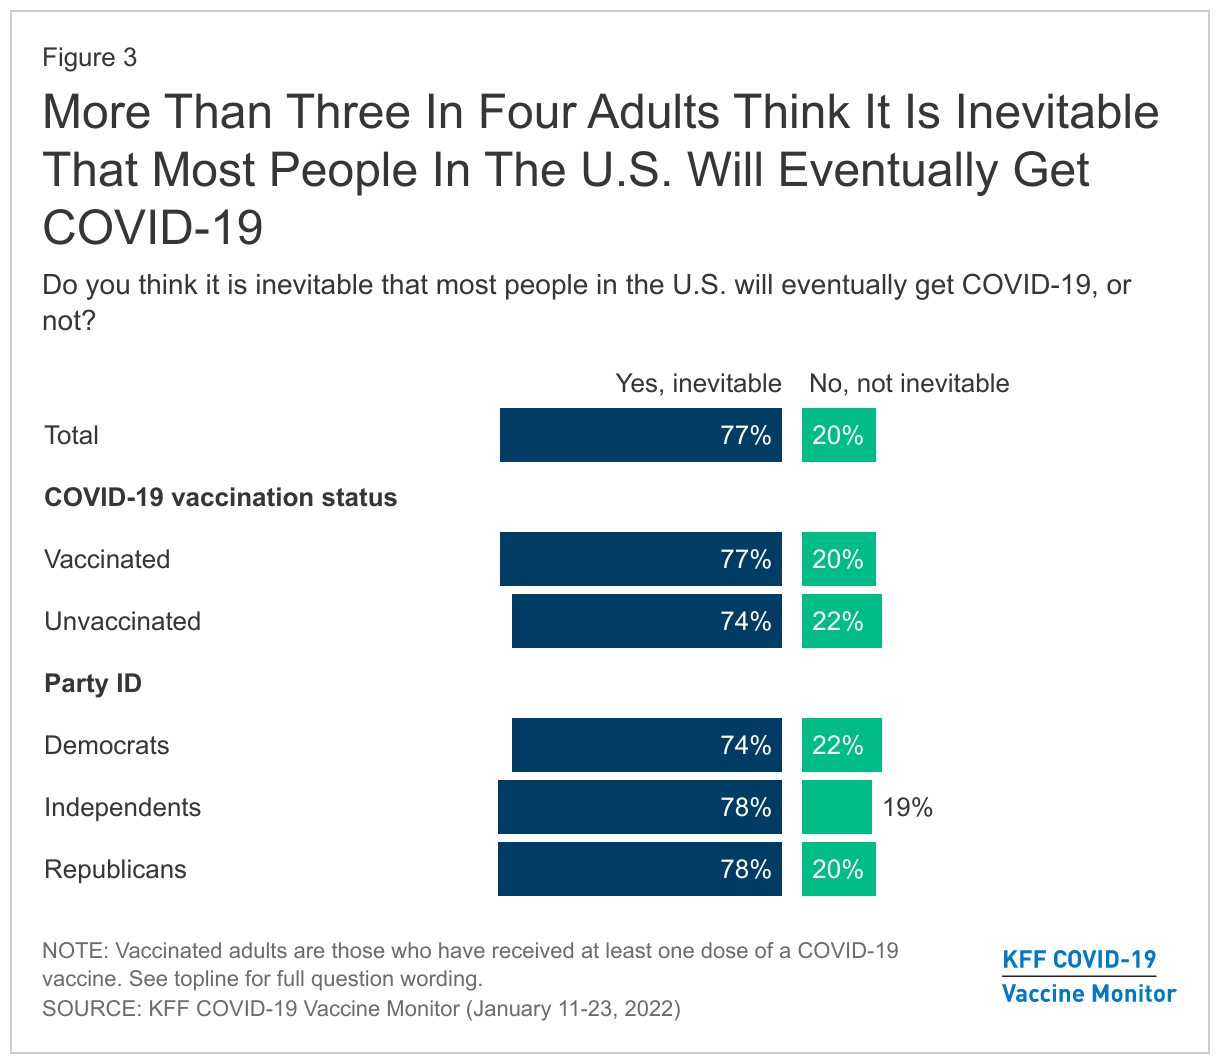
Along with feelings of fatigue and frustration, the public overall seems resigned to the idea that COVID-19 infection is inevitable for most people. Three in four adults (77%) think that most people in the U.S. will eventually get COVID-19, including majorities across gender, age, income, and racial and ethnic groups. Similar shares across partisanship and vaccine status also say this is inevitable.

More Than Three In Four Adults Think It Is Inevitable That Most People In The U.S. Will Eventually Get COVID-19

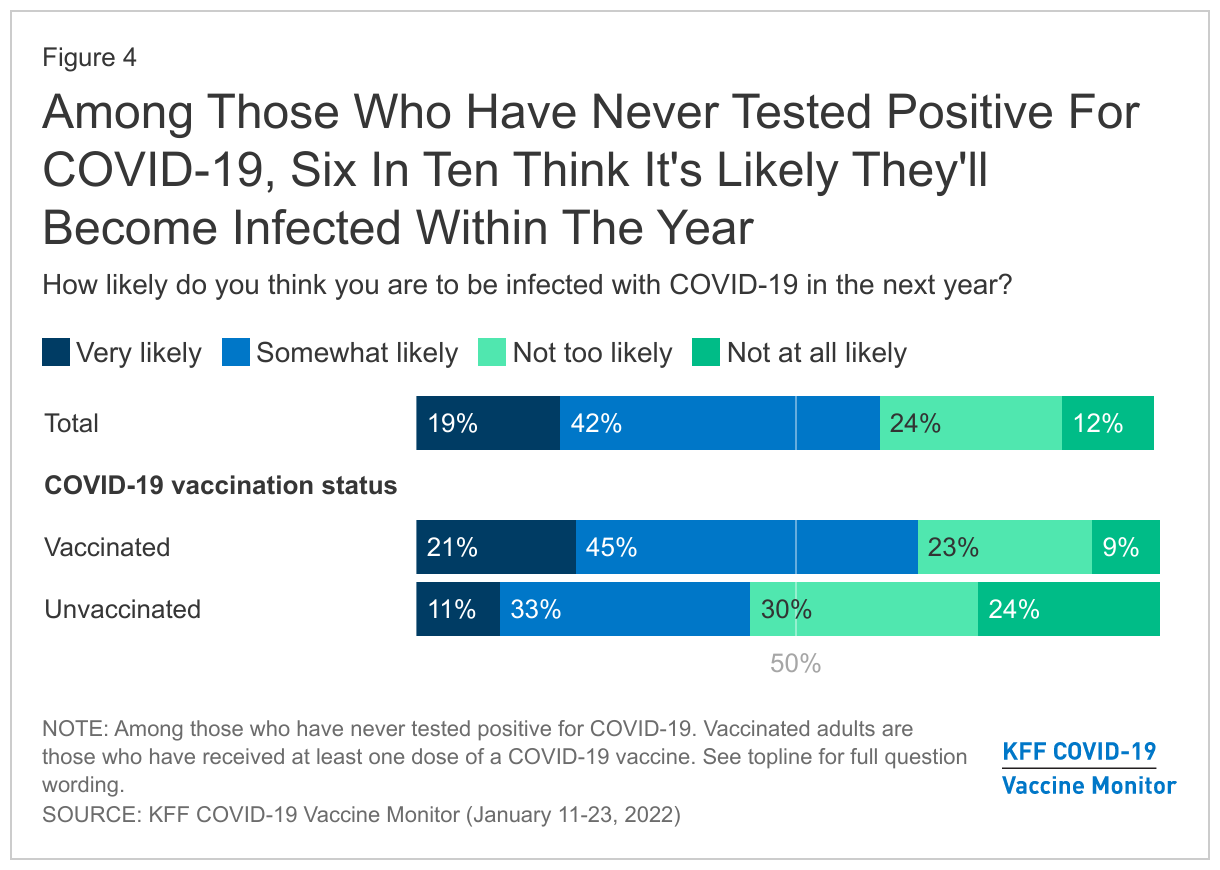
In addition, six in ten (62%) of those who have never tested positive for COVID-19 think it is “very likely” or “somewhat likely” they will become infected in the next year, including two-thirds of those who are vaccinated and 45% of those who are unvaccinated and also have never tested positive.

Among Those Who Have Never Tested Positive For COVID-19, Six In Ten Think It's Likely They'll Become Infected Within The Year

Impact Of Omicron

Omicron’s Impact On Worries

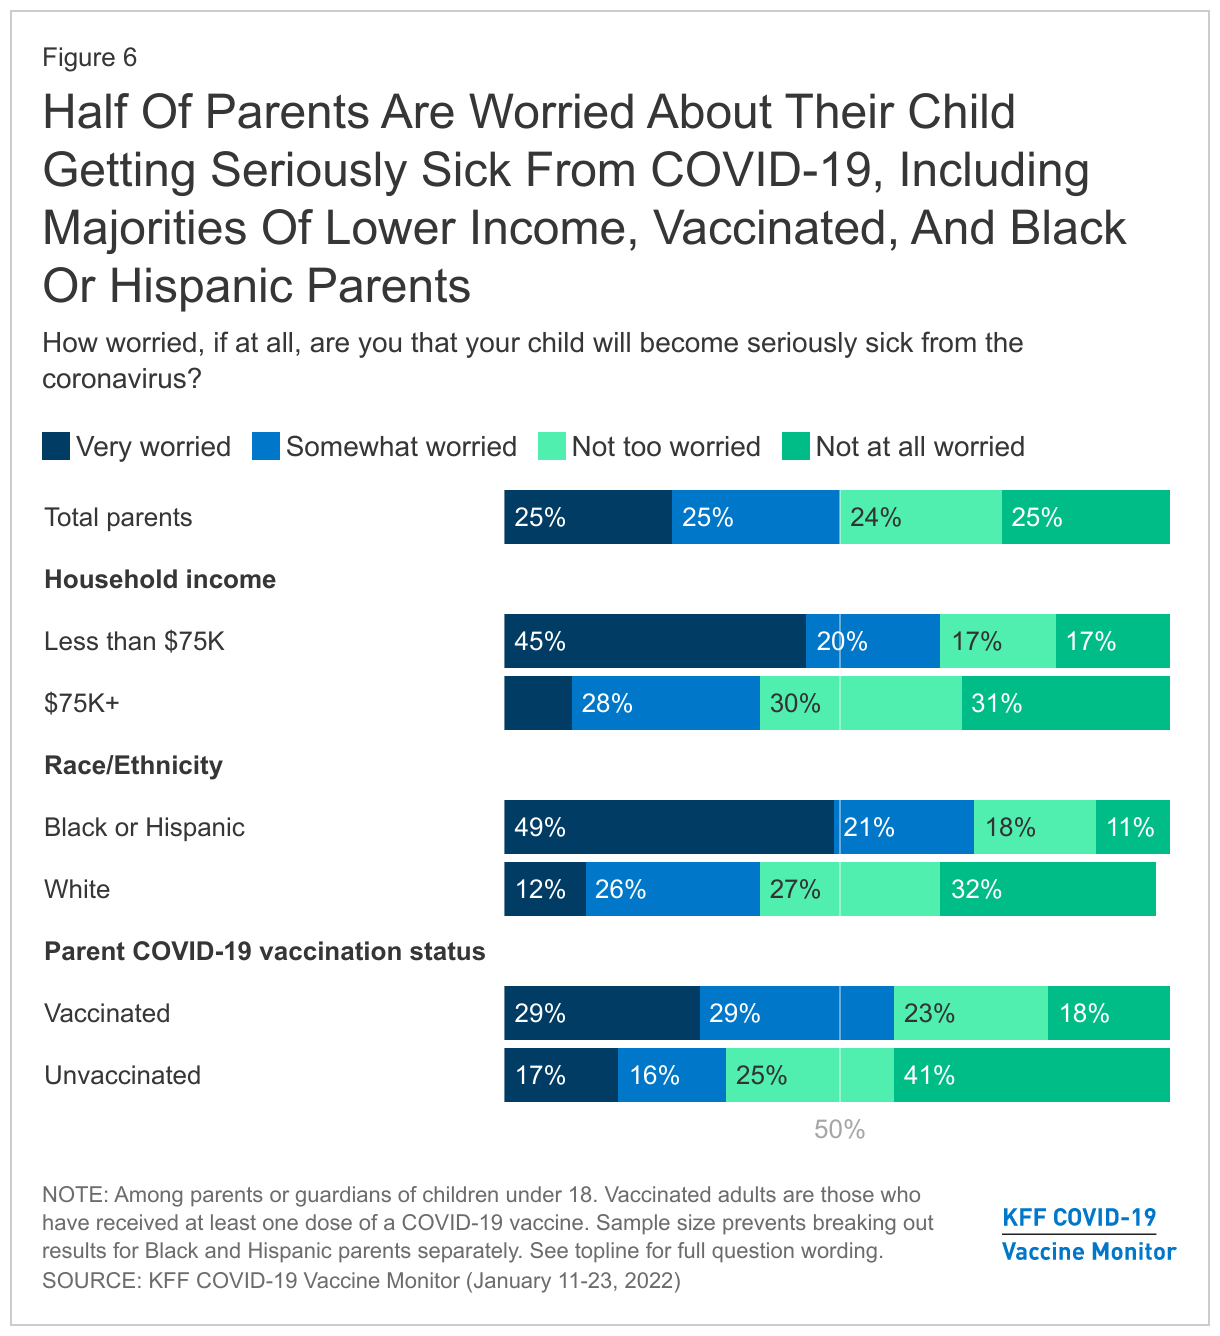
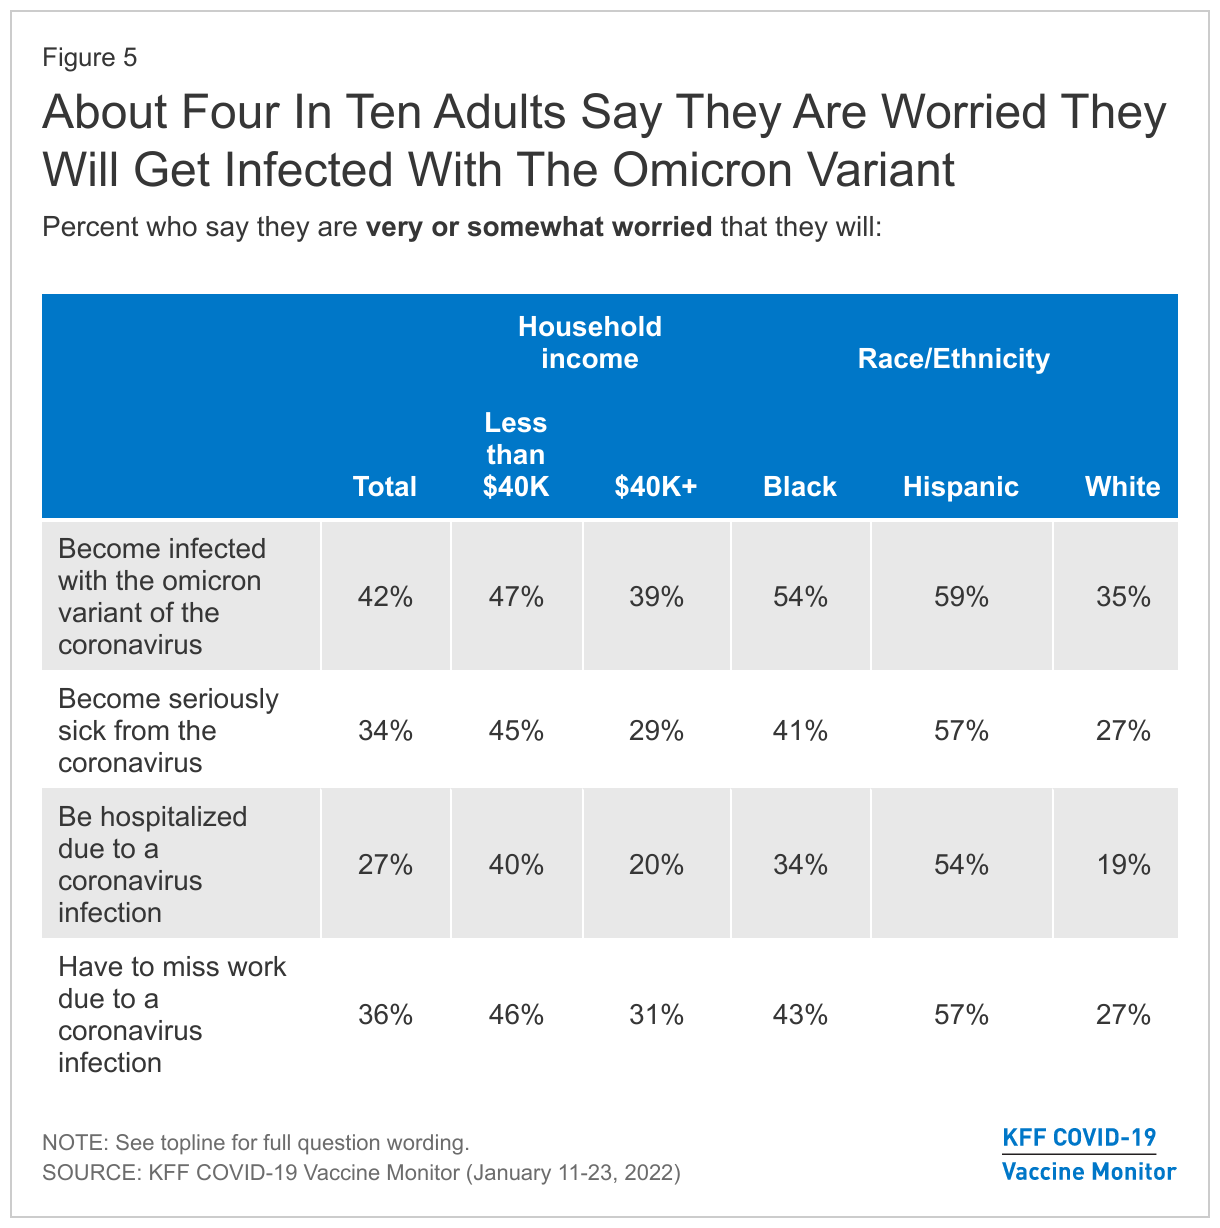
With the omicron variant of COVID-19 spreading across the country, about four in ten adults (42%) say they are “very” or “somewhat” worried that they will become infected with the new variant. The share who are worried about the virus’ impact is somewhat lower, with about a third saying they are worried they will become seriously sick from coronavirus (34%) or will have to miss work due to a coronavirus infection (36%). About a quarter (27%) say they are worried they will be hospitalized for COVID-19. Each of these worries are more prevalent among adults with lower incomes and people of color. For example, Hispanic adults (57%) and Black adults (43%) are much more likely than White adults (27%) to say they are worried about having to miss work due to a coronavirus infection, as are those with incomes under $40,000 compared to those with higher incomes (46% vs. 31%). Hispanic and Black adults are also more likely than White adults to say they are worried about becoming infected with omicron, becoming seriously ill, or being hospitalized due to coronavirus, as are lower-income adults compared to their higher-income counterparts.

About Four In Ten Adults Say They Are Worried They Will Get Infected With The Omicron Variant

Similar to previous KFF Vaccine Monitor findings, vaccinated adults are also more likely than those who are unvaccinated to say they are worried about getting infected with, getting seriously sick from, or being hospitalized due to coronavirus. At least three in ten vaccinated and unvaccinated adults are worried about having to miss work due to a coronavirus infection.

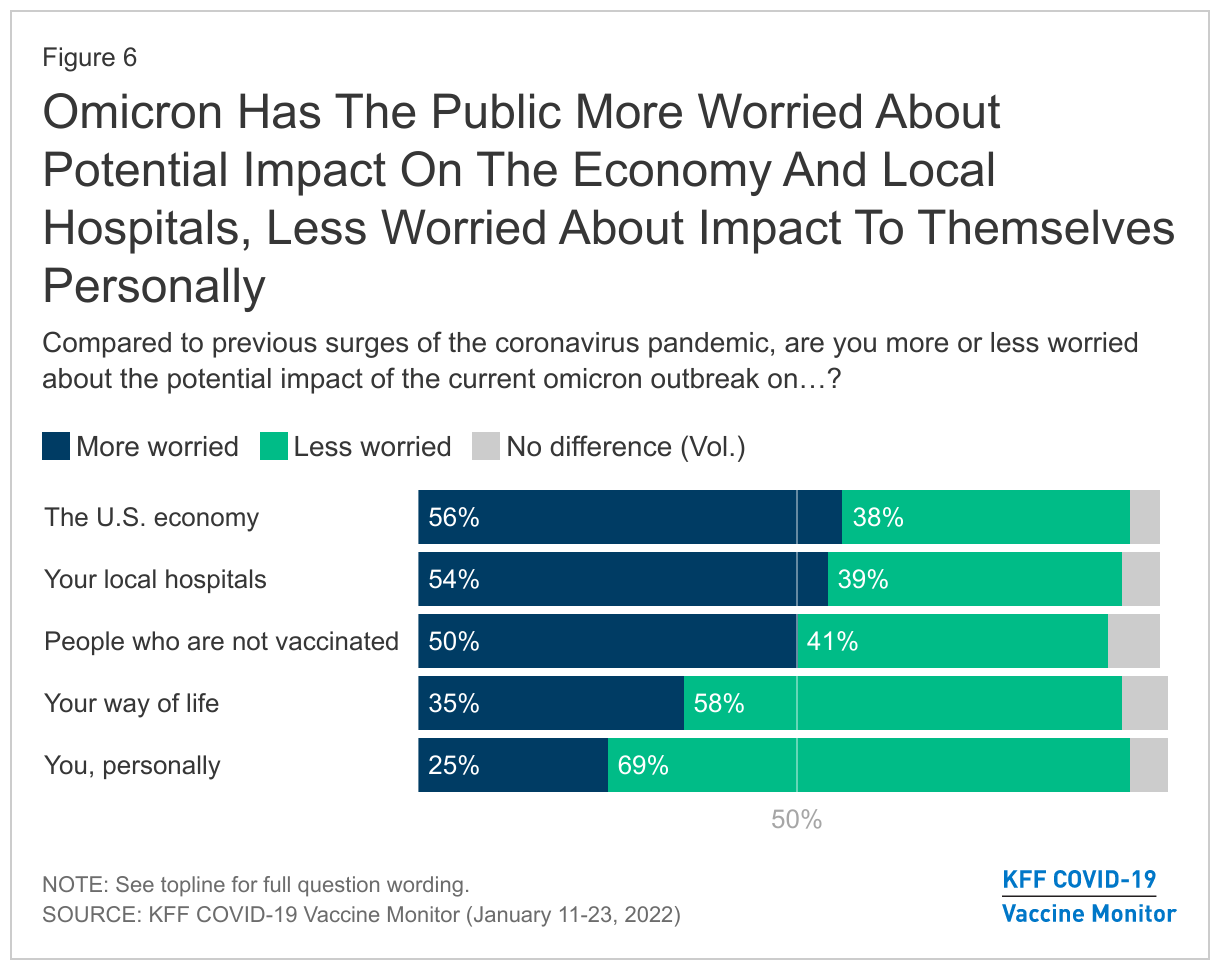
While many adults, and particularly people of color, are worried about the personal impacts of omicron, the public overall says omicron has made them more worried about the pandemic’s impact on the economy, their local hospitals, and people who are unvaccinated. Majorities say that compared to previous surges of the pandemic, they are now more worried about the impact of omicron on the U.S. economy (56%) and on their local hospitals (54%). Half of adults also say they are more worried about omicron’s impact on people who are not vaccinated, however this largely reflects the vaccinated population’s worry about the unvaccinated. Among unvaccinated adults themselves, just 15% say they are more worried about omicron’s impact, compared to 61% of vaccinated adults who are worried about the impact on the unvaccinated.

When it comes to personal impact, the public reports being less worried about omicron than they were about previous waves of the pandemic. Majorities say that compared to previous surges, they are less worried about the impact of omicron on themselves personally (69%) and on their way of life (58%). An even larger share of unvaccinated adults say they are less worried about the impact of omicron on themselves personally (76% of unvaccinated adults, compared to 67% vaccinated) and their way of life (66% of unvaccinated adults, 55% vaccinated).

Omicron Has The Public More Worried About Potential Impact On The Economy And Local Hospitals, Less Worried About Impact To Themselves Personally

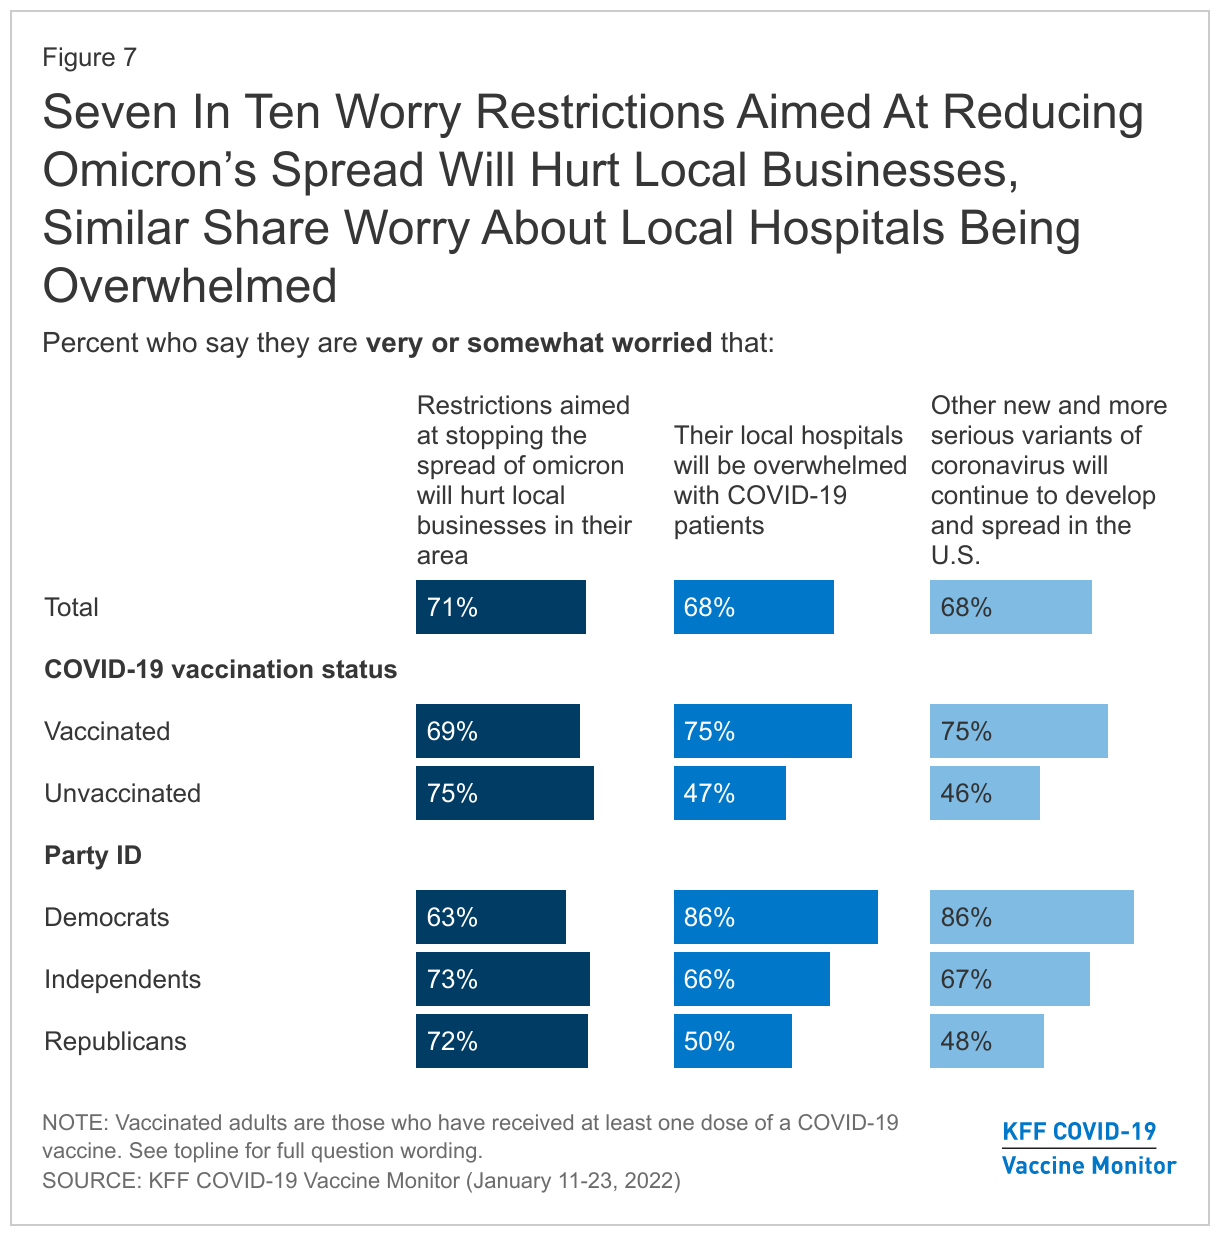
About seven in ten adults (71%) say they are “very” or “somewhat” worried that restrictions aimed at stopping the spread of omicron will hurt local businesses in their area and similar shares (68% each) say they are worried that their local hospitals will be overwhelmed with COVID-19 patients or that other new and more serious variants will spread in the United States. While majorities across partisans express worry about the impact of restrictions on local businesses, Democrats are much more likely than Republicans to worry that their local hospitals will be overwhelmed (86% vs. 50%) or that new variants will develop and spread in the U.S. (86% vs. 48%).

Seven In Ten Worry Restrictions Aimed At Reducing Omicron’s Spread Will Hurt Local Businesses, Similar Share Worry About Local Hospitals Being Overwhelmed

Despite widespread reports of vaccinated individuals becoming infected with the omicron variant, most adults (62%) say “the fact that most vaccinated people who become infected with COVID-19 do not require hospitalization means that the vaccines are working” while about a third (34%) say “the fact that some vaccinated people are becoming infected with COVID-19 means that the vaccines are not working.” Notably, the share who see breakthrough infections as a sign that the vaccines are not working has increased slightly since September (from 26% to 34%), mainly driven by an increase among Republicans (from 39% to 50%) and unvaccinated adults (from 66% to 84%).

Majority Of Public See Low Hospitalization Of Vaccinated Adults As Evidence The Vaccines Are Working, But Unvaccinated View Breakthrough Infections As A Sign That They Are Not

Omicron’s Impact On Behaviors

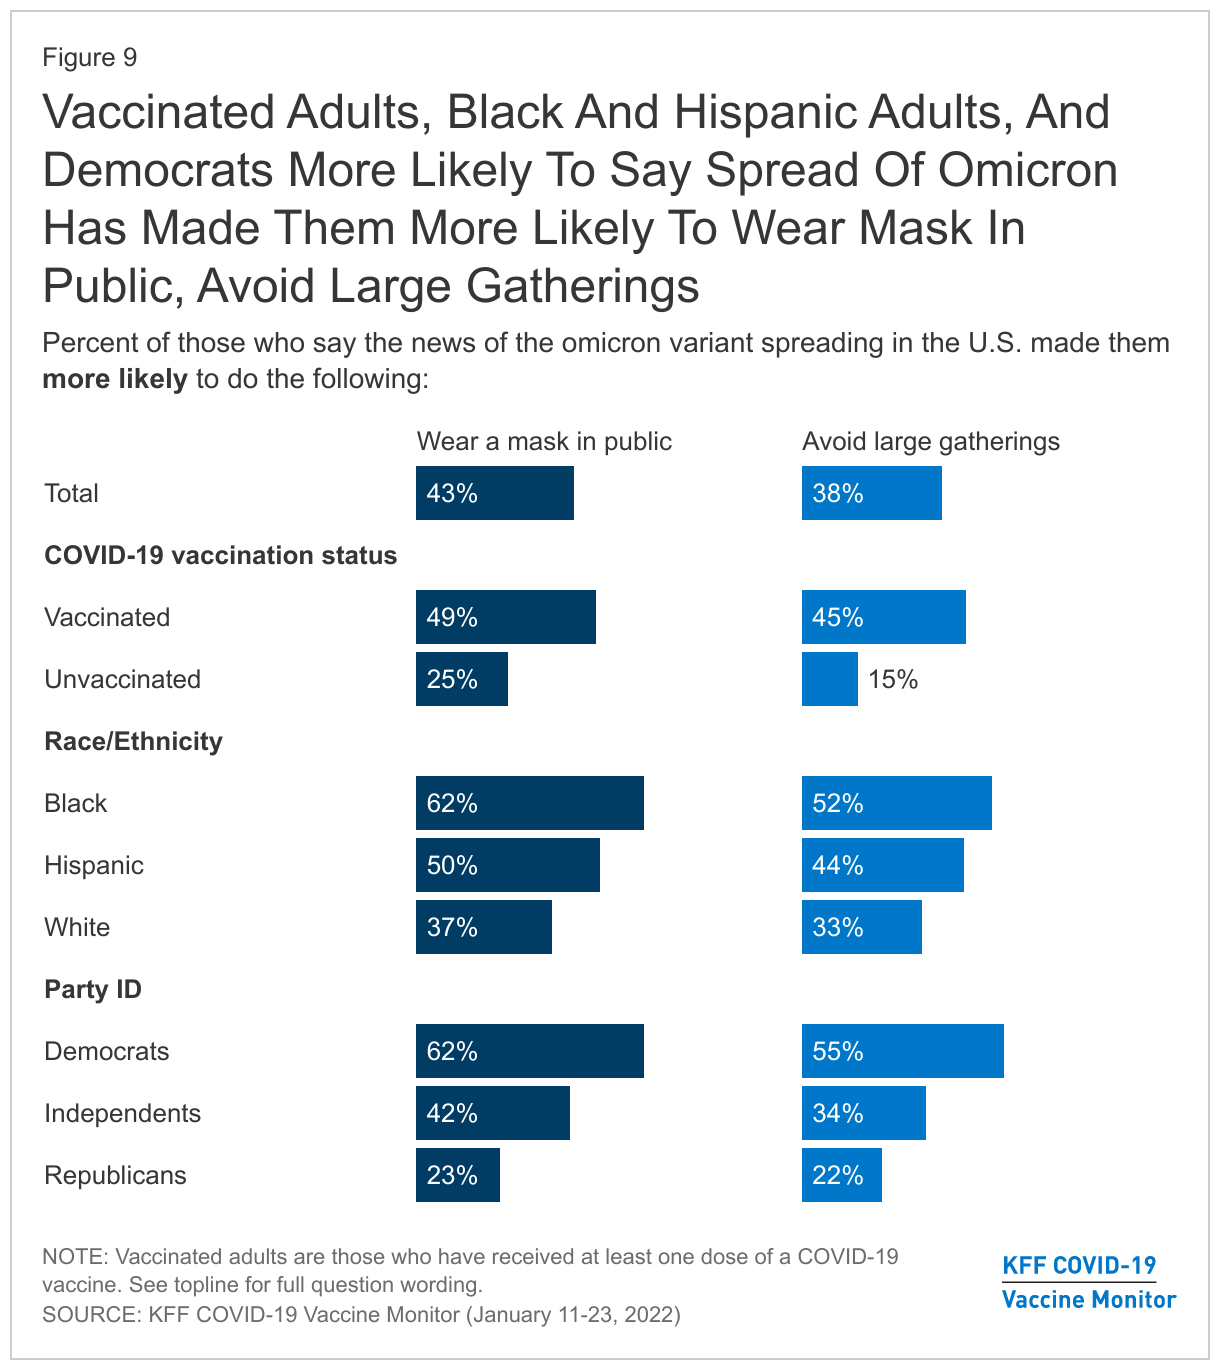
When asked about the impact of omicron on their own behaviors, 43% of adults say the spread of the new variant has made them more likely to wear a mask and nearly as many (38%) say it has made them more likely to avoid large gatherings. Reflecting their higher levels of worry about becoming infected with omicron, Black and Hispanic adults are more likely than White adults to say the new variant has prompted them to change their behavior, as are vaccinated adults compared to unvaccinated adults and Democrats compared to Republicans.

Vaccinated Adults, Black And Hispanic Adults, And Democrats More Likely To Say Spread Of Omicron Has Made Them More Likely To Wear Mask In Public, Avoid Large Gatherings

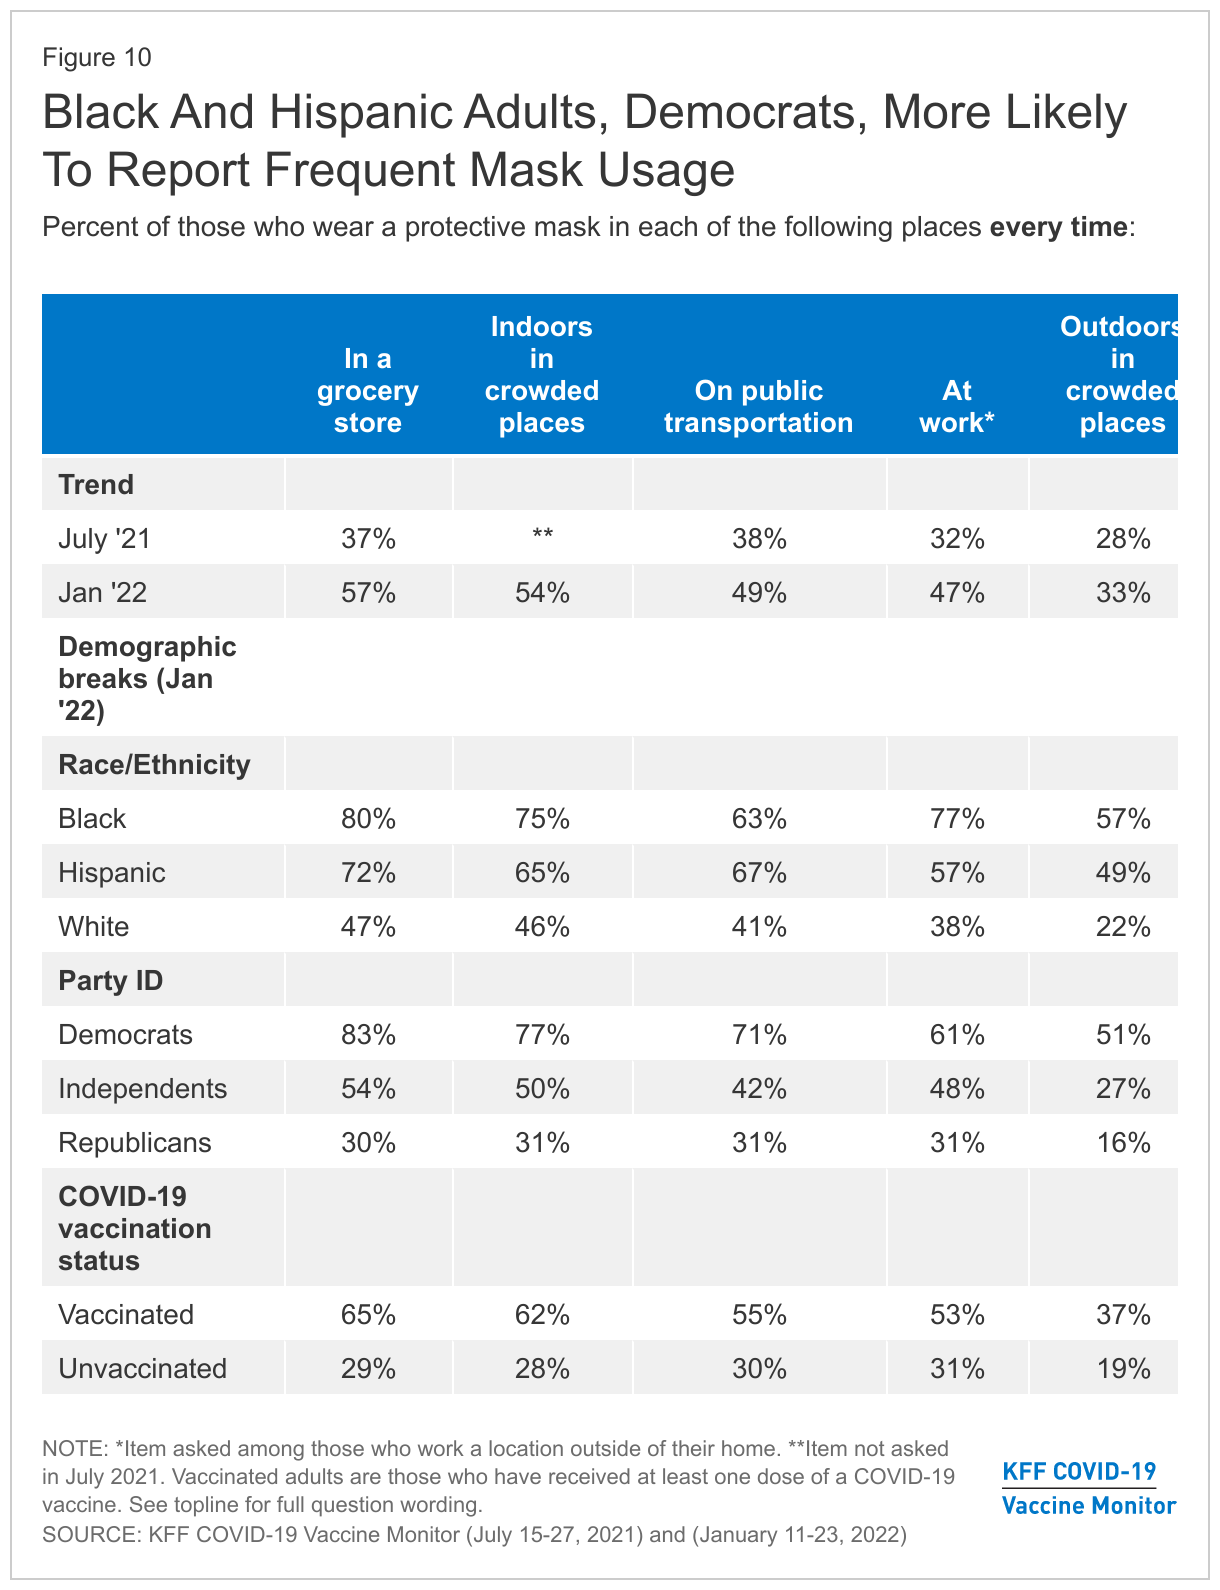
Trend data also reveals that self-reported mask usage has increased among the public since last summer. A majority of adults (57%) now say they wear a mask every time when they are in a grocery store, a 20-percentage point increase since July 2021. About half of the public say they wear masks every time at work (47%) or on public transportation (49%), up from about a third in July. While a majority of adults (54%) say they were a mask every time they are in an indoor crowded place, fewer (33%) report consistent mask usage in crowded outdoor spaces. Overall, Black and Hispanic adults are more likely than White adults to report consistent mask usage, as are vaccinated adults compared to those who are not vaccinated. Across partisans, Democrats are roughly two to three times as likely as Republicans to say they wear a mask every time in each of the situations presented.

Black And Hispanic Adults, Democrats, More Likely To Report Frequent Mask Usage

After holding relatively steady for several months, COVID-19 vaccine uptake inched up between November 2021 and January 2022. More than three-quarters of adults (77%) now report that they have received at least one dose of a COVID-19 vaccine, up from 73% in November. One percent say they plan to get vaccinated as soon as possible, 4% say they want to “wait and see” before getting a vaccine, and 3% say they will get vaccinated only if they are required for work, school, or other activities. One in eight adults (14%) say they will “definitely not” get vaccinated for COVID-19, a share that has held generally constant since December 2020.

More Than Three In Four Adults Say They Have Received At Least One Dose Of A COVID-19 Vaccine

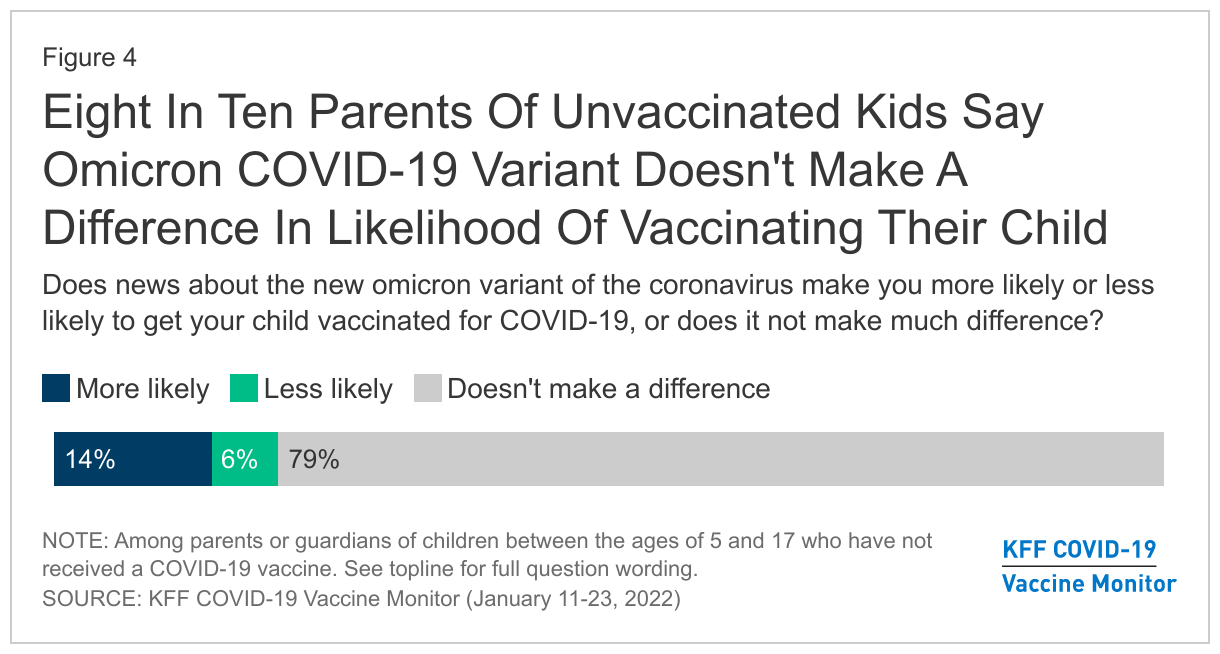
The spread of omicron in the U.S. does not appear likely to motivate more unvaccinated adults to get the COVID-19 vaccine. Three in four unvaccinated adults (76%) say that news of the omicron variant spreading has not made much of a difference as to whether they will get the vaccine while just 8% said it has made the more likely to get vaccinated and 15% say it has made them less likely to do so.

Looking at demographic patterns of COVID-19 vaccine uptake, we continue to find that Democrats, college graduates, older adults, and those living in urban areas report being vaccinated at higher rates than Republicans, those without college degrees, younger adults, and rural residents.

The age gap in vaccine uptake appears to be shrinking somewhat with 73% of 18-29 year-olds and 72% of 30-49 year-olds now saying they are vaccinated, compared to about two-thirds in November. In addition, the shares of Republicans (63%) and independents (76%) who report being vaccinated reached new highs this month, though still lagging significantly behind the vaccination rate among Democrats (91%). Notably, a quarter of Republicans (26%) continue to say they will “definitely not” get vaccinated, a share that has held relatively steady since December 2020.

White Evangelicals And Republicans Continue To Lag In COVID-19 Vaccine Uptake

Vaccine Booster Uptake And Intentions

A recent study released by the Centers for Disease Control and Prevention (CDC) found that a booster dose was effective in preventing hospitalization due to COVID-19 and the CDC announced earlier this month that a booster dose will be required for adults to be considered “up-to-date” on their COVID-19 vaccinations. We find that among adults overall, about four in ten (42%) have received a booster dose, while 34% have received at least one vaccine dose but are not boosted and 22% remain unvaccinated.

Mirroring their earlier uptake of the initial vaccine doses, Democrats (62%) are more likely than independents (37%) and Republicans (32%) to have received a booster. Similarly, two-thirds of adults 65 and older and half of adults ages 50-64 have received a booster, compared to three in ten adults ages 30-49 (31%) and a quarter of those ages 18-29 (24%) who say the same.

Notably, across racial and ethnic groups, White adults (46%) are more likely than Black (31%) and Hispanic (37%) adults to say they have received a booster dose of the vaccine, while larger shares of Black and Hispanic adults are vaccinated but not boosted (49% and 39% respectively, compared to 29% of White adults). This may at least partially reflect some Black and Hispanic adults not yet being eligible for a booster if their initial course of vaccination was completed more recently, since access issues and other concerns delayed initial vaccine uptake for some people.

White Adults, Older Adults, And Democrats Among Those More Likely To Have Received A Booster Dose Of The COVID-19 Vaccines

Among vaccinated adults who are likely eligible for a booster dose (those who either got a booster or completed an initial full course of vaccine at least six months ago), seven in ten have gotten a booster. This rises to 86% among those ages 65 and over and 77% among those ages 50-64 who are likely booster-eligible.

However, there is evidence that booster uptake and access may be lagging among the booster-eligible population of Black adults. Among the likely booster-eligible population, 57% of Black adults compared with 69% of Hispanic adults and 72% of White adults have gotten a booster.

Seven In Ten Adults Who Are Likely Eligible For A COVID-19 Booster Have Received One, Including Higher Shares Of Older Adults

The racial and ethnic gap in booster uptake does not appear to be driven by a lack of desire among Black and Hispanic adults to get boosted. Among those who are vaccinated but not yet boosted, four in ten (39%) say they want to get a booster dose as soon as they can, including 41% of Black adults and nearly half of Hispanic adults (47%).

On the other hand, resistance to getting a booster does appear to be a factor in the partisan gap in booster uptake. A majority (58%) of Democrats who are vaccinated but not yet boosted say they want to get a booster dose as soon as they can, compared to just 18% of Republicans who have not yet gotten a booster. Indeed, about half (53%) of vaccinated but not yet boosted Republicans say they will either “definitely not” get a booster (23%) or will only do so if they are required (30%).

Most vaccinated but not boosted adults (60%) say news of the omicron variant spreading has not made much of a difference as to whether they will get a booster. However, about three in ten (29%) say the spread of omicron has made them more likely to get a booster shot, a share that rises to 41% among Hispanics who are vaccinated but not boosted.

Among Vaccinated Adults Who Have Not Yet Received A Booster Dose, Four In Ten Say They Will Get One As Soon As They Can

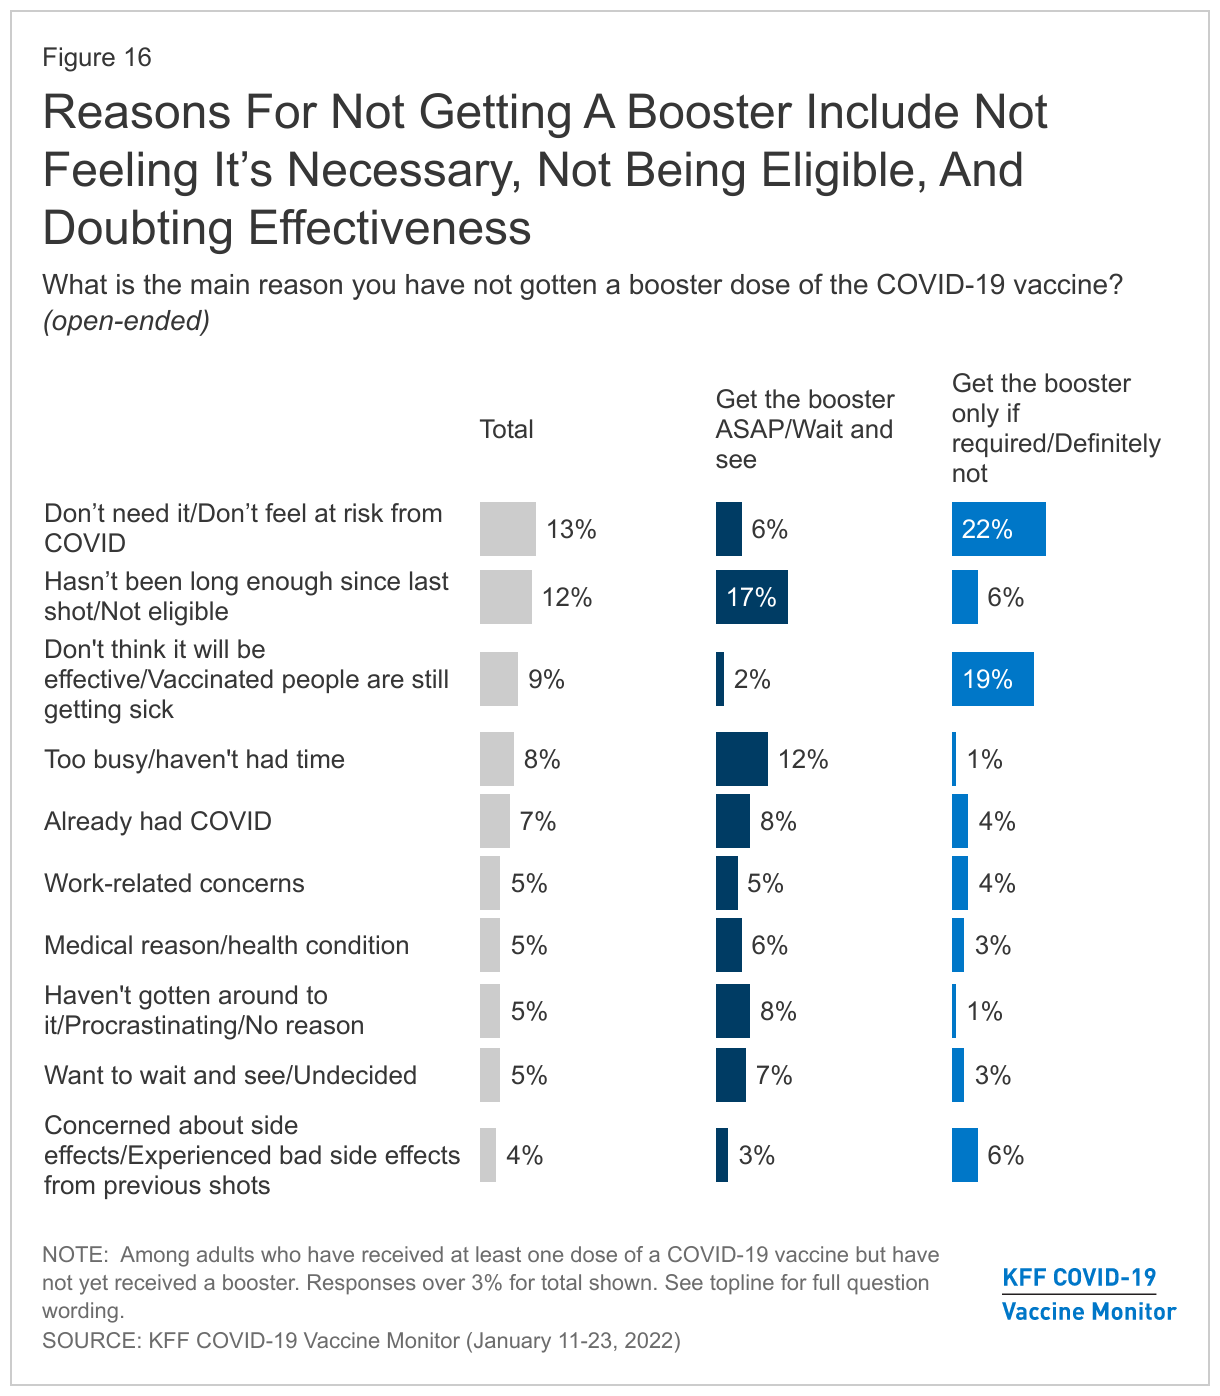
When asked to say in their own words the main reason they have not gotten a booster dose, about one in eight vaccinated but not boosted adults offer that they feel that their initial vaccination doses are enough or that they don’t need it (13%) and a similar share say they are currently not eligible for a booster (12%). Other common reasons provided include doubts about the efficacy of boosters, including those who cite the fact that vaccinated people are still getting sick (9%), being too busy or not having time to get a booster (8%), having already gotten COVID-19 (7%), work-related concerns such as having to miss work to get the shot or recover from side effects (5%), medical issues (5%), procrastination (5%) and wanting to wait and see how boosters are working (5%).

Among those who are more open to getting a booster (those who say they want to get a booster dose as soon as possible or wait and see), the most common reasons given for not getting a booster are that they aren’t eligible (17%), are too busy (12%), already had COVID-19 (8%), or haven’t gotten around to it or have been putting it off (8%). Those who are more reluctant (saying they will get a booster only if required or will definitely not get one) cite different reasons for not getting boosted, with the top answers being that they feel they don’t need a booster or feel the initial vaccination is enough (22%), or that they question the boosters’ effectiveness (19%).

Reasons For Not Getting A Booster Include Not Feeling It’s Necessary, Not Being Eligible, And Doubting Effectiveness

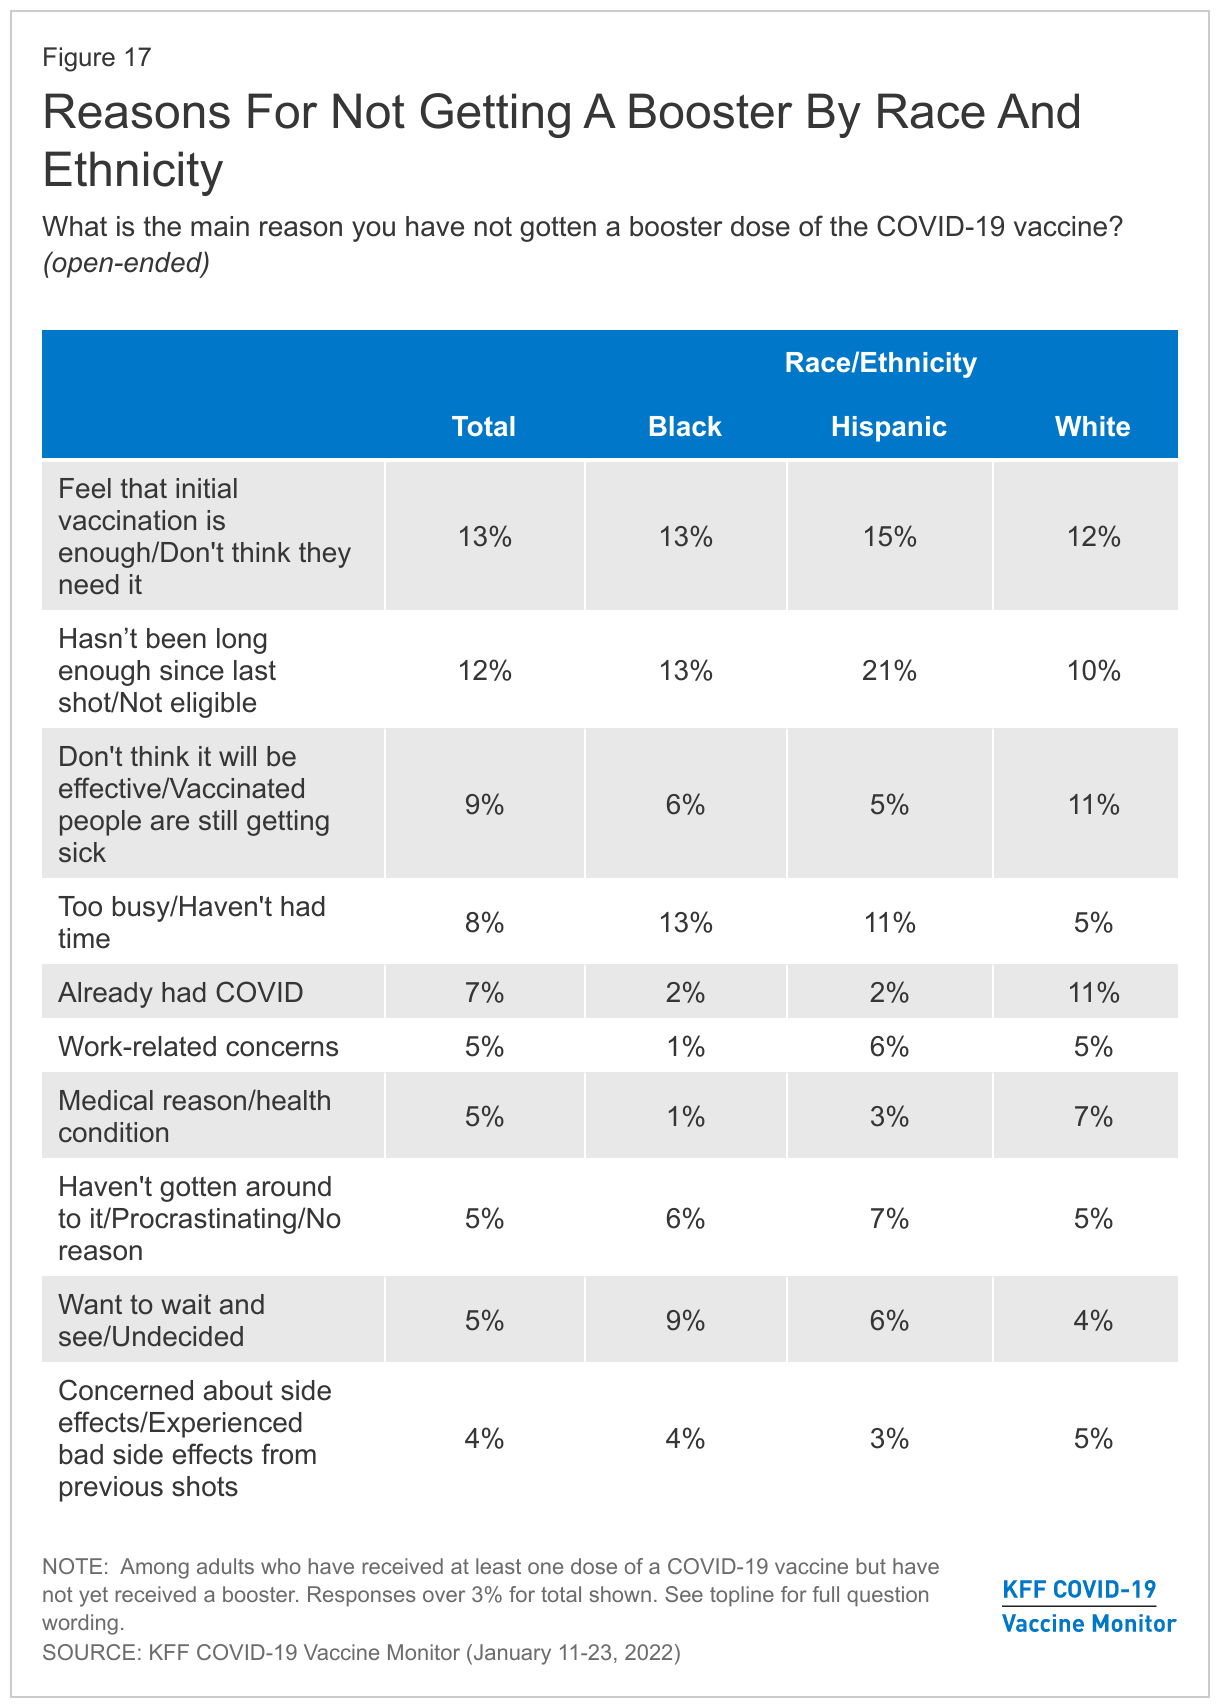
Across racial and ethnic groups, one in five Hispanic adults who are vaccinated but not boosted (21%) cite lack of eligibility as the main reason they have not gotten a booster dose, as do 13% of Black adults and 10% of White adults. Notably, about one in ten vaccinated but not boosted Black and Hispanic adults said they have been too busy or haven’t had time to get a booster dose of the vaccine.

Reasons For Not Getting A Booster By Race And Ethnicity

In their own words: What is the main reason you have not gotten a booster dose of the COVID-19 vaccine?

“I feel that my initial doses were enough” – 36 year-old male, White, Texas

“Because I received my second shot and I have to wait 4 more weeks to receive the booster shot.” – 33 year-old male, Black, Maryland

“Not enough time between doses” – 63 year-old male, White, Oregon

“Because I have to wait until 6 months” – 67 year-old male, Hispanic, Arizona

“First, I don't trust the vaccine and I'm seeing a lot of people vaccinated and still getting sick” – 39 year-old female, Hispanic, Nevada

“Because I know a few people that received the booster and still contracted covid” – 36 year-old female, Black, Pennsylvania

“I don’t think it makes any difference if people are getting vaccinated and people are still getting sick senior citizens are dying” – 56 year-old male, White, Tennessee

“No appointments in my area” – 65 year-old male, Black, Maryland

“I haven't had any time off from work” – 31 year-old female, Black, Mississippi

“Missing work from side effects” – 18 year-old male, Hispanic, Missouri

“Tired of the federal government telling me what to do” – 55 year-old female, White, Maryland

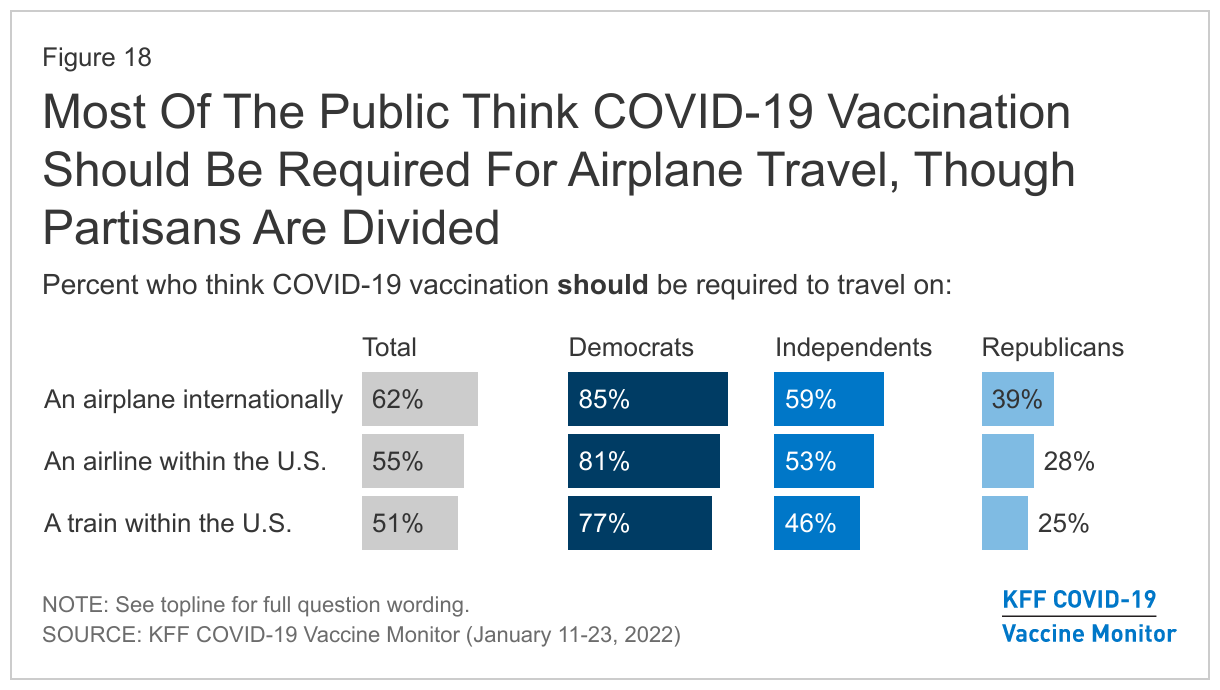
The spread of the omicron variant has led some disease experts to call for COVID-19 vaccine mandates for air travel. Overall, most of the public think that COVID-19 vaccination should be required for international air travel (62%) and for domestic air travel (55%) and about half think there should be a vaccination requirement for train travel within the U.S. (51%). Unsurprisingly, there are large partisan differences on whether to institute vaccination requirements for travel. More than three in four Democrats think there should be a vaccine requirement for air travel and train travel, whereas about four in ten Republicans (39%) think a requirement should be in place for international travel, and about one in four think a requirement should be in place for domestic travel by air (28%) or train (25%).

Most Of The Public Think COVID-19 Vaccination Should Be Required For Airplane Travel, Though Partisans Are Divided

COVID-19 Testing

How Many Adults Have Personally Tested Positive For COVID-19?

Almost a quarter of adults now say they have personally tested positive for COVID-19 at some point (23%), while another 12% say someone in their household has tested positive and 49% say someone else they know has. Around a third of unvaccinated adults say they have tested positive at some point (34%), significantly higher than the share among vaccinated adults (21%).

Vast Majority Of Adults Know Someone Who Has Tested Positive For COVID-19, Including Nearly A Quarter Who Report Personally Testing Positive

Notably, while unvaccinated adults are more likely than those who are vaccinated to say they tested positive for COVID-19 at some point, similar shares of vaccinated and unvaccinated adults say they tested positive within the past month amid the omicron surge (7% and 10%, respectively).

Interactive DataWrapper Embed

Amid concerns that official COVID-19 case counts may be an underestimate if many people are taking at-home tests that are not recorded by government agencies, about eight in ten of those who say they tested positive in the past month say they received a positive result on an in-person test (66%) or on both an in-person and at-home test (17%).

One in six (16%) adults who received a positive test result in the past month (representing about 1% of all U.S. adults) say that result came on an at-home test only. With few states or localities offering residents a way to report their at-home tests, these results are unlikely to be included in official case counts.

Experiences With Testing Access

With COVID-19 cases surging to unprecedented levels over the past two months, many U.S. adults report difficulty accessing both at-home and in-person COVID-19 tests.

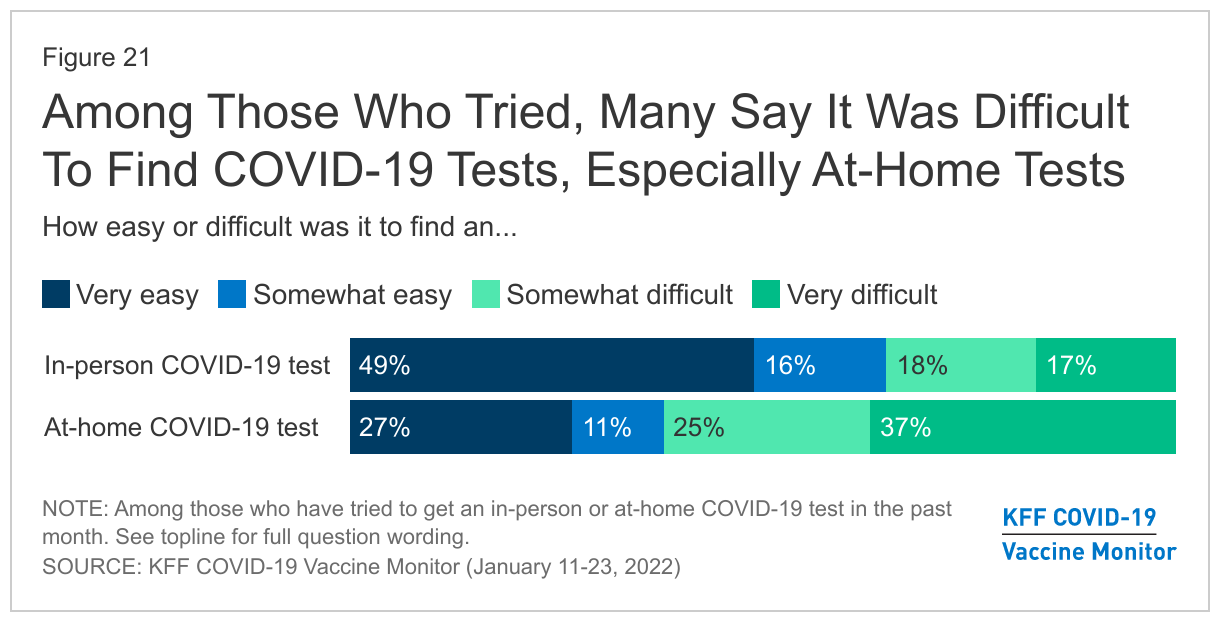
While many made an effort to find testing for COVID-19, some – depending on what type of test they sought – struggled with the task. A majority (65%) of adults who tried to get an in-person COVID-19 test in the past month say it was easy, though a substantial share, 35%, say it was difficult. At-home tests presented even more of a challenge, with 62% of those who tried to find an at-home test reporting it was difficult and 38% saying it was easy.

Among Those Who Tried, Many Say It Was Difficult To Find COVID-19 Tests, Especially At-Home Tests

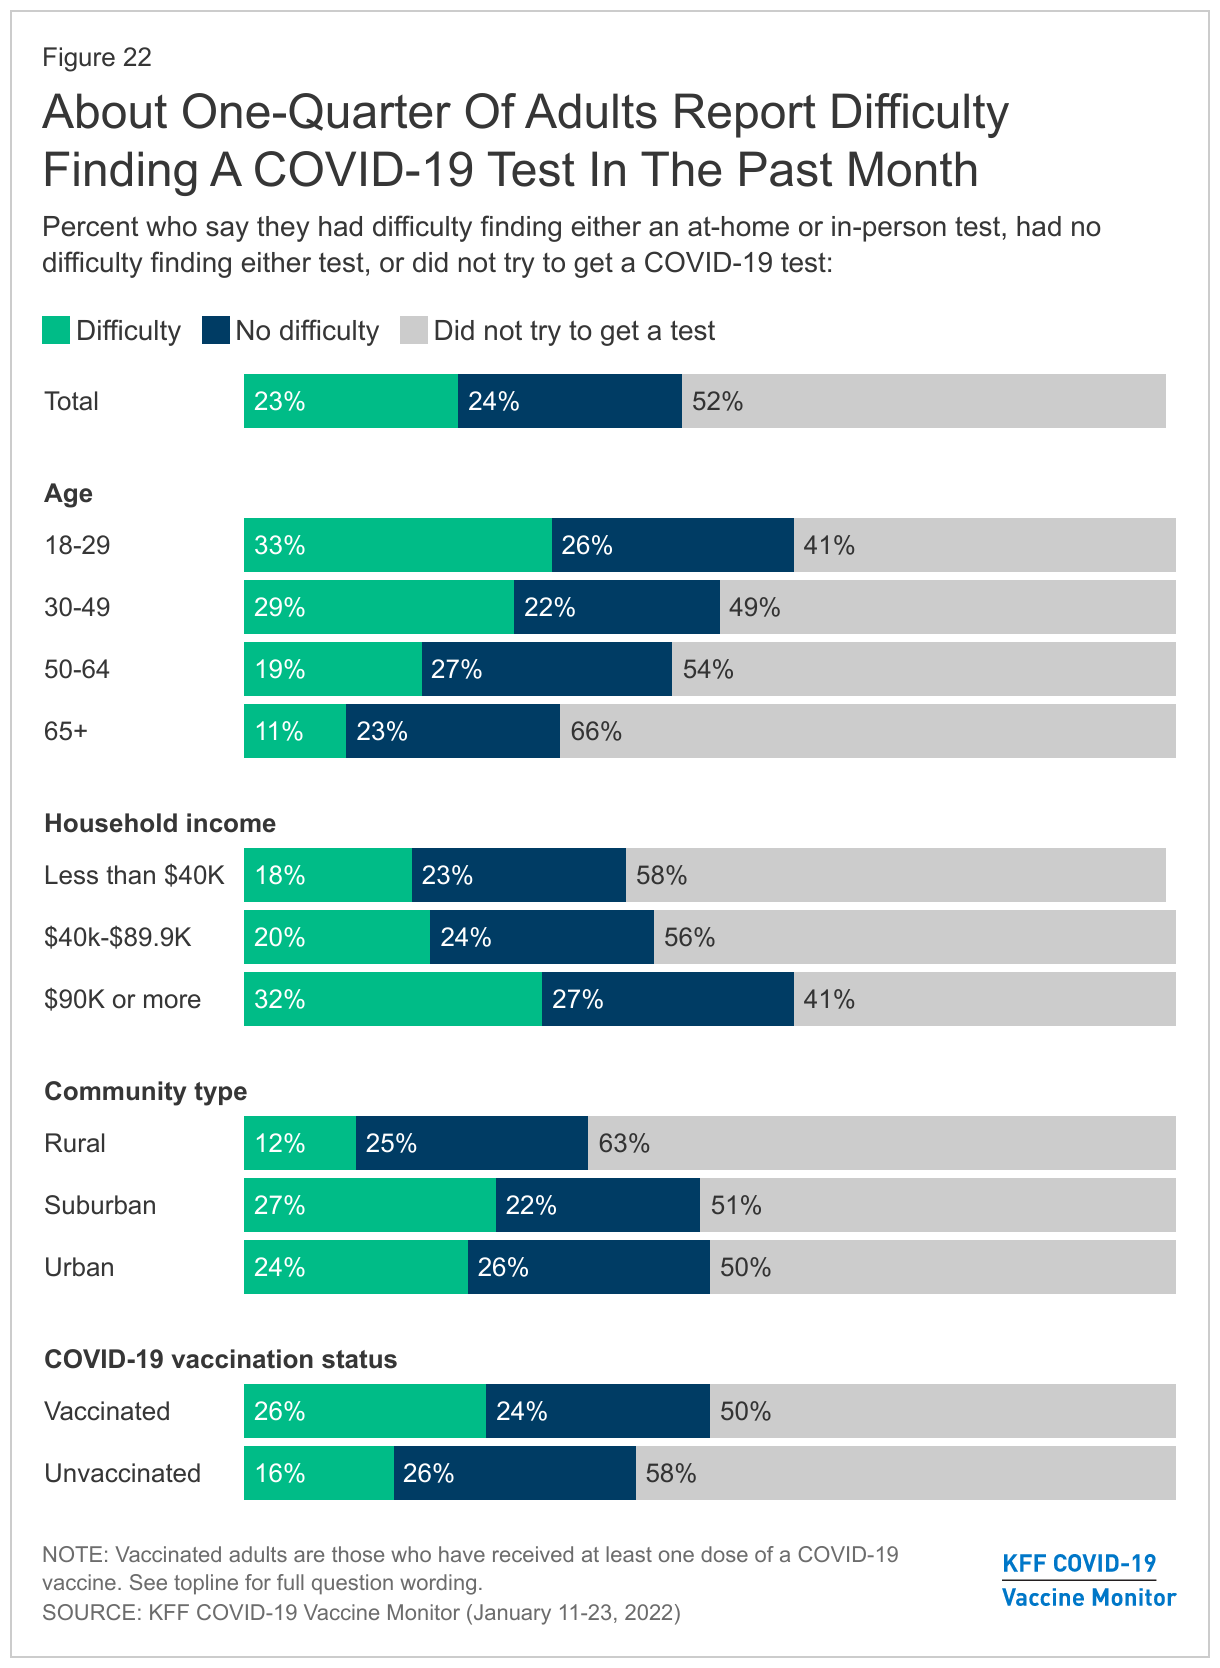
Overall, 23% of all adults say that they tried to get either an in-person or at-home test in the past month and had difficulty finding one, 24% tried and didn’t have any difficulty, and 52% didn’t try to access either type of test. Suburban (27%) and urban (24%) residents are more likely than rural residents (12%) to report difficulties finding tests in the past month. As well, higher shares of young adults (33% of those ages 18-29) and adults with high incomes (32% of those with a household income of $90K or more a year) reported difficulties finding tests. These differences are largely a reflection of the higher shares of these groups who said they attempted to purchase at-home tests, which were often in short supply.

About

The vast majority (89%) of those who attempted to get an in-person COVID-19 test in the past month say they were able to get one, including 58% who say they got a test on the first day they wanted one. However, 11% of those who tried to get such a test (4% of all adults) say they were unable to get an in-person test, and 23% (7% of all adults) say they had to wait 2 days or more to be tested. Combined with the longer wait time for the results of in-person tests, this could result in delays in returning to work or other activities for people who were exposed or experiencing symptoms of COVID-19.

Among those who tried to get an at-home test, one-third (33%, or 9% of all adults) say they were unable to get one, mainly because tests were not available rather than being too expensive (91% vs. 2% among those who tried but could not get an at-home test).

Perceptions Of Test Access In Local Areas

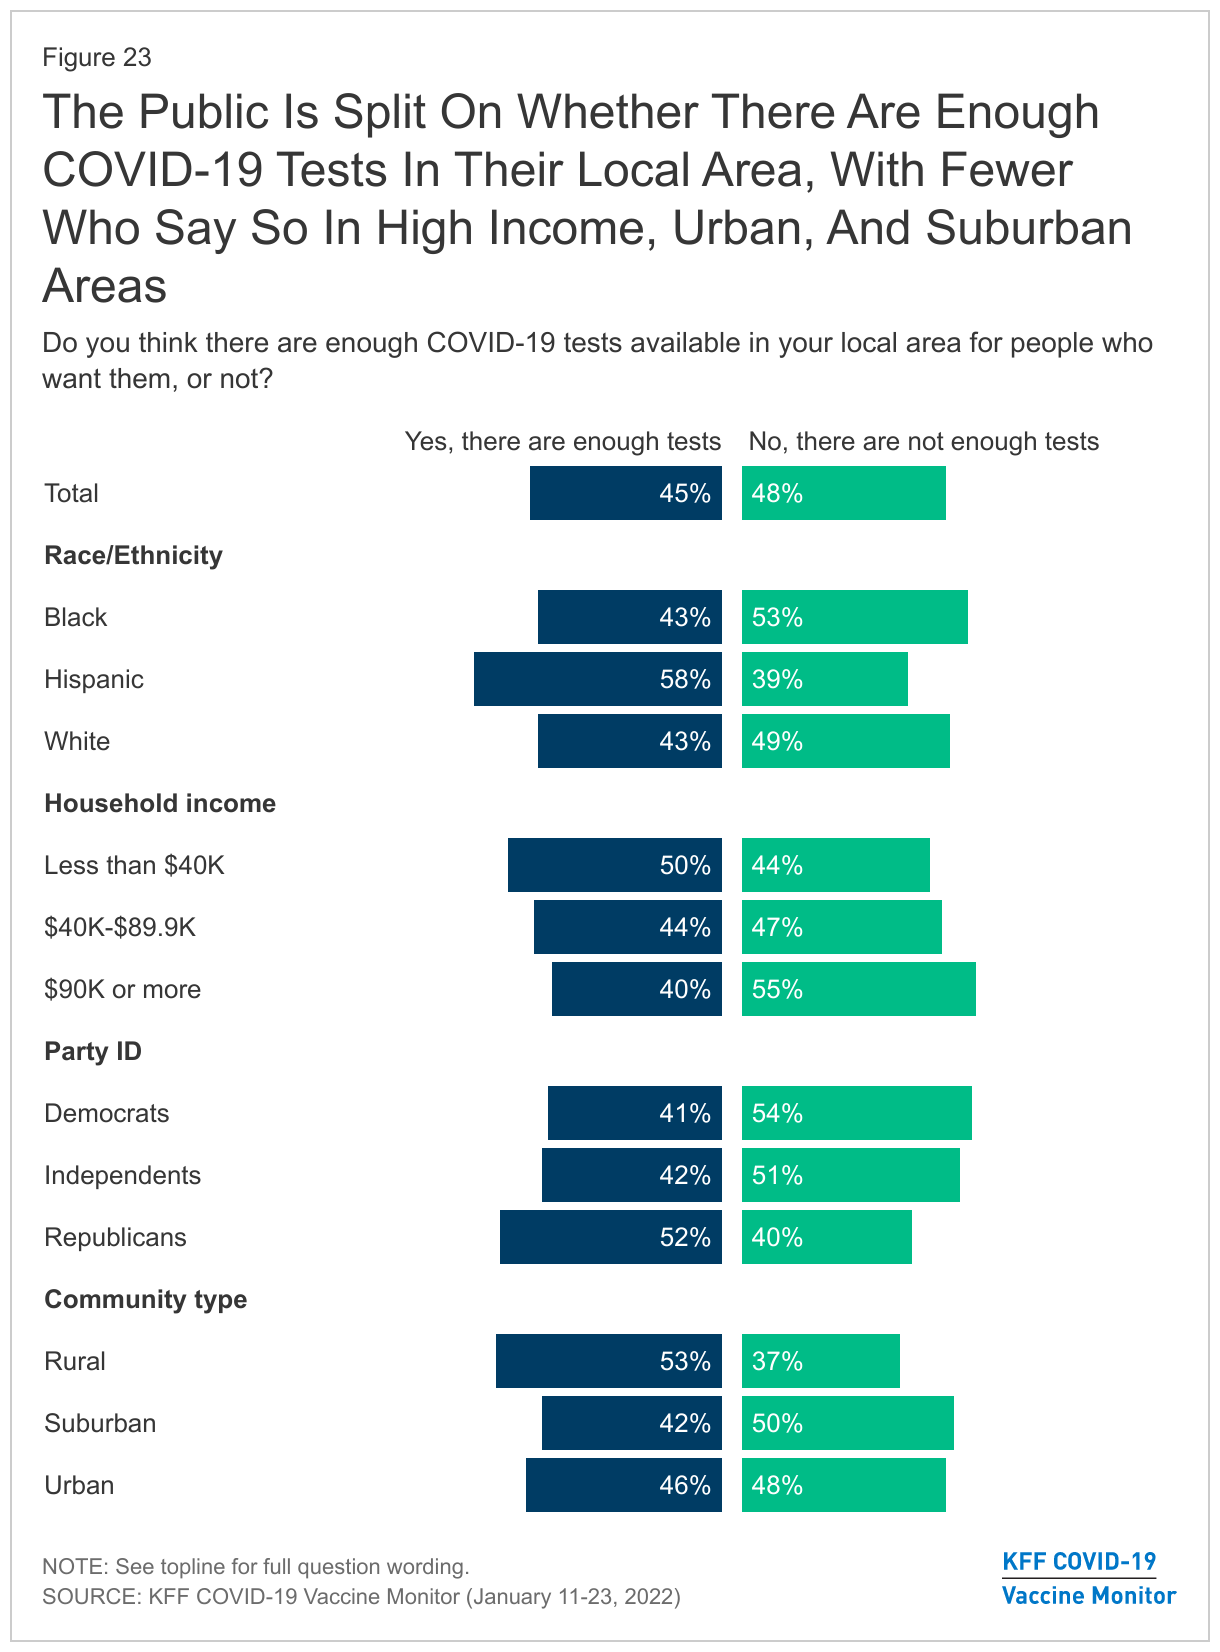
Beyond their personal experiences, about half of adults (48%) feel that there are not enough COVID-19 tests available in their local area for people who want them, while 45% believe there are enough tests. Residents of rural areas are more likely to think there are enough tests in their area (53%) compared to suburban residents (42%). President Biden announced on January 14th that Americans could order at-free home tests beginning on January 19th, while the survey was still in the field.

Adults with higher incomes and those in urban and suburban areas are more likely to feel that the testing supply isn’t adequate, which may reflect the fact that they were more likely to say they have sought out at-home tests, which many people reported difficulty finding.

The

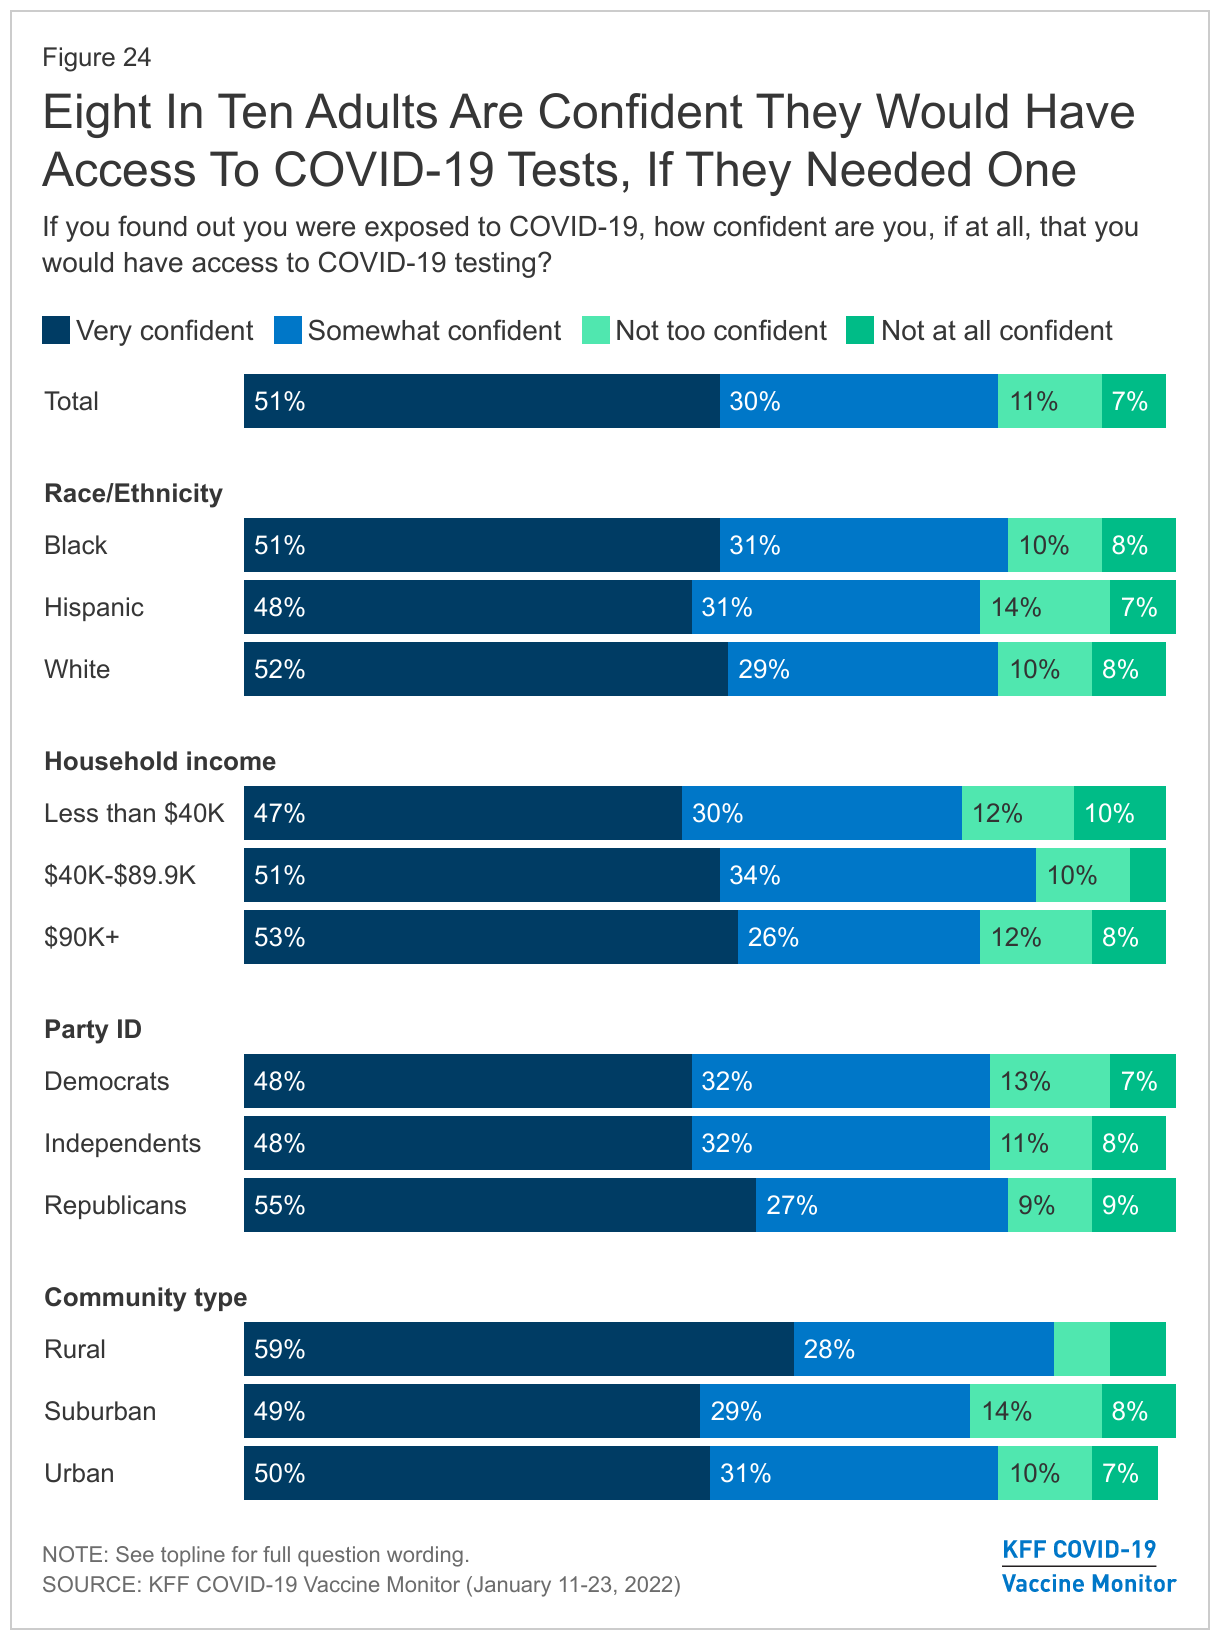
Despite reported difficulty accessing tests, most adults are confident they would be able to access COVID-19 testing if needed. About eight in ten adults overall say they are confident that they would have access to COVID-19 testing if they were exposed to the virus (81%), with about half saying they are very confident (51%).

Eight

Who Does The Public Blame For Issues With Testing?

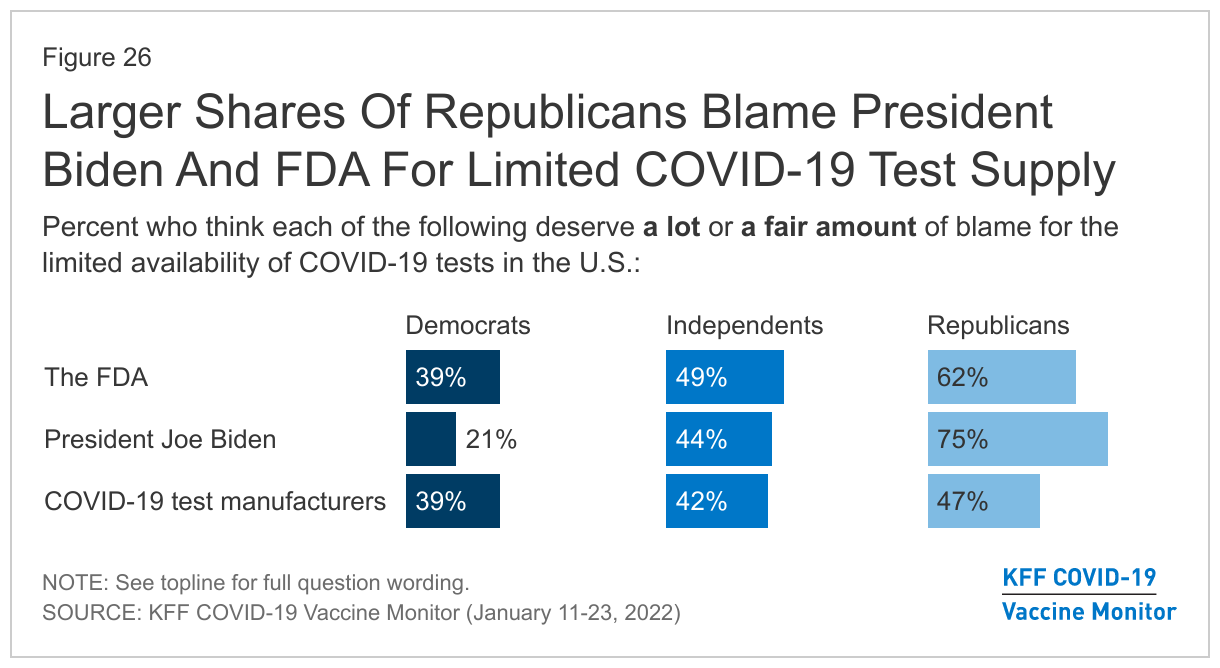
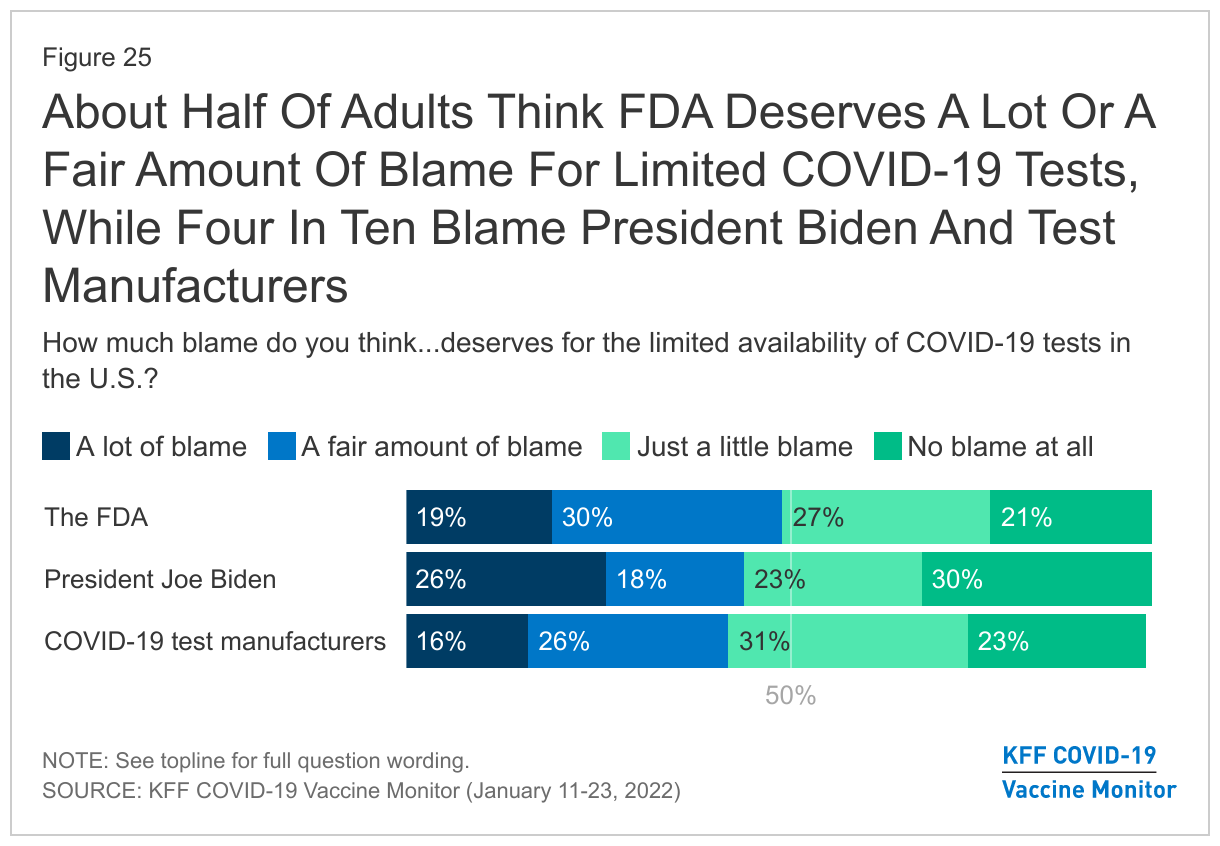
When asked who is responsible for the limited availability of COVID-19 tests in the U.S., around half of adults (49%) say that the FDA deserves a lot or a fair amount of blame for the limited availability of COVID-19 tests in the United States. Slightly fewer think President Joe Biden deserves a fair amount or a lot of blame (44%) with a similar number who say the same about the COVID-19 test manufacturers (41%). However, more adults say that Biden deserves a lot of blame (26%), compared to the FDA (19%) and test manufacturers (16%).

About Half Of Adults Think FDA Deserves A Lot Or A Fair Amount Of Blame For Limited COVID-19 Tests, While Four In Ten Blame President Biden And Test Manufacturers

Republicans and unvaccinated adults are more likely than Democrats and vaccinated adults to place at least a fair amount of blame for test shortages on President Biden and on the FDA. Three in four Republicans (75%) and more than four in ten independents (44%) say President Biden deserves a lot or a fair amount of blame for the limited availability of COVID-19 tests, compared to one in five Democrats (21%) who say the same. Similarly, Republicans are more likely than Democrats to say the FDA deserves a lot or a fair amount of blame (62% vs. 39%).

Larger Shares Of Republicans Blame President Biden And FDA For Limited COVID-19 Test Supply

Confidence In Accuracy Of Testing

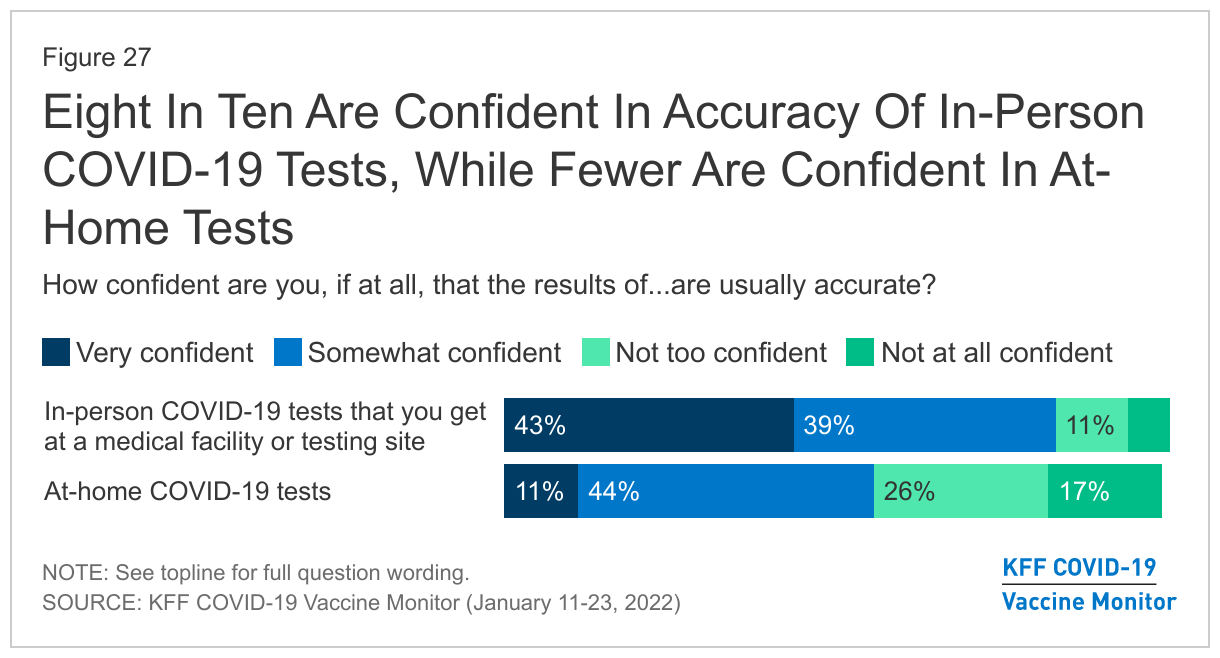
In addition to difficulty accessing at-home tests, many adults lack confidence in their accuracy. While a large majority are very (43%) or somewhat (39%) confident that the results of in-person COVID-19 tests at a medical facility or testing site are usually accurate, far fewer are very (11%) or somewhat (44%) confident in the accuracy of at-home tests.

Eight In Ten Are Confident In Accuracy Of In-Person COVID-19 Tests, While Fewer Are Confident In At-Home Tests

Views Of CDC Guidance Following Testing Or Exposure

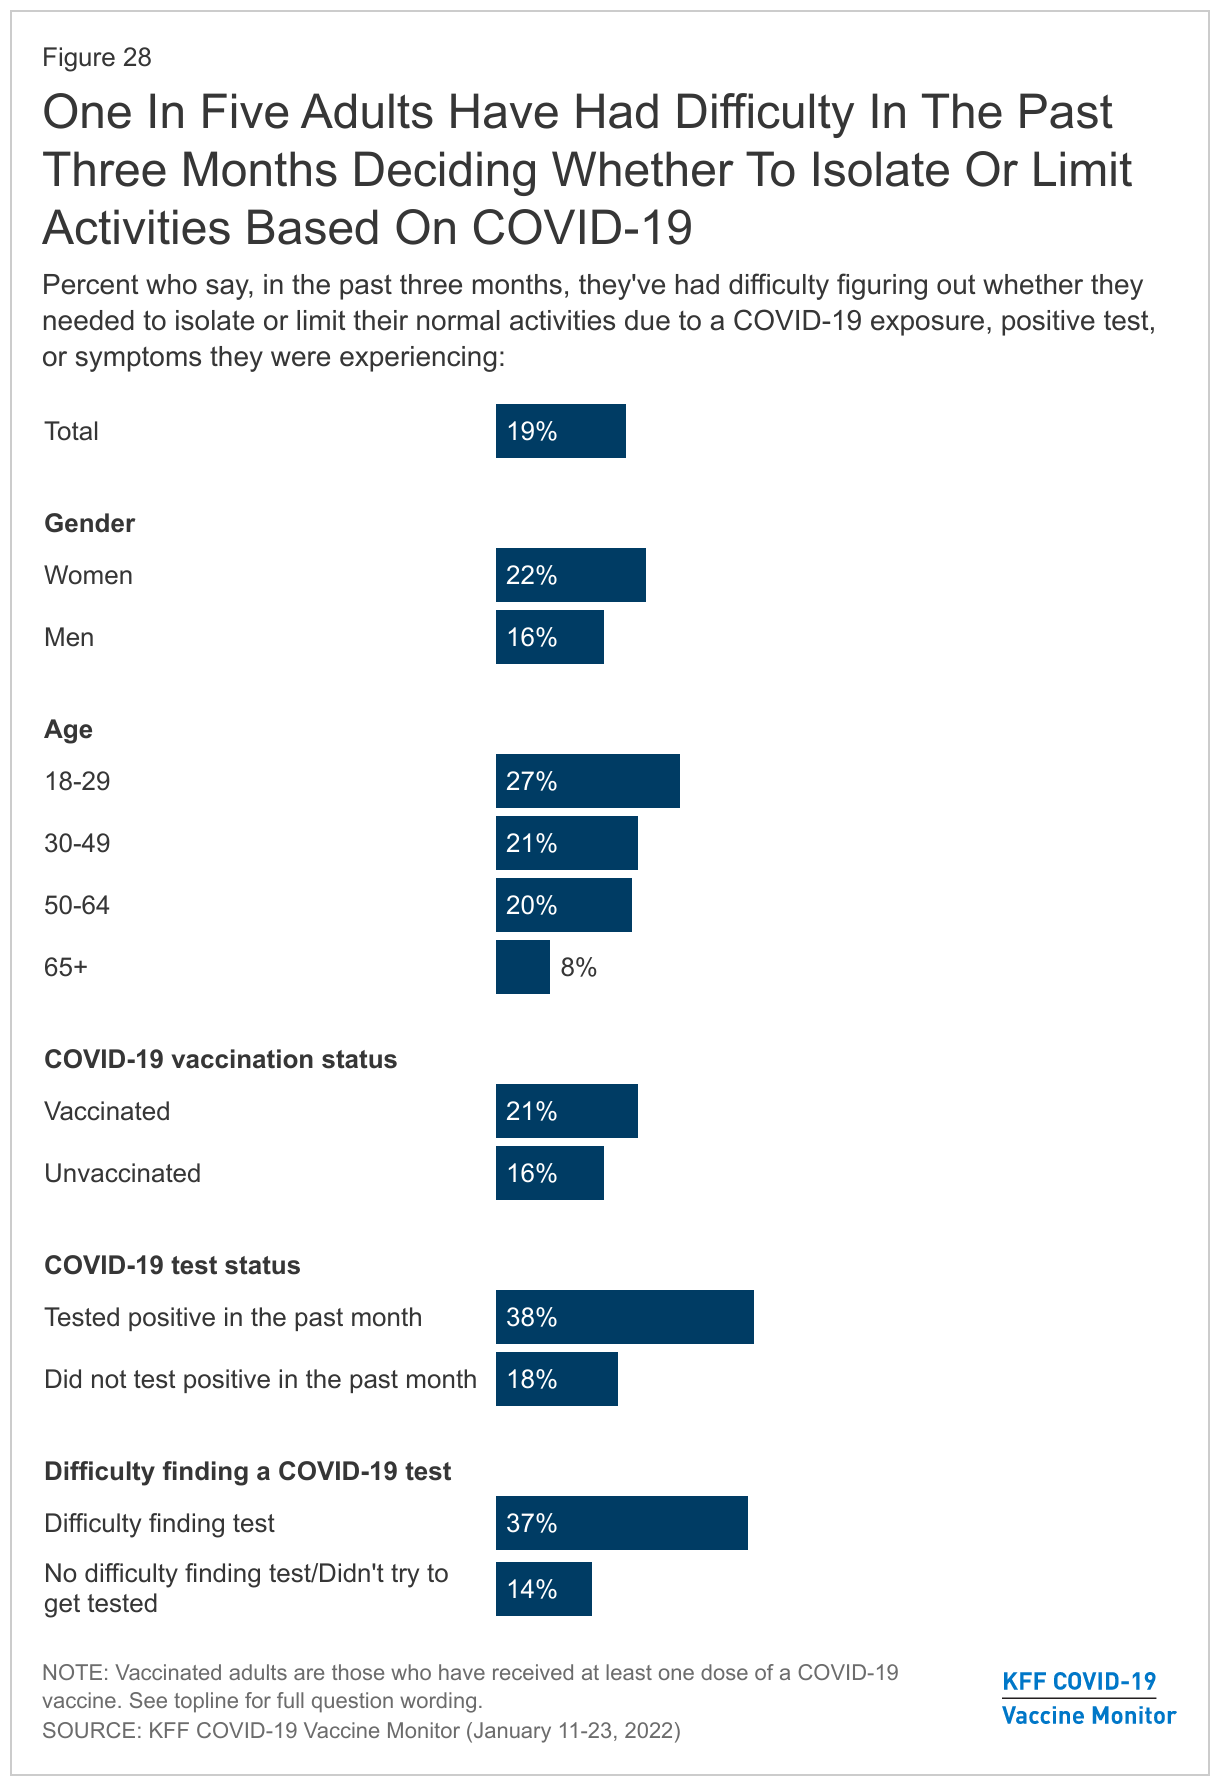
Even after testing positive or being exposed to COVID-19, many still are not sure what they are supposed to do. Around one in five adults (19%) report they have personally had difficulty in the past three months figuring out whether they needed to isolate or limit their normal activities due to a COVID-19 exposure, positive test, or symptoms they were experiencing. Adults under 65 (22%) are more likely than those 65 and older (8%) to say they have had difficulty figuring out whether they needed to isolate or limit their normal activities; among 18-29 year-olds more than one in four (27%) report difficulty making personal decisions around COVID. Notably, 38% of those who say they tested positive for COVID-19 in the last month say they had difficulty deciding whether they needed to isolate, as did 37% of those who reported difficulty finding a COVID-19 test.

One In Five Adults Have Had Difficulty In The Past Three Months Deciding Whether To Isolate Or Limit Activities Based On COVID-19

In late December, the CDC shortened the recommended isolation time for people who test positive for COVID-19 from 10 days to 5 days, followed by another five days of wearing a mask. Some individuals and organizations, including the American Medical Association, questioned the wisdom of the updated guidelines and whether they would be confusing for people to follow. In addition, some states and localities, including Washington, DC, have continued to advise residents to observe a 10-day isolation period. Our findings suggest that the change has indeed been confusing for the public, with around six in ten adults (58%) saying the CDC guidelines for testing and isolation for those exposed or infected with COVID-19 are confusing, while 39% think the guidelines are clear.

Methodology

This KFF COVID-19 Vaccine Monitor was designed and analyzed by public opinion researchers at the Kaiser Family Foundation (KFF). The survey was conducted January 11-23, 2022, among a nationally representative random digit dial telephone sample of 1,536 adults ages 18 and older (including interviews from 327 Hispanic adults and 303 non-Hispanic Black adults), living in the United States, including Alaska and Hawaii (note: persons without a telephone could not be included in the random selection process). Phone numbers used for this study were randomly generated from cell phone and landline sampling frames, with an overlapping frame design, and disproportionate stratification aimed at reaching Hispanic and non-Hispanic Black respondents as well as those living in areas with high rates of COVID-19 vaccine hesitancy. Stratification was based on incidence of the race/ethnicity subgroups and vaccine hesitancy within each frame. High hesitancy was defined as living in the top 25% of counties as far as the share of the population not intending to get vaccinated based on the U.S. Census Bureau’s Household Pulse Survey.  The sample also included 98 respondents reached by calling back respondents that had previously completed an interview on the KFF Tracking poll six months ago or more. Another 82 interviews were completed with respondents who had previously completed an interview on the SSRS Omnibus poll (and other RDD polls) and identified as Hispanic (n=33; including 12 in Spanish) or non-Hispanic Black (n=49). Computer-assisted telephone interviews conducted by landline (165) and cell phone (1,371; including 1,070 who had no landline telephone) were carried out in English and Spanish by SSRS of Glen Mills, PA. To efficiently obtain a sample of lower-income and non-White respondents, the sample also included an oversample of prepaid (pay-as-you-go) telephone numbers (25% of the cell phone sample consisted of prepaid numbers) Both the random digit dial landline and cell phone samples were provided by Marketing Systems Group (MSG). For the landline sample, respondents were selected by asking for the youngest adult male or female currently at home based on a random rotation. If no one of that gender was available, interviewers asked to speak with the youngest adult of the opposite gender. For the cell phone sample, interviews were conducted with the adult who answered the phone. KFF paid for all costs associated with the survey.

The combined landline and cell phone sample was weighted to balance the sample demographics to match estimates for the national population using data from the March 2021 U.S. Current Population Survey (CPS) on sex, age, education, race, Hispanic origin, region, and marital status, within race-groups, along with data from the 2010 Census on population density. The sample was also weighted to match current patterns of telephone use using data from the January-June 2021 National Health Interview Survey. The sample is also weighted to account for the possibility of partisan nonresponse based on three months of KFF national polls and this current survey. The weight takes into account the fact that respondents with both a landline and cell phone have a higher probability of selection in the combined sample and also adjusts for the household size for the landline sample, and design modifications, namely, the oversampling of potentially undocumented respondents and of prepaid cell phone numbers, as well as the likelihood of non-response for the recontacted sample. All statistical tests of significance account for the effect of weighting.

The margin of sampling error including the design effect for the full sample is plus or minus 3 percentage points. Numbers of respondents and margins of sampling error for key subgroups are shown in the table below. For results based on other subgroups, the margin of sampling error may be higher. Sample sizes and margins of sampling error for other subgroups are available by request. Sampling error is only one of many potential sources of error and there may be other unmeasured error in this or any other public opinion poll. Kaiser Family Foundation public opinion and survey research is a charter member of the Transparency Initiative of the American Association for Public Opinion Research.

This work was supported in part by grants from the Chan Zuckerberg Initiative DAF (an advised fund of Silicon Valley Community Foundation), the Ford Foundation, and the Molina Family Foundation. We value our funders. KFF maintains full editorial control over all of its policy analysis, polling, and journalism activities.

GroupN (unweighted)M.O.S.E.
Total1,536± 3 percentage points
COVID-19 Vaccination Status
Have gotten at least one dose of the COVID-19 vaccine1,168± 4 percentage points
Have not gotten the COVID-19 vaccine346± 7 percentage points
Race/Ethnicity
White, non-Hispanic782± 4 percentage points
Black, non-Hispanic303± 7 percentage points
Hispanic327± 7 percentage points
Party Identification
Democrats454± 6 percentage points
Republicans311± 7 percentage points
Independents516± 6 percentage points

What to Watch in Medicaid Section 1115 Waivers One Year into the Biden Administration

Authors: Madeline Guth and Elizabeth Hinton
Published: Jan 27, 2022

Section 1115 demonstration waivers provide states an avenue to test new approaches in Medicaid and generally reflect changing priorities from one presidential administration to another. The Trump Administration’s Section 1115 waiver policy emphasized work requirements and other eligibility restrictions, payment for institutional behavioral health services, and capped financing. The Biden Administration has signaled a shift in policy to emphasize waivers that expand, rather than restrict, Medicaid coverage and access to care (though still within the limits of budget neutrality). For example, CMS recently rescinded work requirement and premium authorities as part of a limited coverage expansion (at the state’s regular match rate for federal funding) in Georgia’s waiver—an action that the state is challenging in court. Additionally, several states have currently pending waiver requests that may align with these new administrative priorities. This issue brief summarizes waiver priorities and actions under the Biden Administration as well as pending waiver themes and other issues to watch. If the Build Back Better Act (BBBA) fails to pass or is narrowed significantly, Medicaid waivers and other administrative actions may be a key tool for the Biden Administration to advance policy priorities absent legislation.

In November 2021, the Biden Administration signaled that in line with its strategic vision for Medicaid, waivers can foster expanded coverage; improved access, quality, and equity; and value-based care and innovation. Prior to the November 2021 enumeration of these strategic Medicaid priorities, in a January 2021 executive order President Biden identified strengthening Medicaid and increasing health care access as key administrative priorities. The executive order directed relevant agencies to review waiver policies that may reduce coverage under or otherwise undermine Medicaid.

In line with early priorities, CMS began the process to withdraw Section 1115 work requirements and has since issued final withdrawals of these provisions in all states that had approvals. More recently, CMS took steps to withdraw or phase out the inclusion of Medicaid premium requirements above statutory limits. While other components of waivers with withdrawn work requirements or premiums remain intact, CMS has indicated that it may review additional policies. Finally, in April 2021 CMS rescinded the prior administration’s 10-year renewal of the Texas Healthcare Transformation and Quality Improvement Program (THTQIP) waiver because of failure to comply with public notice and comment requirements. However, Texas has challenged and a district court issued a preliminary injunction against the CMS recission. Separately, in July 2021 Texas submitted a new 10-year extension request with the same terms as the January approval. Negotiations between CMS and Texas over specific waiver provisions, including provider reimbursement for uncompensated care, may indicate how these broader policy issues align with current administrative priorities.

Recent waiver approvals and renewals emphasize alignment with broader Biden Administration priorities. One key theme has been approvals of waivers extending the Medicaid postpartum coverage period, highlighting a commitment to improving maternal health and reducing health disparities. In its recent approval of California’s CalAIM demonstration, CMS noted that the waiver advances policy priorities through its person-centered approach, health equity goals, and focus on addressing the health needs of high-need groups including those with behavioral health needs, homeless populations, and justice-involved populations. Similarly, CMS emphasized that its recent renewal of Maryland’s HealthChoice demonstration advances its priority to improve health coverage, access, and equity for Medicaid beneficiaries by expanding programs focused on maternal health, addressing health-related social needs, and enhancing behavioral health services.

CMS decisions on a number of pending waiver requests will inform how the Biden Administration may use waivers to advance stated priorities (Figure 1). In the year since President Biden took office, many states have requested targeted eligibility expansions that would increase coverage and access to care for certain populations, including justice-involved individuals. Though no states have received waiver approval to provide services prior to release from incarceration, CMS recently expressed support for pre-release services in correspondence with California. Recent pending waivers also propose to address health-related social needs and behavioral health needs, areas identified as key priorities by both CMS and states. As federal Medicaid rules prohibit expenditures for most non-medical services, it remains to be seen whether and how the Biden Administration may use demonstration waivers to encourage states to address enrollee social determinants of health.

Themes in Pending Section 1115 Waivers, as of January 24, 2022

Health equity is a key goal across pending waiver provisions as well as a priority for the administration both broadly and for Medicaid waivers specifically. In particular, states have highlighted that expanded coverage for high-need populations (including justice-involved individuals, postpartum individuals, and individuals with certain behavioral and/or social needs) and increased focus on social determinants of health will promote health equity. Especially in recent requests to extend and amend long-standing demonstrations, many states have identified equity as a foundational goal underlying all or most provisions. For example, Vermont noted in its extension request that “underlying all [demonstration] goals is Vermont’s commitment to leveraging its 1115 demonstration to advance health equity.” In addition to these overarching goals, some states have also requested specific expenditure authority for initiatives aimed at measuring or incentivizing equity (Figure 1).

Moving forward, Section 1115 waivers may be shaped by additional actions or guidance from CMS, federal legislation, and the future of the COVID-19 pandemic:

  • CMS actions and guidance. CMS may continue to review currently approved waiver provisions and could withdraw or decline to renew policies that may reduce Medicaid coverage or access. CMS is also in the process of applying methodology changes to budget neutrality policies that will restrict the ability of states with long-running demonstrations to roll over “unspent” savings and to extend baseline spending assumptions for years without adjustments; it remains to be seen how these policy changes will affect future waiver spending. CMS may also release additional Section 1115 guidance to promote policy priorities and/or to strengthen transparency, public notice, and comment and evaluation requirements.
  • Federal legislation. Potential passage of provisions included in the BBBA could affect coverage expansions states have requested in waivers—by requiring 12 months of postpartum coverage and allowing federal money to pay for Medicaid-covered services 30 days prior to release for incarcerated individuals—as well as Medicaid coverage for low-income people in states that have not expanded Medicaid under the Affordable Care Act (ACA), outside of waivers. The BBBA also includes provisions related to Medicaid financing, and benefit changes.
  • Future of COVID-19 pandemic. The pandemic continues to challenge state Medicaid programs and to drive their priorities, and these ongoing challenges could hamper states’ capacity to develop and implement new waiver initiatives. At the same time, the pandemic has exacerbated and highlighted issues such as health disparities and health-related social needs; states increasingly identify these areas as top priorities and may address them in future Medicaid waiver requests.

Funding for Health Care Providers During the Pandemic: An Update

Authors: Nancy Ochieng, Jeannie Fuglesten Biniek, MaryBeth Musumeci, and Tricia Neuman
Published: Jan 27, 2022

Since the start of the coronavirus pandemic, Congress, states, and both the Trump and Biden Administrations have adopted a number of policies to ease financial pressure on hospitals and other health care providers. The infusion of funds was intended to help alleviate the fiscal impact of revenue loss due to delays in non-urgent care, coupled with new costs associated with COVID-19. With the recent increase in Omicron-related cases, hospitalizations and deaths, this brief describes the main sources of federal funds for health care providers and how those funds have been allocated.  It also describes federal spending for COVID-19 testing, including at-home testing, using the most recent data available (as of September 2021).

Federal Funding for Hospitals and Other Health Care Providers During the Pandemic:Key Sources of Federal Support

The federal government has used a variety of strategies to provide enhanced financial support for hospitals and other health care providers to compensate for revenue loss and higher costs associated with the pandemic:

  • Congress established the Provider Relief Fund to bolster hospitals and other health care providers to compensate for financial losses and unanticipated costs during the pandemic. HHS has allocated $170.9 billion of the total $178 billion authorized by Congress for this Fund as of September 2021, including $14.8 billion used to support vaccine development and distribution. Of the total amount, $143 billion has been disbursed, according to GAO and HHS announcements. HHS expects to distribute another $6 billion to providers in early 2022.
  • In addition, $7.5 billion of $8.5 billion in American Rescue Plan (ARP) rural funds were distributed to hospitals and other providers that serve patients living in rural areas; the remaining $1 billion in rural funds is expected to be distributed in early 2022.
  • Congress took several steps to avoid automatic payment reductions during the pandemic. Congress waived the automatic 2% reduction in Medicare payments required under budget rules (i.e., sequestration) between May 1, 2020 and March 31, 2022, delayed until 2023 a separate 4% reduction in Medicare payments that would otherwise have been triggered in 2022 under PAYGO rules, and increased physician payments by 3% for 2022 under the Medicare Physician Fee Schedule (PFS) payments to mitigate scheduled budget neutral cuts.
  • Congress established the Paycheck Protection Program that provided health care providers an estimated $100 billion in Paycheck Protection Program (PPP) loans, according to MedPAC.
  • In addition, Congress increased Medicare payments for inpatient COVID-19 admissions by 20% during the public health emergency (PHE), established coverage and payment for administering COVID-19 vaccines, and increased payments for telehealth services, and HHS waived certain regulatory restrictions, such as allowing for expanded coverage of Medicare telehealth services. Congress also provided accelerated or advance payments as loans to providers participating in traditional Medicare to ease cash flow disruptions during the pandemic.

The Impact of the Pandemic on Health Care Spending and Providers

The capacity of hospitals and other health care providers to withstand the pressures of the pandemic depends on a variety of factors, including their financial health prior to the pandemic, the impact of the pandemic on revenue and expenses, and how much assistance they received from the federal government. In this section we briefly describe the impact of the pandemic and federal actions to support different types of providers. In the next section, we provide more detail on the various policies enacted by Congress and the Executive Branch over the last two years.

HOSPITAL AND PHYSICIAN SERVICES

Hospital admissions and use of other health care services dropped dramatically during the Spring of 2020, leading to a sharp decline in revenue for hospitals, outpatient centers and physicians. According to the Medicare Payment Advisory Commission (MedPAC), federal coronavirus relief funds and cost reductions allowed some but not all hospitals to remain profitable during the first three quarters of 2020. Further, MedPAC’s preliminary data shows that in 2021, among the six largest hospital systems, operating profits exceeded pre-pandemic levels. However, even though hospital revenues have largely rebounded, total health care spending was still below expected levels through the second quarter of 2021 (based on pre-pandemic spending), according to an analysis from KFF and EPIC Health Research Network

The impact on physicians has varied, according to the MedPAC. Between June and early December of 2020, the volume of total primary care visits (including telehealth) and elective services (e.g., colonoscopies and total knee replacement) were close to or just below the 2019 levels. Based on MedPAC’s analysis, the rapid growth in allowed charges for telehealth services partially offset decline in in-person office visits in early 2020.

SKILLED NURSING FACILITIES

Nursing homes, including skilled nursing facilities, also received federal funds to mitigate the financial effects of the pandemic, although the long-term effects of the pandemic on these facilities remains unclear. According to MedPAC, new federal assistance made available to skilled nursing facilities helped to offset much of their financial losses and costs incurred due to COVID-19, with total margins increasing in 2020 based on preliminary data. However, skilled nursing facility volume remains below pre-pandemic levels and therefore the longer-term effects of lower utilization for some facilities remains uncertain. Additionally, with staffing declining by approximately 10% between February and December 2020, staffing issues and costs could pose a fiscal challenge for skilled nursing facilities into the future.

SAFETY-NET PROVIDERS

Safety-net providers, including those with a high share of Medicaid and uninsured patients, have been at risk of financial strain during the pandemic, according to a MACPAC report. Contributing factors include low operating margins and the pandemic’s disproportionate impact on populations primarily covered by Medicaid, including people of color and those who use long-term services and supports. Providers that tend to serve Medicaid, but not Medicare, patients, such as pediatricians, home and community-based services providers, and behavioral health practitioners, were less likely to have received federal Provider Relief Funds.

Sources of Federal Support for Hospitals and Other Health Care Providers During the Pandemic

Approaching two years into the pandemic, policymakers have provided substantial support for hospitals and other health care providers to compensate for lost revenue and higher expenses associated with the COVID-19 pandemic. The legislative actions are described in the timeline below (Figure 1).

Figure 1: Timeline of Key Legislative Changes Related to Federal Support for Hospitals and Other Providers During the COVID-19 Pandemic

Payments from the Provider Relief Fund and Paycheck Protection Program loans to support hospitals and other health care providers during the pandemic contributed to a substantial increase in federal health care spending in 2020 – a 36% increase in spending in 2020 compared to 6% in 2019, according to National Health Expenditure data. Federal support during the pandemic appears to have stalled the pace of hospital closures, with fewer hospital closures in fiscal years 2020 (25 closures) and 2021 (10 closures) compared to 2019 (46 closures). In particular, many rural hospitals were struggling before and during the pandemic, with 18 rural hospitals closing in 2019 and 19 closing in 2020, while there were just 2 rural hospital closures reported in 2021. According to a Medicaid and CHIP Payment and Access Commission (MACPAC) report, critical access hospitals and other rural hospitals appear to have received more Provider Relief Funds as a share of their operating expenses than other types of hospitals, although it is not clear if the assistance they have received will be sufficient to prevent additional closures that would further impact access. The various funding and other policy actions taken to support providers include:

  • Provider Relief Fund: The Provider Relief Fund was initially established under the CARES Act in response to concerns about the impact of the COVID-19 on hospitals and other health care providers across the country. Congress subsequently authorized additional amounts for the Provider Relief Fund in The Paycheck Protection Program and Health Care Enhancement Act and the Consolidated Appropriations Act, 2021 (Figure 1). Of the $178 billion in total amounts authorized for the Fund, HHS allocated $170.9 billion (including $8 billion to support vaccine and therapeutic development and procurement activities (previously known as Operation Warp Speed), leaving $7.1 billion unallocated as of December 2021, according to the Government Accountability Office (GAO) (Figure 2). As of December 2021, $143.5 billion has been disbursed.Initially, the funds were distributed to virtually all Medicare-enrolled health care providers in grants that amounted to at least 2% of their 2018 (or most recent complete tax year) annual total patient revenue to cover lost revenue and unreimbursed costs associated with the pandemic. This approach allowed HHS to disburse funds quickly, but also favored providers with a larger share of revenue from private insurance since private insurers tend to reimburse at higher rates than Medicare and Medicaid. The initial distribution also excluded Medicaid and CHIP providers who were not enrolled in Medicare (38% of all Medicaid/CHIP providers); these providers were unable to apply for federal Provider Relief Funds until June 2020. A MACPAC review of Provider Relief Fund applications submitted as of November 26, 2020 (after the phase three general distribution application deadline closed), found that about 18% of Medicaid and CHIP providers who are not enrolled in Medicare received federal Provider Relief Funds, compared to virtually all Medicare providers, and about 54% of all providers potentially eligible for relief funds. Certain providers—including skilled nursing facilities, safety net hospitals, and hospitals that treated a large number of COVID-19 patients early in the pandemic—were among those that later qualified for additional grants.The Phase 4 distribution of $17 billion announced in September 2021 is based on the change in providers’ operating revenues and expenditures for the period between July 1, 2020 and March 31, 2021. According to HHS, the objective is to reimburse smaller providers for their lost revenues and COVID-19 expenditures at a higher rate than larger providers, because according to HHS, smaller providers are more likely to operate on narrow margins and serve higher-need communities. The Phase 4 distribution also includes bonus payments to providers that billed state Medicaid programs, state CHIPs, and/or Medicare between January 1, 2019 to December 31, 2020. To ensure an equitable distribution, bonus payments will be based on Medicare payment rates, which are generally higher. These bonus payments will account for approximately 25% of Phase 4 funds.

    Of the $17 billion in Phase 4 Provider Relief Funds, HHS has distributed $11 billion, including $9 billion distributed in December 2021 and $2 billion distributed in January 2022. The average payment of the $9 billion distributed in December 2021 ranged from $58,000 for small providers to $1.7 million for large providers. Data on targeted distributions of Phase 4 payments by type of provider are not yet available. According to HHS statements published in an October 2021 GAO report, the remaining unallocated Provider Relief Funds are reserved for future contingencies and emerging needs.

Allocation of Provider Relief Fund (as of December 2021)
  • Additional Funds for Rural Health, Community Health Centers and Other Providers: The American Rescue Plan (ARP) included $8.5 billion for rural health care providers to help cover lost revenue and costs associated with COVID-19 (Figure 1). In November 2021, HHS began distributing $7.5 billion of the $8.5 billion in ARP rural payments to providers. According to HHS, payments to providers varied widely, ranging from $500 to approximately $43 million. Providers or suppliers are eligible for ARP rural payments if they bill Medicare, Medicaid, and/or CHIP, and operate in or serve patients in a rural area. Therefore, eligible providers do not have to be located in a rural area to get an ARP payment. In other words, large health systems in urban centers who serve rural patients are also eligible. Other eligible providers include rural health clinics, critical access hospitals, in-home health, hospice, or long-term care providers. Similar to bonus payments under Phase 4 Provider Relief Funds, ARP rural payments are generally based on Medicare rates to allow an equitable distribution of funds. HHS has not announced the timing for the distribution of the remaining $1 billion of the $8.5 billion appropriated for rural health care providers.The ARP also included $7.6 billion for community health centers, more than $6 billion of which was awarded by HHS in April 2021. The ARP also included $200 million to support infection control and vaccination uptake at skilled nursing facilities.The ARP also included a 10 percentage point increase in the federal matching rate (FMAP) for state spending on Medicaid HCBS from April 1, 2021 through March 31, 2022, an estimated $11 billion nationally, to support home and community based services (HCBS) programs and strengthen the direct care workforce. States may use the enhanced funds for a variety of purposes, including supporting direct care workers, expanding HCBS eligibility and/or services, and improving IT systems. However, a KFF survey of state Medicaid HCBS programs found that 2/3 of responding states (25 out of 38) reported a permanent HCBS provider closure during the pandemic, with most of these states experiencing permanent closure of more than one HCBS provider type.
  • Temporary suspension of Medicare automatic payment reductions (sequestration): Congress has provided additional financial protection for hospitals and other health care providers by continuing to waive the automatic 2% reduction in Medicare payments that would be required under budget rules, known as sequestration. COVID-19 relief legislation originally suspended the sequestration payment adjustment of 2% from May 1, 2020 through December 31, 2021.1  On December 10, 2021, the Protecting Medicare and American Farmers from Sequester Cuts Act, S.610, was enacted into law, which continues to exempt Medicare from sequestration until March 31, 2022 (Figure 1). For the next three months (April 1, 2022 to June 30, 2022), the reduction will be phased in at 1% before resuming to 2% thereafter. However, for fiscal year 2030, payment reductions will be increased to 2.25% during the first 6 months and 3% for the next 6 months of that fiscal year, offsetting the federal budgetary effects of the recent sequestration suspensionsThis recently-enacted law (S. 610) will also delay, until 2023, a separate Medicare sequestration of 4% which would otherwise be triggered in 2022 under statutory Pay-As-You-Go (PAYGO). Specifically, any budgetary effects recorded for the fiscal year 2022 “PAYGO scorecards” will be delayed and added to the amounts for the fiscal year 2023 scorecard. Additionally, S.610 provides a 3% increase in Medicare Physician Fee Schedule (PFS) payments for 2022 in order to mitigate scheduled budget neutral cuts resulting from a 3.75% increase in PFS payments in 2021. These legislative changes provide relief for hospitals and other health care providers serving Medicare patients across-the-board, rather than take a more targeted approach to relieve financially troubled hospitals and other health care providers that were significantly impacted by COVID-19.
  • Paycheck Protection Program (PPP) and Other Loans: Many health care providers were eligible for some of the loan programs included in the Coronavirus Aid, Relief, and Economic Security (CARES) Act, including the PPP. Under the PPP for small businesses, loans are forgiven if employers do not lay off workers and meet other criteria. By August of 2020, health care providers received nearly $68 billion of the $525 billion in PPP loans that were distributed in 2020. In 2021, health care providers received another $29 billion of the $278 billion in PPP loans that were distributed that year. The CARES Act also appropriated $454 billion for loans to larger businesses—including hospitals. According to recent preliminary estimates by MedPAC, health care providers have received approximately $100 billion in total PPP loans.
  • Medicare Accelerated and Advance Payment Programs: Health care providers that participate in traditional Medicare were eligible for loans through the Medicare Accelerated and Advance Payment Programs, which helps providers facing cash flow disruptions during an emergency. About 80% of the $100 billion in loans went to hospitals. Repayment for the loans was originally set to begin in August of 2020, but Congress delayed the start date for repayments until one year after providers received the loans, which CMS says began as early as March 30, 2021 for those providers and suppliers that received loans on March 30, 2020. Once repayment begins, a portion of the new Medicare claims are reduced to repay the loans (25% during the first 11 months of repayment and 50% during the next six months). CMS is no longer accepting applications for accelerated or advanced payments as they relate to the COVID-19 Public Health Emergency.
  • Increase in Medicare COVID-19 inpatient reimbursement: Medicare has increased all inpatient reimbursement for COVID-19 patients by 20% during the public health emergency (PHE), which has been renewed through April 14, 2022. Additionally, under the New COVID-19 Treatments Add-on Payment (NCTAP) policy, eligible providers in the inpatient setting receive additional payments for certain COVID-19 treatments, such as remdesivir or convalescent plasma. In order to incentivize inpatient hospitals to continue providing new COVID-19 treatments beyond the end of the PHE, CMS recently extended the NCTAP for certain eligible technologies through the end of the fiscal year in which the PHE ends. Beneficiaries receiving inpatient care for treatment of COVID-19 are subject to cost sharing (deductible and copayments for extended stays).
  • Reimbursement for COVID-19 vaccination administration: Medicare increased its reimbursement for COVID-19 vaccine administration from $17 for an initial dose in a series and $28 for the final dose in a series to approximately $40 per dose. This also applies to booster doses approved by the FDA under the emergency use authorizations. As of June 2021, Medicare also pays an additional $35 per dose for administering the COVID-19 vaccine in the home for certain Medicare patients. Most states have policies in place to increase Medicaid payments for COVID-19 vaccine administration to 100% of the Medicare rate. Medicare and Medicaid beneficiaries are not subject to any cost sharing for the COVID-19 vaccine and administration. For the uninsured and underinsured, a portion of the Provider Relief Funds are being used to reimburse providers for administering COVID-19 vaccines to uninsured or underinsured individuals.
  • Medicaid options to support providers: The coronavirus pandemic resulted in financial strain for health care providers who tend to care for a disproportionate share of Medicaid patients. As of July 1, 2021, 41 states increased provider payment rates for a range of provider types via Disaster-Relief State Plan Amendments (SPAs) or other administrative authority, 40 states did so for HCBS waivers specifically using Appendix K, and two states received approval for Section 1115 waivers that increased payment rates for HCBS. States were also able to use retainer payments for certain HCBS providers as well as directed payments through managed care. In a survey of state Medicaid programs, more than two-thirds of responding states (33 of 47) indicated that one or more payment changes made in FY 2021 or FY 2022 were related in whole or in part to COVID-19. Across provider types, the vast majority of COVID-19-related payment changes were rate increases. COVID-19-related payment changes were most commonly associated with nursing facilities (27 states) and HCBS providers (26 states). Additionally, states reported a variety of other FFS payment changes in FY 2021 or planned for FY 2022 in response to COVID-19 including: increasing COVID-19 vaccine reimbursement rates to 100% of the Medicare rate and allowing a broader range of providers to be reimbursed for vaccine administration such as pharmacists, home health agencies, ambulance providers, renal dialysis clinics, and outpatient behavioral health clinics; making retainer payments to HCBS providers and bed hold payments to institutional providers; and making supplemental or add-on payments to certain providers, especially nursing facilities, for COVID-19 patients.
  • Other support for safety net providers, underserved populations and testing: There has been additional funding allocated to health centers ($9.6B), reimbursements for testing for the uninsured ($2B) and telehealth support for safety net providers ($300M). In addition, $61.4B has been allocated for broader testing activities, beyond what is described in this brief, including for community-based testing programs and the Indian Health Services. That allocation includes funding from several pieces of legislation, including $4.8 billion from ARP announced by HHS in May 2021. It is unclear if this allocation includes funding for at-home tests being distributed through the United States Postal Service or now eligible for reimbursement by private health insurance. It is not yet clear how the federal government is paying for at-home tests being distributed through USPS and the fiscal impact of providing this coverage.

The Long-Term Impact of the Pandemic Across Providers and Communities Remains Uncertain

When hospitals and other health care providers experienced steep drops in revenue early in the pandemic, Congress stepped in with an infusion of funds to bolster the finances of these providers. Collectively, the infusion of funds and other forms of support have generally maintained or improved providers’ financial performance in 2020.  However, not all providers had equal access to these funds, including providers serving a disproportionate share of Medicaid patients, who were less likely to have received federal Provider Relief Funds or more likely to wait longer to receive these Funds.  With emerging virus variants, including the Omicron variant which has caused rapid increases in COVID-19 infections and hospitalizations, the financial impact of the pandemic across providers and communities still remains unclear. More recently, hospitals have been pressing Congress for additional funds, in light of rising hospital admissions attributable to the Omicron variant. At this time, Congress’ intent on making any statutory changes in response to these concerns is not clear.

This work was supported in part by Arnold Ventures. We value our funders. KFF maintains full editorial control over all of its policy analysis, polling, and journalism activities.

  1. The CARES Act, H.R.748, originally suspended the sequestration payment adjustment of 2% from May 1, 2020 through December 31, 2020, followed by the Consolidated Appropriations Act, 2021, H.R.133, that extended the suspension period to March 31, 2021, and then H.R. 1868 delayed the reinstatement until December 31, 2021. On December 10, 2021, the Protecting Medicare and American Farmers from Sequester Cuts Act, S.610, was enacted into law, continuing to exempt Medicare from sequestration until March 31, 2022. ↩︎