Originally published in July 2025, this policy watch has been updated in April 2026 to reflect additional developments and updated measles trends.
Measles has been officially “eliminated” from the U.S. since 2000, which means the country had not seen very large outbreaks and had not had 12 months or more of uncontrolled domestic transmission of the virus since before that time. However, a series of measles outbreaks began in the U.S. in early 2025 that continue today: from January 2025 through the end of March 2026, U.S. states have reported over 3,800 measles cases. Several factors have contributed to the ongoing transmission of measles in the U.S. These include funding and staffing cuts for public health efforts at the federal, state, and local levels that have affected measles prevention and response efforts across the country, along with mixed messages from federal health officials such as Department of Health and Human Services (HHS) Secretary Robert F. Kennedy, Jr. regarding measles response at the same time there has been no Senate-confirmed leader at CDC for almost the whole period since these outbreaks began. Further, there is increased skepticism among the public about the safety and effectiveness of measles vaccines and a decline in trust of health authorities in general, which has contributed to lower measles vaccination rates and complicated outreach and communication efforts in addressing the current outbreak.
What does this mean for U.S. elimination status and control of the disease going forward? This policy watch provides an overview of the definition of measles elimination, including how this status is decided and declared, and its significance. Further, it assesses how the current measles outbreak may threaten elimination status and what that might mean for control of measles in the U.S.
Measles and the Measles Vaccine
Measles is one of the most contagious human viruses. When spreading in a population with no prior immunity, it is estimated that on average one measles case can result in 12- 18 other cases (this is the basic “reproduction number” of measles). While most measles infections are not severe, health complications can occur in about 30% of measles cases, and around 1 in 1,000 measles infections lead to death. There is a higher risk of severe outcomes in young children and immunocompromised individuals. Among the 1,309 confirmed measles cases so far in 2025, 164 (13%) were hospitalized and three deaths have occurred. Besides the risk of the infection itself, measles can also have long-lasting negative impacts on the immune system more broadly, especially in children, leaving people more prone to serious outcomes from other infections. Those who recover from a measles infection usually develop long-term immunity to further measles infection.
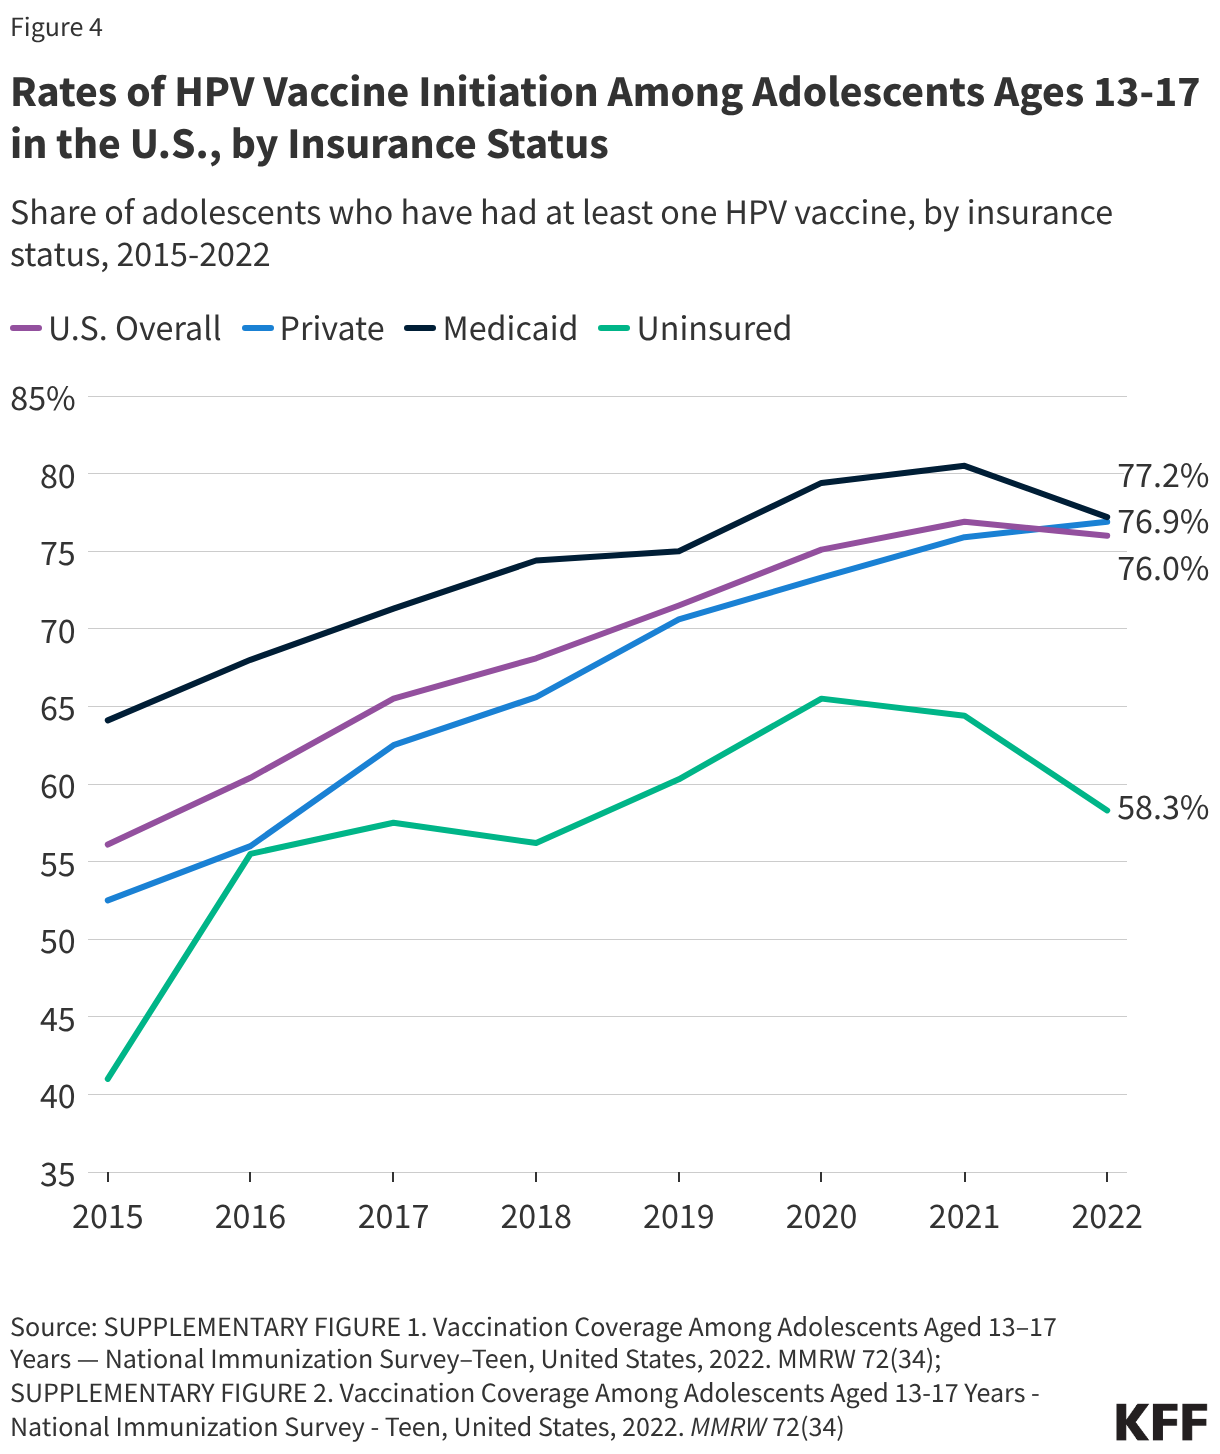
Measles vaccines have been available in the U.S. since 1963 and are safe and effective at providing protection against illness and, importantly, against infection and onward transmission of the virus. It is estimated that two doses of a measles-containing vaccine are 97% effective in preventing infection. CDC recommends children get their first measles vaccine dose between 12 and 15 months of age, and the second dose between 4 and 6 years of age, before entering school. Currently, the most common measles-containing vaccine in the U.S. is the combination measles, mumps and rubella (MMR) vaccine. Epidemiologists estimate that when >95% of a population has immunity to measles, through previous infection or vaccination, then “herd immunity” is reached and measles transmission is interrupted and large outbreaks will not occur. Therefore, at least 95% coverage with two doses of the measles vaccine is a common goal for immunization campaigns and is the current Healthy People 2030 target in the U.S. However, it is estimated that national two-dose MMR coverage in the United States is for children entering kindergarten in 2024 was 92.5%, a figure that had declined from 94.7% in 2011. In addition, this coverage varied significantly across states, ranging from 78.5% in Idaho to 98.2% in Connecticut. Just 10 states had reported coverage levels at 95% or above in 2024-2025.
National, Regional, and Global Measles Elimination Goals and Prior U.S. Certifications
The first national goal to interrupt measles transmission in the U.S. was announced in 1966, just a few years after licensure of the first measles vaccine, and CDC announced further measles elimination goals in 1978 and 1993. In 1994, the member states of the Pan American Health Organization (PAHO, the Americas regional office of the World Health Organization (WHO) that includes the U.S.) set a goal of interrupting endemic measles virus transmission in the region by the year 2000 and in 2012, member states of the WHO endorsed a Global Vaccine Action Plan that included a measles elimination goal for all six WHO regions by 2020.
Despite setting multiple goals since 1966, the U.S. did not officially achieve measles elimination status until 2000. Verification of elimination was carried out first through internal CDC and external expert review of U.S. strategy and programs to address measles, and epidemiological data on cases and vaccinations, which were compared against predetermined benchmarks for success. In March 2000, the National Immunization Program at CDC convened an external panel of experts to review the available data, and the panel concluded that criteria for elimination had been met, and officially stated that measles had eliminated from the U.S. Subsequently, a process was undertaken to re-verify U.S. elimination status in 2011, when the CDC’s National Center for Immunization and Respiratory Diseases assembled panel of external experts to review available evidence on U.S. measles programs and epidemiology since 2000. The panel agreed that measles elimination had been maintained, issuing a final report in March 2012. The U.S. has continued to review measles elimination status over time, including through an external expert committee known as the U.S. National Sustainability Committee for the Elimination of Measles, Rubella, and Congenital Rubella Syndrome.
Given the region-wide goal set in 1994, PAHO has also reviewed and verified national measles elimination for countries of the Americas, including the U.S. In 2007, PAHO member states created an international committee to verify country-level interruption of measles transmission and called for the creation of national-level commissions to help compile and submit related documentation to PAHO for review by an expert committee. Subsequently, PAHO’s Measles and Rubella Elimination Regional Monitoring and Re-Verification Commission (MRE-RVC) has met annually to review available evidence and issue reports on the status of elimination in PAHO member states with the U.S. consistently being designated as having sustained elimination. However, at its most recent meeting (in November 2025), the MRE-RVC placed the U.S. in the category of “sustained with major concerns.”
What Does it Mean to “Eliminate” Measles?
According to the guidelines developed by the U.S. and other PAHO member states, measles elimination has been defined at a basic level as: “Interruption of endemic measles virus transmission for a period greater than or equal to 12 months, in the presence of high-quality surveillance.” By contrast, measles is considered endemic in a given area if there is continuous transmission over a 12-month period.
In their review processes, CDC and external experts have used a variety of epidemiological and programmatic indicators, such as measles cases and transmission patterns, public health measures and response capabilities, and vaccination rates to help determine if endemic measles transmission has been “interrupted” and whether surveillance is “high-quality.” For example, when experts reviewed data for re-certification of measles elimination for the U.S. in 2011, the following primary lines of evidence were used (most covering the period 2001 to 2011) and the committee decided collectively that the data supported the conclusion that endemic measles virus transmission was interrupted in the presence of high-quality surveillance:
- There were fewer than one reported measles case per 10 million population;
- The great majority of measles cases were imported from areas outside the U.S. and most imported cases did not lead to further spread inside the U.S. – over the study period, 40% of cases were found to be imported;
- The number and size of measles outbreaks over that period were small: a total of 64 outbreaks (median 4 outbreaks/year), with a median outbreak size of 6 cases. Only 16 outbreaks included 10 or more cases;
- Measles vaccination rates among children had been sustained at high levels (>95%) over the study period, with no significant differences in coverage by race/ethnicity;
- Data from national surveys indicated that population immunity to measles was above the “herd immunity” threshold; almost all age groups had seropositivity rates for measles antibodies over >95%, and;
- Programmatic data on laboratory testing and case investigation performance indicated that U.S. surveillance adequately and quickly identified measles cases and transmission chains.
Prior to 2025, the largest outbreak of measles since U.S. elimination was declared occurred in 2018-2019. Imported measles cases in late 2018 had started a large outbreak centered in several close-knit communities with low vaccination rates in New York City and surrounding counties. As more measles cases came to be identified, state and local officials began to implement public health measures to combat the outbreak including declaring a public health emergency, mandating vaccinations and instituting fines for parents not vaccinating their children, which led to 60,000 MMR vaccine doses administered in affected areas in a few months. Authorities also closed schools where measles transmission occurred, prohibited unvaccinated children from attending school, and engaged in extensive communication and outreach efforts. At the time, federal agencies such as CDC provided technical assistance and other support and made clear statements about the importance of measles vaccinations, with then-CDC Director Robert Redfield stating “I encourage all Americans to adhere to CDC vaccine guidelines in order to protect themselves, their families, and their communities from measles” and pointing out that “organizations had been deliberately targeting these communities with inaccurate and misleading information about vaccines.” The White House also echoed this, with President Trump stating “vaccinations are so important” and encouraging parents to vaccinate their children against measles. These combined efforts were effective in containing the New York outbreak in under 12 months, as transmission was interrupted by August 2019.
Does the Current Outbreak Threaten U.S. Measles Elimination Status?
In 2025, the U.S. had more reported measles cases, outbreaks, affected states, and deaths than in any year since 1992, and measles outbreaks have continued to occur in 2026. The pace of reported measles cases has fluctuated from early 2025 until March 2026, but there have been continual outbreaks and more states affected over that time period. A higher percentage of cases since 2025 have been due to local transmission vs. importation compared to prior years indicating local transmission has been the primary source of reported cases. Further, U.S. MMR vaccination rates have continued their steady decline and in many locations across the country levels of vaccination are below that needed for herd immunity. Table 1 summarizes key U.S. measles outbreak indicators as reported by CDC for 2025 and year-to-date (through March) 2026.
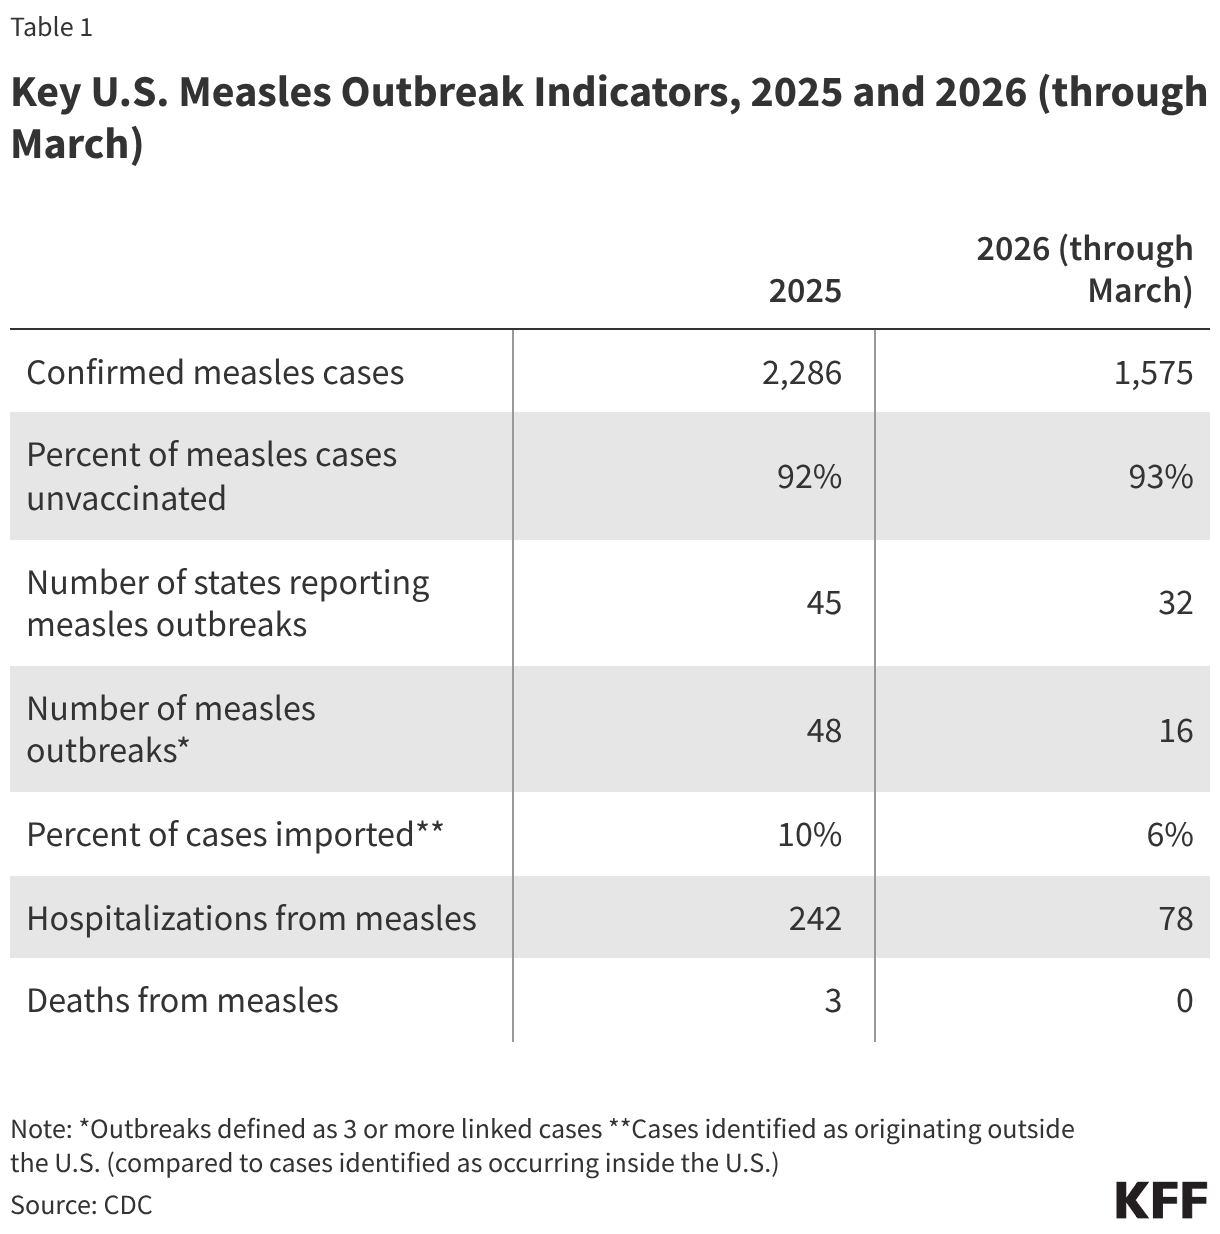
Compared to the elimination period of 2001 to 2011 discussed above, these metrics are notably worse. There were 64 measles outbreaks in total over ten years (2001 -2011) but in 2025 there were 48 outbreaks, and there have been 16 new outbreaks in 2026 through March. While 40% of measles cases were imported in the 2001-2011 period, in 2025 just 10% of cases were imported and just 6% in 2026 (meaning more local transmission chains). There was one measles death over ten years during the elimination period, while there three in 2025 (none have been reported in 2026 to date). Many of these 2025 and 2026 data points are also worse than those from 2019, when U.S. measles elimination status was last threatened. For example, from January to October 1, 2019 (by which time the large outbreaks centered in New York had been contained), there had been 1,249 total measles cases, and 22 total outbreaks across 17 states; 2025 far surpassed those numbers.
Primary responsibility for public health responses to measles sits with state and local health departments. At the moment, metrics on state and local capacities and response times for measles are not available, so gauging whether U.S. surveillance remains “high-quality” is challenging. However, in 2025 and 2026, state and local public health departments have faced cuts in funding and support from the federal government compared to previous years, which may impact their ability to track and respond to measles outbreaks. In recent years, the federal government has provided over half of state and local health public health departments’ budgets. There is little evidence that states most affected by measles in 2025, such as Texas, New Mexico, and South Carolina, have taken the kinds of measures that New York officials implemented to contain outbreaks in 2019: vaccination mandates, school restrictions and fines. While federal agencies such as CDC have been providing technical assistance and funding to affected areas, HHS Secretary Robert F. Kennedy, Jr. has downplayed the risks of measles and has provided mixed messages about the importance of vaccination compared to alternative treatments for measles, and CDC has been without a permanent Director since late August 2025. In January 2026, then Deputy Director of CDC Ralph Abraham stated that the measles outbreaks experienced by the U.S. were “just the cost of doing business…we have these communities that choose to be unvaccinated. That’s their personal freedom.” More recently, acting CDC Director Jay Bhattacharya has made stronger statements of support for measles vaccinations, saying in March 2026 that "measles is preventable and vaccination remains the most effective way to protect yourself and those around you.”
Data also show that national measles vaccination levels declined over the past five years, with kindergarten and childhood measles coverage rates dipping well below the 95% goal. Measles vaccination rates for kindergarteners at the national level declined from 95.2% in 2019-2020 to 92.5% in 2024-2025 (the latest available data), and over three-quarters of states had MMR vaccination rates below the target rate of 95% in the latest data. Additional studies have found that 78% of U.S. counties reported a decline in two-dose measles vaccine coverage in children, with the average county-level measles vaccination rate falling from 93.9% in 2019 to 91.3% in 2024. In 2025, 8% of U.S. measles cases had history of MMR vaccination while 92% of cases were unvaccinated or had unknown vaccination status; in 2026 so far 93% of cases were in unvaccinated individuals. Lower MMR vaccination rates have occurred in the context of broad declines in people’s trust in health authorities and in vaccinations in general. For example, KFF polling has found that parents are frequently exposed to misinformation about measles and the MMR vaccine, and in 2025 almost 20% of adults report they believed the false claim that “getting the measles vaccine is more dangerous than become infected with measles” is probably or definitely true.
Therefore, if current trends hold through the rest of the year there would appear to be grounds for the U.S. to lose measles elimination status, using prior definitions and benchmarks.
U.S. Measles Outbreaks in a Regional and Global Context
The U.S. is not alone in facing higher numbers of measles cases since 2025. There have also been large outbreaks in Mexico (6,213 reported cases in 2025) and Canada (5,463 reported cases in 2025). In fact, in November 2025 PAHO declared that Canada no longer holds measles elimination status due to having over 12 months of continual measles transmission. Like in the U,S., these outbreaks have been concentrated in communities with low vaccination rates. According to PAHO, in the region of the Americas, a total of 14,975 cases of measles were reported in 2025 across 13 countries, with almost all of these cases coming from North America. WHO reports that through June of this year, there were a total of 276,240 measles cases globally with large outbreaks occurring in the European and Eastern Mediterranean regions, in addition to the Americas. Outside of North America, the countries with the highest numbers of measles cases between August 2025 and January 2026 were India (12,135 cases), Angola (11,941), and Indonesia (8,892). As indicated in a standing travel warning from CDC, more circulation of measles regionally and globally means a higher risk that U.S. residents traveling internationally can be exposed, which raises the risk of importing measles and sparking new domestic outbreaks.
Looking Ahead
The next steps in determining U.S. measles elimination status include an internal federal-led review of state and CDC epidemiological data. A key outstanding question is whether transmission over the past year derived from the outbreak that began in January 2025 in West Texas, or whether outbreaks have been due to unconnected importation events. If cases over the past year across different states are epidemiologically linked to those from the Texas outbreak it would indicate continual chains of transmission extending more than 12 months, jeopardizing measles elimination status. Using genetic testing of measles virus isolated from patients, scientists can determine transmission patterns. CDC is currently working with partners to perform such sequences and publish the findings. These, along with other data, will be reviewed by the external expert PAHO committee (the Measles, Rubella, and Congenital Rubella Syndrome Elimination Regional Verification Commission, MRE-RVC), which is responsible for a determination of U.S. elimination status. After initially announcing a review meeting would take place in April 2026, PAHO changed the date for the U.S. measles elimination review to November 2026, which coincides with the regularly scheduled annual MRE-RVC meeting.
The elimination of measles in the U.S. was a notable public health achievement made possible by sustained investments in prevention and response capacities, support of vaccination, and commitment to the goal of elimination. However, this status is currently at risk, as demonstrated by the many factors discussed above. Losing measles elimination status would signify that the same commitment to measles prevention and control may no longer be present in the U.S. It could signify a future where measles is endemic and continuously circulating, especially if vaccination rates continue to decline. That would bring more hospitalizations and more deaths, particularly among vulnerable children, from a very preventable disease. There could be broader implications for communities across the country, which may have to contend with more frequent decisions about whether and when to close day cares and schools in the face of transmission risks. The societal costs of measles outbreaks are high, so continuous outbreaks would place an additional burden on already weakened and depleted public health systems, and would raise questions about what the appropriate level of support and funding should be from the federal government for outbreak response at the state and local levels.