Medicare Advantage in 2026: Enrollment Update and Key Trends

Authors: Meredith Freed, Jeannie Fuglesten Biniek, Anthony Damico, and Tricia Neuman
Published: Jun 5, 2026

Enrollment in Medicare Advantage, the private plan alternative to traditional Medicare, has increased steadily over the past two decades, with more than half of eligible beneficiaries enrolled in Medicare Advantage since 2023. The growth in enrollment has implications for federal spending, because according to the Medicare Payment Advisory Commission (MedPAC), Medicare payments to private plans are higher than spending for similar beneficiaries in traditional Medicare. In 2026, payments are 14% more per person, which translates into an additional $76 billion in federal spending this year. While payments per person relative to traditional Medicare are similar to a decade ago (15% higher), the impact on federal spending was substantially lower at $24 billion because enrollment was substantially lower with about one-third of eligible beneficiaries enrolled in a Medicare Advantage plan at that time.

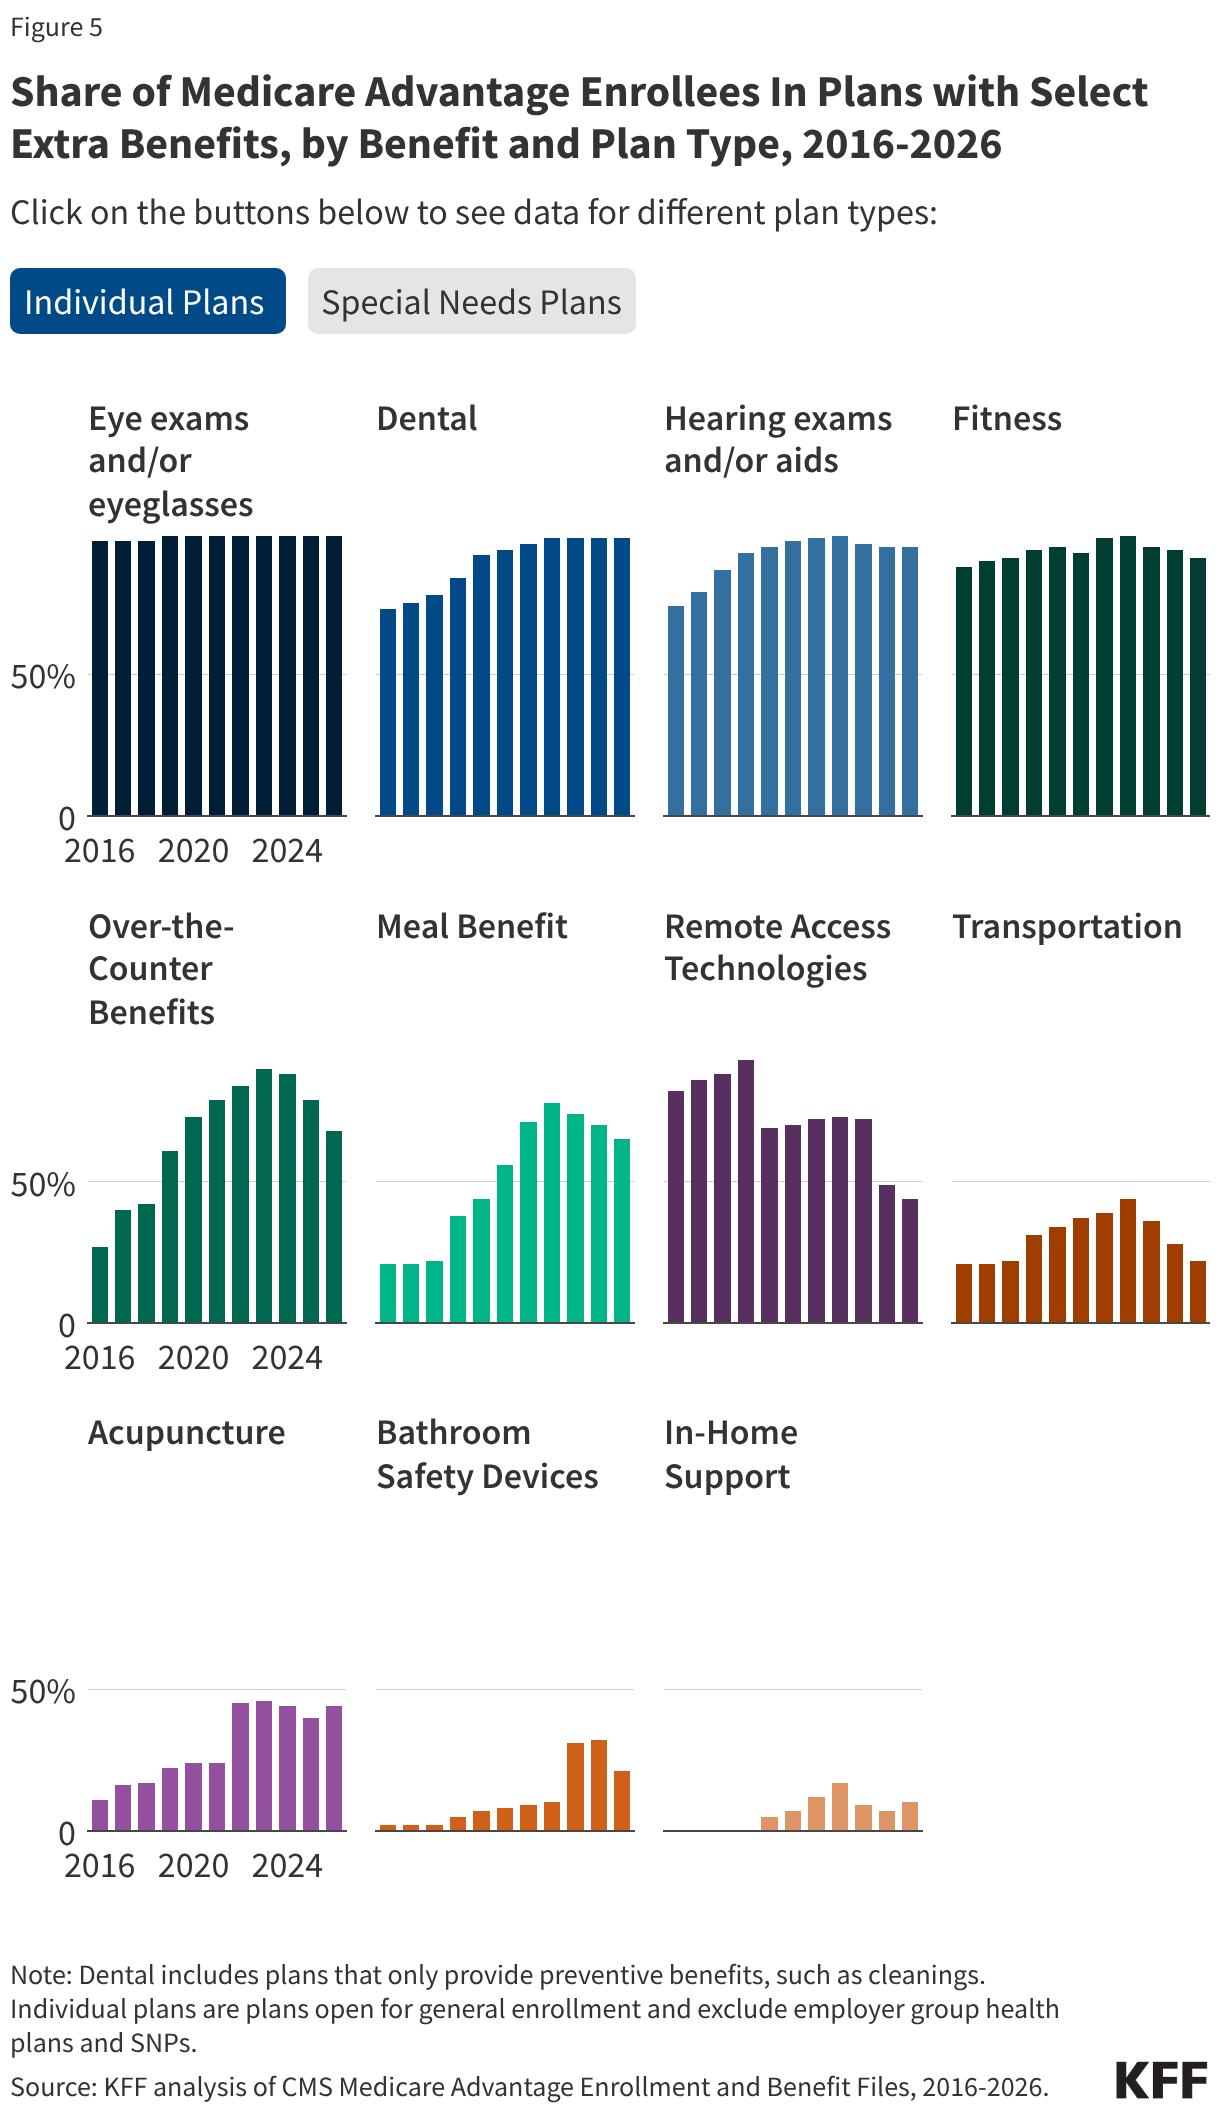
Given the enrollment and spending trends, policymakers have become increasingly focused on how Medicare pays private plans, though without broad agreement on how or when to move forward with any changes to how Medicare Advantage plans are paid. In part, the difficulty stems from concerns about the effects of payment changes on beneficiaries’ choice among plans and access to supplemental benefits, such as coverage of dental, vision and hearing.

To better understand trends in the growth of the Medicare Advantage program, this brief provides current information about enrollment, including by plan type and firm. A second, companion analysis describes Medicare Advantage premiums, out-of-pocket limits, supplemental benefits offered, and prior authorization requirements in 2026.

Highlights for 2026:

  • More than half (55%) of eligible Medicare beneficiaries are enrolled in Medicare Advantage in 2026. While a growing share of Medicare beneficiaries are enrolled in a Medicare Advantage plan, the pace of the increase in enrollment continued to slow in 2026.
  • In 2026, nearly one quarter (23%) of Medicare Advantage enrollees are in a special needs plan (SNP), reflecting a steady increase in recent years. Most (85%) of the net increase in Medicare Advantage enrollment between 2025 and 2026 across all plan types was among SNPs, up from 48% in the prior year.
  • More than three-quarters of SNP enrollment (78%) is in plans designed for people who are dually eligible for Medicare and Medicaid (D-SNPs), with plans for people with certain chronic conditions (C-SNPs) continuing to see a surge in enrollees in 2026 as in 2025. Enrollment in C-SNPS increased by 45% between 2025 and 2026, rising to 20% of SNP enrollment.
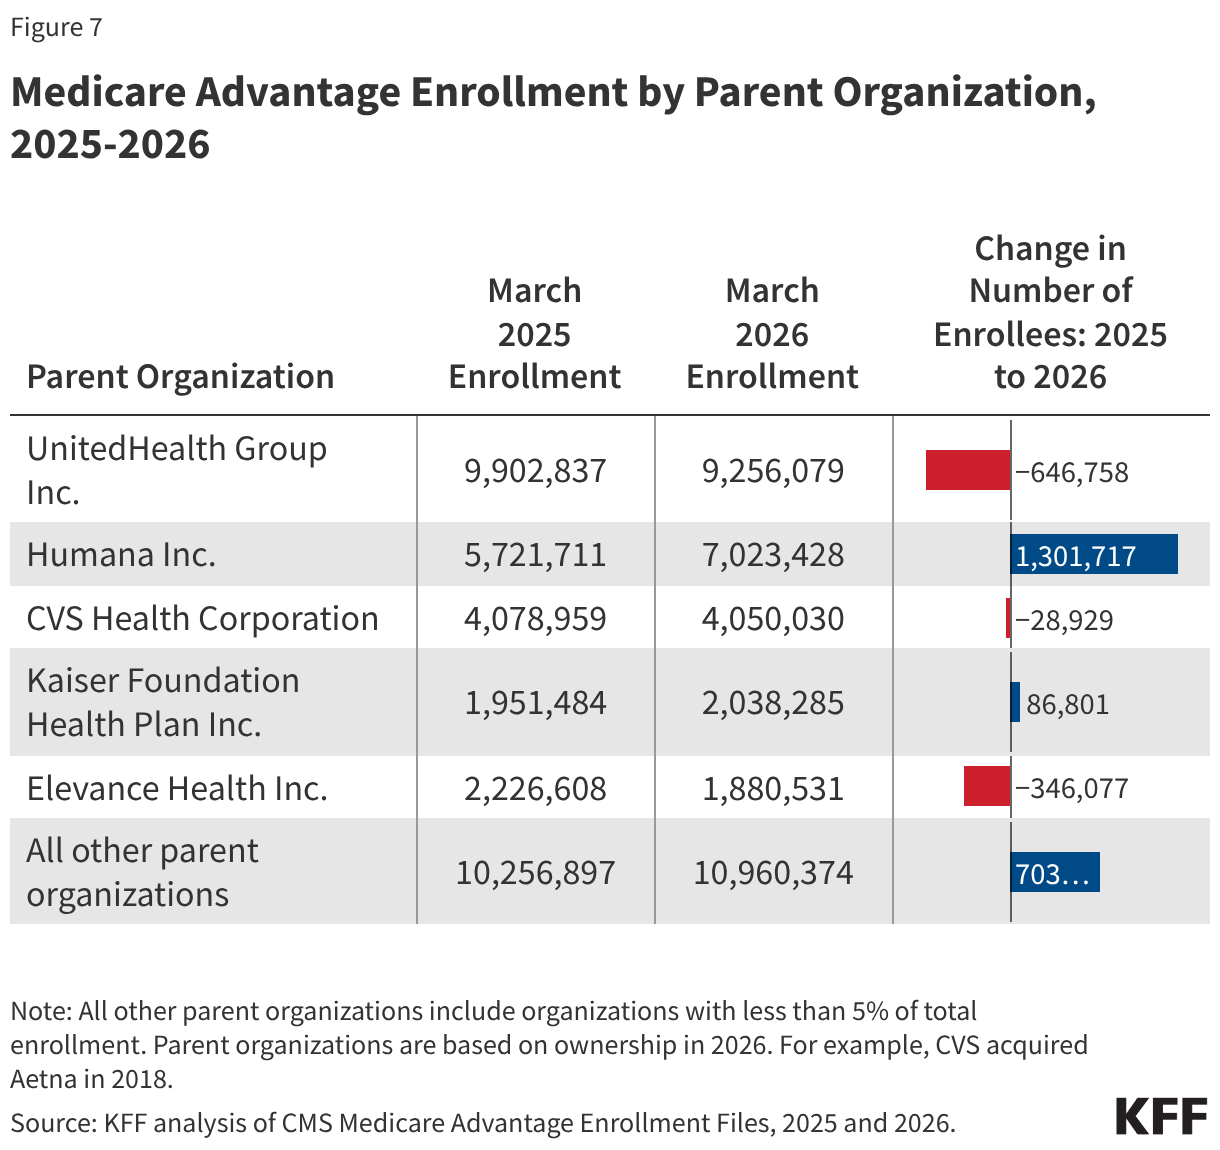
  • Medicare Advantage enrollment is highly concentrated among plans owned by a small number of parent organizations, with UnitedHealth Group leading the market, and, together with Humana, accounting for nearly half (46%) of all Medicare Advantage enrollees nationwide, the same as in 2025, and consistent with the pattern in prior years. However, market shares for the leading parent organizations changed with UnitedHealth Group dropping to 26% (down from 29%), and Humana increasing to 20% (up from 17%). In absolute numbers, Humana had the largest growth in enrollment, with 1.3 million more enrollees in 2026 than in 2025. In contrast, enrollment in UnitedHealth Group plans decreased by nearly 647,000 from 2025 to 2026. 

More than half of eligible Medicare beneficiaries are enrolled in Medicare Advantage in 2026.

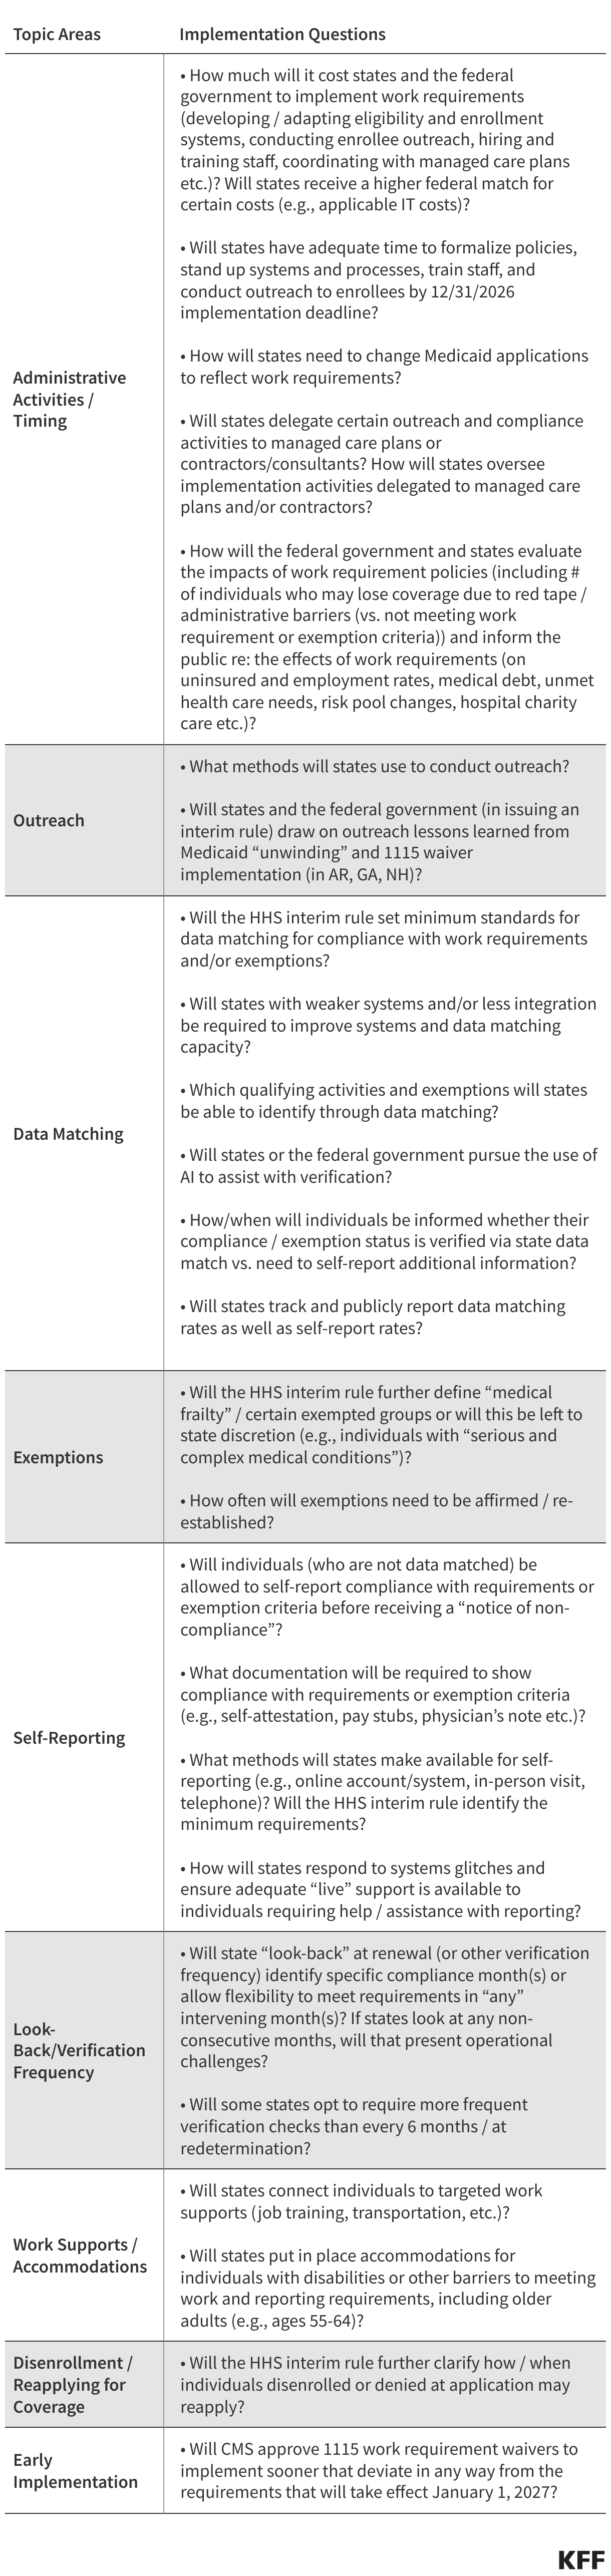
In 2026, more than half (55%) of eligible Medicare beneficiaries – 35 million out of about 64 million Medicare beneficiaries with both Medicare Parts A and B – are enrolled in Medicare Advantage plans. Medicare Advantage enrollment as a share of the eligible Medicare population has jumped from 19% in 2007 to 55% in 2026 (Figure 1).

Total Medicare Advantage Enrollment, 2007-2026 (Column Chart)

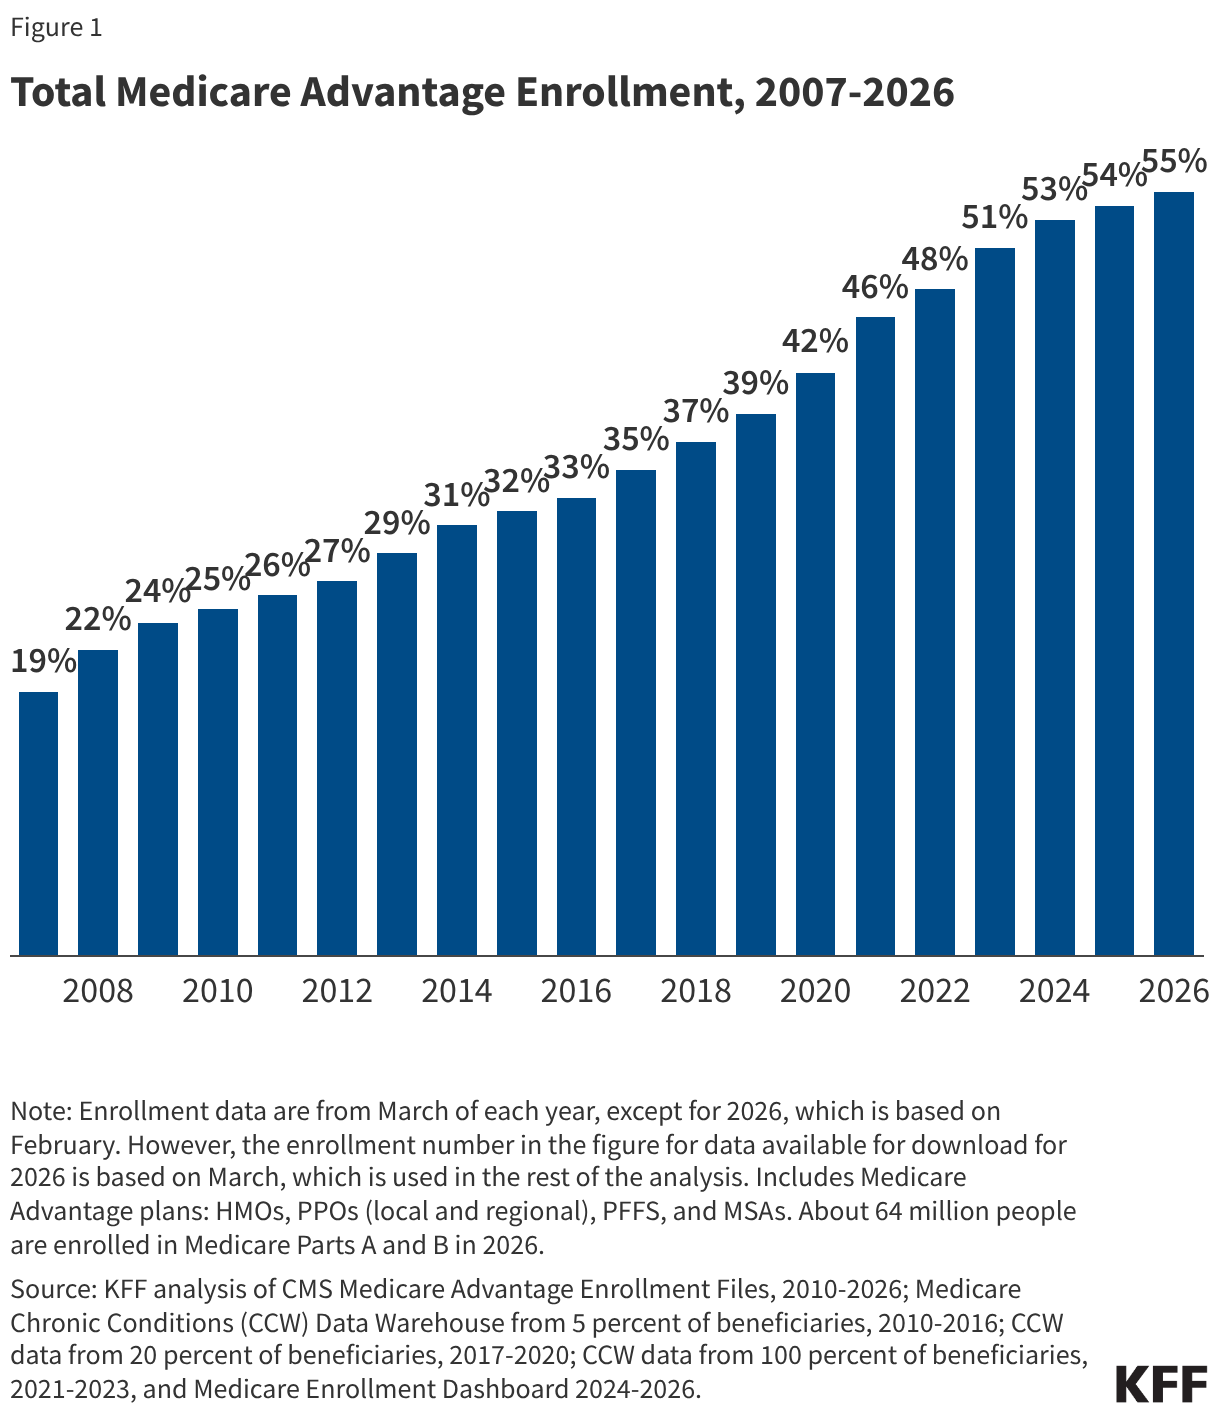
Between 2025 and 2026, total Medicare Advantage enrollment grew by about 1.1 million beneficiaries, or 3% – a similar growth rate to the prior year (4%). The Congressional Budget Office (CBO) projects that the share of all Medicare beneficiaries enrolled in Medicare Advantage plans will rise to 63% by 2034 and remain at 63% for 2035 and 2036 (Figure 2).

Medicare Advantage and Traditional Medicare Enrollment, Past and Projected (Area Chart)

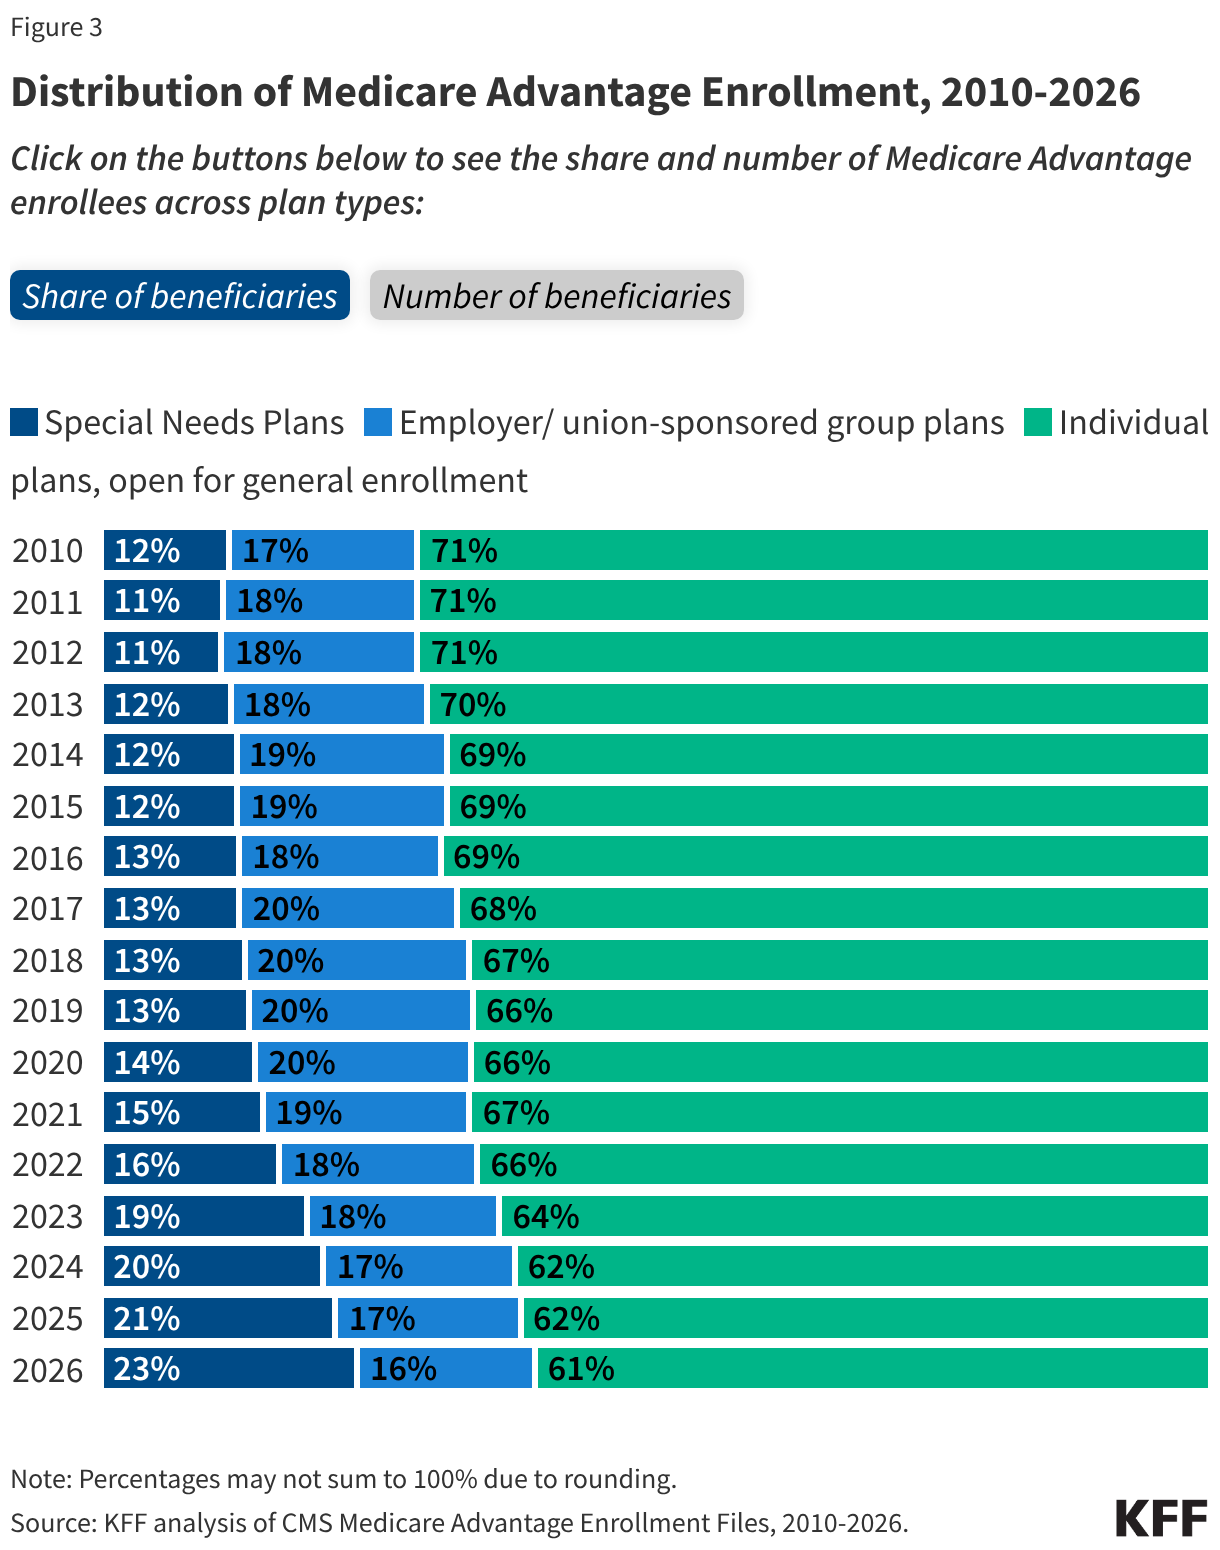
In 2026, about six in ten Medicare Advantage enrollees are in individual plans that are open for general enrollment.

About 6 in 10 Medicare Advantage enrollees (61%), or 21.4 million people, are in plans generally available to all Medicare beneficiaries for individual enrollment (Figure 3). That is an increase of 0.2 million enrollees compared to 2025, though individual plans comprised a slightly smaller share of total Medicare Advantage enrollment in 2026 (61%) compared to 2025 (62%), and their share of enrollment has declined since 2010 when they comprised 71% of all enrollees. The decline in the share of enrollment in individual plans is due to faster enrollment growth in special needs plans (SNPs), especially since 2018.  

Distribution of Medicare Advantage Enrollment, 2010-2026 (Stacked Bars)

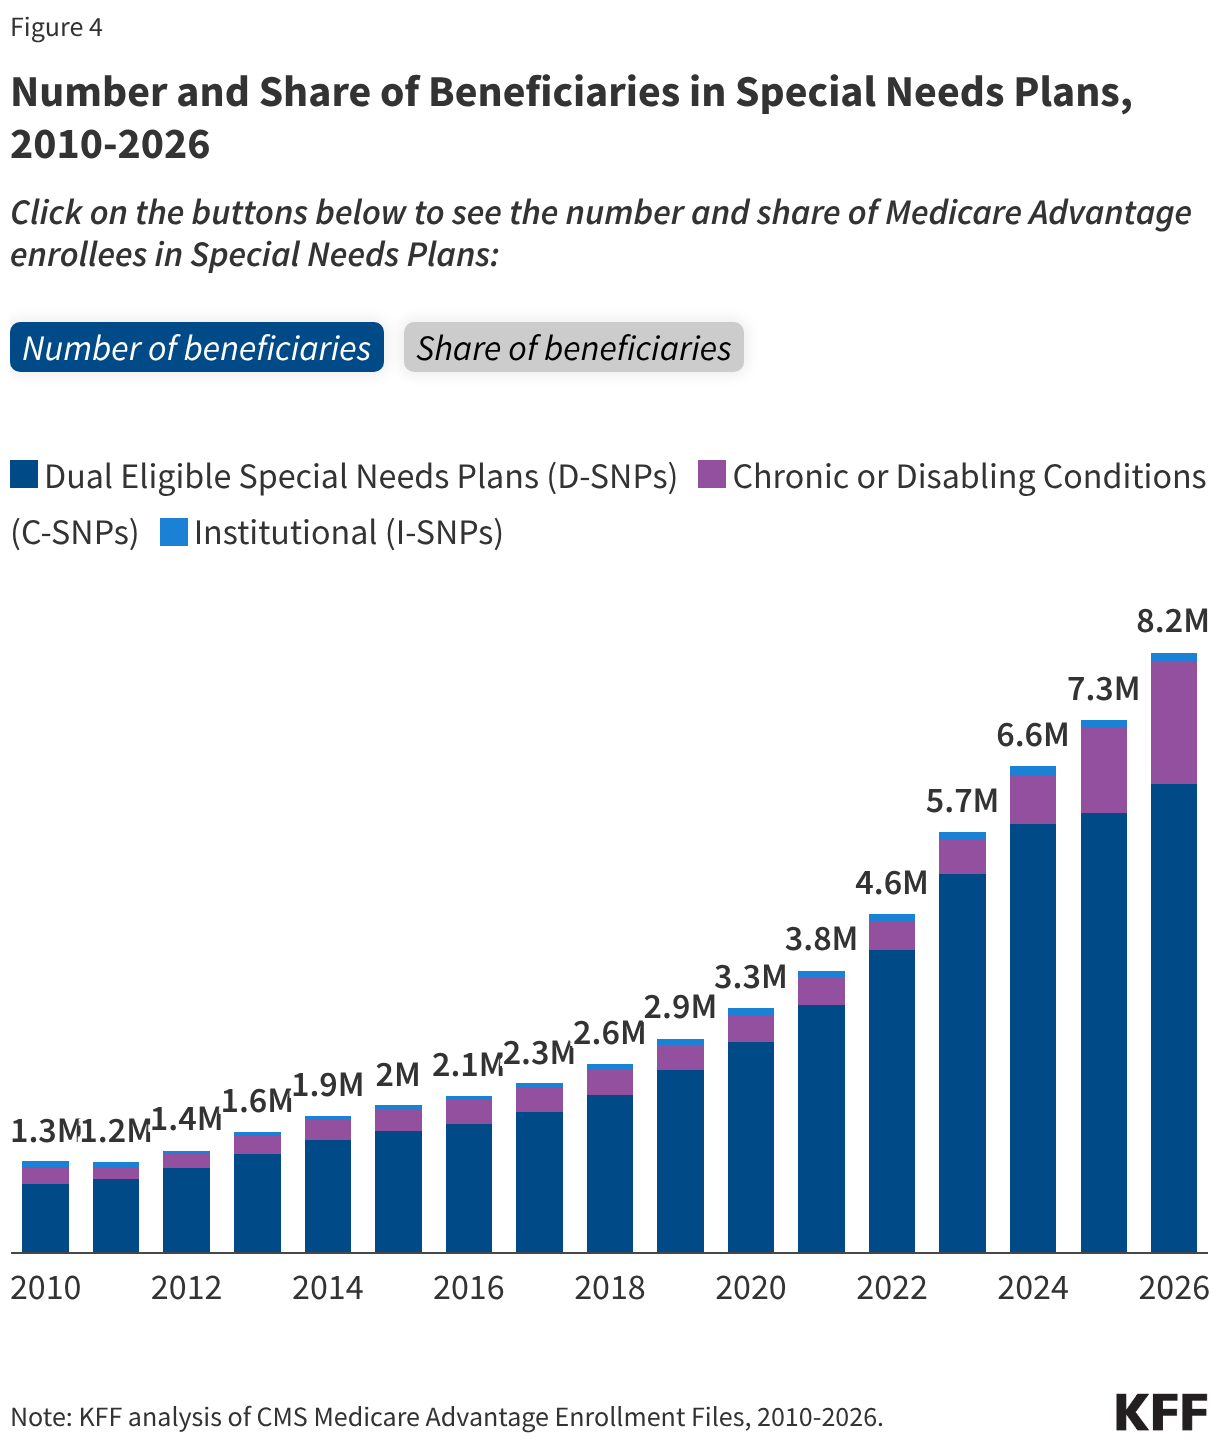
Special needs plans (SNPs) comprise a growing share of Medicare Advantage enrollment.

Nearly 8.2 million Medicare beneficiaries are enrolled in special needs plans (SNPs), an increase of more than 900,000 enrollees since 2025, and accounted for 85% of the net increase in Medicare Advantage enrollment over the last year. SNPs restrict enrollment to beneficiaries with significant or relatively specialized care needs, or who qualify because they are eligible for both Medicare and Medicaid. SNPs comprise a growing share of Medicare Advantage enrollment, accounting for 23% of enrollees in 2026 compared with 21% of enrollees in 2025 (Figure 4).

Number and Share of Beneficiaries in Special Needs Plans, 2010-2026 (Stacked column chart)

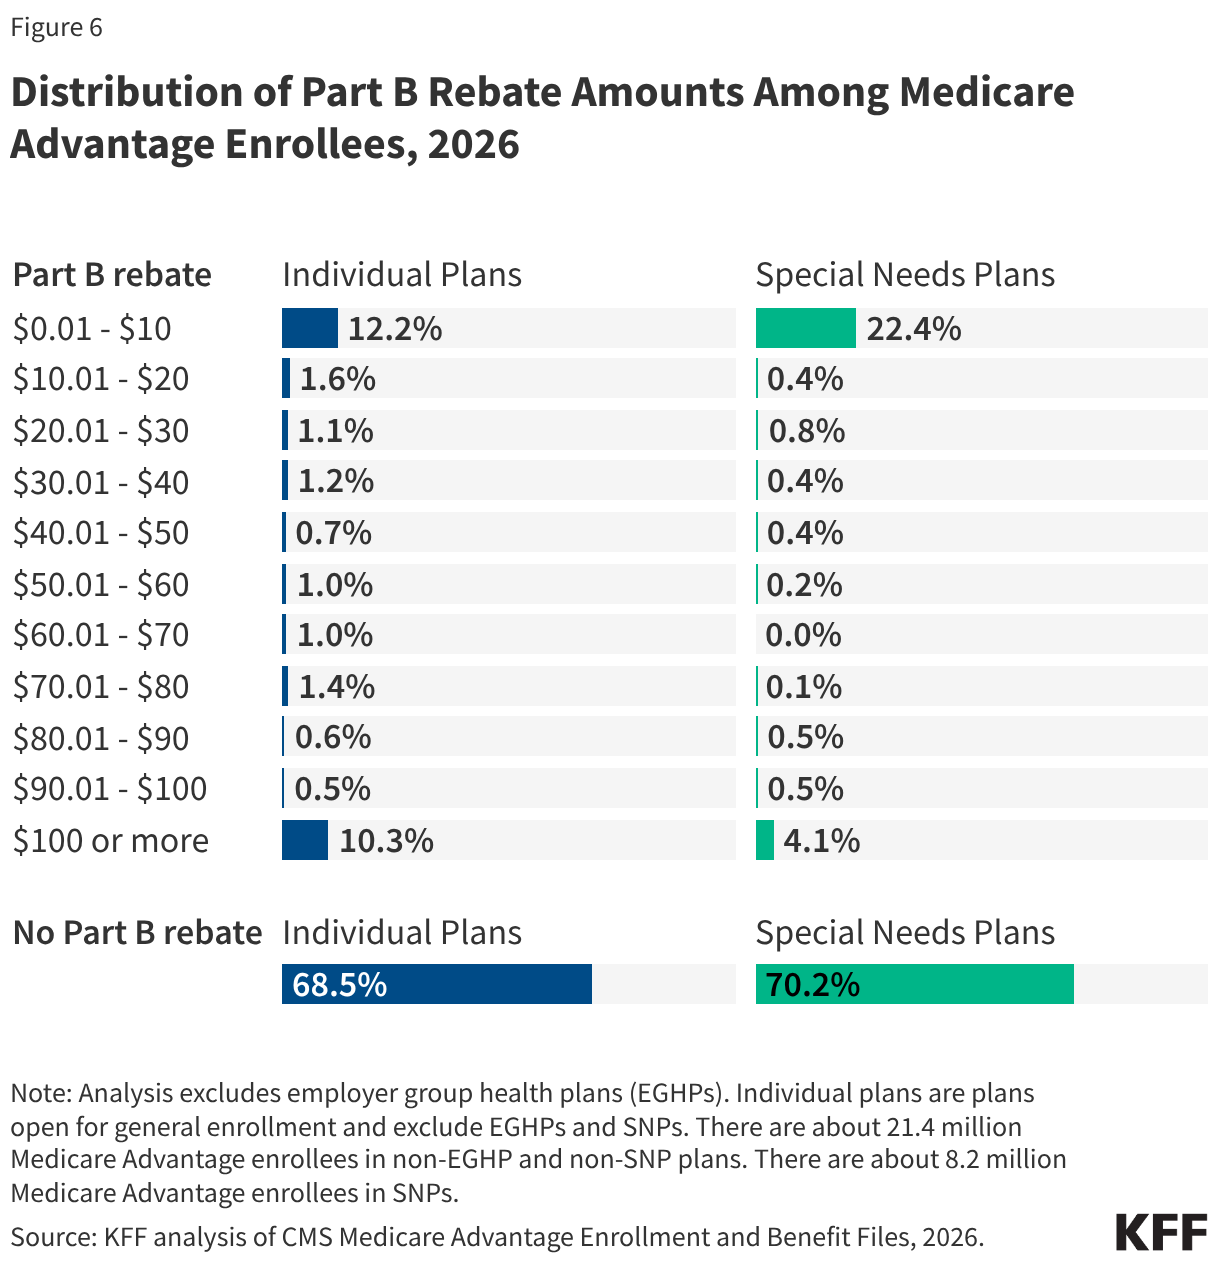
The increase in SNP enrollment is consistent with the increasing number of SNP plans available on average and more dual-eligible individuals having access to these plans since the Bipartisan Budget Act of 2018 made SNPs a permanent part of the Medicare Advantage program. Growth in SNP enrollment may also stem from the sharp increase in rebate payments, which have more than doubled since 2017 and are higher than for individual plans, which enables SNPs to offer extra benefits that are attractive to dual-eligible individuals.

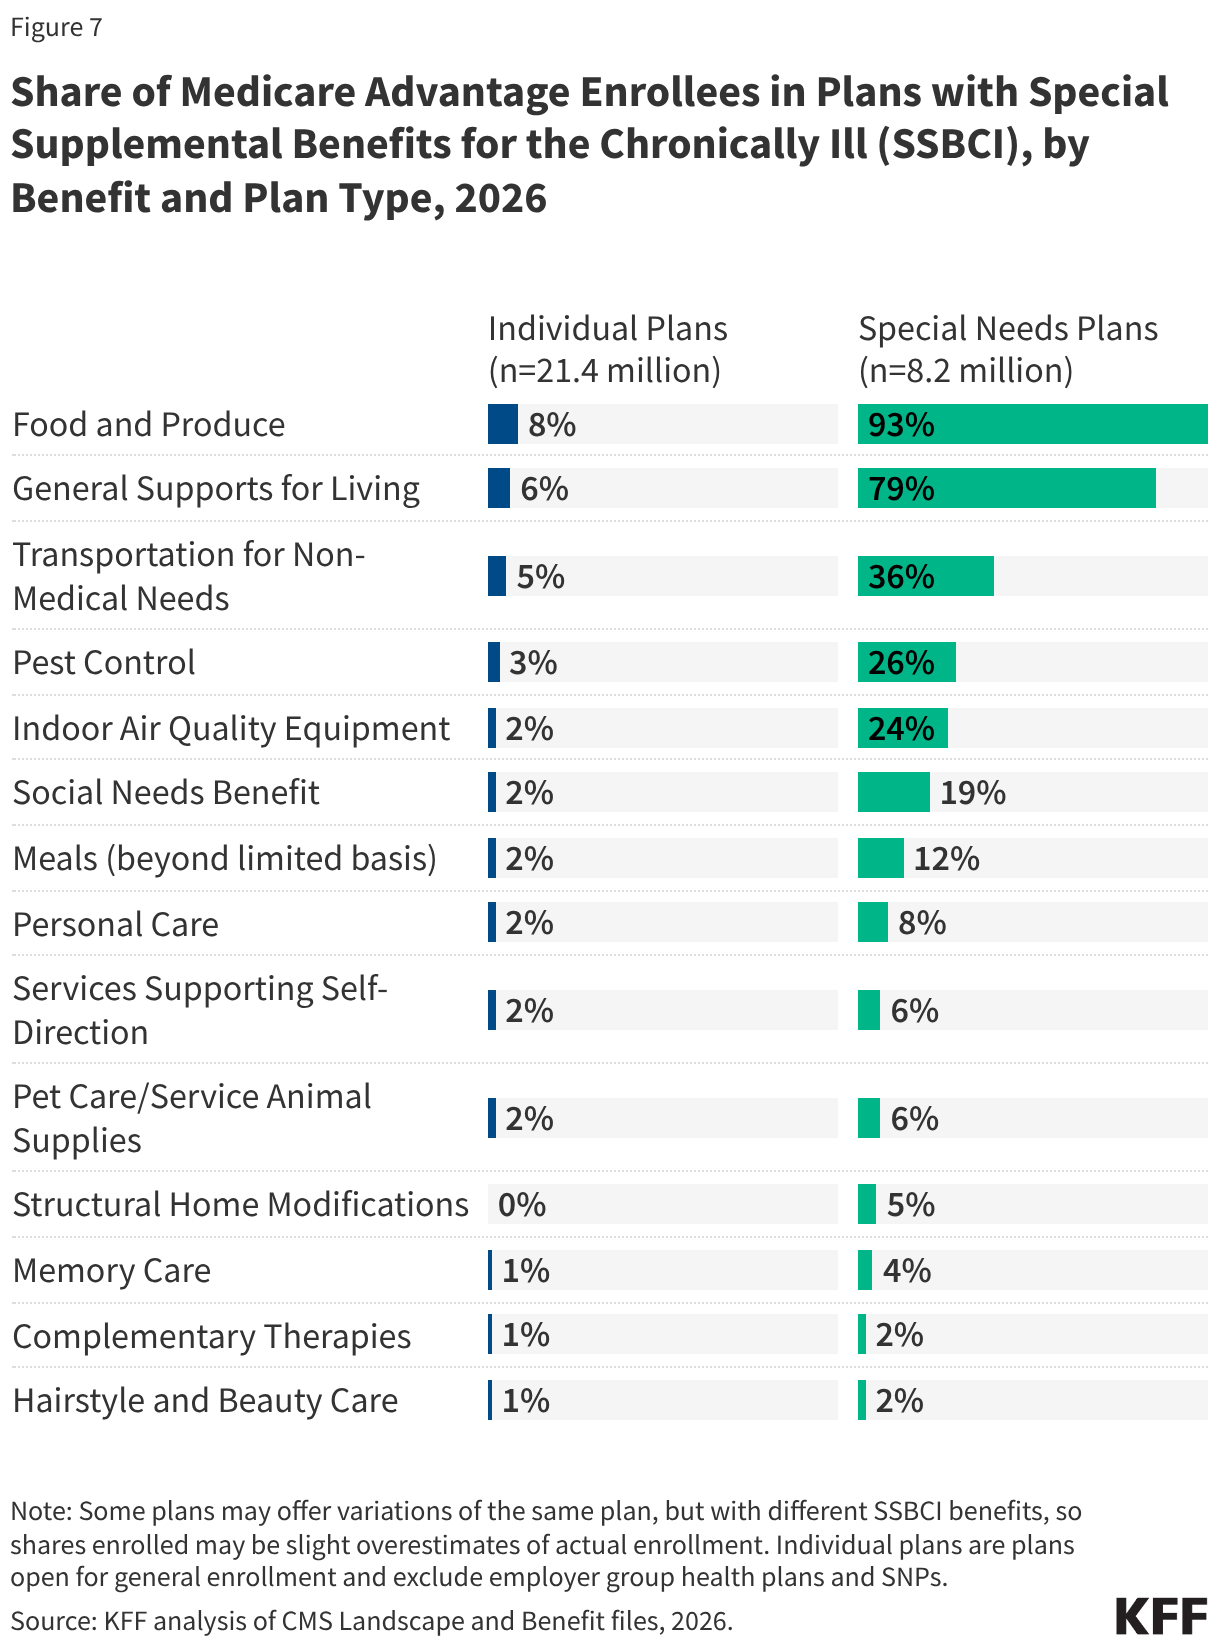
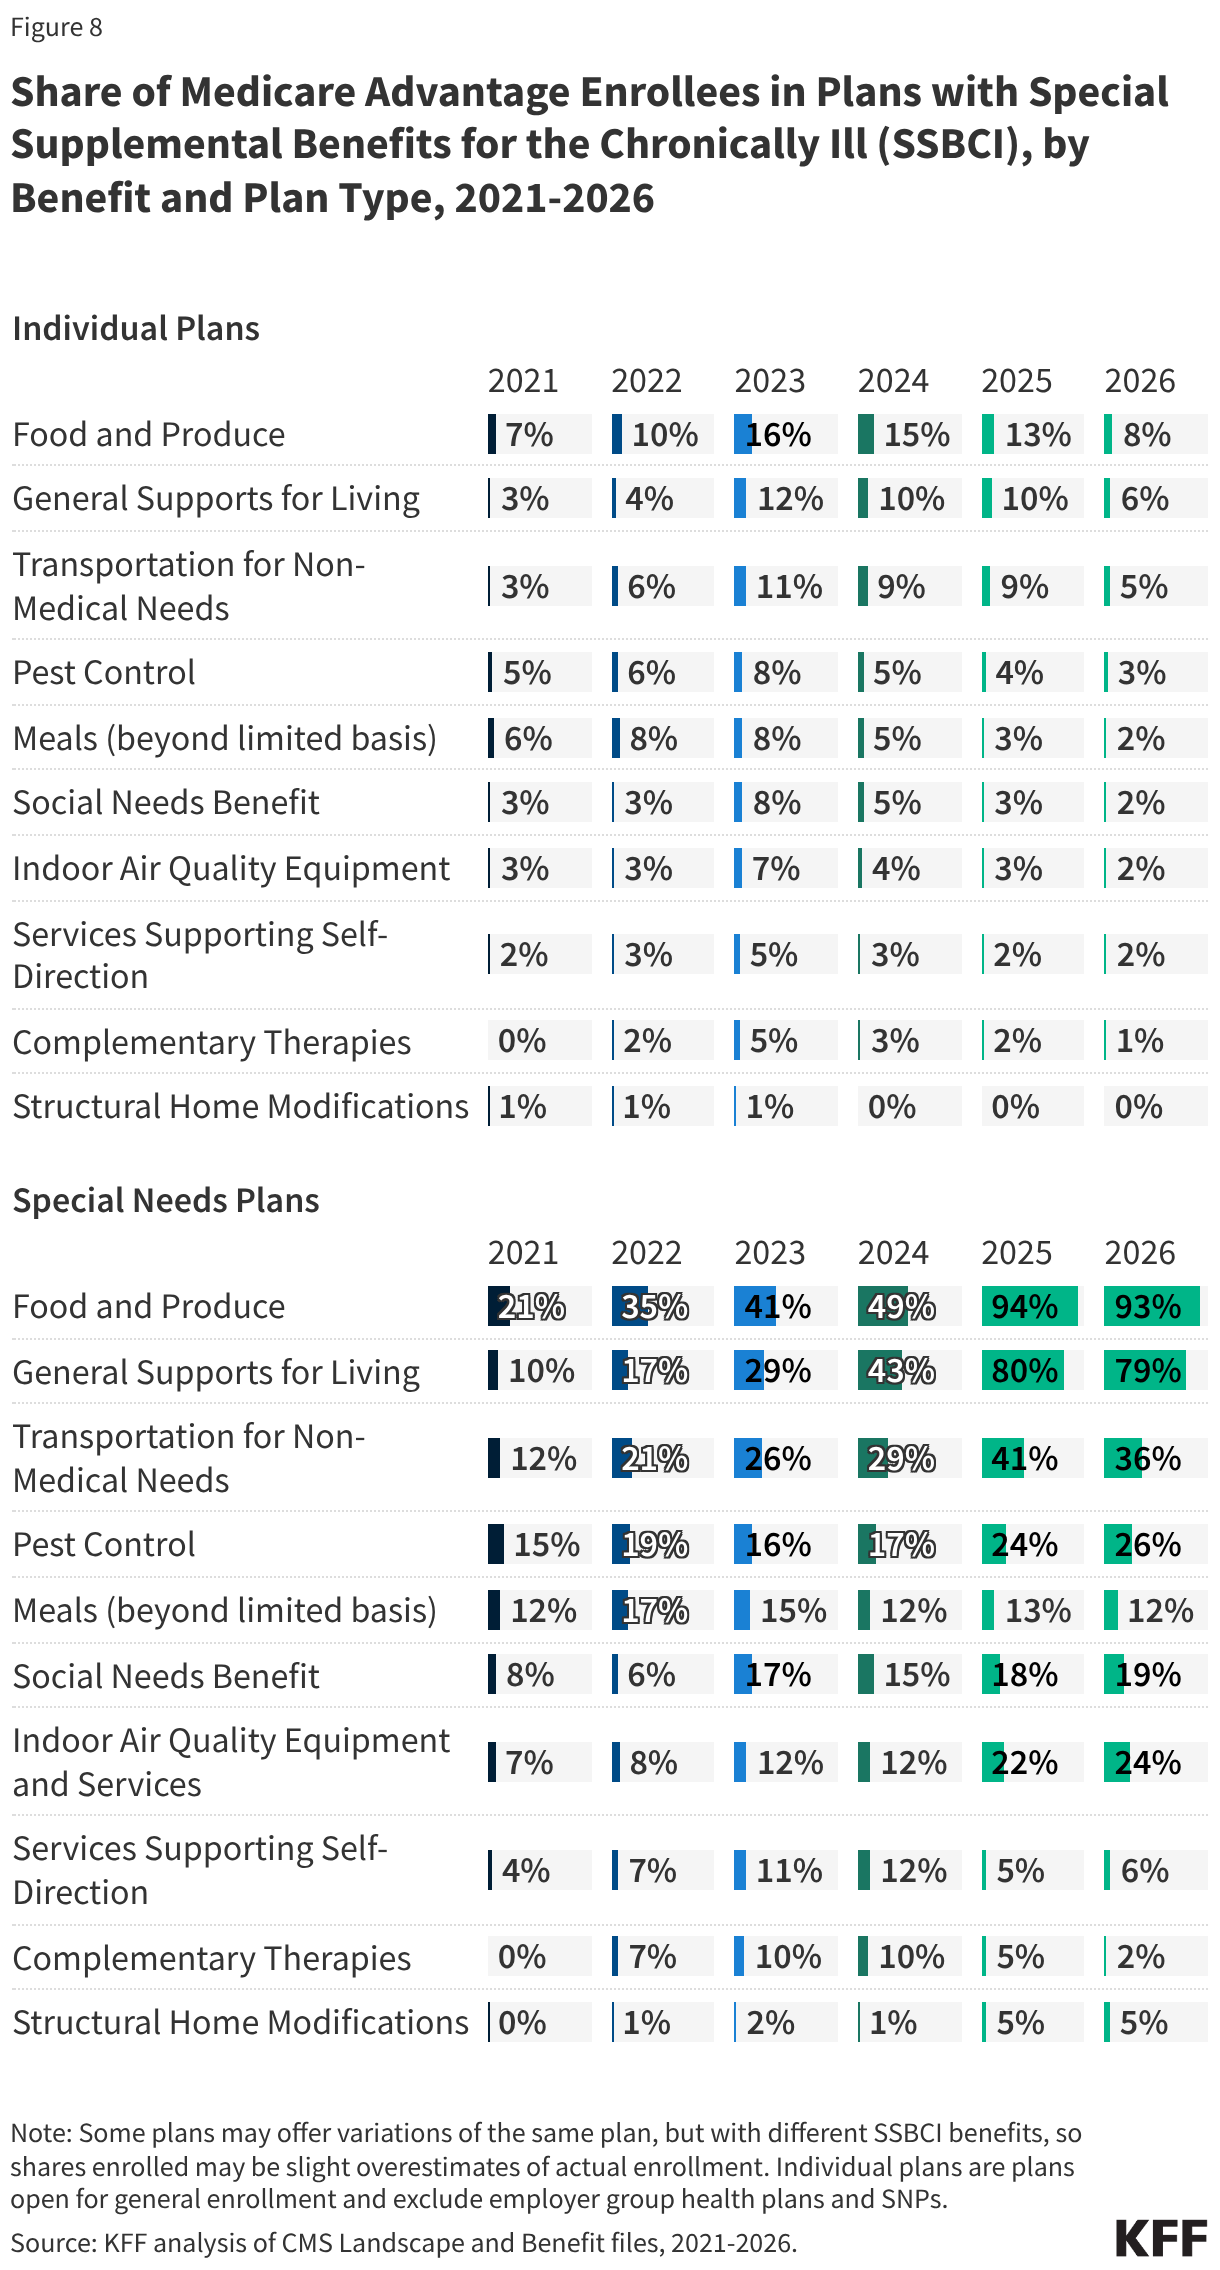
Further, the Medicare Advantage Value-Based Insurance Design Model (VBID), which launched in 2017, gave plans the ability to provide additional interventions to enrollees such as reduced cost sharing and extra benefits based on their socioeconomic status (e.g., LIS eligibility), along with other targeting criteria. This meant many enrollees in SNPs, including those dually eligible for Medicare and Medicaid, may have been eligible for additional benefits. For example, plans enrolled in the model were able to offer benefits such as food and produce, assistance with utilities, and transportation for non-medical needs, among others, to a broader group of enrollees, when many of those benefits were typically reserved for enrollees who met the stricter definition of eligibility for Special Supplemental Benefits for the Chronically Ill (SSBCI). However, CMS discontinued this model in 2025 due to the “unprecedented cost” of this model, including increased rebates and increased Part D expenditures.

D-SNPs. Most SNP enrollees (78%) are in plans for beneficiaries dually enrolled in both Medicare and Medicaid (D-SNPs), a decline from 83% in 2025. While D-SNPs are designed specifically for dually-eligible individuals, among the 3.9 million dually-eligible enrollees with full benefits enrolled in Medicare Advantage plans, 28% were enrolled in Medicare Advantage plans that are generally available to all beneficiaries (not designed specifically for the dually-eligible population).

C-SNPs. Another 20% of SNP enrollees are in plans for people with severe chronic or disabling conditions (C-SNPs) – an increase from 16% in 2025. C-SNP enrollment in 2026 (about 1.7 million people) is 45% higher than it was in 2025 – an increase of about 518,000 enrollees. Nearly all (97%) C-SNP enrollees are in plans for people with diabetes or cardiovascular conditions in 2026, the same as in 2025.

I-SNPs. And 2% of SNP enrollees in 2026 are in plans for beneficiaries requiring a nursing home or institutional level of care (I-SNPs), the same as 2025. Enrollment in I-SNPs increased slightly in 2026 124,000 enrollees, an increase of about 9,000 enrollees since 2025.

SNP enrollment varies across states. In the District of Columbia and Puerto Rico, SNP enrollees comprise about half of all Medicare Advantage enrollees (51% in DC and 49% in PR). In eleven states, SNP enrollment accounts for at least a quarter of Medicare Advantage enrollment: 46% in MS, 40% in AR, 37% in NY, 36% in LA, 33% in FL, 32% in SC, 30% in GA, 27% in OK and AL, 26% in CT, and 26% in RI. In the remaining 39 states, fewer than a quarter of Medicare Advantage enrollees are in SNPs, including Alaska and Vermont, which have no SNP enrollment.

Enrollment in a D-SNP comprises the largest share of enrollment in SNPs in all states except New Hampshire where C-SNP enrollment is higher, though overall SNP enrollment only represents 2% of Medicare Advantage enrollment in New Hampshire. C-SNP enrollment represents a relatively large share of Medicare Advantage SNP enrollment in Illinois, Utah, South Carolina, Delaware, Nevada, and Oregon, where 40% or more of SNP enrollment is in C-SNPs.

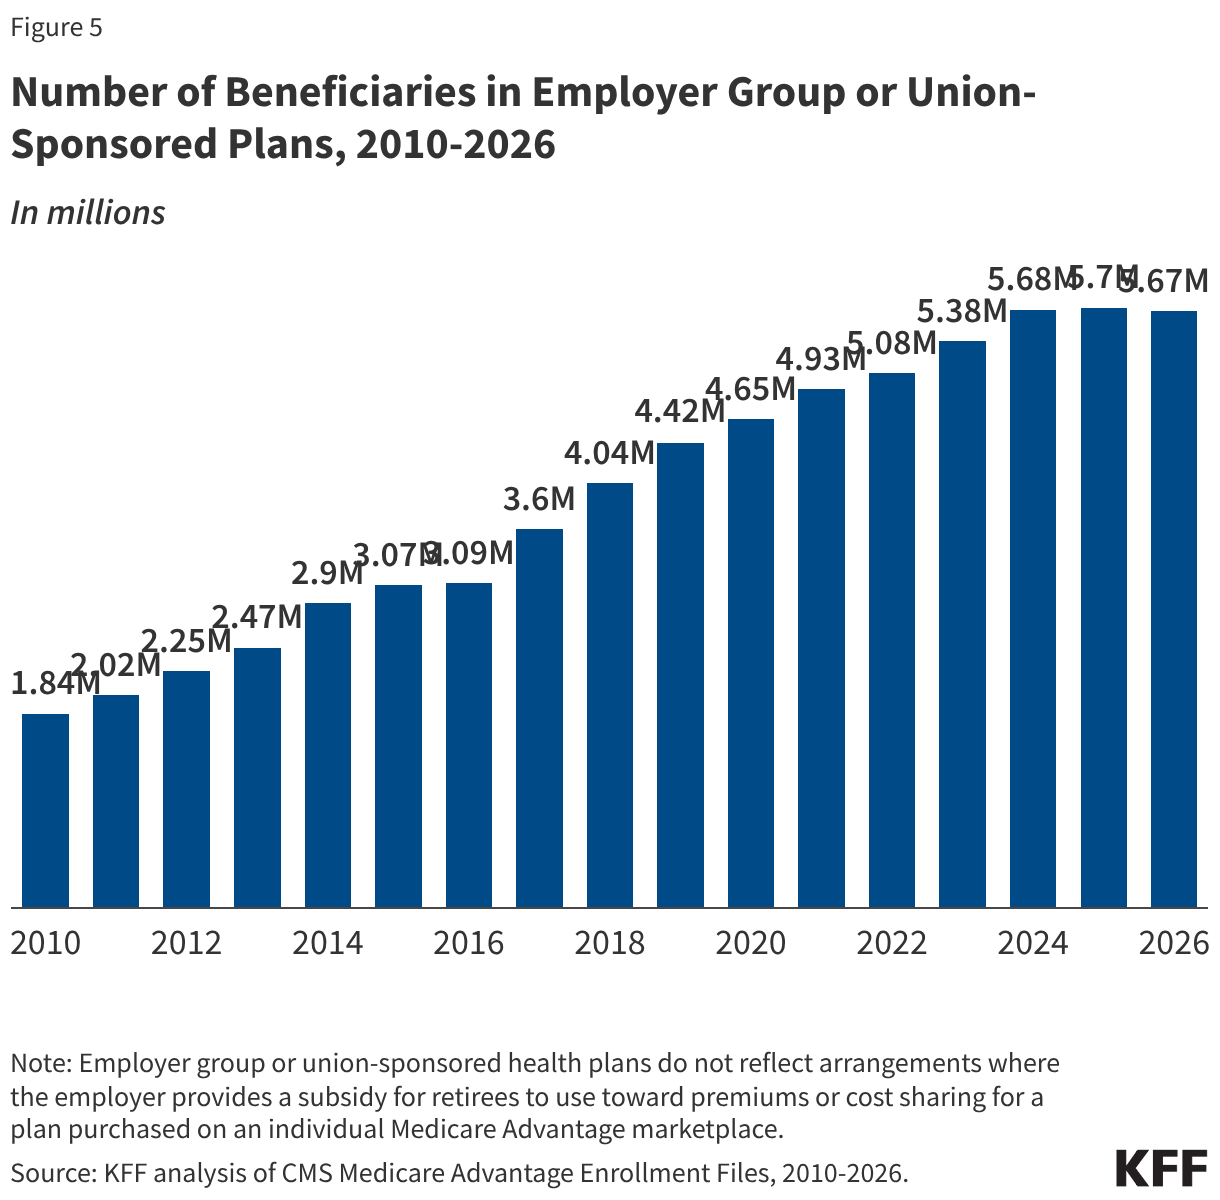
Slightly less than one in five (16% or about 5.7 million) Medicare Advantage enrollees are in a group plan offered to retirees by an employer or union.

Group enrollment as a share of total Medicare Advantage enrollment is 16%, the lowest share since 2010, though it has generally fluctuated between 17% and 20% of enrollment. At the same time, the number of enrollees has increased from 1.8 million in 2010 to 5.7 million in 2026. The 2026 enrollment in group plans is a slight decrease from 2025 (a decrease of about 31,000 enrollees), the first time since 2010 that enrollment in this type of plan has declined year-to-year (Figure 5). With a group plan, an employer or union contracts with an insurer and Medicare pays the insurer a fixed amount per enrollee to provide benefits covered by Medicare. For example, 13 states provided health insurance benefits to their Medicare-eligible retirees exclusively through Medicare Advantage plans in 2024.

Number of Beneficiaries in Employer Group or Union-Sponsored Plans, 2010-2026 (Column Chart)

As with other Medicare Advantage plans, employer and union group plans may provide additional benefits and/or lower cost sharing than traditional Medicare and are eligible for bonus payments if they obtain required quality scores. The employer or union (and sometimes the retiree) may also pay an additional premium for these supplemental benefits. Group enrollees comprise a quarter or more of Medicare Advantage enrollees in seven states: 100% in AK, 60% in VT, 34% in MI, 31% in NJ, 28% in MD and WV, and 25% in IL.

Medicare Advantage enrollment is highly concentrated among a small number of parent organizations.

The average Medicare beneficiary is able to choose from Medicare Advantage plans offered by 8 parent organizations in 2026, the same as in 2025 and 2024, and nearly three in ten (29%) can choose among Medicare Advantage plans offered by 10 or more parent organizations.

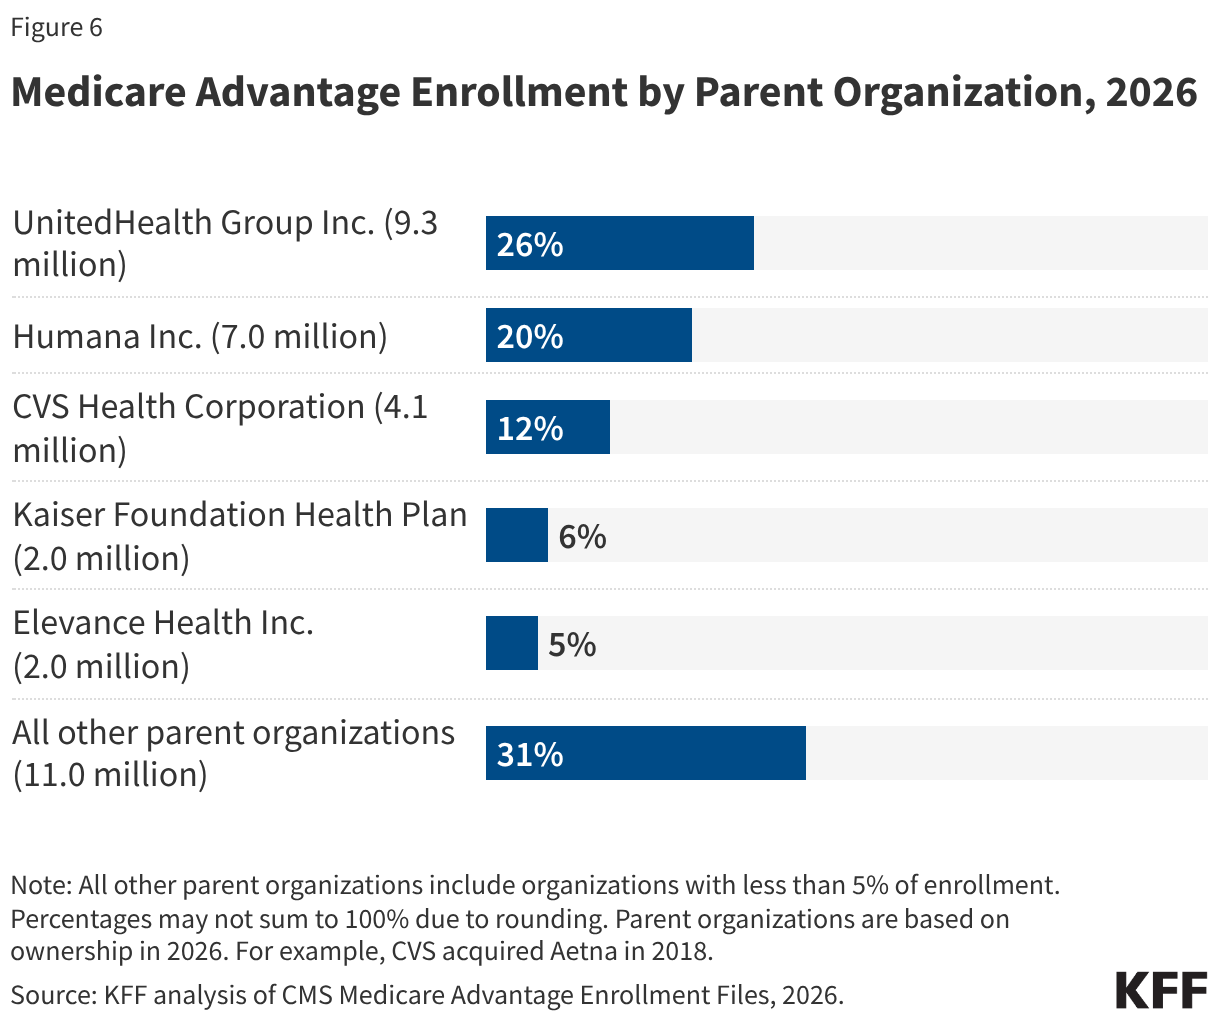
UnitedHealth Group and Humana account for nearly half of all Medicare Advantage enrollees nationwide in 2026.

Despite most beneficiaries having access to plans operated by several parent organizations, Medicare Advantage enrollment is highly concentrated among a small number of parent organizations (Figure 6). UnitedHealth Group Inc. accounts for 26% of all Medicare Advantage enrollment in 2026 (a decline from 29% in 2025), or 9.3 million enrollees. Humana Inc. accounts for 20% of all Medicare Advantage enrollment in 2026 (an increase from 17% in 2025), or 7 million enrollees. Together, UnitedHealth Group Inc. and Humana Inc. account for nearly half (46%) of all Medicare Advantage enrollees nationwide, the same share as in 2025. In more than a quarter of counties (28% or 889 counties), these two organizations account for at least 75% of Medicare Advantage enrollment. These counties include East Baton Rouge (Baton Rouge), LA (81%), Travis County (Austin), TX (78%), Jackson County (Kansas City), MO (76%), and Palm Beach, Florida (75%).

Three other parent organizations comprise more than 5% of Medicare Advantage enrollment: CVS Health Corporation (12%), Kaiser Foundation Health Plan Inc. (6%), and Elevance Health Inc, (5%). (In contrast, as of 2025, CVS Health and Centene Corporation dominate the market for stand-alone prescription drug plans (PDP) that supplement traditional Medicare, with both organizations accounting for just over half of enrollment in PDPs).

Medicare Advantage Enrollment by Parent Organization, 2026 (Bar Chart)

Humana and Kaiser Permanente were the only large insurers to increase enrollment from 2025 to 2026.

In absolute numbers, Humana had the largest growth in enrollment, with 1.3 million more beneficiaries enrolled in a plan sponsored by Humana in March 2026 than in March 2025 (Figure 7). Of the largest insurers (5% of enrollment or more), Kaiser Permanente had the second largest growth in enrollment, with an increase of nearly 87,000 beneficiaries between March 2025 and March 2026. However, some smaller insurers had even larger growth – Devoted Health had an increase of nearly 258,000, SCAN Group had an increase of 136,000, and Aware Integrated had an increase of 89,000 beneficiaries between March 2025 and March 2026 (data not shown).

In contrast, enrollment in UnitedHealth plans declined, decreasing by nearly 647,000 beneficiaries between March 2025 and March 2026, and Elevance had the second largest enrollment drop, losing 346,000 beneficiaries, while enrollment in CVS plans declined by nearly 29,000.

Medicare Advantage Enrollment by Parent Organization, 2025-2026 (Table)

Methods

This analysis uses data from the Centers for Medicare & Medicaid Services (CMS) Medicare Advantage Enrollment, Benefit and Landscape files for the respective year. KFF uses the Medicare Enrollment Dashboard for enrollment data for March 2024-2025, and the CMS Chronic Conditions Data Warehouse Master Beneficiary Summary File (MBSF) for March for earlier years. For overall Medicare Advantage penetration for 2026, we are using February data from the Medicare Enrollment Dashboard and will update to March when available. For other analyses of enrollment in this brief, KFF uses March data; enrollment data is only provided for plan-county combinations that have at least 11 beneficiaries; thus, this analysis excludes approximately 400,000 individuals who reside in a county where county-wide plan enrollment does not meet this threshold. Trend analysis begins in 2007 because that was the earliest year of data that was based on March enrollment. Data from the Medicare enrollment dashboard (used to calculate penetration rates) may change retroactively as CMS updates and reconciles administrative enrollment records. As a result, historical enrollment counts and penetration rates may differ from earlier downloads of the same data.

KFF calculates the share of eligible Medicare beneficiaries enrolled in Medicare Advantage, meaning they must have both Part A and B coverage. In previous years, KFF calculated the share of Medicare beneficiaries enrolled in Medicare Advantage by including Medicare beneficiaries with either Part A and/or B coverage. We modified our approach in 2022 to estimate the share enrolled among beneficiaries eligible for Medicare Advantage who have both Medicare Part A and Medicare B.

Additionally, in previous years, KFF had used the term Medicare Advantage to refer to Medicare Advantage plans as well as other types of private plans, including cost plans, PACE plans, and HCPPs. However, cost plans, PACE plans, and HCPPs are excluded from this analysis in addition to MMPs. In this analysis, KFF excludes these other plans as some may have different enrollment requirements than Medicare Advantage plans (e.g., may be available to beneficiaries with only Part B coverage) and in some cases, may be paid differently than Medicare Advantage plans. These exclusions are reflected in all data displayed trending back to 2007.

Beginning with the analysis of 2025 Medicare Advantage enrollment, KFF has relied on the parent organization field reported to CMS to identify plans sponsored by the same insurer. Previously, KFF had supplemented these data with publicly available information about acquisitions, mergers, and business relationships. The previous approach led to fewer total plan sponsors.

Medicare projections for 2027-2036 are from the February Congressional Budget Office (CBO) Medicare Baseline for 2026. Using the CBO baseline, Medicare enrollment is based on individuals who are enrolled in Part B, which is designed to include only individuals who are eligible for Medicare Advantage and exclude those who only have Part A only (~5.7 million people in 2026) and cannot enroll in Medicare Advantage. However, it may include some individuals who have Part B only and also are not eligible for Medicare Advantage.

Enrollment counts in publications by firms operating in the Medicare Advantage market, such as company financial statements, might differ from KFF estimates due to inclusion or exclusion of certain plan types, such as SNPs or employer group health plans.

Meredith Freed, Jeannie Fuglesten Biniek, and Tricia Neuman are with KFF. Anthony Damico is an independent consultant.

Medicare Advantage in 2026: Premiums, Out-of-Pocket Limits, Supplemental Benefits, and Prior Authorization

Authors: Meredith Freed, Jeannie Fuglesten Biniek, Anthony Damico, and Tricia Neuman
Published: Jun 5, 2026

People with Medicare have the option of receiving their Medicare benefits through the traditional Medicare program administered by the federal government or through a private Medicare Advantage plan, such as an HMO or PPO. In Medicare Advantage, the federal government contracts with private insurers to provide Medicare benefits to enrollees. Medicare pays insurers a set amount per enrollee per month, which varies depending on the county in which the plan is located, the health status of the plan’s enrollees, the plan’s quality star rating, and the plan’s estimated costs of covering Medicare Part A and Part B services.

The plans use the payments from the federal government to pay for Medicare-covered services, and in most cases, to also pay for supplemental benefits and reduced cost sharing, which are attractive to enrollees. Plans are able to offer these additional benefits, often without charging an additional premium for Part D prescription drugs or supplemental benefits, because in 2026, they receive an additional $2,664 per enrollee above their estimated costs of providing Medicare-covered services, according to the Medicare Payment Advisory Commission (MedPAC). This portion of plan payments, also called the rebate, has increased substantially in the last several years, more than doubling since 2018.

Plans are also able to lower costs, which help finance these supplemental benefits, through cost management tools, such as prior authorization requirements and provider networks. Prior authorization requirements are used to assess whether health care services are medically necessary before they are covered to reduce unnecessary costs, though they may also impose barriers to receiving care. Medicare Advantage plans often have a limited network of providers, which can restrict beneficiary choice of physicians and hospitals. More than half of Medicare Advantage beneficiaries are enrolled in HMO plans that typically do not cover out-of-network services.

This brief provides information about Medicare Advantage plans in 2026, including premiums, out-of-pocket limits, supplemental benefits, and prior authorization, as well as trends over time. A companion analysis examines trends in Medicare Advantage enrollment.

Highlights for 2026:

  • In 2026, three quarters (75%) of enrollees in individual Medicare Advantage plans with prescription drug coverage pay no premium other than the Medicare Part B premium, which is a selling point for enrollees, particularly those living on modest incomes. The average supplemental premium, including Medicare Advantage enrollees who pay no supplemental premium, is $15 a month. Individual Medicare Advantage plans are available to all beneficiaries with Medicare Part A and Part B, unlike special needs plans (SNPs) or group plans offered to retirees by an employer or union.
  • More than 6 in 10 enrollees in individual Medicare Advantage plans with prescription drug coverage are in HMOs (61%), 38% are in local PPOs, and less than 1% are in regional PPOs in 2026. HMOs generally only cover services provided in-network, but tend to have lower supplemental premiums, which were $12 a month, on average, in 2026. PPOs cover services received out-of-network, typically for higher cost sharing, and tend to charge higher supplemental premiums, which were $18 a month, on average, in 2026.
  • The average out-of-pocket limit for Medicare Advantage enrollees is $5,421 for in-network services and $9,825 for in-network and out-of-network services combined in 2026. The average out-of-pocket limit for in-network services is higher for PPOs ($6,592) than HMOs ($4,636). Traditional Medicare does not have an out-of-pocket limit, but Medicare Advantage plans are required to cap patient costs.
  • Most Medicare Advantage enrollees are in plans that offer supplemental benefits not covered by traditional Medicare, such as vision, hearing and dental. From 2025 to 2026, access to dental, vision, and hearing benefits for Medicare Advantage enrollees remained stable. However, there were decreases in the share of individual plan enrollees in plans providing over-the-counter benefits, meal benefits, remote access technologies, transportation benefits, and bathroom safety devices. The share of SNP enrollees in plans that offered in-home support services increased, while the share of SNP enrollees in plans that offered transportation benefits, bathroom safety devices, and remote access technologies decreased.
  • About one third of enrollees (31%) are in plans that also reduce the Part B premium ($202.90 per month in 2026), most often by less than $10 a month. Among enrollees in individual Medicare Advantage plans, nearly a third (32%) received a reduction in their Part B premium in 2026, the same as in 2025. Among enrollees in individual plans that offer reduced Part B premiums as a supplemental benefit, 39% are in plans that reduce premiums by less than $10 a month, while about 32% are in plans that reduce Part B premiums by $100 or more per month.
  • Nearly all Medicare Advantage enrollees (99%) are in plans that require prior authorization for some services, which is rarely used in traditional Medicare. Prior authorization is most often required for relatively expensive services, such as inpatient hospital stays (acute: 97%; psychiatric: 93%), skilled nursing facility stays (95%), Part B drugs (94%), and home health services (90%) and is rarely required for preventive services (6%).

In 2026, three quarters of Medicare Advantage enrollees (75%) are in plans with no premium other than the Part B premium.

In 2026, most people (75%) enrolled in individual Medicare Advantage plans with prescription drug coverage (MA-PDs) pay no premium other than the Medicare Part B premium ($202.90 in 2026) (Figure 1). The MA-PD supplemental premium includes both the cost of Medicare-covered Part A and Part B benefits and Part D prescription drug coverage. In 2026, 96% of Medicare Advantage enrollees in individual plans open for general enrollment are in plans that offer prescription drug coverage.

Distribution of Medicare Advantage Prescription Drug Plan (MA-PD) Enrollees, by Supplemental Premium, 2026 (Donut Chart)

Altogether, including those who do not pay a supplemental premium, the average enrollment-weighted supplemental premium in 2026 is $15 per month, and averages $8 per month for just the Part D portion of covered benefits, substantially lower than the average premium of $36 for stand-alone prescription drug plans (PDP) in 2026. Higher average PDP premiums compared to the MA-PD drug portion of premiums is due in part to the ability of MA-PD sponsors to use rebate dollars from Medicare payments to lower their Part D premiums. When a plan’s estimated costs for Medicare-covered services are below the maximum amount the federal government will pay private plans in an area (known as the benchmark), the plan retains a portion of the difference, known as the “rebate” (See How Medicare Pays Medicare Advantage Plans: Issues and Policy Options for additional information on how Medicare sets payment rates). According to MedPAC, rebates average nearly $2,400 per enrollee in 2026 for individual plans, with individual plans allocating $600 or 26% of these rebates for Part D benefits, including reducing Part D premiums.

For the 25% of beneficiaries in plans that charge a MA-PD premium (5.0 million), the average premium is $59 per month, and averages $40 for the Part D portion of covered benefits.

Supplemental premiums paid by Medicare Advantage enrollees steadily declined between 2015 and 2025 but increased slightly in 2026.

Average supplemental MA-PD premiums declined from $36 per month in 2015 to $13 per month in 2025, but increased to $15 per month in 2026 (Figure 2). Average supplemental MA-PD premiums have declined markedly for local PPOs, falling from $65 per month in 2015 to $15 per month in 2025, but increased to $18 per month in 2026. Supplemental premiums for HMOs have also declined steadily from $28 per month in 2015 to $11 per month in 2025, increasing slightly to $12 per month in 2026. Only regional PPOs, which represent a very small and declining share of enrollment, have seen an increase in plan premiums over this time from $36 per month in 2015 to $75 in 2025, increasing again to $89 per month in 2026.

More than 6 in 10 individual Medicare Advantage enrollees in plans with prescription drug coverage are in HMOs (61%), 38% are in local PPOs, and less than 1% are in regional PPOs in 2026. The reduction in supplemental premiums for nearly all plans is driven in part by the decline in supplemental premiums for local PPOs and HMOs, that account for a rising share of enrollment over this time period, as well as the increase in rebates paid by Medicare to these plans.

Since 2015, a rising share of plans estimate that their cost of providing Medicare Part A and Part B services (the “bid”) is below the benchmark, and as plan bids have declined, the rebate portion of plan payments has increased. Additionally, because rebates are adjusted for the health status of enrollees, rebates have increased as risk scores have increased. (A risk score is a measure that reflects an enrollee’s expected health care costs based on their health status and demographic characteristics, with higher risk scores translating to higher payments to plans.) As mentioned above, plans are allocating some of these rebate dollars to lower the Part D portion of the MA-PD premium. According to MedPAC, rebates for individual plans have increased from an average of about $924 per enrollee in 2015 to nearly $2,400 per enrollee in 2026. This trend contributes to greater availability of zero-premium plans, which brings down average premiums.

Average Monthly Medicare Advantage Prescription Drug Plan Supplemental Premiums, Weighted by Plan Enrollment, 2010-2026 (Line chart)

The average out-of-pocket limit for Medicare Advantage enrollees is $5,421 for in-network services and $9,825 for both in-network and out-of-network services (PPOs) in 2026.

Since 2011, federal regulation has required Medicare Advantage plans to provide an out-of-pocket limit for services covered under Parts A and B. In contrast, traditional Medicare does not have an out-of-pocket limit for covered services.

In 2026, the out-of-pocket limit for Medicare Advantage plans may not exceed $9,250 for in-network services and $13,900 for in-network and out-of-network services combined, though plans can offer lower limits than the maximum. These out-of-pocket limits apply to Part A and B services only, and do not apply to Part D spending, which has a separate out-of-pocket limit of $2,100 in 2026. The size of Medicare Advantage provider networks for physicians vary greatly across counties and across plans in the same county, with beneficiaries having access to about half of the physicians available to traditional Medicare beneficiaries in their area, on average.

In 2026, the average out-of-pocket limit for Medicare Advantage enrollees is $5,421 for in-network services, including those enrolled in both HMOs and PPOs. The average out-of-pocket limit both in-network and out-of-network services combined, which applies to just PPOs, is $9,825 (Figure 3).

In 2026, the Average Out-Of-Pocket Limits for Medicare Advantage Enrollees Are ,421 for In-Network Services and ,825 for In-Network and Out-Of-Network Services Combined (Bar Chart)

HMOs generally only cover services provided by in-network, and the average out-of-pocket (in-network) limit is $4,636. Enrollees in HMOs are generally responsible for 100% of costs incurred for out-of-network care, so typically do not have a limit for out-of-network services. These numbers also include about 6 million Medicare Advantage enrollees that are in HMO Point-of-Service plans (HMO-POS), which generally operate the same as HMOs, but give enrollees the option of receiving specified services outside of the HMO plan's provider network, though these services typically cost more than services received in-network and may require prior approval. PPOs cover services delivered by out-of-network providers but charge enrollees higher cost sharing for this care. The average out-of-pocket limit for in-network services for PPOs is $6,592.

Average out-of-pocket limits for in-network services generally declined between 2017 and 2023 but have increased since then, with average limit for in-network services decreasing by nearly $600 from 2017 ($5,253) to 2023 ($4,685), before increasing by about $700 from 2023 to 2026 ($5,421).

Most Medicare Advantage enrollees, including enrollees in special needs plans (SNPs), are in plans that offer some benefits not covered by traditional Medicare in 2026.

Virtually all enrollees in individual Medicare Advantage plans (those generally available to Medicare beneficiaries) are in plans that offer primarily health related supplemental benefits including eye exams and/or glasses (more than 99%), dental care (98%) hearing exams and/or aids (95%), and a fitness benefit (91%) (Figure 4). Similarly, most enrollees in SNPs are in plans that offer these benefits. However, benefits such as in-home support services are less common for enrollees in both individual plans (10%) and SNPs (38%). This analysis excludes employer-group health plans because employer plans do not submit bids, and available data on supplemental benefits may not be reflective of what employer plans actually offer.

Though these benefits are widely available, the scope of specific services varies. For example, a dental benefit may include preventive services only, such as cleanings or x-rays, or more comprehensive coverage, such as crowns or dentures. Plans also vary in terms of cost sharing for various services and limits on the number of services covered per year, many impose an annual dollar cap on the amount the plan will pay toward covered service, and some have networks of dental providers that beneficiaries must choose from.

SNPs restrict enrollment to beneficiaries with significant or relatively specialized care needs, or who qualify because they are eligible for both Medicare and Medicaid. Enrollees in SNPs have greater access than other Medicare Advantage enrollees to transportation (73% vs 22%), meal benefits (81% vs 65%), bathroom safety devices (60% vs 21%), over-the-counter benefits (98% vs 68%), and in-home support services (38% vs 10%). Enrollees in SNPs who are dually eligible for Medicare and Medicaid may also have access to similar benefits through Medicaid.

It is not known what share of enrollees have used these benefits because data are not yet available.

Share of Medicare Advantage Enrollees in Plans with Extra Benefits by Benefit and Plan Type, 2026 (Split Bars)

As of 2020, Medicare Advantage plans have been allowed to include telehealth benefits as part of the basic Medicare Part A and B benefit package – beyond what was allowed under traditional Medicare prior to the public health emergency, which has again been extended to December 31, 2027. Therefore, these benefits are not included in the figure above because their cost is not covered by either rebates or supplemental premiums. Medicare Advantage plans may also offer supplemental telehealth benefits via remote access technologies and/or telemonitoring services, which can be used for those services that do not meet the requirements for coverage under traditional Medicare or the requirements for additional telehealth benefits (such as the requirement of being covered by Medicare Part B when provided in-person). Less than half of enrollees in both individual plans and SNPs are in plans that offer remote access technologies (43% and 39%, respectively), and just 2% of enrollees in individual plans and 1% of enrollees in SNPs have access to telemonitoring services.

Nearly all Medicare Advantage enrollees are in plans that offer vision, dental, and hearing benefits, similar to 2025, while fewer are offered over-the-counter benefits, meals, remote access technologies, transportation, and bathroom safety devices.

In 2026, there were changes to the share of enrollees in plans that offer specific benefits compared to 2025. The same share of enrollees in individual plans are in plans that offer eye exams and/or eyeglasses, dental benefits, and hearing exams and/or aids (Figure 5). However, smaller shares of enrollees are in plans that offer over-the-counter benefits (68% in 2026 vs 79% in 2025), meal benefits (65% in 2026 vs 70% in 2025), remote access technologies (43% in 2026 vs 49% in 2025), transportation benefits (22% in 2026 vs 28% in 2025), and bathroom safety devices (21% in 2026 vs 32% in 2025).

For those in Special Needs Plans (SNPs), similar shares of enrollees are in plans that offer eye exams and/or eyeglasses, dental benefits, and hearing exams and/or aids compared to 2025. Larger shares of SNP enrollees are in plans that offer in home-support services (38% in 2026 vs 11% in 2025). However, smaller shares of SNP enrollees are in plans that offer transportation benefits (73% in 2026 vs 80% in 2025), bathroom safety devices (60% in 2026 vs 68% in 2025), and remote access technologies (39% in 2026 vs 46% in 2025).

Despite concerns that recent changes to Medicare Advantage payment may impact the availability of extra benefits, overall, Medicare Advantage enrollees have not experienced a substantial loss in access to supplemental benefits, particularly dental, vision, hearing, and fitness benefits. However, the availability of some supplemental benefits, such as those mentioned above, has decreased over the last few years, down from a peak in 2023. This analysis also does not account for any changes to the design of benefits, which could make benefits more or less generous, such as changes to eligibility for these benefits, networks of providers, required cost sharing, or the generosity coverage.

Additionally, while CMS collects data on the use and spending for supplemental benefits, these data are not currently available to researchers or consumers. Further, CMS does not collect detailed data on prior authorization requests and denials for these benefits.

Share of Medicare Advantage Enrollees In Plans with Select Extra Benefits, by Benefit and Plan Type, 2016-2026 (Small multiple column chart)

Nearly one-third (31%) of enrollees are in plans that offer a rebate against the Part B premium, though the dollar values of the rebates are often small.

In 2026, about one-third (32%) of individual plan enrollees were in plans that offer a Part B rebate, the same as in 2025. Although the Part B rebate is often used in Medicare Advantage marketing (sometimes described as “money back in your Social Security check”), for most enrollees, the dollar value of the rebate is small relative to the $202.90 standard Part B premium in 2026. Among the 6.7 million beneficiaries in an individual Medicare Advantage plan that provides a Part B rebate, 39% (2.6 million) are in plans that offer rebates of less than $10 a month, though about one-third (32%; 2.2 million) are in plans that offer rebates of $100 or more per month. (Figure 6). In other words, about 12% of all Medicare Advantage enrollees in individual plans get $10 a month off their monthly Part B premium, while 10% get $100 or more off their monthly premium.

In 2026, 30% of SNP enrollees were in plans that offer a Part B rebate, down from 44% in 2025. Among all SNP enrollees, 22% are in plans with a rebate of less than $10 a month. Most SNP enrollees are dually eligible for Medicare and Medicaid, and Medicaid pays the Part B premiums on their behalf (except in Puerto Rico). When dually-eligible individuals enroll in a Medicare Advantage plan with a Part B rebate, the state Medicaid program receives the Part B premium rebate payment from the plan (except in Puerto Rico).

Distribution of Part B Rebate Amounts Among Medicare Advantage Enrollees, 2026 (Split Bars)

Enrollees in SNPs are more likely to be in plans that offer Special Supplemental Benefits for the Chronically Ill (SSBCI) than other Medicare Advantage enrollees.

Beginning in 2020, Medicare Advantage plans have also been able to offer supplemental benefits that are not primarily health related for chronically ill beneficiaries, known as Special Supplemental Benefits for the Chronically Ill (SSBCI). In addition, Medicare Advantage plans participating in the Value-Based Insurance Design Model (which was discontinued at the end of 2025) also offered these non-primarily health related supplemental benefits to their enrollees, but used different eligibility criteria than required for SSBCI, including offering them based on an enrollee’s socioeconomic status (e.g., LIS eligibility) or whether the enrollee lives in an underserved area. While this analysis provides information on the share of Medicare Advantage enrollees in plans that offer these SSBCI benefits, data on how many beneficiaries use these benefits and how often they use them are not currently available.

In 2026, the share of Medicare Advantage enrollees offered SSBCI is highest for food and produce—8% of individual plan enrollees (1.8 million), and the vast majority (93%) of SNP enrollees (7.6 million) are offered this benefit (Figure 7).

The other SSBCI benefits that are most commonly offered are:

  • General supports for living (e.g., housing, utilities) (6% for individual plans vs 79% for SNPs)
  • Transportation for non-medical needs (5% for individual plans vs 36% for SNPs)
  • Pest control (3% for individual plans vs 26% for SNPs)
  • Meals beyond a limited basis (2% for individual plans vs 12% for SNPs)
  • A social needs benefit (e.g., community programs)(2% for individual plans vs 19% for SNPs)
  • Indoor air quality equipment and services (e.g., air conditioning units)(2% for individual plans vs 24% for SNPs)
  • Services supporting self-direction (e.g., power of attorney for health services, financial literacy classes) (2% for individual plans vs 6% for SNPs)
  • Complementary therapies (those offered alongside traditional medical treatment) (1% for individual plans vs 2% for SNPs)
  • Structural home modifications (0.04% for individual plans vs 5% for SNPs)
Share of Medicare Advantage Enrollees in Plans with Special Supplemental Benefits for the Chronically Ill (SSBCI), by Benefit and Plan Type, 2026 (Split Bars)

In addition to the 10 initially enumerated examples of SSBCI provided by CMS, plans are also able to offer “other” extra benefits specified by the plan, including pet care/service animal supplies (2% in individual plans and 6% for SNPs), personal care (2% in individual plans and 8% for SNPs), memory care (1% in individual plans and 4% for SNPs), and hairstyling and beauty care (1% in individual plans and 2% for SNPs). However, this is not an exhaustive list of additional benefits plans may offer.

While the share of enrollees with plans that offer some SSBCI benefits has increased since 2021, such as food and produce, growth for other benefits has been much slower.

Though the share of SNP enrollees in plans with food and produce benefits and general supports for living benefits has grown considerably since 2021, the share of enrollment in plans for other SSBCI benefits has grown much more slowly, particularly for enrollees in individual plans (Figure 8). For example, the share of SNP Medicare Advantage enrollees with food and produce benefits has more than quadrupled from 21% in 2021 to 93% in 2026—with the sharpest growth from 2024 (49%) to 2025 (94%)—while for individual plans, food and produce benefits are far less common. The share of enrollees with these benefits increased modestly from 2021 to 2023 (from 7% to 16%) but has declined back to 8% in 2026. For general supports for living benefits, the share of SNP Medicare Advantage enrollees with these benefits has also significantly increased from 10% to 79%—with the sharpest growth from 2024 (43%) to 2025 (80%)—while for individual plans, the share more than tripled to 2025, from 3% to 10%, but has declined back to 6% in 2026.

Like for other supplemental benefits, the scope of services for SSBCI benefits varies. For example, many plans offer a specified dollar amount that enrollees can use toward a variety of benefits, such as food and produce, utility bills, rent assistance, and transportation for non-medical needs, among others. This dollar amount is often loaded onto a flex card or spending card that can be used at participating stores and retailers, which can vary depending on the vendor administering the benefit. Depending on the plan, this may be a monthly allowance that expires at the end of each month or rolls over month to month until the end of the year, when any unused amount expires.

Share of Medicare Advantage Enrollees in Plans with Special Supplemental Benefits for the Chronically Ill (SSBCI), by Benefit and Plan Type, 2021-2026 (Split Bars)

Nearly all Medicare Advantage enrollees are in plans that require prior authorization for many higher-cost services.

Medicare Advantage plans can require enrollees to receive prior authorization before a service will be covered, and nearly all Medicare Advantage enrollees (99%) are in plans that require prior authorization for some services in 2026 (Figure 9). Prior authorization is most often required for relatively expensive services, such as inpatient hospital stays (acute: 97%; psychiatric: 93%), skilled nursing facility stays (95%), Part B drugs (94%), and home health services (90%) and is rarely required for preventive services (6%). Prior authorization is also required for the majority of enrollees for some extra benefits (in plans that offer these benefits), including preventive dental services, and hearing and eye exams.

Share of Medicare Advantage Enrollees Required to Receive Prior Authorization, by Service, 2026 (Bar Chart)

The number of enrollees in plans that require prior authorization for one or more services stayed around the same from 2025 to 2026. In contrast to Medicare Advantage plans, traditional Medicare does not generally require prior authorization for services and does not require step therapy for Part B drugs. However, the Center for Medicare & Medicaid Innovation (CMMI) is testing a new model, the Wasteful and Inappropriate Service Reduction (WISeR) Model, that uses technologies such as artificial intelligence to apply prior authorization for a limited set of services in six states in traditional Medicare.

In 2024, nearly 53 million prior authorization requests were submitted to Medicare Advantage insurers, with insurers denying 4.1 million or nearly 8% of those requests. While Medicare Advantage insurers are required to publish some data on timeliness and use of prior authorization, information is not currently available on how prior authorization requests, denials, and appeals vary by type of service, plan, or enrollee characteristics because CMS does not collect or report this information.

Methods

This analysis uses data from the Centers for Medicare & Medicaid Services (CMS) Medicare Advantage Enrollment, Benefit and Landscape files for the respective year.

In previous years, KFF had used the term Medicare Advantage to refer to Medicare Advantage plans as well as other types of private plans, including cost plans, PACE plans, and HCPPs. However, since 2022, KFF has excluded cost plans, PACE plans, HCPPs in addition to MMPs. We exclude these other plans as some may have different enrollment requirements than Medicare Advantage plans (e.g., may be available to beneficiaries with only Part B coverage) and in some cases, may be paid differently than Medicare Advantage plans. These exclusions are reflected in both current data as well as data displayed trending back to 2010.

In previous years, KFF’s analysis of average out-of-pocket limits in Medicare Advantage excluded HMOs that are Point-of-Service plans (HMO-POS), which allow out-of-network care for certain services, because they represented a relatively small share of HMO enrollment at the time (e.g., 10% in 2017). However, HMO-POS enrollment has grown substantially and now accounts for nearly half (46%) of HMO enrollment in Medicare Advantage. As a result, these plans are included in the current analysis to better reflect the experience of a substantial share of Medicare Advantage enrollees in HMOs. 

Meredith Freed, Jeannie Fuglesten Biniek, and Tricia Neuman are with KFF. Anthony Damico is an independent consultant.

State and Federal Reproductive Rights and Abortion Litigation Tracker

Last updated on

The Supreme Court’s Dobbs ruling, overturning Roe v. Wade, returned the decision to restrict or protect abortion to states. In many states, abortion providers and advocates are challenging state abortion bans contending that the bans violate the state constitution or another state law. Additionally, new questions have arisen regarding the intersection of federal and state authority when it impacts access to abortion and contraception.

This litigation tracker presents up-to-date information on the ongoing litigation in state and federal courts involving access to contraception and abortion. Use the buttons below to navigate between cases related to: Pregnancy and Work, Emergency Care, Family Planning, Privacy, Medication Abortion, Minors Access, and State Abortion Bans. 

Litigation Involving Reproductive Health and Rights in the Courts, as of June 4, 2026 (Table)

Elimination of Federal Diversity Initiatives: Updates and Current Status

Published: Jun 4, 2026

Editorial Note: This represents an update of an earlier analysis: Elimination of Federal Diversity Initiatives: Implications for Racial Health Equity

It has now been over a year since President Trump signed executive orders eliminating federal diversity, equity, inclusion, and accessibility (DEIA) programs and related initiatives, reshaping policies and priorities across federal agencies, research, and education. Additionally, the Trump administration’s workforce reshaping initiatives, including reductions in force, the Deferred Resignation Program, early retirement incentives and a hiring freeze have led to major declines in the federal workforce which have reduced resources available to support efforts to address disparities. While some efforts have been halted or modified by court rulings, the Trump administration has continued to take steps to remove staff, programs, funding, data collection, and other activities tied to concepts of diversity, equity, or disparities. Together, these actions signal a significant shift in federal approaches to addressing inequities and may have broad implications for efforts to monitor and address disparities in health and health care, as well as for the diversity of the workforce, including in health care.

This brief provides an update on the status of the administration’s actions to eliminate DEI-related initiatives one year later and examines emerging impacts and implications for racial health disparities.

Reductions to Federal Agency Staff and Programs

Federal workforce reductions have led to the elimination or scaling back of programs that support data collection, research, and interventions that have historically included a focus on addressing disparities or groups at higher risk of poor health outcomes. Since January 2025, the Trump administration’s workforce reshaping initiatives have led to significant federal workforce declines, with more than 420,000 people separating from the federal workforce as of May 14, 2026. Within the Department of Health and Human Services (HHS), staffing losses have exceeded 20,000 employees since January 2025. At the Centers for Disease Control and Prevention (CDC), an estimated 15% of the workforce, or about 3,000 employees, have departed, with some reports suggesting even larger reductions. With these reductions, many programs that support research and public health interventions appear to have been terminated. Although the full scope of program cutbacks is unclear due to the lack of a comprehensive public record, staffing reductions across agencies have left key programs understaffed or unable to maintain core functions, including efforts focused on addressing health disparities and advancing health equity. For example:

  • Reporting suggests that layoffs within the CDC’s Division of Reproductive Health in late March and early April reduced the workforce by about two-thirds, disrupting multiple programs focused on maternal and infant health, an area of health with longstanding disparities. These cuts included the elimination of the Pregnancy Risk Assessment Monitoring System (PRAMS), a primary source of data on health behaviors and outcomes before, during, and after pregnancy that has been widely used to study maternal mortality, including disparities, leaving its future uncertain.
  • At HHS, the Office of Climate Change and Health Equity was removed from the agency’s website, and its staff were reportedly placed on administrative leave. Staffing reductions within the CDC’s Division of Environmental Health Science and Practice also led to the elimination of the Environmental Public Health Tracking Program, which monitored data on issues such as cancer clusters and weather-related illnesses. Together, these changes may limit federal capacity to monitor and address environmental and climate-related health disparities, particularly among low-income communities and communities of color that are often disproportionately exposed to environmental hazards and extreme weather events.
  • The elimination of the National Survey on Drug Use and Health team halted a key federal data source on substance use and mental health trends, while CDC staff supporting the National Youth Tobacco Survey were also eliminated. Both surveys have historically been used to assess differences in behavioral health and tobacco use across populations and to help guide prevention and treatment efforts for groups disproportionately affected by these issues.

Elimination of Grants and Research Initiatives

Efforts to eliminate DEI across the federal government have reduced support for research related to disparities, including through funding cuts, changes to grant review and award processes, and the loss of leadership and infrastructure that support clinical trials and participation. Federal agencies have reduced or eliminated funding for research initiatives that included DEI-related goals or focused on specific populations, and grant review processes have been revised to flag or exclude applications containing DEI-related terms or focus areas including discrimination, diversity, equity, and race. For example, the recently formed and now defunct Department of Government Efficiency (DOGE) was tasked with auditing and canceling DEI-related federal research grants. Recent deposition hearings indicate that staff members used ChatGPT to propose cuts to roughly 1,400 grants under the National Endowment for the Humanities, including examples that were not related to DEI. In addition to the grants reviewed under DOGE, broader administrative actions led to the termination of more than 2,300 National Institute of Health (NIH) grants by late June 2025, with nearly 1,100 grants remaining terminated as of May 4, 2026. One study found that the National Institute of Minority Health and Health Disparities lost both the largest share of grants and the largest share of funding across all NIH institutes and centers. Research shows that grant terminations were more likely to impact American Indian or Alaskan Native (AIAN), Asian, Black, Hispanic or Native Hawaiian or Pacific Islander (NHPI) researchers compared to White researchers. These actions also affected 160 NIH-funded clinical trials, more than half of which (57%) included project terms related to racial and ethnic minority populations, such as Black, Latino, Indigenous, Asian, and other historically underserved groups. At the same time, the loss of research leadership and staff has disrupted the research pipeline and contributed to additional grant terminations. HIV research has been particularly impacted. Reporting indicates that at least 145 NIH-funded HIV research grants, totaling nearly $450 million, were terminated in early 2025, including studies focused on HIV prevention, access to pre-exposure prophylaxis (PrEP), and populations disproportionately affected by HIV, which include groups of color. A newly proposed rule issued by the Office of Management and Budget (OMB) would revise federal grant requirements by increasing political review of awards, requiring alignment with presidential priorities, and creating new mechanisms for modifying or terminating existing funding, with an emphasis on prohibiting federal support for programs, funding preferences, or award requirements that advance DEI efforts. If finalized, the proposal could expand federal grantmaking agencies’ authority to review and terminate awards deemed inconsistent with the administration’s interpretation of civil rights laws and federal priorities, which may affect research and programs designed to address racial, ethnic, gender, and other disparities.

Elimination of Public Information and Resources

Efforts to eliminate DEI across the federal government have also reduced the availability and integrity of public information and data, including through the suspension of national surveys, the removal of DEI-related data elements, and changes to climate data and evidence. As previously noted, several national surveys were suspended, delayed, or scaled back, limiting the availability of timely population-level data. These include the Pregnancy Risk Assessment Monitoring System (PRAMS) and the National Survey on Drug Use and Health (NSDUH). There are also reports that the National Intimate Partner and Sexual Violence Survey and the National Youth Tobacco Survey (NYTS) may have also been eliminated, however, their official status remains unclear. These surveys have historically provided data used to identify disparities and inform public health policy and interventions. In addition, key surveys and data systems removed or modified questions and data elements related to race, ethnicity, gender identity, sexual orientation, and other demographic measures, reducing the ability to measure differences across populations. Some publicly available datasets were also modified or taken offline, limiting access for researchers, policymakers, and the public, while some federal websites removed or archived reports, dashboards, and tools that previously highlighted disparities or equity-focused analyses. Climate-related data and resources were similarly removed, reframed and misrepresented, or made more difficult to access. For example, the Trump administration determined that official government websites would no longer host national climate assessments, including the most recent assessment released in 2023, which found that climate change disproportionately affects the health, livelihoods, and security of people of color, with Indigenous populations at particular risk. In addition, concerns have been raised about the scientific rigor and peer review process of the Climate Working Group report recently released under the administration.

Education and Workforce

Amid the executive orders, threats by the Trump administration to withdraw funding from schools with DEI programs, and charges from the Equal Employment Opportunity Commission (EEOC) for discrimination against White people, concerns have grown about the potential impacts on diversity among students and the future workforce. Early last year, the Department of Education issued guidance, commonly referred to as the “Dear Colleague” letter, directing schools and other entities receiving federal education funding to stop using what it described as “racial preferences” in admissions, programming, and other activities. This followed the Supreme Court’s 2023 decision ending race-conscious admissions, which led to a shift in enrollment patterns across higher education institutions, with declines in the share of students of color at highly selective universities. Research also suggests that the ruling has already contributed to declines in the number of Black, Hispanic, and AIAN students entering medical school, raising concerns about the future diversity of the physician workforce. These trends may further exacerbate existing disparities in representation. KFF analysis shows that Hispanic, Black, AIAN, and NHPI people remain underrepresented among physicians relative to their share of the population, with the largest gap among Hispanic people, who comprise 20% of the U.S. population but only 7% of the physician workforce. More broadly, the EEOC has increasingly emphasized enforcement related to alleged discrimination against White workers, which some argue could discourage workplace diversity initiatives. In addition, broader immigration restrictions and enforcement actions may further affect workforce diversity, particularly in health care and research fields that rely heavily on immigrant workers and internationally trained professionals.

In some cases, implementation of DEI-related cuts has been temporarily halted or mitigated by lawsuits and congressional action. As of April 2026, Congress has rejected many of the Trump administration’s proposed reductions to federal health programs through the FY 2026 appropriations process. For example:

  • The legislation provided HHS with approximately $116 billion in funding, about $33 billion more than proposed in President Trump’s FY 2026 budget request, including increases for several public health and behavioral health programs, such as reproductive and community health programs, that support populations disproportionately affected by poor health outcomes, including people of color and lower-income groups.
  • It also maintained the Substance Abuse and Mental Health Services Administration (SAMHSA) as an independent agency and increased SAMHSA funding by $65 million to approximately $7.4 billion, despite earlier proposals to reduce funding by roughly $1 billion. The legislation also included guardrails intended to ensure that SAMHSA funds are distributed as appropriated, preserving support for mental health and substance use programs that often serve low-income and underserved communities.
  • Similarly, Congress maintained CDC funding at approximately $9.2 billion, rather than the nearly 50% reduction proposed in the administration’s FY 2026 budget request, and directed HHS to maintain staffing levels needed to carry out CDC programs, although the agency’s Social Determinants of Health program was eliminated.
  • The legislation also preserved funding for reproductive health programs, including Title X and the Teen Pregnancy Prevention Program, and increased investments in maternal health programs across HRSA, CDC, and NIH, which have historically focused on addressing longstanding racial disparities in maternal and infant health outcomes.
  • In addition, while the administration proposed substantial reductions to NIH funding, Congress ultimately approved increased funding for the agency, and several court challenges temporarily halted some funding cuts and grant terminations, which had a noted focus on DEI-related research.

Separate legal challenges have also limited implementation of some workforce and education-related actions. Federal courts and Congress blocked or delayed aspects of the Trump administration’s workforce reduction efforts, including rulings against certain reductions in force and layoffs implemented during agency restructuring efforts. Courts also blocked implementation of the Department of Education’s “Dear Colleague” guidance related to race-conscious practices in schools, and the Department later withdrew the guidance following legal challenges and court rulings. These actions suggest that the scope and long-term effects of the administration’s policies may continue to evolve as litigation and congressional oversight proceed.

Global COVID-19 Tracker

Published: Jun 3, 2026

Editorial Note: The Policy Actions tracker will no longer be updated as the data source has ceased tracking government responses to COVID-19. For more information, please visit the Oxford Covid-19 Government Response Tracker.

Cases and Deaths

This tracker provides the cumulative number of confirmed COVID-19 cases and deaths, as well as the rate of daily COVID-19 cases and deaths by country, income, region, and globally. It will be updated weekly, as new data are released. As of March 7, 2023, all data on COVID-19 cases and deaths are drawn from the World Health Organization’s (WHO) Coronavirus (COVID-19) Dashboard. Prior to March 7, 2023, this tracker relied on data provided by the Johns Hopkins University (JHU) Coronavirus Resource Center’s COVID-19 Map, which ended on March 10, 2023. Please see the Methods tab for more detailed information on data sources and notes. To prevent slow load times, the tracker only contains data from the last 200 days. However, the full data set can be downloaded from our GitHub page. While the tracker provides the most recent data available, there is a two-week lag in the data reporting.

Note: The data in this tool were corrected on March 18, 2024, to clarify that they represent new cases and deaths over a full week rather than the average per day over a seven-day period.

Policy Actions

This tracker contains information on policy measures currently in place to address the COVID-19 pandemic. Policy categories currently being tracked include social distancing & closure measures, economic measures, and health systems measures. Policies are tracked at the country-, income-, and region-level. Please see the Methods tab for more detailed information on data sources and notes.

Social Distancing and Closure Measures

As countries continue to implement policies to prevent the transmission of SARS-CoV-2, the virus that causes COVID-19, these tables and charts show which social distancing and closure measures are currently in place by country.

Global COVID-19 Policy Actions

Economic Measures

The COVID-19 pandemic has placed an unprecedented strain on country economies. These tables and charts show which economic-related measures, namely income support and debt relief, are currently in place by country.

Global COVID-19 Policy Actions

Health Systems Measures

The COVID-19 pandemic continues to strain and disrupt global health systems. These tables and charts show which health systems measures are currently in place by country.

Global COVID-19 Policy Actions

Methods

Cases and Deaths

SOURCES

As of March 7, 2023, all data on COVID-19 cases and deaths are drawn from the World Health Organization’s (WHO) Coronavirus (COVID-19) Dashboard. Prior to March 7, 2023, this tracker relied on data provided by the Johns Hopkins University (JHU) Coronavirus Resource Center’s COVID-19 Map, which ends on March 10, 2023. Population data are obtained from the United Nations World Population Prospects using 2021 total population estimates. Income-level classifications are obtained from the latest World Bank Country and Lending Groups. Regional classifications are obtained from the World Health Organization.

Policy Actions

NOTES

Policy actions data include the measure that was in place for each indicator at the country-level as of the end of 2022. Policy actions data will no longer be updated as the data source has ceased tracking government responses to COVID-19. For more information, please visit the Oxford Covid-19 Government Response Tracker.

Social Distancing and Closure Measures

Under 'Stay At Home Requirements', exceptions for leaving the house may include anything from being able to leave for daily exercise, grocery shopping, and essential trips, to only being allowed to leave once a week, or one person may leave at a time, etc. Under 'Workplace Closing', partial closing includes instances in which a country recommends closing the workplace (or working from home); businesses are open but with significant COVID-19-related operational adjustments; or when workplaces require closing for only some, but not all, sectors or categories of workers. Under 'School Closing', partial closing includes instances in which a country has recommended school closures; all schools are open but with significant COVID-19-related operational adjustments; or some schools, but not all, are closed; full closing includes schools that are in session but operating virtually. Under 'Restrictions On Gatherings', partial restrictions include restrictions on gatherings of more than 10 people; full restrictions include restrictions on gatherings of 10 people or less. Under 'International Travel Controls', partial restrictions include screening and quarantine requirements for those entering the country. Values for ‘Cancel Public Events’ were not recodified.

Economic Measures

Under 'Income Support', narrow support includes instances in which a country's government is replacing less than 50% of lost salary (or if a flat sum, it is less than 50% median salary); broad support includes instances in which a country's government is replacing 50% or more of lost salary (or if a flat sum, it is greater than 50% median salary). Under 'Debt/Contract Relief', narrow support includes instances in which a country's government is providing narrow relief, such as relief specific to one kind of contract.

Health Systems Measures

Under 'Vaccine Eligibility', partial availability includes availability for some or all of the following groups: key workers, non-elderly clinically vulnerable groups, and elderly groups, or for select broad groups/ages. Under 'Facial Coverings', recommend/partial requirement includes instances in which a country's government recommends wearing facial coverings, requires facial coverings in some situations, and requires facial coverings when social distancing is not possible. 

SOURCES

Data on and descriptions of government measures related to COVID-19 provided by the Oxford Covid-19 Government Response Tracker (OxCGRT). For more detailed information on their data collection and methodology, please see their codebook and interpretation guide.

U.S. International Family Planning & Reproductive Health: Requirements in Law and Policy

Published: Jun 2, 2026

This fact sheet summarizes the major statutory requirements and policies pertaining to U.S. global family planning/reproductive health (FP/RH) efforts over time and identifies those currently in effect. These laws and policies collectively serve to direct how U.S. funds are spent, to where and which organizations funds are provided, and generally shape the implementation and define the scope of U.S. global FP/RH activities. It includes U.S. laws and annual requirements enacted by Congress through appropriations bills (statutory provisions) as well as executive branch policies and guidance specific to FP/RH (policy provisions). Each category lists provisions in chronological order.

Since early 2025, the Trump administration has frozen or eliminated funding for most FP/RH activities, although Congress has continued to appropriate funding for this work. See the KFF fact sheet of the status of FP/RH efforts.

Table 1

Statutory Requirements and Policies for U.S. Global FP/RH Efforts (as of FY 2026)

Provision (Year First Instituted)Issue(s)Applies toStatus
STATUTORY
Helms Amendment (1973)
Prohibits the use of foreign assistance to pay for the performance of abortion as a method of family planning or to motivate or coerce any person to practice abortion. Note: meaning of “motivate” clarified by Leahy Amendment (1994); see below.
Abortion

All foreign assistance authorized under the Foreign Assistance Act of 1961(FAA); all funds under State-Foreign Operations Appropriations (State-Foreign Ops.)Yes, in effect.
Permanent law, amendment to the FAA.
Also included in annual State-Foreign Ops.
Involuntary Sterilization Amendment (1978)
Prohibits the use of funds to pay for involuntary sterilizations as a method of family planning or to coerce or provide a financial incentive to anyone to undergo sterilization.
Voluntarism/
Informed Choice & Consent; Incentives; Involuntary Sterilization
All foreign assistance authorized by the FAA of 1961; all foreign assistance funds under State-Foreign Ops.Yes, in effect.
Permanent law, amendment to the FAA.
Also included in annual State-Foreign Ops.
Peace Corps Provision (1978)
Prohibits Peace Corps funding from paying for an abortion for a Peace Corps volunteer or trainee; beginning in FY 2015, allows for payment in cases where the life of the woman is endangered by pregnancy or in cases of rape or incest.1
AbortionAll Peace Corps fundingYes, in effect.
Included under the “Peace Corps” heading of the State-Foreign Ops.
Biden Amendment (1981)
States that funds may not be used for biomedical research related to methods of or the performance of abortion or involuntary sterilization as a means of family planning.
Abortion; Involuntary SterilizationAll foreign assistance authorized by the FAA of 1961; all foreign assistance funds under State-Foreign Ops.Yes, in effect.
Permanent law, amendment to the FAA.
Also included in annual State-Foreign Ops.
Siljander Amendment (1981)
Prohibits the use of funds to lobby for or against abortion. When initially introduced, the amendment prohibited only lobbying for abortion, but in subsequent years Congress modified the language to include lobbying against abortion as well.
AbortionAll funds under State-Foreign Ops.
 
Yes, in effect.
Included in annual State-Foreign Ops.
DeConcini Amendment (1985)
Requires that U.S. funds be provided to organizations that offer, either directly or through referral to, information about access to a broad range of family planning methods and services. See Livingston-Obey Amendment (1986) below.
Voluntarism/
Informed Choice
All FP funds under State-Foreign Ops.Yes, in effect.
Included in annual State-Foreign Ops.
Kemp-Kasten Amendment (1985)
Prohibits funding any organization or program, as determined by the President, that supports or participates in the management of a program of coercive abortion or involuntary sterilization.
UNFPA Funding; Abortion; Voluntarism/
Informed Choice & Consent; Involuntary Sterilization
All funds under State-Foreign Ops. as well as unobligated balances from prior appropriations actsYes, in effect.
Included in annual State-Foreign Ops.2 each year; Presidents determined that it applied to UNFPA in FY85-FY92, FY02-FY08, FY17-FY20, FY25.
Involuntary Sterilization and Abortion Provision (1985)
Specifies that U.S. foreign assistance funding could be withheld from a country or organization if the president certifies that the use of such funds would violate key provisions of the FAA of 1961 related to abortion or involuntary sterilization (namely the Helms, Biden, and Involuntary Sterilization Amendments).
Voluntarism/
Informed Choice & Consent; Incentives; Abortion; Involuntary Sterilization
All foreign assistance funds under State-Foreign Ops.
 
Yes, in effect.
Included in annual State-Foreign Ops.
Livingston-Obey Amendment (1986)
Prohibits discrimination by the U.S. government against organizations that offer only “natural family planning” for religious or conscientious reasons when the U.S. government is awarding related grants. All such applicants must comply with the requirements of the DeConcini Amendment (1985).
Voluntarism/
Informed Choice
All FP funds under State-Foreign Ops.
 
Yes, in effect.
Included in annual State-Foreign Ops.
Leahy Amendment (1994)
Clarifies Helms Amendment (1973) language that uses the term “motivate” by stating that “motivate” shall not be construed to prohibit, where legal, the provision of information or counseling about all pregnancy options.
Abortion; Voluntarism/
Informed Choice
All authorizing and appropriating legislation related to the State Dept., foreign operations, and related programsYes, in effect.
Included in annual State-Foreign Ops.
Timing of Release of UNFPA Contribution Funds (1994)
Not more than half of funding designated for the U.S. contribution to UNFPA is to be released before a particular date (varies by fiscal year).
UNFPA FundingFunds made available to UNFPANo, not in effect.
Sometimes included in annual State-Foreign Ops.
Conditions on Availability of UNFPA Funds (UNFPA Segregated U.S. Contribution Account; UNFPA Does Not Fund Abortions; Prohibition on the Use of U.S. Funds in China by UNFPA) (1994)
States that funds may not be made available to UNFPA unless:
– UNFPA keeps the U.S. contribution to the agency in a separate account, not to be commingled with other funds, and
– UNFPA does not fund abortions (note: language used beginning in FY00).
It also prohibits UNFPA from using any funds from the U.S. contribution in their programming in China.
UNFPA Funding; AbortionFunds made available to UNFPAYes, in effect.
Included in annual State-Foreign Ops.
UNFPA Dollar-for-Dollar Withholding of Amount UNFPA Plans to Spend in China During Fiscal Year (1994)
Reduces the U.S. contribution to UNFPA by one dollar for every dollar that UNFPA spends on its programming in China.
UNFPA FundingFunds made available to UNFPAYes, in effect.
Typically included in annual State-Foreign Ops.
Tiahrt Amendment (1998)
Prohibits the use of targets/quotas and financial incentives3 in family planning projects and requires projects to provide comprehensible information on family planning methods. Protects people who choose not to use family planning from being denied rights or benefits and requires experimental family planning methods be provided only in the context of a scientific study. Intended to “promote voluntarism and prevent coercion in family planning programs,” it specifically prohibits three types of targets: total number of births, number of family planning acceptors, and acceptors of a particular method of family planning.4
Voluntarism/
Informed Choice & Consent; Incentives and Disincentives
All FP funds under State-Foreign Ops.
 
Yes, in effect.
Included in annual State-Foreign Ops.
Reallocation of Funds Not Made Available to UNFPA (2004)
Provides for funds not made available to UNFPA to be reallocated to USAID’s family planning, maternal, and reproductive health activities/services (and, in some years, assistance to vulnerable children and victims of trafficking in persons).5
UNFPA FundingFunds appropriated for UNFPAYes, in effect.
Typically included in annual State-Foreign Ops.
Medically Accurate Information on Condoms (2005)
Ensures that information provided by U.S.-supported programs about the use of condoms is medically accurate information and includes the public health benefits and failure rates of such use.
CondomsAll funds under State-Foreign Ops.
 
Yes, in effect.
Typically included in annual State-Foreign Ops.
POLICY
USAID Policy Paper on Population Assistance (1982)
Outlines the longstanding USAID guidelines surrounding its fundamental programmatic principles of voluntarism and informed choice and consent.6
Voluntarism/
Informed Choice & Consent
All FP/RH assistance provided by USAIDNo longer in effect due to USAID’s dissolution.
Policy Determination 3 (PD-3): USAID Policy Guidelines on Voluntary Sterilization (1982)
Describes guidelines for informed consent and voluntarism specifically for voluntary sterilization services, including provisions to ensure ready access to other contraceptive methods and prohibiting incentive payments that might induce a person to select voluntary sterilization over another method.
Voluntarism/
Informed Choice & Consent; Voluntary Sterilization
All FP/RH assistance provided by USAIDNo longer in effect due to USAID’s dissolution.
Mexico City Policy (“Global Gag Rule”, 1984)7
As a condition for receiving U.S. family planning assistance, other global health assistance, and, now, also other U.S. foreign assistance (see “Applies to”), requires foreign NGOs and, now, U.S. NGOs, international organizations, foreign governments, and parastatals to certify that they will not provide or promote abortion as a method of family planning using funds from any source.
 
The latest iteration of the policy under the second Trump administration iss called Protecting Life in Foreign Assistance and falls under the broader umbrella of the “Protecting Human Flourishing in Foreign Assistance Policy” (PHFFA Policy), which also requires certain organizations to certify they will not provide or promote “gender ideology” and “discriminatory equity ideology,” among other activities.. Included in the U.S. Department of State Standard Terms and Conditions (see entry below), when applicable.
 
 
Abortion1984- 2003: when in effect, was applied to FP assistance at USAID only. In 2003, expanded to include all FP assistance at USAID and the State Dept., exempting multilateral organizations and HIV/AIDS funding under PEPFAR. 2009-17: Not in effect.
2017-2021: applied to all global health assistance.
2021-2025t: Not in effect.
2025-present: applied to most foreign assistance at the State Department.
Yes, in effect.8
USAID Post-Abortion Care Policy (2001)
Clarifies that post-abortion care – the treatment of injuries or illnesses caused by legal or illegal abortion – is permitted under the Helms Amendment and that any restrictions under the Mexico City Policy, when in force, do not limit organizations from treating injuries or illnesses caused by legal or illegal abortions (i.e., providing post-abortion care). Notes USAID does not finance manual vacuum aspiration equipment purchase/distribution for any purpose.
Post-Abortion CareAll FP/RH assistance provided by USAIDNo longer in effect due to USAID’s dissolution; however, the current Mexico City Policy does not restrict post-abortion care.
Guidance on the Definition and Use of the Global Health Programs Account: Section on Allowable Uses of Funds for Family Planning/Reproductive Health (2014)
Outlines allowable uses of funds for FP/RH by providing a description of activities allowed and examples of activities not allowed, addressing not only FP/RH activities but also family planning activities’ integration with other global health and multisectoral activities.
FP/RH Activities; FP/RH System Strengthening Activities; Integrated FP ActivitiesAll FP/RH assistance provided by USAIDNo longer in effect due to USAID’s dissolution.
USAID Standard Provisions for Nongovernmental Organizations (U.S. and Non-U.S.)
Outline requirements that must be attached to assistance agreements, including language implementing FP/RH legal and policy requirements described above (e.g., the Helms and Leahy Amendments.)9
 
Voluntarism/
Informed Choice & Consent; Incentives; Abortion; Involuntary Sterilization; Condoms; FP/RH Activities
USAID assistance agreementsYes, in effect in ongoing USAID award agreements with NGOs.
U.S. Department of State Standard Terms and Conditions (revised 10/01/2025)
Outline requirements that must be attached to assistance agreements, including language implementing FP/RH legal and policy requirements described above (e.g., the Helms and Siljander Amendments.)10
 
Includes the Promoting Human Flourishing in Foreign Assistance Policy (PHFFA Policy) – in effect as of Feb. 26, 2026 – for foreign NGOs, U.S. NGOs, international organizations, and, when applicable, foreign governments and parastatals.
Voluntarism/
Informed Choice & Consent; Incentives; Abortion; Involuntary Sterilization; FP/RH Activities
State Department assistance agreementsYes, in effect.
  1. As noted in CRS, Abortion and Family Planning-Related Provisions in U.S. Foreign Assistance Legislation and Policy, July 2022: “No restrictions exist on funding for the medical evacuation of Peace Corps volunteers who decide to have an abortion. Under existing policy, the Peace Corps covers the cost of evacuation to a location where ‘medically adequate facilities’ for obtaining an abortion are available and where abortions are legally permissible.” ↩︎
  2. In most recent years, a provision is included requiring that any Kemp-Kasten determination that is made must be accompanied by the evidence and criteria used to make the determination. ↩︎
  3. USAID defines a target/quota as “a predetermined figure that a service provider or referral agent is assigned or required to affect or achieve” for the purposes of the Tiahrt Amendment. It states that “the key to interpreting ‘incentives’ is to see whether they are provided in exchange for accepting a method (in the case of a client) or linked to achievement of a predetermined target or quota (in the case of program personnel).” USAID Global Health eLearning Center, “FP Legislative & Policy Requirements (Updated),” online course, February 2009, authored by Debbie Gueye, MSI. ↩︎
  4. USAID Global Health eLearning Center, “FP Legislative & Policy Requirements (Updated),” online course, Feb. 2009, authored by Debbie Gueye, MSI. ↩︎
  5. Although such reallocation began in practice in FY 2002, it was first authorized by Congress in legislation beginning in FY 2004 with reference to FY 2002 and FY 2003 funds. ↩︎
  6. Informed Choice: Effective access to information on family planning choices and to the counseling, services, and supplies needed to help individuals choose to obtain or decline services; to seek, obtain, and follow up on a referral; or simply to consider the matter further. Voluntarism: Decision to use a specific method of family planning or to use any method of family planning is based upon the exercise of free choice and is not obtained by any special inducements or any element of force, fraud, deceit, duress or other forms of coercion or misrepresentation. USAID Global Health eLearning Center, “FP Legislative & Policy Requirements (Updated),” online course, Feb. 2009, authored by Debbie Gueye, MSI. ↩︎
  7. This policy was first instituted via presidential memorandum in 1984 by President Reagan. In 1993, it was rescinded by President Clinton, although it was briefly applied legislatively in 1999 (see “Status” column). In 2001, it was reinstated by President Bush, who expanded its applicability in 2003 to include family planning funds at the State Department (see “Applies to” column) with some exemptions. In 2009, it was rescinded by President Obama. In 2017, it was reinstated by President Trump, who expanded its applicability to include the vast majority of global health assistance furnished by all departments and agencies. In 2021, it was rescinded by President Biden. ↩︎
  8. Note that, with one exception, has been applied via Executive action. The exception was in FY 2000, when President Clinton agreed to a one-year legislative codification with a partial waiver of restrictions as part of a broader arrangement to pay the U.S. debt to the United Nations. See P.L. 106-113, Sec. 599D, and PAI, Global Gag Rule Timeline, July 12, 2011. ↩︎
  9. “M16. VOLUNTARY POPULATION PLANNING ACTIVITIES – MANDATORY REQUIREMENTS (MAY 2006) …
    b. Prohibition on Abortion-Related Activities:
    (1) No funds made available under this award will be used to finance, support, or be attributed to the following activities: (i) procurement or distribution of equipment intended to be used for the purpose of inducing abortions as a method of family planning; (ii) special fees or incentives to any person to coerce or motivate them to have abortions; (iii) payments to persons to perform abortions or to solicit persons to undergo abortions; (iv) information, education, training, or communication programs that seek to promote abortion as a method of family planning; and (v) lobbying for or against abortion. The term “motivate,” as it relates to family planning assistance, must not be construed to prohibit the provision, consistent with local law, of information or counseling about all pregnancy options.
    (2)No funds made available under this award will be used to pay for any biomedical research which relates, in whole or in part, to methods of, or the performance of, abortions or involuntary sterilizations as a means of family planning. Epidemiologic or descriptive research to assess the incidence, extent, or consequences of abortions is not precluded.” ↩︎
  10. For example, one provision related to abortion included in the State Department Standard Terms and Conditions is:
    “AA. Prohibition on use of funds for performance or research respecting abortions or involuntary sterilization
    The recipient agrees that in accordance with 22 USC 2151b(f) Population planning and health programs no foreign assistance funds provided by the award shall be used to:
    (1) pay for the performance of abortions as a method of family planning or to motivate or coerce any person to practice abortions (Helms Amendment, 1973).
    (2) pay for the performance of involuntary sterilizations as a method of family planning or to coerce or provide any financial incentive to any person to undergo sterilizations (Involuntary Sterilization Amendment, 1978).
    (3) pay for any biomedical research which relates, in whole or in part, to methods of, or the performance of, abortions or involuntary sterilization as a means of family planning (Biden Amendment, 1981).
    Furthermore, the recipient agrees in accordance with the Department’s annual appropriation bill, that no funds provided by the award may be used to lobby for or against abortion (Siljander Amendment, 1981).” ↩︎

The Business of Health with Chip Kahn

Is AI Better for Patients?

June 2, 2026

Video

Audio

About this Episode


Episode 6, AI Series: Is AI Better for patients? What is changing on the ground? Chip talks with Dr. Patrick Conway, Chief Executive Officer of Optum, a health services and technology business under parent company, UnitedHealth Group. They discuss how to ensure the health care industry’s use of AI serves patients first, particularly when the same company bears financial risk and builds the AI that decides who gets care. They also discuss whether use of AI can make value-based care the dominant payment framework, after two decades of policymaker support for the model.

The Host


Headshot photo of Chip Kahn wearing a navy blue suit with a red tie, red pendant on lapel, and glasses.

Sr. Visiting Fellow

Charles N. Kahn III is a senior visiting fellow at KFF. He is also a visiting senior fellow at the American Enterprise Institute and a nonresident senior scholar at the University of Southern California’s Schaeffer Center for Health Policy & Economics. He serves as co-chair of the international Future of Health collaborative.

Guest


Chief Executive Officer of Optum

Dr. Patrick Conway is the Chief Executive Officer of Optum. He served previously as CEOs of Optum Health, Optum RX, and Care Solutions at Optum. Before joining Optum, Dr. Conway was president and chief executive officer of Blue Cross and Blue Shield of North Carolina. He also previously served as Deputy Administrator for Innovation and Quality at the Centers for Medicare and Medicaid Services and as director of the Center for Medicare and Medicaid Innovation and the agency’s Chief Medical Officer. Before joining CMS, he oversaw clinical operations and quality improvement at Cincinnati Children’s Hospital Medical Center.

Transcript


AI Usage Disclosure: This transcript was created with assistance from AI tools. It was reviewed and edited by KFF Staff.

Chip Kahn: Now we move from the health system actually deploying AI inside its hospitals to the health care company doing it across the full stack. One organization bearing the financial risk for care, delivering that care, building the AI that informs coverage decisions, and running the analytics that tie it all together. My guest today is Dr. Patrick Conway, CEO of Optum. No one else in American health care has occupied all four of Patrick’s positions. Regulator at CMS; payer at Blue Cross, North Carolina; pharmacy benefit operator at Optum Rx; and now the head of Optum itself. He designed the value-based payment models. Now he runs the platform meant to deliver them at scale. UnitedHealth is spending at least $1.5 billion on AI. But Patrick will walk us through what is changing on the ground: prior authorizations cleared in seconds; claims are adjudicated while the patient is still in the exam room; and, a true outcomes orientation. At the heart of this conversation, two questions sit alongside the proof points. First, when the same company bears financial risk and builds the AI that decides who gets care, how do you ensure the technology serves the patient first? And second, after two decades of policymaker support for value-based care, particularly in Medicare, can integration and AI finally make it the dominant payment framework? Below all of this sits the test each episode in this series returns to: is the patient better off? Not in the aggregate, but when receiving care in the examination room or the hospital bed. Let’s get started. Patrick Conway, welcome to KFF’s The Business of Health with Chip Kahn.

Patrick Conway: It’s great to be here, Chip.

Chip Kahn: This is great. Such a pleasure. We’ve worked together over the years and known each other for a long, long time and it’s just great to have you here. Before we get into AI and healthcare, although I think this question may touch on that, you were one of the key people that is responsible for designing value-based care and value-based payment models at CMS. Later, you ran the North Carolina Blue Cross plan and now you run the largest integrated health services company within the largest private health insurer in the world. What have you seen from the inside at Optum that you could not see from your earlier vantage points?

Patrick Conway: So, a few thoughts, Chip, and appreciate you having me in the discussion. At a high level, and then I’ll come back to the different stages. You need predictability, you need incentives aligned with total cost of care, quality and experience. And you need the ability to innovate and drive care at the front line on behalf of patients. So then let me take you through the stages that you alluded to and reflect on them. I started in CMS, I was in government twice, the second time through 2011, and then ran the CMS Innovation Center after serving as Chief Medical Officer. As you remember, we had almost zero percent of payments in value-based care models tied to total cost of care quality experience. At that time, you’re launching the ACO program, you’re launching these new CMMI models. The question was, would people participate? Participation went up, we got to over 30% participation by the end of 2016, ahead of schedule. It was a target President Obama had set. Then you’ve seen phases in the public sector, okay, now let’s move to two-sided risk. Now let’s do mandatory models when necessary. Now let’s figure out what’s working and expand those models, and you know, iterate on models. So that’s sort of the public sector side. You know, as I moved into the private sector, at Blue Cross, North Carolina, we actually went from almost 0% of payments in those kinds of models to 70 plus percent in about 18 months. And it was built on some of the lessons—I didn’t plan this out—but from the Innovation Center of partnering, of sharing data, of predictability, of saying, you know, fee for service is not what we want to do. We want to move to this value-based care model that’s integrated. And then at Optum, as you allude to, I’m sure we’ll talk more about this, you know, we have the ability of having the people, resources, and technology to deliver value-based care at scale. So, we serve millions of people across the country. Hospitalizations go down, most models in the high teens, less hospitalizations, unplanned ER visits go down, total cost of care improves significantly, quality 4-star plus in the vast majority of models and NPS or patient experience usually in the 80s to 90s so very high in these models. And I know you like data and stories I’ll share. You know, you see a 91-year-old in her home—this is a visit I went on—used to be hospitalized the year before, 10 plus times. Now has a primary care doc, a nurse care team, people have helped her with food delivery, helped modify her home, addressing her physical, mental, social, and financial needs. Now been hospitalized 0 times and hugs the doctor when she walks in the door. Not me, I am a doctor, but it was a real doctor with me, from our team. And that’s what it’s about, right? That’s better care for patients. So, when we get it right, it delivers exactly what we want for our own loved ones in the health system.

Chip Kahn: So, I think you just described the secret sauce. But how do you scale that, and how does this kind of pay-for-performance, value-based care become the prominent dominant payment scheme?

Patrick Conway: It’s interesting, this week I was in D.C. and the West coast so saw much of the country, and Massachusetts. Dr. Oz talked about this on a panel about, you know, he wants value-based care to be the model in the U.S. He wants 100% of patients and people in accountable care relationships. By the way, this is a bipartisan idea. It’s been across administrations. The good news is I think we’re getting much closer. So, you have over 50% of patients nationally in these models. It’s heading towards 50% and sort of two-sided risk models. So, I think we’re moving. You know then I think how do you get there? It’s going to be public private collaboration. It’s going to be continuing getting the incentives and the various payment incentives right. But that’s not all you need. You also need the technology, the clinical practices, the workforce, which you know is often organizations of a certain scale and capability to deliver those services. We may talk about rural today. That’s something we think about a lot now. How do we scale these models to rural settings as well so that we at Optum are serving the whole population. And you know, it’s not going to be one organization including Optum. It’s going to be a set of public private sector actors that are all moving in the same direction.

Chip Kahn: I have a feeling technology is going to be part of this. So, let’s now go to AI and UnitedHealth Group is spending a great deal on AI. You’ve got hundreds and hundreds of use cases that I understand you’re focused on and trying to operationalize. How is that investment going and what is the evidence that it will be transformative? How are you going to make it transformative?

Patrick Conway: Look, we think AI is going to completely transform our business. You know we talk about if we don’t transform and disrupt ourselves, somebody else will. So then let me describe; we’re now scaling use cases. So, I think we’re at the sort of next phase of the journey. I’ll put them in categories. You’ve got what I’ll call administrative type functions. So, think, call, claim other things. How do you make the system work better? We take about 300 million calls in UnitedHealth Group. We think that could be 150 million or less in the next 12 to 18 months. So many of these investments we think will get an in-year return and then a long-term return. Let’s go to another area. Products and services. So, Optum Real, which is real time settlement of claims. The payer agrees what they’re going to pay, based on what we’ve digitized and used AI on, the benefits, the provider, we’ve pulled the clinical data and made sure we’ve met all the criteria. I think 99 plus percent approval at the point of care. And the patient knows what their copay is and can settle that right away. It’s how the system should work. So, we’re scaling that across payers and providers. You know, also things like ambient listening combined with AI technology. So, the clinician could just practice and then it’ll automatically or autonomously code for them so they’re not spending as much time with documentation. One of the stats I loved: some of this work has saved over 2 million minutes of clinician documentation time just in our system. So let them get back to patient care. I know, you know, I’m still a practical physician. I use the EHR on weekends in the hospital. and you want to focus on the patients, right? Last clinical, I just, I know I’ll try not to be too long winded, but the clinical example, I’ll give that I think we’re in the early stages of. My first week as an attending. I finished residency at Boston Children’s. I go to Children’s Hospital Philadelphia. I get a patient who had been referred all around America, people trying to figure out the diagnosis, about a thousand-page chart. I get to page 487 and I’m like, oh my gosh, this kid has a rare metabolic disorder. Which ended up being the case. That took hours of reading. In an era of AI, that should be queued up to me or any other clinician anywhere in the country. You know, the nurse practitioner in rural America. So instead of two years, that child’s diagnosis may be done in minutes. That’s the kind of potential impact the technology could have.

Chip Kahn: On the paperwork side, in a sense, the sort of rift between providers and payers. What can it do with prior authorization? I know that you’re applying it there and you’re trying to cut back on the number of times that prior auth is required. What do you see the developments there that are going to bridge some of these gaps we have right now?

Patrick Conway: First, as you alluded to, we are both across UnitedHealthcare and Optum, eliminating prior authorization whenever possible. So, decreasing the prior authorization  burden, if you will. And then we’re standardizing and using electronic tools. So let me give you a couple examples. At Optum Rx, our pharmacy business, we once again connected all those benefits using the pharmacy rails into providers. The median prior authorization team had been eight hours, sometimes days or weeks for medicine, we got it down to less than 30 seconds. So, it’s auto approved, by the way, if the clinician, the prescriber, you need one more piece of information, which is usually why prior authorization gets caught up because you don’t have all the documentation. It tells them right then so they can enter the information and get it approved. So that’s how a system should work. We’re also doing that for medical as well through Optum Insight. So, you get approval rates that are very high immediately and they’re in the clinical workflow, which you know, that was prior auth’s original intent, right? Get the right treatment to the right patient. That we can all stand behind. But we have to have a system that makes it fast, standardized, and seamless for the patient and the clinician.

Chip Kahn: In terms of your 91-year-old patient example, how broad based is that in terms of having that integrated platform, at least in your system right now? I mean, are most of the patients getting that total coordination integration or is it just being experimented with? Where are you with that?

Patrick Conway: Yeah, so in our Optum Health platform, integrated value-based care, we serve about 20 million patients today. It’s, by the way, across about 100 payers. It’s national, so it’s large scope. You know, as you alluded to, there’s obviously more Americans in our health care system so there’s more room for growth or expanding the model. But our integrated value-based care platform is impacting millions and millions of people all across the country. And to be clear, Medicare Advantage and duals are the most in that platform. But we also serve Medicaid and commercial on the platform. It’s across all lines of business. As I said, sometimes people forget sometimes we actually serve about 100 payers. So, it’s UnitedHealthcare and all the big nationals, but also regional blues and other health plans as well.

Chip Kahn: Are you using data to locate those patients? What kind of systems do you have?

Patrick Conway: We’re an evolution, transformation, whatever verb you want to use as well. So, we do, and I think those are getting better over time. So, let me try to give you an example. In our various clinics and specialties, we’re trying to make sure we match demand, so patient demand for appointments and things like that to supply. So, we get people to the right clinician quick enough. Actually, mental and behavioral we haven’t talked about yet today, very important. We have about 4,000 mental and behavioral health clinicians. So, psychiatrists, therapists and others. Obviously huge demand. We use technology to try to match that demand to the supply and including through virtual care, also in person, but a large percentage virtual. The last thing I’ll say on sort of clinical pathways in our Optum Insight, Optum Real business, and Optum Health. As we think about guiding patients, we’re increasingly saying, you’ve got a patient with a clinical need. How do we navigate them to the right place? That could be an Optum clinician, that could be a hospital, that could be wherever the right place is. So how to use data and technology and partnerships to sort of find that clinical need earlier and then guide them to the best clinical pathway for them.

Chip Kahn: You know, you’re big. In a sense, there are a lot of people within the whole umbrella, where it’s the same company bearing the risk for the care that bills the AI that informs the coverage decisions. How do you ensure that AI serves the patient first and is seamless for the provider? And what does your sort of AI review board or however you process things, actually do to give confidence to the answer?

Patrick Conway: We do have an AI review board that reviews the technology and its principle is sort of patient quality safety first. Since I’ve been at Optum, I’m in my seventh year now in all the various businesses, and I’ve run different businesses over time, now I just started my second year as CEO of Optum. We always start with a patient story. So, you center on the patient, the clinical first. So, we actually did it yesterday, our monthly business review. It was a child with multiple chronic conditions that we care for in the home. And we care for her almost every day of her life because we have a big home health hospice business as well. You know, that’s why you do the work. Then as you do, you take that principle into AI and you’re always clinical first. As I said, we’re using it for clinical approvals, automatically. You know, if it’s changing direction of care or saying we don’t think the therapy is needed. We have a principle that a clinician must review that—a human doctor, nurse practitioner, or other—the appropriate clinician. Because where we are now on the paradigm, we think that’s important that a clinician has the final say on approvals, auto approval by the technology for anything that is a redirection of care. We think that final decision, aided by AI and technology, but should be made by a clinician.

Chip Kahn: With that principle though, and not focusing on one, United or other companies. There is litigation, legislative activity in this whole area around AI-driven coverage decisions. How do you engage? And in some ways, you just did it. But public concern about AI being used to limit access. How do you assure people? And maybe also what kind of guardrails or public policy do you think are appropriate here?

Patrick Conway: Yeah, so first on us, I’d go back to the principles. I said, so what’s the review of the technology overall for patient quality first? And then I think principles like I described, auto approval, making the system faster, the technology can enable that. Redirection of care, or saying that, you know, this treatment is not approved, we think a clinician, you know, typically a doctor, has the final say. Then how do we assure people? I think it’s around transparency. I don’t know if we’re going to talk about Optum Rx today, but I’ll just—we put out the culmination of a series of work on Monday that is 100% transparency, 100% rebate pass through, 100% transparency down to the group purchasing organization, cost-based reimbursement for all drugs, 100% of independent pharmacies. They actually—Buddy Carter, who, you know, did a positive tweet about Optim Rx that’s, you know, you don’t see that every day.

Chip Kahn: Right.

Patrick Conway: I think it’s the same in AI. If we provide transparency, that builds trust. And so, one of our principles is providing that transparency to build trust. Sorry, last thing I’ll say here, because you alluded to a couple different ways. The health care system has many broken, fragmented parts. You actually need scale, whether you’re a UnitedHealth Group or a health system or public private partnerships to address people’s physical, mental, pharmacy, social needs at scale. I’d almost flip this question on its head sometimes. Individual niche solutions may solve individual niche problems. But if you want to make health care better for millions and millions of people, you actually need the capabilities, the assets, the people, the technology to do that. And that often comes with scale to deliver those outcomes.

Chip Kahn: Yeah, I think what you just articulated is really important and there are a lot of naysayers about…I’ll use the consolidation word. But at the end of the day, if you can’t do most of what the patient needs in some kind of system, then the patient’s not going to get what they need. Fragmentation is a problem. I mean, there’s no question about it.

Patrick Conway: Totally. Look, to bring it to the clinical: I was down at Kelsey-Seybold [Clinic] a while back, which is one of our clinics systems in Houston and they have a product that actually the network is more open than you might imagine. I said, well, how do you keep people coming to Kelsey-Seybold? And they’re like, well, they love us and we do everything. We got primary care, we got specialty care, we got ambulatory surgical centers, we got mental health. And to your point, you need the scale and set of capabilities to do that. And actually, the data proves it out. They’re lower cost by far. Their quality results are through-the-chart positive, and their experience results are very positive. I mean, sometimes you can’t make this up. I’m not going to name the person because I don’t know if you want me to, but I met with senior officials in Massachusetts yesterday and he had been to one of our ambulatory surgical centers. And you’re a little nervous when that happens because you’re like, oh, he was like, he was like, no, it was amazing. Like, it was the best health care experience I’ve ever had. It was patient centered, it was organized. You guys had transferred my primary care record to the ASC [ambulatory surgery center]. I mean, that’s what you want for patients and that is the benefit of some level of scale capabilities, technology to support that level of care.

Chip Kahn: So, let’s move from the patient side to the physician side. You know, there’s some data out there that maybe you can even give us the number of the total physicians that you employ. But Optum docs, I understand, run 34% below industry average in terms of burnout, which is, which is a really incredibly positive number. What is different about a doctor’s day inside your model? And how are you keeping them in the race and not burn out?

Patrick Conway: You do your research. I’m impressed. You know that stat, that is the right stat. We basically try to support them in the clinical care and remove the barriers. And then let me describe. We use ambient listening powered by AI to help them with documentation. We use AI and technology to queue up, have you thought about these clinical decisions? Have you thought about these Star gap closures? So, it’s helping them manage. I mean, you know, I still practice. You’re managing a kid or an adult with 10 plus chronic conditions and many medications. It is a recipe for, on one end of the spectrum, errors or safety errors. On the other end of the spectrum, you know, making sure you address every care gap and address all their needs. We’re supporting them with the latter. Give you some other tangible examples. I live in Massachusetts. I interact with our Atrius physicians a fair bit. They were struggling as an independent. Now they’re expanding, they’re expanding services. They have the technology to do what they need to do. They’ve got home health and hospice and the whole care paradigm, ambulatory surgical centers to serve patients. The last story I’ll tell: It’s actually the flip with a 91-year-old story with one of our geriatricians who do those visits often. She said to me, you know, I was going to retire. She was older in her career and she said, and then I found this and I love it. She was like, I was doing 15-minute office visits, burnt out, could never do everything I wanted. And now I get to drive around and see four or five people in their home and do a visit for an hour, hour and a half. She’s like, this is amazing. Like I love it and I don’t plan to retire anytime soon. So, I mean that you give physicians the ability to practice or nurse practitioners or other clinicians and just deliver amazing clinical care. That’s why they went into medicine, that’s why I went into medicine. And you do the opposite and you create barriers or paperwork or other things, then you end up burning people out. So, we’re trying to do the former.

Chip Kahn: So how much is AI, contributing on this clinical side to diagnostics and are we headed to automated decision-making in this at all? And where’s the accountability? I know you talked a bit about it, but could you put more emphasis on it?

Patrick Conway: Yeah, I think AI is going to be a huge accelerator. So, there’s even a study came out I think, yesterday or the day before, on sort of physicians using AI and various tools. And it’s a very high percentage now what they’re generally, I use it by the way in my clinical practice as well, it’s used as an aid, a support system. And I think that in today’s paradigm that’s the way it should be used. So, if it’s diagnosis, what are the various diagnosis to consider? I like data and stories as you’ve heard. Our care at home model, we broke patients into various cohorts. So, you’ve got a 40-year-old disabled patient versus a 92-year-old patient versus an oncology patient. So, you’re queuing up the right information based on AI technology for that specific patient. It also becomes much more personalized. As you know, patients are starting to use AI to help guide their journey. I think that’s good. It’s giving them information and clinicians are using AI. So, I think it becomes much more personalized, if you will, to get the exact right care for that individual patient in front of you.

Chip Kahn: You’ve committed to pretty significant cost reductions from AI in ‘26 and argued that capitation and generative AI together can bring about value-based care. And this is where we get into the rural side, to rural communities. If you were right and obviously if you’re saving money, some of that’s sort of coming out of the payments and the volume. What happens to the independent physician, that local community hospital, and the smaller players in that market?

Patrick Conway: A couple things. I grew up in Texas, I certainly understand rural health care. With a doc that, you don’t do this anymore, did one year internship, hung a shingle, delivered us, did minor surgery, my entire medical records, like five pages. You don’t see that much anymore, handwritten. We need to support these hospitals and clinicians. Then let me describe that. So, we actually serve a little north of 8 out of 10 hospitals and health systems in the country in some way, usually in a lot of their back-office functions. A ton of those are in rural America. We’re committed to that; we’re committed to doing more of it. We even through our UnitedHealth Group foundation are talking about how we invest even more in rural, both as a business and a foundation. For those independent docs, as you alluded to, we often are given a physician number and people include contracted employed. Employed is actually a smaller percentage of the number. The vast majority are contracted, which means they’re not employed by us. We’re offering them tools, technology, and contractual arrangements to allow them to participate in value-based care. As you know, as a small doc practice, that’s very hard on your own. And many of those are in rural areas and we want to expand those and even more in rural areas. So, the rural hospitals, we support many of them now and we’re having these kinds of conversations. How do we use AI and technology to help you be more efficient, help you get the right patients in your door. Also, you know, when patients need to transfer, go somewhere else. How do we make that process as simple and fast and efficient as possible?

Chip Kahn: Can we go into a little bit more depth, and maybe beyond what you’re doing in terms of rural health care? We have in the OBBA [One Big Beautiful Bill Act ] very large Medicaid reductions and frankly from at least my perspective, we have a small little rural program. And the administration’s made it clear they don’t want to use that money for helping directly to providers. So, there’s going to be a gap and it’s not going to come all at once. It’s going to be over the next few years. But that gap is going to be really significant in terms of those rural hospitals that are very dependent on Medicaid and Medicare. And the Medicaid numbers that they’re paid is going to come down. Do you have a view as to how that should be dealt with? How we can mitigate that at all or…?

Patrick Conway: Look, it’s a major issue. My hypothesis is we’re going to need public and private sector to sort of fill in because gaps, if you will, and partner in rural America. We’ve talked to the current administration about this. You know, rural health has actually generally been bipartisan over time. Certainly something we care deeply about. Look, I think you’re going to have to fill in with technology data supports. I think payment models you’re going to have to think of slightly differently. So, give you an example. You know, in the Innovation Center, we had this rural hospital model in Pennsylvania that basically tried to support them if they wanted to become a smaller sort of inpatient surgical footprint and more of an ER and a community footprint, they could do that and gave them the glide path. In Vermont, we did this all-payer ACO model which also tried to support the rural hospitals. So, I’d look to some of the state-based work as well, not just those two generally that have said, you know, we need a system of care in this state that includes rural and urban and how do we make that system function as best as possible?

Chip Kahn: I mean, something’s got to be done. It’s not going to get better by itself.

Patrick Conway: Exactly. And you know, we read about the alternative, right, where you now have a desert where, you know, I have to drive two and a half hours to deliver my child. You know, to deliver a baby. That’s obviously not optimal. You know, there in a given state, I’d literally map that out to figure out, you know, where do I have those kinds of significant access concerns? How do I as a state support something in that area, even if it’s a smaller physical footprint, not a whole hospital, but some ability to do the more emergent and basic care? And I’d include childbirth, it’s a specialty, but it’s an important specialty that is incredibly important at the time you’re delivering a child. So how do you have that spread out with access uniformly, including to rural areas.

Chip Kahn: You brought up the Rx and you talked about the refinements that you all were making in your pharmacy benefit management function. What role will AI play on the pharmacy side? I know in Utah they’re back and forth about an experiment of having scripts refilled using AI. What’s your view on that?

Patrick Conway: Yeah, so I’d put in categories again. So one, we are using AI for auto approval, like I said now, the median is less than 30 seconds. So, I mean, you know, we literally had a very senior person in our company. It was like, it worked on my phone, like it was ordered and approved, you know, all done. And that’s how it’s supposed to work and that is how it works. So median less than 30 seconds for auto approval. The other place we’re using AI, this cost-based reimbursement for all drugs, all pharmacies across America. One of the challenges before was the data to try to get there. So how do you sort of, you know, you got thousands and thousands of drugs, thousands of pharmacies. So, we actually had an AI technology pricing platform it was part of the solution to allow us to move to a cost-plus type of arrangement for all drugs, all pharmacies. And the feedback we’ve gotten from independent community pharmacists is very positive. Actually, a rural issue as well. You know, if you’re a rural independent community pharmacy, we can support you in a sustainable cost-plus model. We won’t have a pharmacy desert in that area, as an example. The last area I’ll put in is a large part of our Rx business is also the pharmacies. So, think infusion, specialty pharmacy, home delivery. We actually have these community pharmacies that are integrated care for mental and behavioral. So, think schizophrenia, substance use disorder, really cool model, partner with FQHCs and community health centers. The data there is similar to some of the clinical realms. You know, how do we get the nurse to the right patient? How do we make sure this, you know, right drug, right patient, right time, affordably, right dose, you know, how do we make sure that happens every time using AI and technology. So those are some of the ways we’re using it in the Rx space.

Chip Kahn: One of the other issues that comes up, and there have been some Wall Street analysts on this, talking about whether AI in terms of the clinical area will save money or reduce spending immediately. And the issue is, I think, really characterized by one of our earlier interviews with Elad Walach from Aidoc, where their technology now is so good that even if they have a CT scan that was ordered for a certain purpose, they can find out a lot of other stuff about that patient. So, as we apply AI to whether it’s population health or whether it’s specific procedures or diagnostics, you’re going to be finding things you didn’t see before. So where do you fall out on this notion that at least at the beginning it’s going to find more disease, which will have to be dealt with before we get to the longer-run benefits of finding things earlier? You, know, where do you fall out on this?

Patrick Conway: Yeah, look, I go back to first principles. There will be instances where AI finds something earlier. I would argue that’s unequivocally a good thing if it improves health. You know, so if you’re improving health, that’s our first principle goal—health care outcomes and quality and experience. And over the long term, most of those things will have a cost, return as well. There was actually. I’m looking,  I got books above me. Somebody wrote in one of their books about this. You may remember this, when we did the diabetes prevention program in CMMI, I actually had to approve. The actuary said, well, it does improve in quality. It does. You know, it clearly saves lives. By the way, in our 10-year window that we use for everything in D.C., it may increase cost. And we actually said we still want to expand it nationally because the goal of Medicare should be to improve life and health outcomes. And, by the way, a 10-year window is pretty arbitrary, and so we approved it and expanded, as you know. Look, the reason I share a story is similar here. Anything we can do, or anybody in the health system can do to improve quality of life, health outcomes, morbidity, mortality, we should do, because that’s what our population that we serve wants. And the vast majority of those things do have a financial return over some time period. Some of them will be longer, some of them will be shorter. But we need to invest in health.

Chip Kahn: You know, one of the dilemmas in the whole area of pay-for-performance is that, you know, obviously it usually has a pricing angle, and it has some kind of volume angle, but it also includes some kind of metrics. But those metrics are usually structural or process.

Patrick Conway: We worked on this.

Chip Kahn: We did, and it was the best you could do at the time. But we’re sort of stuck with a system that at best, I could say, is not dynamic and may not even be relevant to the services that are being provided. It’s really about compliance now. Do you think that AI can—and obviously we have all the data—AI can break the logjam here.

Patrick Conway: I do. I was smiling because we did work on it and you’re right, we did the, you know, Medicare stars, which we put in when I was at CMS. It was the best for the time. It was. It needs to evolve faster to more outcome-oriented measures, to measures that actually matter. And you know, the current administration agrees with that by the way, as do we. So, I do actually think AI and technology may be the final breakthrough, if you will, because one of the biggest limits before, as you know, was the data. Well, I don’t have the outcomes data, I don’t have the clinical data. Oh, it’s too expensive to collect, you know, so we’re just going to rely on claims data because that’s what we have, you know, or a process metric that we happen to have. That was what you had at the time, but now you’re in an era with the AI technology that you should be able to have the data. It should not be costly to collect. You should actually know the health outcomes. And so, I do think it opens up the health outcome and quality measures to be much more meaningful and actually have that parsimonious set we’ve talked about for so long in the various areas that are the measures that matter.

Chip Kahn: You know, as we close out our conversation, Patrick, there are a lot of doomsayers about AI, generally, as well as those who look at it as making the future brighter. In terms of AI and health care sort of generally, is there anything that keeps you up at night that worries you about where we’re headed?

Patrick Conway: Look, what’s kept me up at night through various…actually, I fall asleep in about two seconds, but if anything kept me because I probably don’t get enough sleep, although I’m trying to get back. But if anything kept me up at night, I’ve had the blessing, if you will, to work at places like CMS and UnitedHealth Group and Optum that serve millions and millions of people. And then what would keep me up or worry me? There’s somebody falling through the cracks. And actually, when I work clinically in the hospital, I work at a safety net hospital in Boston. I see those people that fell through the cracks, didn’t get the mental health care they needed, didn’t get the home-based care they needed, didn’t get basic preventative care. So that’s what keeps me up or worries me. I’m an optimist. I actually think AI is one of the keys to solving that problem, because one of the challenges as a clinician, you don’t see the patient not in front. You see the patient in front of you. And we literally train clinicians that way. But in population health or value-based care, you have got to care for the whole population. To do that, you’re going to need AI and technology to help you see and understand that whole population and serve their physical, mental, pharmacy, social, financial needs across their life trajectory. And that I think AI and technology are the key to. And what gives me hope is when I’ll, go out and see this care. I’ve got to end with one story that I hope you keep in the podcast.

Chip Kahn: We’ll keep it. We’re going to keep it all though.

Patrick Conway: Yeah, it’s not AI, but it’s caring. So, I’m in Lafayette, Louisiana, and I like to do visits, so I show up at this house and the nurse walks from across the yard and I’m like, are you his neighbor? And she says, yeah, I’ve cared for him. You know, when I was a single mother, he helped me help repair my house, he helped do other things. I’m a hospice nurse. He was going into hospice. There was no question I was going to care for him. And we walk into the home and his caregiver, these are these nurses employed by us, the caregivers employed by us watch from the backyard. You can’t make this up. I care for him 50 hours a week because he’s my neighbor. You know, I work. LHC is the business. It’s one of our home health hospice businesses. And the emotion in that room was palpable. And then you walk out and the nurse says, do you have a minute for an elevator speech? Do you know what an elevator speech is? I’m like, of course I do. She gives a speech about hospice and about how it’s important to care for people at birth. It’s just as important at the end of life. And that she cares for their physical, mental, social, pharmacy, their whole holistic needs. That’s when you know you got it right. And we do support her with technology as well. To bring it back to your AI topic. But it’s not just technology, it’s the caring of a clinician like that and giving them the tools and the technology so they can do their best work.

Chip Kahn: Thanks, Patrick, for a great conversation. I really appreciate your time. And I certainly learned a lot today and I know our audience will appreciate it also.

Patrick Conway: Well, thank you. I’m a learner, too.

Chip Kahn: Great.


SERIES

This weekly podcast features insightful conversations between host Chip Kahn and his guests, who discuss the business of health care, connecting the dots between the health care business, policy, and patients.

The podcast’s first series on AI in health care illuminates how AI is changing health care, and features guests who are deploying this technology, managing its consequences, and designing policy around it.

Tracking Implementation of the 2025 Reconciliation Law Medicaid Work Requirements

Updated on:

The 2025 reconciliation law requires states to condition Medicaid eligibility for adults in the ACA Medicaid expansion group on meeting work requirements starting January 1, 2027; however, states have the option to implement requirements sooner through a state plan amendment (SPA) or through an approved 1115 waiver.

State Plan Amendments (SPAs)

States may choose to implement work requirements prior to the required January 1, 2027 implementation date through a state plan amendment. Nebraska is the first state to announce that it will begin enforcing federal work requirements early through a state plan amendment, starting May 1, 2026. Two other states are also planning to implement before January 2027–Montana on July 1, 2026 and Iowa on December 1, 2026. Arkansas has announced that it plans to launch a soft implementation of work requirements on July 1, 2026 but will not disenroll individuals prior to January 1, 2027.

1115 Waivers

Since the start of the second Trump administration, several states have submitted waivers to implement work requirements. However, states are unlikely to be moving forward with proposed 1115 waivers at this time due to the passage of federal work requirements. States that plan to implement federal work requirements early will do so through a state plan amendment. Currently, Georgia is the only state with a Medicaid work requirement waiver in place following litigation over the Biden administration’s attempt to stop it. Georgia’s waiver will expire December 31, 2026; the state is required to come into compliance with the new federal requirements effective January 1, 2027.

Early Implementation and Waiver Status

The map below identifies states that have indicated they will implement federal work requirements early through a state plan amendment and the one state (Georgia) that has implemented work requirements through an 1115 waiver.

States Implementing Work Requirements Early and/or With Approved Work Requirement Waivers (Choropleth map)

Tracking Implementation of the 2025 Reconciliation Law Medicaid Work Requirements

Updated on:

KFF Resources on Medicaid Work Requirements

Work requirements overview:

50-state survey of Medicaid eligibility and enrollment policies:

Implementation of work requirements:

Research and analysis on Medicaid and work:

1115 work requirement waivers:

Work requirements implications and state experience:

Arkansas work requirement experience:

KFF Polling on Work Requirements:

Beyond the Data by KFF CEO Drew Altman:

Tracking Implementation of the 2025 Reconciliation Law Medicaid Work Requirements

Updated on:

CMS Guidance and Information

Operational and Implementation Questions

Table