 Robin Rudowitz
  Jennifer Tolbert
  Alice Burns
  Elizabeth Hinton
  Anna Mudumala
  Priya Chidambaram
  Maiss Mohamed
 Medicaid is the primary program providing comprehensive coverage of health and long-term care to about 80 million low-income people in the United States. Medicaid accounts for nearly one-fifth of health care spending (and over half of spending for long-term care) and a large share of state budgets. Medicaid is jointly financed by states and the federal government but administered by states within broad federal rules. Because states have the flexibility to determine what populations and services to cover, how to deliver care, and how much to reimburse providers, there is significant variation across states in program spending and the share of people covered by the program. Changes to Medicaid and the Affordable Care Act included in the tax and spending budget reconciliation law enacted in July 2025 are expected to reduce federal Medicaid spending by $911 billion over 10 years and reduce the number of people with health insurance by 10 million (three-quarters of which stems from the cuts to Medicaid).

Medicaid 101
Published: October 8, 2025
Health Policy 101:
Table of Contents
Introduction
What Is Medicaid?
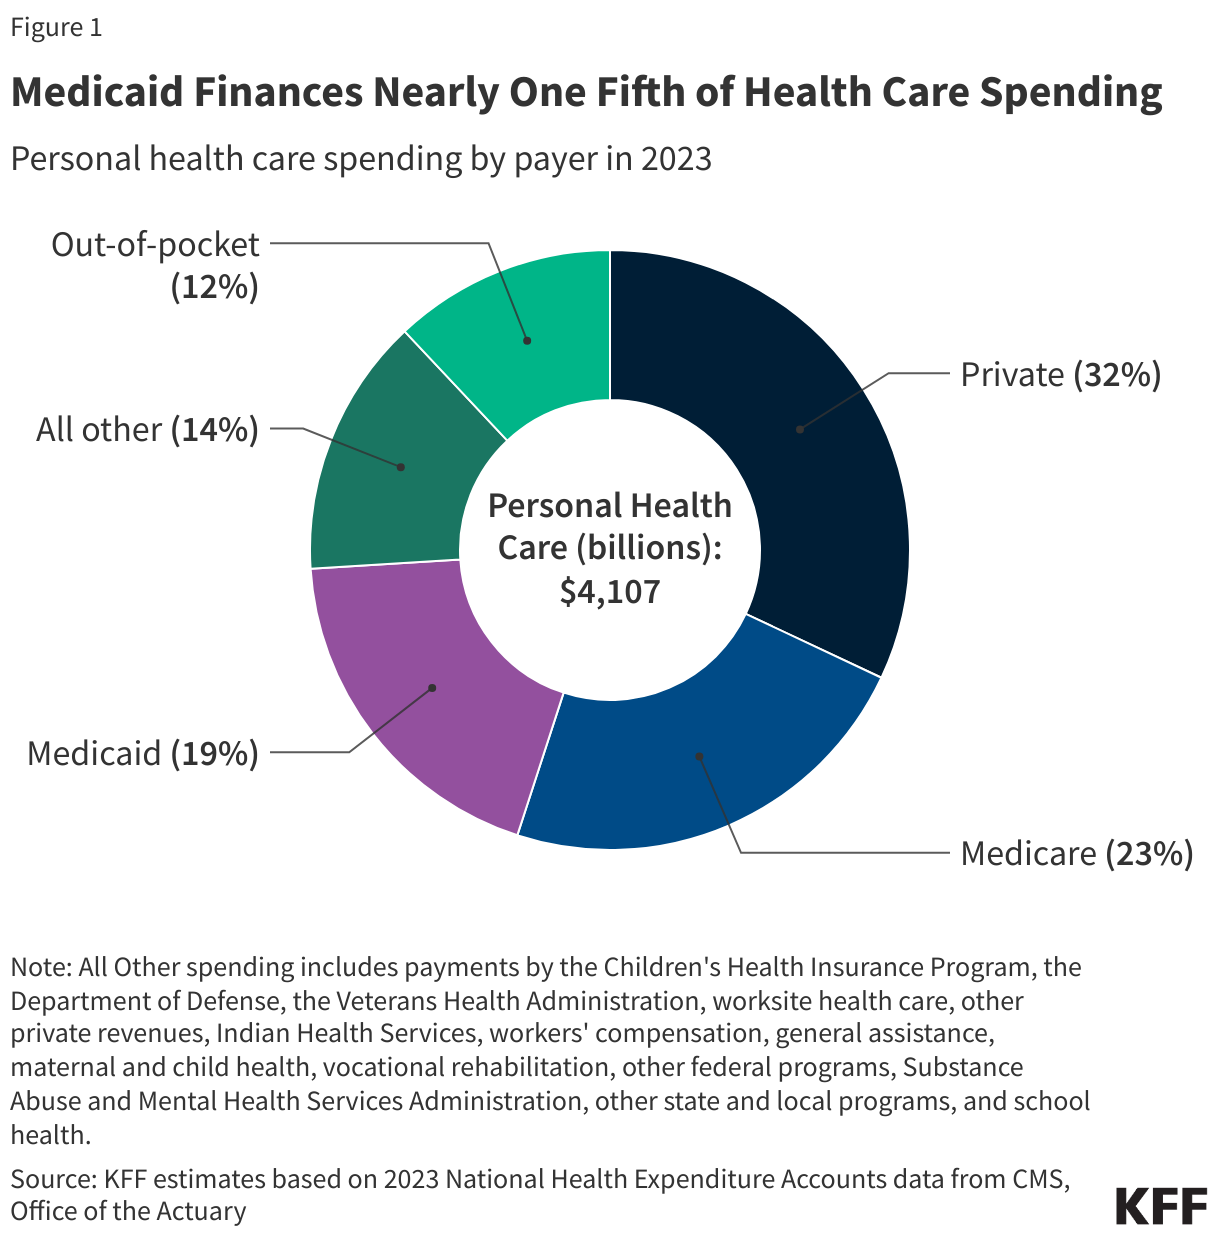
Medicaid is the primary program providing comprehensive coverage of health care and long-term care to about 80 million low-income people in the United States. Medicaid accounts for nearly one-fifth of health care spending (and half of spending for long-term care) and a large share of state budgets (Figure 1).
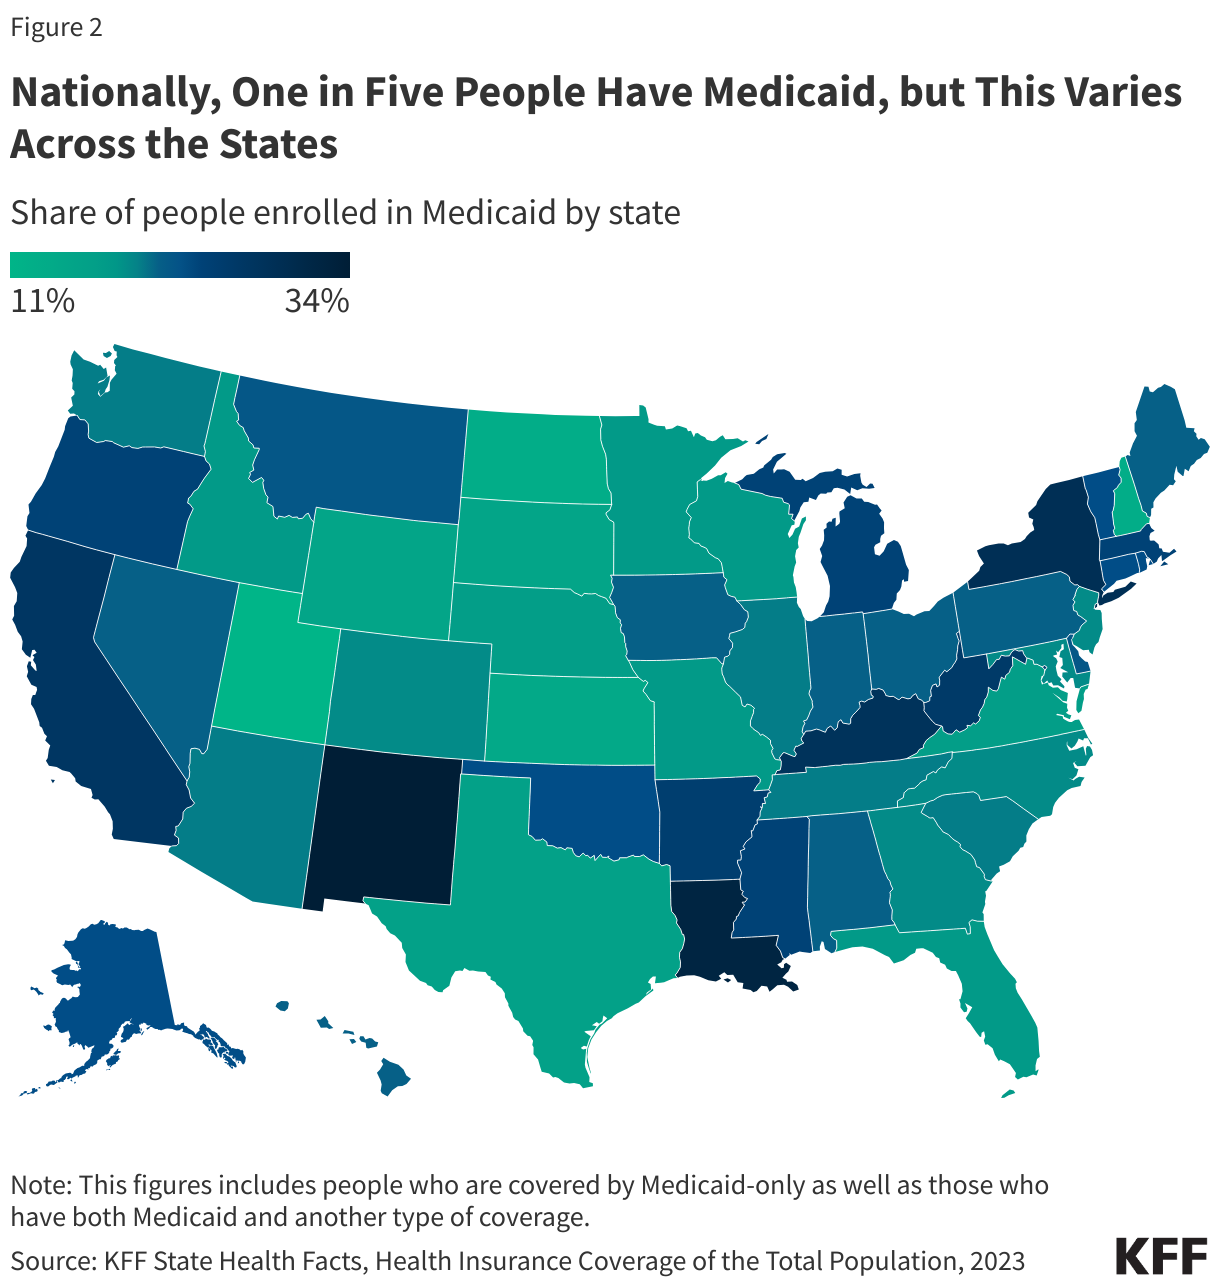
Subject to federal standards, states administer Medicaid programs and have flexibility to determine what populations and services to cover, how to deliver care, and how much to reimburse providers. States can obtain Section 1115 waivers to test and implement approaches that differ from what is required by federal statute if the Secretary of Health and Human Services (HHS) determines the waivers would advance program objectives. Because of this flexibility, there is significant variation across state Medicaid programs, and, as a result, the share of state residents covered by the program (Figure 2).
How Has Medicaid Evolved Over Time?
Title XIX of the Social Security Act and a large body of federal regulations and sub-regulatory guidance govern the program, defining federal Medicaid requirements and states’ options and authorities. At the federal level, the Centers for Medicare and Medicaid Services (CMS) within the Department of Health and Human Services (HHS) administers Medicaid and oversees states’ programs. States may choose to participate in Medicaid, but if they do, they must comply with core federal requirements. Not all states opted to participate in Medicaid immediately after its enactment in 1965, but by the 1980s, all states had opted in. Medicaid coverage was historically tied to cash assistance—either Aid to Families with Dependent Children (AFDC) or federal Supplemental Security Income (SSI). Over time, Congress expanded federal minimum requirements and provided new coverage requirements and options for states, especially for children, pregnant women, and people with disabilities. In 1996, legislation replaced Aid to Families with Dependent Children with Temporary Assistance to Needy Families (TANF) and severed the link between Medicaid eligibility and cash assistance for children, pregnant women, and low-income parents. The Children’s Health Insurance Program (CHIP) was established in 1997 to cover low-income children above the cut-off for Medicaid with an enhanced federal match rate (Figure 3).
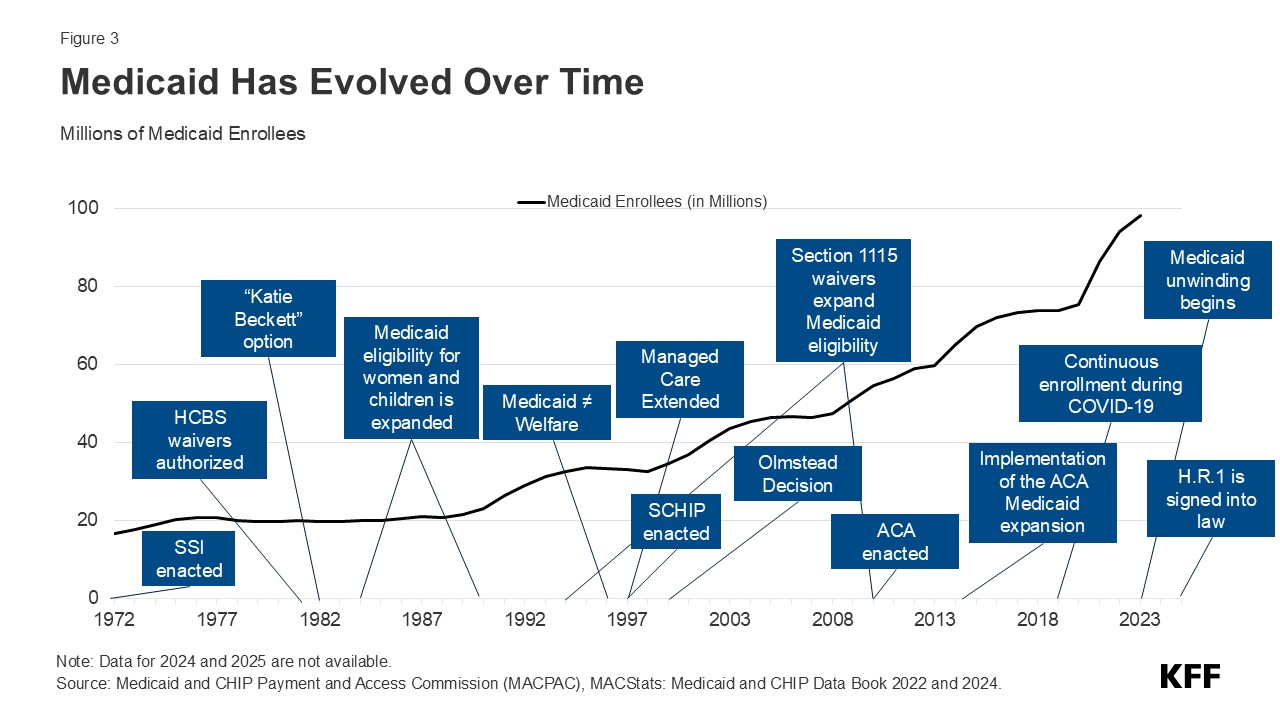
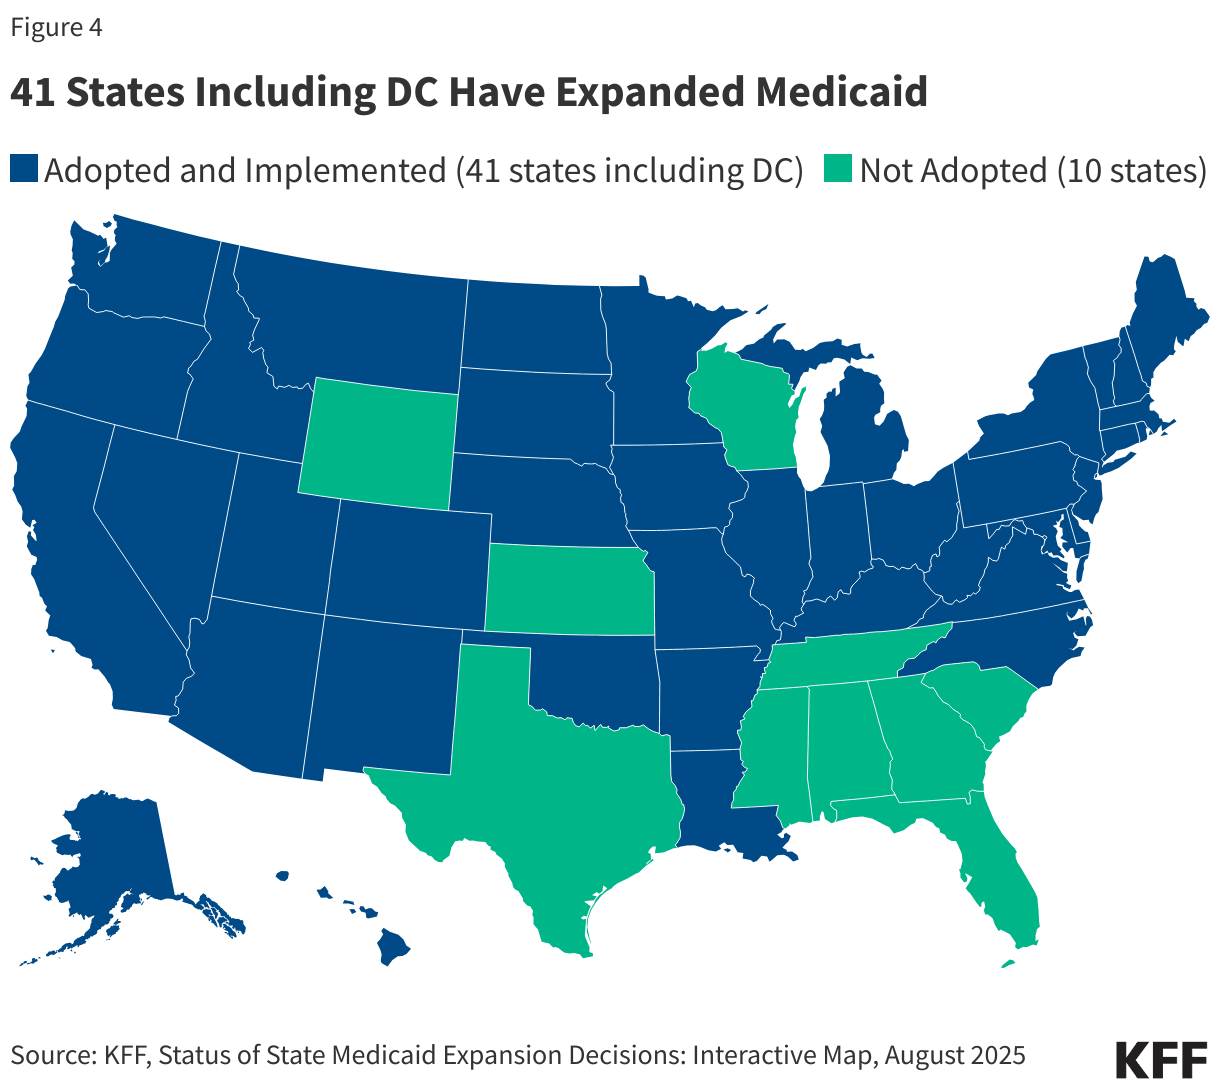
In 2010, the Affordable Care Act (ACA) expanded Medicaid to nearly all nonelderly adults with income up to 138% FPL ($21,597 annually for an individual in 2025) through a new coverage pathway for parents with incomes above states’ mandatory eligibility levels for parents/caretakers and adults without dependent children who had traditionally been excluded from Medicaid coverage. However, the ACA Medicaid expansion coverage is effectively optional for states because of a 2012 Supreme Court ruling. As of July 2025, 41 states, including Washington, D.C., have expanded Medicaid (Figure 4). States receive a higher rate of federal matching funding for people who are enrolled through the expansion coverage pathway. Under the ACA, all states were also required to modernize and streamline Medicaid eligibility and enrollment processes to help individuals obtain and maintain coverage.
The COVID-19 pandemic profoundly affected Medicaid spending and enrollment. At the start of the pandemic, Congress enacted legislation that included a requirement that Medicaid programs keep people continuously enrolled in exchange for enhanced federal funding. As a result, Medicaid/CHIP enrollment grew substantially, and the uninsured rate dropped. The unwinding of these provisions started on April 1, 2023, and millions were disenrolled from Medicaid; however, Medicaid enrollment remains higher than prior to the start of the pandemic in February 2020.
Passage of the tax and spending reconciliation budget bill in July 2025 included significant changes to Medicaid that are expected to reduce federal Medicaid funding and reduce Medicaid enrollment over the next 10 years relative to what would have been expected under current law. For the first time, the law conditions Medicaid eligibility for Medicaid expansion enrollees on meeting work and reporting requirements. These work requirements, which will go into effect on January 1, 2027, or sooner at state option, represent the largest source of federal Medicaid funding reductions and the largest source of enrollment declines in the law. The law makes other changes. Beyond work requirements, the largest cuts to Medicaid stem from provisions that would: reduce and limit provider taxes, a mechanism that nearly all states use to finance the state share of Medicaid; reduce the payments states require managed care organizations to make to health care providers (“state-directed payments”); delaying enforcement of certain provisions in the Biden administration’s rules simplifying Medicaid eligibility and renewal processes; and increasing frequencies of eligibility redeterminations for expansion enrollees. Combined, those changes and work requirements account for nearly 90% of the expected cuts in federal spending according to the Congressional Budget Office (CBO).
How Is Medicaid Financed?
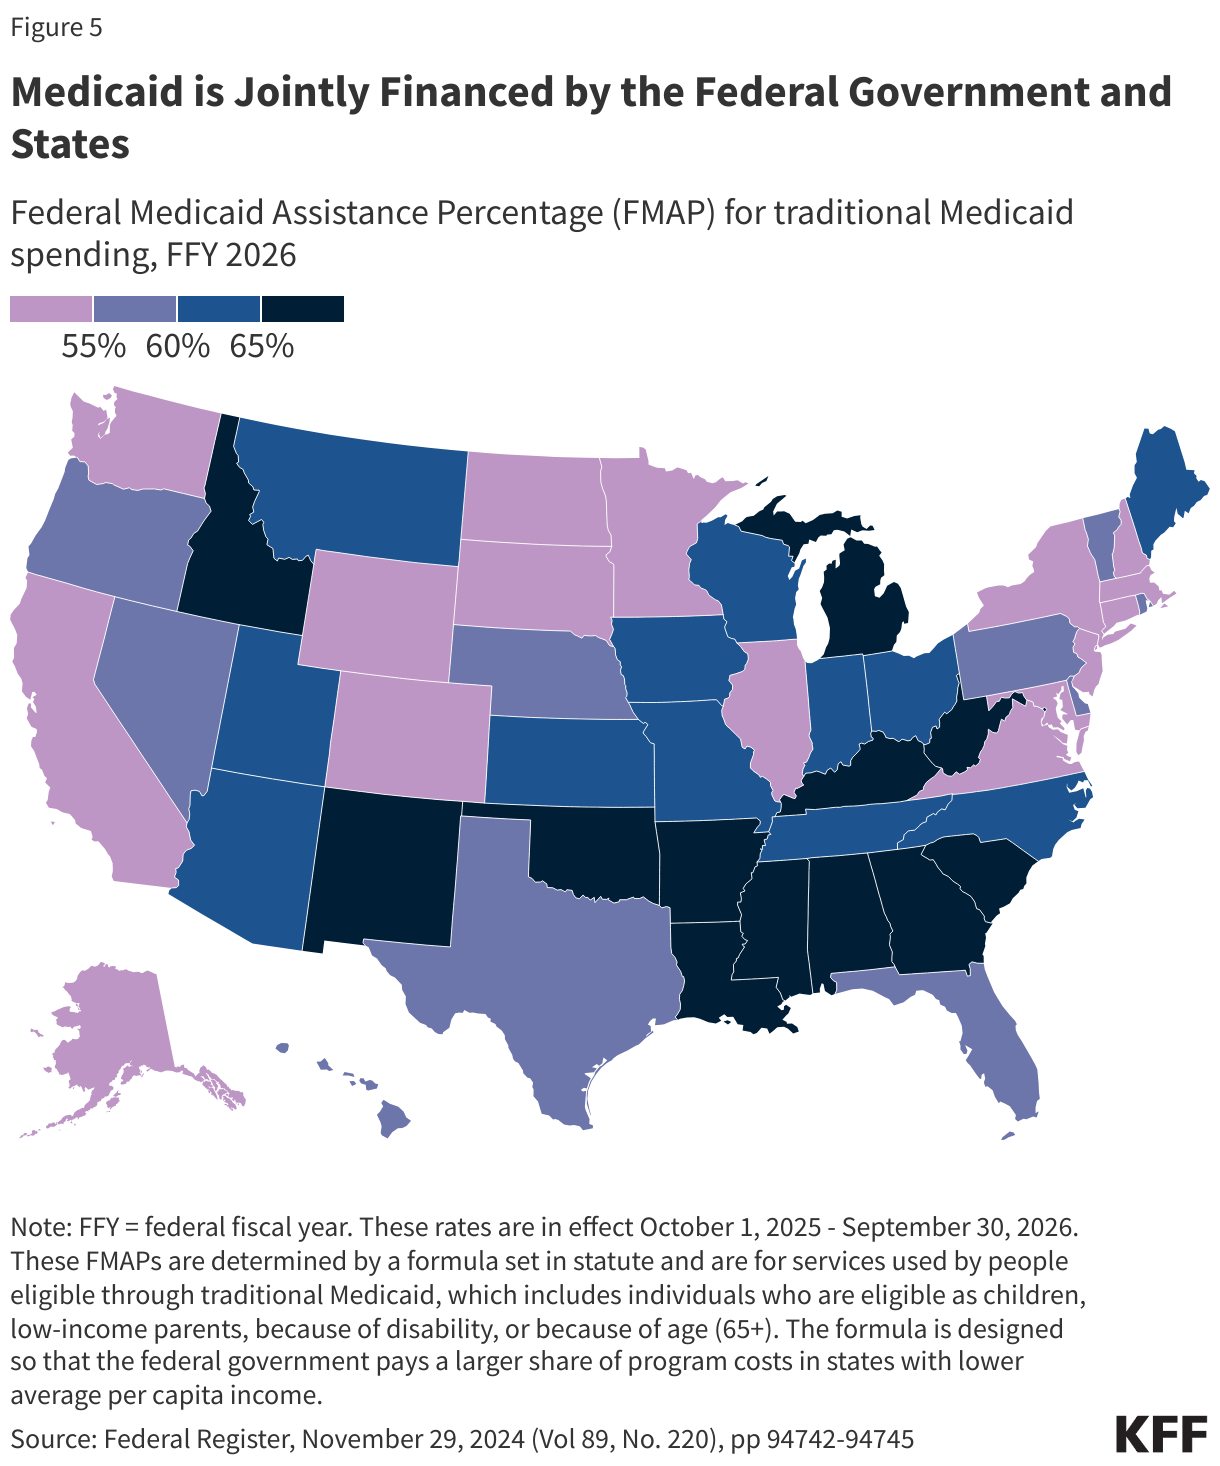
States are guaranteed federal matching dollars without a cap for qualified services provided to eligible enrollees. The match rate for most Medicaid enrollees is determined by a formula in the law that provides a match of at least 50% and provides a higher federal match rate for states with lower per capita income (Figure 5). States may receive a higher match rate for certain services and populations. The ACA expansion group is financed with a 90% federal match rate, so states pay 10%, and the American Rescue Plan Act included an additional temporary fiscal incentive to states that newly adopt the Medicaid expansion; however, the tax and spending law eliminated the incentive, effective January 1, 2026. In FY 2023, Medicaid spending totaled $880 billion of which 69% was federal spending. Medicaid spending growth typically accelerates during economic downturns as enrollment increases. Spending growth also peaked after the implementation of the ACA and, more recently, due to enrollment growth tied to the pandemic-related continuous enrollment provision.
Overall, Medicaid accounts for a large share of most states’ budgets and is often central to state fiscal decisions; however, state spending on Medicaid is second to state spending on elementary and secondary education, and the program is also the largest source of federal revenue for states. In state fiscal year 2023, Medicaid accounted for 30% of total state expenditures, 15% of expenditures from state funds (general funds and other funds), and 57% of expenditures from federal funds received by the state.
Social Security, Medicare , and Medicaid are the three main entitlement programs, accounting for 41% of all federal outlays in FFY 2024. Of these three programs, Medicaid is the smallest in terms of federal outlays, though it covers more people than Medicare or Social Security. Overall, federal spending on domestic and global health programs and services accounted for 29% of net federal outlays in FFY 2023, including spending on Medicare (13%), Medicaid and CHIP (10%), and other health spending (6%). Dating back to the 1980s, there have been efforts to limit federal financing for Medicaid either through a block grant to states or through a cap on spending per enrollee as a way to help reduce federal spending. Such efforts could shift costs to states, forcing them to make tough choices about whether to pay for the federal cuts, which would require higher taxes or reductions in non-Medicaid state spending, or to reduce Medicaid spending by limiting Medicaid eligibility, covering fewer benefits, or paying less to providers. Although early discussions over the tax and spending law included proposals that would have reduced the federal Medicaid match rate and imposed a cap on per-enrollee spending, these changes to Medicaid financing were not included in the final version of the bill that passed.
Who Is Covered by Medicaid?
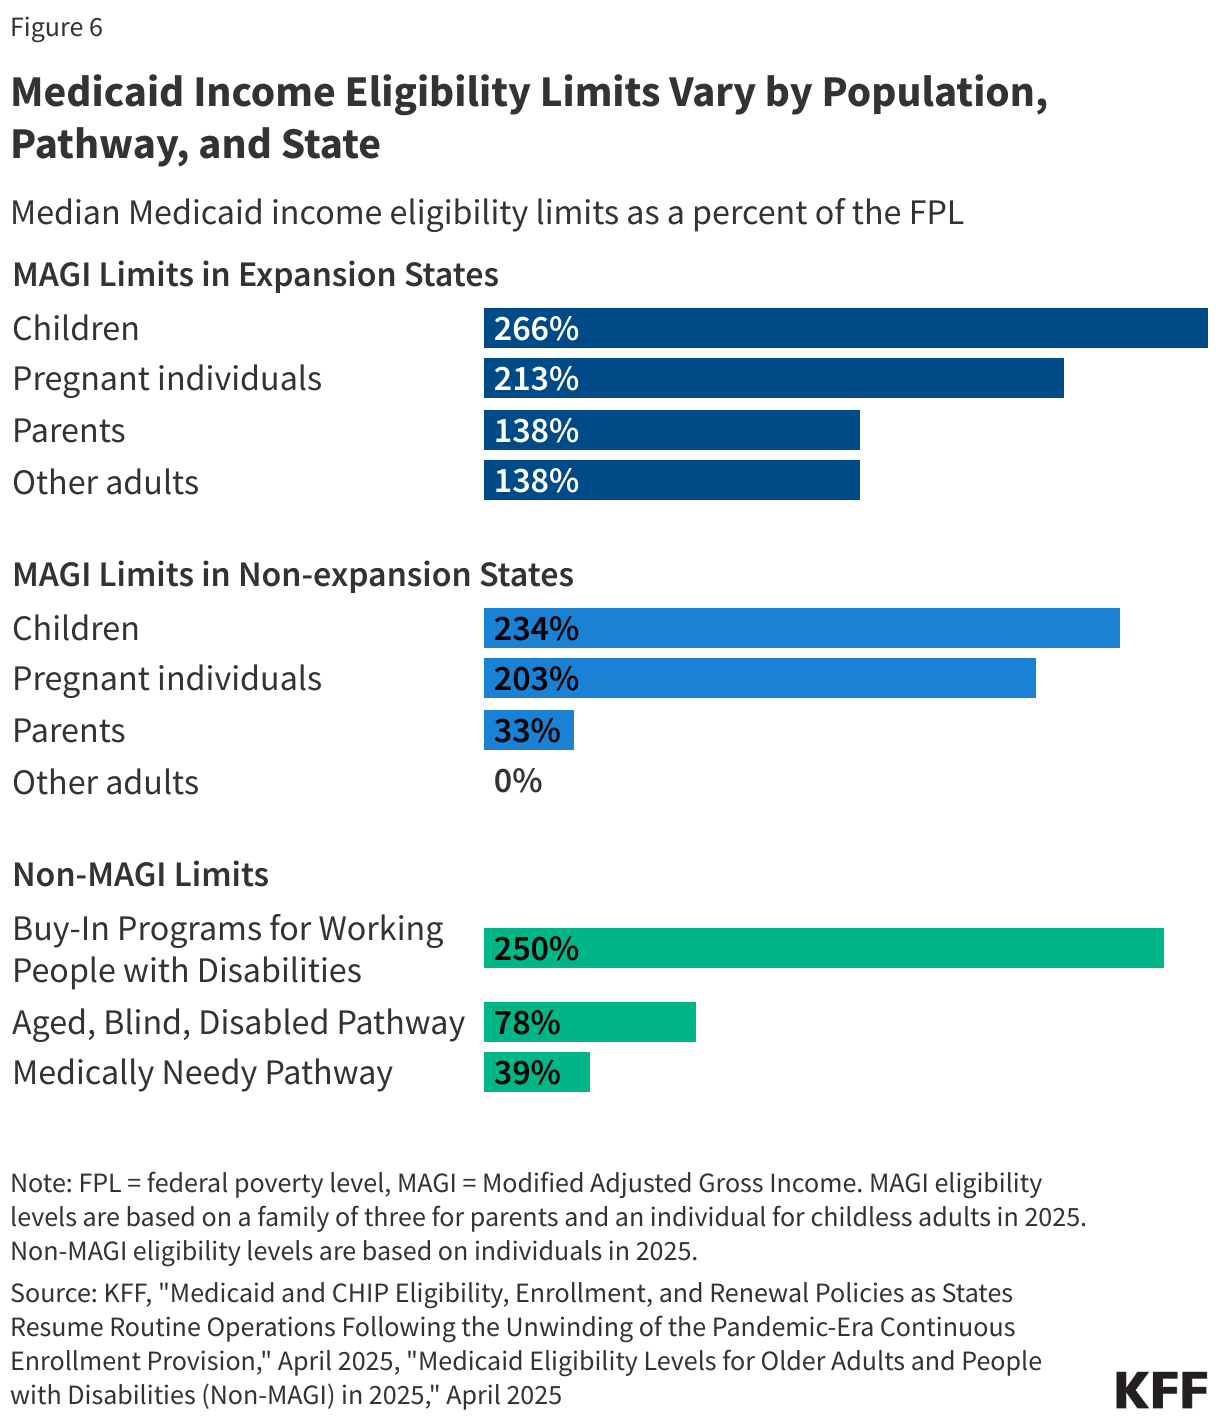
Medicaid is an entitlement, meaning individuals who meet eligibility requirements are guaranteed coverage. The federal government sets minimum eligibility standards, but states may expand coverage beyond these minimum requirements. Federal minimum eligibility levels for children and pregnant individuals are set at 133% of the federal poverty level (FPL) with a mandatory 5 percentage point income disregard or effectively 138% FPL ($36,777 for a family of 3 in 2025); however, median eligibility levels for these groups were 255% FPL for children and 213% FPL for pregnant individuals as of January 2025. As a result of the ACA, the median coverage level for parents and adults without dependent children is 138% FPL, but for states that have not adopted the ACA expansion, the median eligibility for parents was 33% FPL. In non-expansion states, adults without dependent coverage are not eligible for Medicaid coverage and those with incomes below the FPL fall into the coverage gap.
Medicaid coverage is also available to certain individuals who qualify on the basis of being age 65 and older or having a disability. These coverage categories are referred to as “non-MAGI” pathways because they do not use the Modified Adjusted Gross Income (MAGI) financial methodology that applies to pathways for pregnant people, parents, and children with low incomes. In addition to considering advanced age, disability status, and income, many non-MAGI pathways also have asset limits. Medicaid generally covers individuals who qualify for Supplemental Security Income (SSI), but nearly all other non-MAGI pathways are optional, resulting in substantial state variation. Each group has different rules about income and assets, making eligibility complex (Figure 6).
Medicaid coverage is limited for immigrants, and except for emergency services, Medicaid coverage is not available for undocumented immigrants. A number of states, however, use state funds to provide coverage to all or some undocumented immigrants.
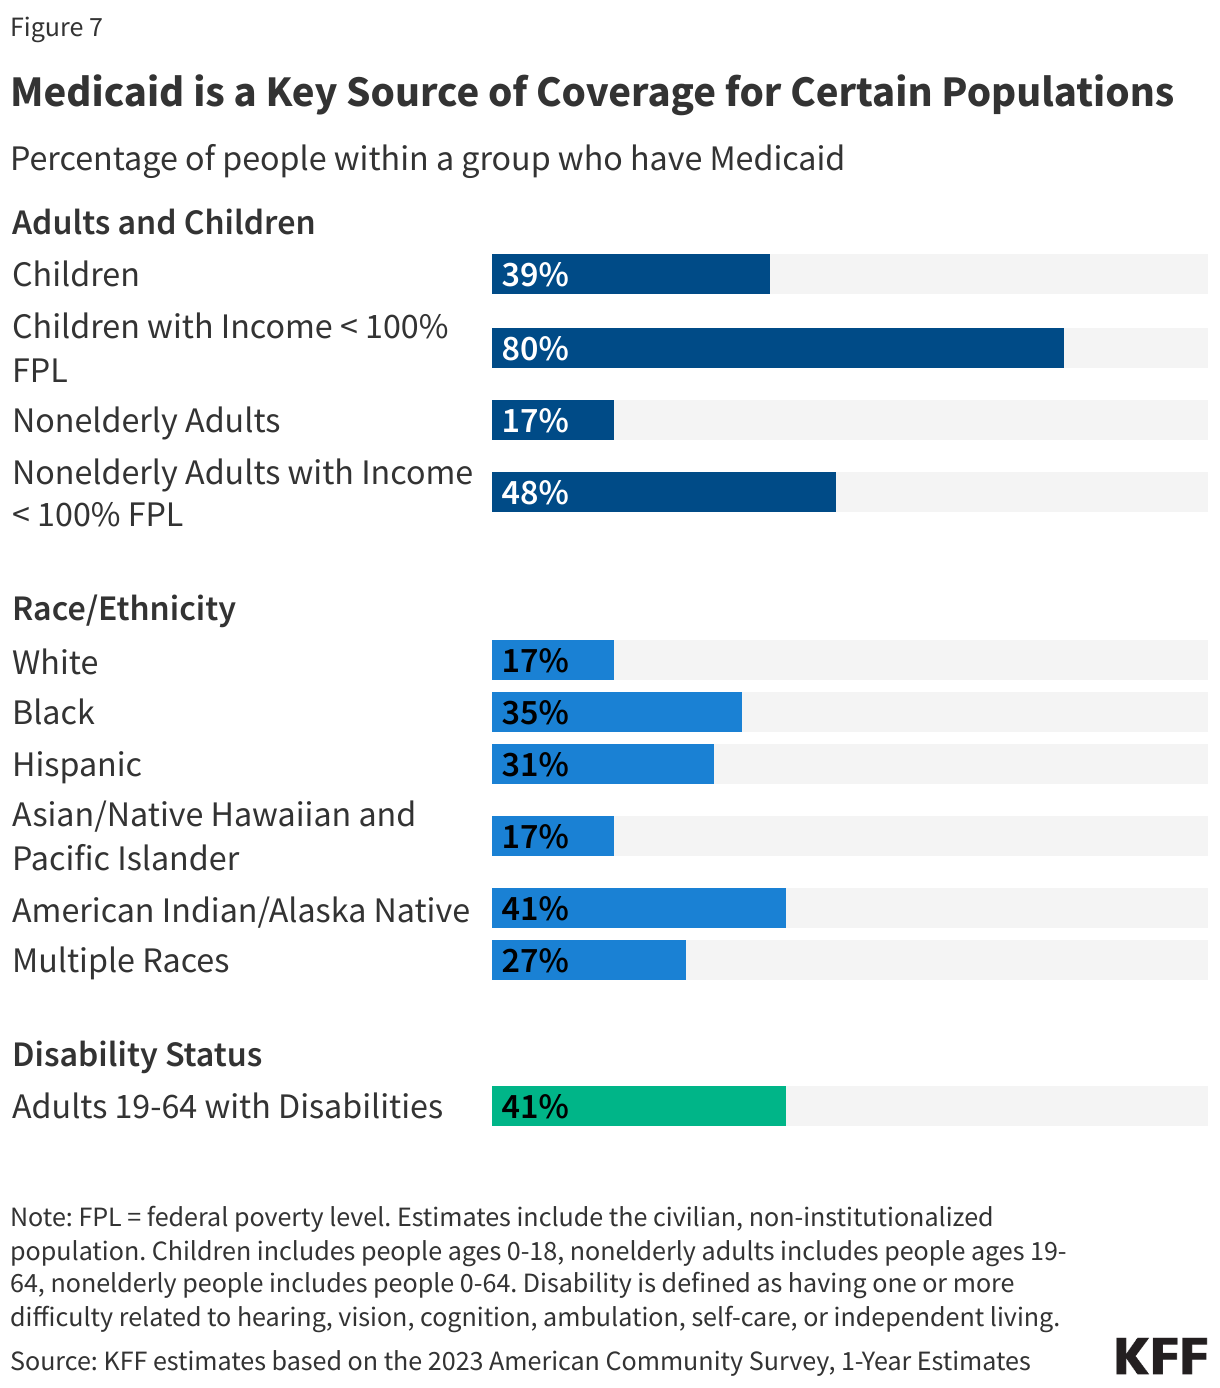
While Medicaid covers 1 in 5 people living in the United States, Medicaid is a particularly significant source of coverage for certain populations. In 2023, Medicaid covered 4 in 10 children, 8 in 10 children in poverty, 1 in 6 nonelderly adults, and 6 in 10 nonelderly people in poverty. Relative to White children and adults, Medicaid covers a higher share of Black, Hispanic, and American Indian or Alaska Native (AIAN) children and adults. Medicaid covers over 1 in 3 people with disabilities overall (4 in 10 people with disabilities ages 19-64), who are defined as having one or more difficulty related to hearing, vision, cognition, ambulation, self-care, or independent living (Figure 7).
Medicaid provides coverage for a number of special populations. For example, Medicaid covers 41% of all births in the United States, 42% of children with special health care needs, 5 in 8 nursing home residents, 29% of non-elderly adults with any mental illness, and 40% of non-elderly adults with HIV. Medicaid pays Medicare premiums and often provides wraparound coverage for services not covered by Medicare (like most long-term care) for nearly 1 in 5 Medicare beneficiaries (13 million). Medicaid is a key source of coverage for individuals experiencing homelessness and those transitioning out of carceral settings, particularly in states that have adopted the Medicaid expansion.
Among the non-elderly covered by Medicaid, nearly half are children under age 19, 6 in 10 are people of color, 57% are female, and three-quarters are in a family with a full- or part-time worker. Even though most adult Medicaid enrollees are working, many do not have an offer of employer-sponsored coverage, or it is not affordable.
What Benefits Are Covered by Medicaid?
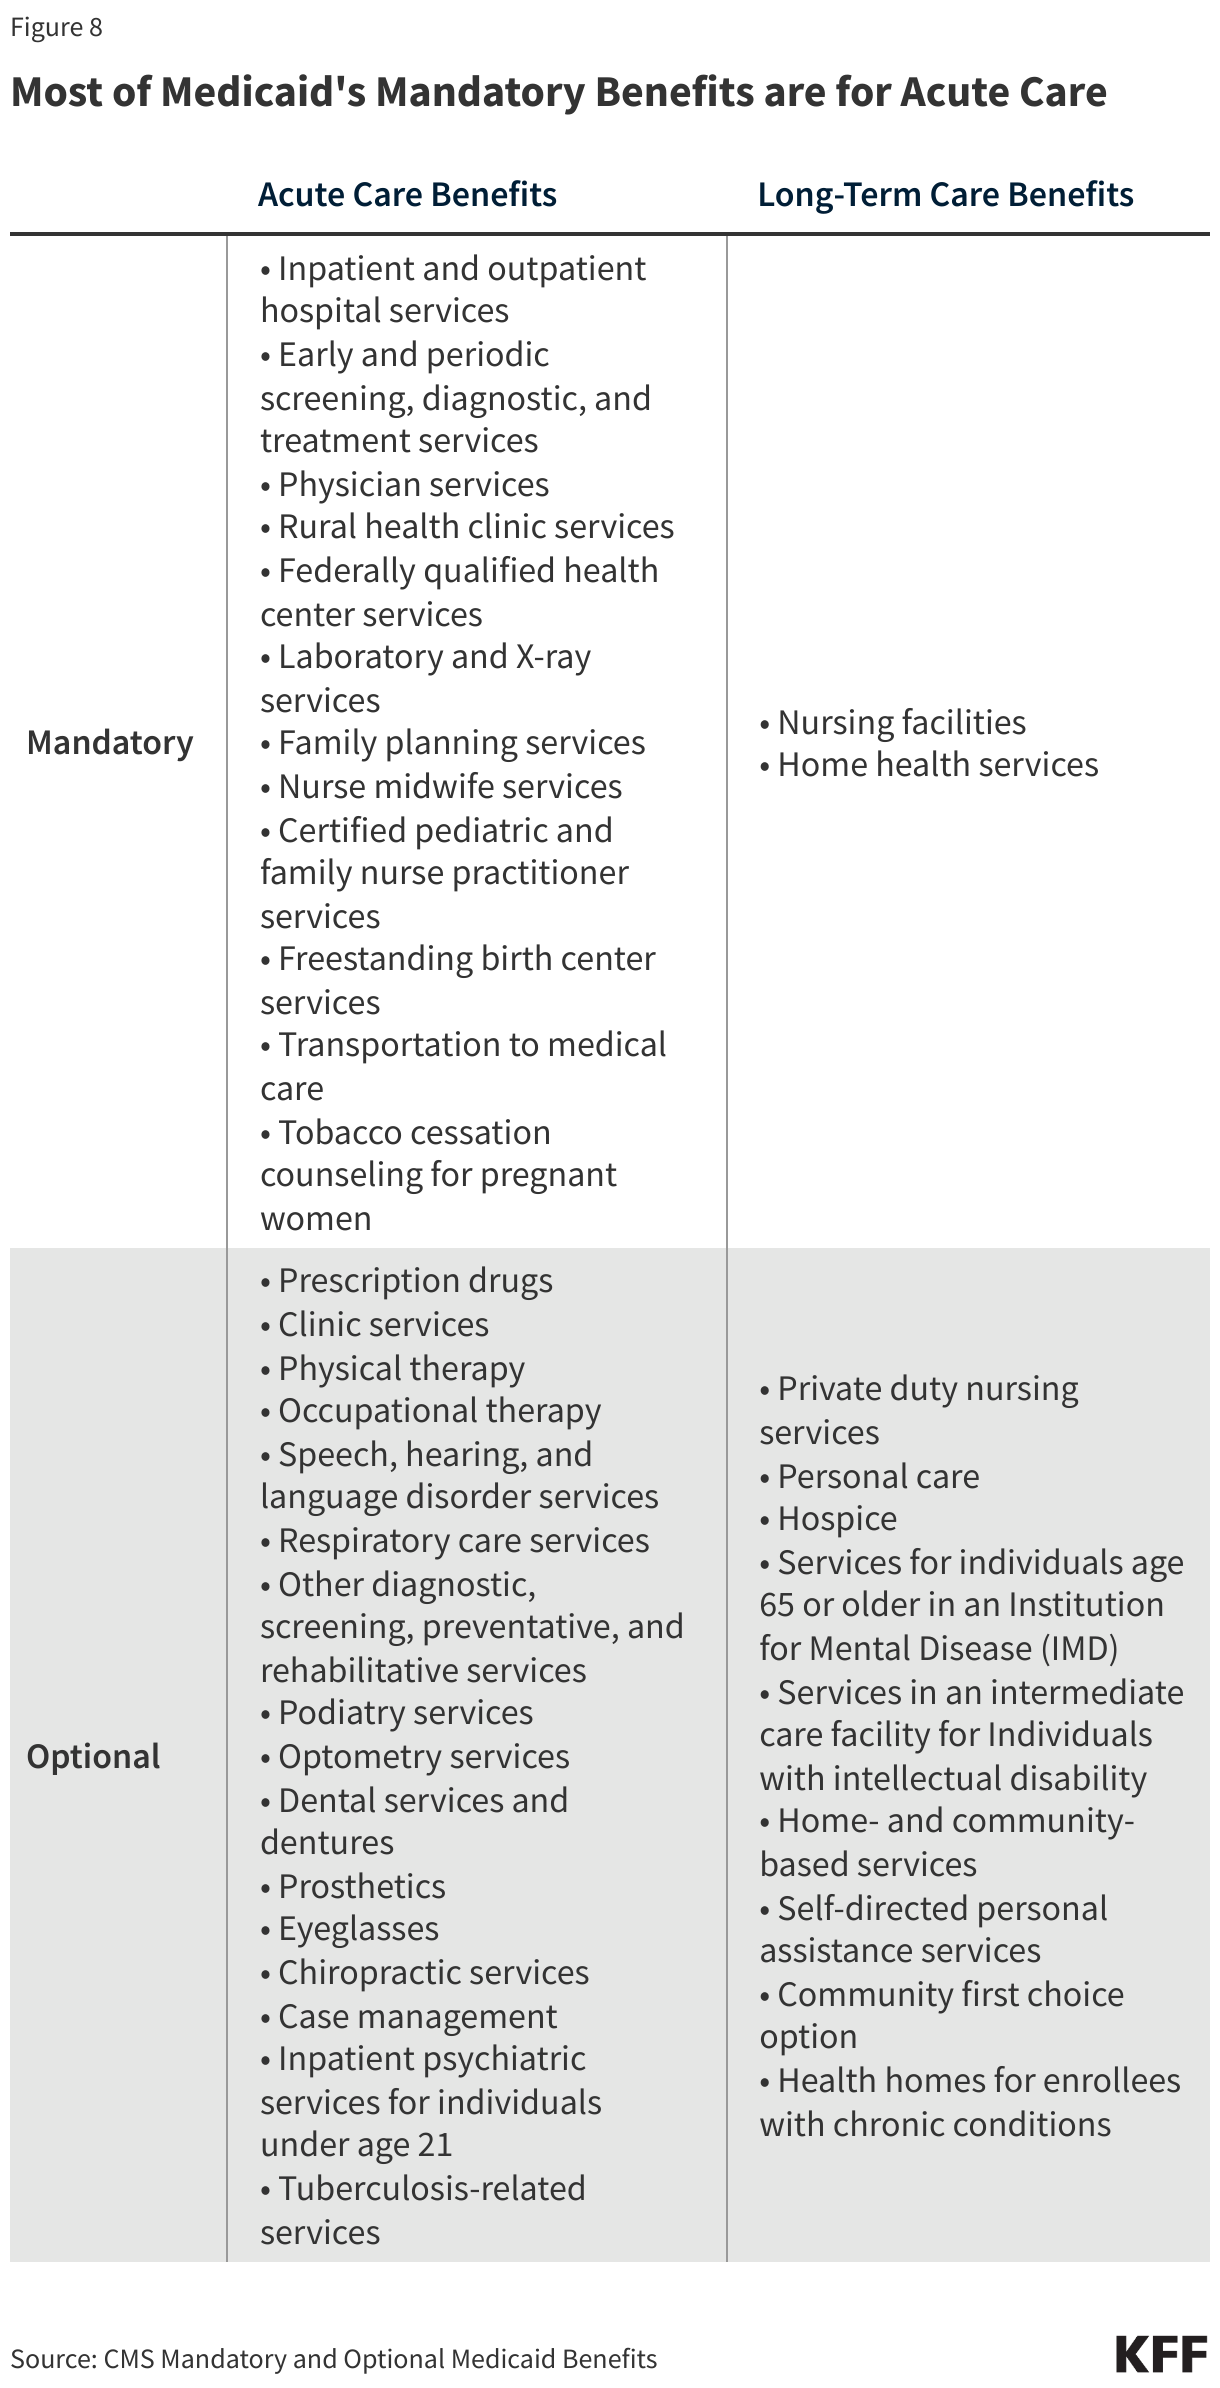
Medicaid covers a broad range of services to address the diverse needs of the populations it serves. In addition to covering the services required by federal Medicaid law, all states elect to cover at least some services that are not mandatory (Figure 8). All states cover prescription drugs, and most states cover physical therapy, eyeglasses, and dental care. Medicaid provides comprehensive benefits for children, known as Early Periodic Screening Diagnosis and Treatment (EPSDT) services. EPSDT is especially important for children with disabilities because it allows children access to a broader set of benefits to address complex health needs than what is traditionally covered by private insurance. Unlike commercial health insurance and Medicare, Medicaid also covers non-emergency medical transportation, which helps enrollees get to appointments, and long-term care, including nursing home care and many home care services (also known as home and community-based services, or HCBS). Coverage for long-term care is mandatory for nursing facilities, but most coverage of home care is optional. In recent years, states have expanded coverage of behavioral health services and benefits to help enrollees address social determinants of health (SDOH) like nutrition or housing.
What Long-term Care (LTC) is Covered by Medicaid?
Most people age 65 and older and many people under age 65 with disabilities have Medicare, but Medicare does not cover most LTC; instead, Medicaid is the primary payer for LTC. LTC encompasses the broad range of paid and unpaid medical and personal care services that assist with activities of daily living (such as eating, bathing, and dressing) and instrumental activities of daily living (such as preparing meals, managing medication, and housekeeping). They are provided to people who need such services because of aging, chronic illness, or disability. These services include nursing facility care, adult daycare programs, home health aide services, personal care services, transportation, and supported employment. They may be provided over several weeks, months, or years, depending on an individual’s health care coverage and level of need. There have been longstanding challenges finding enough workers to provide LTC for all people who need such services, and the COVID-19 pandemic exacerbated those issues considerably. As the population ages and advances in medicine and technology enable people with serious disabilities to live longer, the number of people in need of LTC is expected to grow.
In 2024, the median annual costs of care in the U.S. were $127,750 for a private room in a nursing home, $70,800 for an assisted living facility, and $77,792 for a home health aide. Medicare provides home health and skilled nursing facility care under specific circumstances, but the Medicare benefit is considered “post-acute” care and generally not available for people needing services on an ongoing basis. Medicaid plays a key role in access to LTC for people who qualify because LTC costs are difficult for most people to afford when paying out-of-pocket. In some cases, people only qualify for Medicaid after exhausting their savings on the costs of LTC. In 2023, Medicaid paid 61% of the $459 billion spent on LTC in the U.S. (Figure 9).
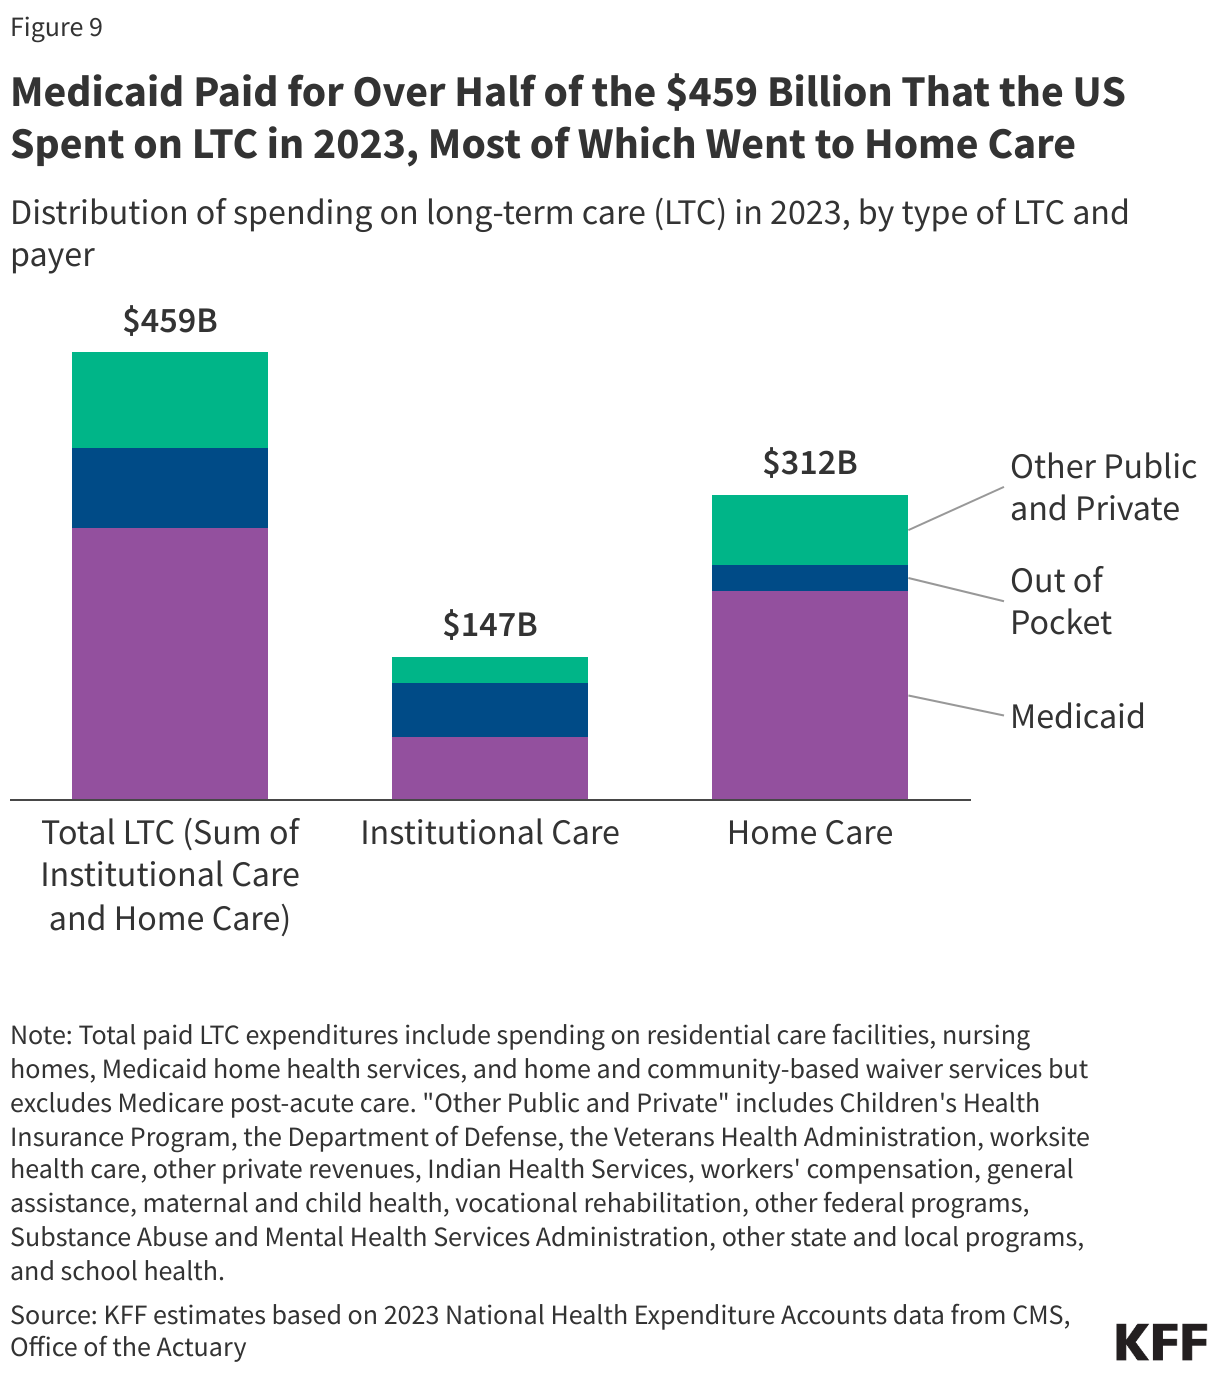
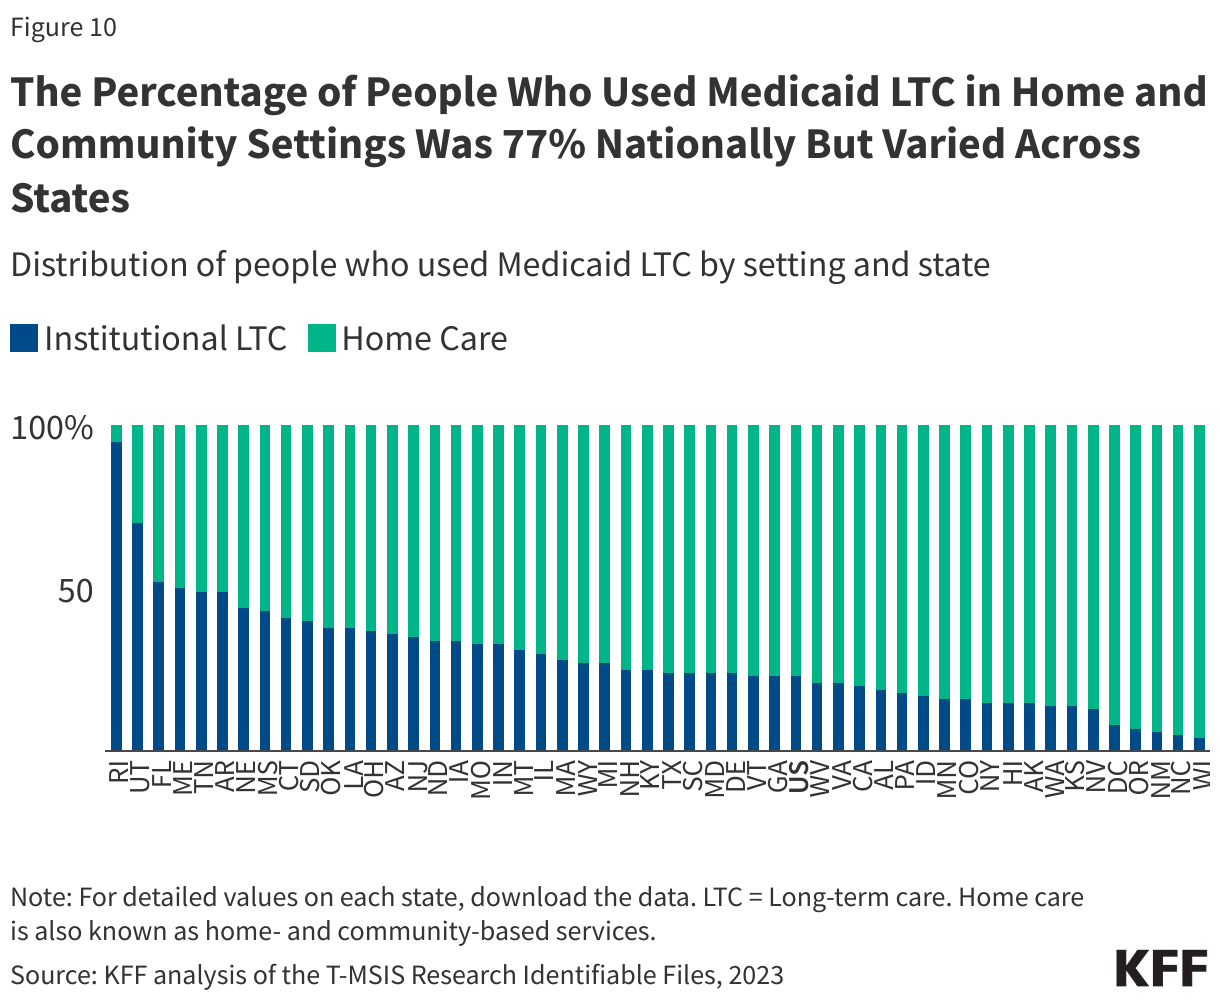
LTC may be provided in various settings broadly categorized as institutional or non-institutional. Institutional settings include nursing facilities and intermediate care facilities for people with intellectual disabilities. Services provided in non-institutional settings are known as home care (also known as home and community-based services, or HCBS), and these settings may include a person’s home, adult day care centers, assisted living settings, and group homes. Federal Medicaid statutes require states to cover institutional LTC and home health, but nearly all home care is optional. Even without a mandate to cover home care, Medicaid LTC spending has shifted from institutional to non-institutional settings over time. In 2023, most spending for LTC in the U.S. was for home care (Figure 9). That shift reflects beneficiary preferences for receiving care in non-institutional settings and requirements for states to provide services in the least restrictive setting possible stemming from the Olmstead decision. In 2023, there were 6.3 million people who used Medicaid LTC, of which 4.9 million (77%) used home care and 1.4 million (23%) used institutional care (Figure 10). While overall, over three-quarters of people who used Medicaid LTC exclusively used home care services, the share varied across states (Figure 10). To qualify for coverage of LTC under Medicaid, people must meet state-specific eligibility requirements regarding their levels of income, wealth, and functional limitations.
How Much Does Medicaid Spend and on What?
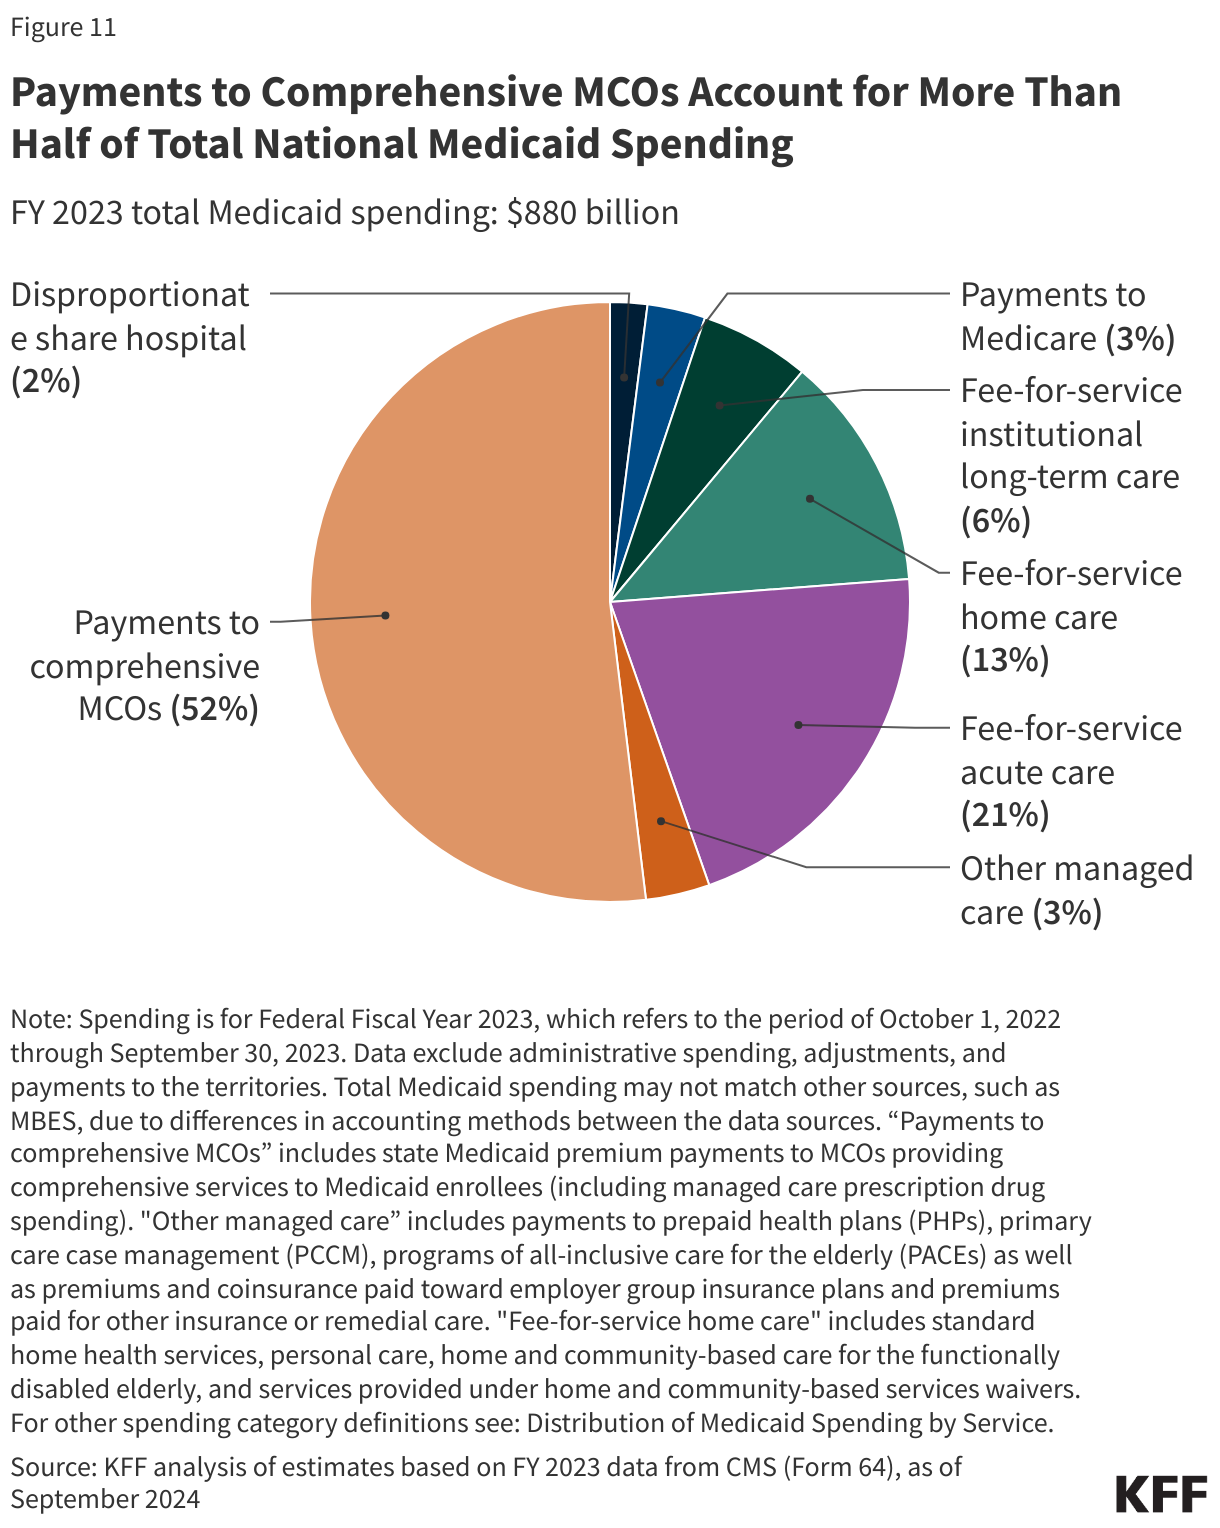
Managed care is the dominant delivery system for Medicaid enrollees with 75% of Medicaid beneficiaries enrolled in comprehensive managed care organizations (MCOs). Medicaid MCOs provide comprehensive acute care and, in some cases, LTC to Medicaid beneficiaries and are paid a set per member per month payment for these services. In FFY 2023, payments to managed care and health plans accounted for the largest share (55%) of Medicaid spending, with capitated payments to comprehensive MCOs accounting for 52% of Medicaid spending and payments to other Medicaid managed care (e.g., primary care case management (PCCM) arrangements or specialty plans) accounting for another 3% (Figure 11). Smaller shares of total Medicaid spending in FFY 2023 were for fee-for-service acute care (21%), fee-for-service LTC (19%), Medicaid spending for Medicare premiums on behalf of enrollees who also have Medicare (3%), and disproportionate share hospital (DSH) payments (2%).
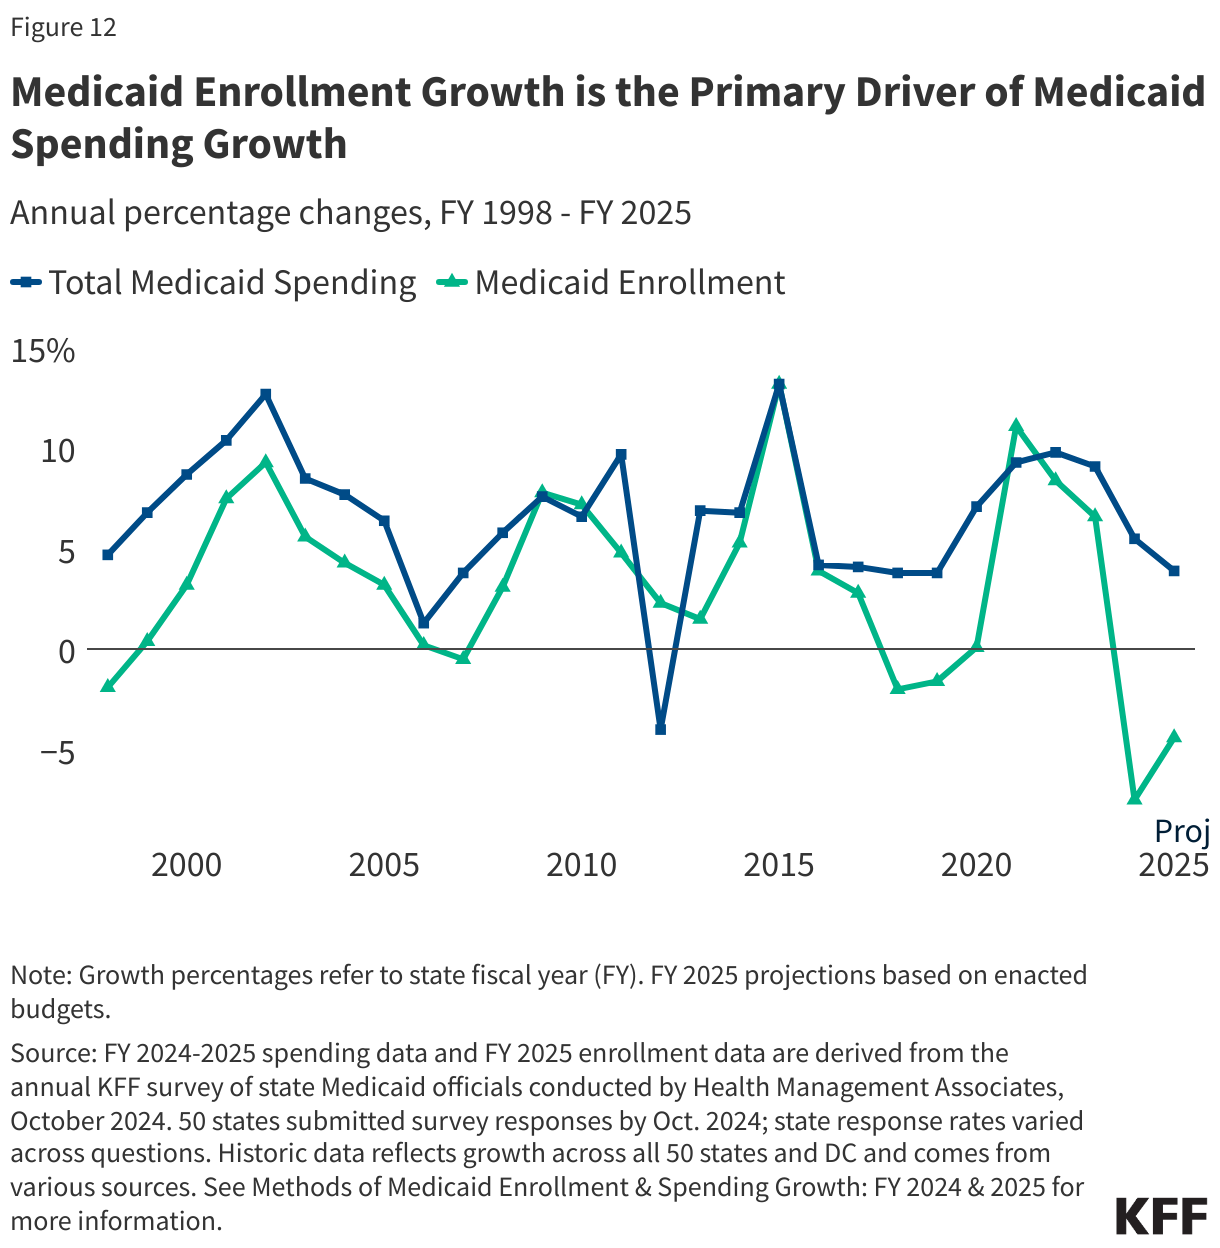
Medicaid spending is driven by multiple factors, including the number and mix of enrollees, their use of health care and long-term care, the prices of Medicaid services, and state policy choices about benefits, provider payment rates, and other program factors. During economic downturns, enrollment in Medicaid grows, increasing state Medicaid costs while state tax revenues are declining. Due to the federal match, as spending increases during economic downturns, so does federal funding. During the pandemic-induced recession and the two economic downturns prior to the pandemic, Congress enacted legislation that temporarily increased the federal share of Medicaid spending to provide increased support for states to help fund Medicaid. High enrollment growth rates, tied first to the Great Recession, then ACA implementation, and later the pandemic, were the primary drivers of total Medicaid spending growth over the last two decades (Figure 12).
How Much Does Medicaid Spending Vary Across Enrollee Groups and States?
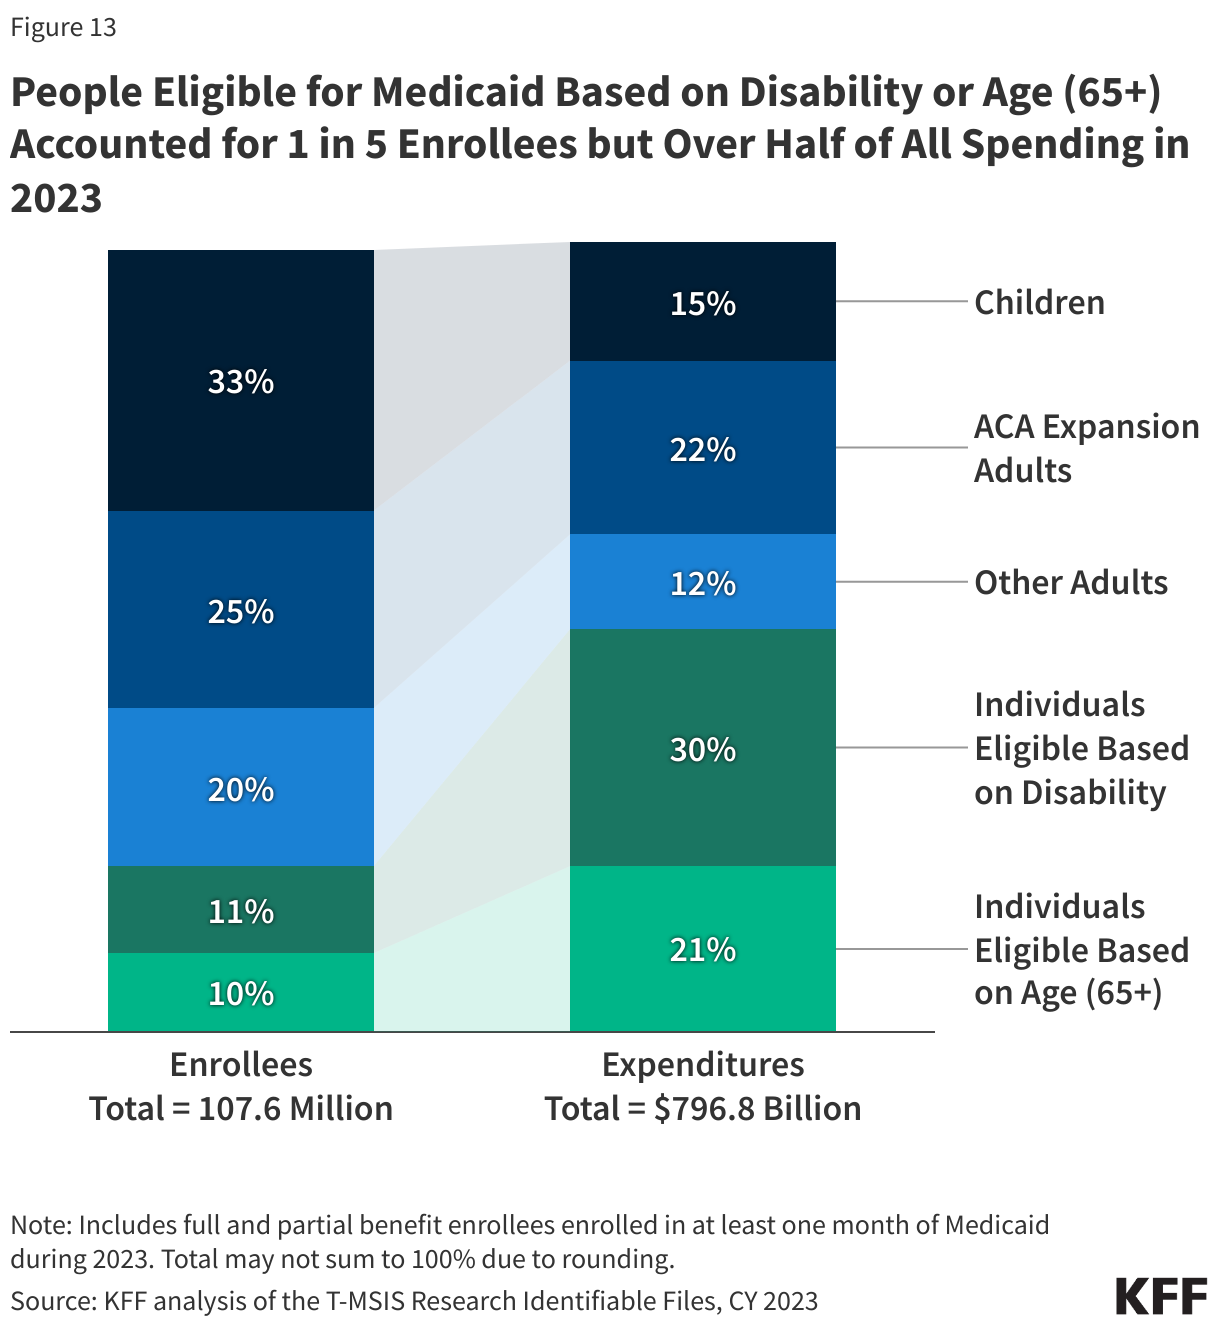
People eligible based on being age 65 or older or based on a disability comprise about 1in 5 enrollees but account for more than half of Medicaid spending, reflecting high health care needs and in many cases, use of LTC (Figure 13).
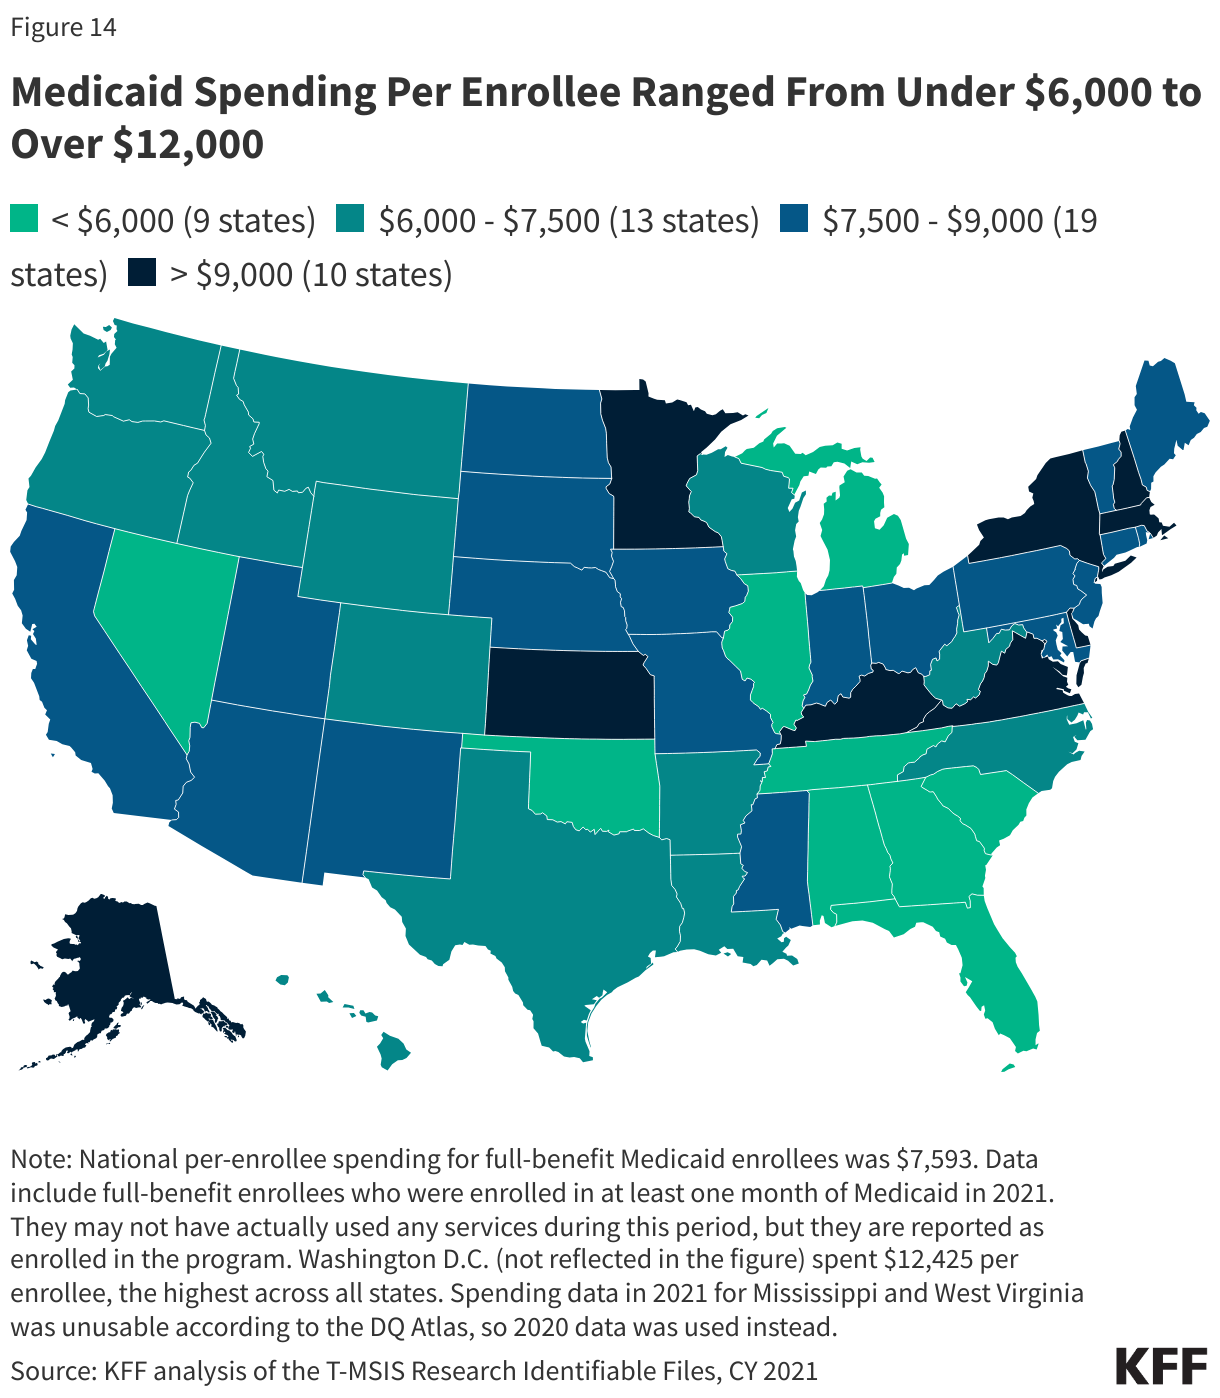
Across the states, spending per full-benefit enrollee ranged from a low of $4,780 in Alabama to $12,295 in the District of Columbia in 2023. Variation in spending across the states reflects considerable flexibility for states to design and administer their own programs – including what benefits are covered and how much providers are paid — and variation in the health and population characteristics of state residents. Within each state, there is also substantial variation in the average costs for each eligibility group, and within each eligibility group, per-enrollee costs may vary significantly, particularly for individuals eligible based on disability (Figure 14).
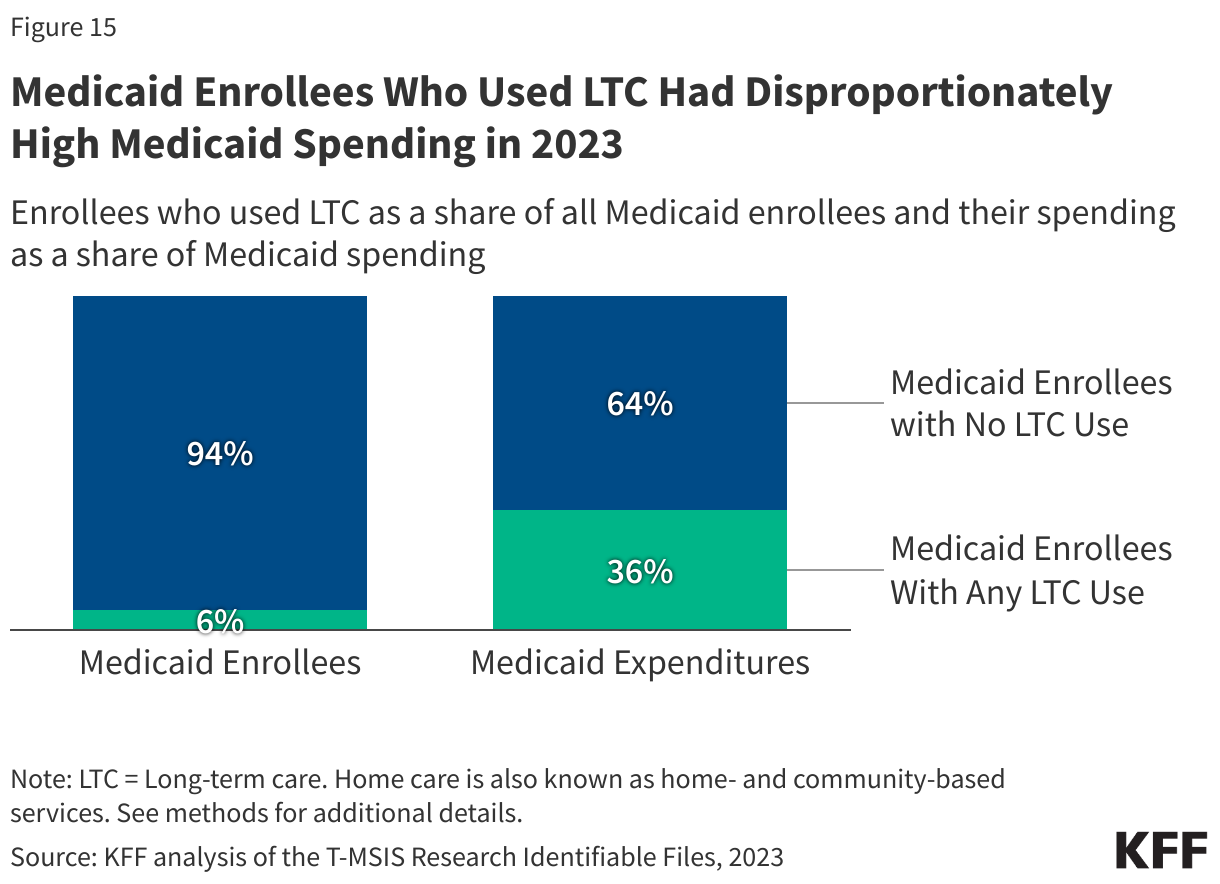
In 2023, people who used Medicaid LTC comprised 6% of Medicaid enrollment but 36% of federal and state Medicaid spending (Figure 15). High per-person Medicaid spending among enrollees who use LTC likely reflects the generally high cost of LTC and more extensive health needs among such groups that lead to higher use of other health care services and drugs as well.
How Are Medicaid Services Delivered?
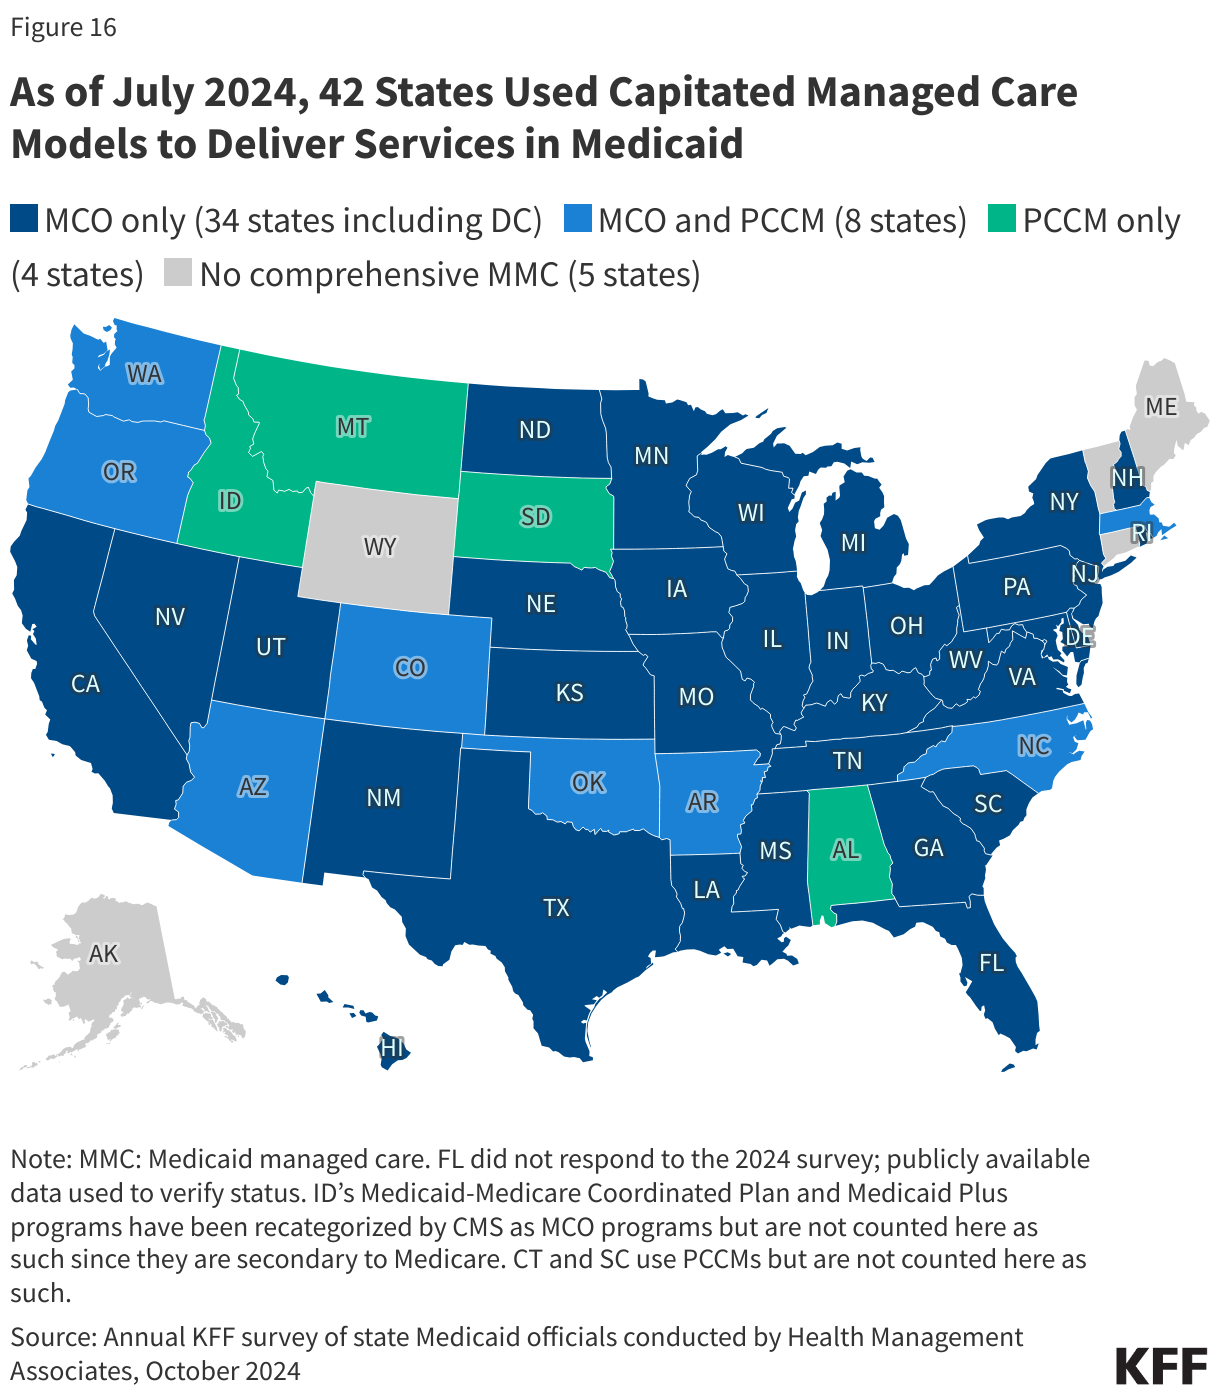
As of July 2024, 42 states (including Washington, D.C.) contract with comprehensive, risk-based managed care plans – often administered by private insurance companies – to provide care to at least some of their Medicaid beneficiaries (Figure 16). Medicaid MCOs provide comprehensive acute care (i.e., most physician and hospital services) and, in some cases, LTC to Medicaid beneficiaries and are paid a set per member per month payment for these services. Medicaid MCOs represent a mix of private for-profit, private non-profit, and government plans. States have increased their reliance on MCOs with the aim of improving access to certain services, enhancing care coordination and management, and making future costs more predictable. While the shift to MCOs has increased budget predictability for states, the evidence about the impact of managed care on access to care, costs, and outcomes is both limited and mixed. Children and adults are more likely to be enrolled in MCOs than adults aged 65 and older and people eligible because of a disability; however, states are increasingly including beneficiaries with complex needs in MCOs. States are also increasingly leveraging Medicaid MCOs to help identify and address social determinants of health and to reduce health disparities.
What Is Known About Access in Medicaid?
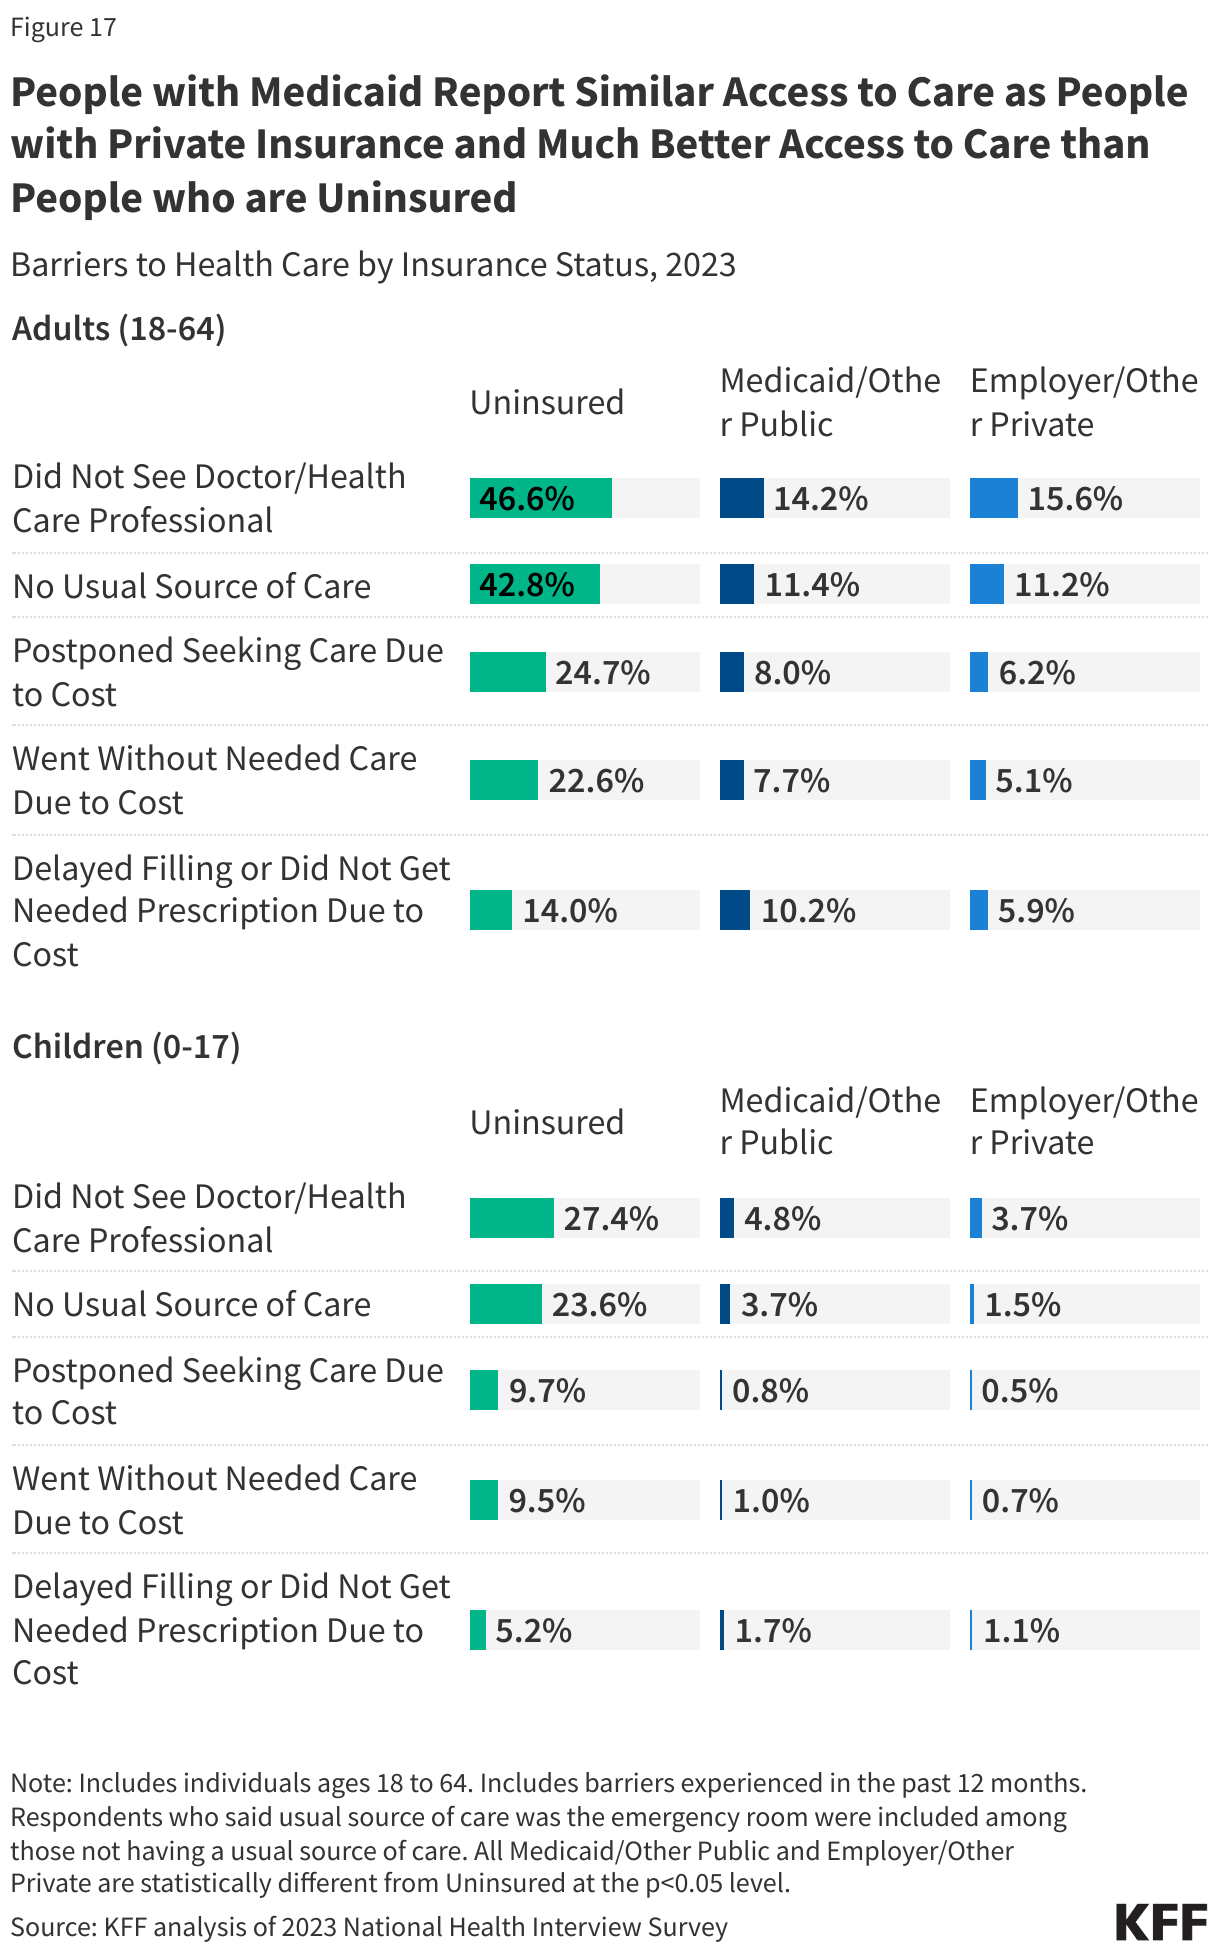
A large body of research shows that Medicaid enrollees have substantially better access to care than people who are uninsured (who are also primarily low-income) and are less likely to postpone or go without needed care due to cost. Key measures of access to care and satisfaction with care among Medicaid enrollees are generally comparable to rates for people with private insurance (Figure 17). Given Medicaid enrollees have low incomes, federal rules include protections to limit out-of-pocket costs that can help improve access. A 2023 KFF Survey of Consumer Experiences with Health Insurance found Medicaid enrollees report fewer cost-related problems compared to those with Marketplace or employer coverage. While most Medicaid enrollees will continue to be protected against large out-of-pocket costs, the tax and spending law newly requires states to impose cost sharing of up to $35 on certain services on Medicaid expansion adults who have incomes 100% - 138% FPL.
Longstanding research shows that Medicaid eligibility during childhood is associated with positive effects on health (including reduced avoidable hospitalizations and mortality) and impacts beyond health, such as improved long-run educational attainment. Early and updated research findings show that state Medicaid expansions to low-income adults are associated with increased access to care, increased economic security, improved self-reported health status, and other outcomes including increased early-stage cancer diagnosis rates, lower mortality rates for certain conditions (e.g., cancer, cardiovascular disease, liver disease), decreased maternal mortality, improved treatment management for conditions (e.g., diabetes, HIV), and improved outcomes related to substance use disorders. Gaps in access to certain providers (e.g., psychiatrists and dentists) are an ongoing challenge in Medicaid that may reflect system-wide problems, but may be exacerbated by provider shortages in low-income communities, Medicaid’s lower physician payment rates, and lower Medicaid physician participation compared with private insurance. In 2021, MACPAC found physicians were less likely to accept new Medicaid patients (74%) than those with Medicare (88%) or private insurance (96%), but these rates may vary by state, provider type, and setting. Medicaid acceptance was much higher where physicians practiced in community health centers, mental health centers, non-federal government clinics, and family clinics compared to the average for all settings. Provider participation rates may contribute to findings that Medicaid enrollees may experience more difficulty obtaining health care than those with private insurance. A 2023 KFF Survey of Consumers found Medicaid enrollees report more problems with prior authorization and provider availability compared to people with other insurance types.
How Do Medicaid Demonstration Waivers Work?
Section 1115 demonstration waivers offer states the ability to test new approaches in Medicaid that differ from what is required by federal statute, if CMS determines that such proposals are “likely to assist in promoting the objectives of the Medicaid program.” Nearly all states have at least one active Section 1115 waiver and some states have multiple 1115 waivers. Section 1115 waivers have been used over time and generally reflect priorities identified by the states as well as changing priorities from one presidential administration to another (Figure 18). Waivers have been used to expand coverage or benefits, change policies for existing Medicaid populations (e.g., testing premiums or other eligibility requirements), modify delivery systems, restructure financing or authorize new payments (e.g., supplemental payments or incentive-based payments), as well as make other program changes.
Activity from the first Trump administration and the Biden administration tested how 1115 waivers can be used to advance administrative priorities and also tested the balance between states’ flexibility and discretion by the federal government. The first Trump administration’s Section 1115 waiver policy emphasized work requirements and other eligibility restrictions, payment for institutional behavioral health services, and capped financing. The Biden administration withdrew waiver approvals with work requirements, phased out approval of premium requirements, and instead encouraged states to propose waivers that expand coverage, reduce health disparities, advance “whole-person care,” and improve access to behavioral health care. Areas of focus during the Biden administration included leveraging Medicaid to address health-related social needs (including housing instability, homelessness, nutrition insecurity) and to provide health care to individuals transitioning from incarceration back into the community. Several states also received approval to provide multi-year continuous Medicaid coverage for children. Recent actions from the new Trump administration could signal efforts to curtail waivers related to social determinants of health, continuous eligibility and to limit 1115 waiver financing tools and flexibility. In addition, several states are seeking approval for work requirements waivers. Although the tax and spending reconciliation law now includes a national work requirement, some states may continue to pursue waivers to implement work requirements prior to January 1, 2027 when the national requirement goes into effect.
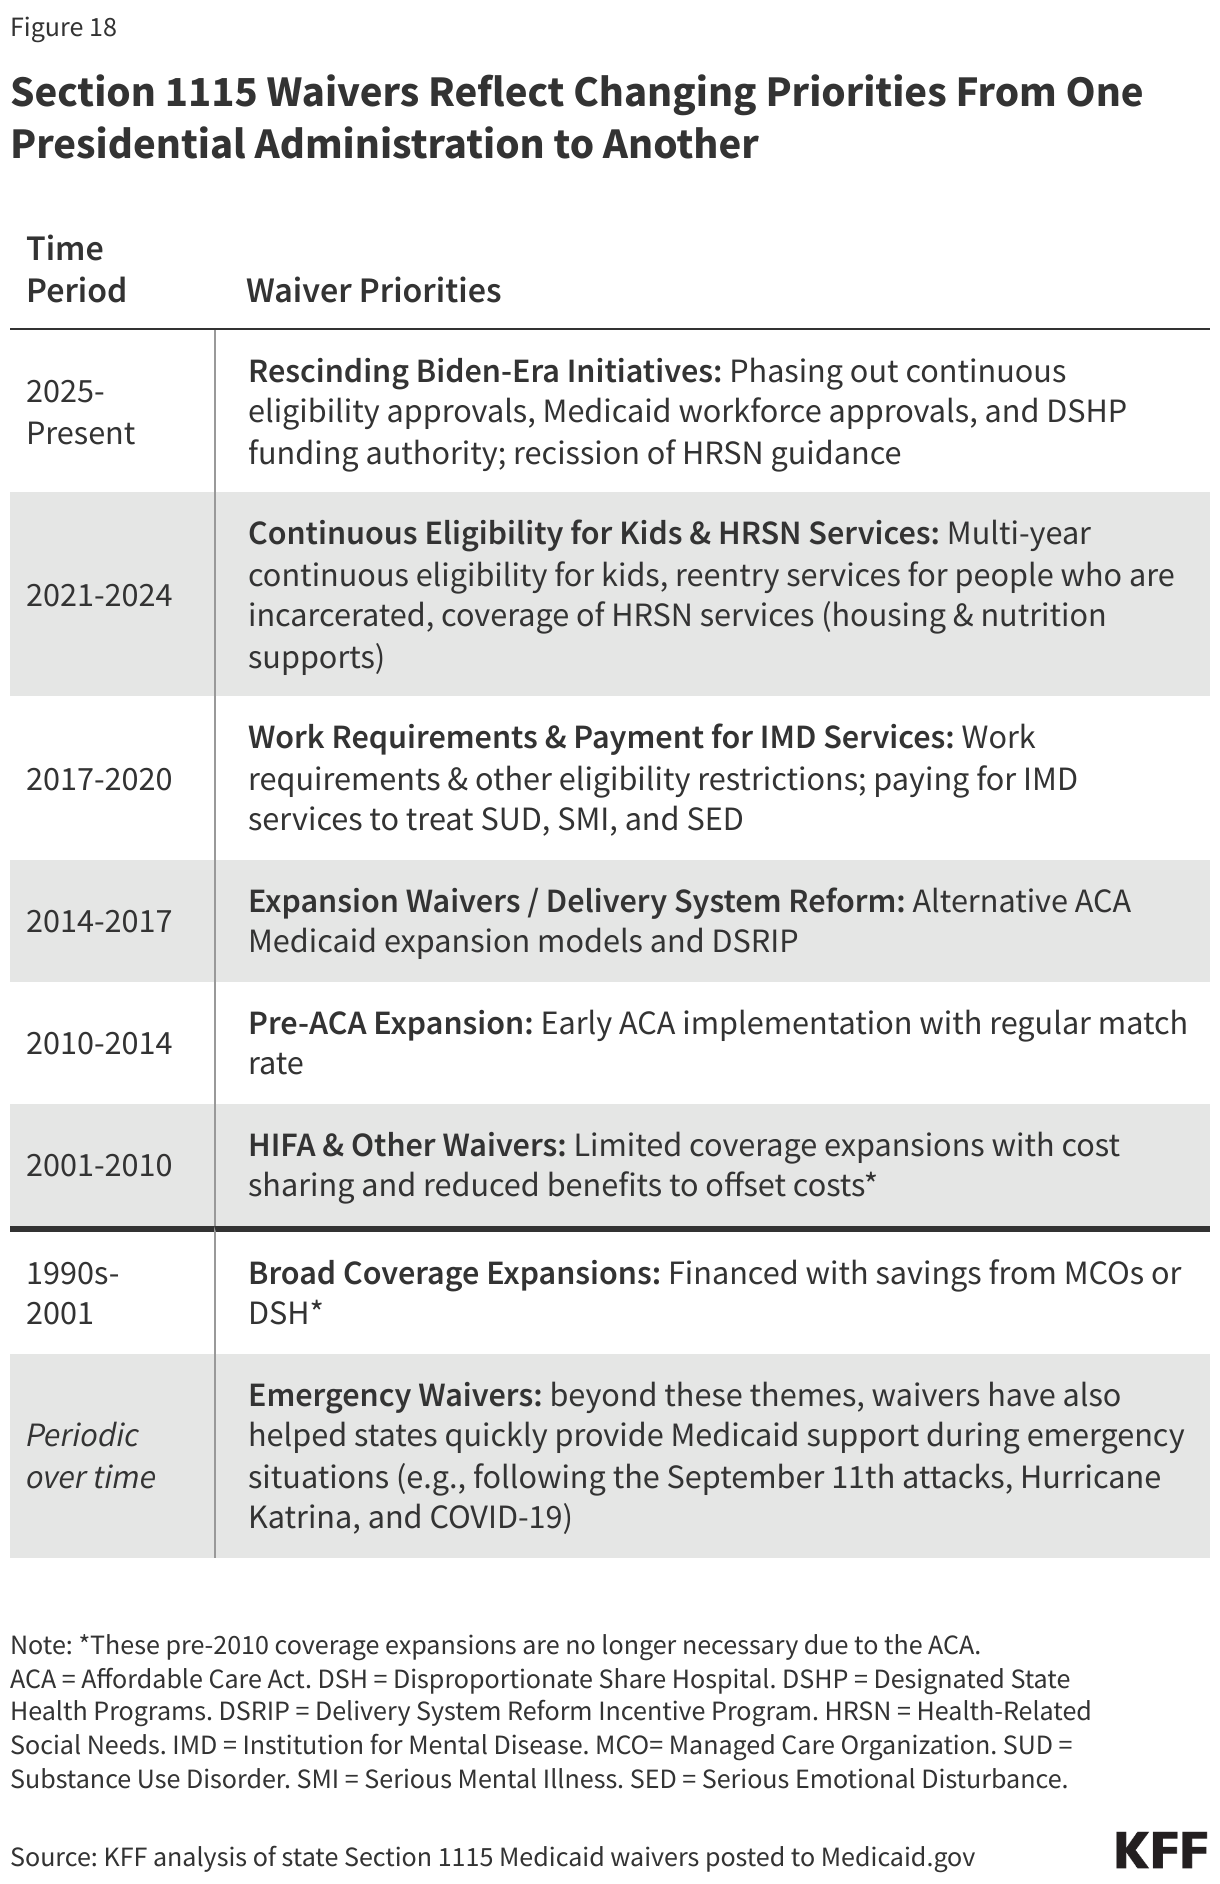
Various types of waivers and other emergency authorities can also be used to respond to emergencies. These authorities can help expand Medicaid capacity and focus on specific services, providers, or groups of enrollees that may be particularly impacted. During the COVID-19 pandemic, all 50 states and Washington, D.C. received approval to make changes using emergency authorities to facilitate access to care by expanding telehealth, eligibility, benefits and help address workforce issues for home- and community-based services.
Future Outlook
Looking to the future, Medicaid faces a number of challenges, including:
- How will the new work requirements, eligibility and cost sharing changes affect Medicaid enrollment and access to care, particularly for adults covered through the Medicaid expansion?
- What impact will the Medicaid changes have on the number of people without health insurance?
- How will states respond to federal Medicaid spending cuts and limits on their ability to use provider taxes to help finance the non-federal share of Medicaid spending?
- How will the cuts in Medicaid spending and enrollment affect health care providers (including rural providers) and the broader health care system? To what extent will a new temporary rural health fund totaling $50 billion blunt some of the effects of the cuts?
- Will administrative actions and federal funding cuts for Medicaid as well as broader federal changes in immigration policy affect Medicaid payment rates for long-term care and the long-term care workforce?
- Will Congress move to reverse some of the Medicaid cuts before they go into effect?
Policy changes to Medicaid have implications for the roughly 80 million people who rely on the program for health coverage, state and federal budgets and spending, and health care providers, including nursing facilities and home care providers. As the source of nearly one fifth of total health care spending, these changes will also have implications for the broader health care system. Changes in Medicaid enrollment will also affect overall coverage trends. Declines in Medicaid enrollment can be expected to increase the number of people who are uninsured, jeopardizing improvements in the affordability of and access to care for potentially millions of people.
Resources
- 10 Things to Know About Medicaid
- Medicaid: What to Watch in 2025 | KFF
- Medicaid Financing: The Basics
- 10 Things to Know About Medicaid Managed Care
- 10 Things About Long-Term Services and Supports (LTSS)
- 50-State Medicaid Budget Survey Archives
- 50-State Medicaid Eligibility Survey Archives
- 50-State Survey Archives: Medicaid HCBS and Eligibility Based on Disability or Age 65+
- Status of State Medicaid Expansion Decisions: Interactive Map
- Medicaid Waiver Tracker: Approved and Pending Section 1115 Waivers by State
- Allocating CBO’s Estimates of Federal Medicaid Spending Reductions Across the States: Enacted Reconciliation Package | KFF
- Health Provisions in the 2025 Federal Budget Reconciliation Law
- Implementation Dates for 2025 Budget Reconciliation Law
Citation
Rudowitz, R., Tolbert, J., Burns, A., Hinton, E., Chidambaram, P., & Mudumala, A., Medicaid 101. In Altman, Drew (Editor), Health Policy 101, (KFF, October 2025) https://www.kff.org/health-policy-101-medicaid/ (date accessed)