KFF designs, conducts and analyzes original public opinion and survey research on Americans’ attitudes, knowledge, and experiences with the health care system to help amplify the public’s voice in major national debates.
The FDA has approved and authorized updated COVID-19 vaccines for the fall, and CDC has recommended them for everyone, ages 6 months and older. This recommendation comes as COVID-19 hospitalizations, and likely cases, are on the rise. The fall will also mark the first time that COVID-19 vaccines will be commercialized – that is, transitioned to the commercial market for their manufacturing, procurement and pricing. Up until this point, the federal government had purchased all COVID-19 vaccines and provided them free of charge to anyone, regardless of insurance coverage or ability to pay.
While the average price paid by the federal government for the most recent COVID-19 booster was about $29/dose, vaccine manufactures have indicated that they will charge $110-$130 per dose, or 3-4 times as much, on the commercial market. This has raised concerns about how those who are uninsured will access COVID-19 vaccines going forward, particularly given the potential for adverse effects on individual and population-level health. While virtually everyone with public and private insurance is guaranteed free access to any CDC recommended vaccine, including for COVID-19, this is not the case for the more than 23 million uninsured non-elderly adults in the United States, a number that may be increasing due to the unwinding of the pandemic-era continuous enrollment policy in Medicaid. Uninsured adults are disproportionately low income, people of color, and in poorer health, including being more likely to be hospitalized for avoidable health conditions and to experience declines in their overall health than those who are insured.
The federal government and vaccine manufactures have announced plans for a temporary approach to support access to the COVID-19 vaccine for uninsured adults. This policy watch provides an overview of how uninsured adults currently access recommended vaccines, how they have accessed COVID-19 vaccines thus far, including what is known about their vaccine uptake, and proposed plans to provide COVID-19 vaccines to uninsured adults this fall and beyond. It does not focus on uninsured and underinsured children who are guaranteed free access to all recommended vaccines through the Vaccines for Children Program.
How do uninsured adults access and pay for recommended vaccines now?
For adults who are uninsured in the United States, there is no guaranteed access to free vaccines recommended for routine use. The federal government does purchase a limited number of recommended vaccines directly for uninsured and other qualifying adults through funding that comes from Section 317 of the Public Health Services Act. Section 317 is a discretionary program, dependent upon annual appropriations from Congress, and its funding is used both for purchasing recommended vaccines and for supporting the nation’s immunization infrastructure. As a discretionary program, funding does not necessarily match need or cost, or take into account the introduction of a new vaccine (such as for COVID-19 or RSV). Because of these limits, some states supplement their Section 317 funds with state funds in order to reach more people. To be eligible to receive free vaccines through the Section 317 program, adults must be uninsured, have no vaccine coverage, or be vaccinated as part of a public health response such as a mass vaccination campaign. Free vaccines are largely distributed through state and local health departments and community health centers. Uninsured adults who are unable to access free vaccines must pay out of pocket for the full cost of the vaccines or receive them on a sliding fee scale at certain safety net providers.
How have uninsured adults accessed COVID-19 vaccines up until this point?
During the COVID-19 pandemic emergency, the federal government spent billions of dollars in emergency funds to purchase COVID-19 vaccines, including boosters, to provide them free of charge to the public. Vaccines were distributed widely, through federal and state public vaccine distribution centers, pharmacies, and health centers, which were instrumental in prioritizing hard to reach communities during this time. In addition, states were given a temporary option to provide Medicaid coverage for COVID-19 vaccines to uninsured individuals and receive 100% federal matching funds to cover the costs of providing care. This coverage option ended when the public health emergency declaration ended in May.
What do we know about uptake of COVID-19 vaccines among uninsured adults?
Among adults between the ages of 18 and 65, and despite COVID-19 vaccines being free to all up until this point, those who are uninsured are much less likely to have been vaccinated compared to those who are insured (54% vs 75%), based on recent KFF polling. This difference in uptake may reflect several factors, including systemic barriers to accessing care among uninsured individuals, different views of vaccination, and other challenges.
What is the ‘Vaccines for Adults’ program proposed by the Biden administration?
The Biden administration has twice proposed to Congress in its annual budget request the creation of a new “Vaccines for Adults” (VFA) program to provide uninsured adults with access to all recommended vaccines, including COVID-19 vaccines, at no cost. Congress has not acted on these proposals. As a result, the administration has proposed a temporary “Bridge Access” program to provide COVID-19 vaccines to uninsured adults on a limited basis (see below).
What is the HHS Bridge Access Program?
To address concerns about COVID-19 vaccine access among uninsured adults this fall, the administration announced a new “Bridge Access Program” earlier this year. It will operate as a “public-private partnership to help maintain uninsured individuals’ access to COVID-19 care at their local pharmacies, through existing public health infrastructure, and at their local health centers.” Financed with $1.1 billion in funds already appropriated during the COVID-19 emergency (funds will be used for both vaccines and treatments), the program is largely managed by the CDC and has two main components:
Vaccines will be purchased through the CDC’s Section 317 program and distributed through that network of local health departments and health centers. The Health Services and Resources Administration will provide additional support to health centers to ensure equitable access to vaccines and treatments.
CDC will partner with three pharmacy chains (CVS, Walgreens, and eTrueNorth) and provide them with a per-dose payment to support vaccine administration costs, as was done during the public health emergency. This component of the program relies on vaccine manufacturers providing COVID-19 vaccines at no cost to uninsured people, as they have announced (see below).
CDC has indicated that vaccines under the program will begin to be available within 48 hours of being recommended by CDC. The program is temporary and will run through December 2024.
Will vaccine manufacturers help provide COVID-19 vaccines to the uninsured?
Many vaccine and drug manufacturers offer patient assistance programs to support those without insurance or with limited means in accessing their products; however, these programs vary in terms of eligibility and application process. Both Pfizer and Moderna have announced that they intend to provide their vaccines at no cost to uninsured individuals, though details are not yet available.
Discussion
During the COVID-19 pandemic emergency, the federal government spent billions of dollars in emergency funds to purchase COVID-19 vaccines, including boosters, to provide free of charge regardless of insurance status or ability to pay. As COVID-19 vaccines enter the commercial market for the first time, uninsured adults will no longer be guaranteed access to these vaccines at no cost. To address this in the short term, the federal government announced a “Bridge Access Program” that relies, in part, on vaccine manufacturers providing free vaccines to uninsured individuals. Still, full details on these efforts are not yet available. And, while participating pharmacies will be required to conduct outreach to underserved communities, ensuring eligible people know about the program will be a challenge. Given that uninsured adults are disproportionately low income and people of color and that COVID-19 vaccine uptake among uninsured adults is already lower than among those with insurance, concerns about cost and lack of awareness about the availability of free vaccines could present additional barriers to vaccination and further exacerbate existing disparities in uptake and health status. Moreover, these temporary approaches do not address access to vaccines beyond COVID-19, such as for flu or RSV, and underscore the broader challenge faced by those who are uninsured in accessing preventive health services.
Medicare Advantage enrollment has grown rapidly in recent years, and in 2023, more than half (51%) of all eligible Medicare beneficiaries are in a Medicare Advantage plan. Most Medicare Advantage enrollees, and most Medicare beneficiaries, live in metropolitan areas. To understand the role of Medicare Advantage in rural areas, this analysis examines trends in enrollment, plan availability and premiums in less populated counties.
Medicare Advantage enrollment is lower, but has grown more rapidly in recent years in rural areas than in metropolitan areas. In 2023, 40% of all eligible Medicare beneficiaries in rural counties are enrolled in a Medicare Advantage plan, nearly four times the share in 2010 (11%). Rural Medicare Advantage enrollees can choose from among 27 plans, on average, which is triple the number of plans available just five years ago. In rural counties, like all areas, most Medicare Advantage enrollees are in a plan that charges no additional premium, other than the Part B premium.
Medicare Advantage in Rural Areas
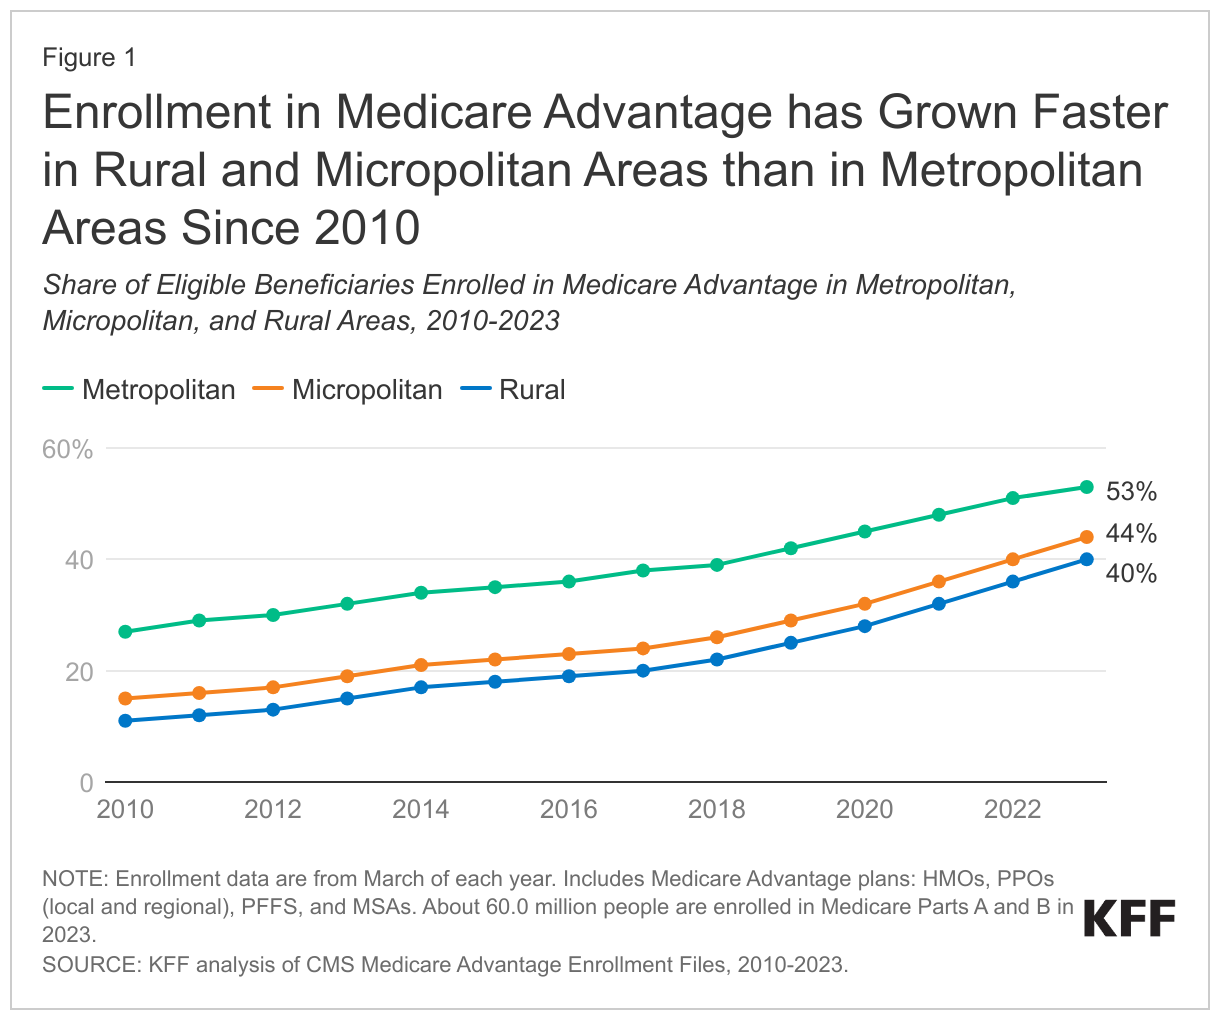
Medicare Advantage enrollment has quadrupled in rural areas since 2010 and reached 40% in 2023.
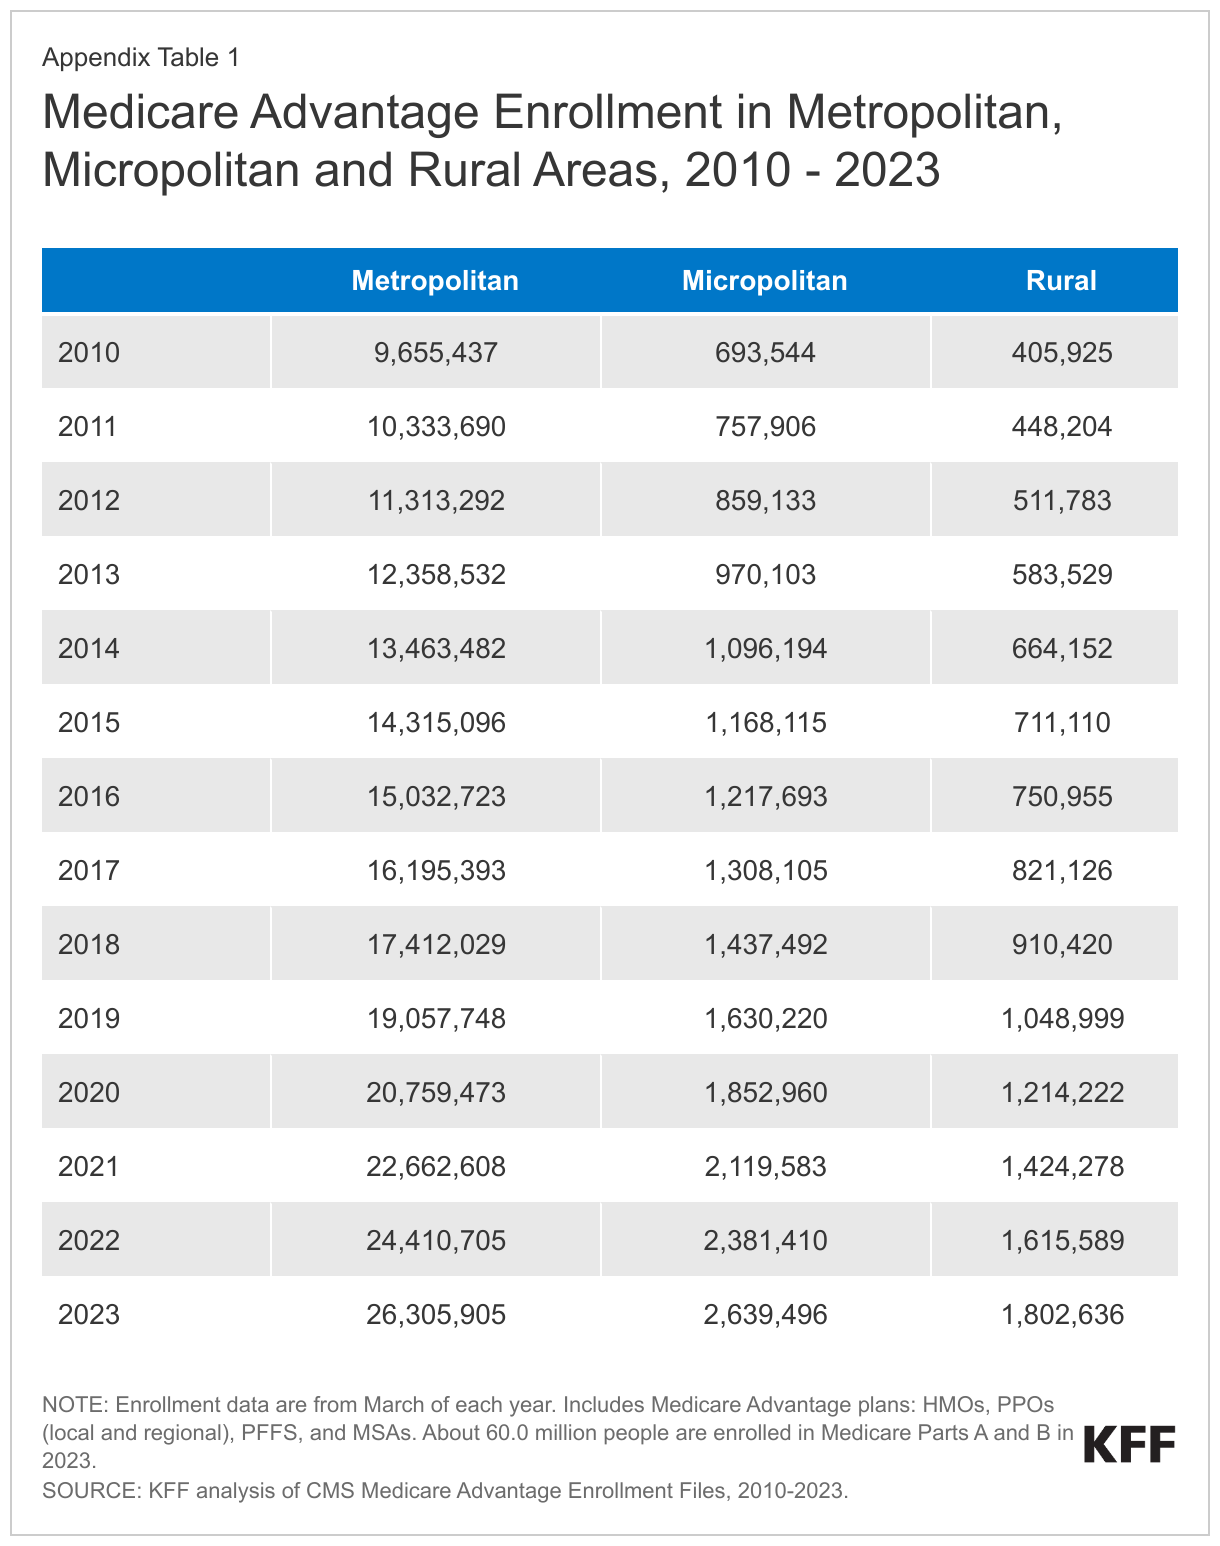
In 2023, a smaller share (40%) of Medicare beneficiaries in rural areas – counties with less than 10,000 people – are enrolled in a Medicare Advantage plan than Medicare beneficiaries in micropolitan (10,000 to 50,000 people) or metropolitan (at least 50,000 people) areas (44% and 53%, respectively). Though Medicare Advantage enrollment is lowest in rural areas, it has grown more rapidly in these counties, nearly quadrupling from 11% of eligible Medicare beneficiaries in 2010 to 40% in 2023. Over the same period, the share of Medicare beneficiaries enrolled in a Medicare Advantage plan in micropolitan areas nearly tripled (from 15% to 44%), and nearly doubled in metropolitan areas (from 27% to 53%).
In 2023, more than 1.8 million Medicare beneficiaries in rural areas are enrolled in a Medicare Advantage plan, more than four times the number enrolled in 2010 (400,000). In metropolitan areas, enrollment increased from 9.7 million in 2010 to 26.3 million in 2023 and in micropolitan areas, enrollment rose from nearly 700,000 in 2010 to 2.6 million in 2023 (Appendix Table 1). The growth in enrollment translates into an average annual increase of 12% in rural areas and 11% in micropolitan areas, compared with 8% in metropolitan areas between 2010 and 2023.
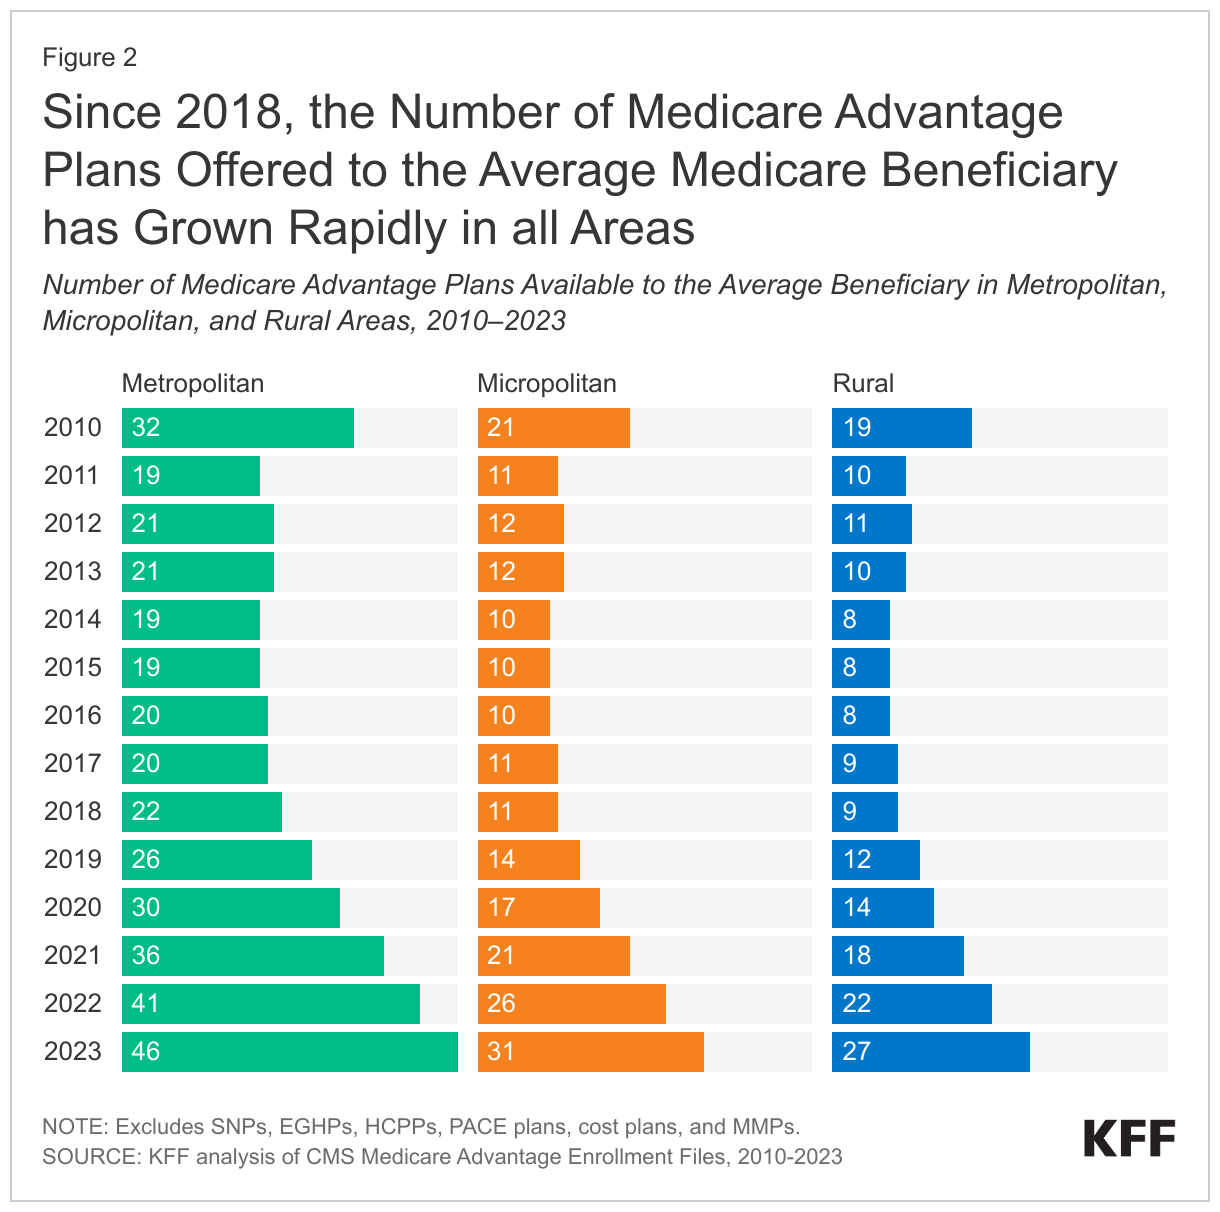
The average Medicare beneficiary living in a rural county can choose among 27 Medicare Advantage plans, triple the number of plans offered five years ago.
Across all areas, the number of Medicare Advantage plans available to the average Medicare beneficiary have risen steadily since 2018, after holding relatively constant in earlier years. In 2023, the average Medicare beneficiary in a rural area has 27 Medicare Advantage plans to choose from, which is three times more than the number of plans available in 2018 (9 plans). This is similar to the growth in micropolitan areas, where the average Medicare beneficiary has access to 31 plans in 2023, compared to 11 plans in 2018. In contrast, the average Medicare beneficiary in a metropolitan area can choose from substantially more plans – 46 in 2023, just over double the number in 2018 (22 plans) (Figure 2).
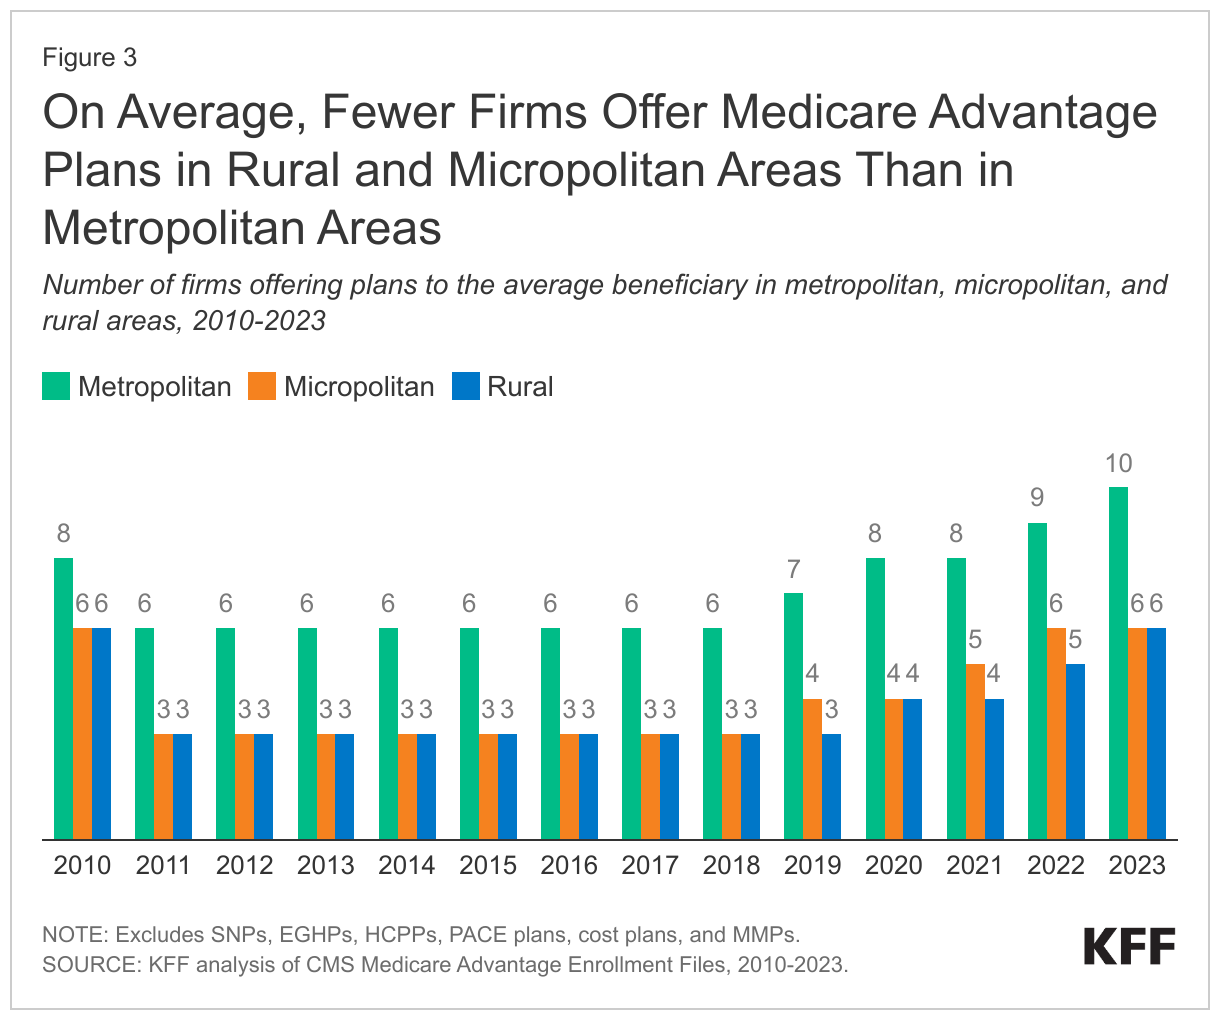
In 2023, the average Medicare beneficiary living in a rural area can choose among Medicare Advantage plans offered by six firms, twice the number of firms offering plans in these counties in 2018.
Since 2018, the average number of firms offering Medicare Advantage plans has increased in all areas. The average Medicare beneficiary in a rural area can choose from plans offered by six firms in 2023, which is double the number of firms offering plans in these areas in 2018 (3 firms). The trend in the number of firms offering plans in micropolitan areas is similar, rising from three in 2018 to six in 2023. The number of firms offering plans has been consistently higher in metropolitan areas than in other geographic areas, rising from six firms in 2018 to ten firms in 2023 (Figure 3).
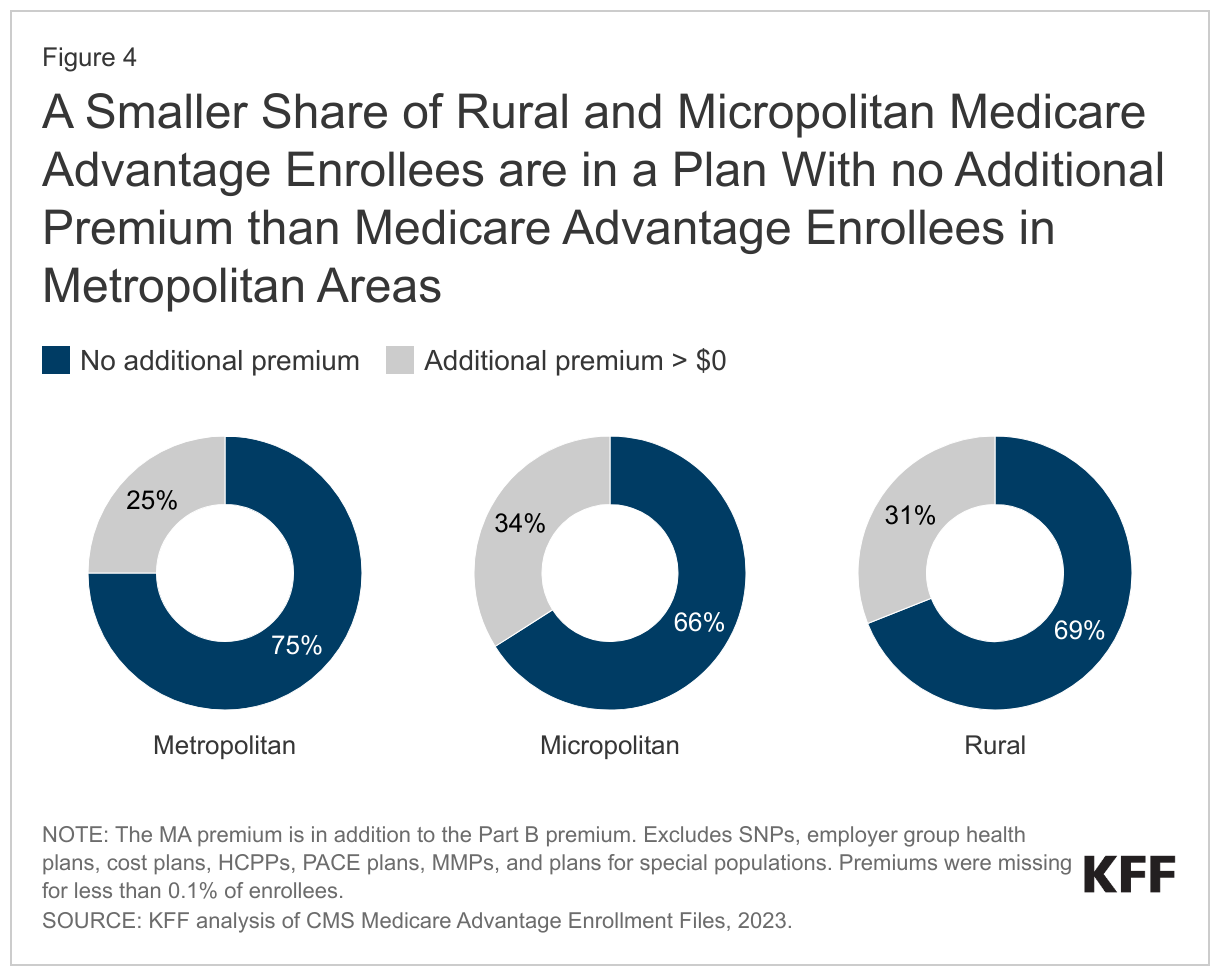
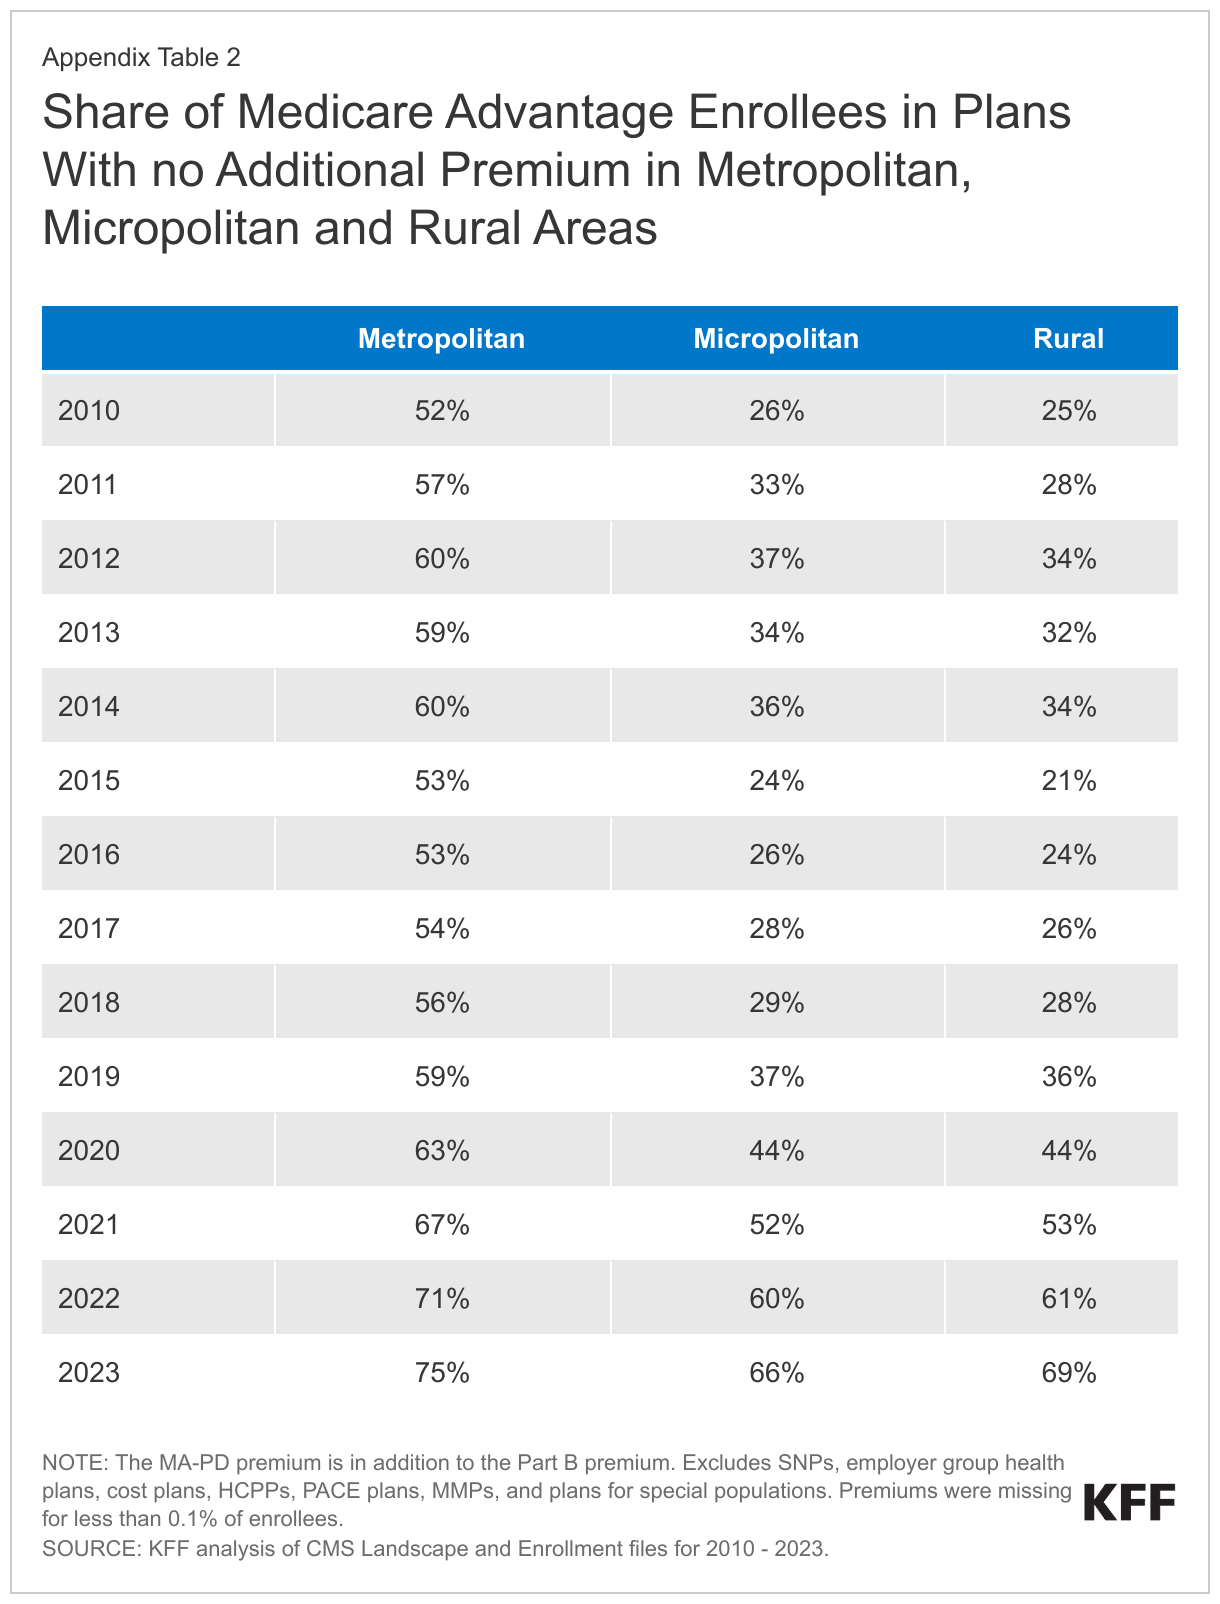
More than two-thirds (69%) of Medicare Advantage enrollees in rural areas are in a plan that requires no premium other than the Part B premium.
A somewhat smaller share of enrollees in rural (69%) and micropolitan (66%) counties pay no additional premium compared with enrollees in metropolitan areas (75%) (Figure 4). Medicare Advantage plans may impose a premium for the cost of Medicare-covered services above payments made by the federal government to the plans, as well as the cost of prescription drug coverage. Most Medicare Advantage plans offer extra benefits for no additional premium.
Since 2015, the share of Medicare Advantage enrollees in plans with no additional premium has increased steadily in all areas. Growth has been fastest in rural areas where the share of enrollees in plans with no additional premium increased from 21% in 2015 to 69% in 2023. Growth has been similarly rapid in micropolitan areas, rising from 24% in 2015 to 66% in 2023. In metropolitan areas, the share of enrollees in plans with no additional premium has been consistently higher than in rural or micropolitan areas, but has increased more slowly, rising from 53% in 2015 to 75% in 2023 (Appendix Table 2).
Discussion
Medicare Advantage enrollment and plan availability in rural areas have increased rapidly in recent years, as they have in more populated counties. Private plans often provide supplemental benefits to enrollees for no additional premium (other than the Part B premium), including some coverage of dental, vision, and hearing services, as well as reduced cost sharing compared to traditional Medicare without a supplemental plan. At the same time, Medicare Advantage plans may use provider networks, limiting coverage of services delivered by out-of-network providers. Provider networks may impose barriers to people living in rural areas who already face challenges obtaining health care services because of fewer providers and longer travel distances. Despite recent growth, Medicare Advantage enrollment in rural areas remains lower than enrollment in more populated areas. This could be the result of fewer investments in marketing and outreach in these areas by Medicare Advantage insurers, because financial returns are lower given the smaller population of potential enrollees. As Medicare Advantage enrollment continues to grow, understanding how plans differ across metropolitan, micropolitan and rural areas will be increasingly relevant to assessing how well private plans meet the needs of their enrollees.
Jeannie Fuglesten Biniek and Tricia Neuman are with KFF. Gabrielle Clerveau was with KFF at the time this brief was written. Anthony Damico is an independent consultant.
As states unwind the Medicaid continuous enrollment provision, data show that large shares of people are being disenrolled for paperwork or procedural reasons as opposed to being determined ineligible. These high procedural disenrollment rates are raising concerns that many people who remain eligible for Medicaid may, nevertheless, be losing coverage. But, there are different procedural disenrollment rates being reported that can be confusing to interpret. This policy watch explains how the different rates are calculated, provides insights for interpreting the data, and describes steps the Centers for Medicare and Medicaid Services (CMS) and states are taking to reduce procedural disenrollments.
What are procedural disenrollments?
Procedural disenrollments occur when there is no definitive determination of ineligibility. Procedural disenrollments may happen because enrollees do not receive renewal notices or face barriers to completing the redetermination process, such as not understanding what steps need to be taken. In some cases, people may be procedurally disenrolled because eligibility workers are not able to process documents enrollees have submitted before cases are automatically closed. Some enrollees may know they are no longer eligible, perhaps because of an increase in income or other change in circumstance, and do not respond to the renewal request so the state cannot make a definitive determination that the person is no longer eligible. While some states are reporting reasons for procedural terminations that indicate whether someone may be over income or did not respond, these data are limited. The main concern with procedural disenrollments is that many people losing Medicaid for these paperwork reasons may still be eligible and do not have another source of health coverage.
How are the procedural disenrollment rates calculated and how should different rates be interpreted?
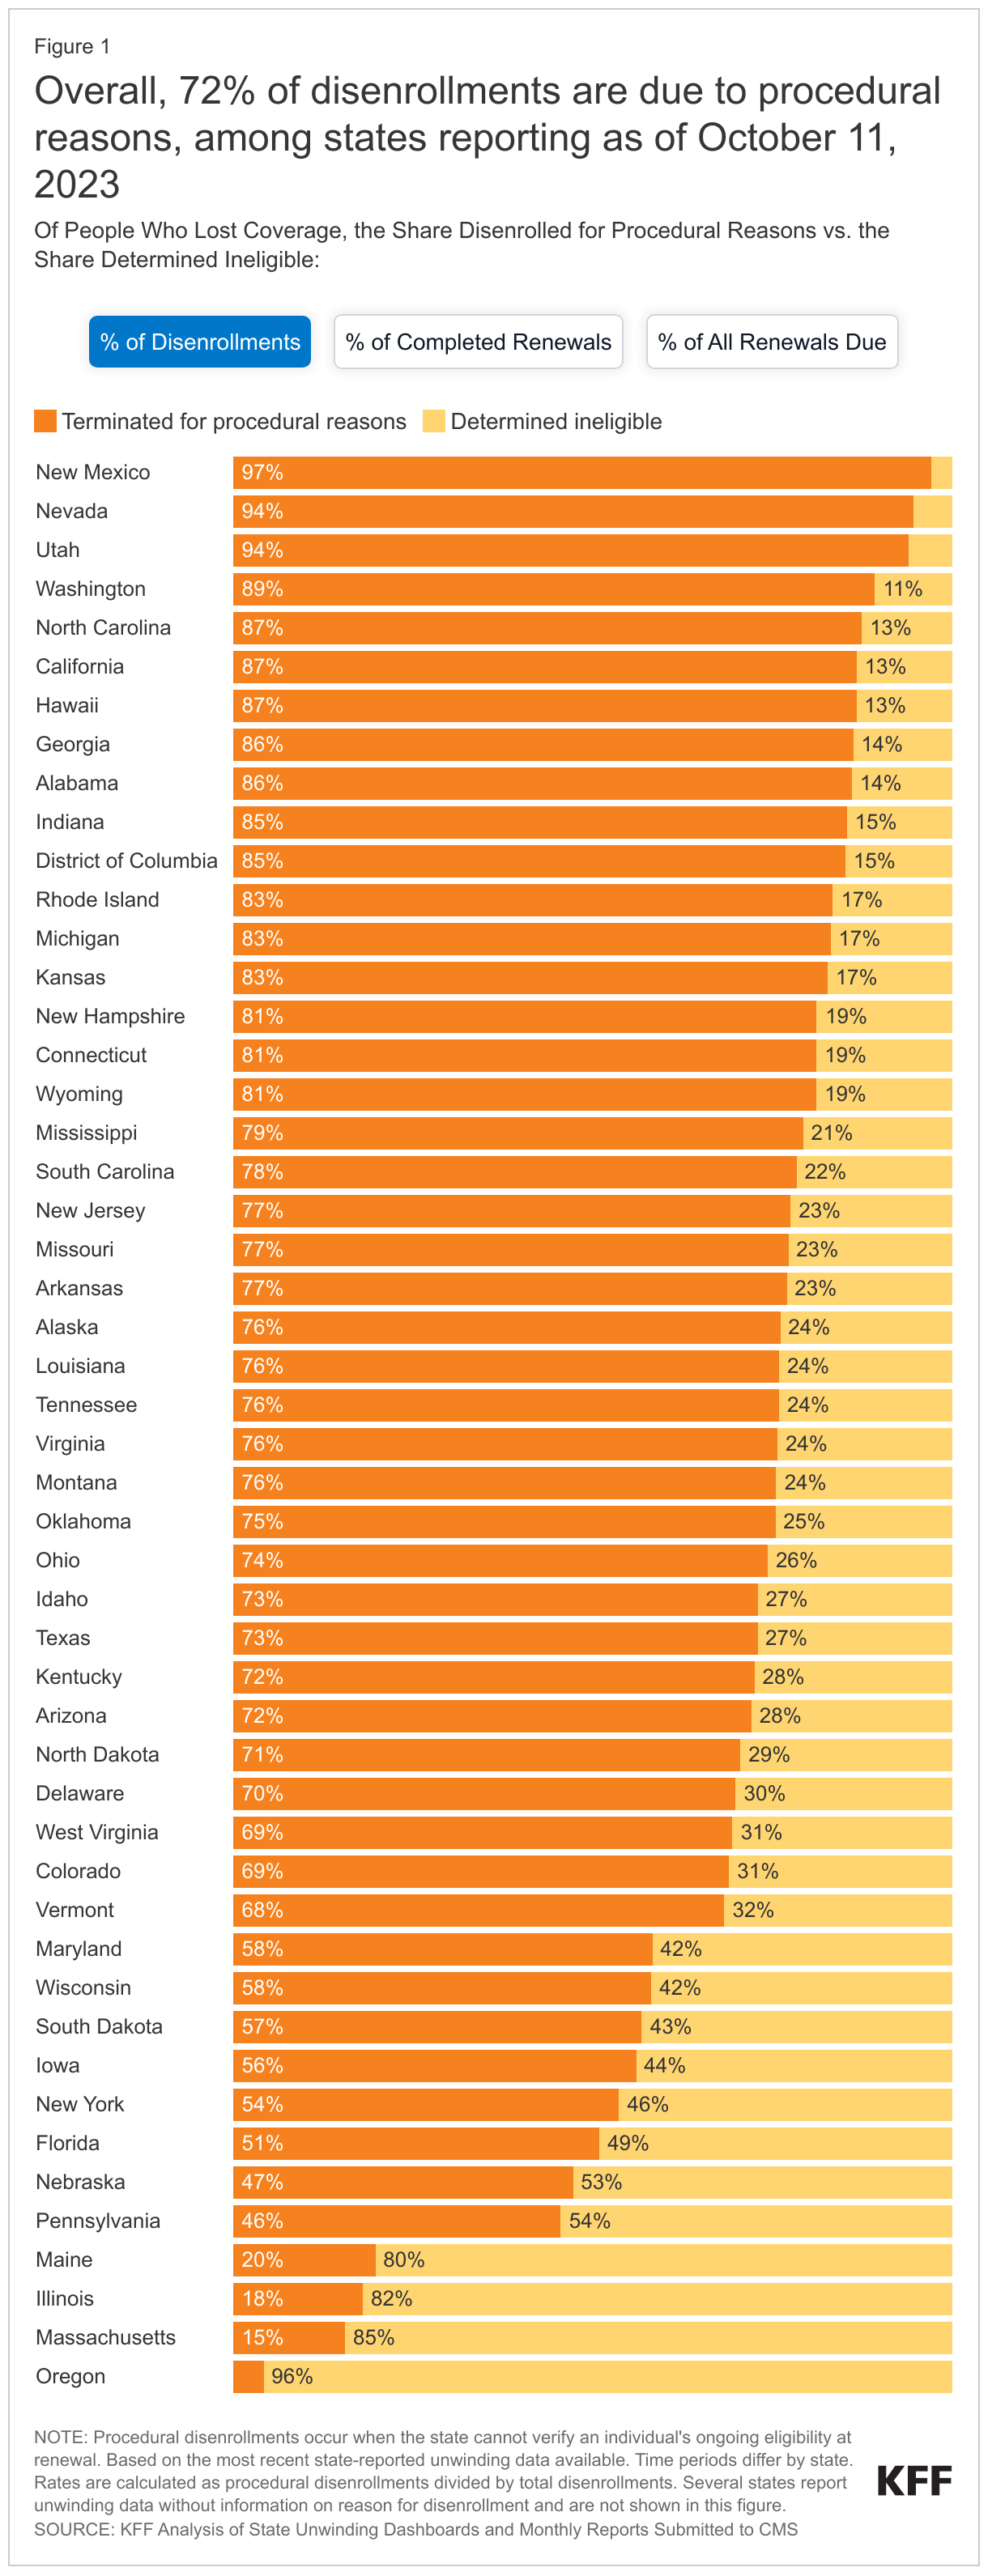
Different procedural disenrollment rates are being reported for states because of differences in how those rates are calculated. When calculating procedural disenrollment rates, the denominator and timeframe matter. A procedural disenrollment rate calculated using total disenrollments as the denominator is going to be higher than a rate that uses all initiated renewals, which includes enrollees whose coverage was renewed as well as cases that remain pending, as the denominator. Additionally, a cumulative procedural disenrollment rate based on all reported renewal data since the start of the unwinding period is going to differ from one that is cohort based and reflects only procedural disenrollments for a single month. The cumulative procedural disenrollment rate reported by KFF, 73% as of September 5, 2023, uses total disenrollments as the denominator, highlighting that a substantial majority of disenrollments are for paperwork reasons rather than for people being definitively determined ineligible. In contrast, the cumulative procedural disenrollment rate using all initiated renewals as the denominator is 20%, reflecting the fact that many people have had their coverage renewed (Figure 1).
Reporting procedural disenrollments as a share of total disenrollments isolates procedural disenrollments and can help to identify systems or other issues. High procedural disenrollment rates using this methodology may reflect problems with mail delivery, backlogs in processing returned forms, or problems complying with federal regulations related to processing redeterminations. In contrast, states with lower procedural disenrollments as a share of total disenrollments may have more effective processes and procedures for contacting enrollees; they may provide a longer timeframe for enrollees to respond; or they may have more robust systems that streamline the process for returning renewal forms or submitting documentation.
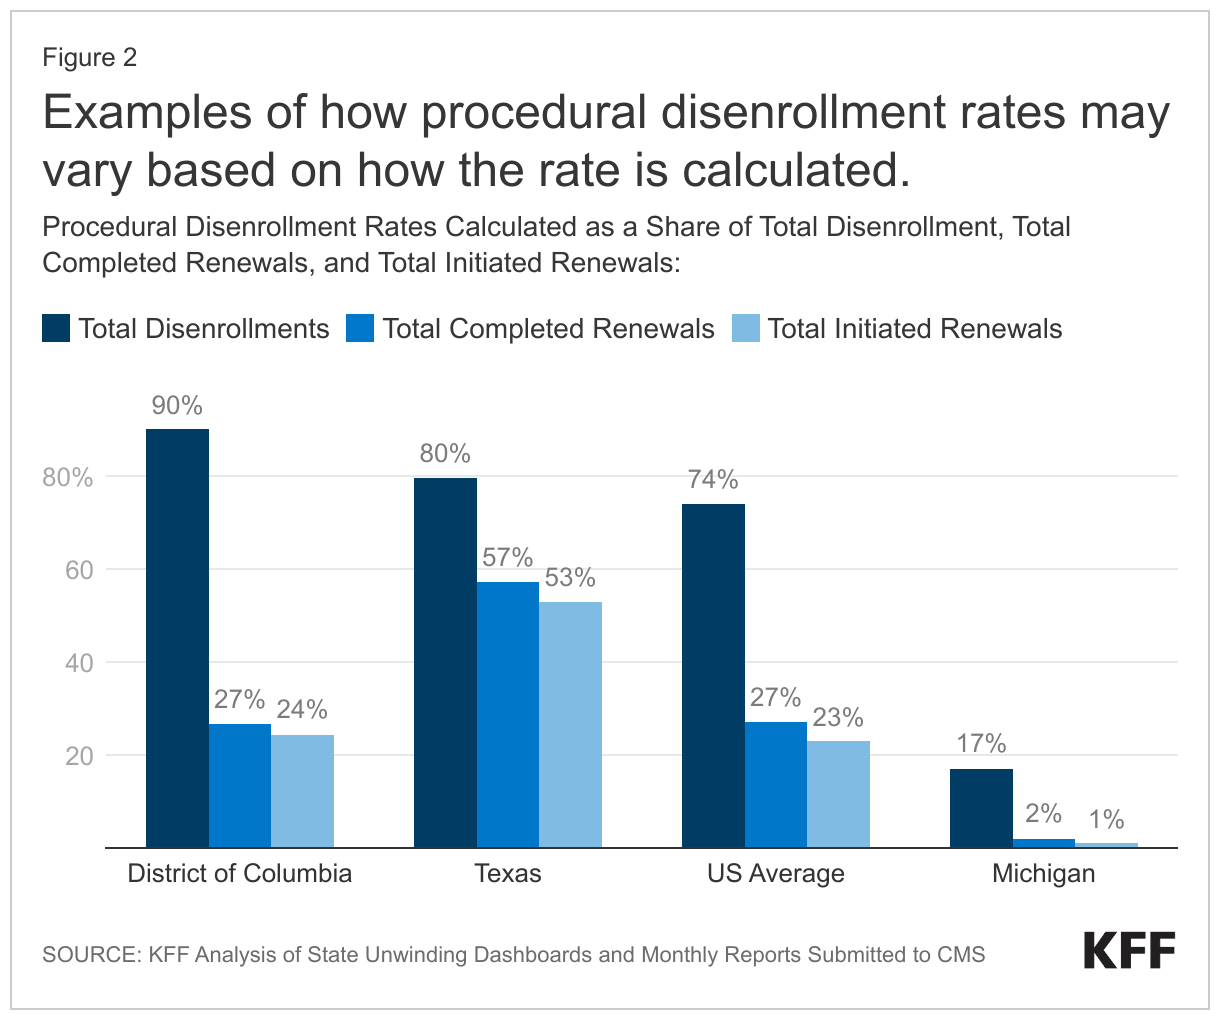
Examining procedural disenrollments as a share of people renewed or the share of all initiated renewals can provide important context for understanding the data. States that are renewing large shares of people each month or that are holding redetermination cases open to give enrollees more time to respond may have lower overall disenrollment rates, even if their procedural disenrollment rates as a share of total disenrollments are high. An example is the District of Columbia, which has a 90% procedural disenrollment rate as a share of total disenrollments that drops to just 27% when calculated as a share of total completed renewals because DC is renewing coverage for 70% of enrollees (Figure 2). While some states, such as Texas, have procedural disenrollment rates that are higher than the national average for each measure, other states, such as Michigan, have rates that are lower.
How are CMS and states addressing high procedural disenrollment rates?
CMS has sent letters to states identifying concerns with high procedural disenrollment rates and potential systems issues contributing to inappropriate procedural terminations. On August 9, 2023, CMS sent letters to states expressing general concern over procedural disenrollment rates and urging states to take action to reduce those rates. CMS flagged 28 states where the agency deemed the procedural disenrollment rate to be too high. The rates reported in the letters were for May 2023 only, using total renewals initiated in the month as the denominator, and CMS defined a high procedural disenrollment rate as greater than 10%, More recently, CMS sent a letter to state Medicaid Directors on August 30, 2023 identifying a potential issue related to how some states are processing ex parte renewals (i.e., renewals that make use of electronic data sources documenting income and other circumstances) that could be contributing to inappropriate procedural terminations for some individuals, including children. According to the letter, any state that is out of compliance with federal rules must implement a mitigation strategy until the issue is fixed, reinstate coverage for all individuals who were improperly terminated for procedural reasons, and pause procedural disenrollments for individuals who may be affected.
Most states have adopted at least some of theflexibilities CMS has made available during the unwinding period aimed at reducing procedural disenrollment rates. More recently but prior to the release of the CMS letters, some states extended renewal notice timelines by 30 days to give people additional time to respond and to give states additional time to reach out to enrollees who have not yet responded. Other states temporarily paused procedural disenrollments for certain cohorts or for all enrollees. In light of the recent CMS letters, states can be expected to adopt additional strategies to reduce procedural disenrollments.
Enhanced Marketplace subsidies have continued to drive up enrollment in the individual market, and the loss of Medicaid coverage by millions of people could contribute to this trend, according to a new KFF analysis. Meanwhile, enrollment in non-ACA-compliant plans is at a record low.
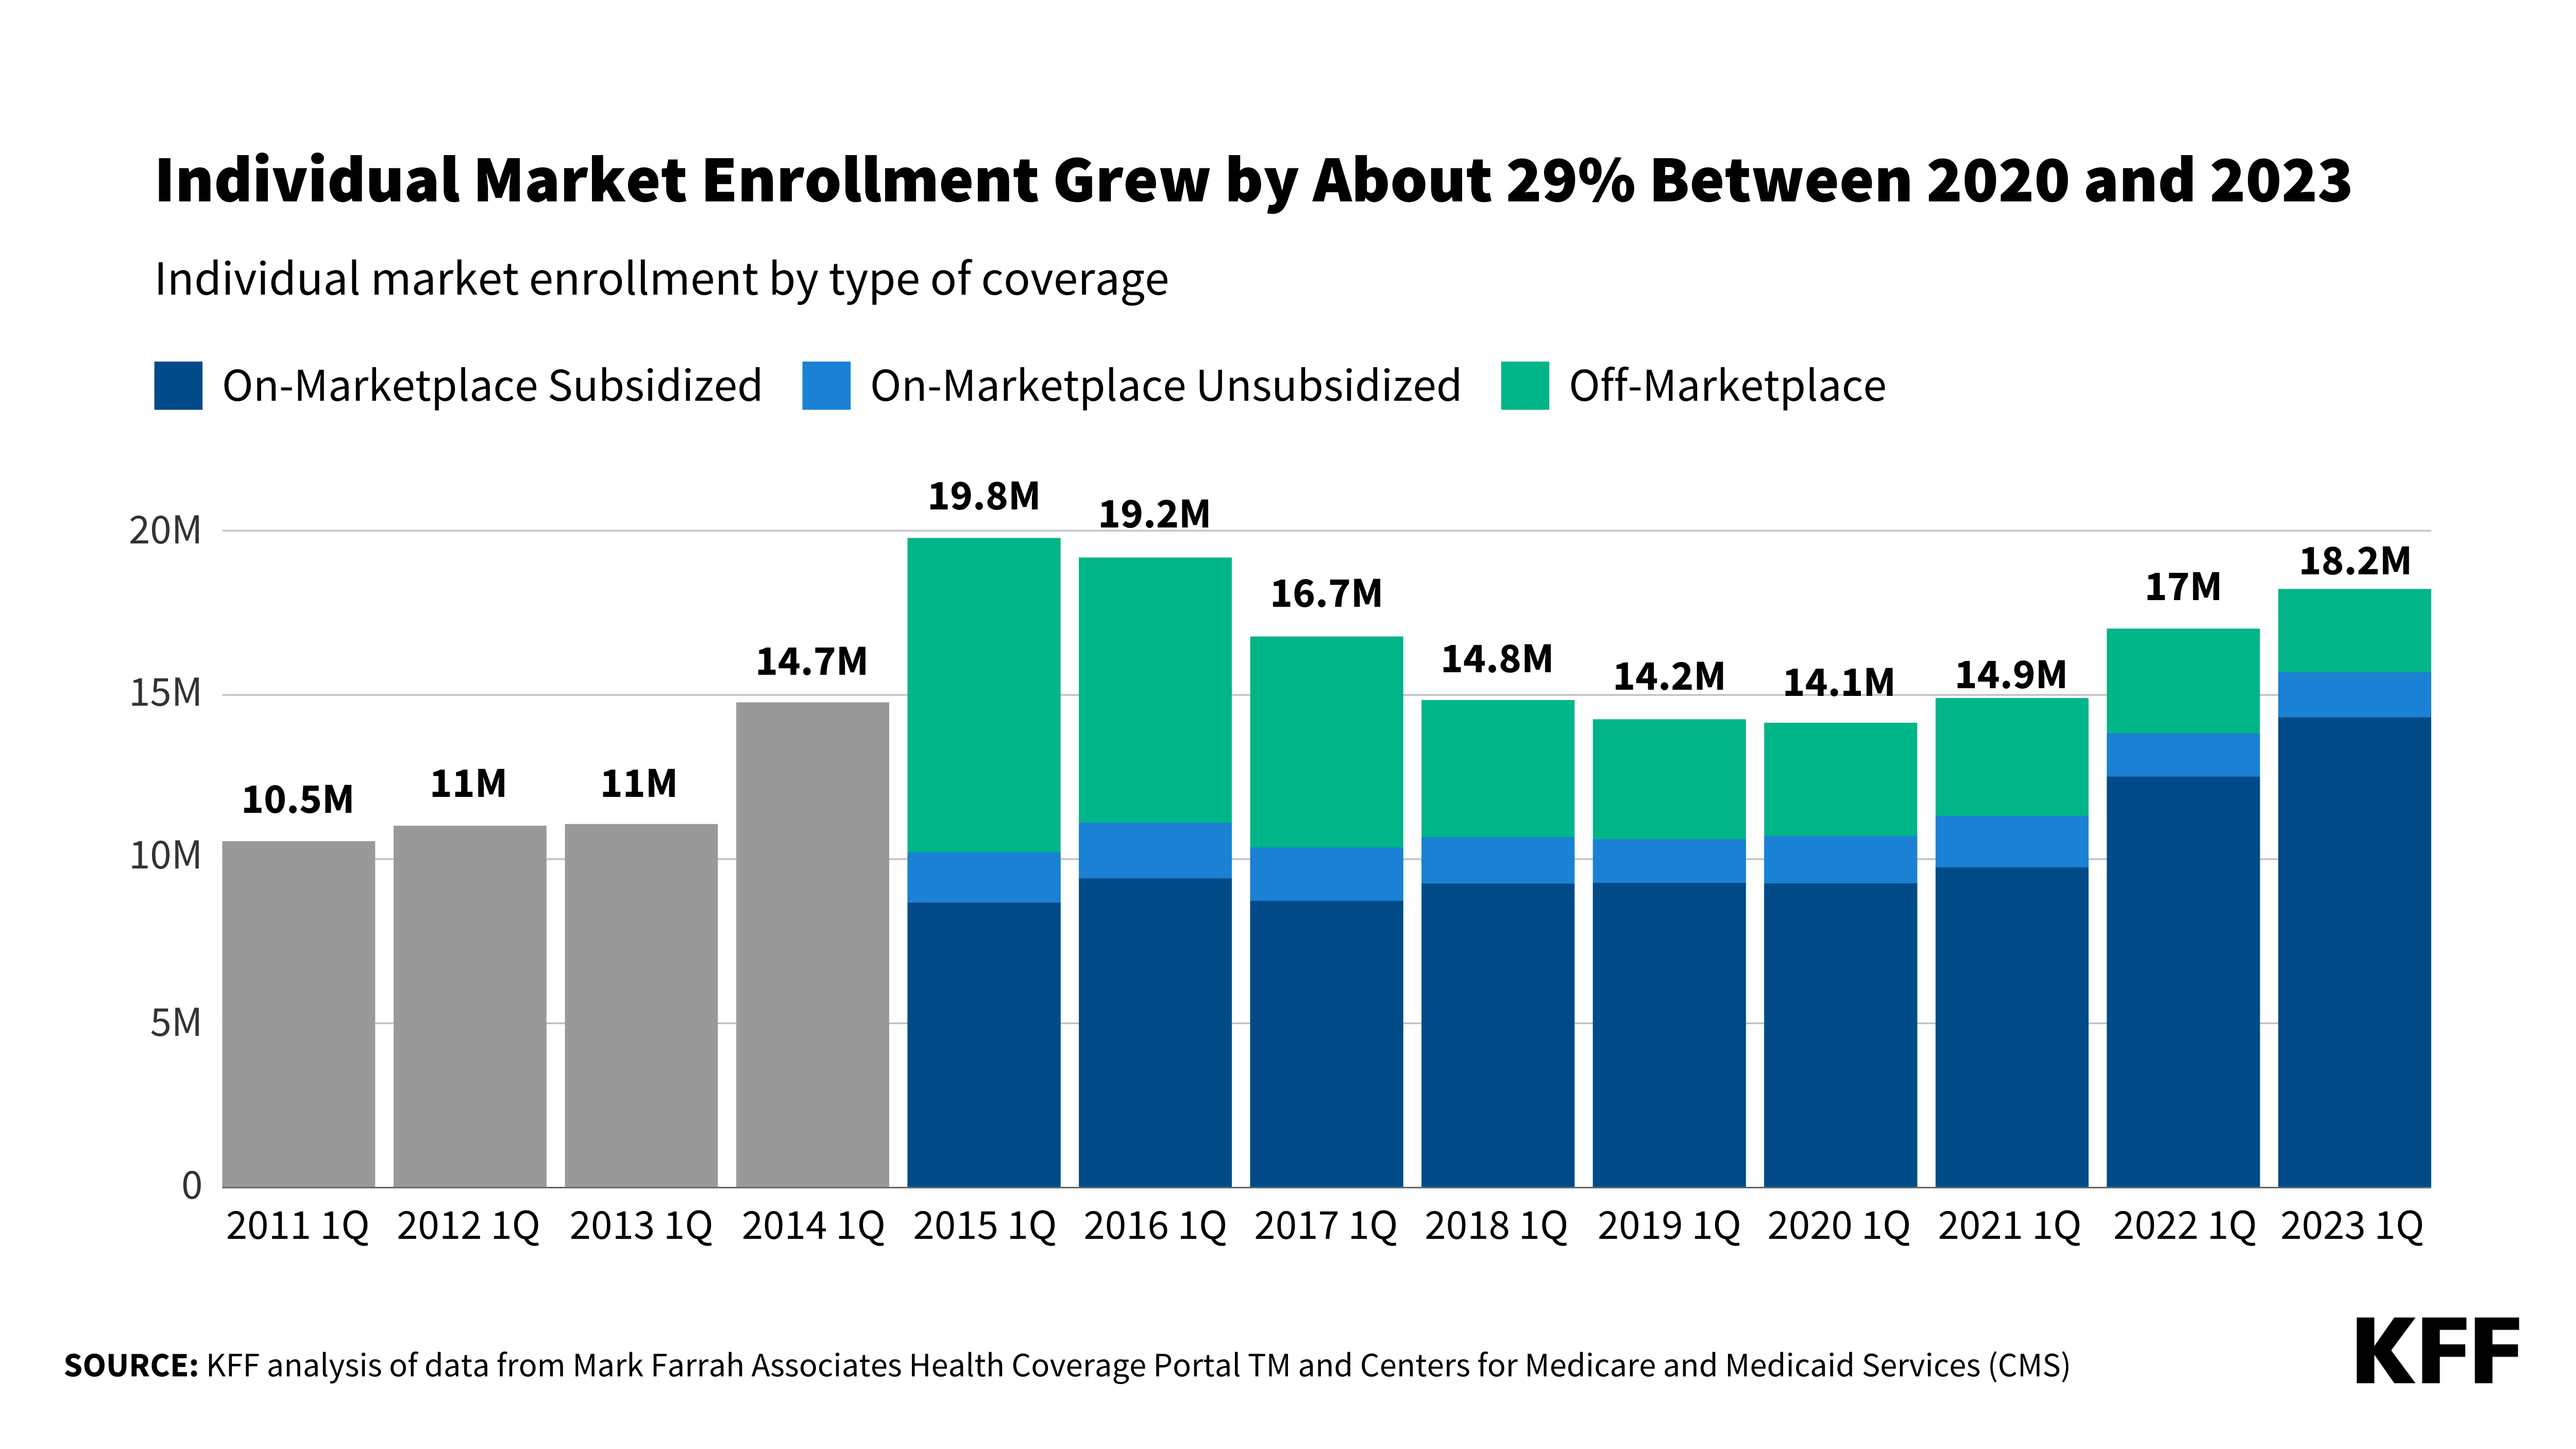
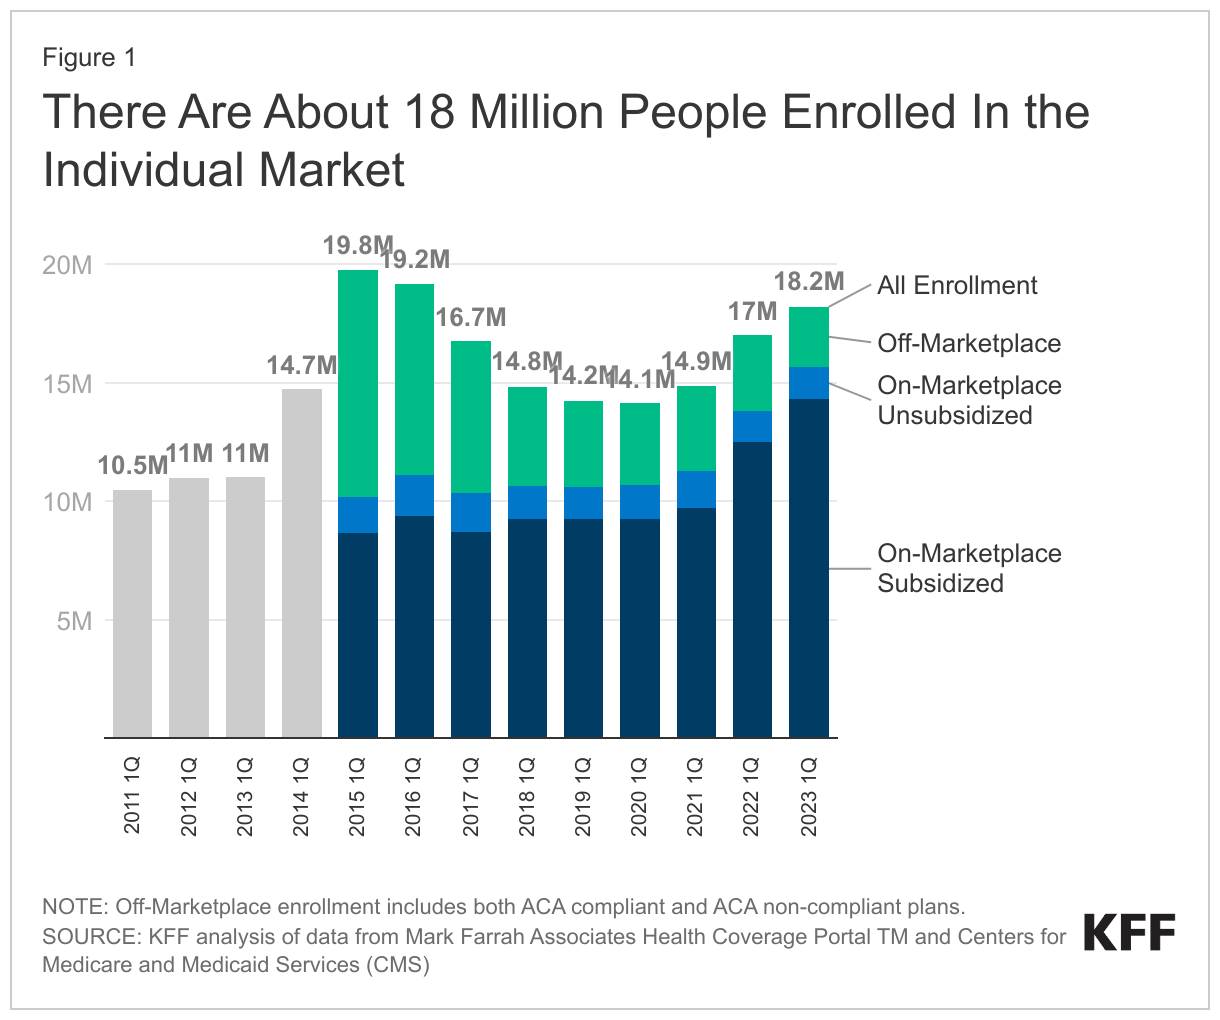
As of early 2023, an estimated 18.2 million people have individual market coverage, the highest since 2016. Individual market enrollment grew by about 29% between early 2020 and early 2023 — a result of enhanced subsidies introduced by the Inflation Reduction Act, increased outreach, and an extended enrollment period.
This enrollment growth could continue in 2023 as states resume Medicaid disenrollments amid the unwinding of the continuous enrollment provision. Some of the people losing Medicaid coverage may be eligible for subsidies on the ACA Marketplaces.
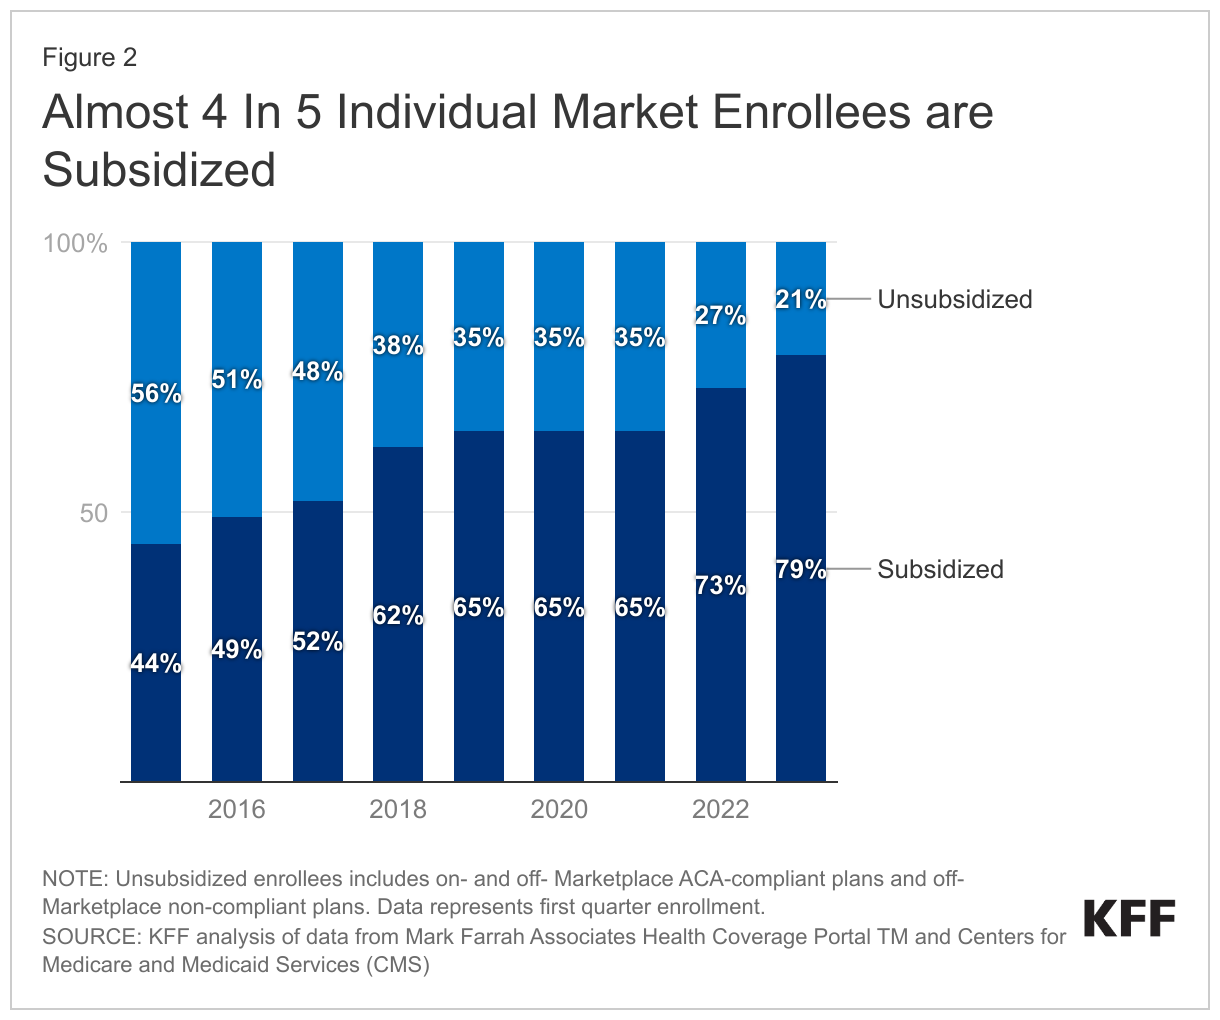
Due in part to the enhanced subsidies, about 4 in 5 individual market enrollees have subsidized coverage — the highest share since the ACA was implemented.
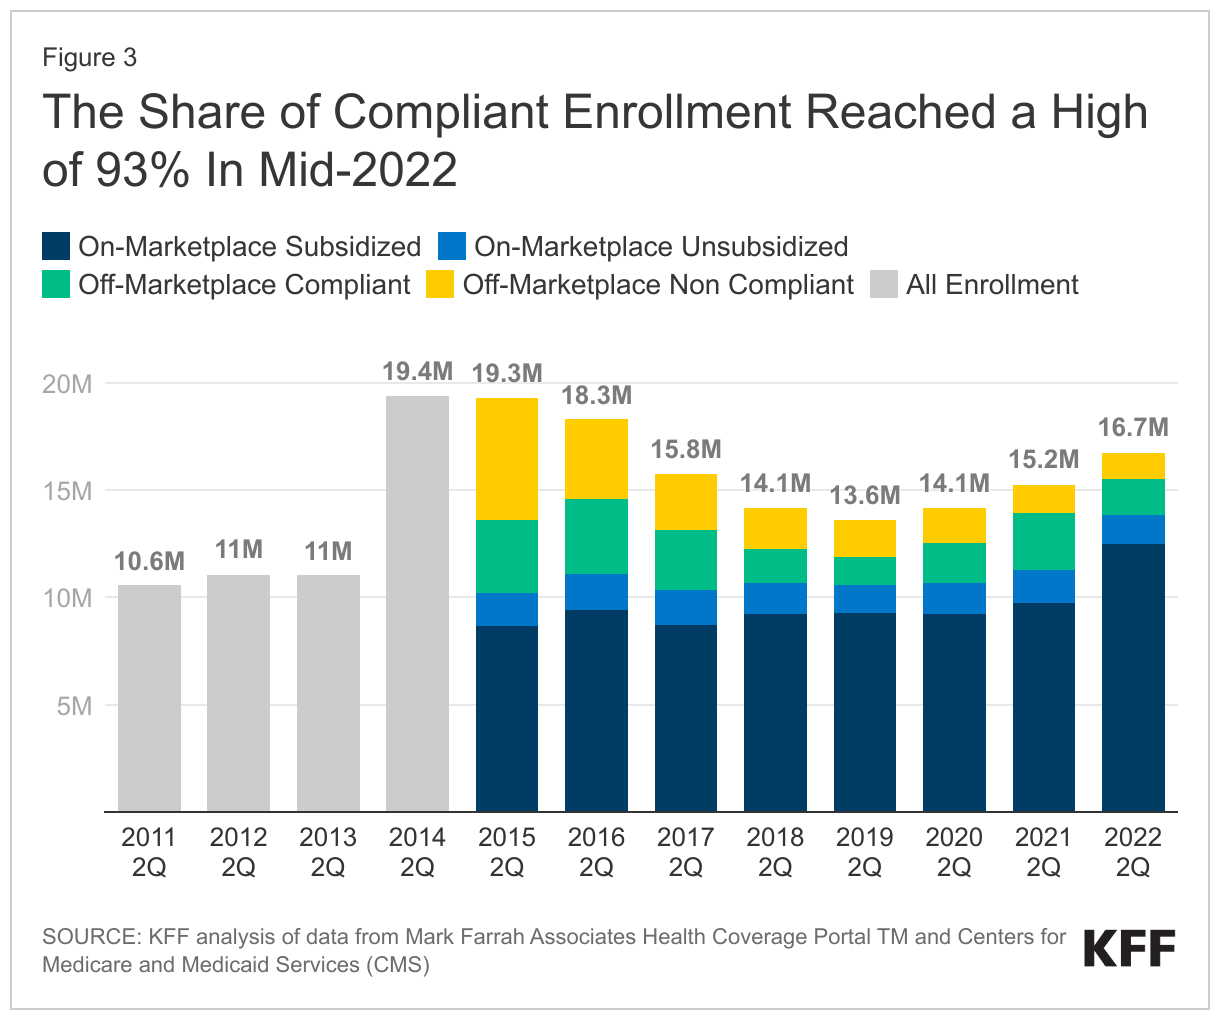
The number of people in non-compliant plans has fallen each year and could decrease further due to the Biden Administration’s proposed rule that would reverse the expansion of short-term plans. An estimated 1.2 million people were in non-ACA-compliant plans in mid-2022, compared to 5.7 million in mid-2015. These short-term plans often do not include certain benefits or coverage for pre-existing conditions and can impose a dollar limit on insurance coverage.
If unsubsidized premiums rise in 2024 due to higher health care prices and utilization, enhanced subsidies could shield most individual market enrollees from increases in their monthly payments.
With Marketplace enrollment at a record high in early 2023, the upcoming open enrollment period could be among the busiest yet. In addition to Marketplace enrollees renewing coverage, uninsured people and those buying individual coverage off-Marketplace – as well as those losing Medicaid coverage as the pandemic-era continuous enrollment provision unwinds – may want to check if they are eligible for expanded subsidies under the Inflation Reduction Act.
This analysis looks at how many people are signed up for each type of individual market coverage—both on- and off-Marketplace and with or without subsidies—as of early 2023. The number of people enrolled in compliant and non-compliant plans was also evaluated up to 2022, the latest year this data is publicly available. A key takeaway from this analysis is that as Marketplace enrollment has reached record highs with enhanced premium assistance, fewer people are buying coverage off-Marketplace, but the overall individual market is nonetheless growing.
Individual market enrollment continues to grow, driven by enhanced subsidies. As of early 2023, an estimated 18.2 million people have individual market coverage, the highest since 2016 (Figure 1). The individual health insurance market grew rapidly in the early years of ACA implementation, reaching nearly 20 million people in early 2015, nearly double the approximately 11 million signed up before the ACA. However, these enrollment gains were partially offset by subsequent declines driven by steep premium increases, particularly among people not receiving subsidies. By early 2020, the individual market had declined to about 14 million enrollees.
During this period of decreasing individual market enrollment, subsidized enrollment increased from 2017-2019 which corresponds with the Trump Administration ending federal cost-sharing reduction (CSR) payments; this led to insurers “silver loading” premiums for CSRs and increased premium subsidies for some.
With passage of enhanced subsidies in the American Rescue Plan Act (ARPA), combined with boosted outreach and an extended enrollment period, 2021 marked the first year since 2015 when there was an increase in individual market enrollment. Individual market enrollment grew about 5% from 14.1 million in first quarter 2020 to 14.9 million in first quarter 2021.
The ARPA’s subsidies didn’t simply bring people from off-Marketplace plans to the Marketplace; the subsidies also helped bring overall individual market enrollment higher, up to 18.2 million in early 2023, an increase of about 29% from early 2020.
Now, with enhanced subsidies in place, the vast majority of people buying individual market coverage are subsidized. The Inflation Reduction Act continues the ARPA subsidies without interruption for another three years through 2025. That means premiums are capped for people with incomes over 400% of the poverty level ($120,000 for a family of 4 in 2024) who were ineligible for subsidies previously, and those who were already eligible for subsidies are paying even less than they were before. Overall, about 4 in 5 individual market enrollees are now subsidized (Figure 2) – the highest share since the ACA was implemented – and some of those who aren’t receiving a subsidy might find they are eligible if they moved onto the Marketplace.
Heading into 2024 open enrollment, we estimate there are still about 2.5 million people buying unsubsidized coverage off-Marketplace, including some in non-ACA-compliant plans (like grandfathered and short-term plans). Early 2023 off-Marketplace enrollment decreased by 20% compared to early 2022. Despite Trump Administration efforts to promote non-compliant coverage, the number of people in non-compliant plans has fallen each year.
While enrollment in non-ACA-compliant plans is at a record low, a substantial number continue enrolling in non-compliant plans. Using federal risk adjustment data and data compiled by Mark Farrah Associates, we estimate 1.2 million people were in non-ACA-compliant plans in mid-2022, compared to 5.7 million in mid-2015 (Figure 3). Although we don’t yet have complete 2023 data, it’s likely ACA-compliant enrollment (both on- and off-Marketplace) is currently at a record high and that non-compliant enrollment is at a record low.
Non-compliant short-term plans often do not include certain benefits or coverage for pre-existing conditions, and can impose a dollar limit on insurance coverage. For example, of short-term plans reviewed, none covered maternity care, most didn’t cover prescription drugs, about half didn’t include mental health or substance use treatment, and most imposed a dollar limit on covered services or drugs. The Biden Administration’s proposed rule, which would reverse Trump Administration’s expansion of short-term plans, may further reduce enrollment in non-compliant plans if it is finalized.
The share of individual market enrollment in ACA compliant plans has increased to 93% in mid-2022 compared to 71% in mid-2015. These data are only available through mid-2022, and non-compliant enrollment may have fallen even further in 2023.
Some off-Marketplace enrollees will find they are still ineligible for subsidies, even with enhanced subsidies. Undocumented immigrants and people with affordable offers of employer coverage are ineligible for Marketplace subsidies. Additionally, although there is no longer an upper income limit for subsidies, people with higher incomes who would pay less than 8.5% of their income for an unsubsidized benchmark silver plan do not qualify for subsidies because their premium isn’t high enough to trigger financial help. Even so, some of the latter group may find it advantageous to purchase on the Marketplace because if they experience midyear changes in their income or other circumstances, they may begin receiving subsidies mid-year without changing plans or they could retroactively claim a subsidy when they file taxes.
Yet others who were previously ineligible for Marketplace subsidies may now be eligible. For example, the Biden Administration’s fix to the “family glitch” means dependents of workers, who have affordable self-only coverage but unaffordable family coverage through their employers, can get Marketplace subsidies starting in 2023.
Marketplace enrollment data are as of the first quarter of 2023. In the second quarter of 2023, states started to disenroll people from Medicaid, some of whom may be signing up for subsidized Marketplace coverage.
How might future premium increases affect people in the individual market? Looking back over the last ten years of the ACA, changes in individual market enrollment closely mirror changes in what people had to pay for coverage. In years when premiums were rising steeply from 2016-2018, unsubsidized individual market enrollment fell. When premiums held mostly steady from 2019 to 2020, so did individual market enrollment. Then, as new subsidies became available in 2021-2023, individual market enrollment picked up again, driven by an increase in the number of subsidized enrollees.
Heading into 2024, we may see unsubsidized premiums rise, pushed up by rising health care prices and utilization. However, unlike when premiums rose in past years, the Inflation Reduction Act’s enhanced subsidies could shield the vast majority of individual market enrollees from increases, even those with higher incomes. In fact, some people who aren’t subsidized in 2023 may find premium increases in 2024 make them newly eligible for subsidies (if their benchmark premium rises above 8.5% of their income). But, to take advantage of subsidies, they would need to shop on the Marketplace during open enrollment.
Methods
Federal enrollment and risk adjustment data were combined with administrative data insurers report to state regulators, as compiled by Mark Farrah Associates, to determine the number of enrollees in each type of individual market coverage. Early effectuated enrollment reports (available for years 2015-2023) were used to determine the number of on-Marketplace and subsidized enrollees. Risk adjustment data (available for years 2014-2022) were used to determine the total number of enrollees in ACA-compliant plans. The number of compliant enrollees in Massachusetts and Vermont in 2015-2021 and Massachusetts in 2022 was estimated using a ratio of total Exchange enrollment to total compliant enrollment in all the other states.
Mark Farrah Associates data were used to estimate the total number of enrollees in the individual market. Because some plans do not file quarterly data, we adjust these plans’ enrollment numbers based on enrollment changes seen in plans that do file quarterly. We also remove likely Children’s Health Insurance Program, or CHIP, enrollees from the individual market total.
As the Biden administration begins the process of negotiating prices for 10 costly drugs on behalf of Medicare and its beneficiaries as authorized in last year’s Inflation Reduction Act, KFF Executive Vice President for Health Policy Larry Levitt probes some likely arguments against it in this op-ed column in The New York Times. The column also examines the policy and political implications of the debate and pending legal challenges.
This document was updated on Sept. 8, 2023 to cite a related analysis.
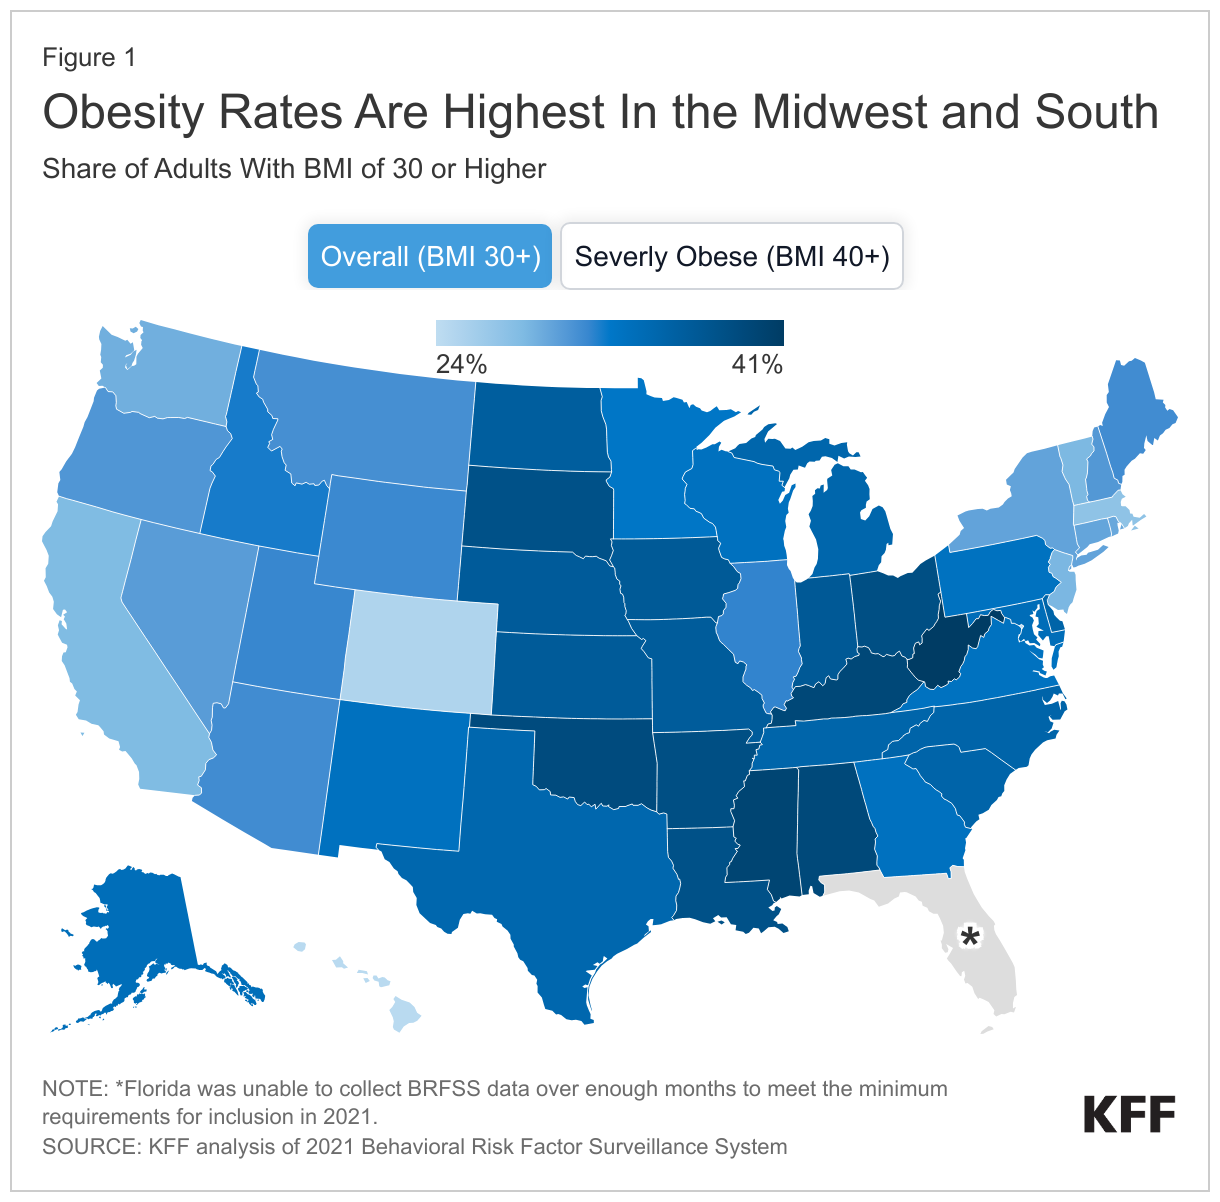
Key health organizations began recognizing obesity as a disease a decade or more ago and treatment methods for the condition have ranged from behavior change counseling to bariatric surgery. A class of prescription drugs (GLP-1) that can result in substantial weight loss is emerging as a potentially revolutionary treatment for the one-third of U.S. adults who are obese* (having a body mass index of 30 or above). But, health coverage and access in the fragmented U.S. health care system is determined by many actors, and the rate of obesity in the state of residence could factor into coverage, and therefore how accessible and affordable this class of drugs is for patients.
A look at KFF’s State Health Facts indicator of the distribution of adults with a body mass index (BMI) of 30 or more shows that the 20 states with the highest rates of obesity are all in the Midwest and South, as classified by the U.S. Census Bureau (Figure 1).
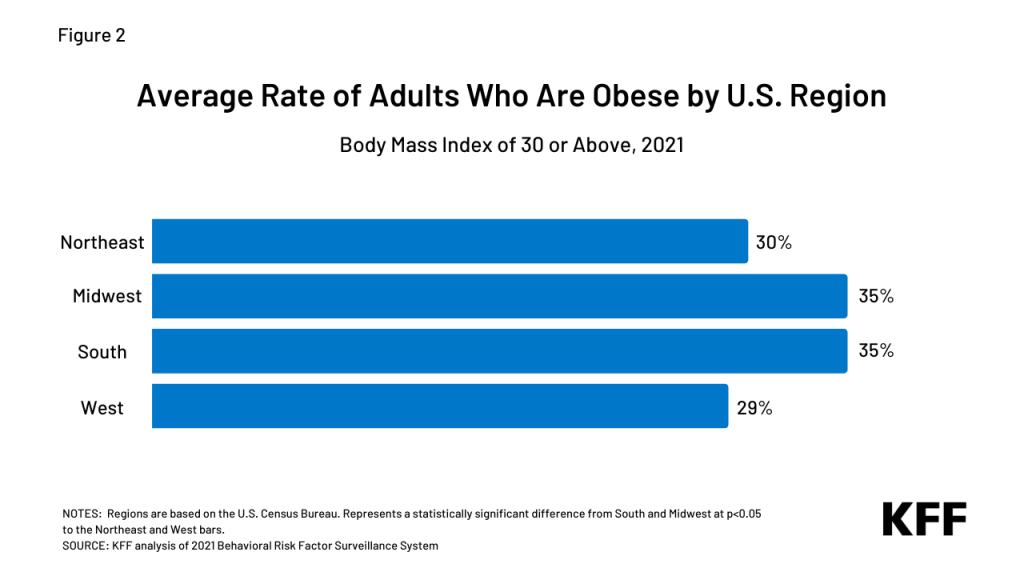
When comparing average obesity rates by region (Figure 2), adult rates in the Midwest and South are about five percentage points higher than the Northeast and six percentage points higher than the West.
Figure 2: Average Age of Adults Who are Obese by U.S. Region
The cost of treating adults who are obese with GLP-1 drugs would be substantial in the near term and could impact coverage policies. For state Medicaid programs in the Midwest and South, and employers and insurers with a significant presence in these regions, the higher rates of obesity among residents may factor into their decisions. Also a factor in access to these drugs, seven of ten states that have not adopted the Affordable Care Act’s Medicaid expansion and nearly all (97%) of the people experiencing a coverage gap due to non-expansion are in the South.
Recent reports (Business Insider, STAT, WSJ) reveal some employers previously covering GLP-1 drugs are pulling back coverage and health insurers are scrutinizing physicians’ off-label prescribing. With the prospect of a dramatic increase in costs if the class of drugs continues to gain FDA approval, coverage of the drugs could stall, drop, or be restricted, including limiting coverage eligibility to people with a higher body mass index. (Obesity is typically classified into three ranges of BMI. The American Medical Association recently clarified its policy on the role of BMI as a measure of obesity, noting historical problems and its limitations.) Other potential actions include:
Limiting off-label use,
Requiring additional treatment like behavioral therapy in conjunction with the drugs,
Prior authorization, including step-therapy to try less expensive options first, and
Higher cost-sharing.
The early clinical results and potential of new prescription drugs for weight loss have caught the interest of nearly half of U.S. adults. Federal and state policymakers, employers and insurance coverage providers are in the early stages of considering these drugs’ potential costs and benefits in determining if and how to cover them in insurance plans. The long-term cost savings from a reduction in obesity and its related risks in the country could be substantial. Still, the current U.S. prices of these drugs for weight loss are high and their lifetime use may be required for continued health benefits. It is also important to note that some patients prescribed the drugs are experiencing side effects and their use’s long-term impact remains a question.
With adults in the Midwest and South having higher obesity rates, states’ coverage programs and regional employers could face higher health insurance costs – particularly in the short term – and seek ways to control the use of newer weight-loss drugs. As coverage of GLP-1 prescription drugs develops, regional trends could diverge.
*The Centers for Disease Control and Prevention’s (CDC) National Health and Nutrition Examination Survey, using clinical measurements, estimates about four in ten adults are obese. KFF estimates are based on analysis of state-level Behavioral Risk Factor Surveillance System self-reported data collected by the CDC and state health departments via phone calls.
Climate change-relatedextreme heat events have lengthened, become more frequent, and increased in intensity over the past few decades with some of the worst conditions and impacts observed in Summer 2023. Across the globe and the country there have been rising incidents of extreme heat, and air quality events. June 2023 became the hottest June on record, globally, while smoke from wildfires in Canada driven by climate change-related heat resulted in significant air pollution that affected more than 60 million people in the U.S. In August, prolonged dry conditions and high winds in Hawai’i laid the foundation for wildfires that caused massive destruction on the island of Maui and other areas of the islands, resulting in the largest loss of life due to wildfires in modern U.S. history. As temperatures continue to rise and extreme heat events that are linked to adverse health outcomes become more frequent in the U.S., people of color and other underserved communities are disproportionately affected.
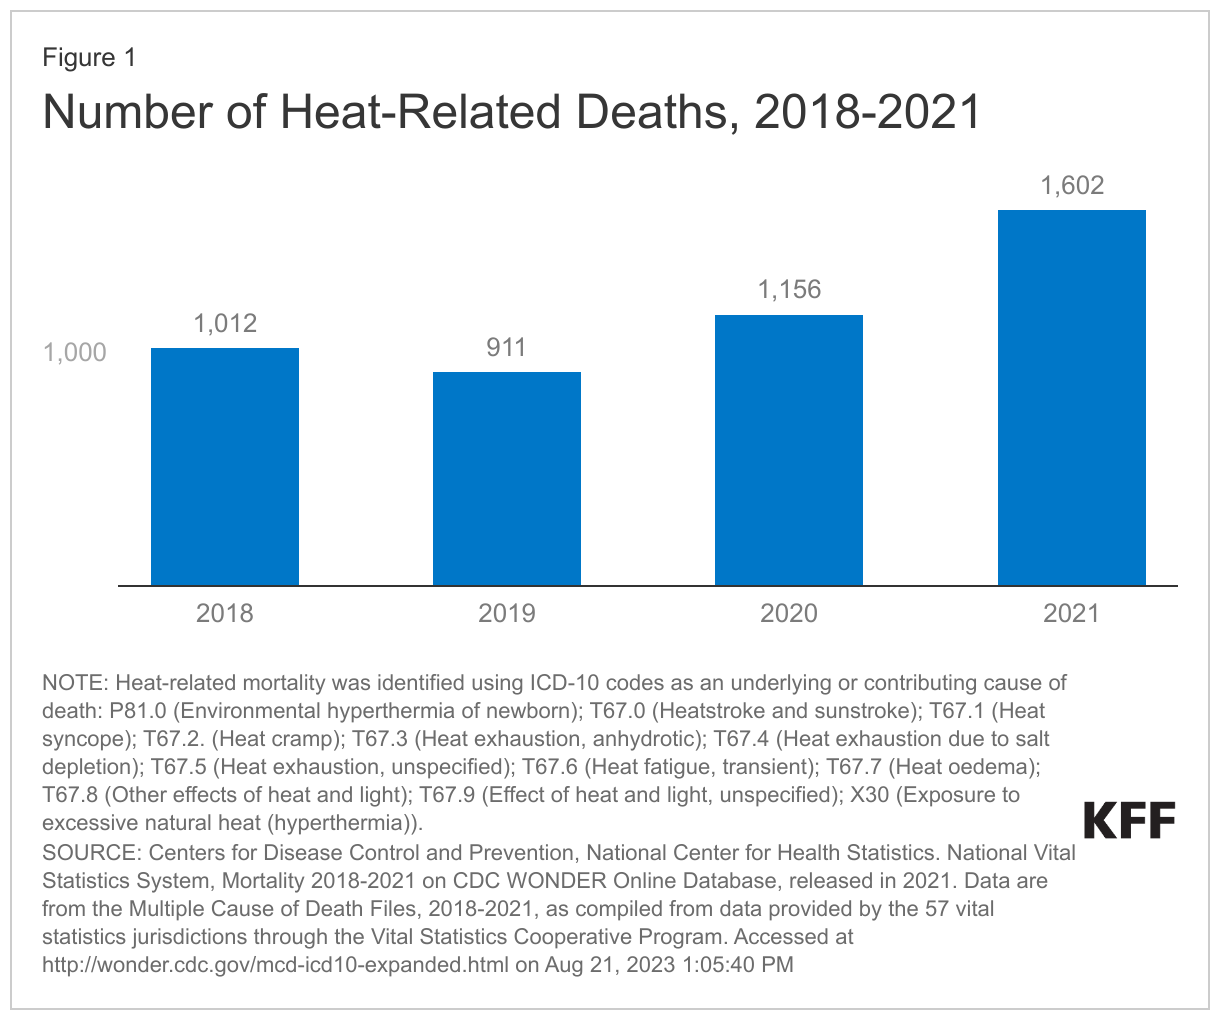
Extreme heat can have serious health impacts, including death. According to the Community Resilience Estimates (CRE) for Heat tool developed by the U.S. Census Bureau and Arizona State University, which accounts for factors such as housing quality, transportation exposure, and financial hardship, nearly a quarter of people in the U.S. are socially vulnerable if exposed to extreme heat. Extreme heat is the leading cause of weather-related deaths, killing more people in the U.S. than any other weather phenomenon. According to mortality data from the Centers for Disease Control and Prevention, between 2018 and 2021, there were a total of 4,681 heat-related deaths, with the number of deaths rising each year from 2019 onward (Figure 1). However, studies suggest that this is likely a vast undercount, and other evidence shows that extreme heat is associated with higher all-cause mortality. One estimate pegs the cost of heat events in the U.S. at approximately $1 billion in excess health care costs each year and, if unaddressed, could cost the U.S. economy approximately $14.5 trillion over the next fifty years.
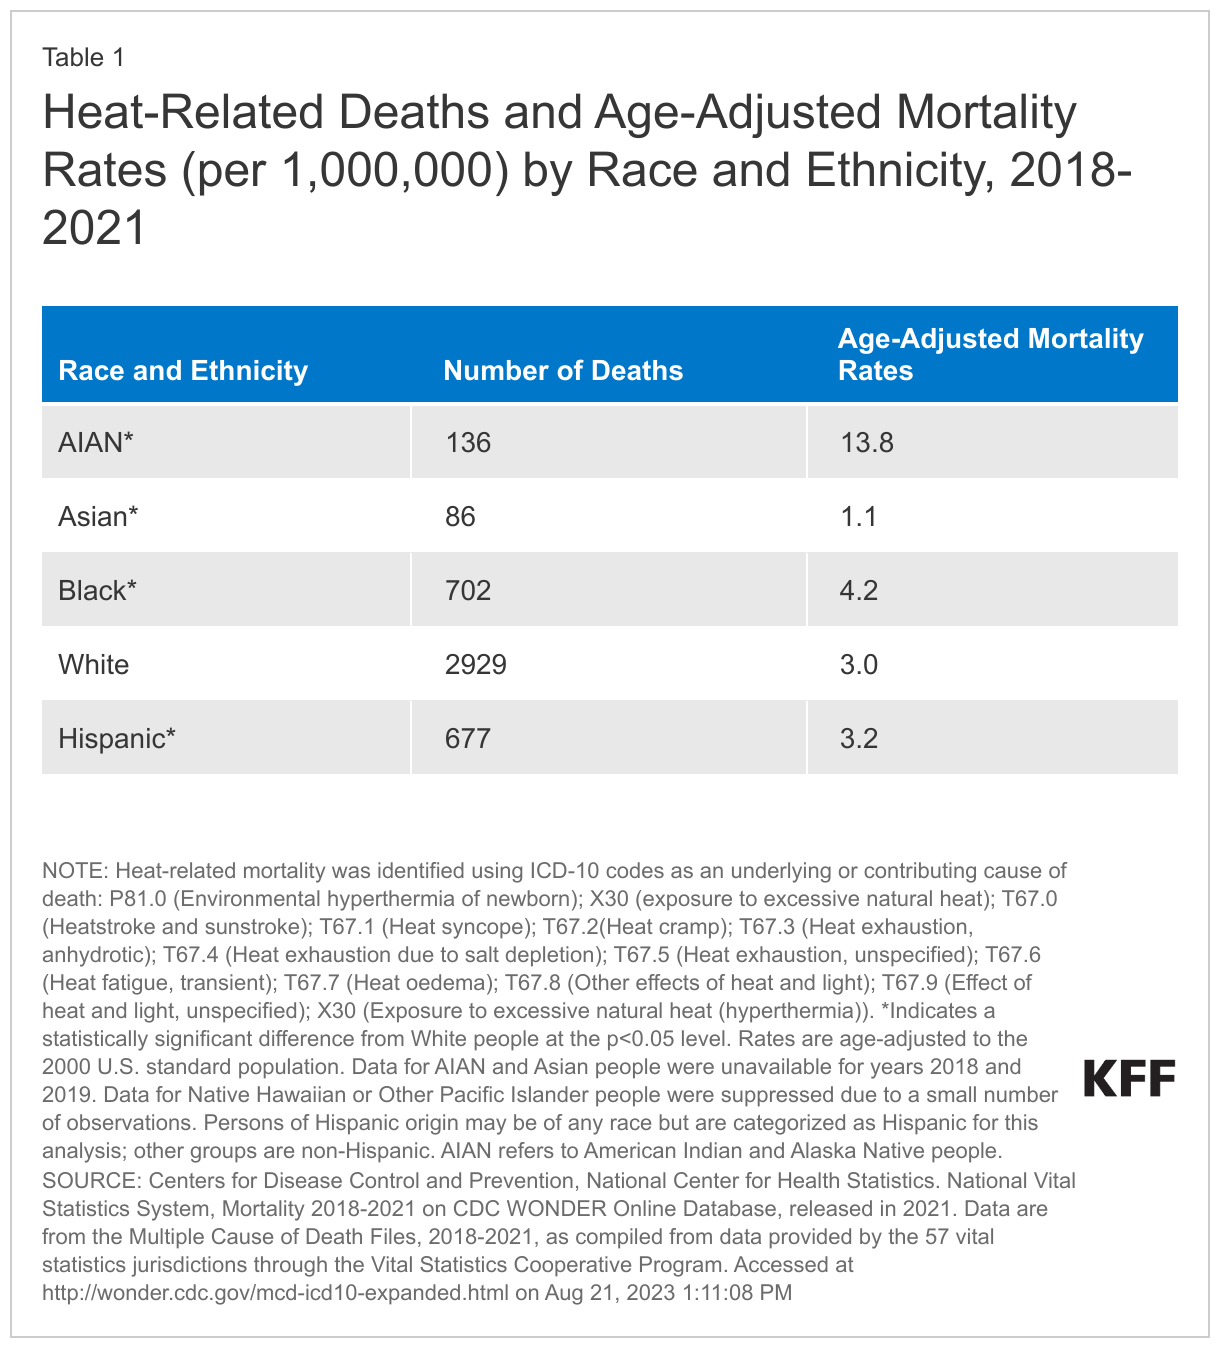
While extreme heat and other climate-related weather events have implications for everyone, they disproportionately affecthistorically marginalized groups who are at higher risk for dying from heat exposure. Recent literature shows that within the U.S., some communities of color have higher risks of heat-related mortality than White people. Consistent with trends in earlier years, between 2018-2021, AIAN people were most likely to die due to heat compared to all other racial and ethnic groups, and Black people had a higher rate of heat-related deaths compared to White people. The rate for Hispanic people was similar to that of White people, while Asian people had a lower rate of heat-related death (Table 1). Data also show that noncitizens are more likely to die from heat exposure compared with citizens.
These higher mortality risks reflect increased exposure to heat due to underlying inequities. Due to historically-codified residential segregation in the U.S. including “redlining,” on average, people of color have a higher likelihood of living in a census tract with higher summer daytime surface urban heat island intensity compared to their White counterparts. Low income communities and communities of color also suffer from tree inequity, increasing the risk of exposure to extreme heat and subsequent heat-related illnesses. Communities that live in these historically zoned areas are also more likely to have higher rates of asthma and cardiovascular illnesses and other diseases that increase their risk of poor health outcomes associated with exposure to climate change-related extreme heat and air pollution. The Southern U.S. and some areas in the Northeast and Midwest have experienced the greatest increases in the number of heat wave days in the U.S., which may have equity implications because these affected areas include higher shares of people of color, and are therefore more likely to be exposed to longer and more intense heat waves. Projections suggest that disparities in extreme heat exposure will continue to persist thirty years from now.
More limited access to air conditioning also contributes to disproportionate exposure to extreme heat and heat-related illnesses. Low-income households, which include disproportionate shares of people of color, face affordability challenges to accessing air conditioning. Lack of air conditioning increases risk of negative health outcomes including death due to heat exposure. Rising temperatures have been associated with increases in mortality among incarcerated people, a population in which people of color are overrepresented, and that sometimes has more limited access to air conditioning. The 2023 Texas heat wave highlighted the impact of lack of air conditioning in prisons. Approximately 13% of deaths in Texas prisons during warm months between 2001 and 2019 were associated with extreme heat in unairconditioned prisons. Further, as temperatures continue to rise, U.S. power grids may be unable to support the surges in energy use due to increase air conditioning and cooling infrastructure usage during heat waves and other extreme weather events.
People of color, noncitizen immigrants, and people with low incomes are more likely to work in jobs with climate-related health risks, including heat. Heat is a top cause of exertion-related occupational injuries and deaths. Workers at risk of heat stress include outdoor workers and workers in hot environments, such as construction workers, agricultural workers, factory workers, firefighters, among others. Migrant or immigrant workers make up significant proportions of farmworkers and are disproportionately exposed to environmental hazards, including heat.
The Occupational Safety and Health Administration (OSHA)and the Center for Disease Control and Prevention have heat stress prevention recommendations, but there currently are no national standards in place to protect workers from exposure to extreme heat. In 2021, OSHA issued a proposed rulemaking to protect workers from extreme heat exposure and heat stress in indoor and outdoor settings by seeking information on issues that may be considered in developing a standard. Since then, OHSA has established an enforcement initiative on heat-related hazards and created a National Advisory Committee to better understand challenges and identify and share best practices to protect workers. However, to date, a standard has not been established. As of Summer 2023, OSHA is seeking feedback from small businesses and local governments on the potential impact of a workplace heat standard on small businesses. Five states currently have occupational heat protection standards. In contrast, Texas Governor Gregg Abbott signed House Bill 2127 that limited local governments’ abilities to regulate work breaks. The law is expected to overturn local ordinances that mandate regular water breaks for workers, including construction workers who are disproportionately exposed to extreme heat
As extreme heat continues to worsen, strategies to mitigate exposure and reduce health risk will be of increasing importance. The Biden Administration has taken some steps to increase awareness and understanding of heat exposure and health risks, including launching a new heat.gov website, and plans to develop a National Heat Strategy. The newly established Office of Climate Change and Health Equity within the Department of Health and Human services aims to address the impact of climate change on health and is developing new tools to help track heat-related illnesses. Other agencies have taken steps to educate individuals and communities about how to protect themselves from extreme heat and to develop more climate-resilient communities. Ongoing efforts to address rising temperatures, reduce risks of heat exposure, and increase protections for those most at-risk for heat exposure will be important for reducing negative health impacts due to extreme heat particularly for groups who already face disparities in health.
A growing body of evidence shows that consolidation in health care provider markets has led to increases in prices without clear evidence of increases in quality. Policymakers and regulators have historically focused on consolidation within the same geographic area, but there have been a large number of mergers and acquisitions (referred to as “mergers” in this brief) between hospitals and health systems that operate in different regions (referred to as “cross-market mergers” in this brief), including several multi-billion dollar deals over just the past couple of years. Some experts have raised concerns that cross-market mergers could result in hospitals and health systems raising their prices. It is also possible that cross-market mergers could result in the elimination of service lines by some acquired hospitals, which may reduce access to care.
This issue brief explains the role and implications of cross-market mergers in hospital and health system markets and describes the approaches that government antitrust agencies have taken in reviewing these types of transactions.
What Is a Cross-Market Merger?
A “cross-market merger” entails a merger between two health care providers that operate in different geographic markets for patient care.1,2 For instance, this term could apply to the following scenarios:
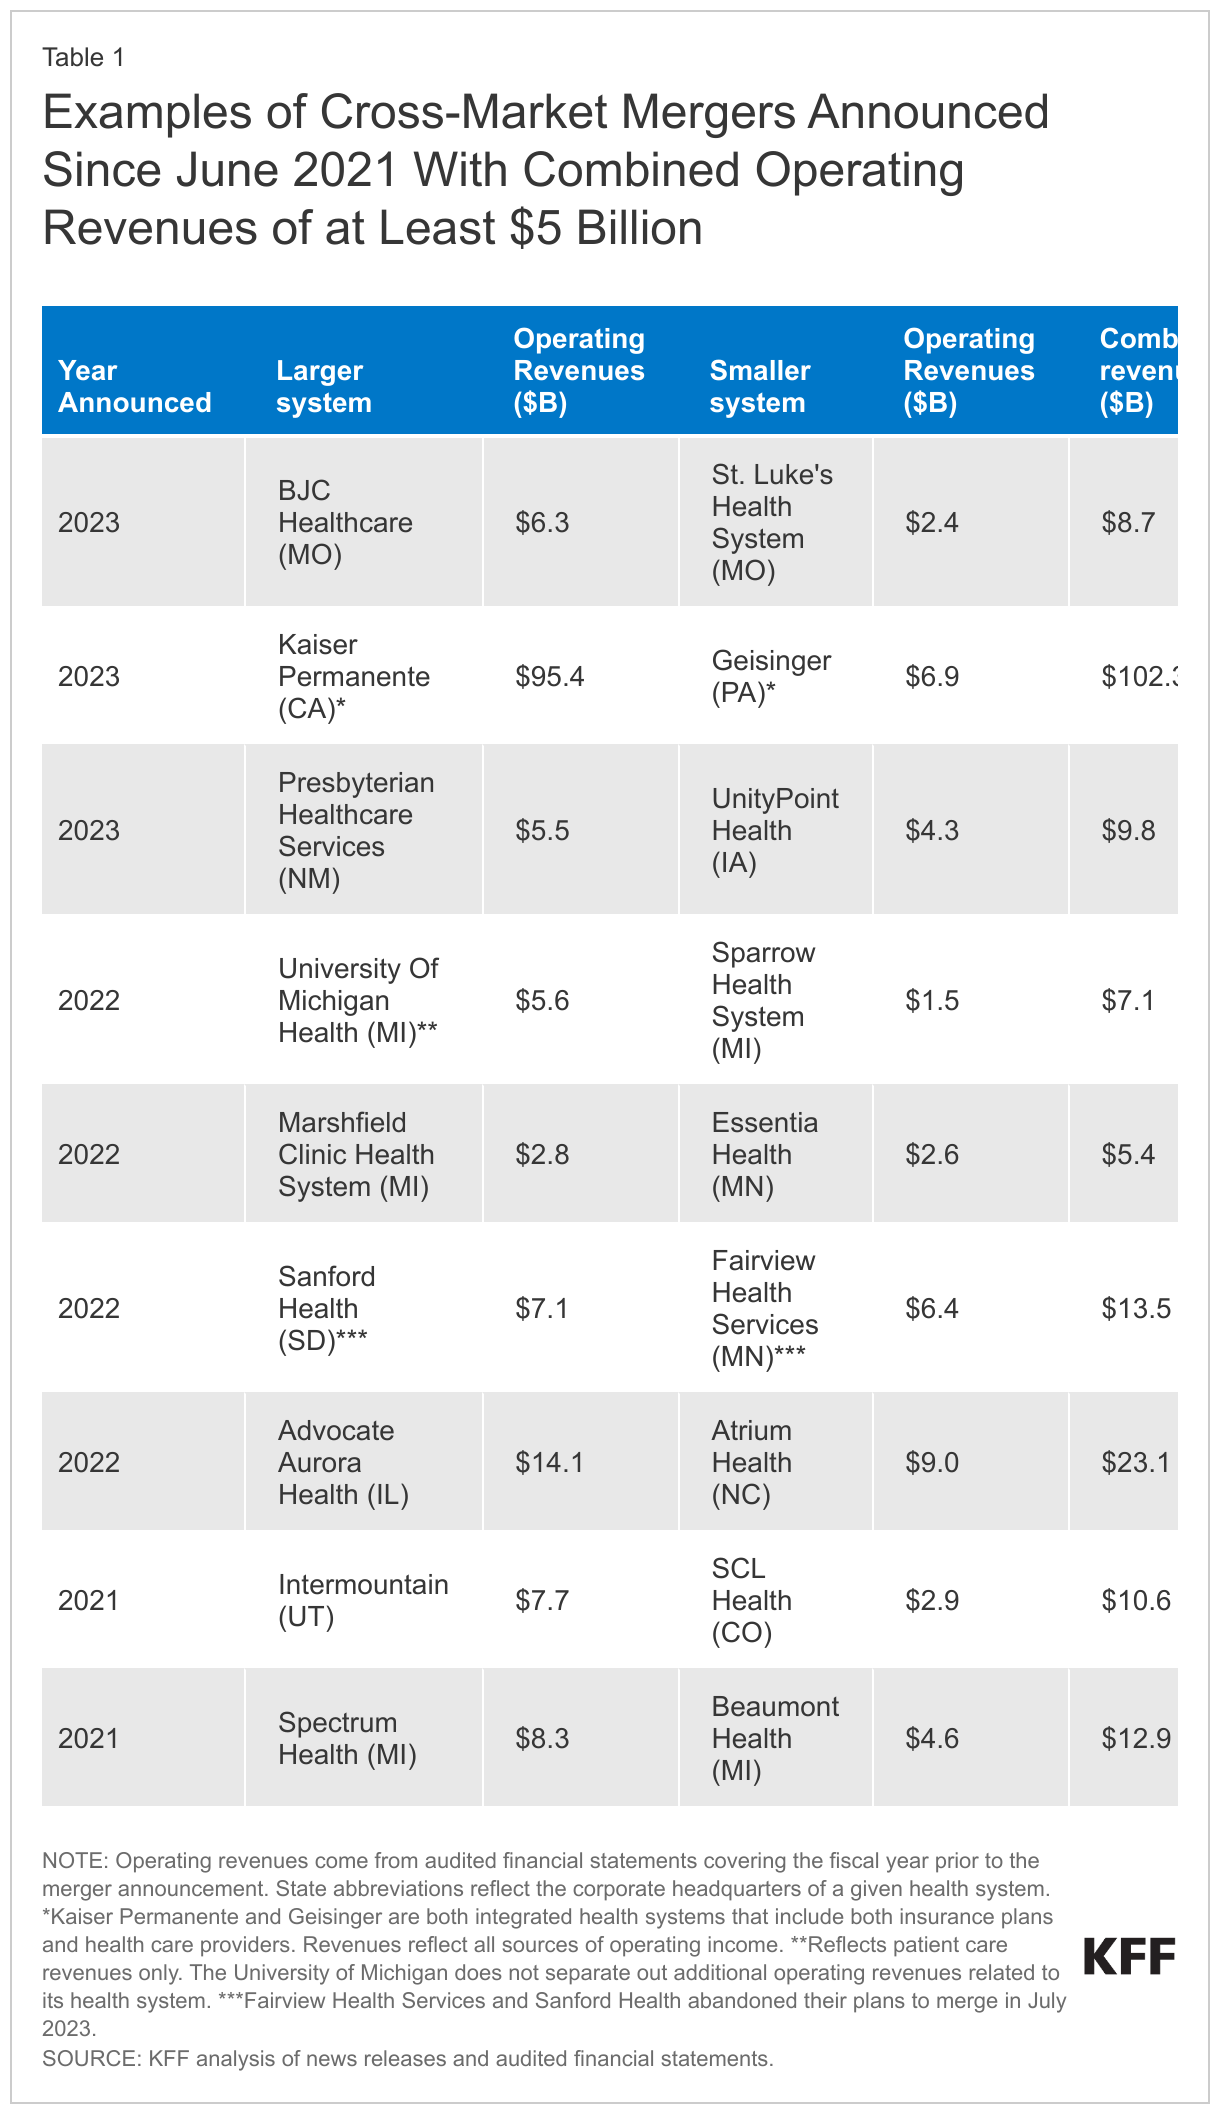
Two health systems that operate in different geographic markets merge. For example, in April 2023, Kaiser Permanente and Geisinger announced their plans to merge. These systems operate in different regions of the United States, with Kaiser Permanente operating in five states in the West (including California) and Georgia, Maryland, Virginia, and DC and Geisinger operating in Pennsylvania. In 2022, Kaiser Permanente and Geisinger earned $95 billion and $7 billion in operating revenues, respectively.3
A health system acquires an independent hospital in a geographic market where it does not operate. One example is Christus Health’s acquisition of Gerald Champion Regional Medical Center in July 2023. Christus Health is a large health system based in Texas that includes 28 hospitals, while Gerald Champion Regional Medical Center is an independent hospital in Alamogordo, New Mexico that is over 200 miles away from the nearest Christus Health facility.
Cross-market mergers can involve hospitals and health systems that are in neighboring markets as well as entities that are hundreds or even thousands of miles apart. An example of the former is the recent merger between University of Michigan Health—which is based in Ann Arbor, Michigan—and Sparrow Health System, which is based about 65 miles away in Lansing, Michigan. An example of the latter is the recently proposed merger of UnityPoint Health—which operates in the Midwest (Iowa, Illinois, and Wisconsin)—and Presbyterian Healthcare Services, which operates in New Mexico.
How Common Are Cross-Market Mergers?
Hospital and health system mergers are common, and many of these mergers involve providers in different geographic markets. For example, according to one study, about 1,500 hospitals were targeted as part of a completed merger or acquisition from 2010 through 2019 and most of these deals (55%) involved hospitals or health systems in different commuting zones. According to another study, about one in eight rural hospitals merged with an out-of-market hospital or health system from 2010 through 2018. A series of large, cross-market mergers in recent years have drawn further attention to this topic. Table 1 below provides examples of nine large, cross-market merger deals announced since June 2021, each of which entailed health systems with combined annual operating revenues of at least five billion dollars.
Cross-market mergers may be appealing to health systems that are seeking to expand for at least a couple of reasons. First, cross-market mergers have received little resistance from government antitrust agencies relative to mergers between health care providers that operate in the same market.4 Second, many health care markets are already highly concentrated, leaving fewer opportunities for health systems to expand within a given region.
What Are the Potential Implications of Cross-Market Mergers?
Cross-market mergers may benefit patients in some instances when hospitals and health systems are able to operate more efficiently as a combined entity. Even if hospitals and health systems are located in different markets, they may be able to share knowledge and best practices with each other, such as by collaborating to develop better clinical practice guidelines and sharing effective strategies and tools for managing patients’ care. Operating at a larger scale may also facilitate providers’ participation in complicated, value-based payment programs, which some health plans offer in an effort to reduce costs and improve the quality of care. Hospitals and health systems merging within and across markets can also potentially achieve efficiencies by purchasing goods and supplies in greater volume.
In some scenarios, small and struggling hospitals may seek to merge with large health systems in order to improve their finances or offer higher-quality services. For example, a large health system with deep pockets could provide a smaller hospital with resources to purchase new equipment and invest in quality improvements or provide a financial backstop and access to capital that may enable a struggling rural hospital to keep its doors open. A large, financially successful system could also share management strategies with hospitals that are losing money to help them operate more efficiently.
However, cross-market mergers may lead to higher prices. In fact, researchers have estimated that these types of deals have led to price increases ranging from 6 to 17 percent, though only a smallnumber of studies have focused on cross-market mergers.
There are at least a few reasons why cross-market mergers could lead to price increases, even though they entail hospitals and health systems that are not competing against each other in the same area. First, a combined health system with providers in, say, different areas of a state may be able to use its dominant position in one market to negotiate higher prices in another when contracting with a given health plan (e.g., a state employee plan with enrollees that reside in several markets). Second, a combined health system may compete with other health systems that also operate across the same markets. In that case, the combined health system may be hesitant to offer lower prices in one market out of concern that their competitor will retaliate by lowering prices and undercutting them in other markets. Finally, a large system that, say, acquires a small hospital may have more expertise in bargaining with insurers, which it could use to negotiate for higher prices.
Another concern that has been raised about certain types of mergers, which could also apply to some cross-market mergers, is that they may reduce access to care. For instance, a large health system that acquires a small rural hospital may be less responsive to community needs and more willing to eliminateservice lines, such as obstetric care. Relatedly, a hospital may also reduce spending on community benefits after being acquired by a health system.
How Do Government Antitrust Agencies Approach Cross-Market Mergers?
Federal and state antitrust agencies seek to promote competitive markets—often to benefit consumers—by scrutinizing mergers and other potentially anticompetitive practices. Antitrust agencies have historically focused on mergers between hospitals and health systems that operate in the same geographic market, though there are signs that they have begun to take a closer look at cross-market mergers. While federal antitrust agencies have yet to formally challenge a cross-market merger, the Federal Trade Commission (FTC) has identified these types of deals as an area of interest and has investigated at least two specific cross-market mergers (between Advocate Aurora Health and Atrium Health and between Spectrum Health and Beaumont Health).5
At the state level, the state attorney general in California has used its legal authority to imposeconditions on mergers that have been identified as cross-market deals. These conditions have included, for example, placing restrictions on price increases and requiring that the merged entities maintain certain services, such as by having a minimum number of emergency room, intensive care, and obstetrics beds. In Minnesota, the state attorney general had begun to investigate whether to challenge a proposed merger between Fairview Health Services (based in Minnesota) and Sanford Health (based in South Dakota) before the two systems abandoned their plans in July 2023.
Cross-market mergers have never been fully-litigated by a federal or state antitrust agency, and doing so in the short term may be difficult. First, only a handful of analyses have focused on cross-market mergers, limiting the ability of regulators to cite potential consequences based on empirical evidence. Second, antitrust agencies have not yet released detailed guidelines for evaluating cross-market mergers,6 nor have they tested legal strategies for challenging cross-market mergers in the courts. In contrast, when antitrust agencies challenge within-market mergers, they can rely on years of legal precedent as well as economic frameworks recognized by the courts. Finally, antitrust litigation can be complex and expensive. Without adequate funding, it may be impractical to challenge a large number of health care provider business practices that raise anticompetitive concerns, including cross-market mergers. Given these challenges, it is conceivable that cross-market mergers will continue unabated in the near future.
Discussion
Hospital and health system mergers are common, and these mergers often involve providers in different geographic markets. Cross-market mergers may have benefits in some scenarios, for example, if the providers involved share effective clinical strategies for improving patient care. However, a handful of studies indicate that cross-market mergers can lead to increases in health care prices. It is also possible that some hospitals may become less responsive to community needs after a cross-market merger. Antitrust agencies have begun to take a closer look at mergers of hospitals and health systems across different geographic regions, which may have a bearing on affordability and access to care in many regions across the country, but they have yet to fully-litigate a cross-market merger.
Some policy and regulatory options have been floated that could address some of the concerns about cross-market mergers. For example, government regulators could use their existing authority to scrutinize cross-market mergers, which antitrust agencies have begun to do. States could enact laws to give government agencies authority to require some or all types of providers to obtain prior approval from the government before merging. California has done so, and attorneys general in the state have used this authority to impose conditions on cross-market mergers to limit price hikes and require that merging entities maintain certain services. In addition, regulators could prohibit certain types of clauses in contracts between providers and insurers that may allow merged entities to leverage market power to negotiate for higher prices in one market based on their strong position in another.7
Each of these policy and regulatory options would involve tradeoffs. For example, determining whether to challenge a given cross-market merger could entail weighing the potential benefits of a merger, such as allowing a small hospital to keep its doors open, against the potential for some harm, such as higher health care prices and potentially less access to care for patients in a given market. As the number of cross-market mergers increases, these concerns and tradeoffs are likely to be on the radar of policymakers and regulators.
This work was supported in part by Arnold Ventures. KFF maintains full editorial control over all of its policy analysis, polling, and journalism activities.
This brief defines cross-market mergers based on providers being in separate geographic markets. We distinguish this from vertical mergers, which occur when there is consolidation between providers that offer different services along the same supply chain, such when a hospital acquires a physician practice. ↩︎
Regulators and researchers have long grappled with how to define the boundaries of geographic markets for health care services. As a result, a merger that is considered to cross markets by some may be identified as occurring within a single market by others. ↩︎
Kaiser Permanente and Geisinger are both integrated health systems that include both insurance plans and health care providers. Revenues reflect all sources of operating income. ↩︎
For example, in 2015, the Federal Trade Commission (FTC) initiated a legal challenge against a planned merger between two Illinois health systems—Advocate Health and Northshore University HealthSystem—arguing that the combined entity would control over half of the market for general acute care inpatient services in the North Shore area of Chicago. The two systems eventually abandoned their plans to merge. However, Advocate Health was later involved in two cross-market mergers—first with Aurora Health (based in the neighboring state of Wisconsin) to form Advocate Aurora Health and then with Atrium Health (based in North Carolina, South Carolina, Georgia, and Alabama) to form Advocate Health. The Federal Trade Commission investigated the latter merger, but the government did not seek to challenge either merger in the courts. ↩︎
The Department of Justice (DOJ) and FTC have taken additional steps that indicate that they are taking a closer at cross-market mergers. For example: (1) in September 2021, the FTC announced that they would be considering cross-market effects in their reviews of large merger deals, (2) in February 2023 and July 2023, respectively, the two agencies withdrew from their health care policy statements which, among other things, may have created a safety zone for large health systems to acquire small hospitals in other markets, and (3) in July 2023, the two agencies released a draft version of their updated guidelines for reviewing mergers that included language which might be used to challenge cross-market mergers (though this is not yet clear). ↩︎
In July 2023, the FTC and DOJ released a draft version of their updated guidelines for reviewing mergers that included language which might be used to challenge cross-market mergers (though this is not yet clear). ↩︎
This would entail banning “all-or-nothing clauses,” which require an insurer that wants to contract with a particular provider in a system to contract with all providers in that system. ↩︎
On Sept. 15, KFF released three follow-up reports examining the exposure to, and belief in, health misinformation among key groups, as well as their trust in different sources of health misinformation:
While health misinformation and disinformation long preceded the pandemic, the pervasiveness of false and inaccurate information about COVID-19 and vaccines brought into further focus the extent to which misinformation can distort public health policy debates and impact the health choices individuals make. KFF COVID-19 Vaccine Monitor surveys in 2021 and 2022 found that large shares of the public believed or were uncertain about false claims related to COVID vaccines and treatments, including myths about the vaccines’ effects on pregnancy and fertility. These surveys also highlighted the roles of traditional and social media as vehicles for spreading and/or combatting misinformation, showing a strong relationship between individuals’ trusted news sources and their propensity to believe false claims about COVID-19.
KFF has focused on providing reliable, accurate, and non-partisan information to help inform health policy in the United States. Yet, in a time where health-related misinformation is so easily accessible and disseminated, understanding the dynamics of misinformation is important to help ensure a robust and fact-based health policy environment. With this understanding, KFF is designing a new program that will identify and track the rise and prevalence of health-related misinformation in the United States, with a special focus on communities that are most adversely affected by health misinformation.
KFF is releasing our Health Misinformation Tracking Poll Pilot as part of this effort, examining the public’s media use and trust in sources of health information and measuring the reach of specific false and inaccurate claims surrounding three health-related topics: COVID-19 and vaccines, reproductive health, and gun violence. Accompanying this overview report of the pilot poll, KFF also released snapshot reports to the field, examining the implications for understanding and combatting misinformation among Black adults, Hispanic adults, and rural residents. Future surveys will explore other health topics for which misinformation has been found to be circulating.
The Misinformation Tracking Poll will work in tandem with our forthcoming Health Misinformation Monitor, a detailed report of the landscape of current health misinformation messages circulating among the public, sent directly to professionals working to combat misinformation. The Misinformation Monitor will be an integral part of KFF’s efforts to deeper analyze the dynamics of misinformation and inform a robust, fact-based health information environment, and will inform the topics we will ask about on future Health Misinformation Tracking Polls.
Key Takeaways for the Field
Health misinformation is widespread, yet the KFF Health Misinformation Tracking Poll Pilot presents a more nuanced perspective on what information people believe. Beliefs influenced by misinformation are not universally entrenched, and a significant portion of the public falls in the middle, susceptible to false claims, but not already bought in. These individuals hold tentative beliefs that lean towards or against misinformation, providing an opportunity to foster a more fact-based public understanding of health issues and informed dialogue.
While it is true that most adults have heard or read many of the false and inaccurate health claims asked about in the survey, relatively small shares of the public have both heard and believe misinformation about central health topics such as COVID-19 and vaccines, reproductive health, and firearm violence and safety. Moreover, while there are some adults who, when presented with false and inaccurate health misinformation, say they believe them to be definitely true, this is a relatively small share of the public. Most adults are uncertain about various items of health misinformation and fall in a potentially “malleable middle” who say the claims are “probably” true or “probably” false. While exposure to misinformation may not necessarily convert the public into ardently believing false health claims, it is likely adding to confusion and uncertainty about already complicated public health topics and may lead to decision paralysis when it comes to individual health care behaviors and choices. In any case, this “malleable middle” presents an opportunity for tailored interventions.
Furthermore, reinforcing accurate information may need to go hand-in-hand with combatting false health claims. When adults in the survey were asked to provide an example of COVID-19 misinformation they have read or heard, some individuals presented true claims as examples of misinformation. While the focus of some anti-misinformation efforts is on combating false claims that circulate widely, the survey reveals that there is a parallel challenge of true claims not being believed. This finding suggests allocating sufficient attention to addressing the skepticism and disbelief surrounding accurate information.
Some groups seem to be more susceptible to misinformation than others, with larger shares of Black and Hispanic adults, those with lower levels of educational attainment, and those who identify politically as Republicans or lean that way saying many of the misinformation items examined in the poll are “probably true” or “definitely true.” News sources also matter as those who say they regularly consume news from One America News Network (OANN), Newsmax, and to a smaller extent Fox News, are consistently more likely to believe most of the misinformation items asked about in the survey.
Media and other messengers can undoubtedly play a key role in efforts to address and to counter health misinformation. Local TV news and network news are among the most used news sources and also among the most likely to be trusted when it comes to health information. While many adults report frequently using social media, few say they would trust health information they may see on these platforms. Despite this, adults who frequently use social media to find health information and advice are more likely to believe that certain false statements about COVID-19 and reproductive health are definitely or probably true.
In an age of declining trust in institutions, some sources are more trusted than others and may have an important role to play in addressing misinformation. As the most trusted source of health information for the public, individual doctors may have an essential role to play in helping dispel false health claims. Additionally, while few media sources are widely trusted by the public as a source of health information, local news stations and network TV news stand out for their widespread use as a source of news and their relatively high level of trust among the public.
The following are the specific health-related claims that have been shown to be false, which were asked about in this KFF Health Misinformation Tracking Poll pilot survey. See the Appendix for more information the sources used to document each claim:
False claims about COVID-19 and vaccines:
“The COVID-19 vaccines have caused thousands of deaths in otherwise healthy people.”
“Ivermectin is an effective treatment for COVID-19.”
“The COVID-19 vaccines have been proven to cause infertility.”
“More people have died from the COVID-19 vaccines than have died from the COVID-19 virus.”
“The measles, mumps, rubella vaccines, also known as MMR, have been proven to cause autism in children.”
False claims about reproductive health:
“Using birth control like the pill or IUDs makes it harder for most women to get pregnant after they stop using them.”
“Sex education that includes information about contraception and birth control increases the likelihood that teens will be sexually active.”
False claims about gun violence:
“People who have firearms at home are less likely to be killed by a gun than people who do not have a firearm.”
“Most gun homicides in the United States are gang related.”
“Armed school police guards have been proven to prevent school shootings.”
False claim about the Affordable Care Act:
In addition to the false claims above, the survey also asked about the longstanding false claim that the Affordable Care Act established government “death panels” for people of Medicare in the question below:
“To the best of your knowledge, did the Affordable Care Act establish a government panel to make decisions about end-of-life care for people on Medicare?”
Exposure to and Belief in Health Misinformation Claims
Overall, health misinformation is widely prevalent in the U.S. with 96% of adults saying they have heard at least one of the ten items of health-related misinformation asked about in the survey. The most widespread misinformation items included in the survey were related to COVID-19 and vaccines, including that the COVID-19 vaccines have caused thousands of deaths in otherwise healthy people (65% say they have heard or read this) and that the MMR vaccines have been proven to cause autism in children (65%).
Regardless of whether they have heard or read specific items of misinformation, the survey also asked people whether they think each claim is definitely true, probably true, probably false, or definitely false. For most of the misinformation items included in the survey, between one-fifth and one-third of the public say they are “definitely” or “probably true.” While the most frequently heard claims are related to COVID-19 and vaccines, the most frequently believed claims were related to guns, including that armed school police guards have been proven to prevent school shootings (60% say this is probably or definitely true), that most gun homicides in the U.S. are gang-related (43%), and that people who have firearms at home are less likely to be killed by a gun than those who do not (42%).
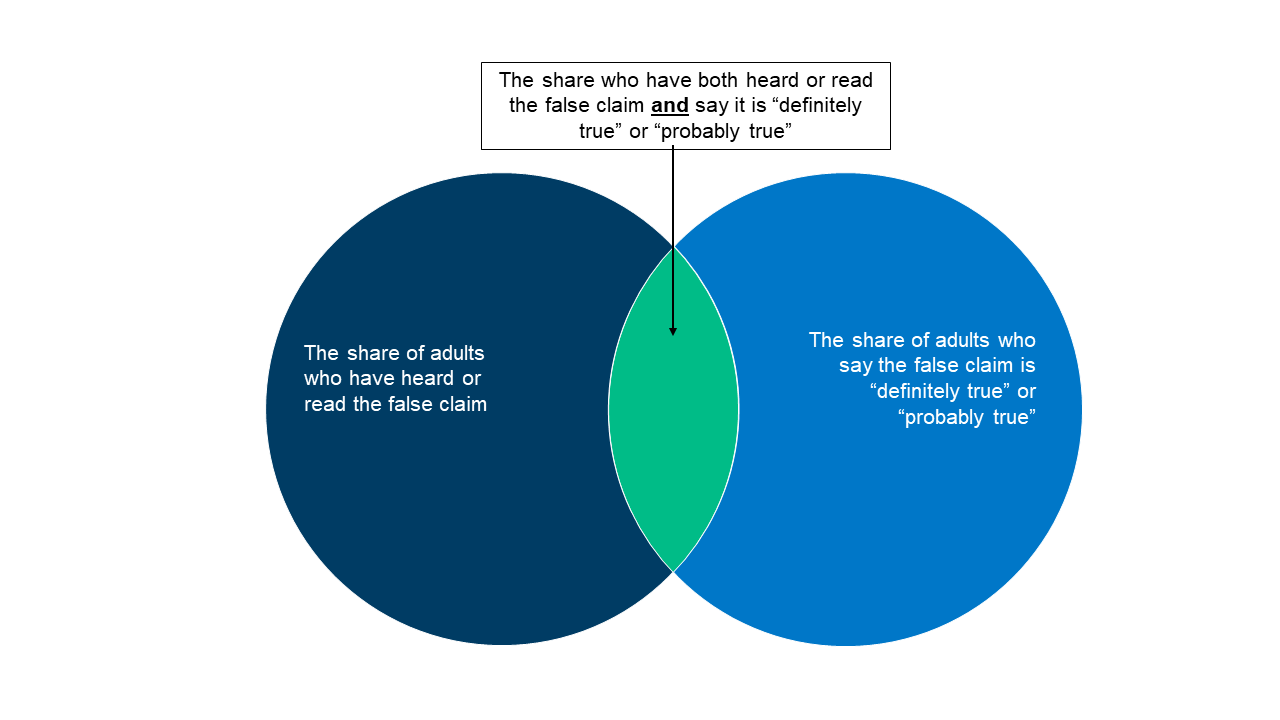
Combining these measures, the share of the public who both have heard each false claim and believe it is probably or definitely true ranges from 14% (for the claim that “more people have died from the COVID-19 vaccine than from the virus”) to 35% (“armed school police guards have been proven to prevent school shootings”).
Measures of Health Misinformation
This report examines three measures of health misinformation among the public. Adults were asked whether they had heard or read specific false health-related statements. Regardless of whether they have heard or read specific items of misinformation, all were asked whether they thought each claim was definitely true, probably true, probably false, or definitely false. We then combined these two measures in order to examine the share who have heard the false claims and believe it is definitely or probably true.
Uncertainty is high when it comes to health misinformation. While fewer than one in five adults say each of the misinformation claims examined in the survey are “definitely true,” larger shares are open to believing them, saying they are “probably true.” Many lean towards the correct answer but also express uncertainty, saying each claim is “probably false.” Fewer tend to be certain that each claim is false, with the exception of the claim that more people have died from the COVID-19 vaccines than from the virus itself, which nearly half the public (47%) recognizes as definitely false.
The range of people’s responses when presented with false claims – ranging from definitely true to definitely false – suggests different potential approaches for directing interventions among different groups. Those who say false health claims are “probably false” may benefit from having accurate information reinforced to them by trusted messengers such as their doctor or family and friends in the medical or health fields. However, those who say health-related misinformation items are “probably true” may require a different approach. While adults in each level of belief and disbelief of health misinformation present a unique opportunity for different tactics of interventions and outreach, the remainder of this report focuses on the group who say the false claims examined were “definitely true” or “probably true,” as this group represents adults who have bought in or are at the greatest risk of buying into the health misinformation items asked about in this survey.1
COVID-19 and Vaccine Misinformation
Across the five COVID-19 and vaccine related misinformation items, adults without a college degree are more likely than college graduates to say these claims are definitely or probably true. Notably, Black adults are at least ten percentage points more likely than White adults to believe some items of vaccine misinformation, including that the COVID-19 vaccines have caused thousands of sudden deaths in otherwise healthy people, and that the MMR vaccines have been proven to cause autism in children. Black (29%) and Hispanic (24%) adults are both more likely than White adults (17%) to say that the false claim that “more people have died from the COVID-19 vaccine than have died from the COVID-19 virus” is definitely or probably true. Those who identify as Republicans or lean towards the Republican Party and pure independents stand out as being more likely than Democratic leaning adults to say each of these items is probably or definitely true. Across community types, rural residents are more likely than their urban and suburban counterparts to say that some false claims related to COVID vaccines are probably or definitely true, including that the vaccines have been proven to cause infertility and that more people have died from the vaccine than from the virus.
Educational attainment appears to play a particularly important role when it comes to susceptibility to COVID-19 and vaccine misinformation. Six in ten adults with college degrees say none of the five false COVID-19 and vaccine claims are probably or definitely true, compared to less than four in ten adults without a degree. Concerningly, about one in five rural residents (19%), adults with a high school education or less (18%), Black adults (18%), Republicans (20%), and independents (18%) say four or five of the false COVID-19 and vaccine misinformation items included in the survey are probably or definitely true.
Reproductive Health Misinformation
The KFF Health Misinformation Tracking Poll asked about two misinformation items related to reproductive health and these two false claims appear to have different audiences. When asked about birth control leading to issues getting pregnant after cessation, younger adults – particularly younger women – are more likely to have heard this and to say this is probably or definitely true. However, when asked about sex education among teens leading to more sexual activity, older adults are more likely to say it is definitely or probably true. For both of these false reproductive health claims, adults without a college education, Republicans, and pure independents are more likely than their counterparts to say the claims are probably or definitely true. Black and Hispanic adults – groups who experience disparities in both health outcomes and in access to care – are more likely than White adults to say both of these false reproductive health claims are definitely or probably true.
Gun-Related Misinformation
When it comes to misinformation on gun-related violence, educational attainment again appears related to susceptibility to misinformation as those without a college degree are more likely than college graduates to say the firearm misinformation items are probably or definitely true. Notably, White (63%) and Hispanic (57%) adults are more likely than Black adults (48%) to say the claim that armed school police have been proven to prevent school shootings is definitely or probably true. Gun-related misinformation appears to be heavily politically charged, with Republicans and independents more likely than Democrats to say each of the claims regarding gun-related violence are probably or definitely true. Nearly three in four rural residents (73%) say that the claim that armed school police have been proven to prevent school shootings is definitely or probably true compared to fewer urban (56%) and suburban (58%) residents.
Gun owners are no more likely to have heard each of these items compared to those who do not own a gun, yet they are more likely to say each is definitely or probably true.
Affordable Care Act Misinformation
Some misinformation claims can have longevity and lead to longstanding public confusion and uncertainty. The KFF Health Misinformation Tracking Poll also asked about the false claim that the Affordable Care Act (ACA) established a government panel to make decisions on end-of-life care for people on Medicare. This is a long-standing myth about the ACA and previous KFF research has found that most adults could not accurately identify that the law did not set up such a panel. In the latest survey, seven in ten adults say they are not sure whether the ACA established a government panel to make end-of-life decisions for people on Medicare, and a further 8% incorrectly answer that the law did establish these panels. Just one in four adults (23%) – including three in ten Democrats – know that the ACA did not establish these so-called “death panels.” Notably, adults ages 65 and older (most of whom have Medicare coverage) are more likely than adults under the age of 30 to correctly answer that the ACA did not establish government panels for end-of-life decisions for those on Medicare.
Views of Health Misinformation and Responsibility for Combatting It
Large majorities of U.S. adults say that the spread of false and inaccurate information generally (86%) and the spread of false and inaccurate information related to health issues (74%) are major problems. This includes large shares across age, gender, education, and partisanship.
While a large majority of the public believes that false and inaccurate health information is a major problem, the COVID-19 pandemic underscored the complex nature of what the public sees as health misinformation in the United States. The current polarized political and media climate can lead to very different views of what constitutes misinformation.
The KFF Health Misinformation Tracking Poll asked adults to provide an example of COVID-19 misinformation that they have read or heard, and many examples were in direct contradiction with one another. For example, many cited things they had heard about facemasks that they perceive to be untrue. However, while some cited claims of masks not helping to curb the spread of the virus as misinformation, others cited claims that masking did help prevent the spread as a misinformation item. Similarly, adults provide contradictory claims about the COVID-19 vaccines’ safety and efficacy as examples of misinformation they have read or heard.
In Their Own Words: Can you provide an example of misinformation related to COVID-19 that you read or heard about in the media or elsewhere?
“That wearing a mask would not help prevent the spread” – 35 year-old Hispanic woman in Mississippi
“That masks stop the spread” – 52 year-old White woman in Ohio
“That masks don’t need to be worn” – 72 year-old White woman in Arizona
“The use of masks reduces chances of getting COVID-19” – 26 year-old Hispanic man in Texas
“Taking the COVID shot will protect you that was all a LIE.” – 54 year-old Hispanic man in Florida
“The vaccines were ok to use” – 27 year-old Black woman in Texas
“Vaccines not being effective” – 62 year-old White woman in Massachusetts
“Vaccines do not work or are dangerous” – 75 year-old White woman in New Jersey
This lack of consensus on what constitutes health misinformation adds to the difficulty of curbing the spread of false and inaccurate health and medical claims. Nonetheless, the public sees a role for government, media, and social media companies to tackle this issue. At least two-thirds of adults say that Congress, President Biden, the U.S. news media, and social media companies are not doing enough to limit the spread of false and inaccurate health information. Despite often divided views on the role of government and media, majorities of adults across age, gender, education, and partisanship say each of these entities is not doing enough.
Trusted Sources of Information and News
With large shares of the public unable to identify many health-related misinformation items as definitely false, trusted messengers and sources have an important role to play in efforts to combat the proliferation of health misinformation. Not surprisingly, individual doctors are the most trusted source, with 93% of the public saying they have a great deal or a fair amount of trust in their own doctor to make the right recommendations on health issues.
When it comes to government agencies, most adults have at least a fair amount of trust in the FDA and CDC to make the right recommendations on health issues, though just one in four have a great deal of trust in the CDC and one in five have a great deal of trust in the FDA. Fewer say they trust the Biden Administration on health issues, and Republicans are less likely than Democrats to trust the Administration, as well as the CDC and the FDA.
Traditional News Media Use and Trust
The proliferation of media sources has led to many adults having a varied media diet. Local TV news, national network news, and digital and online news aggregators are the top news sources for U.S. adults, with over half saying they regularly read, watch, or listen to each.
There are variations in consumption of traditional news sources. Adults under age 30 are less likely than older adults to say they regularly watch local news but are more likely to use digital or online news aggregators that summarize various traditional and nontraditional news sources, such as Apple or Yahoo News. More than seven in ten Black (77%) and Hispanic (71%) adults say they regularly watch their local TV news station compared to 59% of White adults. Similarly, White adults (52%) are less likely to watch national network news regularly compared to Black (74%) and Hispanic (65%) adults. A majority of Republicans (57%) say they regularly watch Fox News to say up-to-date on current events, whereas a majority of Democrats (55%) say they watch CNN. Yet notably, more than six in ten Democrats and Republicans say they also regularly watch their local TV news channel, underscoring the wide reach of local news.
Regardless of whether they are regular viewers, the survey measured how much individuals would trust information about health issues that was reported by each of these sources. At least seven in ten U.S. adults say they would have at least “a little” trust in health information reported by their local TV news station, national network news, or their local newspaper. However, fewer than three in ten adults say they would have a lot of trust in health information reported by each of the media sources asked about in the survey.
The picture of trust in health information from various news sources looks somewhat different when looking only at those who are regular users of each source. Not surprisingly, regular users are much more likely than those who do not use each news source to say they would have a lot of trust in health information reported by that source. However, there is variation among news sources in how much their regular users trust the information they report. For example, majorities of regular users of NPR (59%) and the New York Times (52%) say they would trust health information reported on these platforms “a lot,” while a third of regular MSNBC viewers (34%) and Fox News viewers (36%) say they would place a lot of trust in health information reported there. For most other sources, the share of regular users who say they would have a lot of trust in health information they report ranges from three to four in ten.
Social Media Use and Trust
Most adults (55%) say they use social media at least once a week to keep up-to-date on news and current events, including a third (33%) who say they use it every day. About one in four (24%) say they use social media at least weekly to find health information and advice, though four in ten say they “never” do this. Larger shares of Hispanic and Black adults compared to White adults, and younger adults compared to older adults, say they regularly use social media for both news and health information. Hispanic adults are particularly likely to say they regularly use social media, with seven in ten (70%) saying they use it weekly for news and current events and half (49%) saying they use it weekly for health information and advice. While similar shares across education and income groups say they use social media for news, larger shares of those without college degrees and those living in lower-income households report using social media to find health information and advice compared to those with college degrees and higher incomes.
The most commonly used social media platforms included in the survey are YouTube and Facebook, with more than six in ten saying they use each of these platforms at least weekly. Regardless of whether they use the platforms, about half say they would have at least a little trust in information about health issues if they saw it on YouTube and four in ten say the same about Facebook. However, fewer than one in ten say they would have a lot of trust in health information seen on any of the platforms included in the survey.
Even among the those who frequently use specific social media sites, very few say they would have a lot of trust in health information if they saw it on these platforms. One in six Reddit weekly users say they would have a lot of trust in health information if they saw it on that platform, with similar shares of weekly TikTok, YouTube, and Twitter users expressing a lot of trust in health information they may see on those platforms.
Information Sources and Exposure and Belief in Health Misinformation
Similar to previous KFF surveys, this survey shows that consumption of different types of news media is correlated with belief in health misinformation. For example, when it comes to the falsehoods about COVID-19 and vaccines tested in the survey, just under half (45%) of all adults say they have both heard at least one of these falsehoods and believe it to be probably or definitely true. This share rises to about three in four among regular viewers of Newsmax, two-thirds among regular viewers of OANN, and six in ten among regular viewers of Fox News. In comparison, three in ten of those who regularly get news from NPR or the New York Times, and about four in ten who regularly get news from their local newspaper or national network news said the same.
Social media use is also correlated with being exposed and inclined to believe health misinformation. For example, a majority of those who use social media for health information and advice at least weekly say that they have heard at least one of the false COVID-19 or vaccine claims tested in the survey and think it is definitely or probably true, compared to four in ten of those who don’t use social media for health advice.
KFF also released additional analysis from the Health Misinformation Tracking Poll Pilot examining media use and trust and exposure and susceptibility to health misinformation among Black adults, Hispanic adults, and rural residents.
Support for this work was provided by the Robert Wood Johnson Foundation (RWJF). The views expressed do not necessarily reflect the views of RWJF. KFF maintains full editorial control over all of its policy analysis, polling, and journalism activities.
Methodology
This KFF Health Misinformation Tracking Poll Pilot was designed and analyzed by public opinion researchers at KFF. The survey was conducted May 23 – June 12, 2023, online and by telephone among a nationally representative sample of N=2,007 U.S. adults in English (1,881) and in Spanish (126). The sample includes 1,532 adults reached through the SSRS Opinion Panel either online or over the phone (n=78 in Spanish). The SSRS Opinion Panel is a nationally representative probability-based panel for which panel members are recruited randomly in one of two ways: (a) Through invitations mailed to respondents randomly sampled from an Address-Based Sample (ABS) provided by Marketing Systems Groups (MSG) through the U.S. Postal Service’s Computerized Delivery Sequence (CDS); (b) from a dual-frame random digit dial (RDD) sample provided by MSG. For the online panel component, invitations were sent to panel members by email followed by up to three reminder emails. 1,445 panel members completed the survey online and panel members who do not use the internet were reached by phone (87).
Another 475 (n=48 in Spanish) interviews were conducted from a random digit dial telephone sample of prepaid cell phone numbers obtained through MSG. Phone numbers used for the prepaid cell phone component were randomly generated from a cell phone sampling frame with disproportionate stratification aimed at reaching Hispanic and non-Hispanic Black respondents. Stratification was based on incidence of the race/ethnicity groups within each frame. Respondents in the prepaid phone samples received a $15 incentive by check received by mail, and panel respondents received a $5 electronic gift card incentive (some harder-to-reach groups received a $10 electronic gift card).
The online questionnaire included two questions designed to establish that respondents were paying attention. Cases that failed both attention check questions, those with over 30% item non-response, and cases with a length less than one quarter of the mean length by mode were flagged and reviewed. Cases were removed from the data if they failed two or more of these quality checks. Based on this criterion, 0 cases were removed.
The combined cell phone and panel samples were weighted to match the sample’s demographics to the national U.S. adult population using data from the Census Bureau’s 2021 Current Population Survey (CPS). Weighting parameters included sex, age, education, race/ethnicity, region, and education. The sample was weighted to match patterns of civic engagement from the September 2017 Volunteering and Civic Life Supplement data from the CPS and to match frequency of internet use from the National Public Opinion Reference Survey (NPORS) for Pew Research Center. Finally, the sample was weighted to match patterns of political party identification based on a parameter derived from recent ABS polls conducted by SSRS polls. The weights take into account differences in the probability of selection for each sample type (prepaid cell phone and panel). This includes adjustment for the sample design and geographic stratification of the cell phone sample, within household probability of selection, and the design of the panel-recruitment procedure.
The margin of sampling error including the design effect for the full sample is plus or minus 3 percentage points. Numbers of respondents and margins of sampling error for key subgroups are shown in the table below. For results based on other subgroups, the margin of sampling error may be higher. Sample sizes and margins of sampling error for other subgroups are available by request. Sampling error is only one of many potential sources of error and there may be other unmeasured error in this or any other public opinion poll. KFF public opinion and survey research is a charter member of the Transparency Initiative of the American Association for Public Opinion Research.
Support for this work was provided by the Robert Wood Johnson Foundation (RWJF). The views expressed do not necessarily reflect the views of RWJF. KFF maintains full editorial control over all of its policy analysis, polling, and journalism activities.
Group
N (unweighted)
M.O.S.E.
Total
2007
± 3 percentage points
Party ID
Democrat/Lean Democrat
968
± 5 percentage points
Republican/Lean Republican
632
± 5 percentage points
Independents
382
± 7 percentage points
Race/Ethnicity
White, non-Hispanic
866
± 4 percentage points
Black, non-Hispanic
510
± 6 percentage points
Hispanic
514
± 6 percentage points
Appendix
The KFF Health Misinformation Tracking Poll sought to examine the public’s exposure to and belief in a number of health-related misinformation claims. The statements included in the survey were selected based on public media documentation that these are claims that have been shared and spread in recent years and have been shown to be false or inaccurate. Below are some of the documented sources used to establish the existence of these misinformation claims and sources used to document their inaccuracy.
Statement
Source documenting presence in public health conversation
Source documenting falsehoods and inaccuracy of the statement
The COVID-19 vaccines have caused thousands of deaths in otherwise healthy people.
The subsequent analysis and discussion in this report largely focuses on the share of adults who say each item of health misinformation presented examined in the survey is probably or definitely true, regardless of whether they’ve heard it. While exposure to health misinformation is a concern, the KFF analysis presented focuses on those who are most susceptible to the health misinformation claims when they are presented and say they are probably or definitely true. ↩︎