KFF designs, conducts and analyzes original public opinion and survey research on Americans’ attitudes, knowledge, and experiences with the health care system to help amplify the public’s voice in major national debates.
The recently released KFF/Washington Post Trans Survey, the most in-depth, representative survey of transgender adults living in the U.S., was aimed at providing a deeper understanding of trans people’s experiences in the U.S. over the life span including during childhood, through gender transition, and present wellbeing. Building on that report, and using the survey data, this analysis provides the most comprehensive representative profile of trans Americans ever complied, while also offering insights on their experiences in the health care system. While some federal surveys include a representative share of trans people, demographic questions tend to be fairly general and do not allow for more in depth analysis of the experiences and identities of trans people, particularly related to health access. At a time when issues around LGBTQ rights, including in health care, are at the forefront of national conversations, understanding trans people’s experiences and wellbeing is especially timely.
The survey included interviews with 515 trans and gender non-conforming individuals and a comparison sample of 823 cisgender adults. Trans adults include those who identify as transgender or as a trans adult; cisgender (non-trans) adults include those do not identify as trans and their gender is the same as their sex assigned at birth. For more information about sampling and method of recruitment, see the methodology section in the full report.
Identities
Gender Identity. Gender identity is based on one’s intrinsic sense of who they are, be that male, female, transgender, non-binary, or some other identity. When one’s gender identity aligns with their sex assigned at birth they are considered cisgender. When one’s gender identity does not align with sex assigned at birth, they are often described as being transgender, though many people use other terms to describe themselves, including being gender nonconforming or nonbinary, among others.
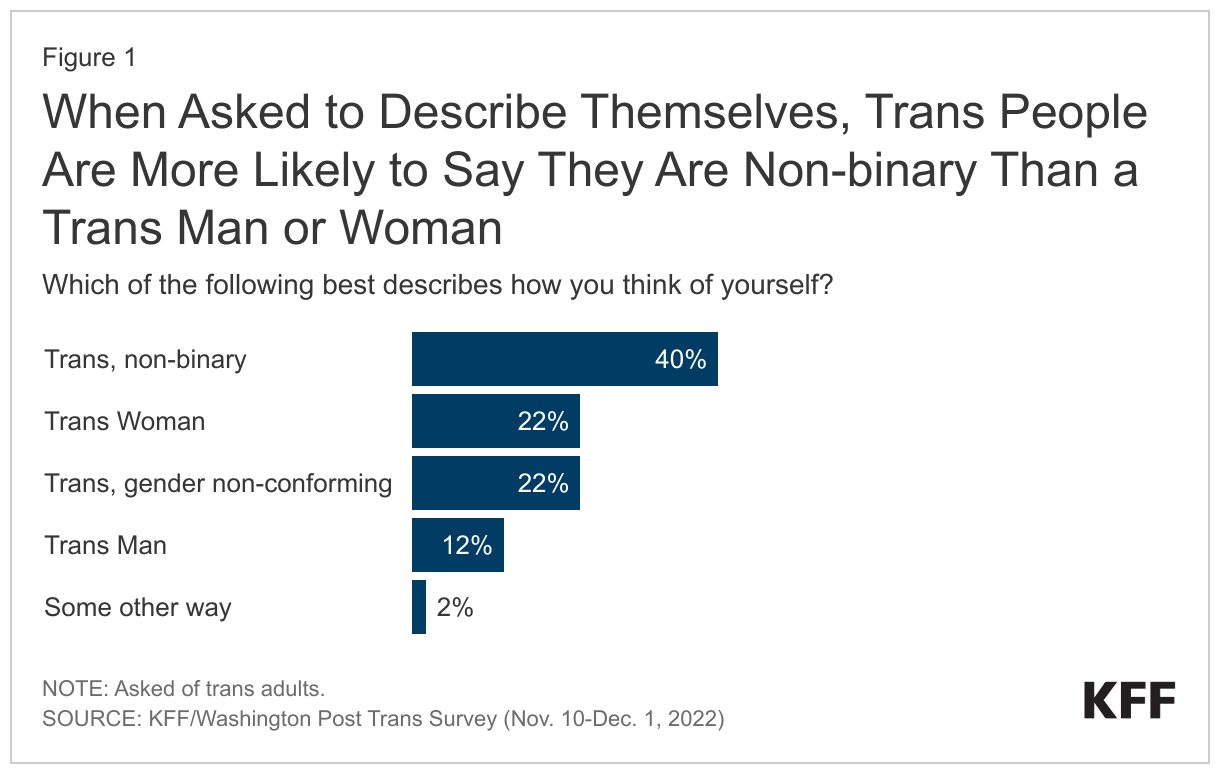
When asked how they think of themselves, a plurality of trans adults identify as non-binary (40%), with about one in five identifying as trans women (22%) or gender non-conforming (22%), and a smaller share identifying as trans men (12%). Others say they identify in some other way (2%). Some use one term and others use multiple terms. Those who described themselves in “some other way” commonly described themselves as agender or genderfluid when asked to specify. Those aged 18 to 34 are more likely to identify as non-binary than those aged 35 or older (47% v 32%).
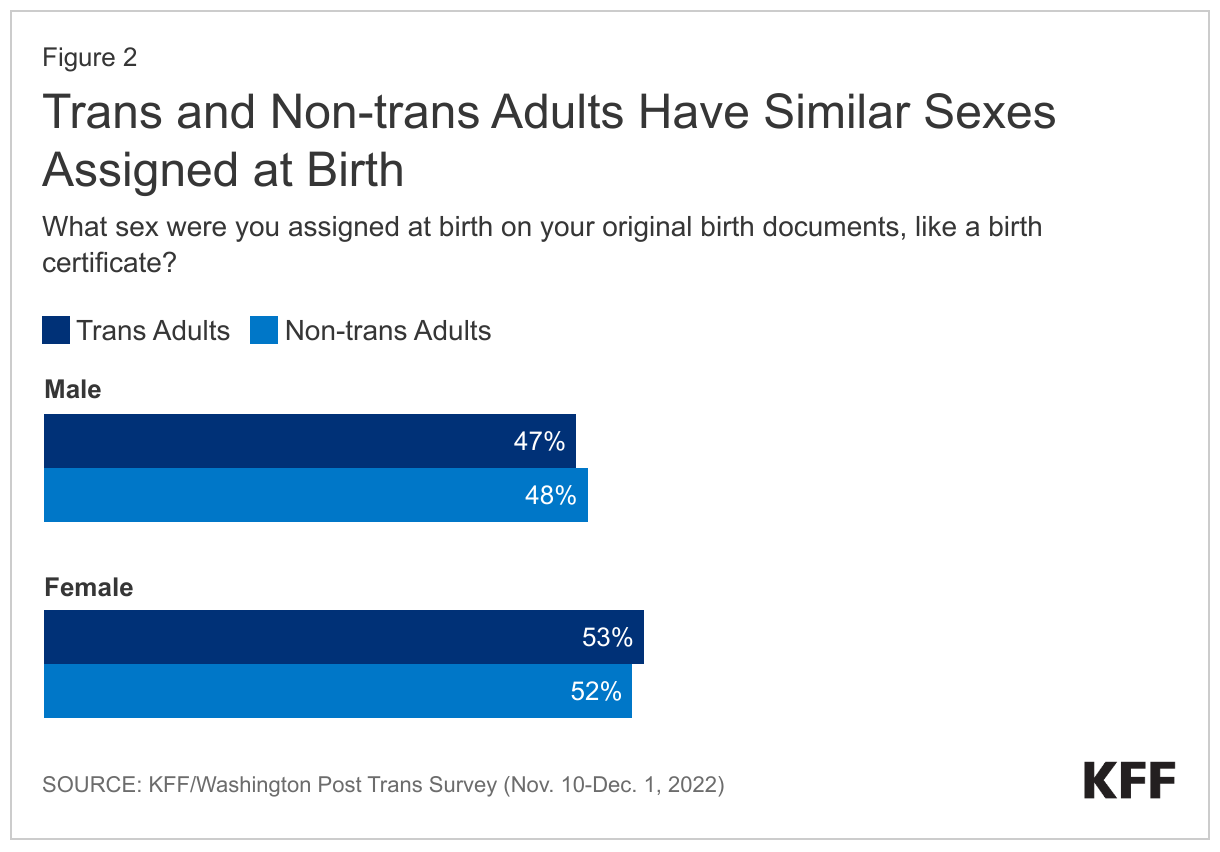
Sex assigned at birth. Sex assigned at birth differs from gender identity because it is based on phenotypic sex characteristics and is the sex stated on an individual’s birth certificate. It may or may not align with gender identity. Trans and non-trans adults are equally likely to have been assigned either male or female at birth.
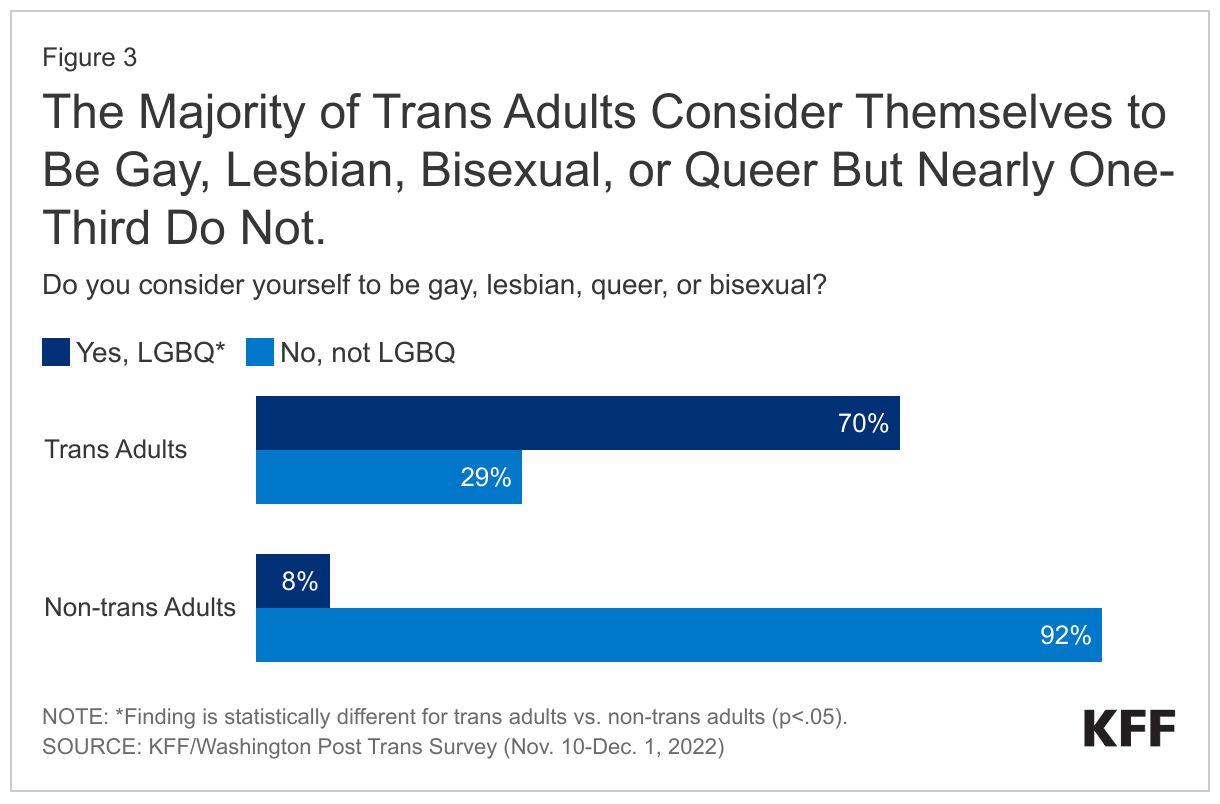
Sexual orientation. Sexual orientation is separate from sex assigned at birth (being biologically male, female, or intersex) and gender identity (which is based on an internal sense of being such as being cisgender or transgender, among other identities). Sexual orientation refers to the gender or genders someone experiences sexual, emotional, or romantic attraction or attachment to. Heterosexual/straight, lesbian, gay, bisexual, and queer are examples of sexual orientations. Most (70%) trans adults considered themselves to be lesbian, gay, bisexual or queer while just 8% of non-trans adults did so. However, three in ten (29%) trans adults do not identify as lesbian, gay, bisexual, or queer.
Pronoun use. Pronouns are a shorthand way of referring to an individual without using their name. Often, pronouns connote gender as is the case with he/him or she/her. Some adults, especially LGBTQ adults, and trans or nonbinary adults in particular, use a pronoun that would not traditionally be associated with their sex assigned at birth or does not reflect the historic gender binary (male/female), such as they/them. In addition, some adults use multiple pronouns or are comfortable with any pronouns.
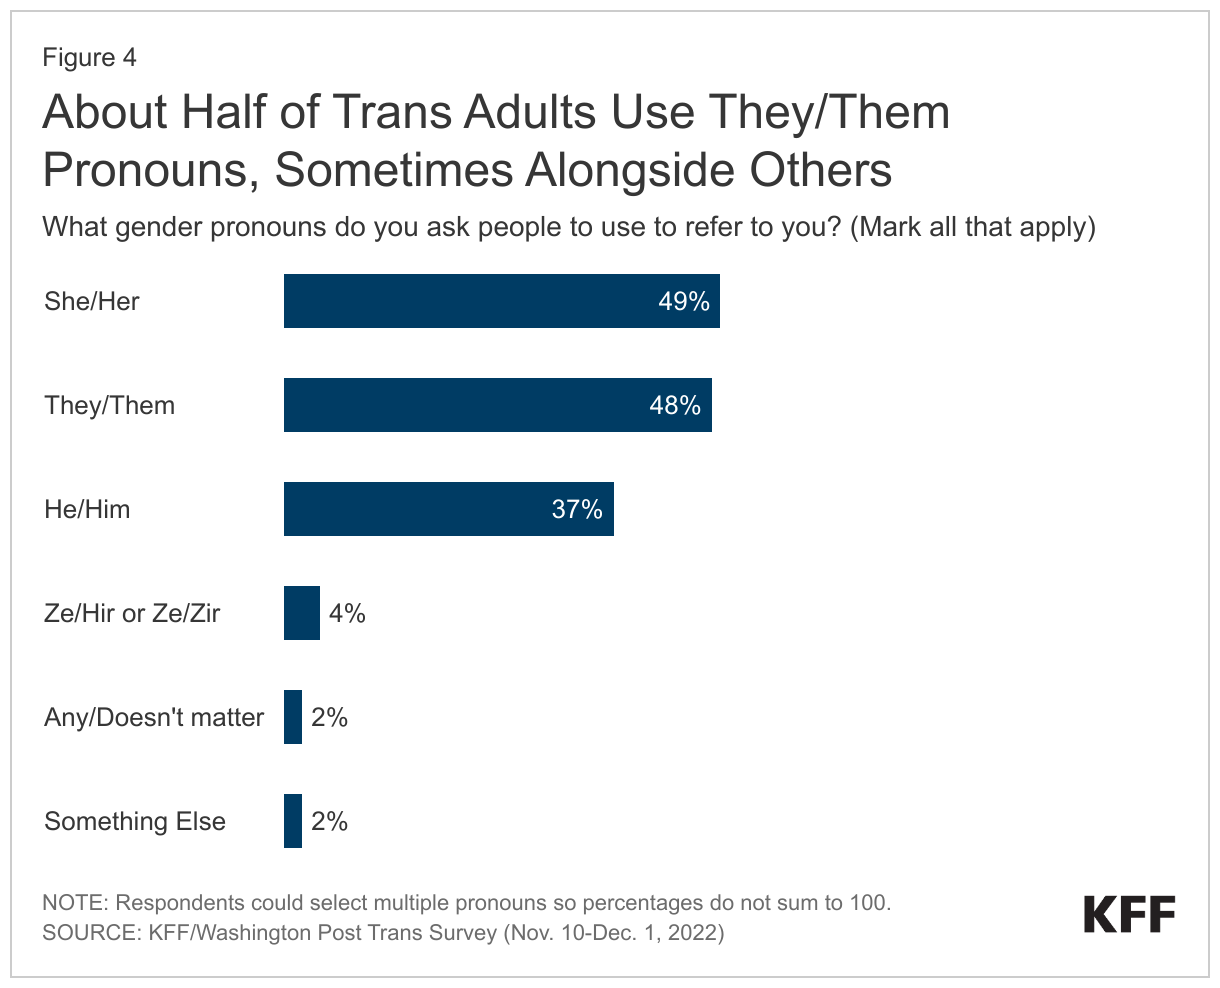
Nearly half (48%) of trans adults use they/them pronouns, with those ages 18-34 being more than twice as likely to use these terms than those 35+ (64% vs. 28%). About half of trans adults use she/her (49%) pronouns and almost four in ten (37%) use he/him pronouns. About one-third of trans adults say they use a combination of they/them and she/her or he/him pronouns. (Note: Percentages do not sum to 100% as respondents could select multiple genders).
General Demographics
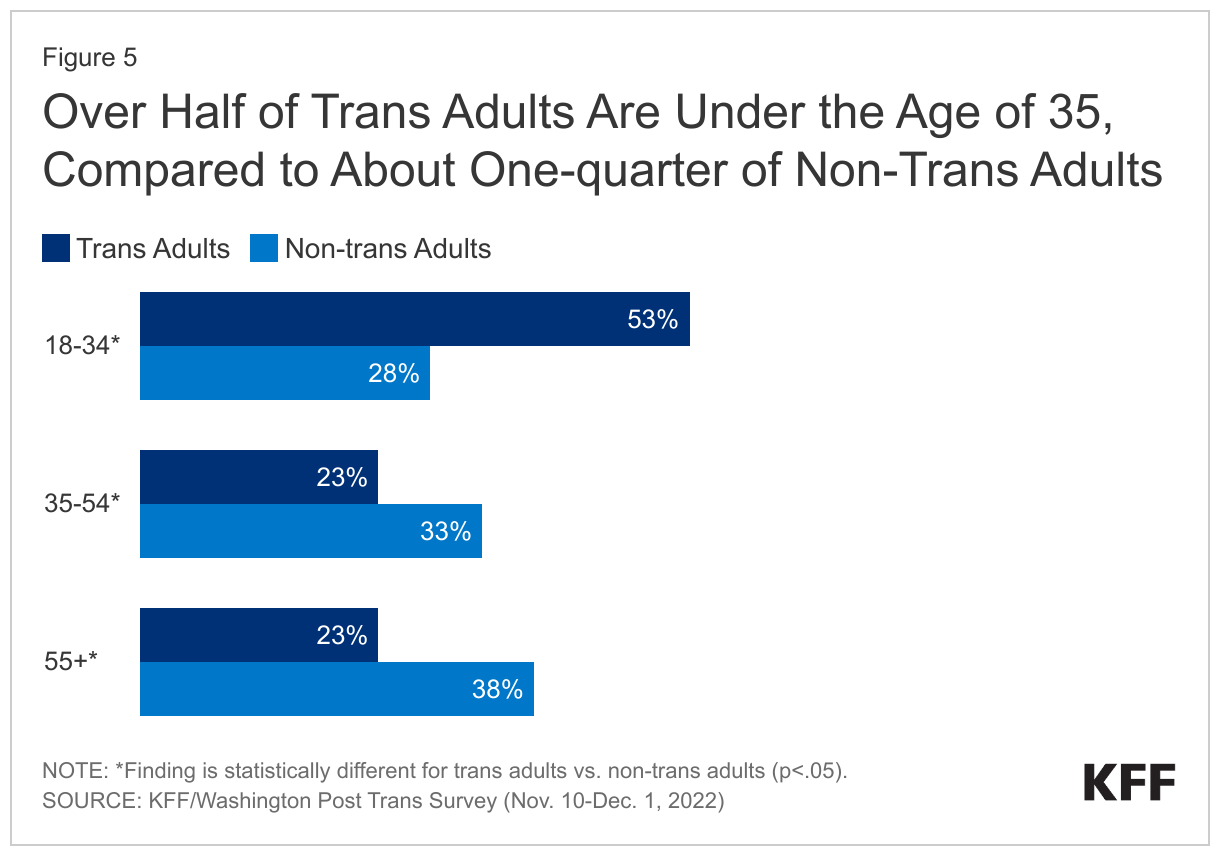
Age. Trans adults are a younger population than non-trans adults. Over half (53%) of trans adults are under 35 years old compared to just over a quarter of non-trans adults (28%). Just a small share (8%) of trans adults are seniors, those over the age of 65, compared to 22% of non-trans adults (not shown in chart).
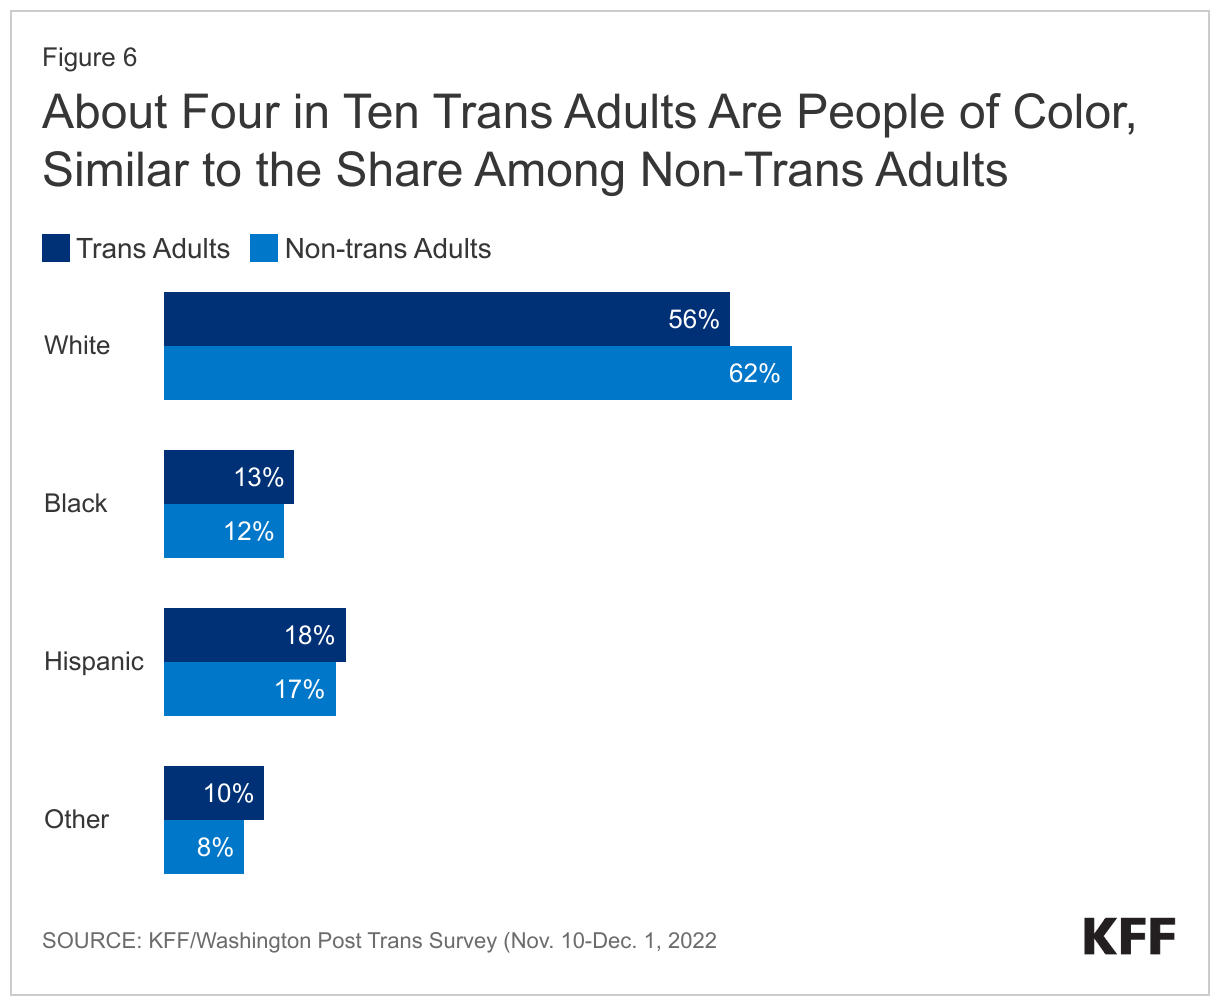
Race/Ethnicity. Similar shares of trans and non-trans adults are White, Hispanic, Black, and other races/ethnicities.
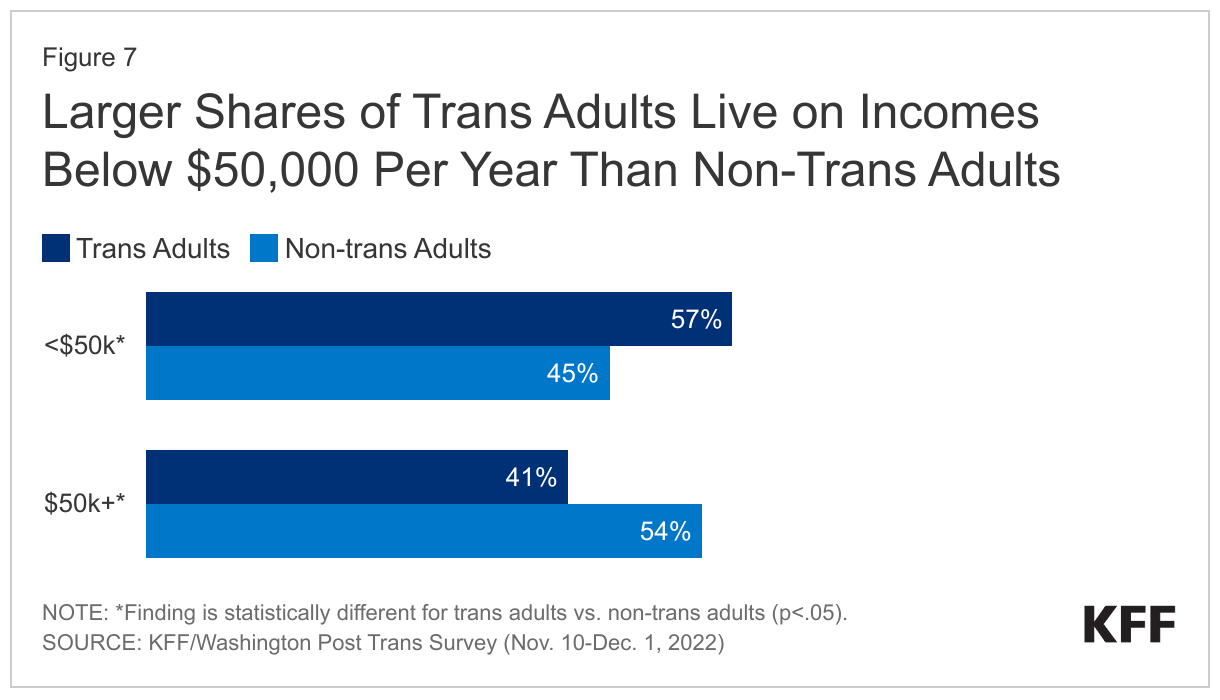
Income. A larger share of trans adults have incomes below $50,000 per year than non-trans adults (57% v. 45%), potentially reflecting younger age, lower levels of education, and higher unemployment (see below).
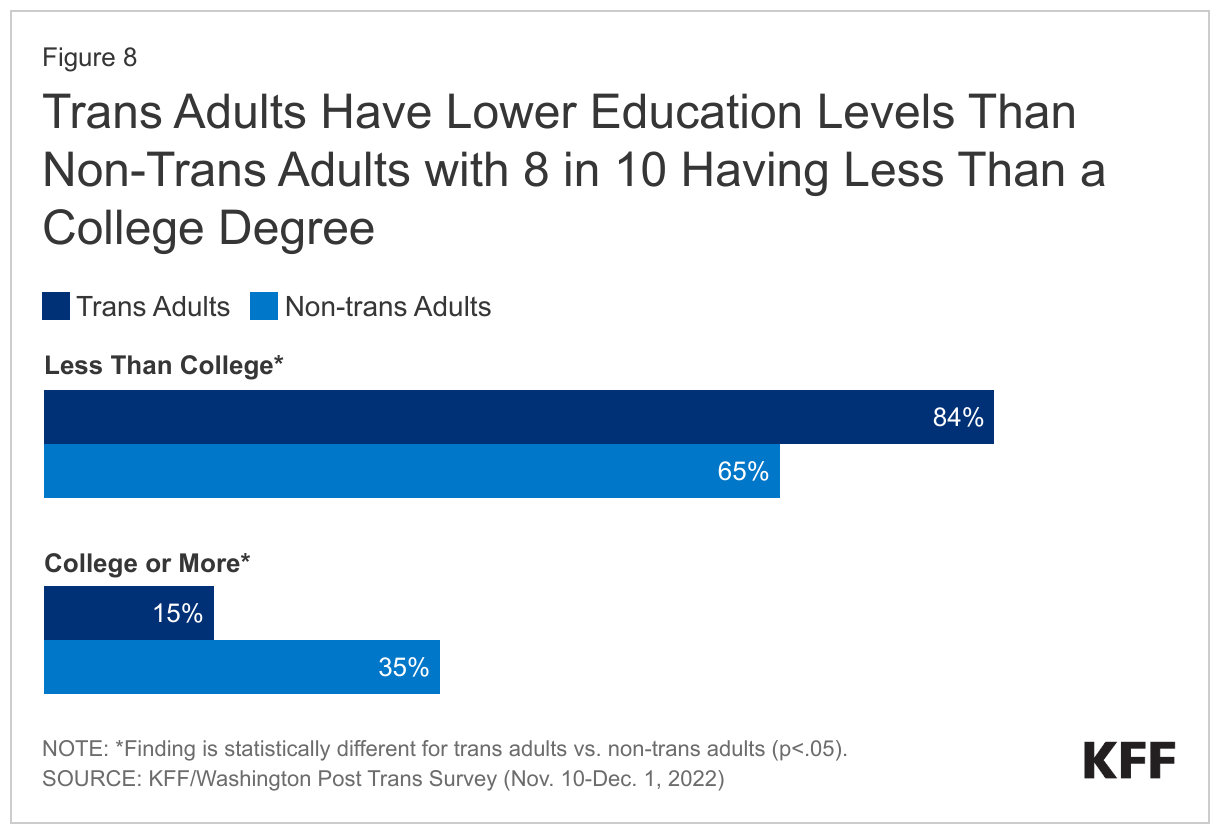
Education. Trans adults have lower levels of education when compared to non-trans adults. More than 8 in 10 (84%) have less than a college degree compared to 65% of non-trans adults. Non-trans adults are more than twice as likely to have graduated college than trans adults (35% vs. 15%). This finding held true even when controlling for age, and despite having similar incomes at most levels.
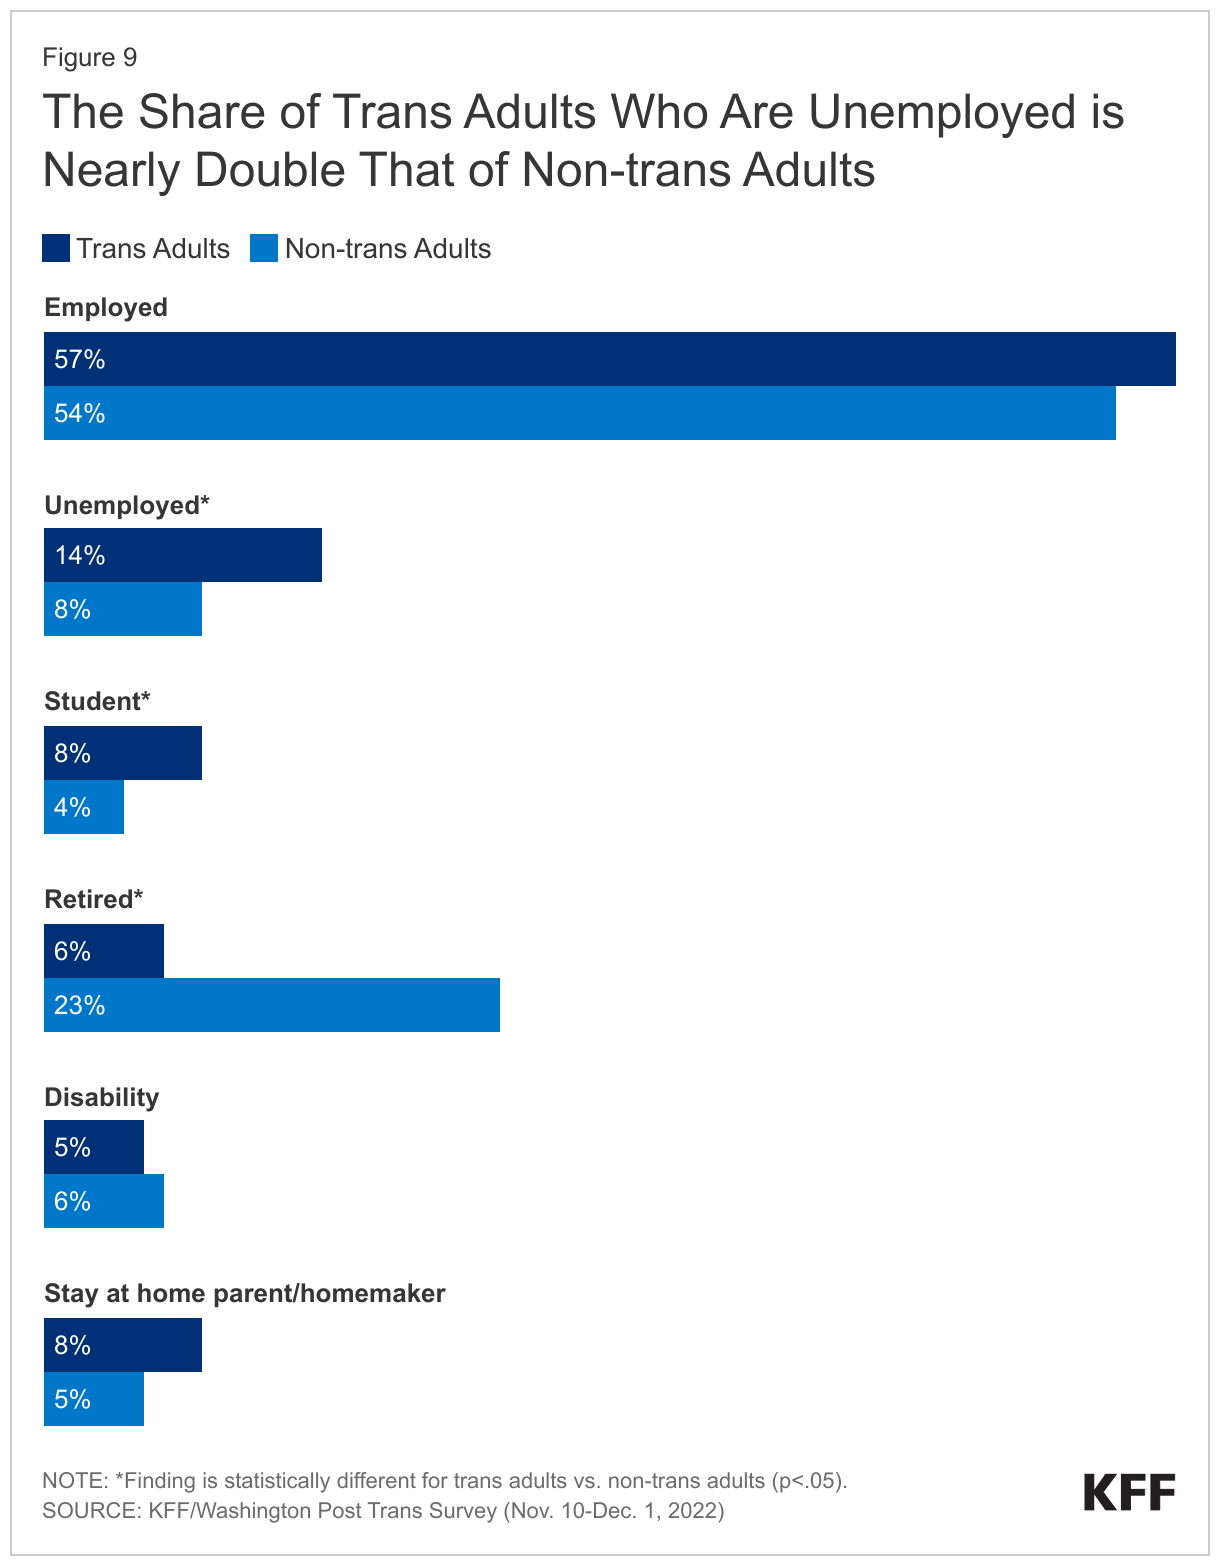
Employment. A larger share of trans adults report being unemployed (14% vs. 8%) or being students (8% vs. 4%) than non-trans adults and smaller shares report being retired, likely due the fact that the trans adult population is younger in age than the non-trans adult population. Similar shares report being employed, being on disability, or being a stay at home parent/home maker.
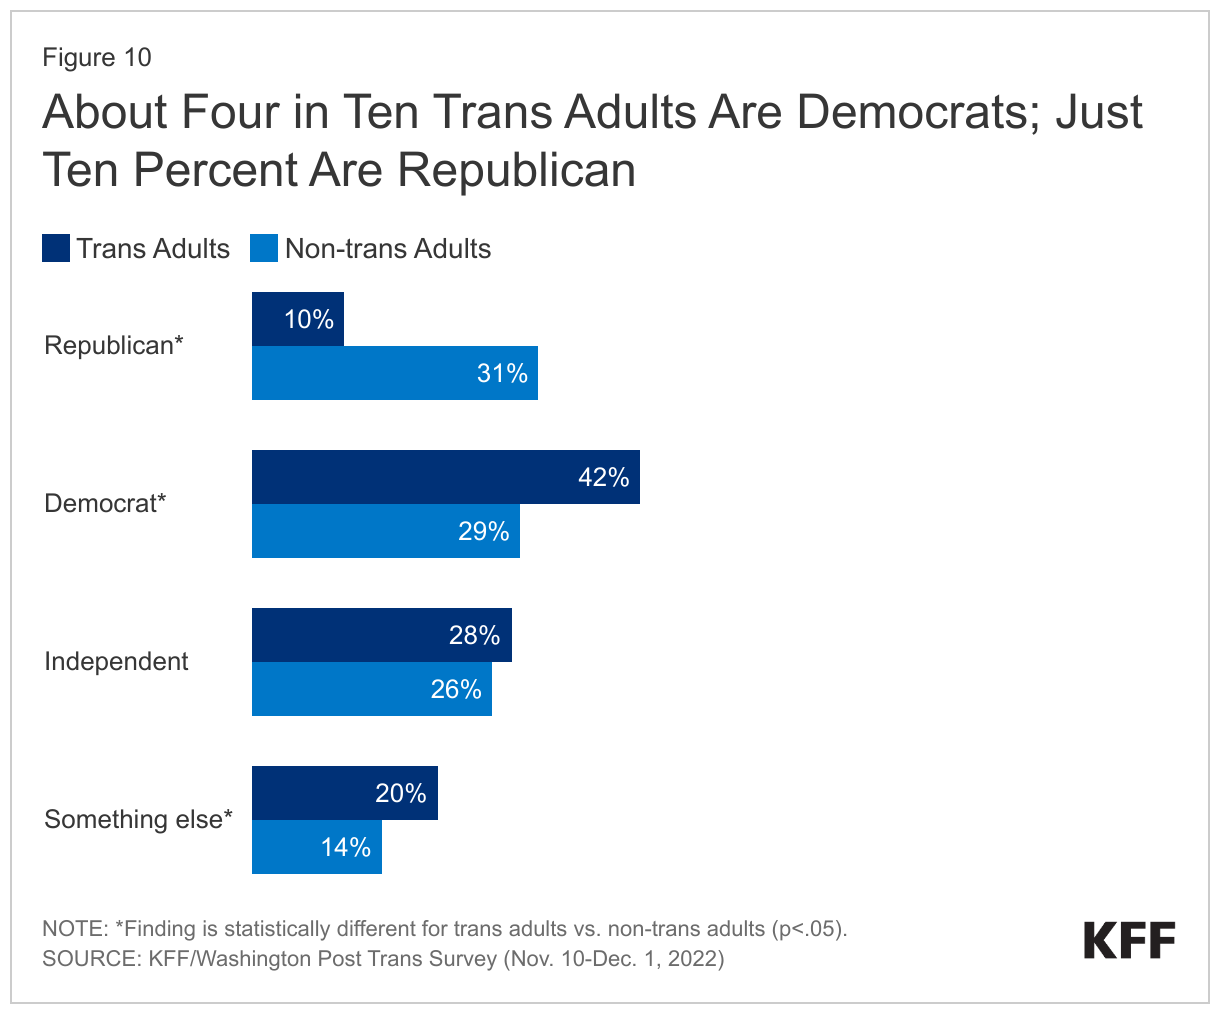
Partisan identification. Four in ten trans adults (42%) identify as a Democrat, a larger share than non-trans adults (29%) and few, just one in ten (10%), identify as a Republican compared to almost one-third (31%) of non-trans adults. Trans adults are also more likely to say their political identity is something other than Republican, Democrat, or independent (20% vs. 14%).
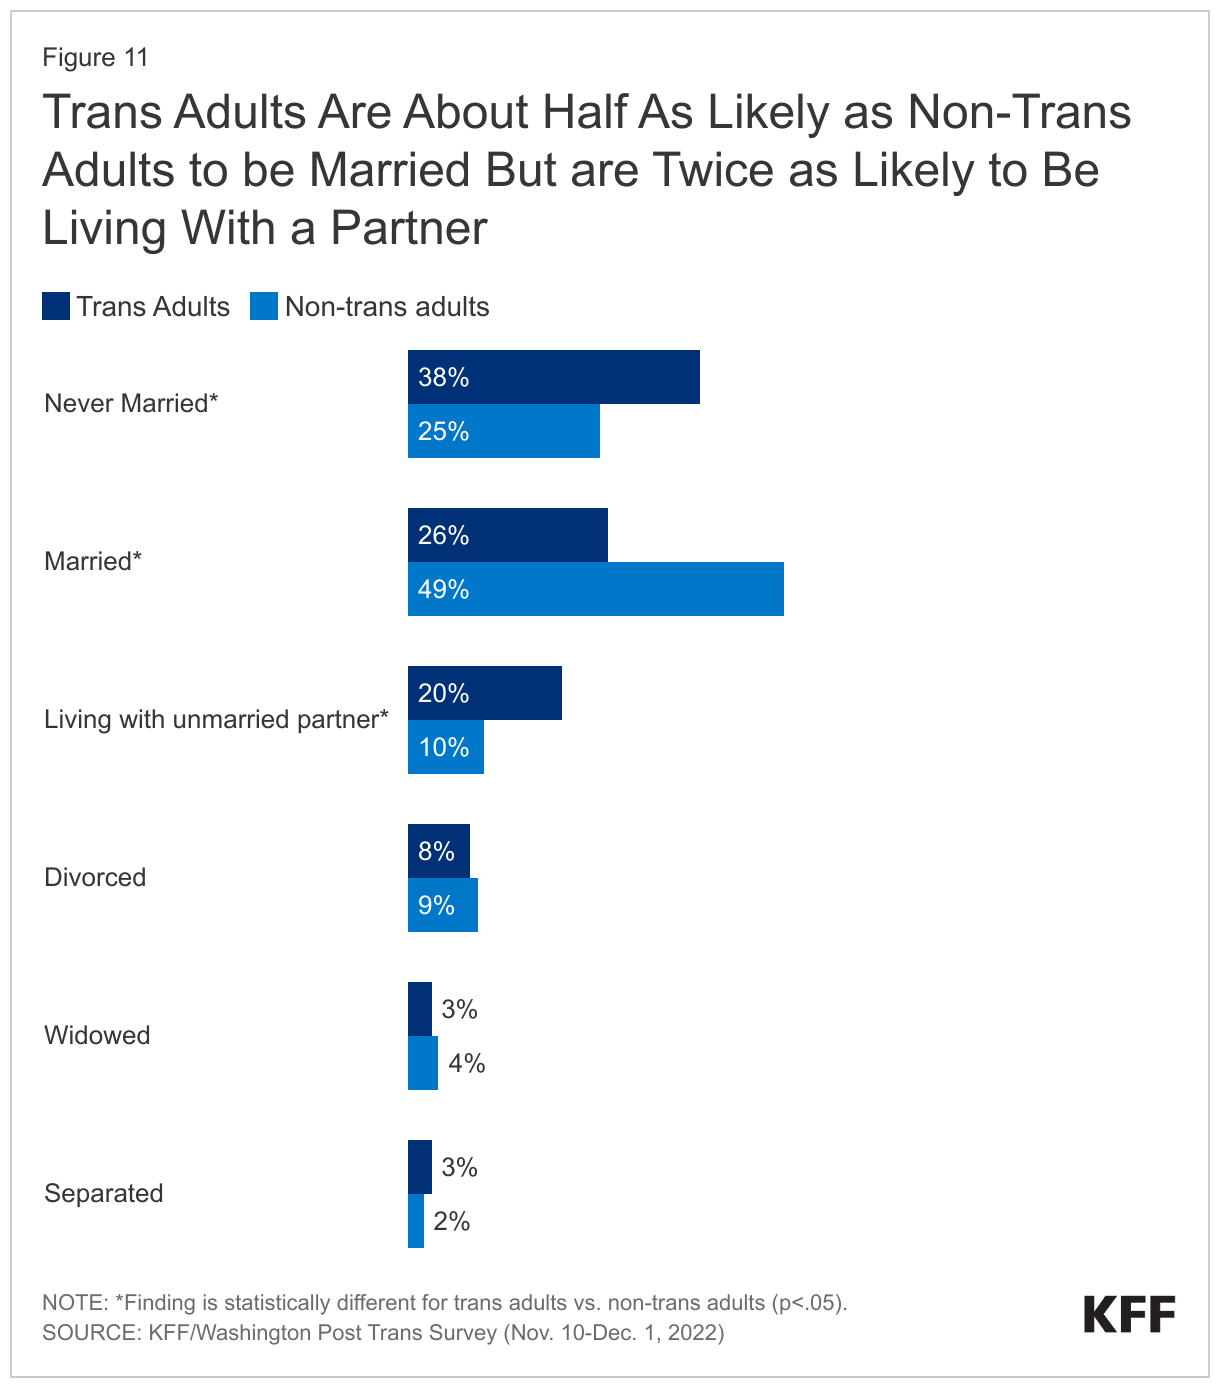
Marital Status. Trans adults are about half as likely to be currently married than non-trans adults (26% vs. 49%) and also less likely to have ever been married (25% vs. 38% ) which likely reflects, at least in part, their younger age. However, they are twice as likely to be living with an unmarried partner (20% vs. 10%). The share of trans adults who are widowed or divorced is similar to that of non-trans adults.
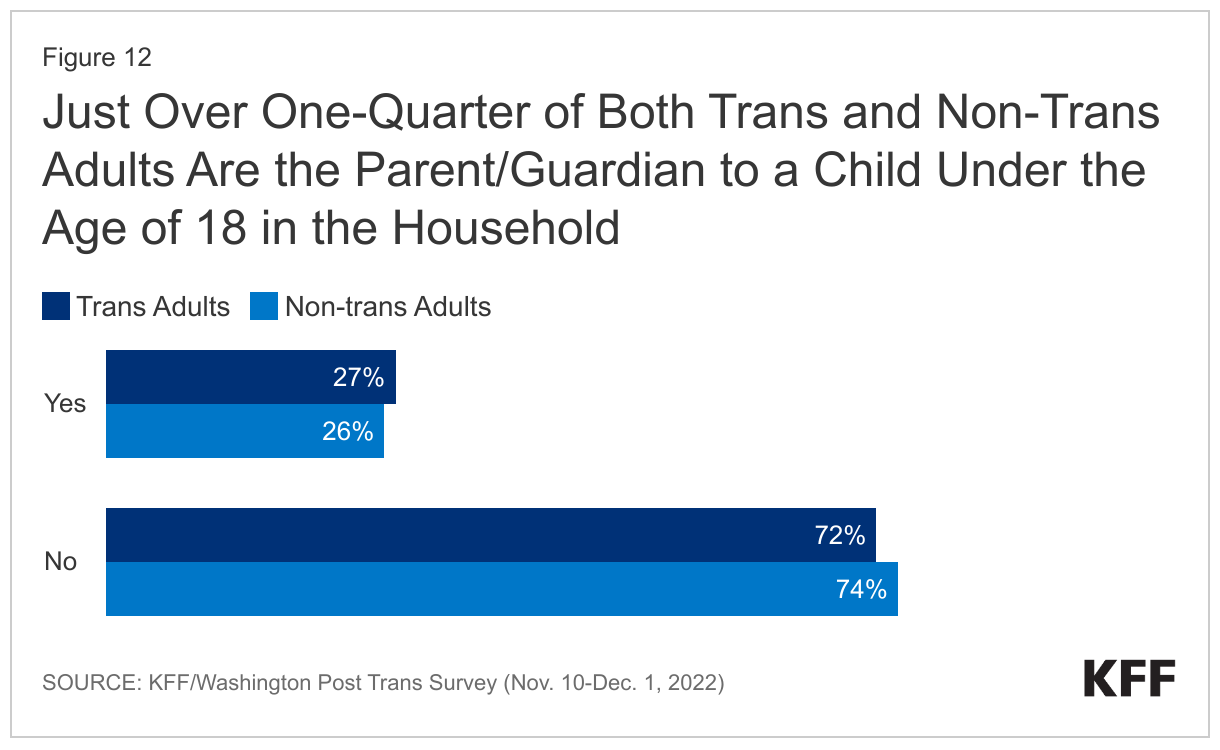
Parenthood. Overall, similar shares of trans adults are a parent or guardian to a child under the age of 18 living in their household (27% vs 26%). However, looking at younger adults, there are significantly fewer trans parents under the age of 40 than non-trans parents under 40 (23% vs. 40%).
Healthcare Access
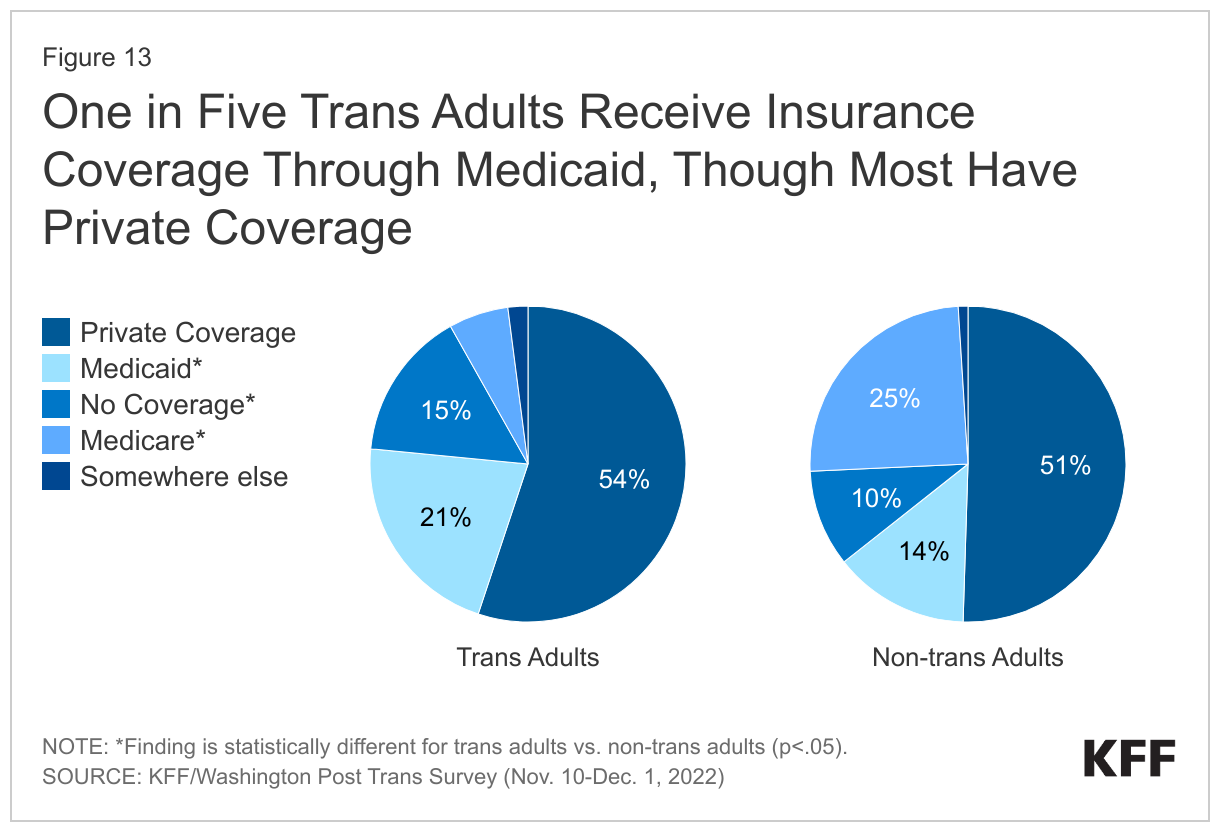
Insurance Coverage. Larger shares of trans adults report being uninsured than non-trans adults (15% vs. 10%). The share of trans adults who report not having health insurance is similar across age groups and racial and ethnic identities, but larger among those with lower household incomes compared to those with higher incomes.
About half of both trans adults and non-trans adults report having private insurance (55% vs. 51%), although trans adults are three times as likely to report having such coverage through a parent (10% vs. 3%), likely reflecting their younger age. Smaller shares of trans adults have Medicare (6% vs. 25%), likely reflecting the younger age of the population, and about one in four have Medicaid (21%), a larger share than non trans-adults (14%).
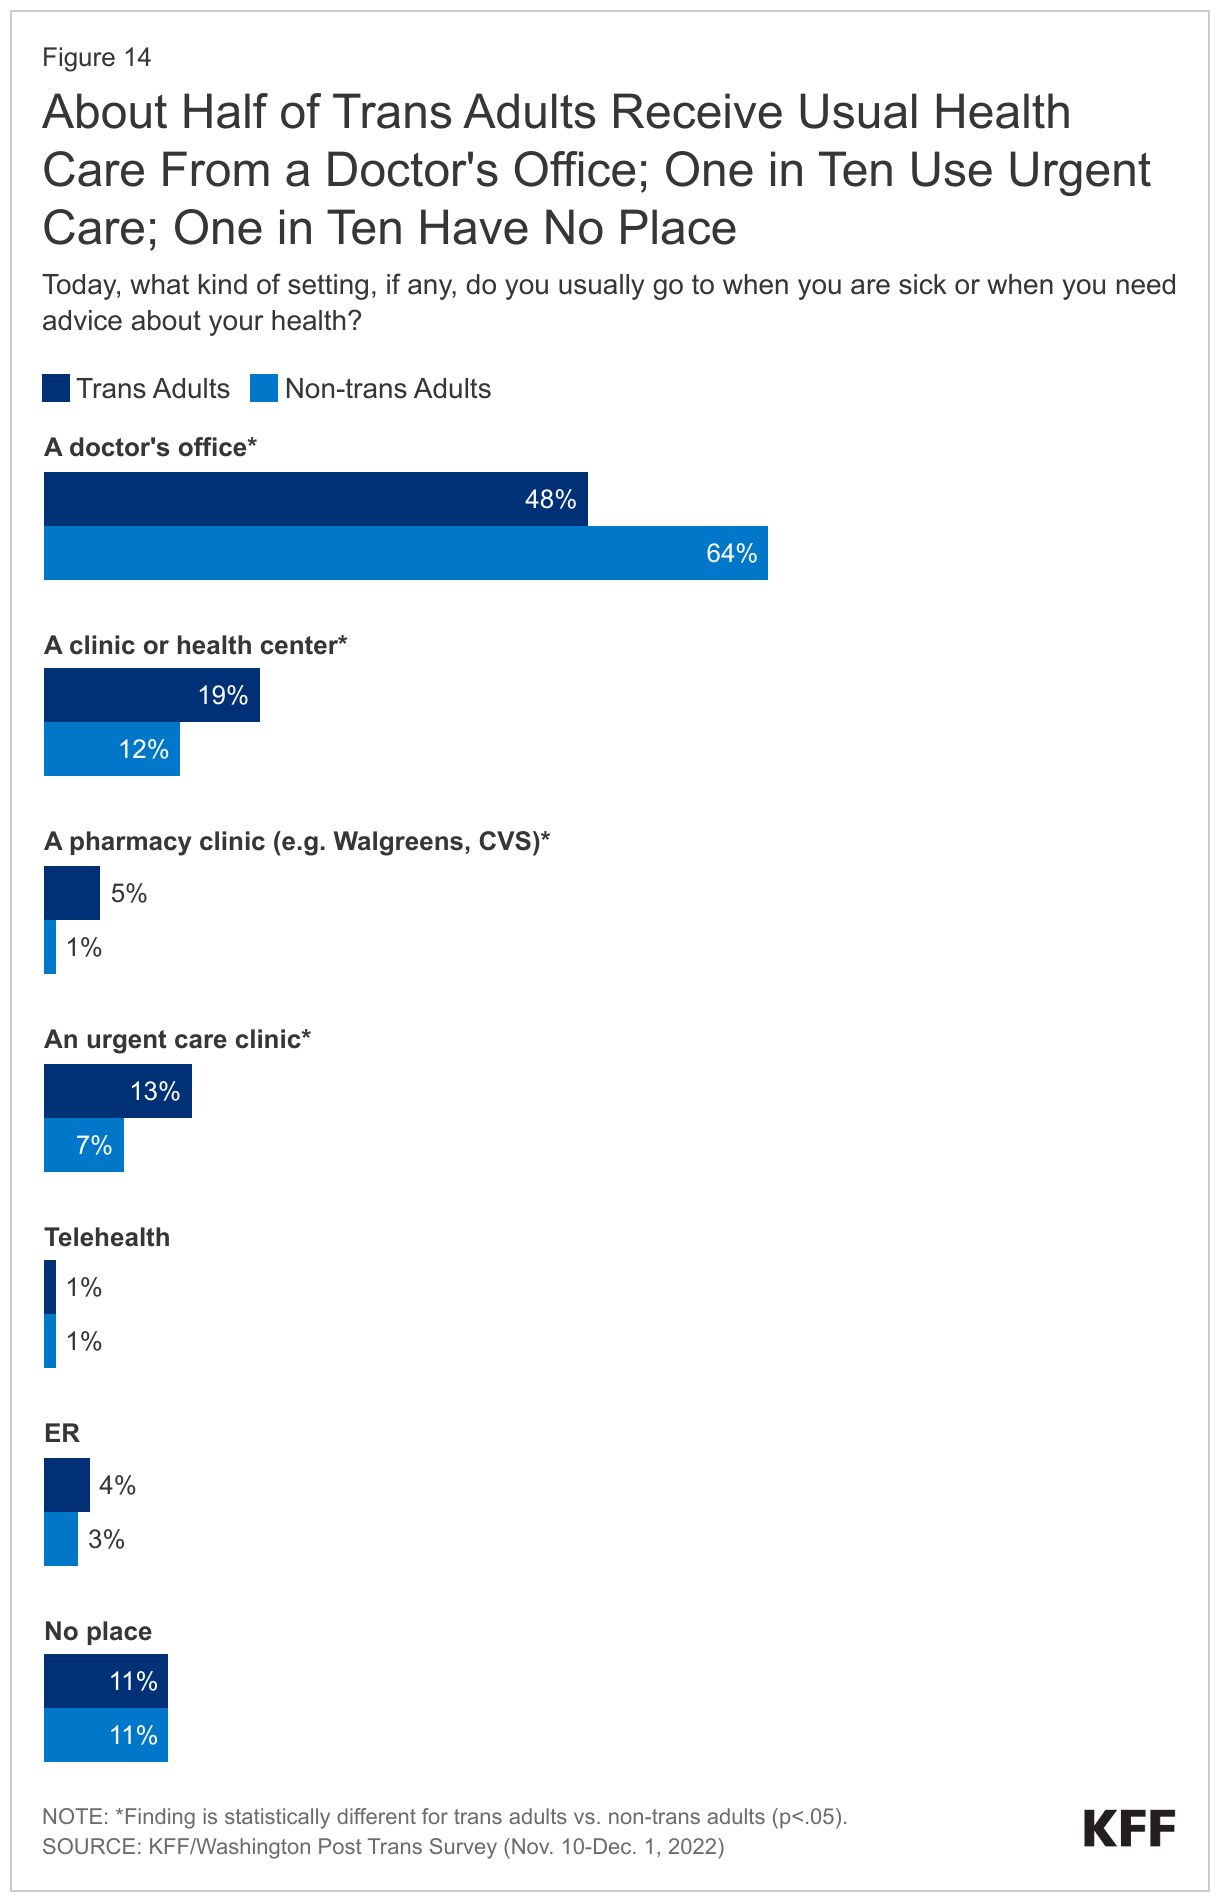
Care location. Trans adults use different types of health care settings to access care than non-trans adults. They are more likely to get their usual care at clinics including health centers, pharmacies, and urgent care (36% vs. 21%) and less likely to get this care at a doctor’s office (48% vs. 64%). Trans adults of color, those under age 35, and those earning less than $40,000 per year were more likely to say their usual source of care is the ER than White, older, or higher income trans adults. Among trans adults, those ages 35 and older and those earning more than $40,000 per year are more likely to receive care at a doctor’s office than trans adults who are younger or who have lower incomes. Like non-trans adults, about one in ten have no place they get care.
Health and Well-being
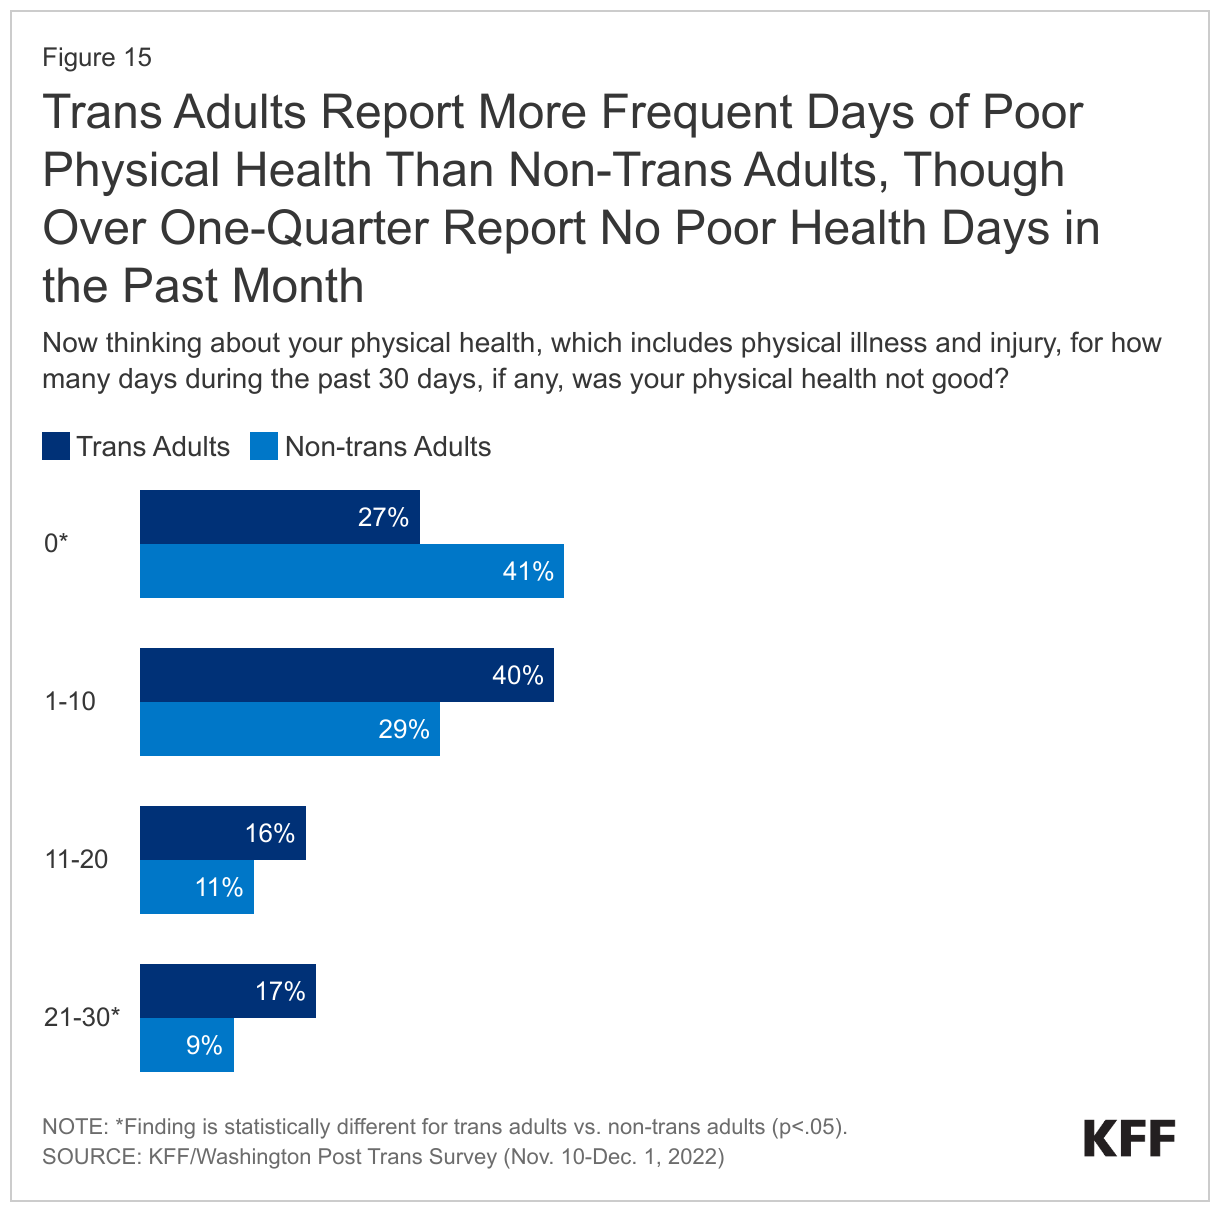
Physical Health. Despite being a younger population, trans adults report poor physical health more so than non-trans adults. Looking back across the past 30 days, on average, trans adults had more days when their physical health, including physical illness and injury, was “not good”. Smaller shares of trans adults than non-trans adults had zero days when their physical health was not good in the preceding 30 days (27% vs. 41%) and nearly double the share of trans adults said their health had not been good for 21-30 days (17% vs. 9%). Among trans adults, there were minimal differences when looking across demographic factors including, race/ethnicity, age, and income.
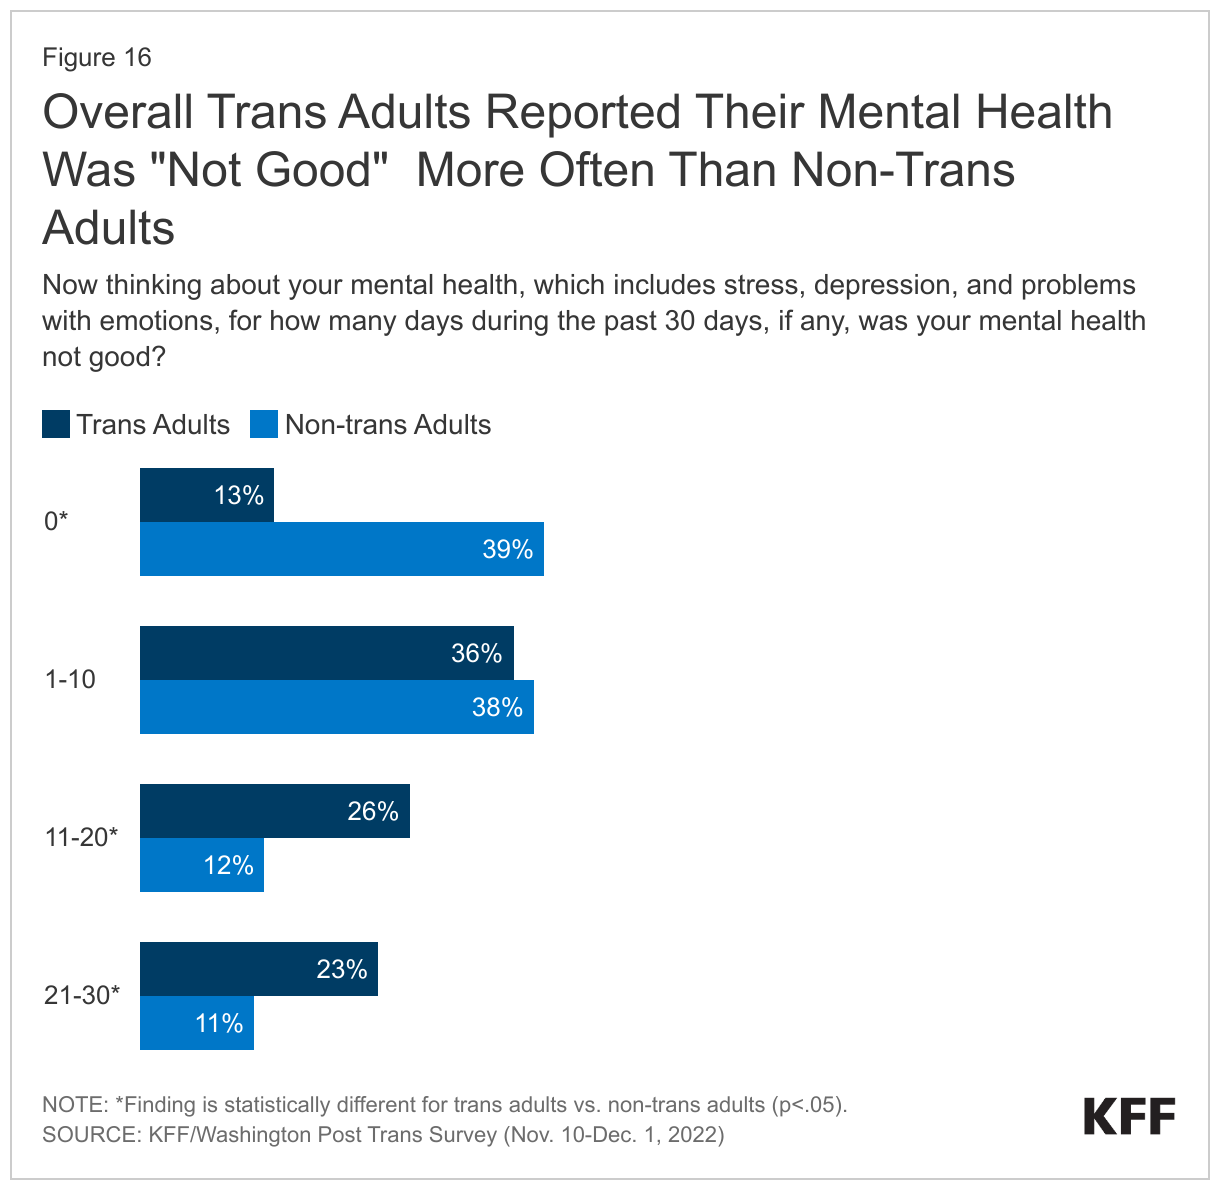
Mental Health. Similarly, while four in ten (39%) non-trans adults say there were zero days in the past month when their mental health, including stress, depression, and problems with emotions, was not good, just about one-in-ten trans adults (13%) said so. Conversely, nearly one quarter of trans adults (23%) say their mental health had been not good 21-30 days in the preceding 30. Notably, trans adults who reported having had a happy childhood reported fewer not good mental health days. Among trans adults, there were minimal differences when looking across demographic factors including, race/ethnicity, age, and income. In our main report on this survey, we find specifically that trans adults report higher rates of anxiety, depression, and loneliness than non-trans adults.
Poll: Nearly Half of Adults Expect to Get the New COVID-19 Vaccine, But Most Parents Don’t Expect to Get It for Their Children; More Eligible Adults Expect to Get a Flu Shot and the New RSV Vaccine
Republicans are Much Less Likely than Democrats to View Fall Vaccines as Safe Or Expect to Get Them, though COVID-19 Sparks the Greatest Split in Intentions and Views
Nearly half of adults say that they will “definitely” or “probably” get the newly recommended COVID-19 vaccine, though most parents are not planning to get the shot for their children, according to the latest KFF COVID-19 Vaccine Monitor poll.
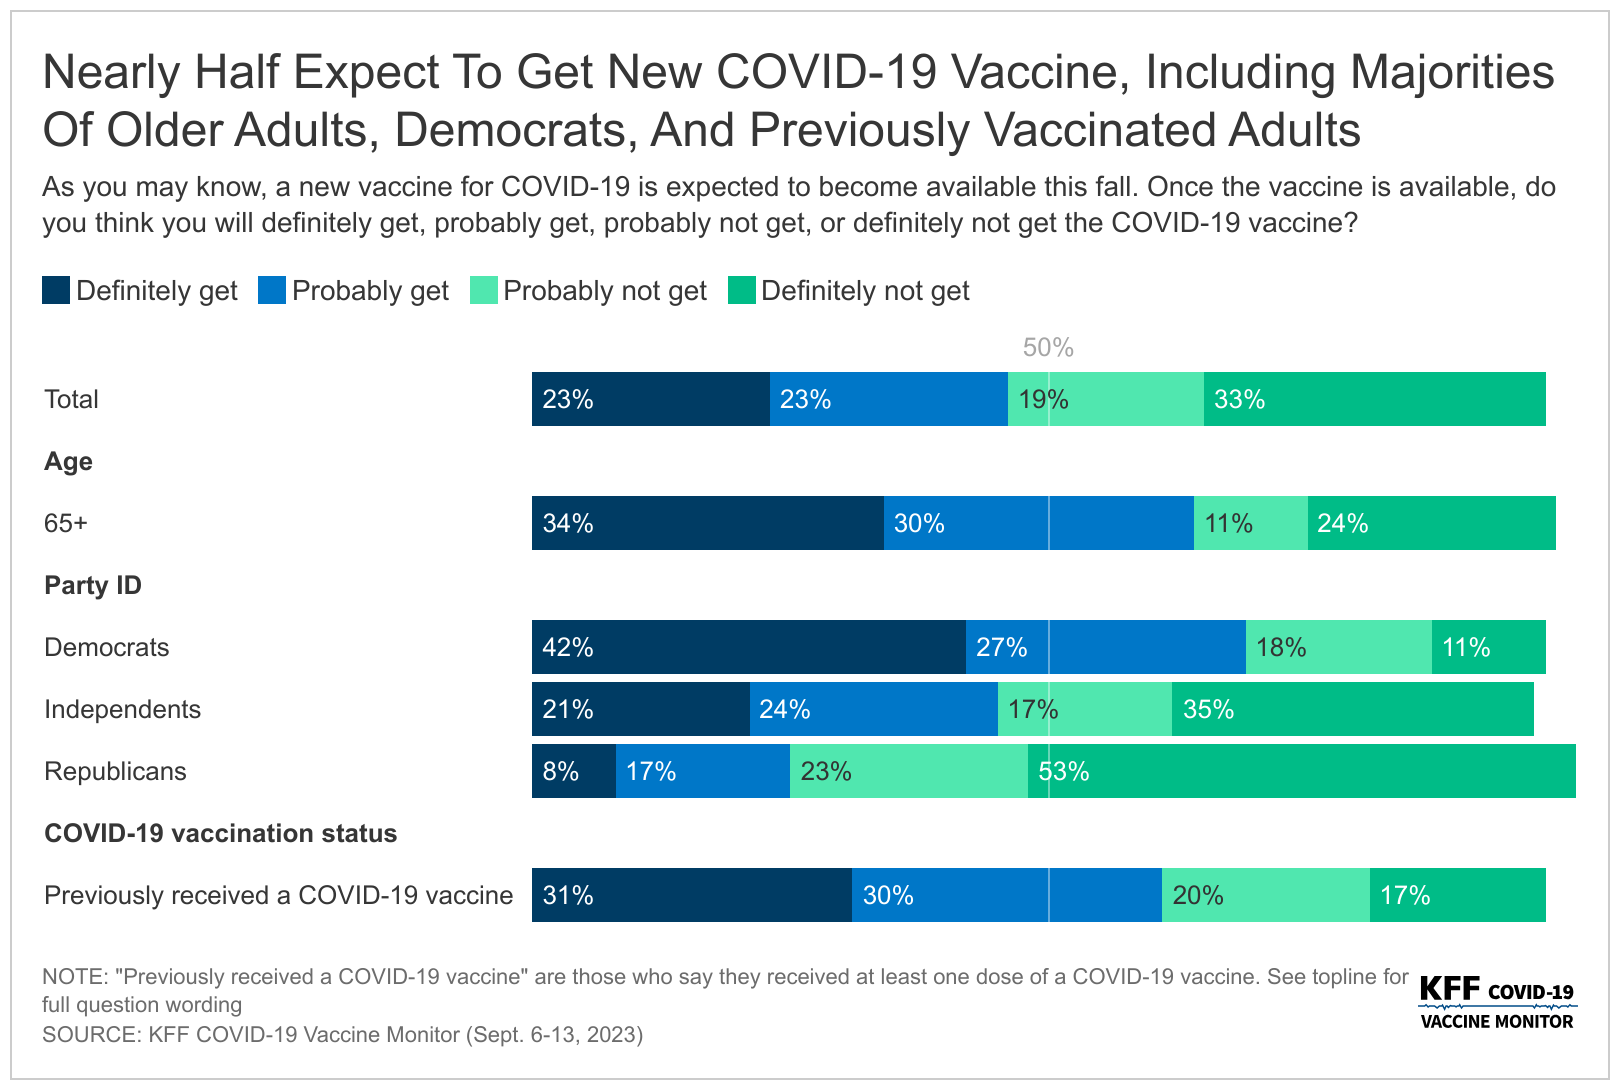
Among all adults, 23% say they will definitely get the new vaccine, 23% say they will probably get it, while 19% say they will probably not get it and 33% say they definitely not get it.
The share of the public who intend to get the new COVID-19 vaccine is higher than the share who have received previous booster shots, but not as high as initial vaccine uptake back in 2020. Almost four in ten (37%) people who previously received a COVID-19 vaccine say that they probably or definitely won’t get the new shot. Reflecting patterns from earlier vaccine rollouts during the pandemic, the groups most likely to say they definitely or probably will get the new vaccine include people at least 65 years old (64%) and Democrats (70%).
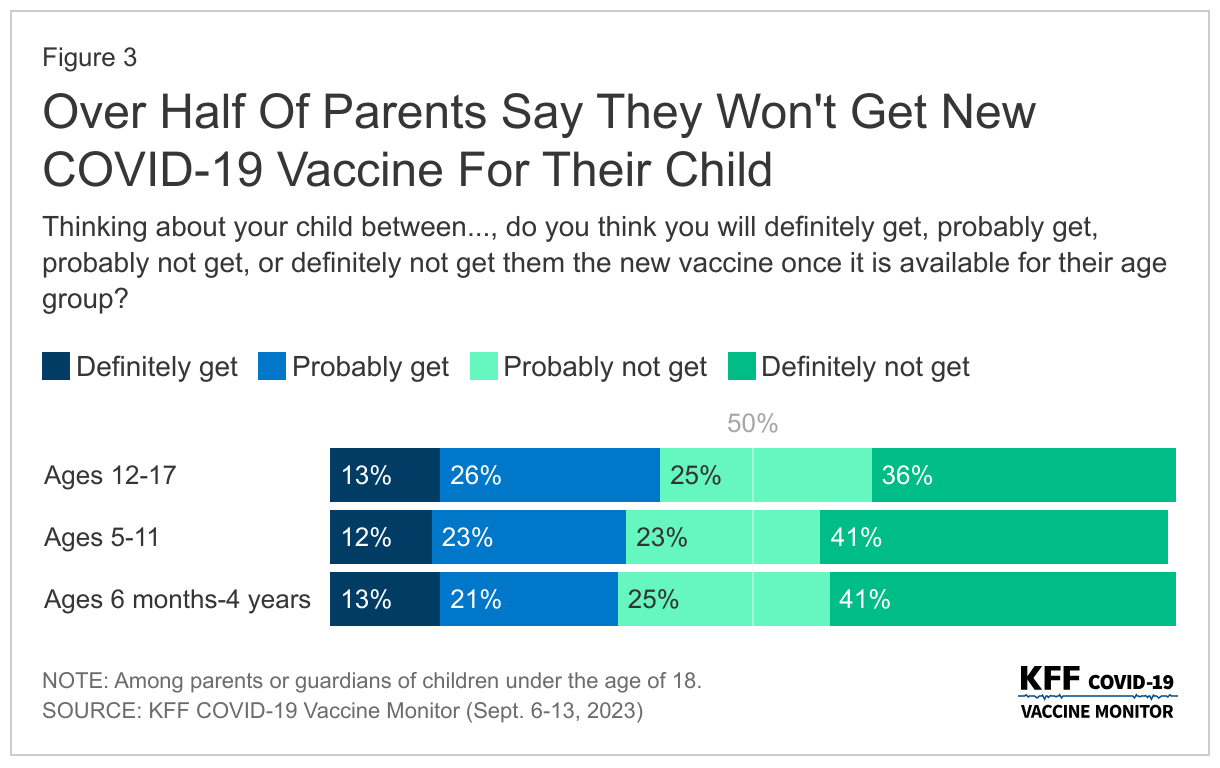
While the new COVID-19 vaccine is recommended for children ages 6 months and up, fewer than four in ten parents say they expect to get the vaccine for their children ages 12-17 (39%), ages 5-11 (36%), and ages 6 months through 4 years (34%). More than half of parents with children in each age group say they probably or definitely won’t get their children vaccinated.
The latest survey also shows that somewhat larger shares of eligible people expect to get an annual flu shot and a newly recommended vaccine for RSV (respiratory syncytial virus) than plan to get the COVID-19 vaccine. For example, most adults (58%) say that they have already gotten or expect to get a flu shot, and most adults ages 60 and older (60%) say they have already gotten or expect to get the new RSV vaccine (recommended for their age group).
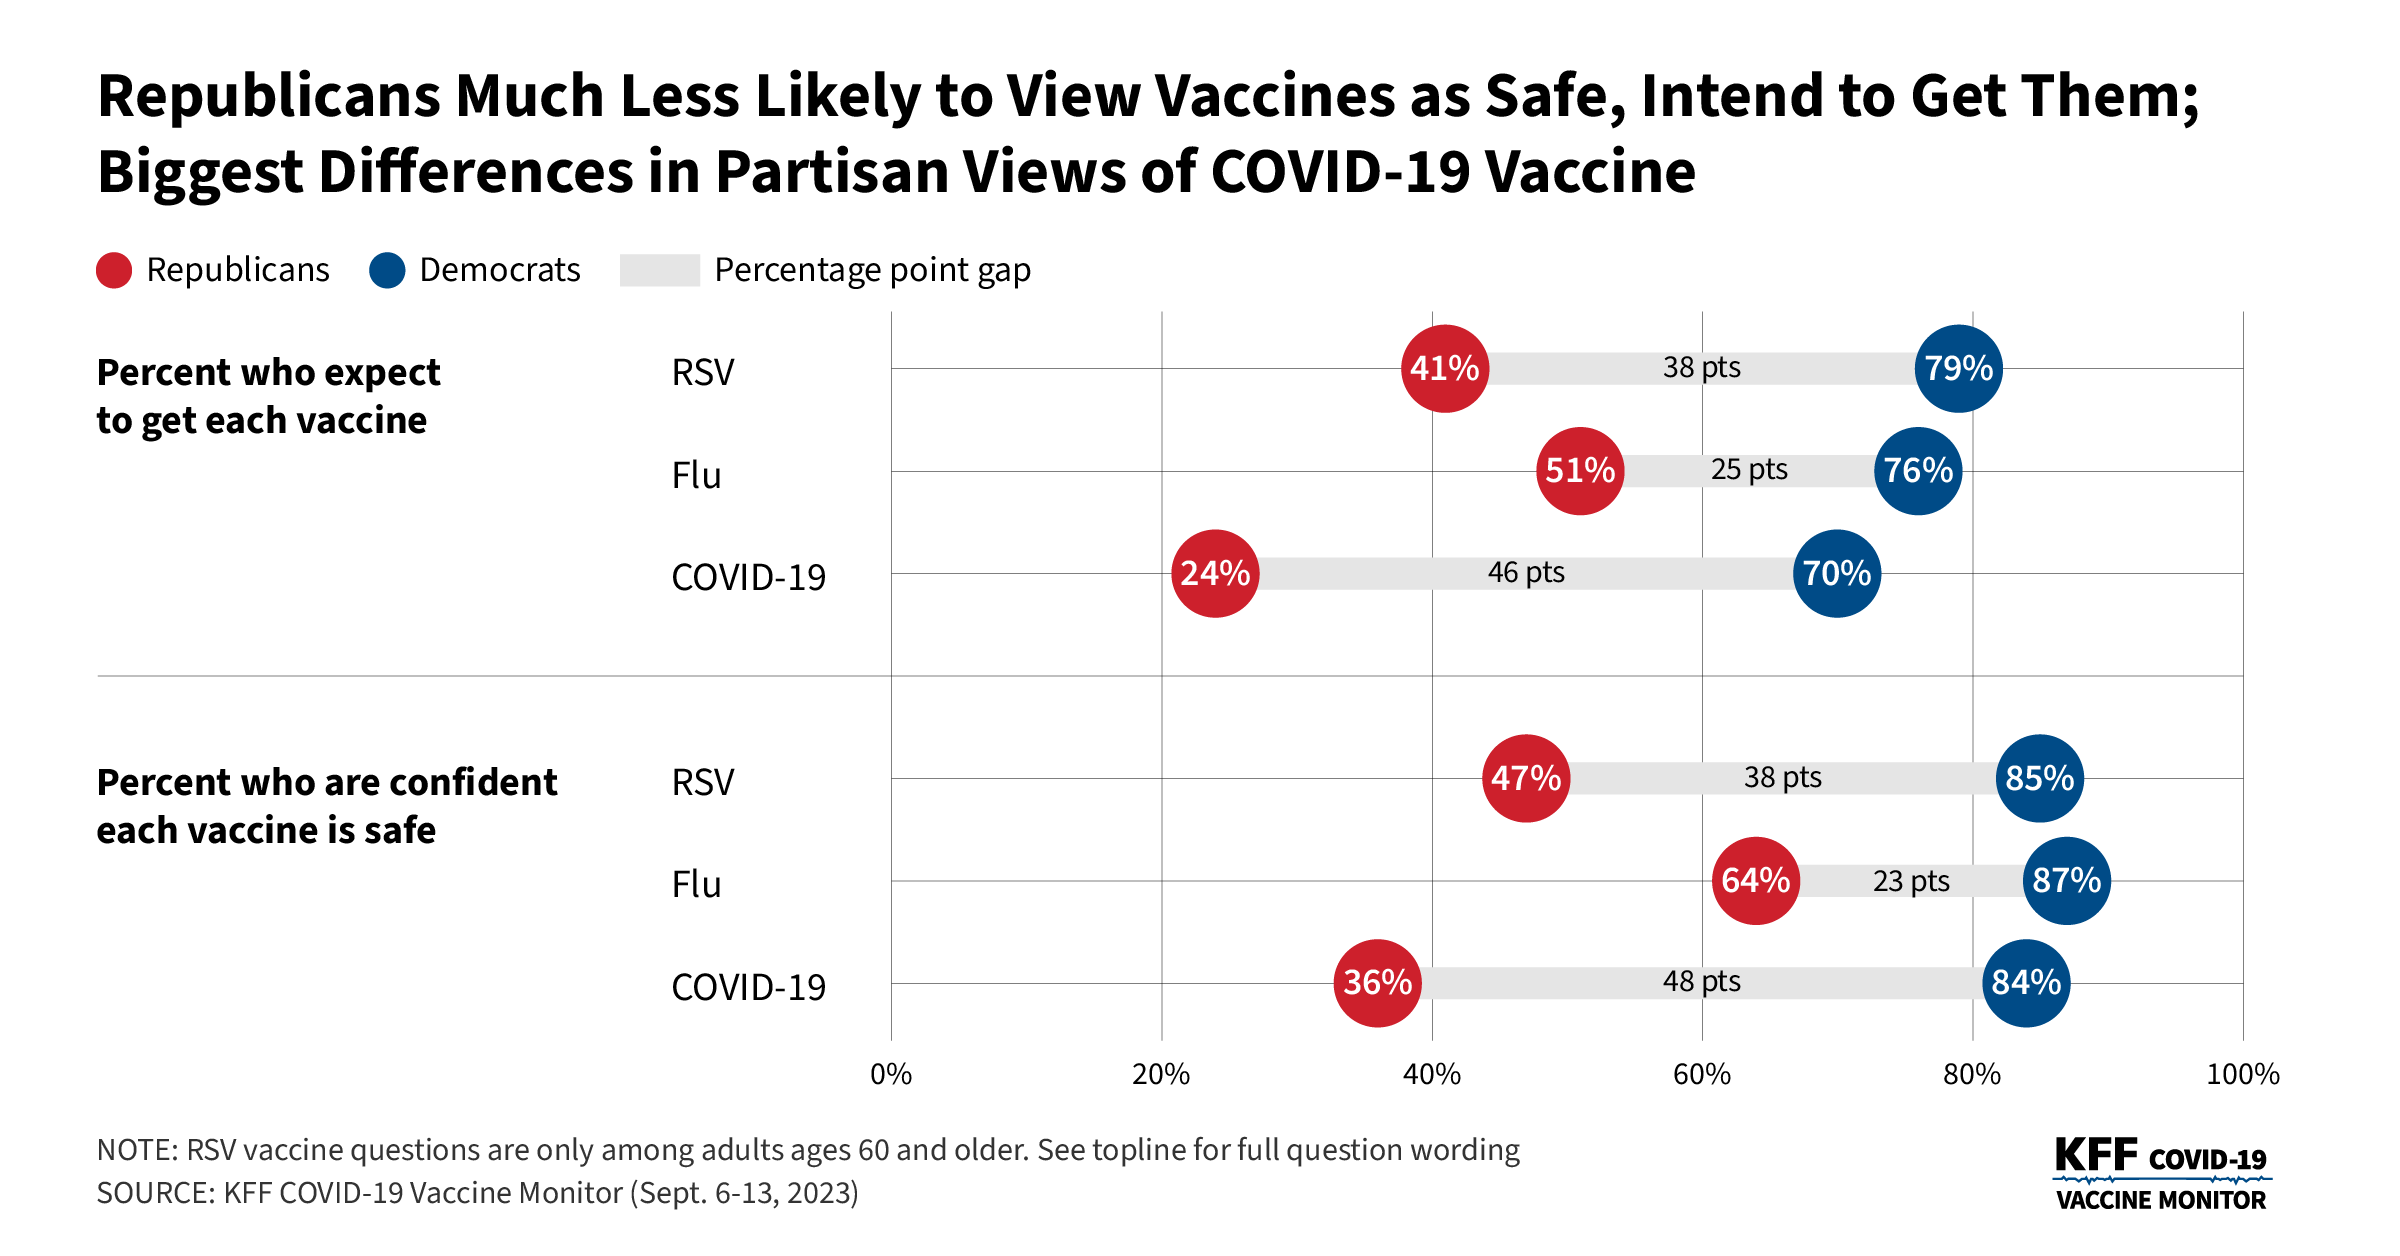
As has been true throughout the pandemic, a much smaller share of Republicans (24%) than Democrats (70%) expect to get the new COVID-19 vaccine – 46 percentage point gap.
There are smaller, but still considerable, partisan divisions in intentions for these vaccines than for the COVID-19 shot: for example, 76% of Democrats and 51% of Republican expect to get or have already gotten a flu shot this fall (a 25-point gap), while among those ages 60 and older, 79% of Democrats and 41% of Republicans expect to get or having already gotten an RSV vaccine (a 38-point gap)
Republicans are also less likely than Democrats to be confident that each of three vaccines are safe, with the biggest divide for the COVID-19 vaccine (84% of Democrats and 36% of Republicans are confident it is safe).
The partisan divides persist across a wide range of measures related to vaccines and the COVID-19 pandemic. Some examples:
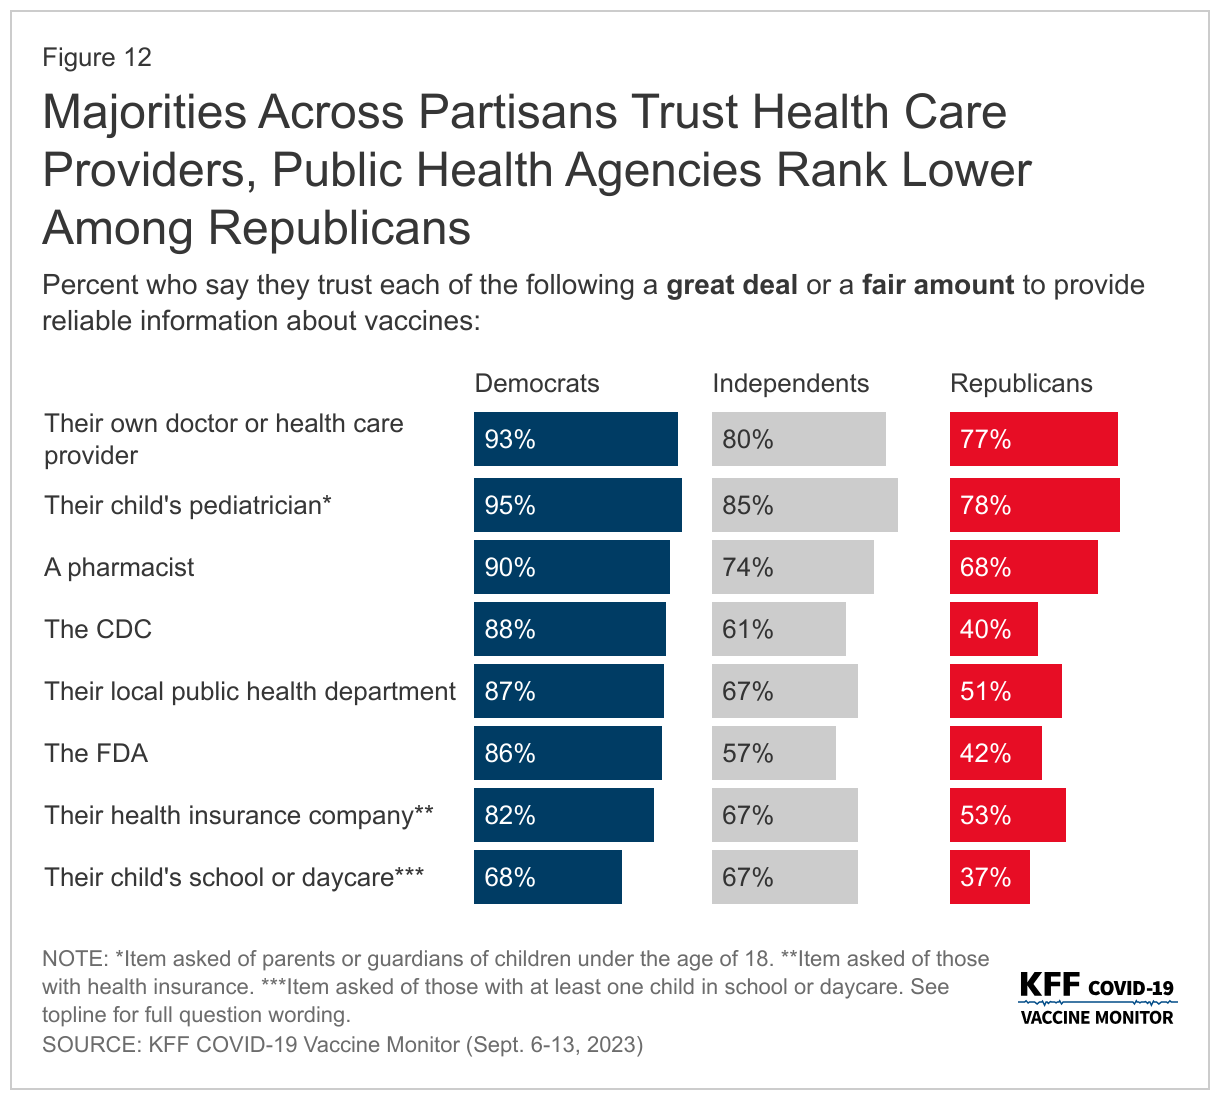
Trust in public health agencies. Overall, 63% of the public trust the Centers for Disease Control and Prevention (CDC) a great deal or a fair amount when it comes to providing reliable information about vaccines, and 61% trust the Food and Drug Administration (FDA).Much larger shares of Democrats than Republicans have at least a fair amount of trust in vaccine information from the CDC (88% vs. 40%), their local public health departments (87% vs. 51%), and the Food and Drug Administration (86% vs. 42%).
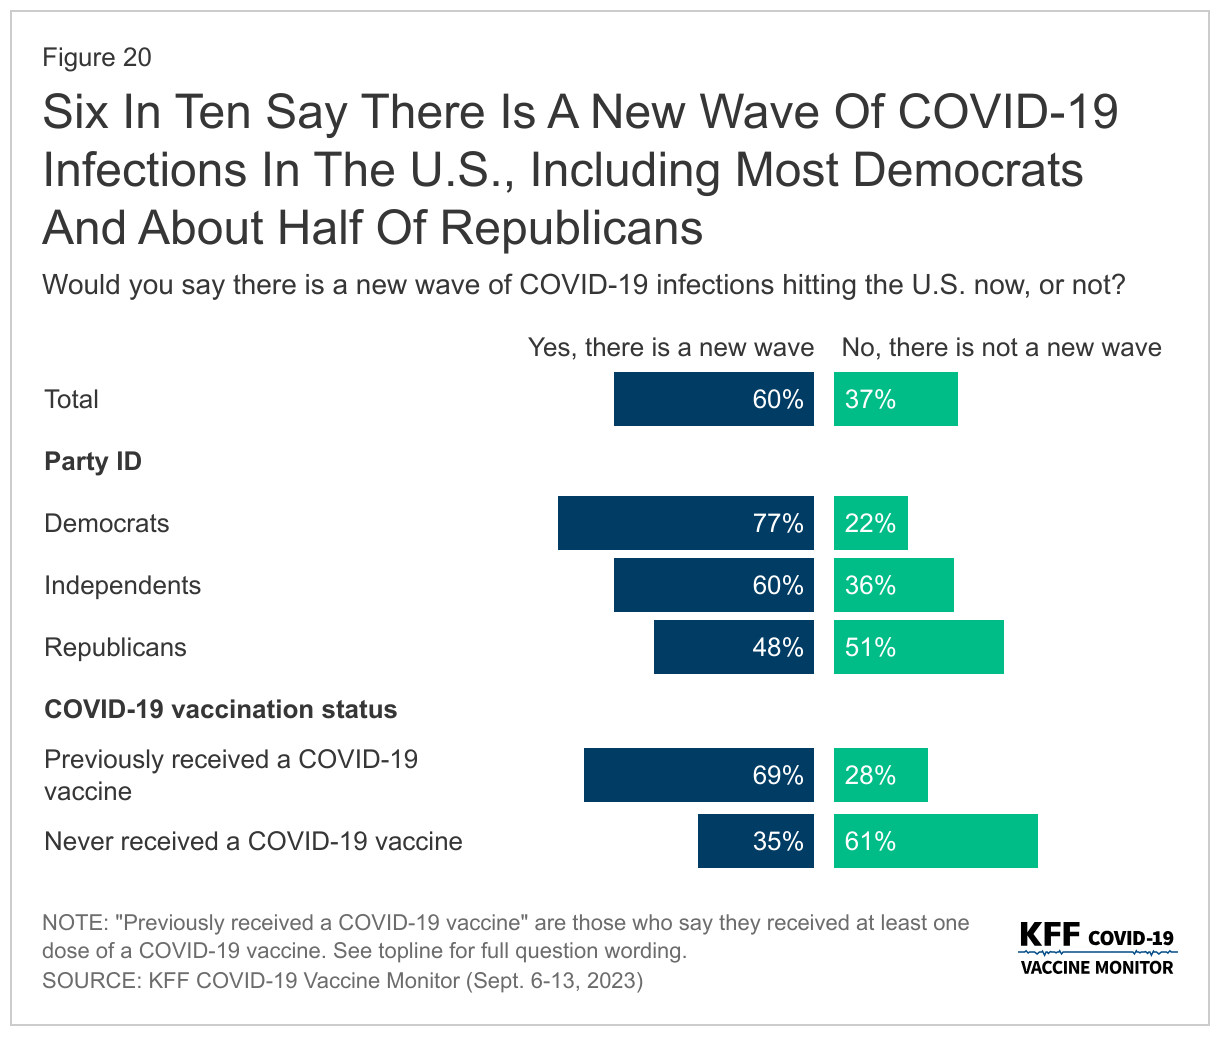
Perceptions about threat. Three quarters (77%) of Democrats say that there is a new wave of COVID-19 infections across the country. In contrast, similar shares of Republicans say there is (48%) and isn’t (51%) a new wave.
Taking precautions. Democrats are more than three times as likely as Republicans (58% vs. 16%) to say that news about the new COVID-19 wave has led them to take extra precautions, including being more likely to wear a mask in public or avoid large public gatherings, or being less likely to travel or to dine indoors at restaurants.
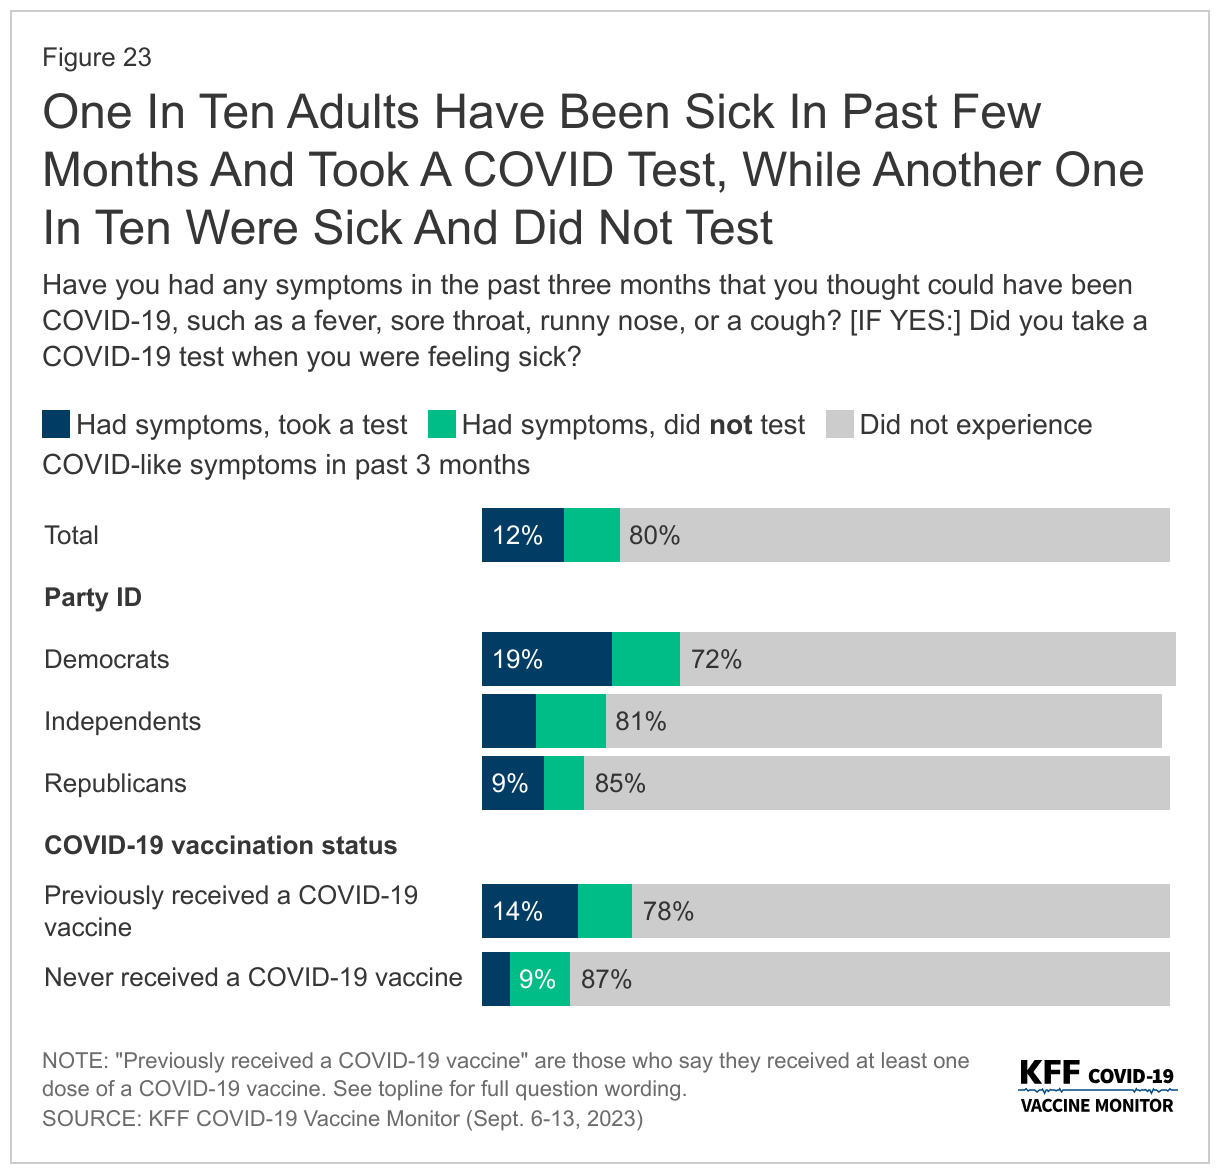
Getting tested. Republicans are half as likely as Democrats (9% vs. 19%) to say that they were sick in recent months and got a COVID-19 test.
“The poll shows that most of the nation still trusts the CDC and the FDA on vaccines – but there is a partisan gap, and most Republicans don’t trust the nation’s regulatory and scientific agencies responsible for vaccine approval and guidance,” KFF President and CEO Drew Altman said.
One area where partisans agree is that their personal doctors, including their children’s pediatricians, are their most trusted sources of vaccine information.
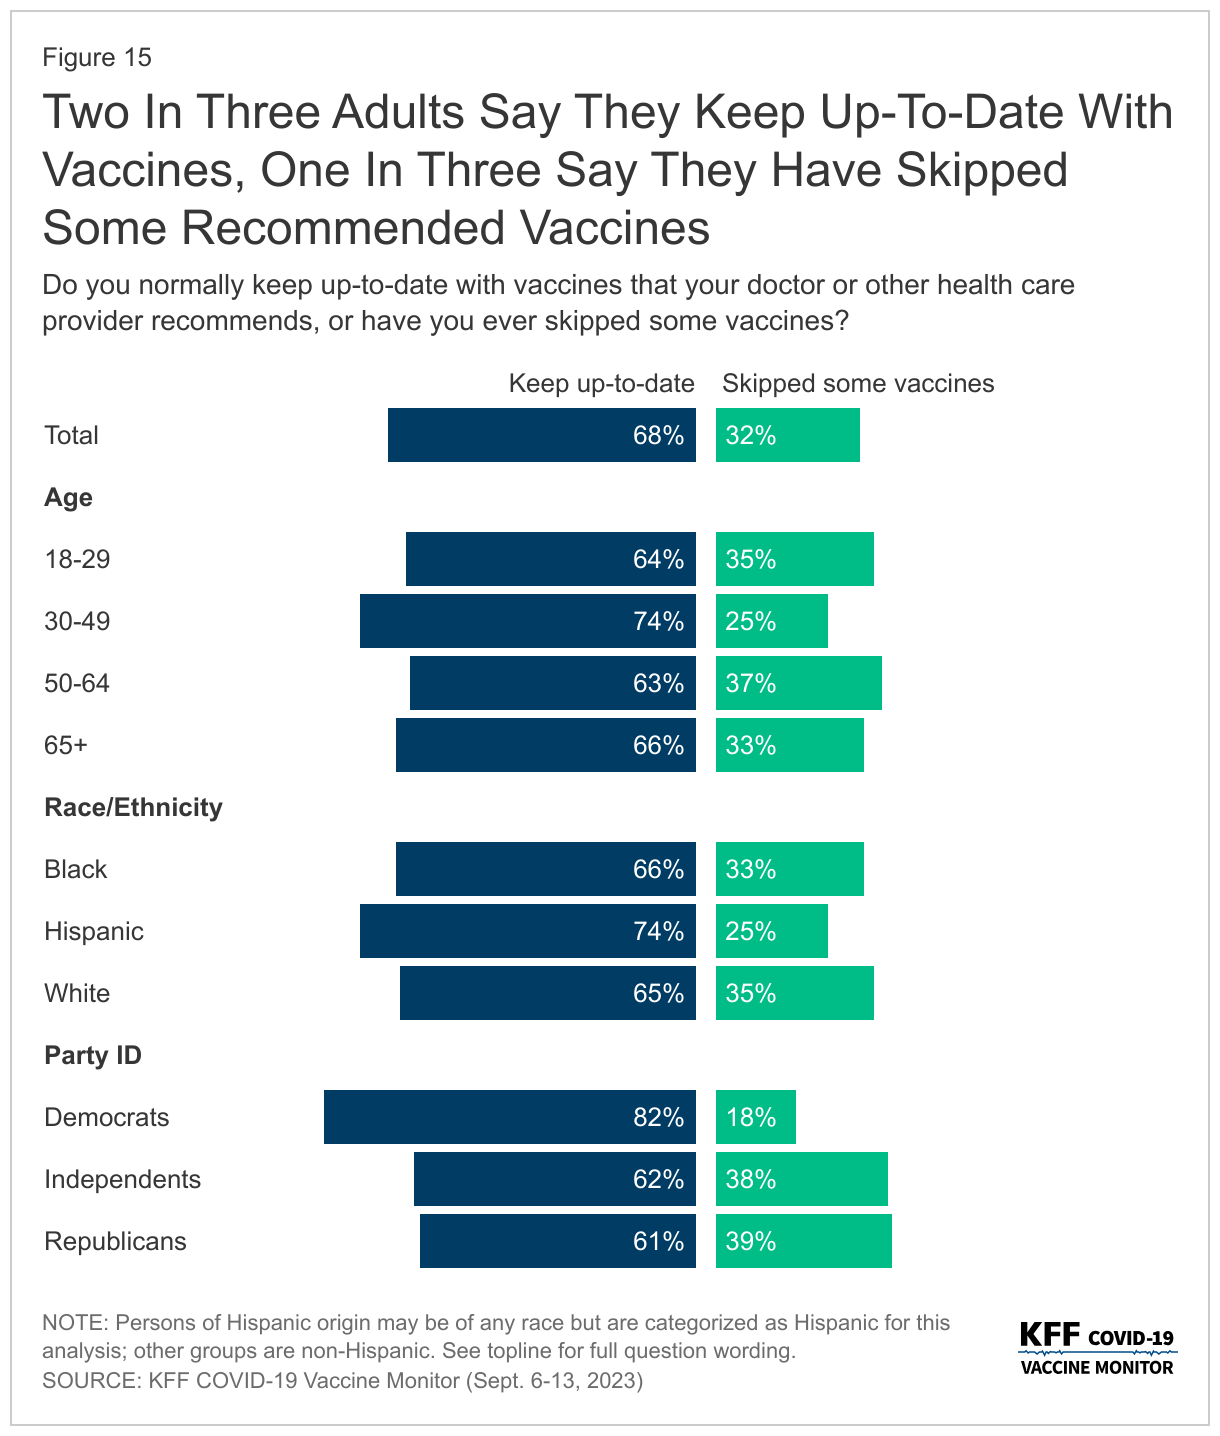
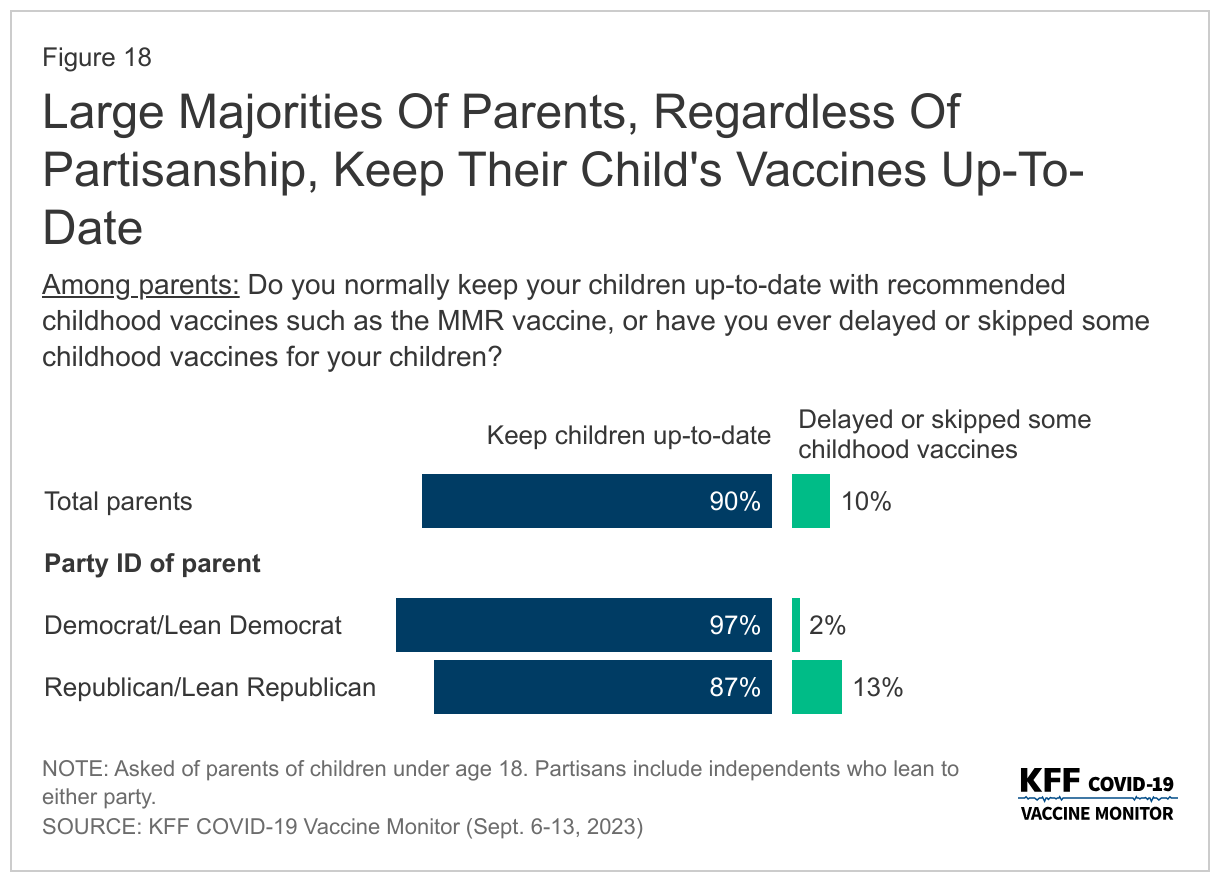
Most adults (68%) also say they normally keep up-to-date with the vaccines that are recommended by their own doctor, including 82% of Democrats and 61% of Republicans. Large majorities of parents – regardless of partisan identification – say they keep their children up to date on recommended childhood vaccines, with just 10% saying they delayed or skipped some vaccines.
Other poll results include:
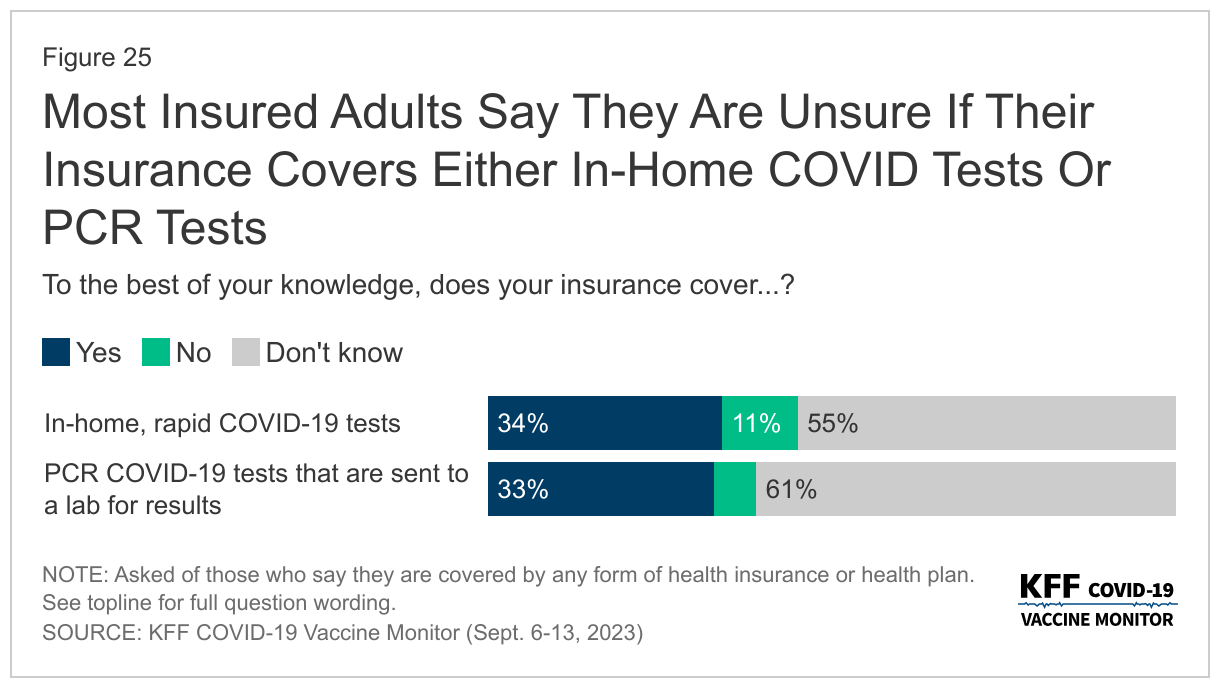
Following the end of the COVID-19 public health emergency in May, most insured people now say they are unsure whether their health insurance covers either in-home, rapid COVID-19 tests (55%) or PCR COVID-19 tests that are sent to a lab for results (61%).
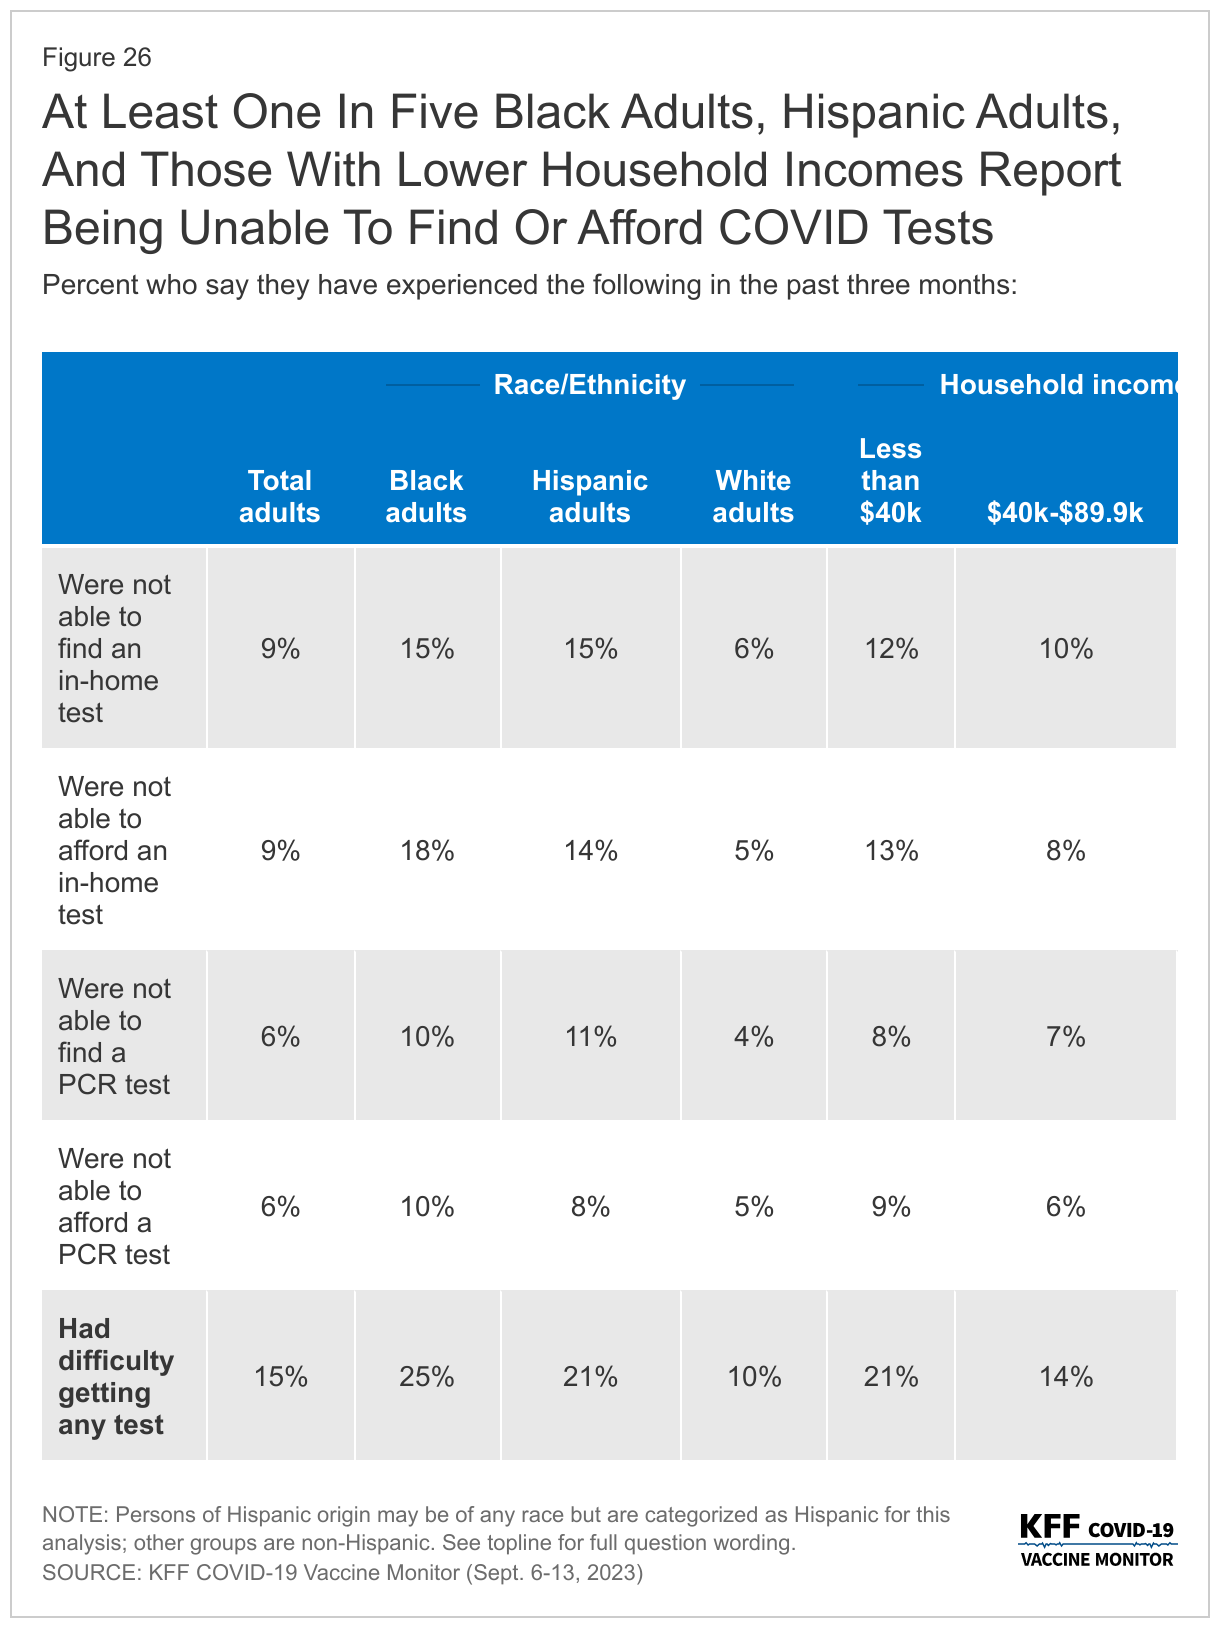
In addition, one in seven (15%) say they’ve wanted to get a COVID-19 test but were not able to find or afford one. Those most likely to report difficulties obtaining a COVID-19 test includes at least one in five Black adults (25%), Hispanic adults (21%), and people with household incomes under $40,000 annually (21%).
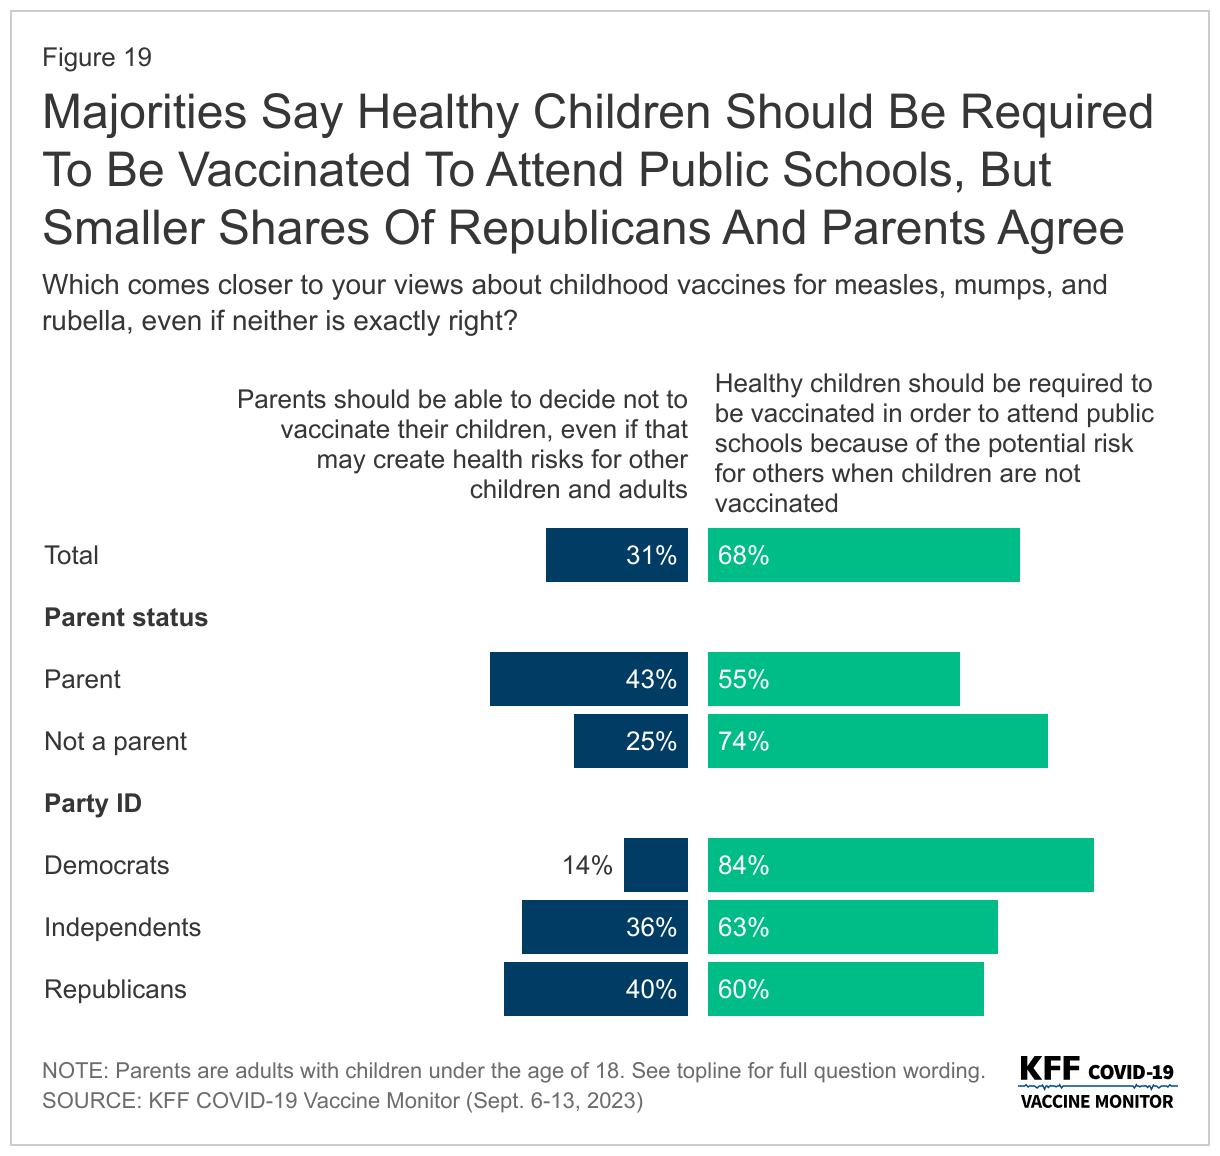
Most adults (68%) and parents (55%) – say that healthy children should be required to be vaccinated against measles, mumps, and rubella to attend public school; fewer adults (31%) and parents (43%) say that parents should be able to decide not to vaccinate their children even if that may create health risks for others.
Designed and analyzed by public opinion researchers at KFF, the survey was conducted from September 6-13, 2023, online and by telephone among a nationally representative sample of 1,296 U.S. adults. Interviews were conducted in English and in Spanish. The margin of sampling error is plus or minus four percentage points for the full sample. For results based on other subgroups, the margin of sampling error may be higher.
The fall season has become synonymous with increased concerns over the spread of three respiratory viruses: COVID-19, the flu, and RSV. A “tripledemic,” the scenario in which all three of these viruses peak at the same time, could strain the country’s health care system and impact millions of people with, for some, life-threatening illnesses. Yet, there are vaccines available, including an updated COVID-19 vaccine and a new RSV vaccine, to help prevent people from getting seriously sick. In the latest COVID-19 Vaccine Monitor, a majority of adults (58%), including three-quarters of adults ages 65 and older, say they will get a flu shot this year including some who say they have already received it. In addition, 58% of adults 60 and older say they will either “definitely get” or “probably get” the new RSV vaccine recommended for their age group.
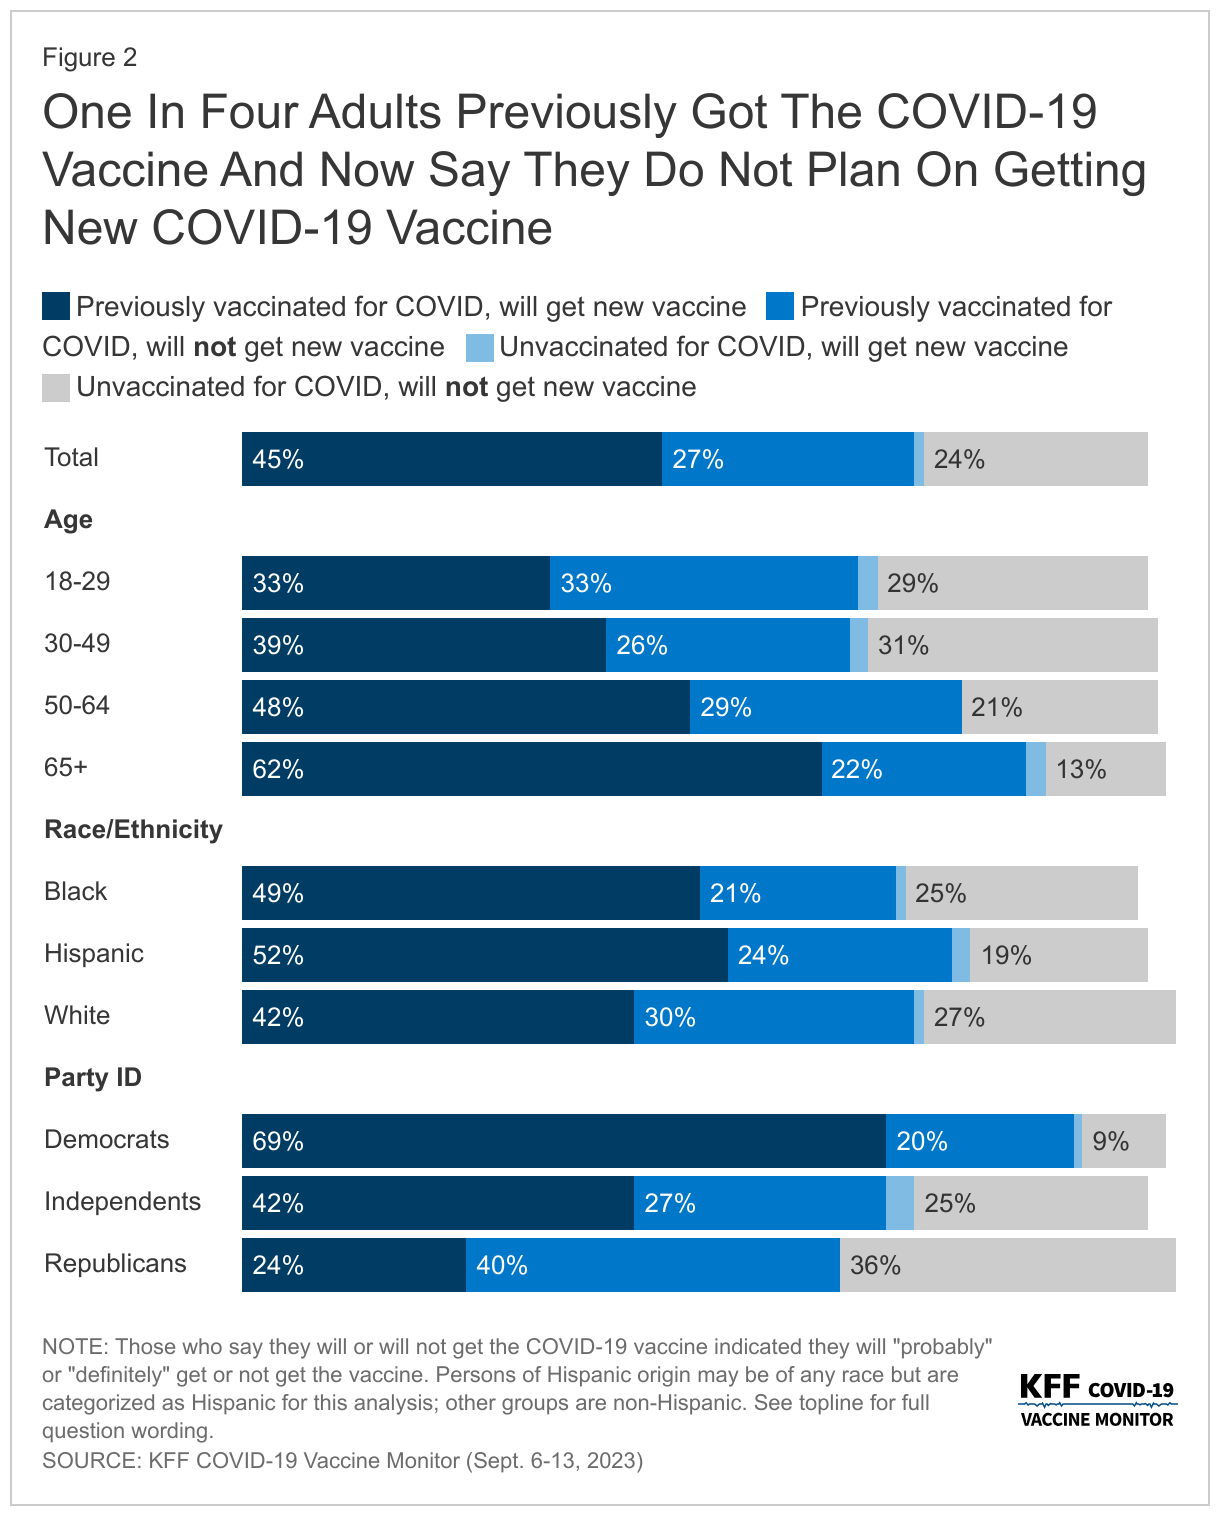
Compared to the flu and RSV vaccines, a somewhat smaller share of adults (47%) say they plan to get the new COVID-19 vaccine, which was recommended by the CDC on September 12th while the poll was in the field. While most (61%) of those who were previously vaccinated for COVID-19 say they will get the new vaccine, almost four in ten (37%) of this group say they “probably” or “definitely” will not get the new vaccine. This means one quarter (27%) of all adults have previously received a COVID-19 vaccine and say they will not get the new vaccine. The vast majority of previously unvaccinated adults say they also will not get the latest COVID-19 vaccine, with just 5% of this group saying they may get the new vaccine. One in four (24%) of all adults have not received any previous COVID-19 vaccine and do not intend to get the newest vaccine available.
Reflecting patterns seen throughout the COVID-19 pandemic, intended uptake is largely divided along party lines. Seven in ten Democrats say they will get the latest COVID-19 vaccine compared to about a quarter of Republicans. Confidence in safety of the new vaccine is also largely partisan. More than eight in ten Democrats (84%) say they are confident in the safety of the COVID-19 vaccine, compared to one in three (36%) Republicans. Overall views of the safety of the COVID-19 vaccine (57%) lag behind the other two vaccines (RSV, 65%; flu, 74%) – largely driven by the views of Republicans who are more confident in the safety of the other two vaccines.
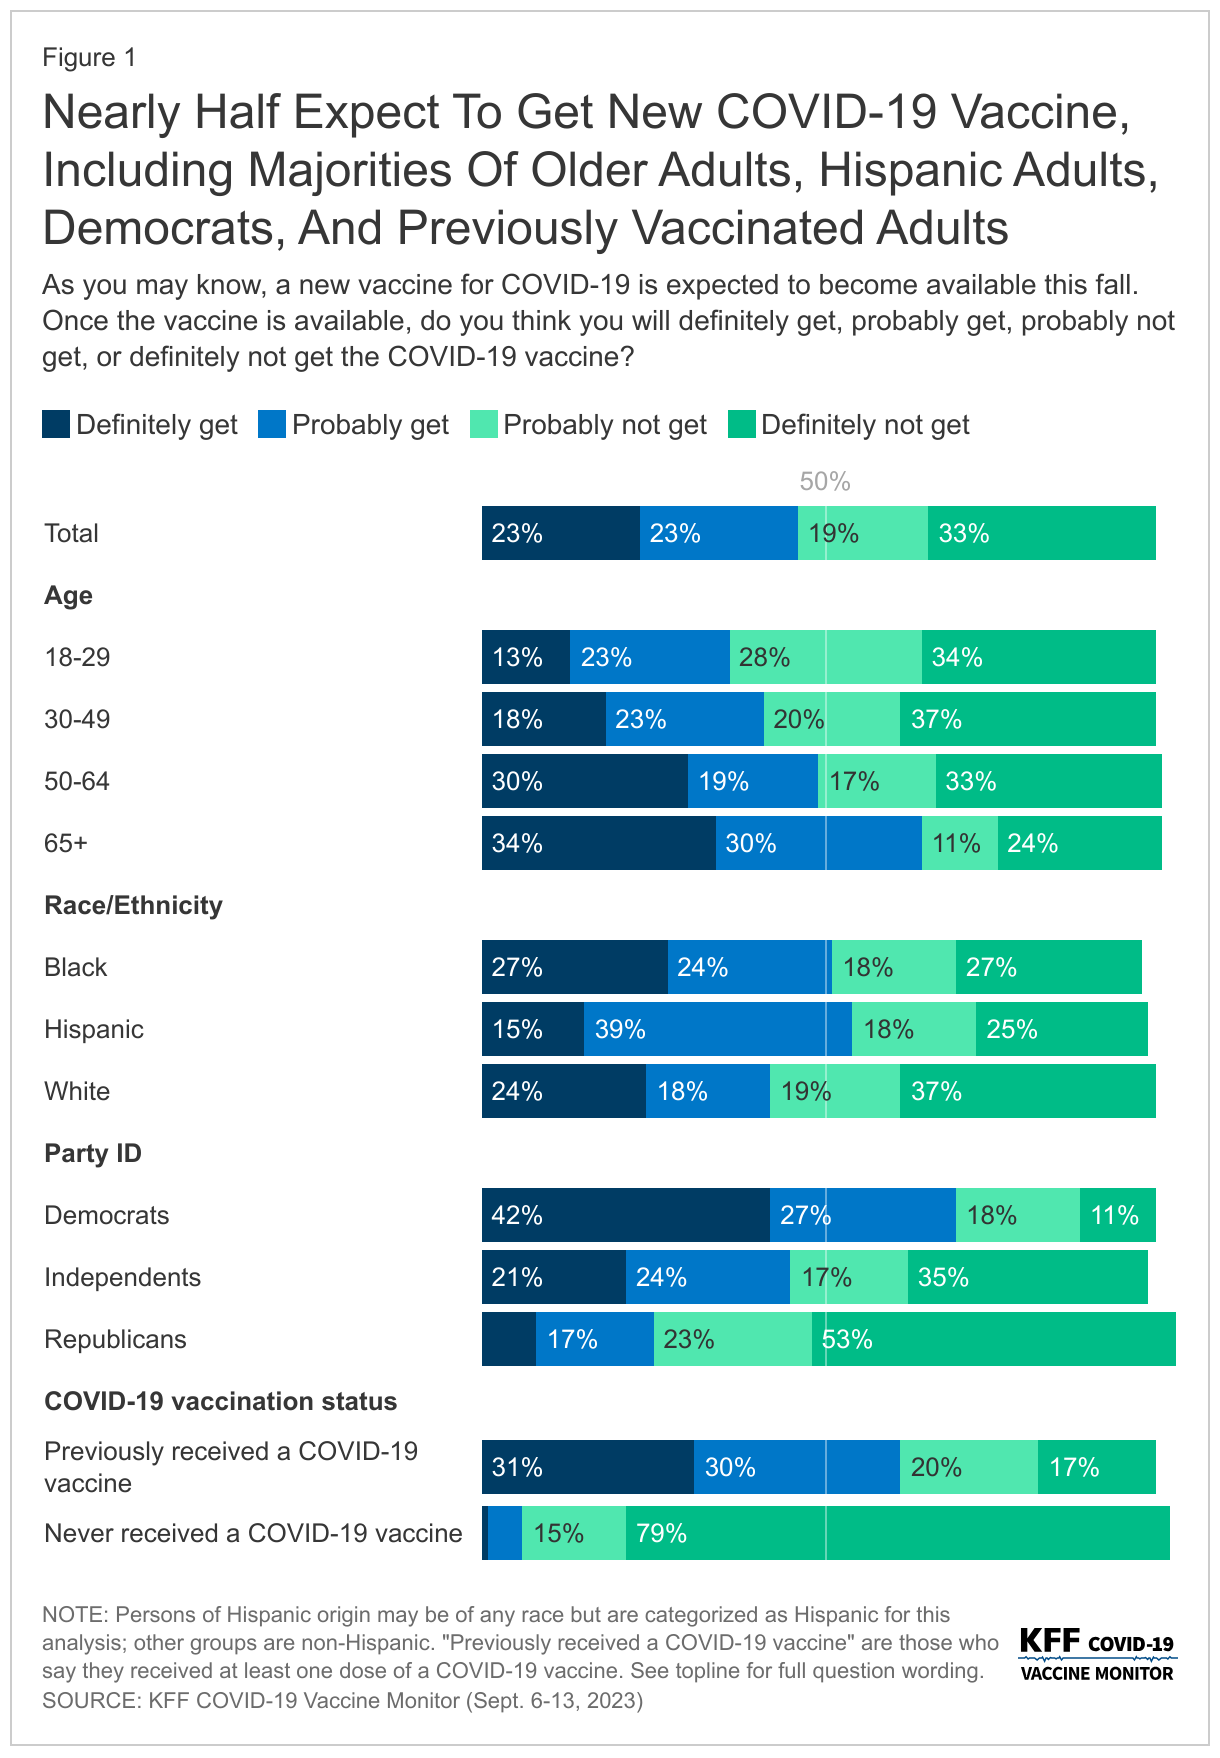
Majorities of groups who are most at risk for getting seriously sick from COVID-19 say they intend to get the latest vaccine available including two-thirds (64%) of adults ages 65 and older and most (56%) of those with a serious health condition. In addition, at least half of Hispanic adults (54%) and Black adults (51%) say they will get the COVID-19 vaccine compared to four in ten (42%) White adults.
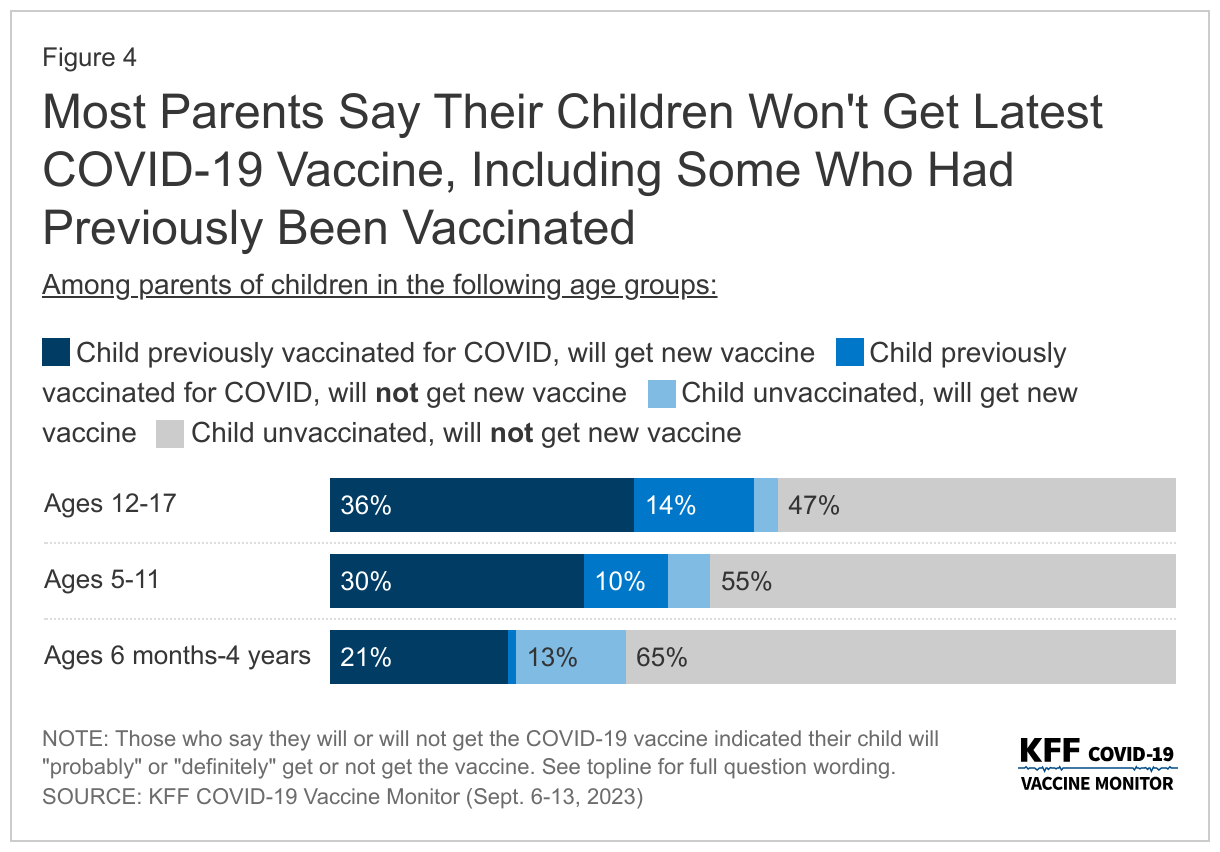
Since COVID-19 vaccines first became available for children, uptake has lagged behind that of adults, particularly at younger ages. In the latest survey, most parents say they will not get their child the new COVID-19 vaccine including six in ten parents of teenagers (those between the ages of 12 and 17), and two-thirds of parents of children ages 5 to 11 (64%) and ages 6 months to 4 years old (66%). One in seven (14%) parents of teenagers say their teen was previously vaccinated but they aren’t planning on getting them the most recent vaccine. More than half of parents of children ages 5 and younger say their child has never received a COVID-19 vaccine and they do not plan on getting them the newest COVID-19 vaccine. Similar to adults overall, larger shares of parents say they are confident in the safety of both the flu vaccine (68%) and the RSV vaccine (63%) compared to the COVID-19 vaccine (48%).
Mirroring the partisan differences in views on vaccines, there is a persistent partisan divide on overall views of COVID-19, the current caseload in the U.S., whether they could be sick from COVID, and changes to behavior – including willingness to take a diagnostic test when sick. Democrats are more likely to report changing their behaviors because of recent news of increases in COVID-19. More than half of Democrats (58%) say they’ve recently modified their behavior to be more COVID-conscious compared to 16% of Republicans. Democrats (19%) are also more than twice as likely as both independents (8%) and Republicans (9%) to say that in the past three months they have had symptoms they thought could be COVID-19, and therefore took a COVID-19 diagnostic test. Most Democrats (77%) also say there is a new wave of COVID-19 infections hitting the U.S. now, while half of Republicans (51%) disagree.
Most insured people now say they are unsure whether their health insurance covers either in-home, rapid COVID-19 tests (55%) or PCR COVID-19 tests that are sent to a lab for results (61%). This confusion likely reflects the changing coverage landscape for tests since the public health emergency ended more than three months ago as most people no longer have coverage of in-home tests and will likely face cost-sharing for PCR tests. And while most adults do not report difficulty accessing testing, 15% overall say there was a time in the past three months when they wanted a COVID-19 test and they were not able to find or afford one, rising to more than one in four Black adults and one in five Hispanic adults. HHS announced on September 20th that free in-home tests will soon be available again on a limited basis from the federal government.
COVID-19, Flu, and RSV Vaccine Intentions and Perceived Safety
The September KFF COVID-19 Vaccine Monitor asks the public about their intention to get the flu vaccine and the updated COVID-19 vaccine, both of which are recommended by the CDC for people ages 6 months and older. The poll was in the field when the latest COVID-19 vaccine was recommended by the Centers for Disease Control and Prevention (CDC) but largely before it was available to the public. The CDC issued recommendations for everyone 6 months and older to get the annual flu vaccination on June 29th. Older adults, those 60 and older, were also asked questions about other vaccines recommended for their age group including the pneumonia vaccine, the shingles vaccine, and the new RSV vaccine which the CDC also recently recommended for this group.
Intentions To Get New COVID-19 Vaccine Lags Behind Initial Vaccine Uptake Among Adults And Children
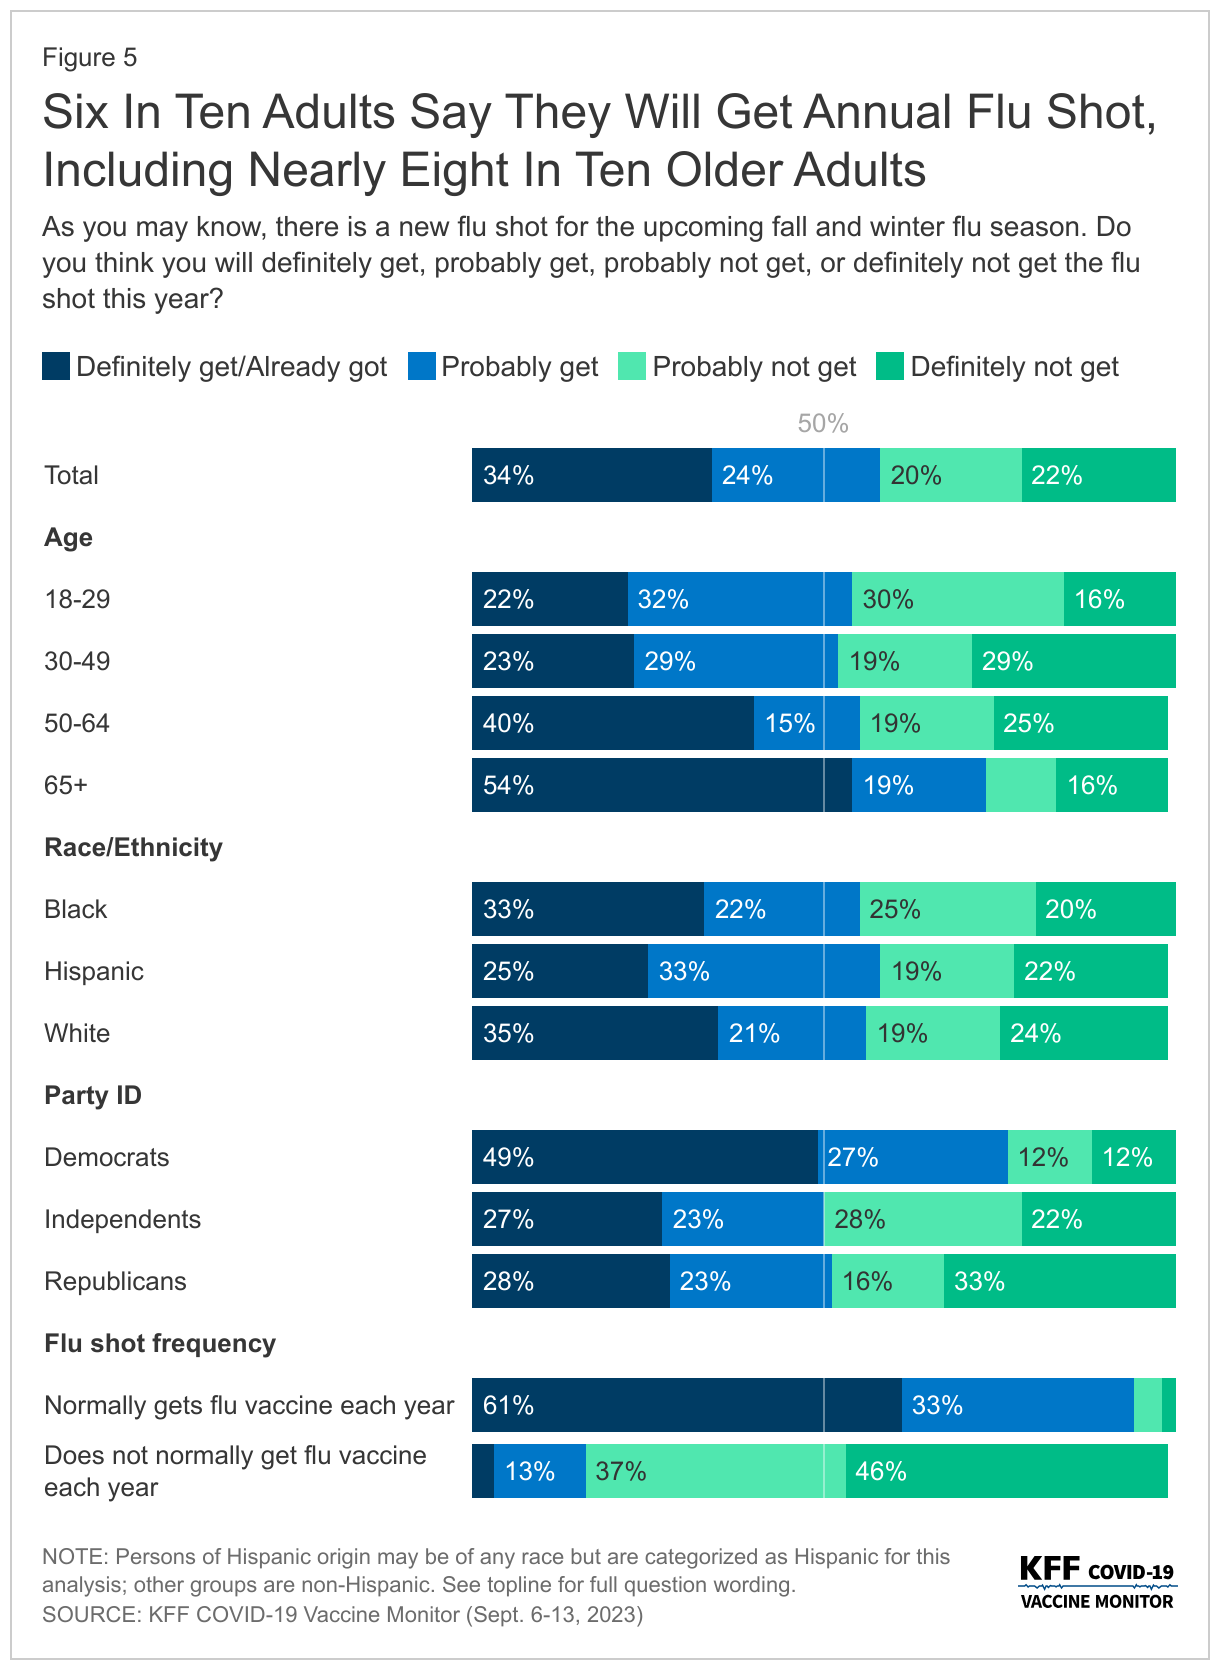
Half of adults say they either will “definitely get” (23%) or “probably get” (23%) the new vaccine for COVID-19 that was approved by the CDC on September 12th. One in three adults say they will “definitely not get” the new COVID-19 vaccine, and another 19% say they will “probably not get” the vaccine. Reflecting patterns in COVID-19 vaccine uptake throughout the pandemic, the share who say they will get the new COVID-19 vaccine is largest among adults age 65 and older (64%) and Democrats (70%). In addition, at least half of Hispanic adults (54%) and Black adults (51%) say they will get the COVID-19 vaccine compared to four in ten (42%) White adults.
Larger shares of those with a serious health condition (56%), such as high blood pressure, heart disease, lunch disease, cancer, or diabetes, say they will get the new COVID-19 vaccine compared to 42% of those who do not have a chronic condition. Similar to previous trends, almost half (44%) of those with insurance who are under the age of 65 report that they will get the new COVID-19 vaccine compared to three in ten (30%) of those who are uninsured and under 65 years old.
While most (61%) of those who were previously vaccinated for COVID-19 say they will get the new vaccine, almost four in ten (37%) of this group say they probably or definitely won’t get it. Very few (5%) of those who have not received a previous COVID-19 vaccine dose say they will get the new vaccine.
Intentions to get the initial booster, the bivalent booster, and now the latest vaccine available measured in the KFF COVID-19 Vaccine Monitor have not matched initial vaccine uptake. And while a smaller share of adults say they intend to get the latest vaccine compared to initial vaccine rollout (in which more than three in four adults received at least one dose), intentions to get this vaccine outpaces both intentions to get previous boosters and actual vaccine uptake measured by the CDC. Overall, about half of adults (45%) have received a COVID-19 vaccine and say they plan to get the latest vaccine, but about a quarter of adults (27%) say they have previously received a COVID-19 vaccine and now say they will not be getting the new vaccine available.
COVID-19 vACCINE Intent Among Parents Of Teenagers anD Kids
The KFF COVID-19 Vaccine Monitor has been tracking vaccine uptake for children across various age groups since the vaccines became available. The surveys have consistently shown COVID-19 vaccine uptake has been higher among older kids with about half of parents of teenagers saying their child has received at least one dose of the COVID-19 vaccine, compared to about a quarter of parents of kids between 6 months and 4 years old. Parents have cited safety concerns, lack of testing or research, and side effects as their main reasons for not getting the youngest cohort vaccinated.
The new version of the COVID-19 vaccine is recommended for all children ages 6 months and older and unlike previous COVID-19 vaccines, most parents say they will either “probably not get” or “definitely not get” their child, regardless of age, vaccinated. Six in ten parents of teenagers (those between the ages of 12 and 17) say they will not get their child the new COVID-19 vaccine as do two-thirds of parents of children ages 5 to 11 (64%) and ages 6 months to 4 years old (66%).
About a third of parents of teenagers say their child was previously vaccinated and they will get their child vaccinated with the most recent vaccine available, while a notable share (14%) say their teenager was previously vaccinated but they aren’t planning on getting them the most recent vaccine. More than half of parents of children younger than five years old say their child has never received a COVID-19 vaccine and they do not plan on getting them the newest COVID-19 vaccine.
Majority Of Adults Say They Will Get Annual Flu Shot And Most Older Adults Plan To Get RSV Vaccine
Six in ten adults (58%) say they will get a flu shot this year including 2% who say they have already gotten their flu shot. This includes nearly eight in ten adults ages 65 and older, as well as three in four Democrats. Those who report normally getting a flu shot (53% of all adults) are nearly six times as likely as those who do not normally get a flu shot to say they will get it this year. About half of Republicans (51%) and independents (49%) say they will get their annual flu shot or have already gotten it.
While public health officials say getting the flu vaccine and the COVID-19 vaccine at the same time is safe and initially thought to be preferred in order to reduce burden, only about half (53%) of those who intend to get both say they plan to get it at the same time.
Most Older Adults Say They Will Get RSV Vaccine
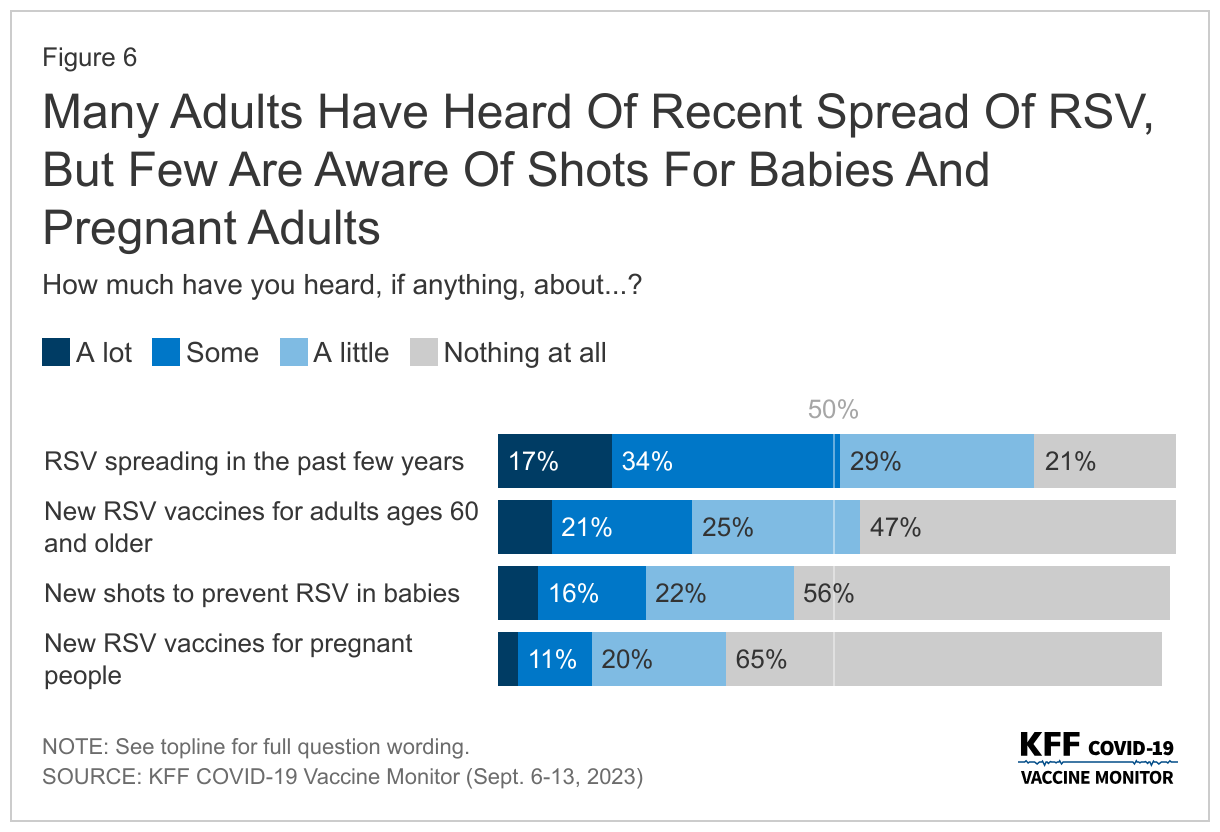
Half of people say they have heard either “a lot” or “some” about RSV spreading in the past few years, but considerably smaller shares have heard about the vaccines aimed at preventing at-risk groups from getting seriously sick from the respiratory virus. Three in ten adults (28%) say they have heard at least some about the new RSV vaccine for adults 60 and older, one in five (22%) say they have heard about the new shots to prevent RSV in babies, and one in seven (14%) have heard about the new recommended RSV vaccines for pregnant people.
Awareness of both the vaccines for adults ages 60 and older, and the new shots to prevent RSV in babies is higher among groups that are at risk. Four in ten adults ages 60 and older say they have heard about the new RSV vaccines for their age group and one in three parents of children less than two years old say they have heard about the shots for this age group.
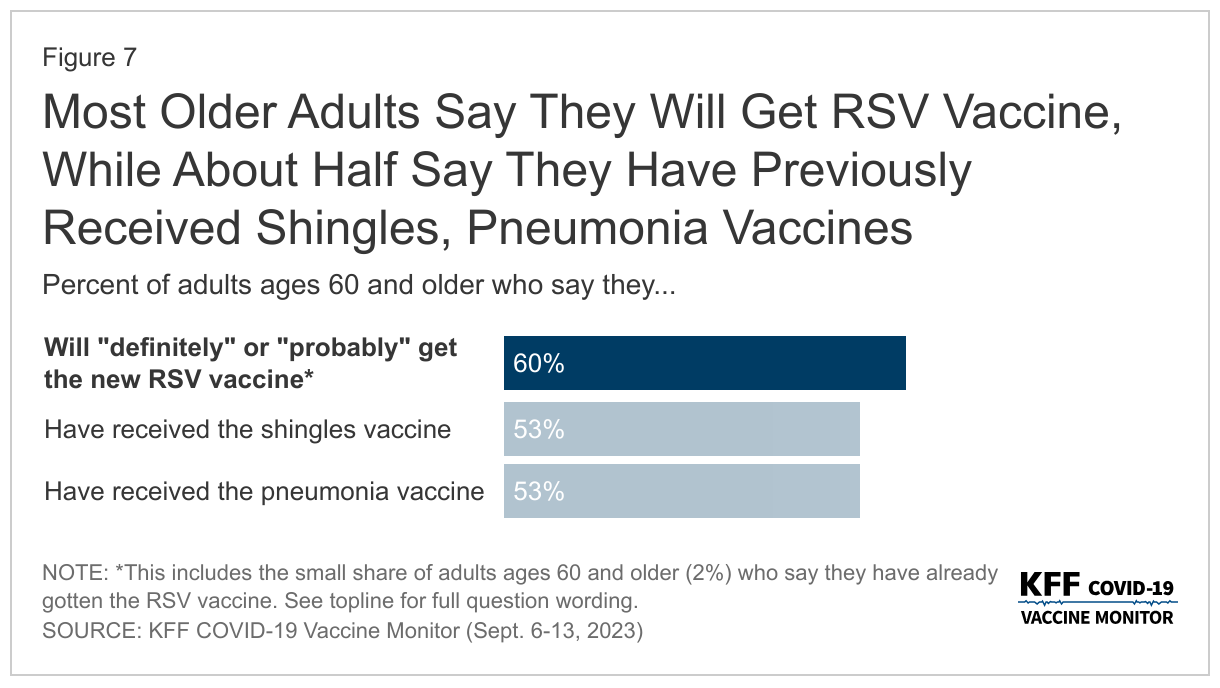
The share of adults ages 60 and older who say they will either “definitely get” or “probably get” the new RSV vaccine matches vaccine uptake for other key vaccines for this age group, notably the shingles vaccine and the pneumonia vaccine. More than half of older adults say they have received the pneumonia vaccine (53%), the shingles vaccine (53%), and plan to get the new RSV vaccine (58%). An additional 2% of older adults say they have already gotten the RSV vaccine.
As Virus Season Approaches, Most Are Confident In Vaccine Safety
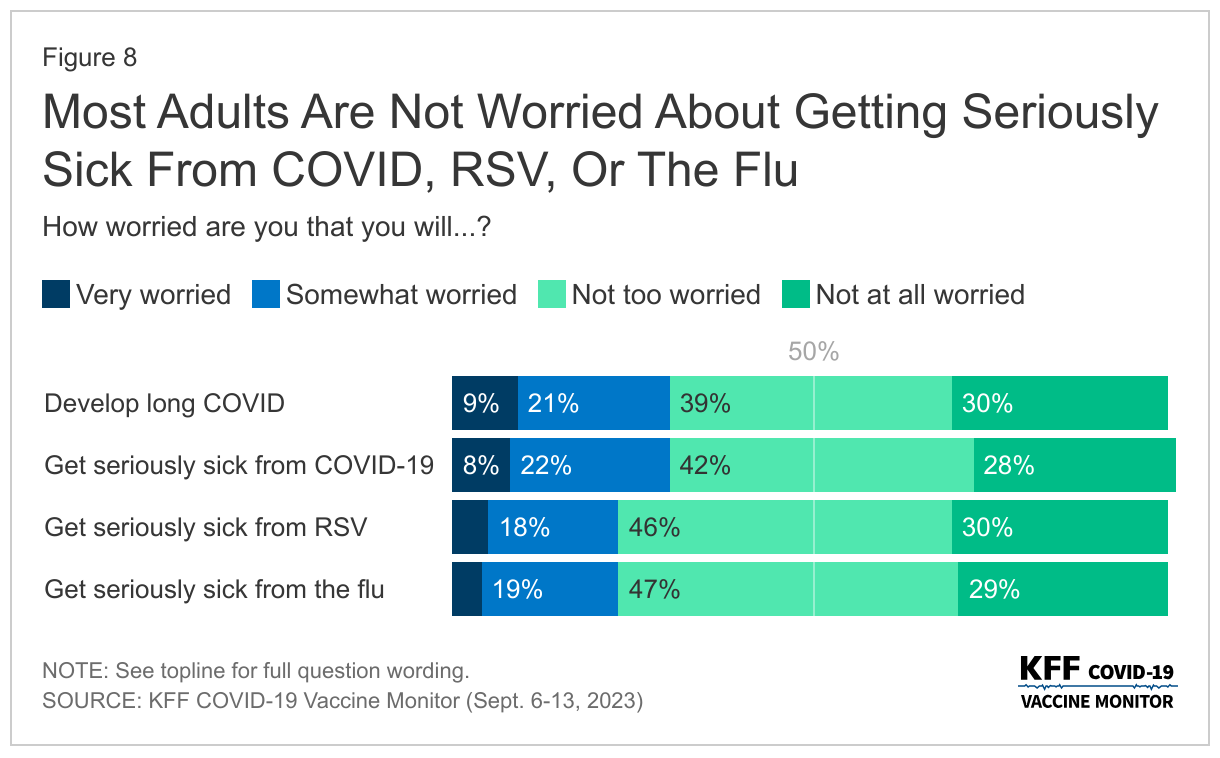
Public health officials have raised concerns about a possible “tripledemic” with COVID-19, the respiratory illness RSV (respiratory syncytial virus), and the flu all hitting peaks this fall as people are more likely to be indoors and gathering together. About three in ten adults say they are worried about developing long COVID (31%) or getting seriously sick from COVID-19 (30%). About one in four are worried about getting seriously sick from the flu (23%) or from RSV (23%).
Those with a serious health condition (such as high blood pressure, heart disease, lung disease, cancer, or diabetes) are more likely than those without a serious health condition to be worried about the impending virus season. About four in ten of those with a chronic health condition say they are worried about getting seriously sick from COVID-19 (38%) or developing long COVID (38%), and three in ten are worried about getting seriously sick from RSV (29%) or the flu (28%).
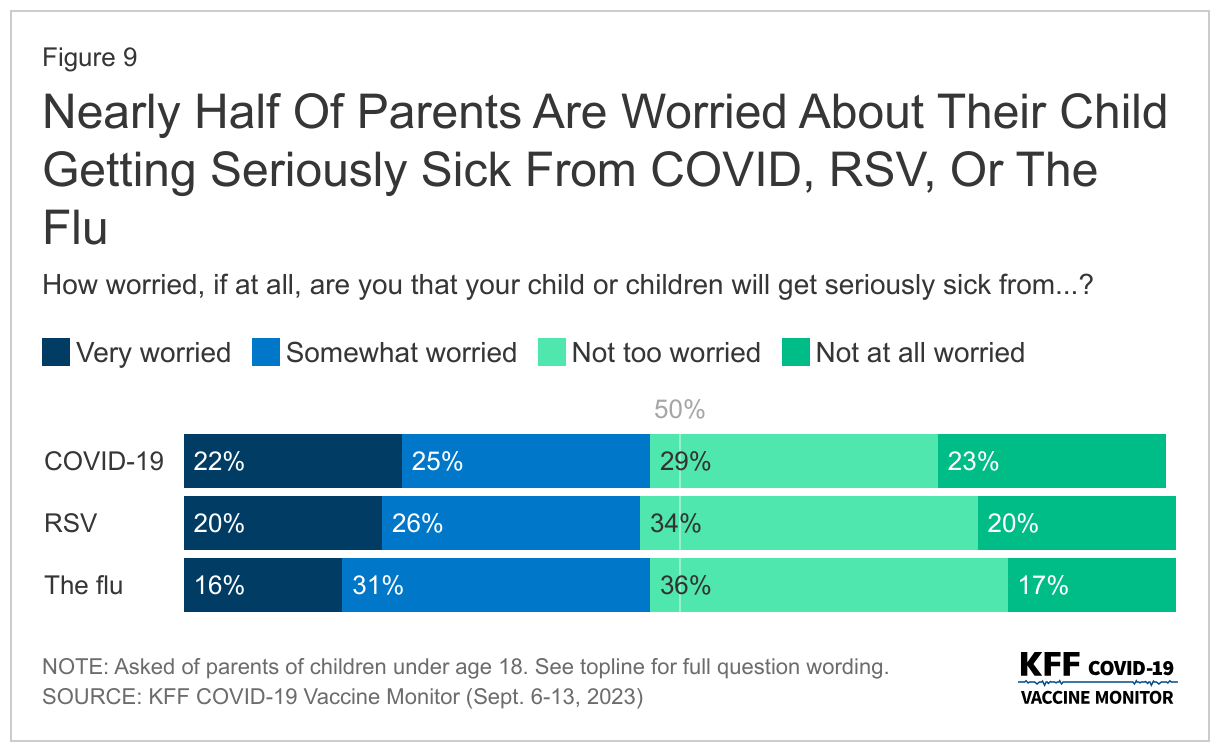
Nearly half of parents say they are worried that their child or children will get seriously sick from COVID-19 (48%), the flu (47%), or RSV (46%).
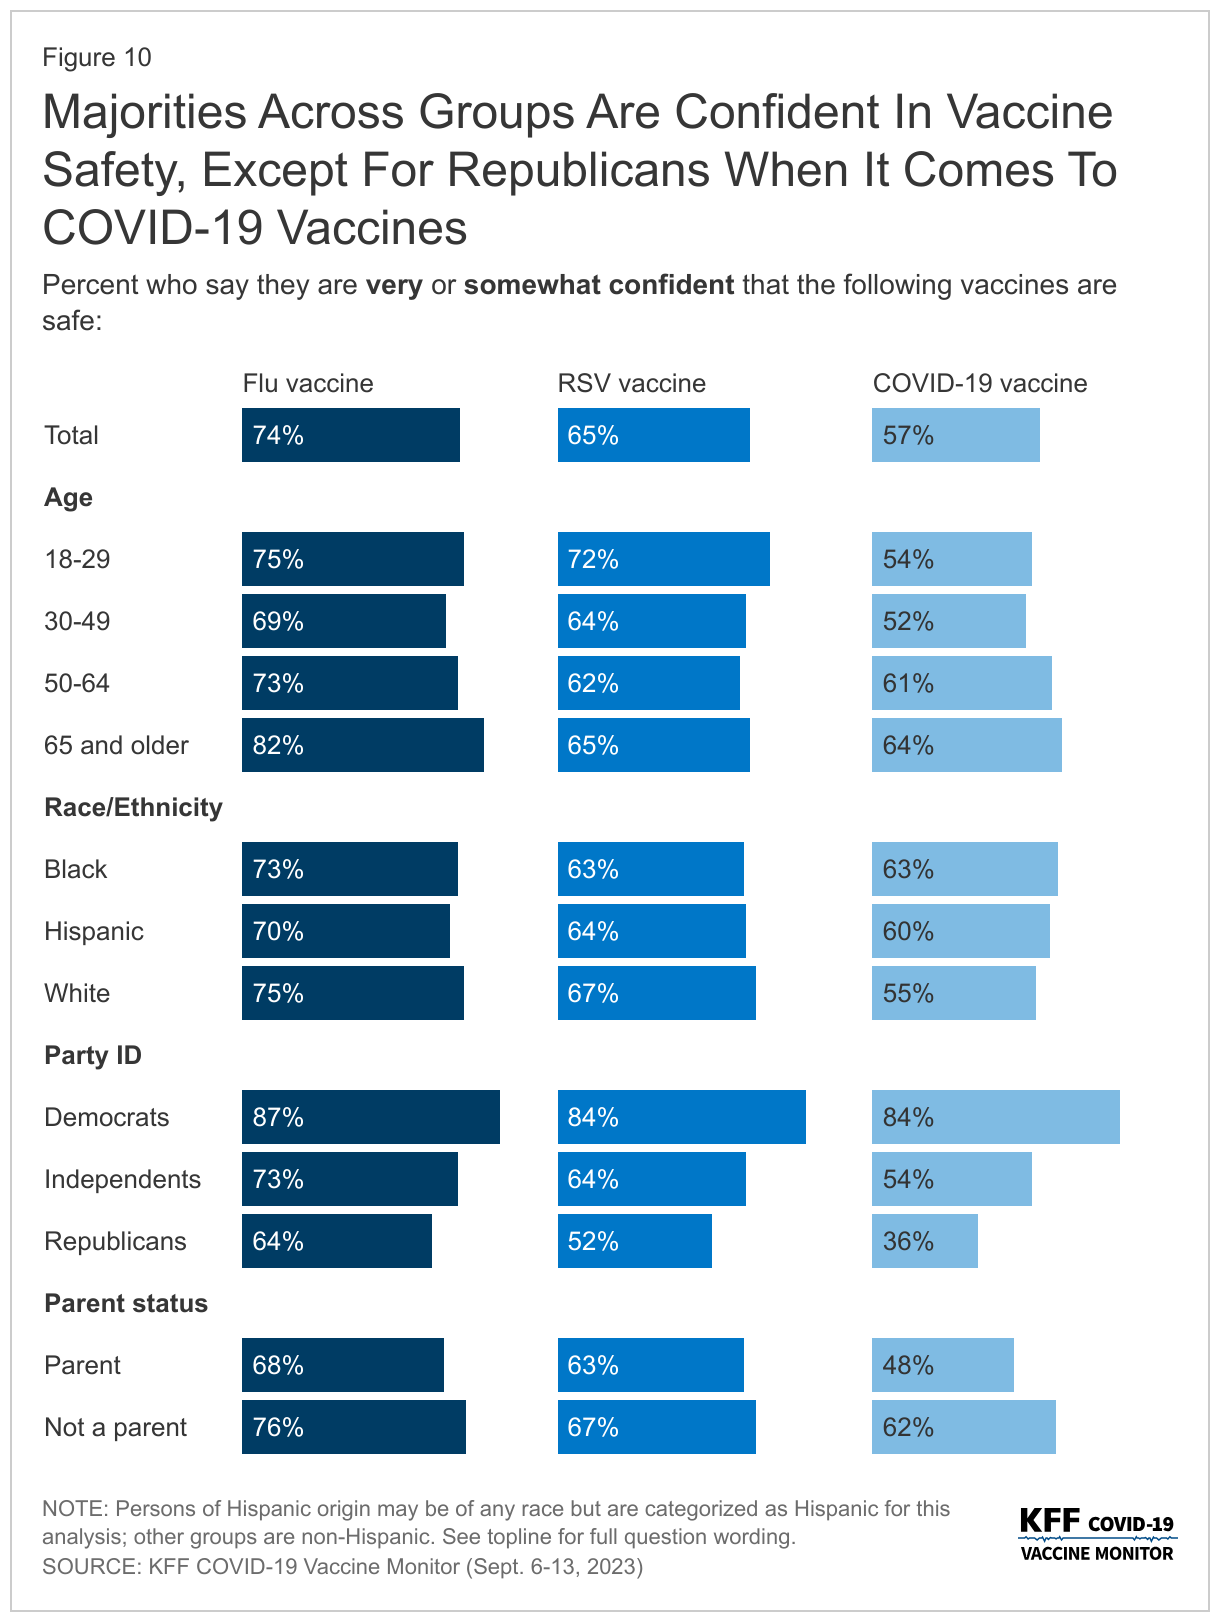
Amidst news of the impending virus season, most adults think that the vaccines developed to combat these viruses are safe. While a majority of adults are confident in the safety of the COVID-19 vaccine (57%), it lags slightly behind confidence in the RSV vaccine (65%) and the flu vaccine (74%).
Majorities across age groups, racial and ethnic identities, and partisanship are confident in the safety of all three vaccines – with one notable exception. About one in three Republicans say they are “very confident” or “somewhat confident” in the safety of the COVID-19 vaccine (36%), compared to more than half of Republicans who are confident the RSV vaccine is safe (52%) and nearly two-thirds who are confident in the safety of the flu vaccine (64%). These views reflect the partisan gap in COVID-19 vaccine confidence throughout the more than two years of COVID-19 vaccine rollout.
Similarly to adults overall, parents are more confident in the safety of both the flu vaccine (68%) and the RSV vaccine (63%), than the COVID-19 vaccine (48%).
Trust In Vaccine Information
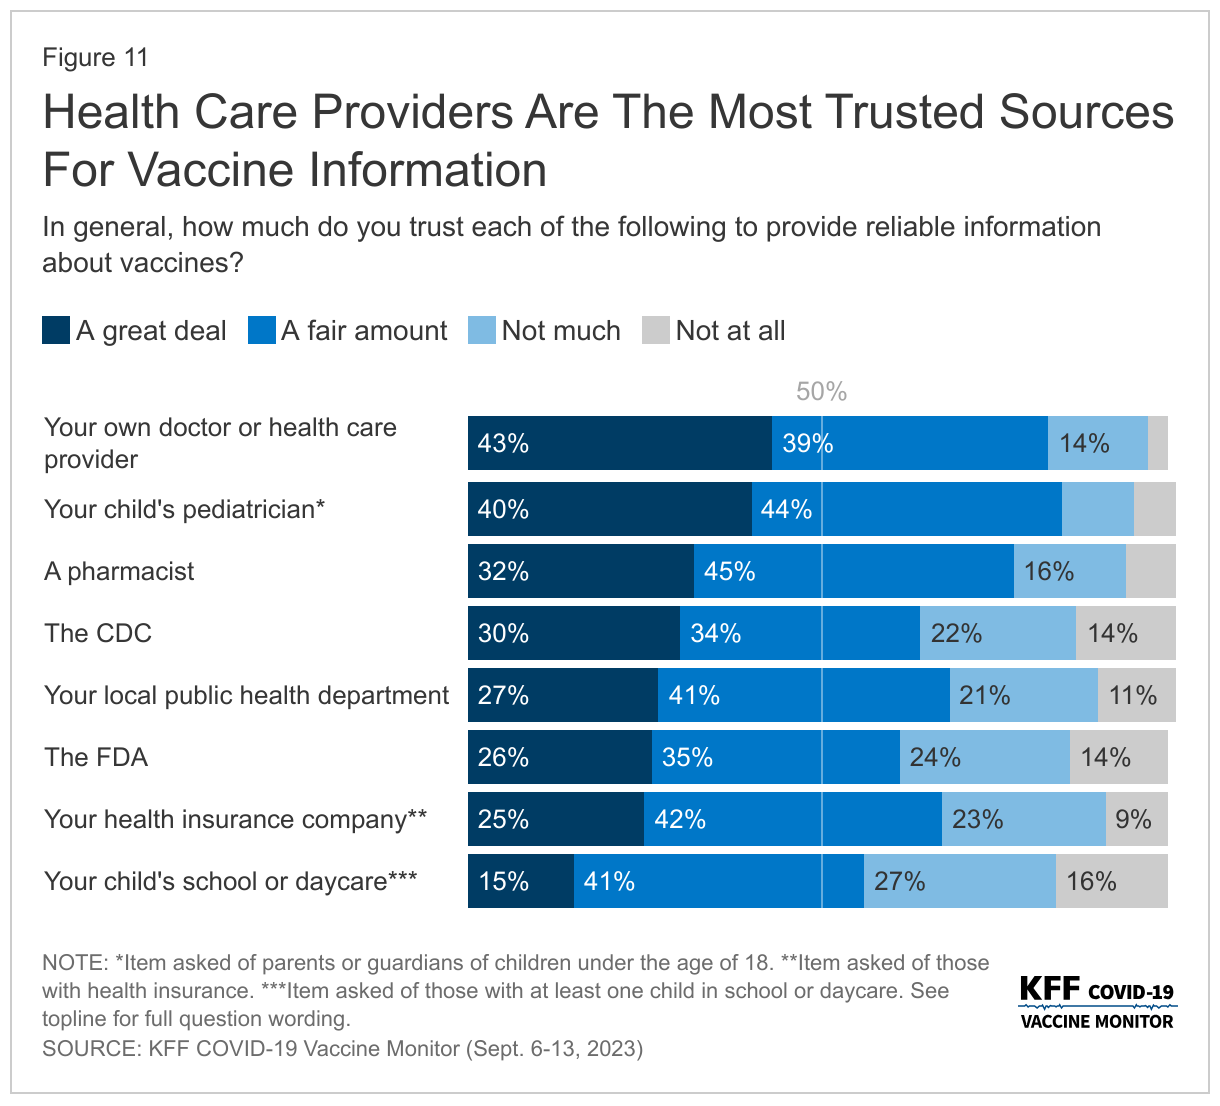
As the CDC Director Mandy Cohen continues her efforts to combat the lingering vaccine skepticism from the COVID-19 pandemic, the public continues to rank their own doctors as the most trusted source of information about vaccines. More than eight in ten adults (82%) say they trust their own doctor or health care provider at least a fair amount when it comes to providing reliable information about vaccines. A similar share of parents (84%) has the same level of trust in their child’s pediatrician. About three-quarters of adults (77%) say they trust pharmacists to provide reliable information. A smaller share, but still a majority, say they trust public health government agencies like their own local public health department (68%), the Centers for Disease Control and Prevention (CDC) (63%), or the U.S. Food and Drug Administration (FDA) (61%). This is similar to the share of insured adults (68%) who say they trust their health insurance company. Schools and daycares rank below other groups asked about with slightly more than half (56%) of parents with children attending school or daycare saying they trust them to provide reliable information about vaccines.
The ranking of trusted sources on reliable information about vaccines is similar to the sources the public trusts specifically on COVID-19 vaccines measured last year, and partisan differences are still very apparent. While large majorities across partisans say they trust their own doctor or child’s pediatrician, government sources of information like the CDC, local public health departments, and the FDA fare much worse among Republicans. About four in ten Republicans say they trust the FDA (42%) or the CDC (40%) to provide reliable information about vaccines, and about half of Republicans (51%) say the same about their local public health departments. Large majorities of Democrats and more than half of independents say they trust each of these organizations at least a fair amount.
Understanding How And Why To Get Vaccines
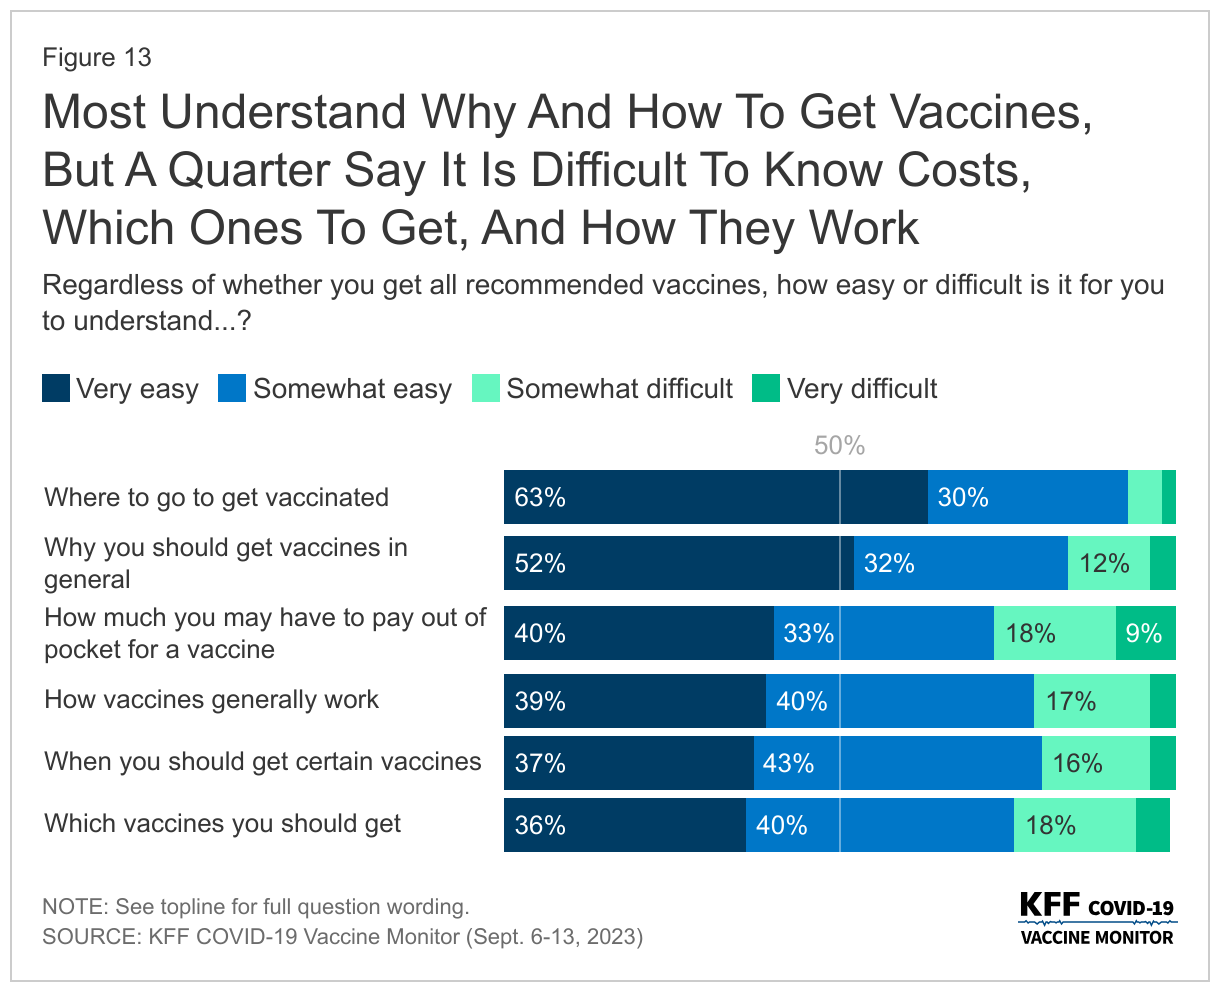
Nearly all adults (93%) say it is easy for them to understand where to go to get vaccinated, including six in ten (63%) who say it is “very easy.” At least three-quarters of adults also say it is easy for them to understand why they should get vaccines (84%), when they should get them (79%), how vaccines work (78%), which vaccines they should get (77%), and how much they may have to pay for a vaccine (63%).
While most adults say it is easy for them to understand the reasoning behind vaccines and the logistics of how to get them, at least one in five of adults still say some of these aspects are difficult to understand. This includes understanding which vaccines they should get (23%), how vaccines generally work (22%), or understanding when they need to get certain vaccines (20%). More than one in four adults say it is difficult to know how much they may have to pay out-of-pocket (27%), even as most people with health insurance will not have to pay any out-of-pocket costs for recommended vaccines.
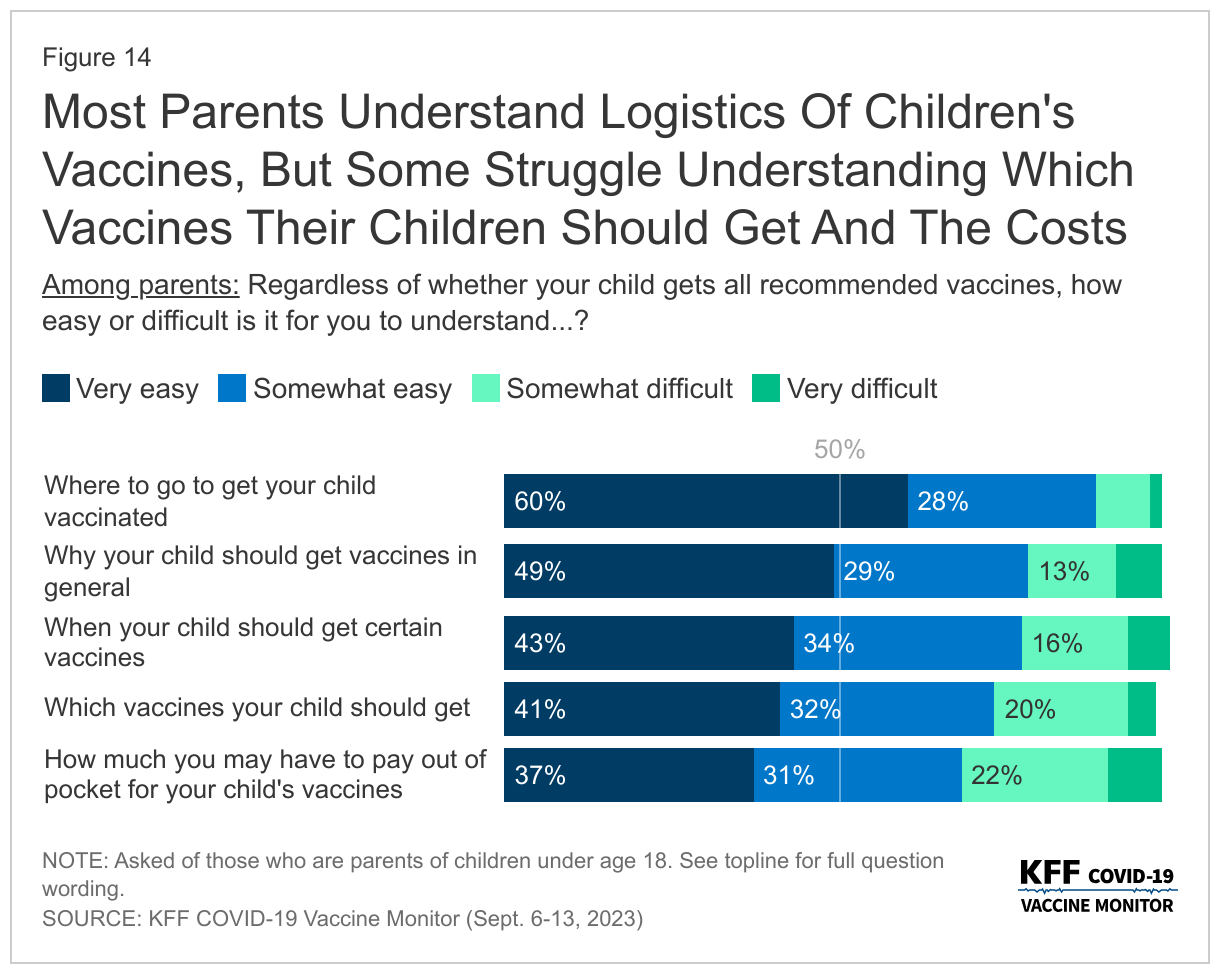
Similarly, most parents report that it is easy to understand the logistics of their vaccinations, such as when and where to get the shots and why their child should get vaccinated. Nearly nine in ten (88%) parents say it is easy to know where to go to get their children vaccinated and about three-fourths of parents say the same about why their children should get vaccines in general (78%), when their child should get certain vaccines (77%), or which vaccines their child should get (73%). Two-thirds (68%) say it is easy for them to understand how much they have to pay out-of-pocket for their child’s vaccines. Most insurance coverages require no out-of-pocket costs for recommended vaccines for children.
Most adults say they get vaccines recommended by Their doctors
With health care providers as the most trusted sources of information about vaccines, most adults (68%) say they normally keep up-to-date with the vaccines that their health care provider recommends for them, while one-third (32%) say they have skipped some recommended vaccines. The share who say they have skipped some recommended vaccines is lowest among Democrats with one in five (18%) saying they have skipped some vaccines, compared to four in ten independents (38%) and Republicans (39%). At least one in three Black adults (33%) and White adults (35%) say they have skipped some vaccines, as have one in four Hispanic adults.
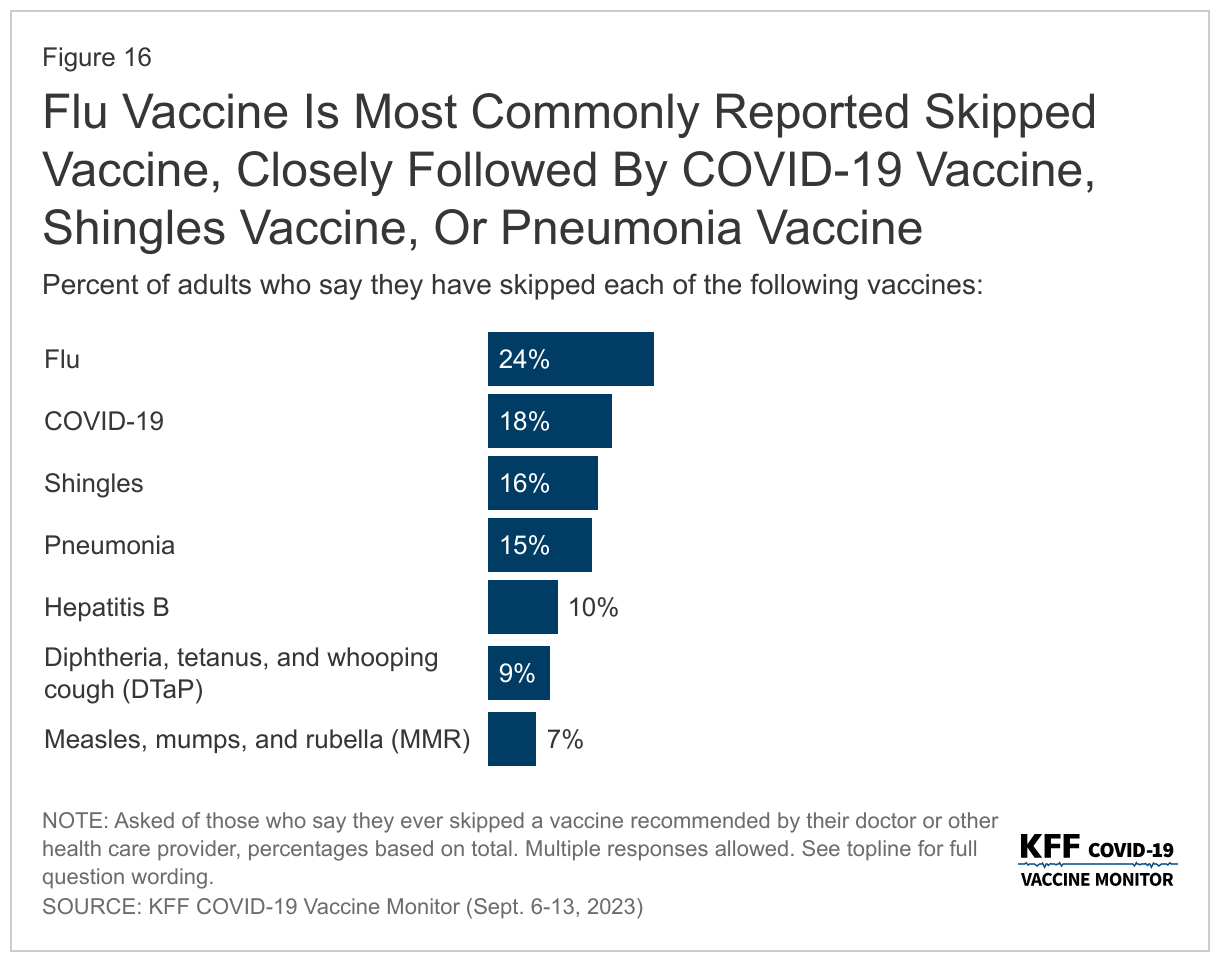
The flu vaccine is the most commonly reported skipped vaccine with one in four adults overall saying they have ever skipped a flu vaccine. About one in six adults say they have skipped a COVID-19 vaccine (18%), the shingles vaccine (16%), or the pneumonia vaccine (15%) when it was recommended by their provider. Previously, both the pneumonia and shingles vaccines were generally recommended for older adults and only recently has the shingles vaccine recommendations expanded to include some adults with certain ongoing health needs, and the pneumonia vaccine is now recommended for children as well as adults 65 and older. The flu vaccine and the COVID-19 vaccine are recommended for everyone age 6 months and older.
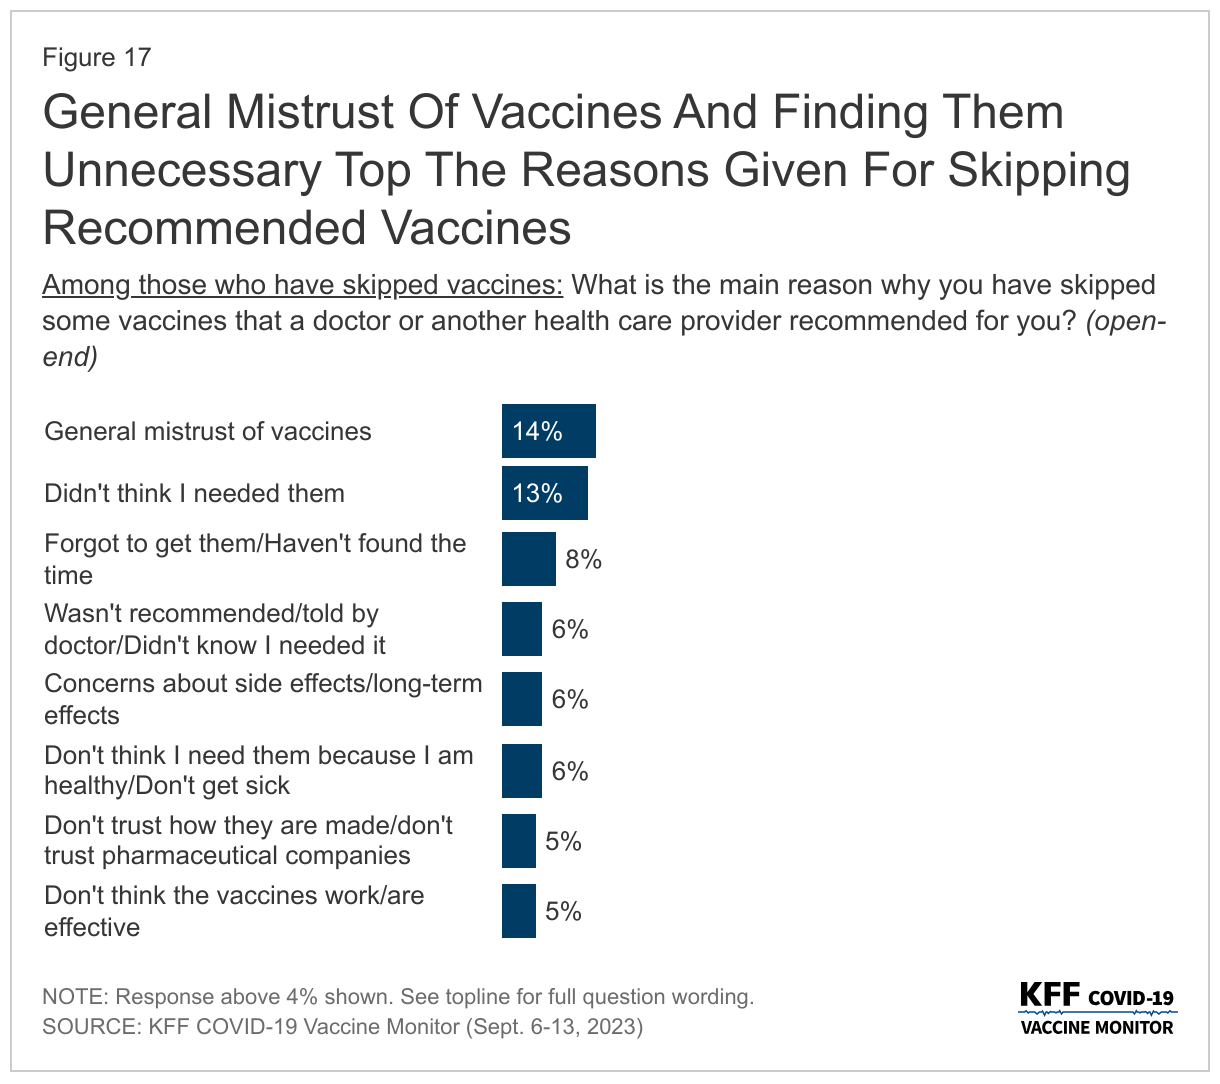
When asked the main reasons for skipping some recommended vaccines, the most commonly provided responses focus on general mistrust of vaccines (14%), or people not thinking they needed them (13%). Another one in ten offer responses focused on not finding the time or forgetting they needed to get them (8%). Other commonly reported responses include a doctor not recommending them or they not knowing they needed them (6%), concerns about side effects or long-term effects (6%), and not thinking they needed them specifically because they are healthy and do not typically get sick (6%). Small but significant shares also offer responses related to mistrust in the vaccines and pharmaceutical companies (5%) or thinking the vaccines do not work or are not effective (5%).
In Their Own Words: Why Have You Skipped Some Recommended Vaccines?
“I have no confidence in the safety or efficacy of vaccines. I believe they are unnecessary for generally healthy individuals.” – 62 year-old White woman, Florida
“Haven’t had a chance to go to local pharmacy to get one.” – 74 year-old Hispanic woman, New Jersey
“I don’t believe I will get sick, I don’t have insurance, visiting the doctors is a hassle, finding affordable or free healthcare assistance takes more time out of my schedule then I’ve had.” – 27 year-old Black individual (“other” gender selected), Georgia
“It’s inconvenient, and I’m completely broke.” – 24 year-old White woman, Missouri
“I trust my body to heal.” – 50 year-old White man, Montana
Most Parents get Recommended vaccines for children
Adherence to recommended vaccines is higher among children than adults overall. Nine in ten parents say they normally keep their child or children up-to-date with recommended childhood vaccines, such as the MMR vaccine, while one in ten say they have delayed or skipped some of their child’s vaccines.
Large majorities of parents, regardless of partisanship, race and ethnicity and income, say they keep their child up-to-date including nearly all Democratic and Democratic-leaning parents (97%) and about nine in ten Republican or Republican-leaning parents.
The share of parents who report keeping their child updated with vaccines is unchanged since July 2021. While confidence in vaccines, such as the measles, mumps, and rubella, or MMR vaccine, remains high, the debate over COVID-19 vaccines and some government mandates has spilled over into attitudes towards requiring vaccines for public schools. Currently, all states and the District of Columbia require children to be vaccinated against certain diseases, including measles, mumps, and rubella, in order to attend public schools, though exemptions are allowed in certain circumstances.
Most adults (68%)1 say healthy children should be required to be vaccinated against MMR in order to attend public schools because of the potential risk for others when children are not vaccinated, compared to three in ten (31%) who say parents should be able to decide not to vaccinate their children, even if that may create risks for other children and adults. Parents are more likely than adults without children under the age of 18 in their home to say parents should be able to decide whether or not to vaccinate their children (43% compared to 25%). A majority of parents (55%) still say vaccines should be required to attend public school.
Among all adults, a larger share but still a minority of Republicans (40%) say parents should be able to decide, while a large majority of Democrats say healthy children should be required to be vaccinated.
Late-Summer COVID-19 Wave and Who Is Still Taking COVID-19 Tests
Although the COVID-19 wave is difficult to track with the end of federal COVID-19 case tracking, earlier this month the CDC reported on an increase in virus-related hospitalization rates and deaths suggesting a late-summer COVID-19 wave.
Six in ten adults believe there is a new wave of COVID-19 infections hitting the U.S now, while nearly four in ten (37%) say there is not a new COVID-19 wave. Larger shares of Democrats and those who have received at least one COVID-19 vaccine say there is a new wave hitting the U.S., with three in four Democrats (77%) and seven in ten (69%) vaccinated adults saying they think there is a COVID-19 wave. Republicans are more equally divided with similar shares saying there is (48%) and is not (51%) a new COVID-19 wave. Most unvaccinated adults (61%) say there is not a new wave of COVID-19 infections hitting the U.S.
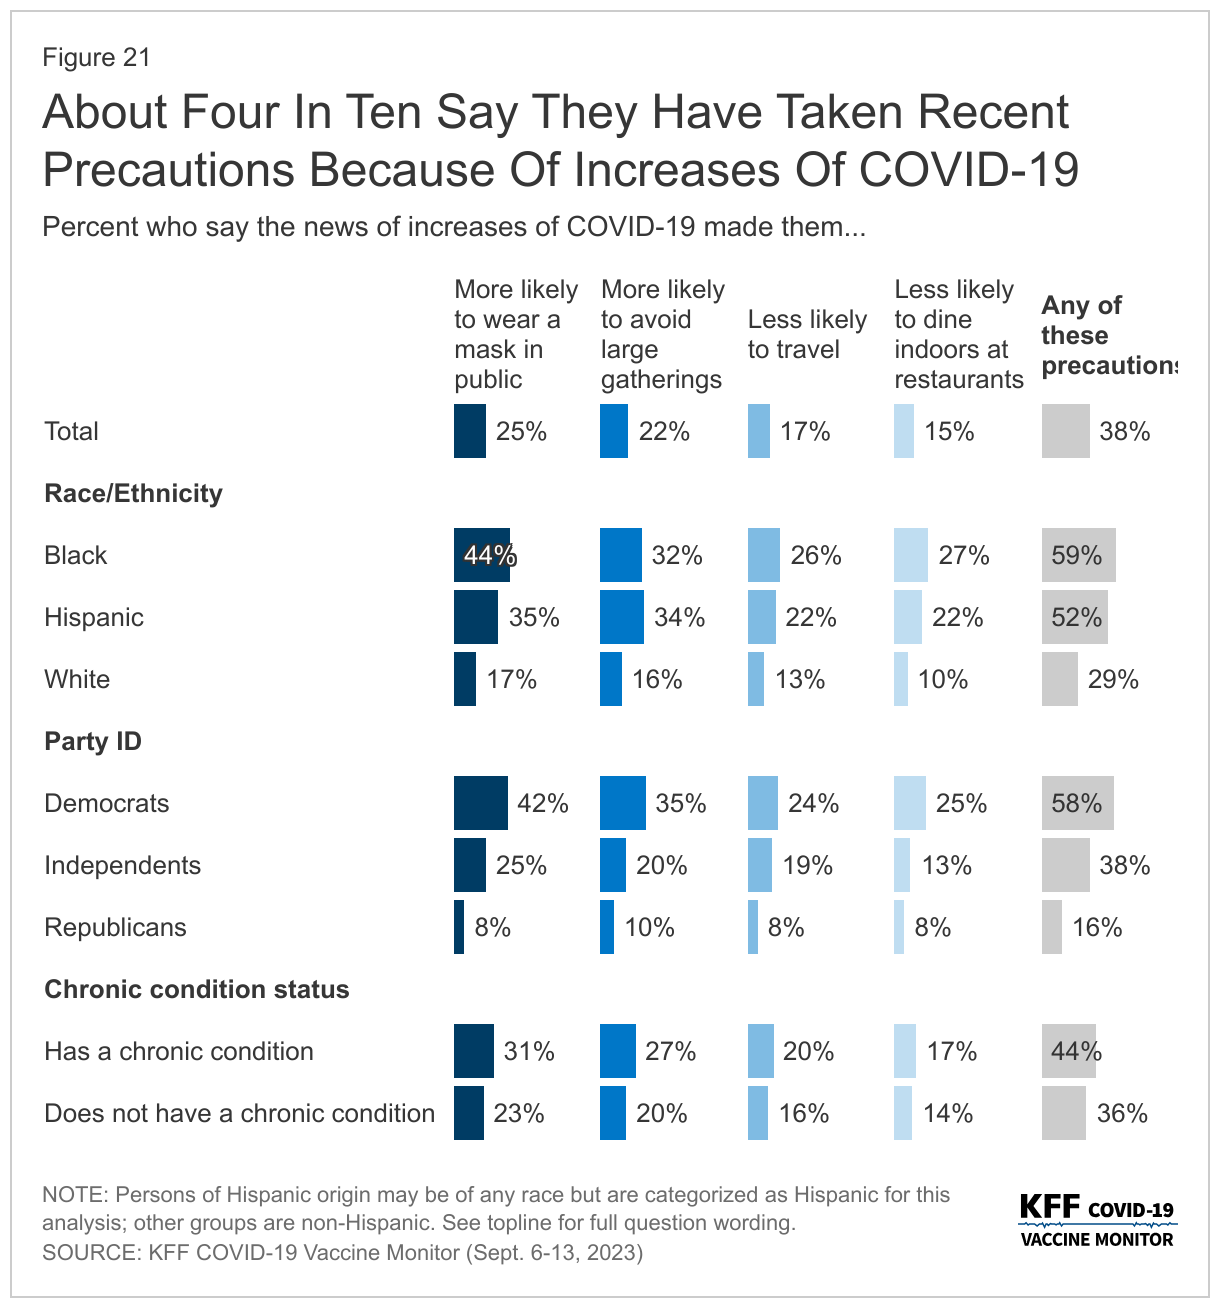
Groups that are more likely to say there is a current wave of COVID-19 cases are also more likely to report changing their behaviors because of the news of increases in COVID-19. Overall, four in ten (38%) adults say they have modified their behavior to be more COVID-conscious due to the news of the increases. This includes a quarter of adults who say they are more likely to wear a mask in public (25%) or avoid large gatherings (22%). Another one in six say the news of increases has made them less likely to travel (17%) or dine indoors at restaurants (15%).
Larger shares of Black adults (59%), Democrats (58%), Hispanic adults (52%), and people with a chronic condition (44%) say they have modified their behavior in at least one of these ways because of news of increases of COVID-19. Comparatively, smaller shares of White adults (29%), Republicans (16%), and people without a chronic condition (36%) report doing the same.
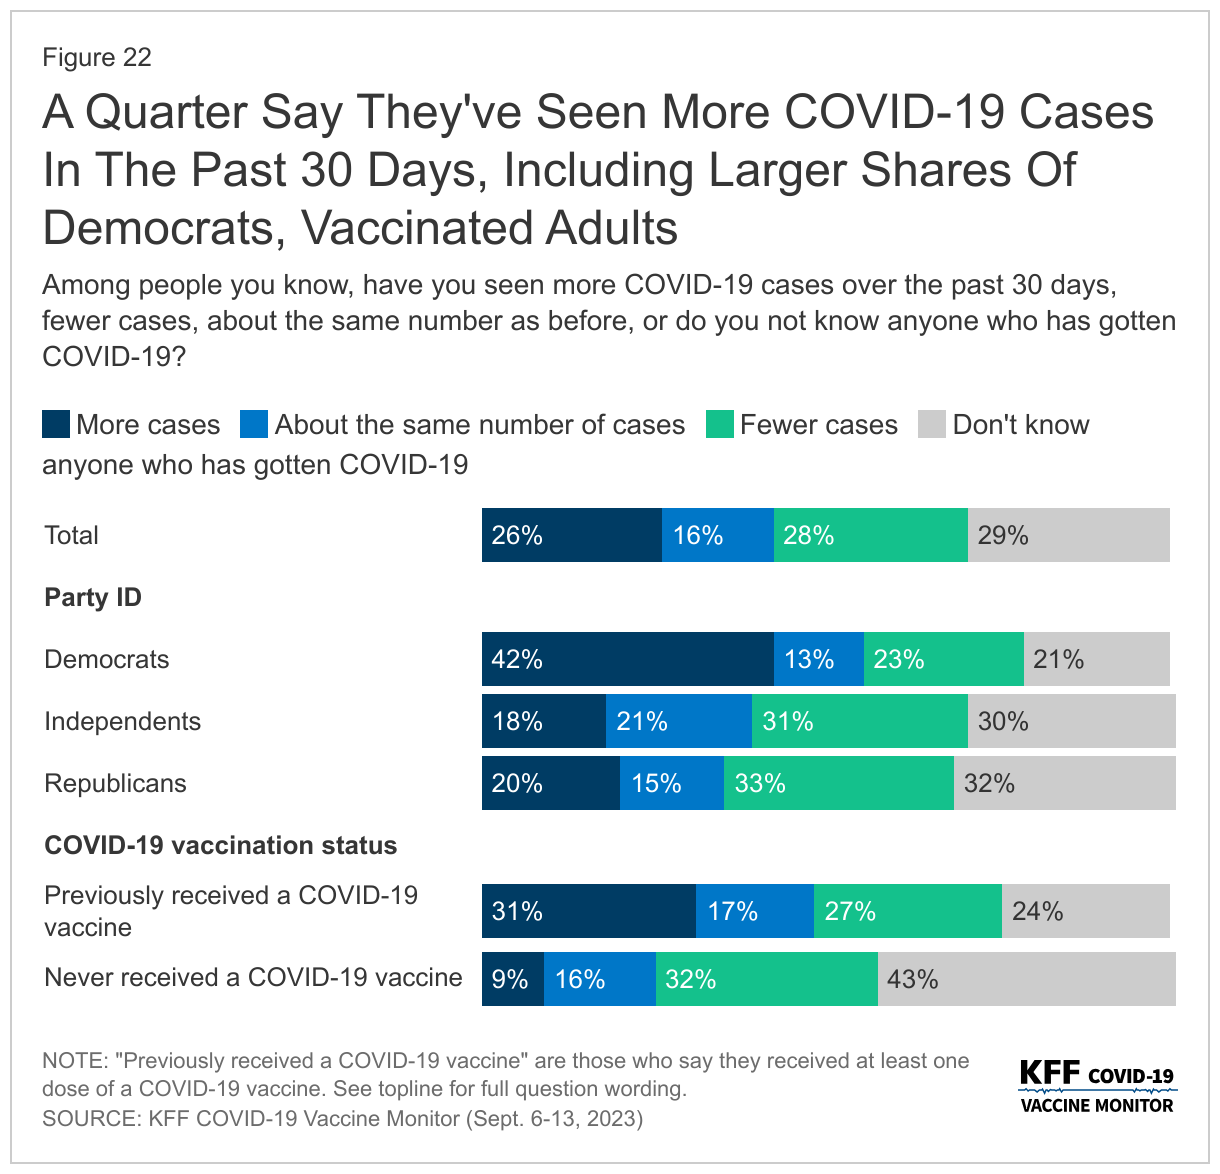
About a quarter (26%) of adults say they have personally seen “more cases” among people they know in the past 30 days. However, a similar share (28%) say they have seen “fewer cases” of COVID-19 in the past 30 days. About one in seven (16%) say they have seen the same number of cases among people they know, while three in ten (29%) say they do not know anyone who has gotten COVID-19.
Democrats (42%) and vaccinated adults (31%) are more likely to say they have seen more COVID-19 cases among people they know in the past 30 days, compared to one in five Republicans and a small share (9%) of those who have never gotten a COVID-19 vaccine.
COVID-19 Testing
Partisanship and vaccine status are also strong drivers in the share of people who say they have taken a COVID-19 test, most likely because they are more likely than their counterparts to identify any possible symptoms of COVID. One in five adults say they have had symptoms in the past three months they thought could be COVID-19, such as a fever, sore throat, runny nose, or a cough. Among those who had such symptoms, over half say they took a test (12% of all adults), and a similar share did not take a test (8% of all adults). Democrats are more than twice as likely as both independents and Republicans to say they felt like they had COVID-19 symptoms and took a test, 19% compared to 8% and 9% respectively.
These partisan and vaccine status differences in perceptions of cases and testing for the virus are consistent with overall views of the pandemic that KFF has been tracking for the past three years. Republicans are more than three times as likely as Democrats to say the news has “generally exaggerated” the seriousness of the coronavirus (71% compared to 18%), while most Democrats say either that the news of the seriousness of COVID-19 has been generally correct (65%) or even “generally underestimated” (18%).
Some Concerns Over Costs Of Diagnostic COVID-19 Tests
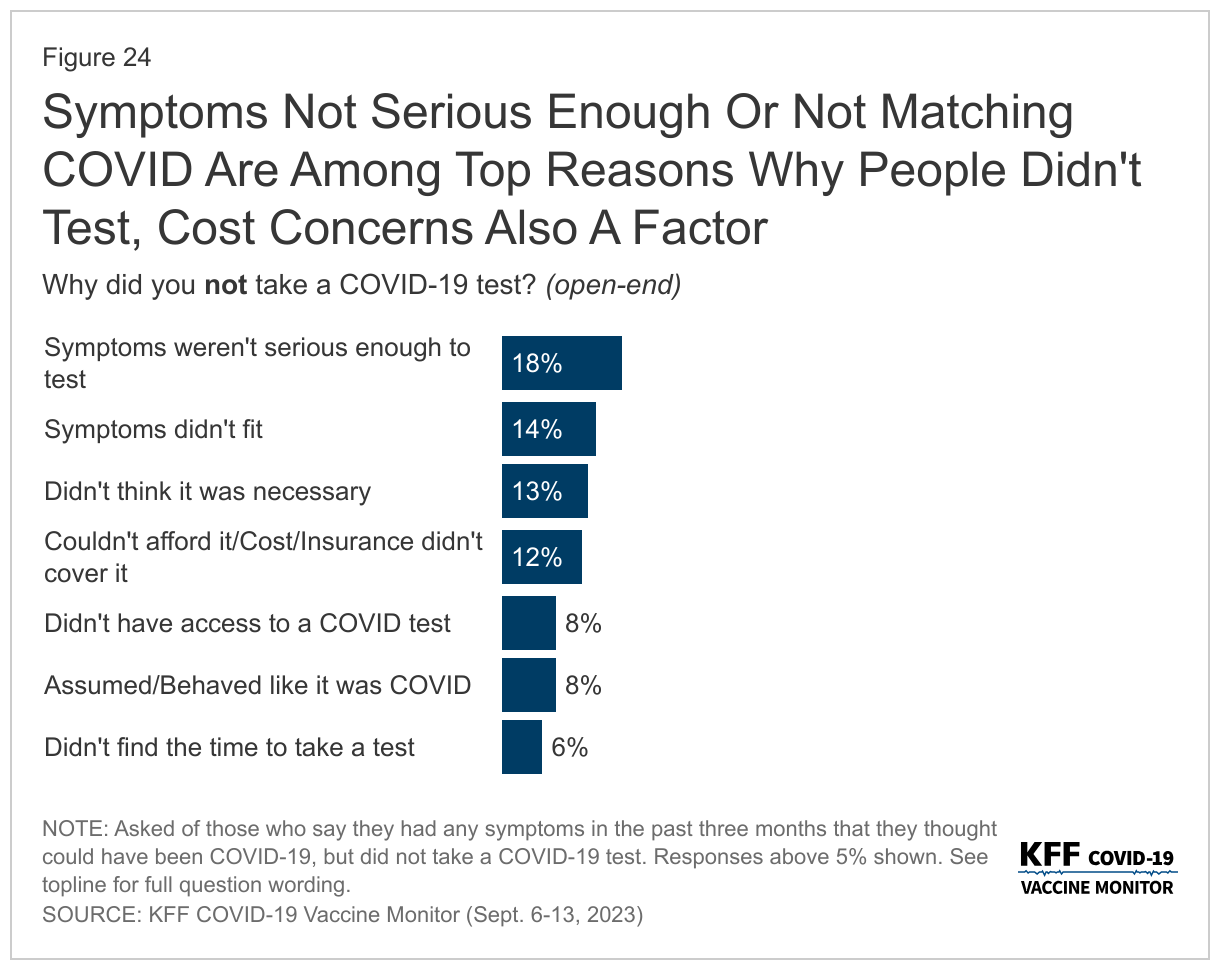
When those who said they were experiencing symptoms and did not take a test were asked why they did not get tested, the most common reasons provided were that they didn’t feel like their symptoms were serious enough to test (18%), they did not think their symptoms fit COVID-19 (14%), they did not think it was necessary for them to test (13%), or they had costs concerns about tests (12%).
These concerns over the costs of COVID-19 tests come more than three months since the end of the public health emergency and national emergency declarations related to the COVID-19 pandemic, which were put in place in early 2020 and provided some free COVID tests for people regardless of health insurance status.
Most insured people now say they are unsure whether their health insurance covers either in-home, rapid COVID-19 tests (55%) or PCR COVID-19 tests that are sent to a lab for results (61%).
While most adults do not report difficulty accessing COVID-19 tests, 15% say there was a time in the past three months when they wanted either an in-home rapid COVID-19 test or a PCR COVID-19 test and they were not able to find or afford one. The shares who report difficulty accessing and affording testing are even higher among Black and Hispanic adults and those with lower incomes. A quarter (25%) of Black adults and two in ten (21%) Hispanic adults say they had difficulty getting a test in the last three months, a larger share than the one in ten (10%) White adults who say the same. Similarly, another two in ten (21%) of those with a household income of less than $40,000 a year had difficulty, compared to smaller shares of those with higher incomes.
Overall, more than one in three adults say they would use a test they already have at home if they wanted to take a COVID-19 test (37%), while one in five say they would purchase one at a pharmacy (22%) or get one at a doctor’s office (19%). One in ten adults (11%) say they are unsure where they could get a COVID-19 test.
Note: The title on Figure 5 was updated on November 29, 2023, to better characterize the data on older adults’ intentions for getting a flu shot.
Methodology
This KFF COVID-19 Vaccine Monitor was designed and analyzed by public opinion researchers at KFF. The survey was conducted September 6-13, 2023, online and by telephone among a nationally representative sample of 1,296 U.S. adults in English (1,210) and in Spanish (86). The sample includes 1,014 adults (n=57 in Spanish) reached through the SSRS Opinion Panel either online or over the phone. The SSRS Opinion Panel is a nationally representative probability-based panel where panel members are recruited randomly in one of two ways: (a) Through invitations mailed to respondents randomly sampled from an Address-Based Sample (ABS) provided by Marketing Systems Groups (MSG) through the U.S. Postal Service’s Computerized Delivery Sequence (CDS); (b) from a dual-frame random digit dial (RDD) sample provided by MSG. For the online panel component, invitations were sent to panel members by email followed by up to three reminder emails. 988 panel members completed the survey online and 26 panel members who do not use the internet were reached by phone.
Another 282 (n=29 in Spanish) interviews were conducted from a random digit dial telephone sample of prepaid cell phone numbers obtained through MSG. Phone numbers used for the prepaid cell phone component were randomly generated from a cell phone sampling frame with disproportionate stratification aimed at reaching Hispanic and non-Hispanic Black respondents. Stratification was based on incidence of the race/ethnicity groups within each frame.
Cases that failed both attention check questions, those with over 30% item non-response, and cases with a length less than one quarter of the mean length by mode were flagged and reviewed. Cases were removed from the data if they failed two or more of these quality checks. Based on this criterion, no cases were removed. Respondents in the phone samples received a $15 incentive via a check received by mail, and web respondents received a $5 electronic gift card incentive (some harder-to-reach groups received a $10 electronic gift card).
The combined cell phone and panel samples were weighted to match the sample’s demographics to the national U.S. adult population using data from the Census Bureau’s 2022 Current Population Survey (CPS). Weighting parameters included sex, age, education, race/ethnicity, region, and education. The sample was weighted to match patterns of civic engagement from the September 2021 Volunteering and Civic Life Supplement data from the CPS. The sample was weighted to match frequency of internet use and political party identification by race/ethnicity based on parameters derived from a KFF Benchmarking survey with ABS and prepaid cell phone samples. The weights take into account differences in the probability of selection for each sample type (prepaid cell phone and panel). This includes adjustment for the sample design and geographic stratification of the cell phone sample, within household probability of selection, and the design of the panel-recruitment procedure.
The margin of sampling error including the design effect for the full sample is plus or minus 4 percentage points. Numbers of respondents and margins of sampling error for key subgroups are shown in the table below. For results based on other subgroups, the margin of sampling error may be higher. Sample sizes and margins of sampling error for other subgroups are available by request. Sampling error is only one of many potential sources of error and there may be other unmeasured error in this or any other public opinion poll. KFF public opinion and survey research is a charter member of the Transparency Initiative of the American Association for Public Opinion Research.
Group
N (unweighted)
M.O.S.E.
Total
1,296
± 4 percentage points
Party identification
Democrats
434
± 6 percentage points
Independents
347
± 7 percentage points
Republicans
321
± 7 percentage points
Endnotes
The share who say parents should be able to decide not to vaccinate their children has stayed steady since the beginning of the pandemic. When the question was asked by Pew Research Center, fewer adults said that parents should be able to decide not to vaccinate their children than now, with 16% who said so, compared to 30% now.
↩︎
Telehealth use surged with the COVID-19 pandemic as patients sought access to services while providers implemented social distancing protocols. An ongoing question is how the growth of telehealth will affect health spending. If payers reimburse services provided through telehealth at a lower rate, there could be cost savings. Alternatively, if telehealth encourages the use of more services, total spending could increase.
This analysis compares payments for physician medical service claims delivered via telehealth and in-person in 2021 using data from the Health Care Cost Institute (HCCI). It finds that private insurers paid similarly for telehealth and in-person physician claims for evaluation and management and mental health therapy services, on average, in 2021 as well as 2020. This is after accounting for variation across regions, providers, and severity level, among privately insured. Among providers who offered both telehealth and in-person care, the majority received similar payments for service provided in-person or through telehealth.
The analysis is available through the Peterson-KFF Health System Tracker, an online information hub that monitors and assesses the performance of the U.S. health system.
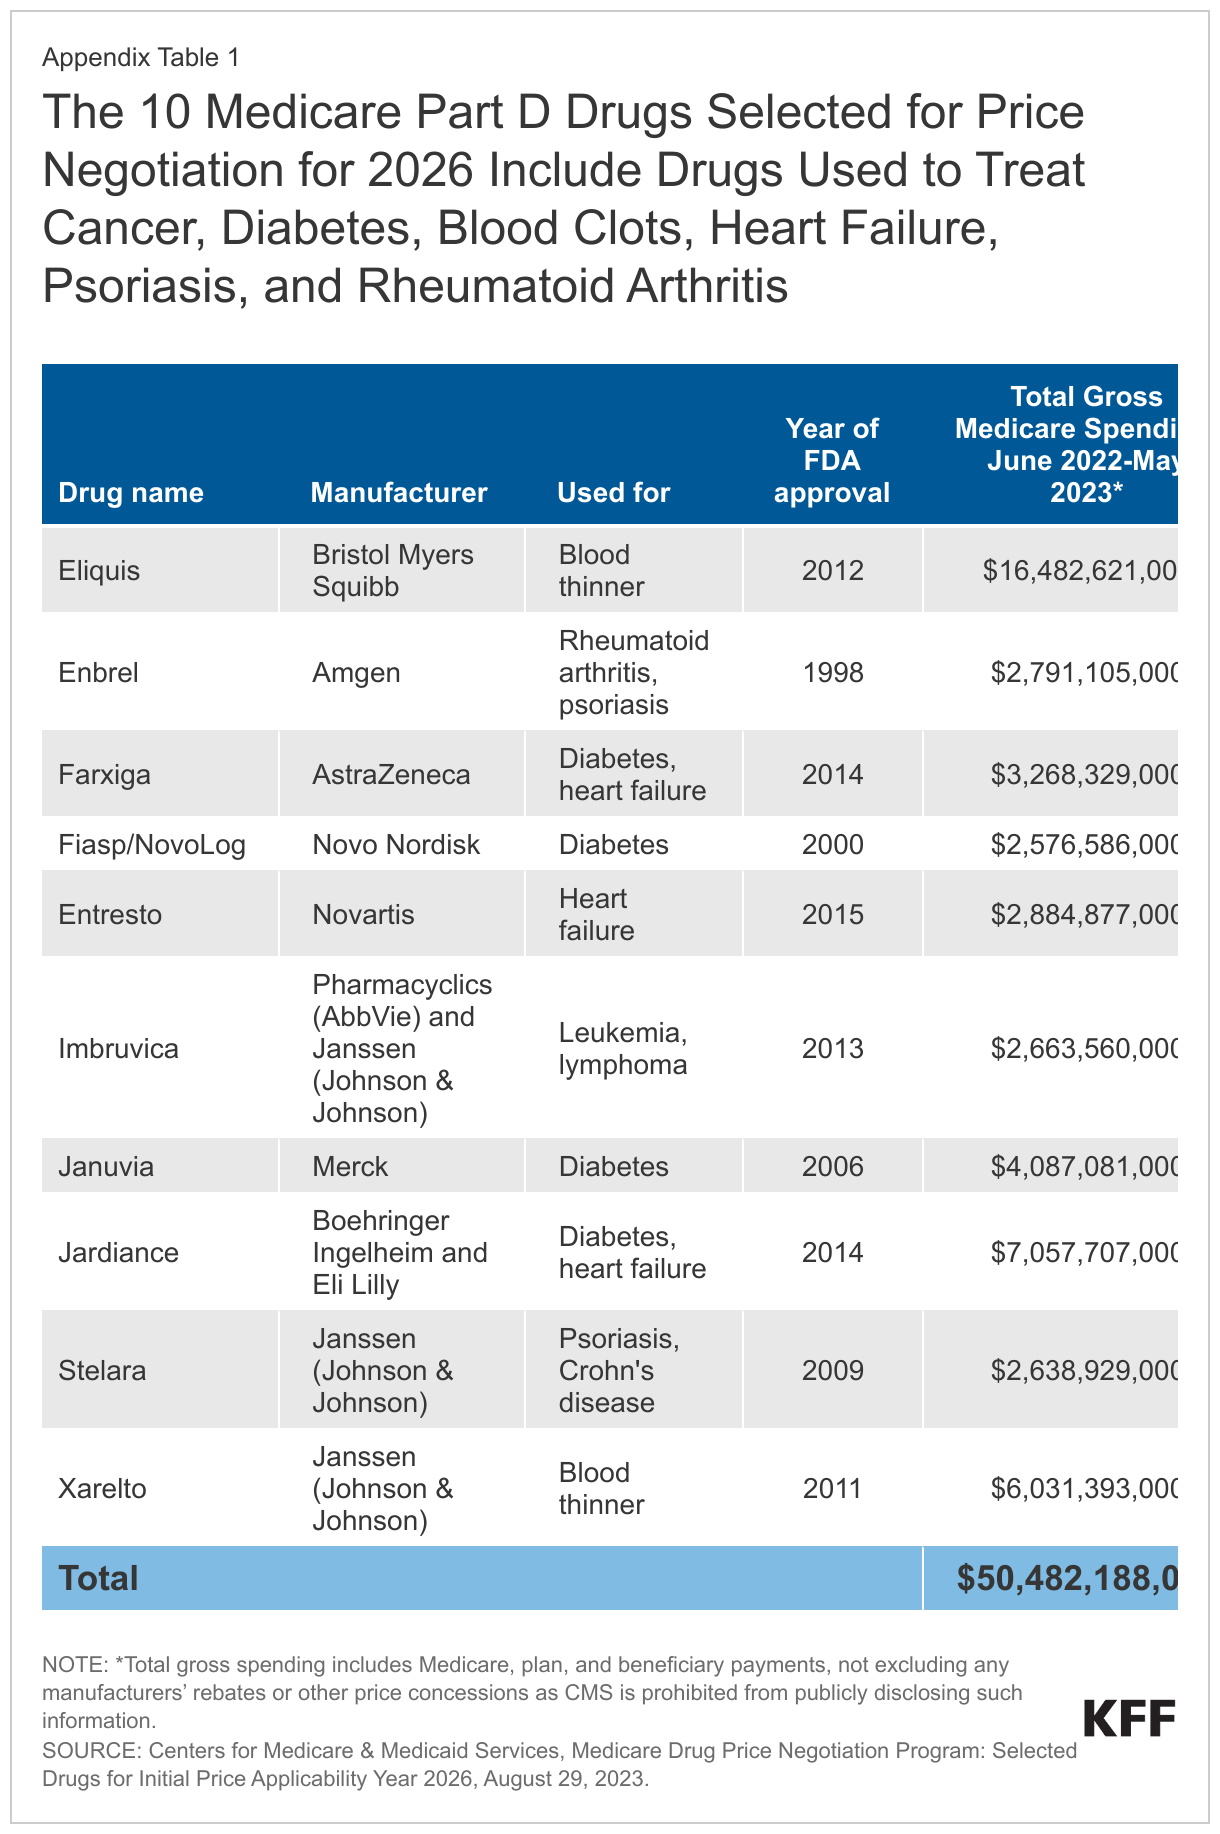
Medicare recently announced the first 10 Part D drugs selected for negotiation under Medicare’s new drug price negotiation program. These drugs were identified as the 10 top spending drugs covered under Medicare Part D without generic or biosimilar equivalents that have been on the market for at least seven years and also meet other selection criteria. The 10 drugs selected for the first round of negotiations include treatments for several medical conditions, including diabetes (Farxiga, Fiasp/NovoLog, Januvia, Jardiance), blood clots (Eliquis, Xarelto), heart failure (Entresto, Farxiga), psoriasis (Stelara, Enbrel), rheumatoid arthritis (Enbrel), Crohn’s disease (Stelara), and blood cancers (Imbruvica) (Appendix Table 1). Between June 2022 and May 2023, 8.3 million Medicare Part D enrollees used one or more of these medications. Negotiated prices for these 10 drugs will be available on January 1, 2026.
Much of the discussion around Medicare’s new drug price negotiation program has been about the details of the negotiation process, whetheror not it will impact future drug development, and the several lawsuits that have been filed by drug manufacturers seeking to block its implementation. But scant attention has been paid to the ways in which the new negotiation program could affect access to and utilization of selected drugs for Medicare Part D enrollees:
The law requires all Medicare Part D plans to cover each of the selected drugs, including all dosages and forms, when negotiated prices take effect in 2026.
The Centers for Medicare & Medicaid Services (CMS) will require Part D plans to justify formulary placement of selected drugs on non-preferred tiers, where cost sharing is typically higher than for preferred tiers.
CMS will scrutinize plans’ use of utilization management tools, such as prior authorization requirements, applied to selected drugs, which could remove administrative barriers to accessing these medications.
Along with improved access, Part D enrollees could see lower out-of-pocket costs due to lower negotiated prices, particularly for drugs with coinsurance requirements, which could increase utilization.
This brief examines how Part D enrollees’ access to and utilization of the first set of 10 selected drugs could be affected by the new Part D coverage and formulary requirements for selected drugs established by the Inflation Reduction Act and in CMS guidance, as well as the potential for lower out-of-pocket costs, based on analysis of current (2023) Part D formulary coverage, tier placement, and utilization management requirements for these 10 drugs.
The Inflation Reduction Act requires Part D plans to cover all selected drugs, including all dosages and forms, when negotiated prices are in effect
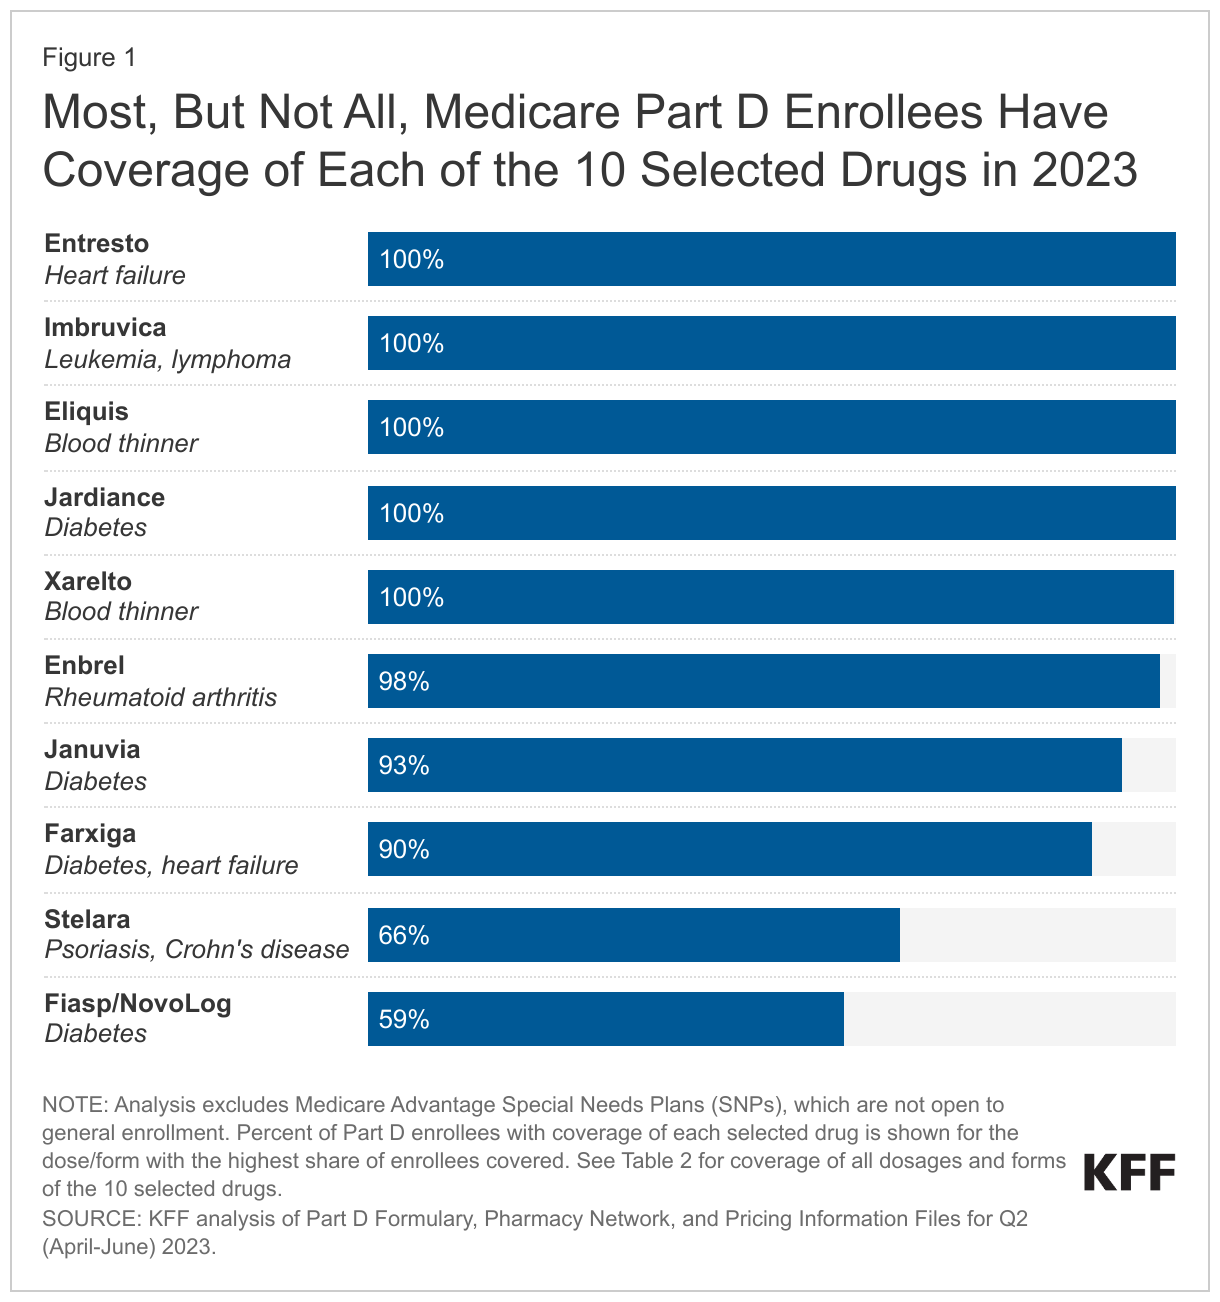
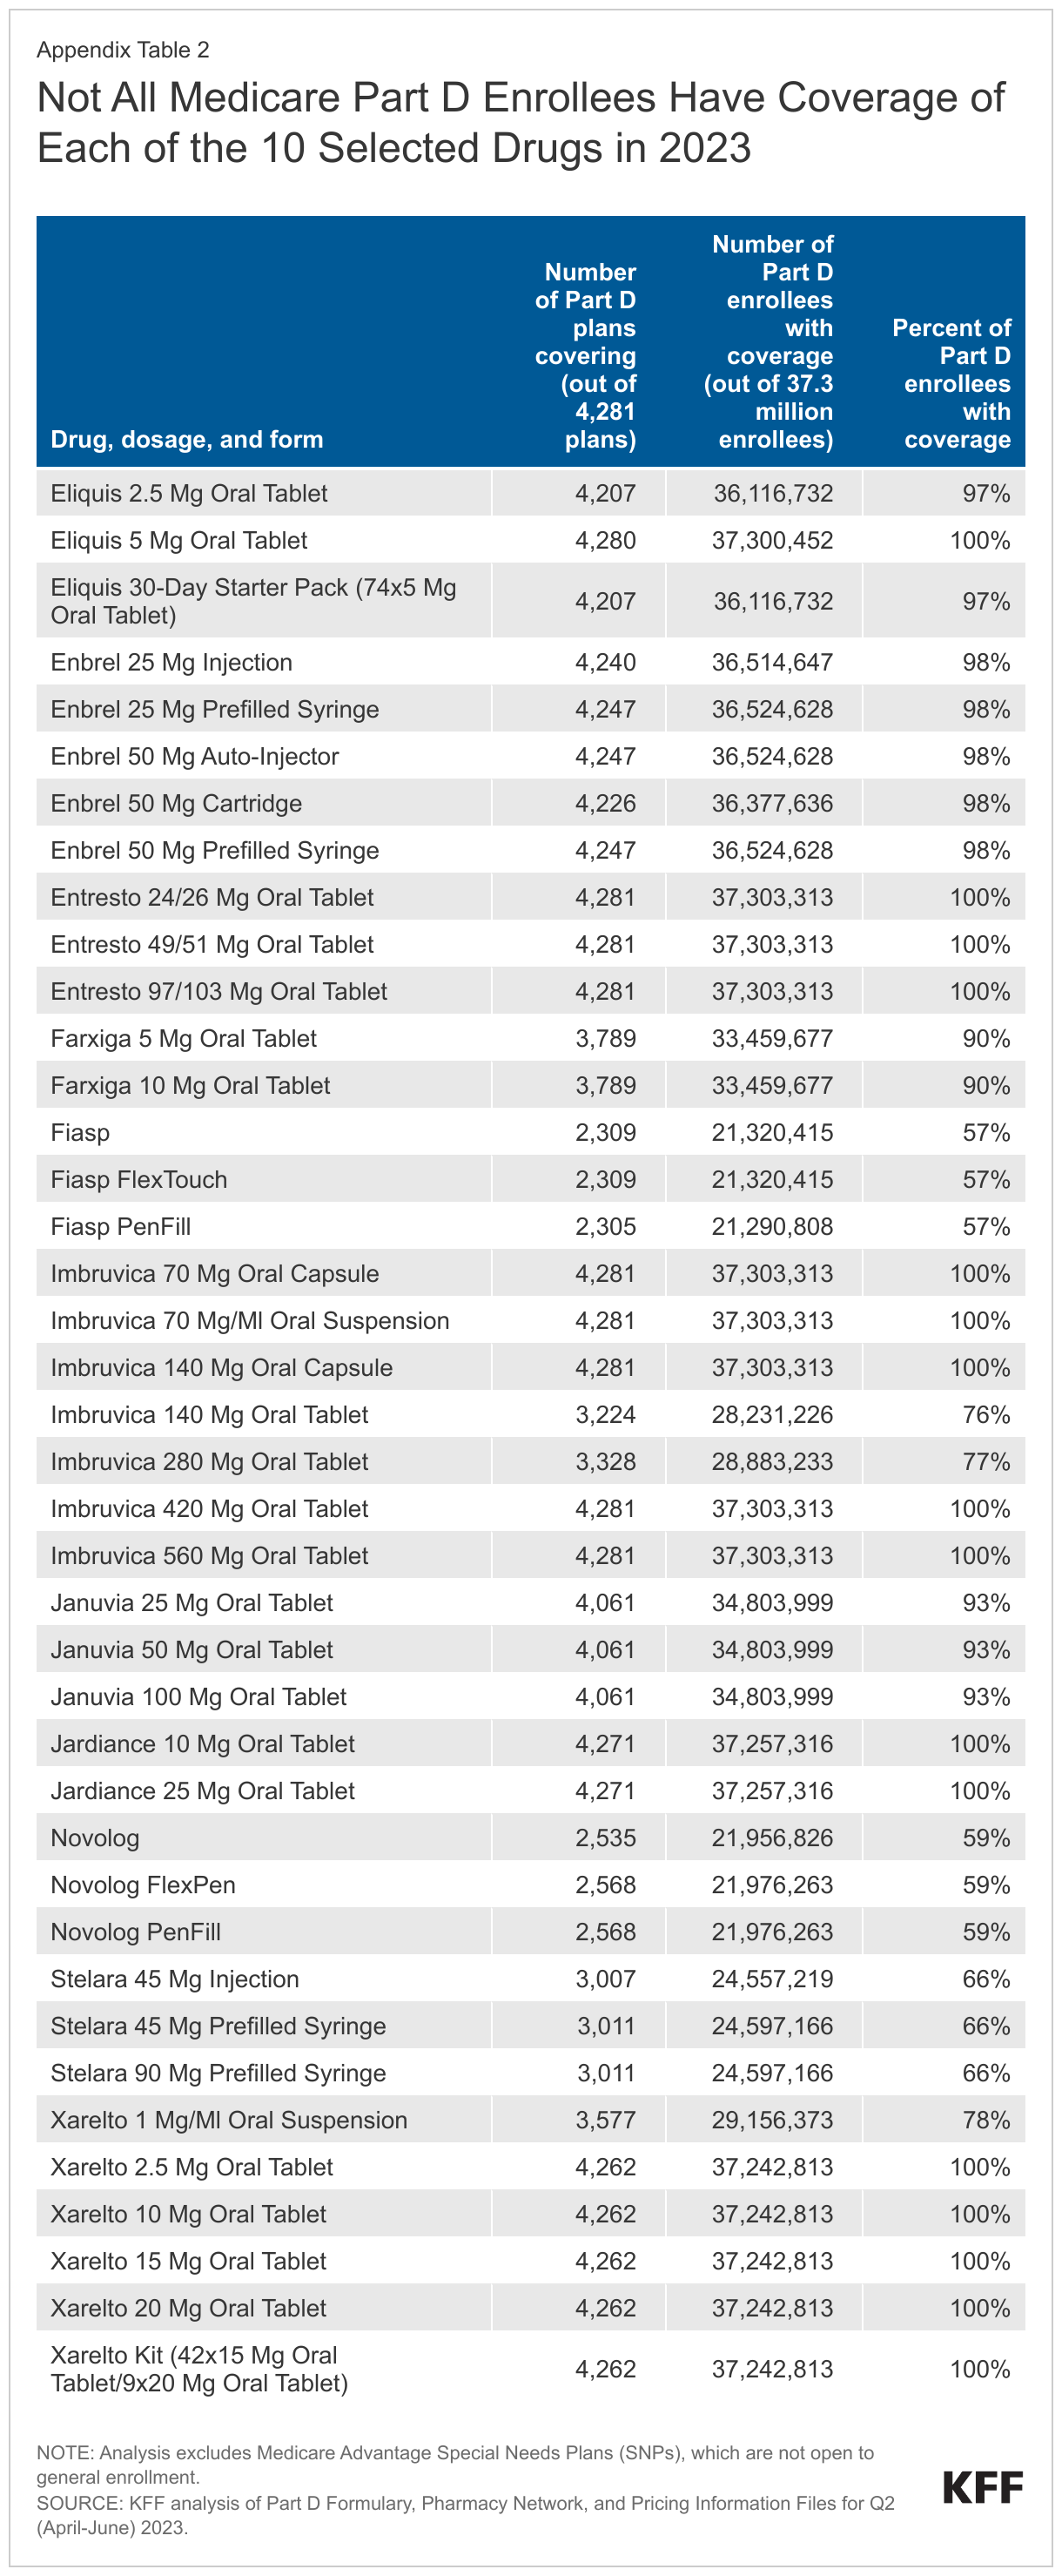
Not all Medicare Part D enrollees have coverage of each of the 10 selected drugs in 2023. The statutory coverage requirement will have the effect of improving access to the selected drugs that are not currently universally covered, in particular the insulin product Fiasp/NovoLog and the psoriasis drug Stelara. The share of Part D enrollees with coverage of any form of these 10 drugs ranges from less than 60% for Fiasp/NovoLog and 66% for Stelara to 100% for Eliquis, Entresto, Imbruvica, Jardiance, and Xarelto (Figure 1). (Imbruvica is an antineoplastic, a type of medication used to treat cancer, which is one of six so-called protected classes where all or substantially all drugs are required to be covered by all Part D plans.)
For Part D enrollees with coverage of the selected drugs in 2023, plans generally cover all or nearly all dosages and forms, but there is a small amount of variation in coverage for seven of the 10 selected drugs. For example, the blood thinner Xarelto is covered in tablet form for virtually all Part D enrollees, but the share of enrollees with coverage of the oral suspension falls to 78%. For the cancer drug Imbruvica, all enrollees have coverage of the 140mg oral capsule but that share drops to 77% for the 280mg oral tablet (Appendix Table 2).
CMS will require Part D plans to justify formulary placement of selected drugs on non-preferred tiers
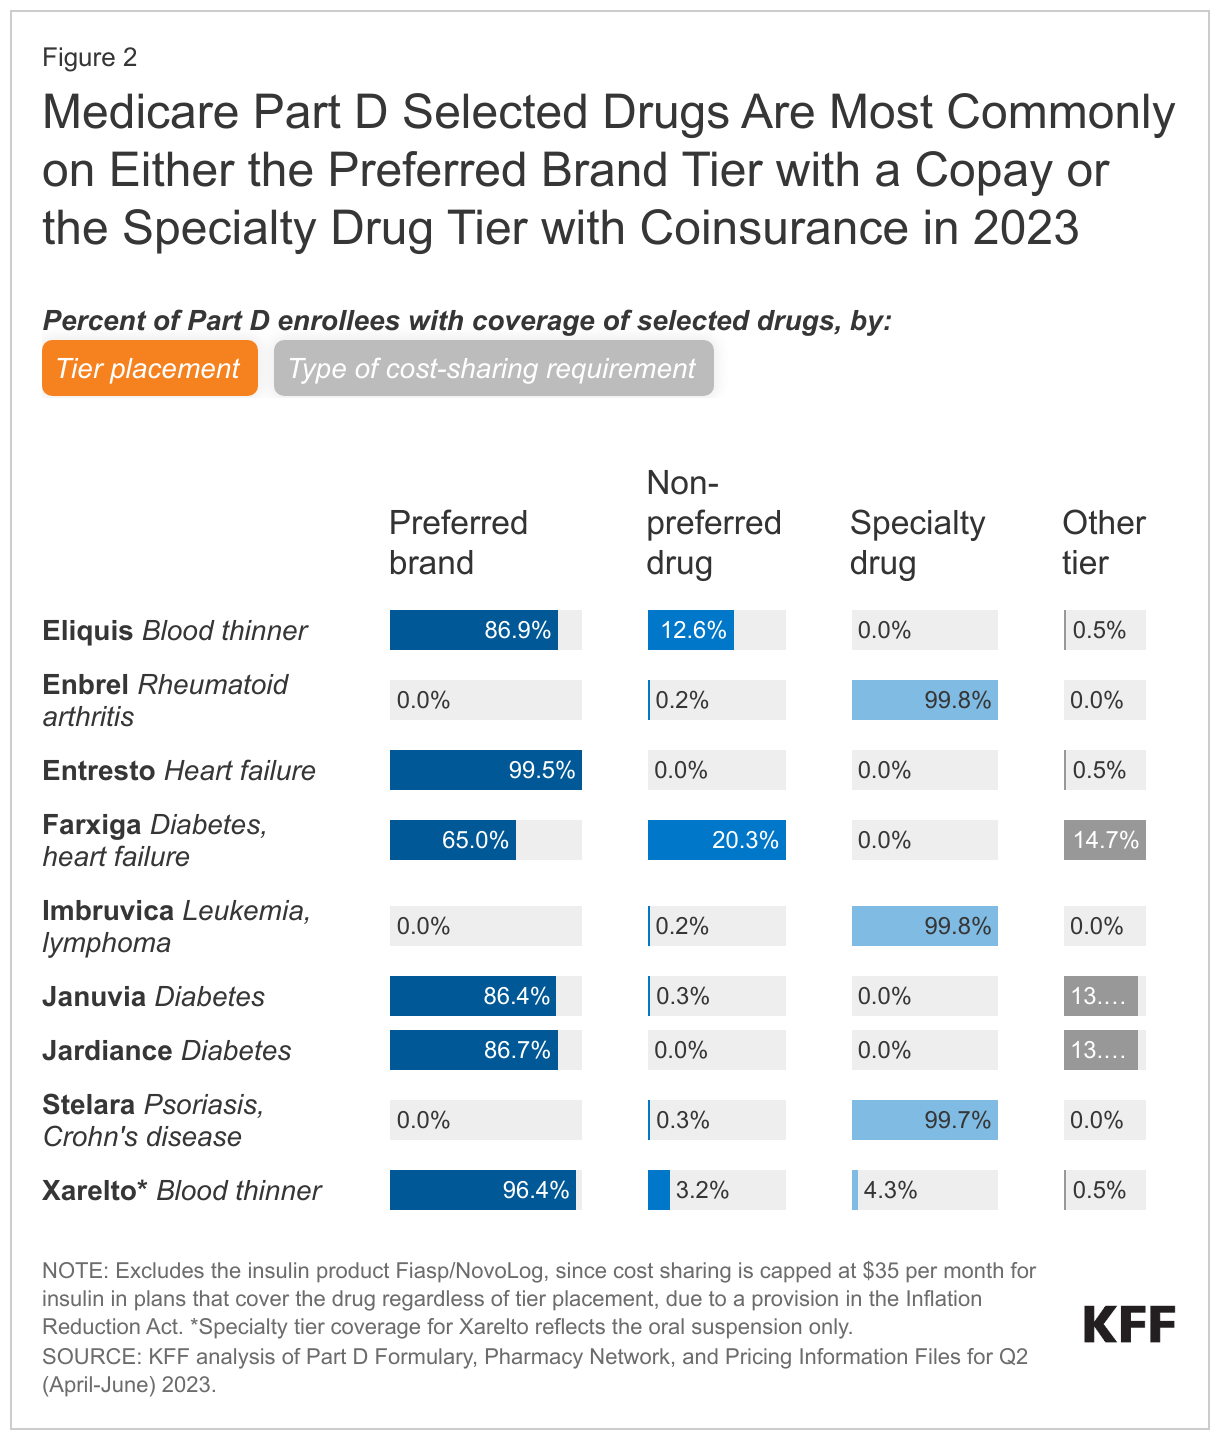
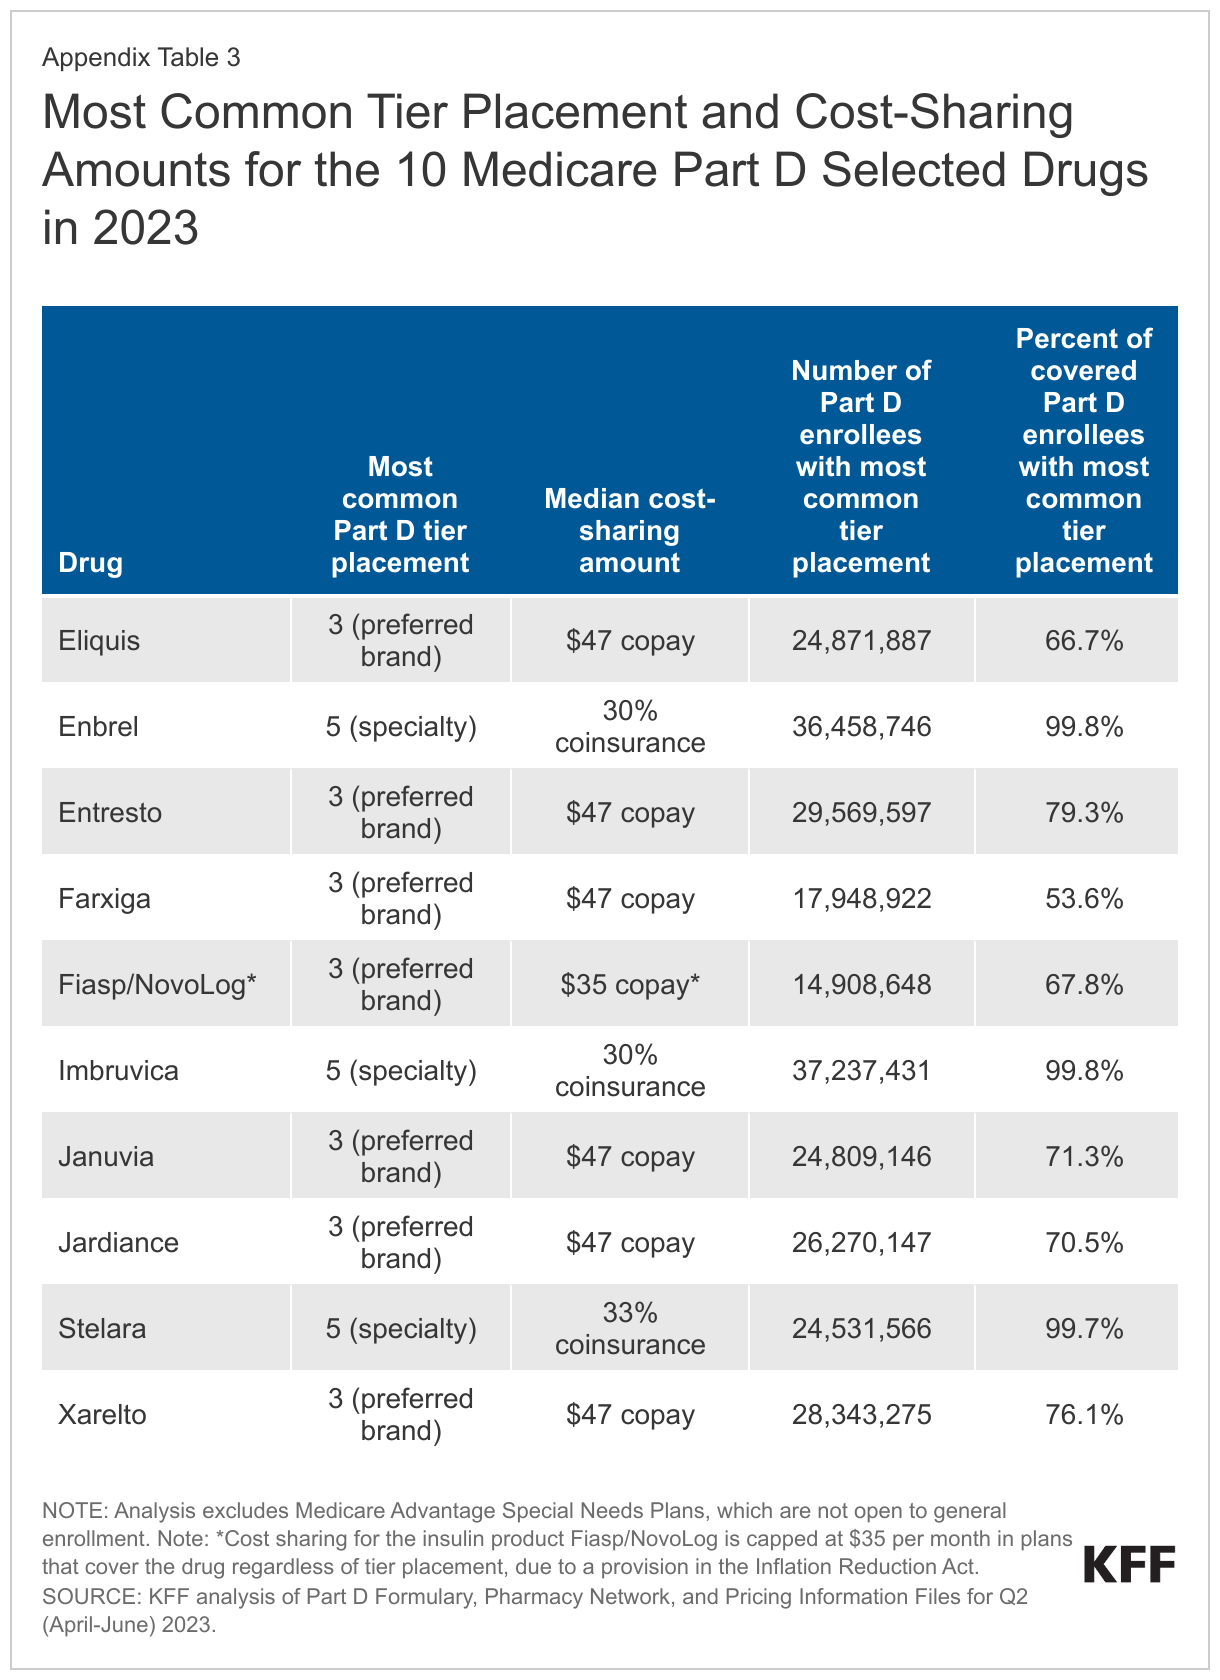
As of 2023, placement of the 10 selected drugs on non-preferred tiers is not common (although whether CMS will consider the specialty tier a non-preferred tier for this purpose is unknown); if coverage of selected drugs shifts to preferred tiers, that could lower Part D enrollees’ out-of-pocket costs. In 2023, three of the 10 selected drugs – the rheumatoid arthritis drug Enbrel, the cancer drug Imbruvica, and the psoriasis drug Stelara – are placed on the specialty tier in virtually all Part D plans that cover these drugs, with median coinsurance of 30-33% in the initial coverage phase (Figure 2, Appendix Table 3). This coinsurance rate is applied to the price of each drug to determine an enrollee’s monthly out-of-pocket cost. Currently, list prices, which do not take into account manufacturer rebates or other price concessions, are generally used in determining patient out-of-pocket costs for drugs with coinsurance. This means that a lower negotiated price would result in lower out-of-pocket costs for selected drugs with coinsurance requirements. In turn, lower out-of-pocket costs could lead to higher utilization of selected drugs.
Six of the 10 selected drugs (Entresto, Eliquis, Farxiga, Januvia, Jardiance, and Xarelto) are more commonly placed on a preferred brand tier in 2023, with a median copayment of $47 per month – an out-of-pocket amount that is fixed rather than being a percentage of the drug’s list price (Figure 2, Appendix Table 3).
But some Part D enrollees with coverage of these six drugs in 2023 have coverage on a non-preferred tier, where cost sharing is higher than for drugs on preferred tiers, and enrollees may face coinsurance of up to 50% rather than fixed copayments. For example, roughly 13% of Part D enrollees whose plans cover the blood thinner Eliquis have coverage on a non-preferred tier and face coinsurance of 50% (9.5% of enrollees) or a monthly copayment of $100 (3% of enrollees). If coverage of these drugs shifts to preferred tiers, that could lower Part D enrollees’ out-of-pocket costs.
For the insulin product Fiasp/NovoLog, the most common tier placement in 2023 is on a preferred brand tier, but regardless of tier placement, monthly cost sharing is capped at $35 in plans that cover this product. This is due to a provision of the Inflation Reduction Act, where, starting in 2023, Part D plans are not allowed to charge a copayment of more than $35 per month for covered insulin products.
CMS expects Part D plans to provide justification if more restrictive utilization management is applied to selected drugs relative to non-selected drugs in the same class
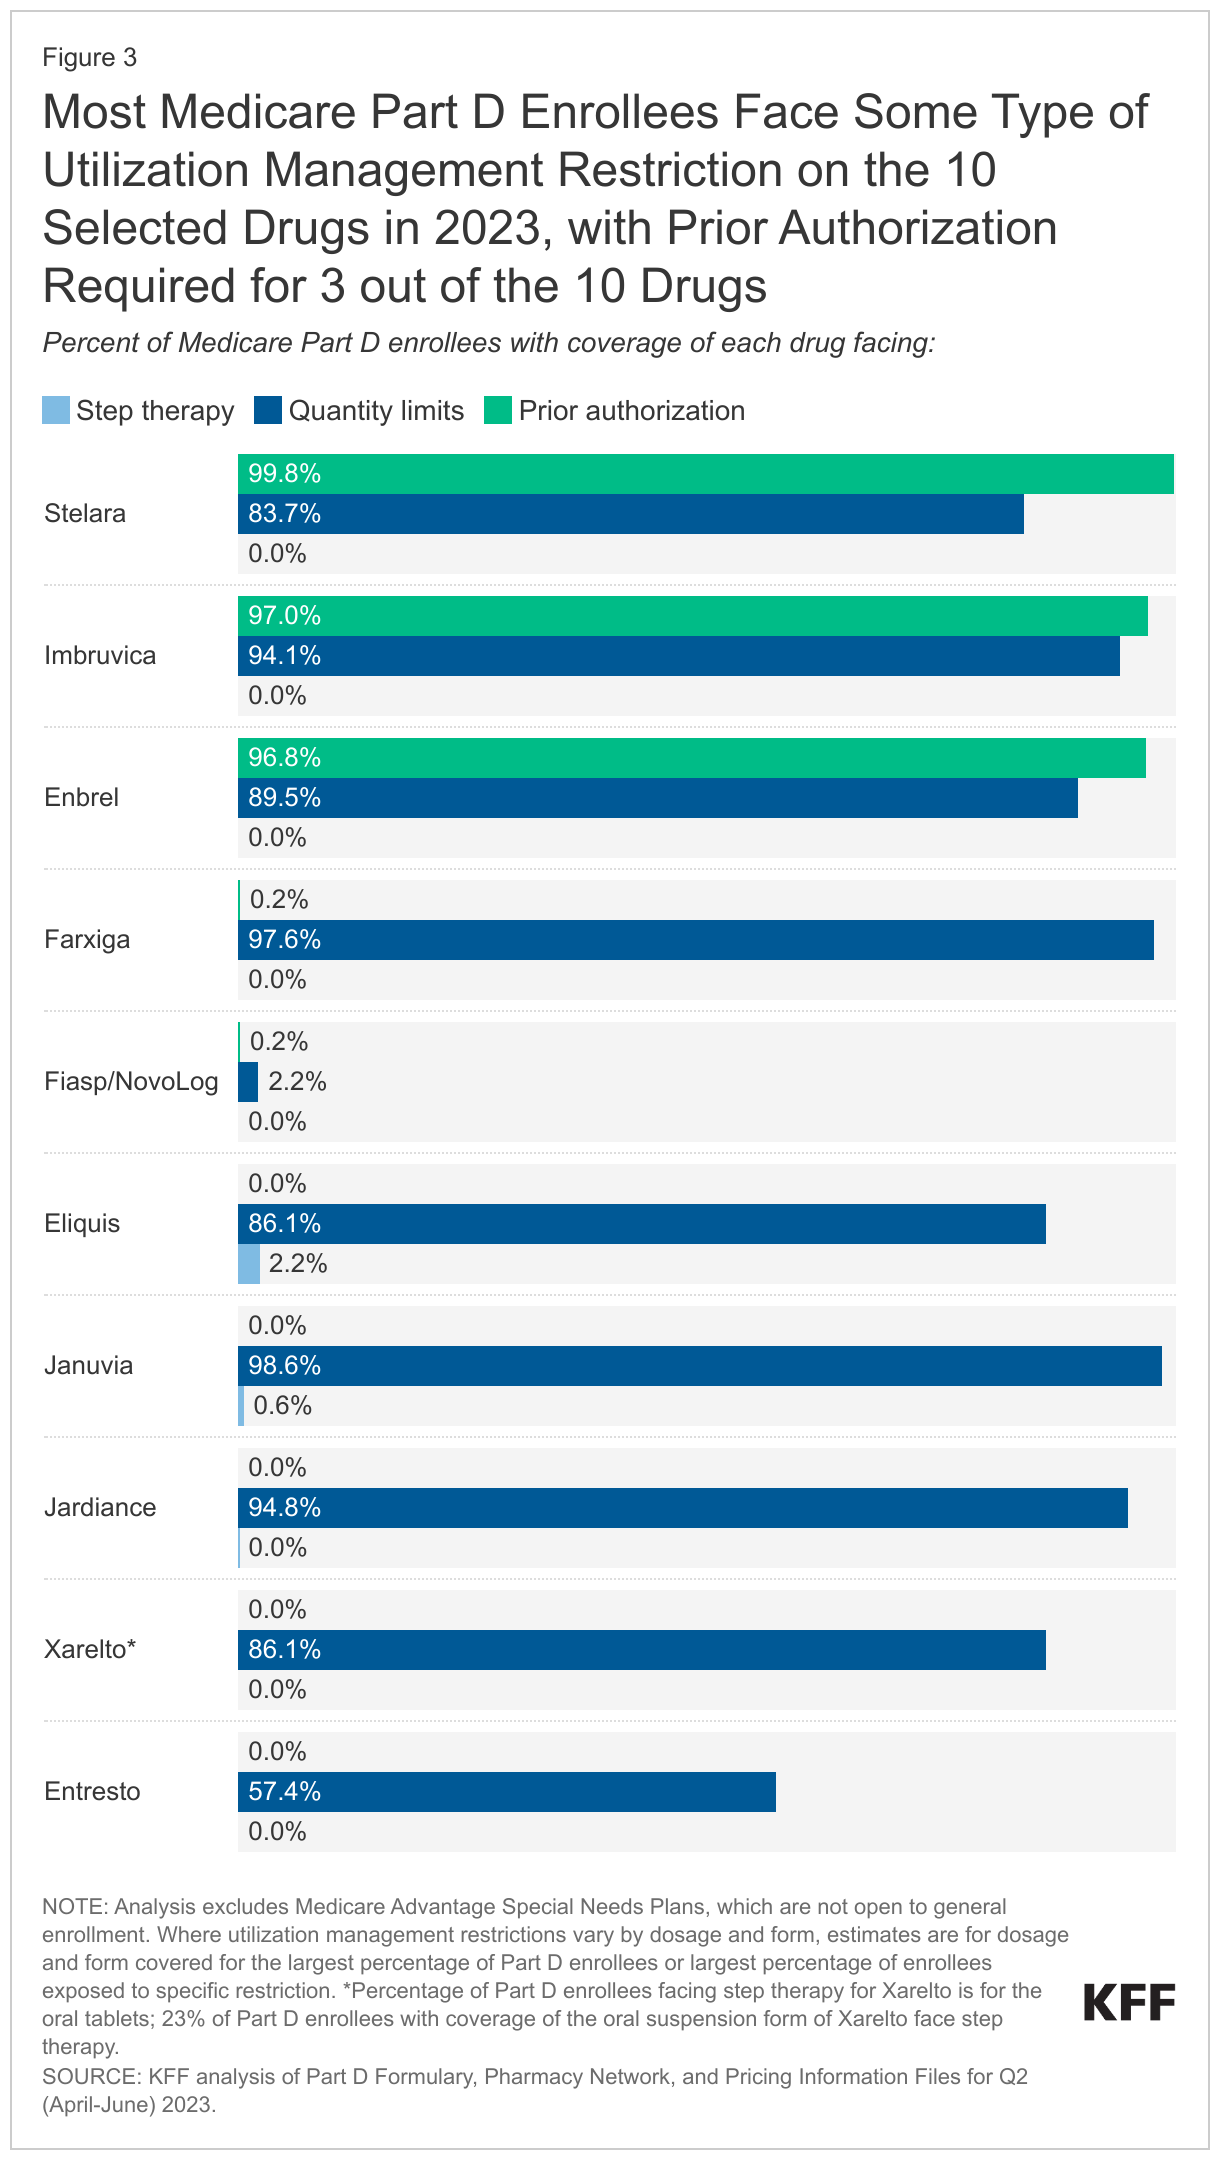
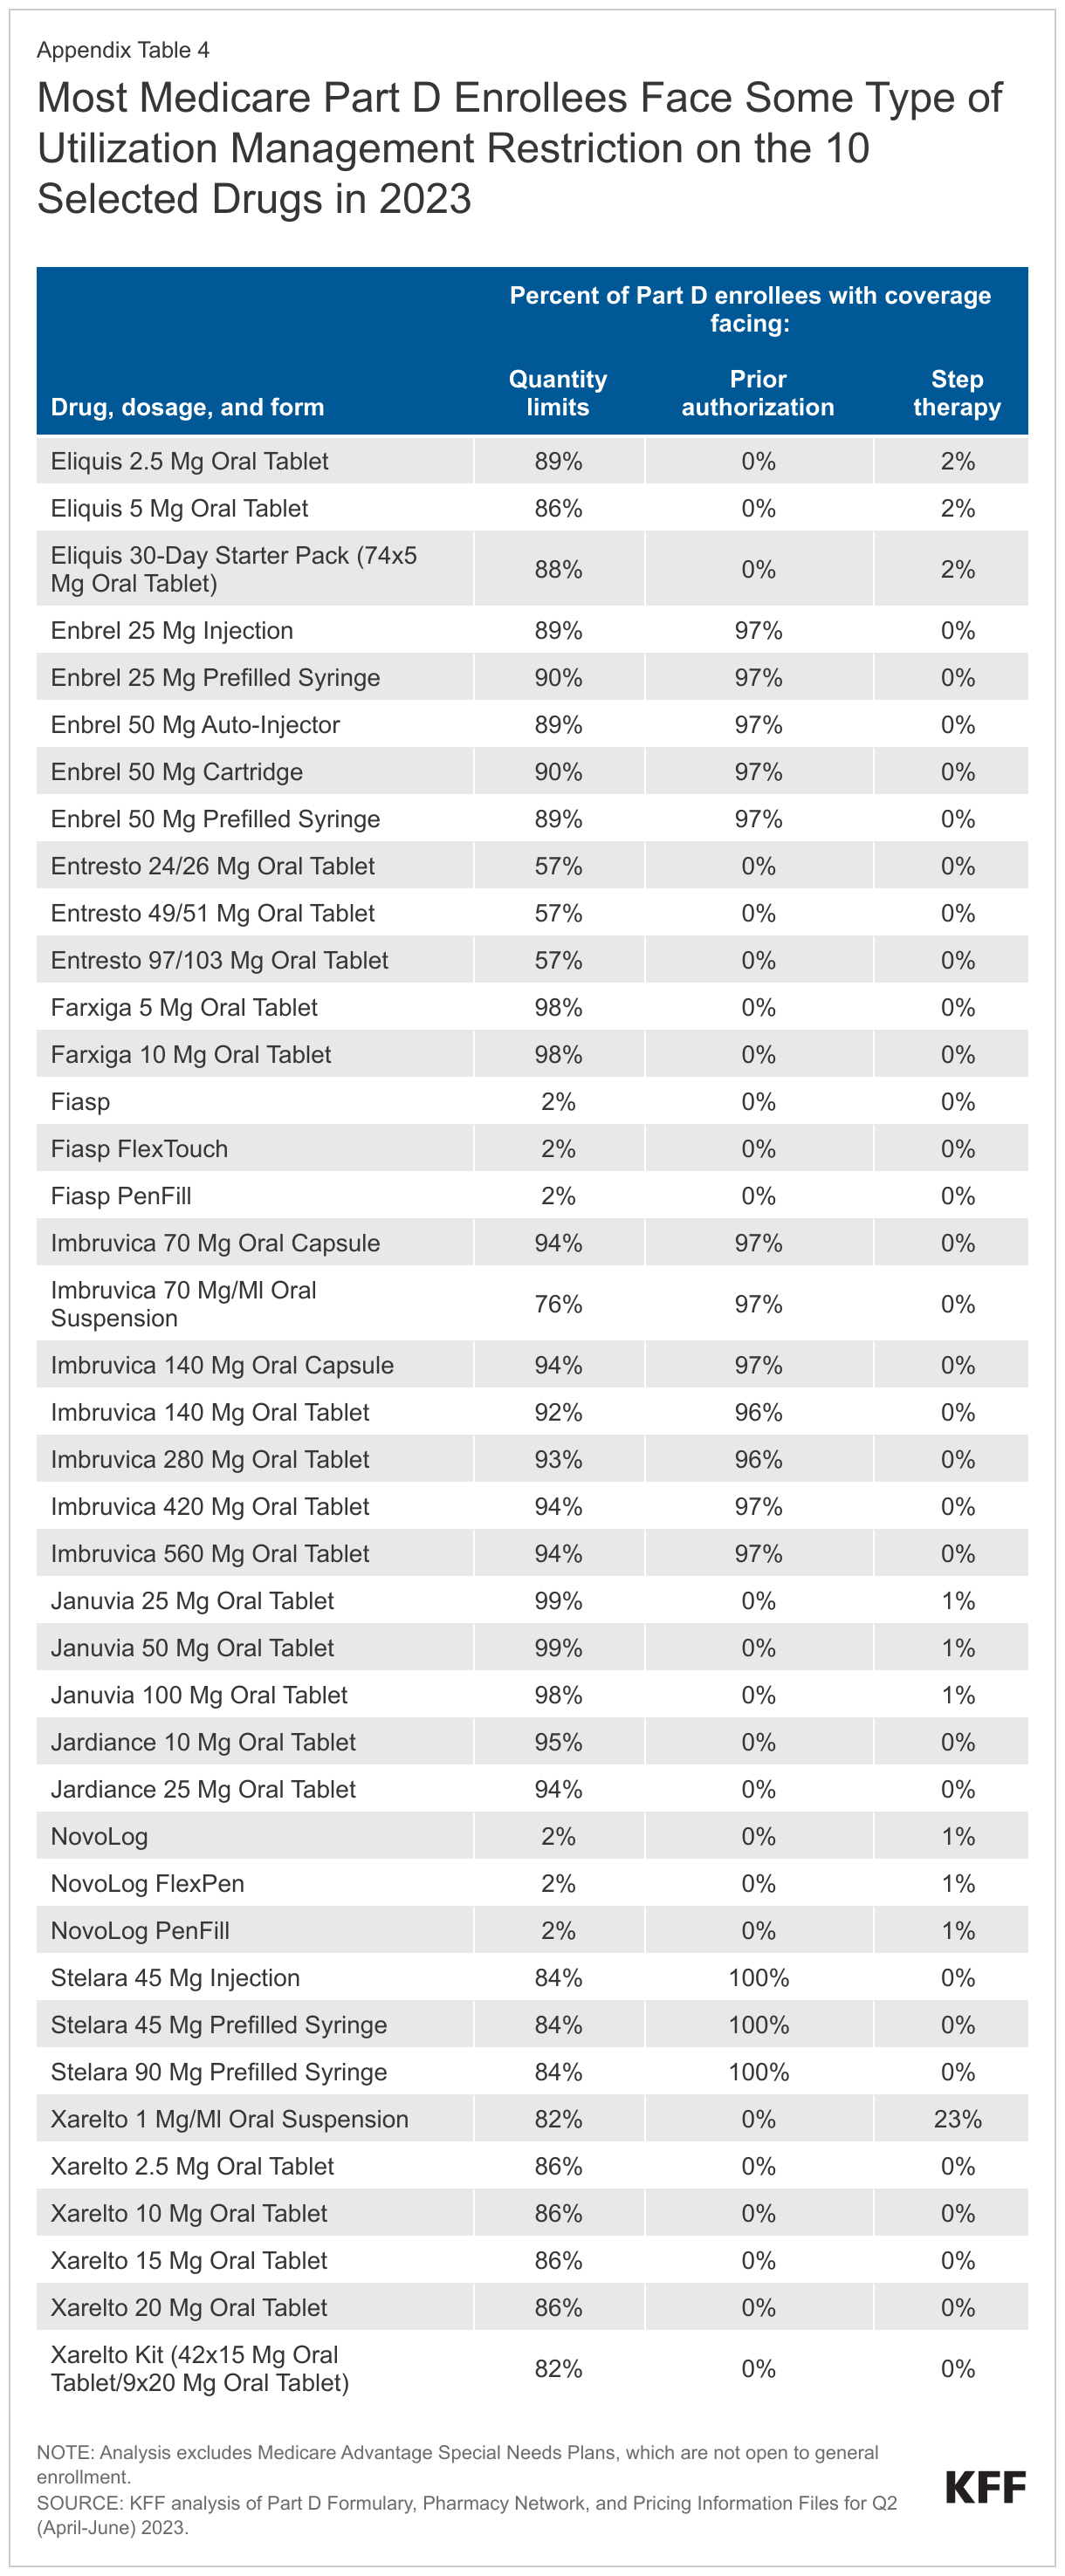
Most Part D enrollees face some type of utilization management restriction on the 10 selected drugs in 2023. Prior authorization requirements are applied to virtually all Part D enrollees who have coverage of Enbrel, Imbruvica, and Stelara in 2023, meaning that nearly all enrollees would need to get prior authorization from their plan prior to initiating treatment with any of these three drugs (Figure 3, Appendix Table 4). The most common utilization management restriction applied to the 10 selected drugs is quantity limits, ranging from around 2% of Part D enrollees who have coverage for the insulin product Fiasp/NovoLog to nearly all enrollees with coverage of Januvia and Jardiance. Step therapy requirements are rarely applied to these 10 drugs.
This analysis did not examine utilization management restrictions applied to other drugs in the same classes as selected drugs to assess whether utilization management applied to selected drugs in 2023 is comparatively more restrictive. But if CMS’s justification requirement leads to less frequent application of utilization management tools on selected drugs by Part D plans, utilization could increase.
Conclusion
While Medicare’s new drug price negotiation program is projected to lower Medicare spending on drugs selected for negotiation, less attention has been given to its potential to expand access to and utilization of selected drugs for Part D enrollees. In part, this could result from a requirement in the Inflation Reduction Act that all Part D plans cover all selected drugs once negotiated prices take effect. This requirement will have the effect of expanding coverage for the selected drugs that are not currently universally covered by all plans, in particular Fiasp/NovoLog and Stelara. This requirement could have a larger impact in future years, depending on formulary coverage of drugs selected for price negotiation in the future. CMS has also stated that it intends to use the annual formulary review process to ensure that all Part D plans cover all dosages and forms of selected drugs during the year that the negotiated prices apply. This level of coverage currently is not standard.
CMS has stated that it will also require plans to justify formulary placement of selected drugs on non-preferred tiers, where cost sharing is typically higher than when drugs are on preferred tiers. As of 2023, placement of the 10 selected drugs on non-preferred tiers is not common, but some Part D enrollees have coverage on a non-preferred tier and face higher cost-sharing requirements than for drugs on preferred tiers. If coverage of selected drugs shifts to preferred tiers, that could lower Part D enrollees’ out-of-pocket costs. And for drugs with coinsurance requirements, a lower negotiated price would result in lower out-of-pocket costs. In turn, lower out-of-pocket costs could lead to higher use of selected drugs.
Finally, CMS has stated that it expects plans to provide a justification if more restrictive utilization management is applied to selected drugs relative to non-selected drugs in the same class, or if utilization management restrictions that are not based on medical appropriateness are applied to selected drugs. If CMS’s justification requirement leads to less frequent application of utilization management tools on selected drugs by Part D plans, utilization could increase.
It should be noted that if manufacturers of selected drugs do not want to participate in price negotiations, they are required to withdraw their drugs from coverage under Medicare and Medicaid or face an excise tax on sales of the selected drug to Medicare beneficiaries. Withdrawal of products from coverage under the Medicare and Medicaid program would affect access to these medications, but would also mean that manufacturers would forfeit the revenue from sales of all of their products in these programs.
Taken altogether, the formulary and coverage requirements for selected drug in the Inflation Reduction Act and CMS guidance are likely to increase access to selected drugs for Medicare Part D enrollees and could also lower Part D enrollees’ out-of-pocket costs, which could increase utilization of these drugs and revenues for their manufacturers.
Juliette Cubanski and Tricia Neuman are with KFF. Anthony Damico is an independent consultant.
Methods
This analysis is based on KFF analysis of the Part D Formulary, Pharmacy Network, and Pricing Information Files for Q2 (April-June) 2023. Part D formulary files were used for analysis of formulary coverage, tier placement, cost-sharing amounts, and utilization management restrictions. The formulary analysis includes 4,281 Part D plans, both stand-alone prescription drug plans and Medicare Advantage drug plans, covering 37.3 million enrollees. Analysis excludes Medicare Advantage Special Needs Plans (SNPs), which are not open to general enrollment (1,144 plans covering 5.7 million enrollees).
Formulary tiers with tier number 3 were categorized as preferred brands, tier number 4 as non-preferred drugs, and tier number 5 as specialty drugs; all other tier numbers were categorized as other tier. Cost sharing is based on standard (i.e., non-preferred) 30-day cost-sharing requirements and is enrollment weighted.
Jennifer Kates, senior vice president and director of the Global Health and HIV Policy Program at KFFCynthia Cox, vice president and director of the Program on the ACA at KFF
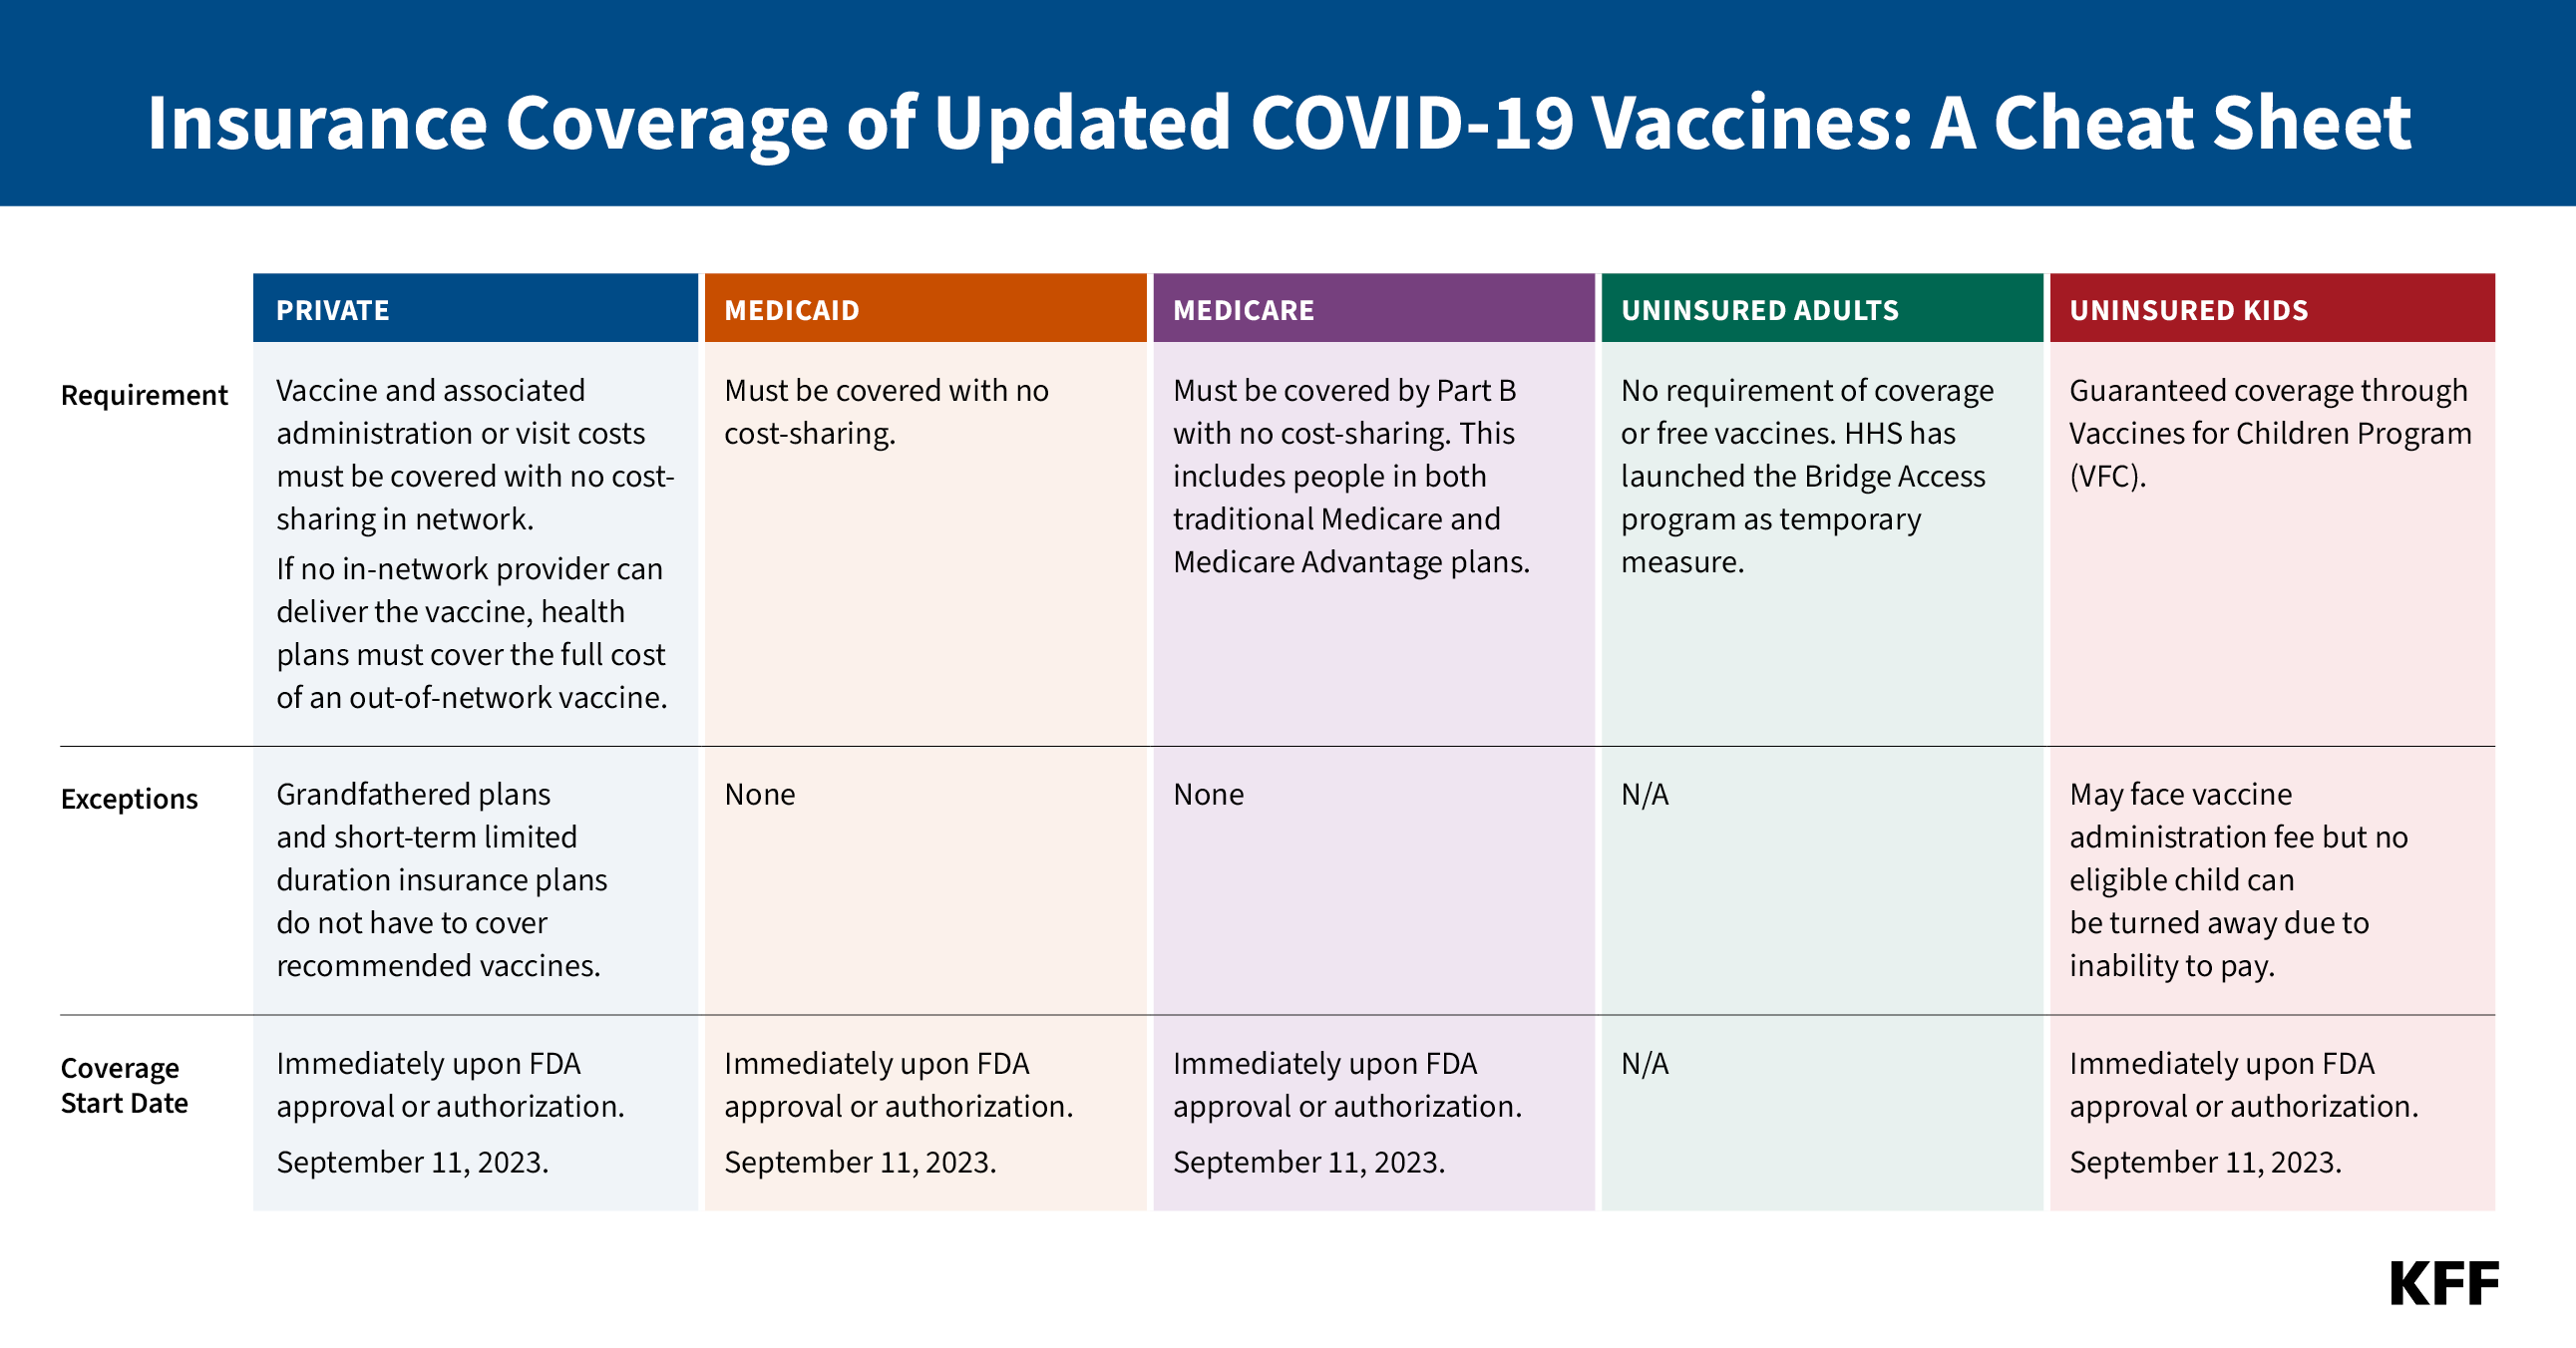
On September 11, 2023, the FDA approved and authorized updated COVID-19 vaccines from Pfizer and Moderna. The Centers for Disease Control and Prevention’s Advisory Committee on Immunization Practices (ACIP) recommended them for everyone from the ages of 6 months and older on September 12 and the CDC Director adopted this recommendation on the same day. This marks the first time that COVID-19 vaccines will be commercialized – that is, transitioned to the commercial market for their manufacturing, procurement and pricing. Up until this point, the federal government had purchased all COVID-19 vaccines and provided them free of charge to anyone, regardless of insurance coverage or ability to pay. The commercial price being charged by Pfizer and Moderna is $115 to $128 per dose, respectively, about 3-4 times higher than the price paid for by the federal government. In addition to the cost of the vaccine, there may be a cost associated with administering the vaccine and/or the cost of a provider visit.
With commercialization, the way in which vaccines are paid for and whether they are covered by insurance will now be dictated by insurance market rules and regulations. Because of the Affordable Care Act and laws passed during the COVID-19 pandemic, COVID-19 vaccines will continue to be free of charge to virtually everyone with private and public insurance coverage, although uninsured adults will have no guarantee of free vaccines. This cheat sheet provides details on coverage rules by insurance type and for people who are uninsured.
LEGAL BASIS
Private:
ACA: Requires private insurers to cover any ACIP recommended vaccine once the CDC Director adopts recommendation no later than one year later.
CARES Act: Expedited coverage requirement to 15 business days for COVID-19 vaccines
DOL FAQs: The 15-day requirement was already satisfied 15 days after first COVID-19 vaccine recommended in December 2020. As of January 5, 2021, any COVID-19 vaccine that is approved or authorized by the FDA must be covered immediately.
Medicaid:
ARPA: Requires no cost-sharing through September 2024
IRA: Requires Medicaid coverage of ACIP-recommended vaccines for adults with no cost sharing permanently.
Medicaid covers ACIP-recommended vaccines for children at no cost through the Vaccines for Children Program.
Medicare:
CARES Act: Requires no cost-sharing
Uninsured Adults:
There is no federal guarantee of free recommended vaccines for adults. Section 317 of the Public Health Services Act created a discretionary program that provides some limited support for recommended vaccines. The Biden administration has proposed creating a mandatory Vaccines for Adults Program, modeled on the Vaccines for Children Program
Uninsured Children:Section 1928 of the Social Security Act created the VFC program. Vaccines are automatically included in program if recommended by ACIP and included on the CDC’s vaccine schedule. COVID-19 vaccines were added to the vaccine schedule on October 19, 2022.
As Congress considers reauthorization of the President’s Emergency Plan for AIDS Relief (PEPFAR) for a fourth time, KFF explores the debate over abortion policy that has stalled the legislation and the potential implications if Congress does not reauthorize the program. PEPFAR spans more than 50 countries and has been reported to have saved 25 million lives since President George W. Bush created it in 2003. Funding for the program in FY 2023 was $6.9 billion, including funding for the Global Fund to Fight AIDS, Tuberculosis, and Malaria.
Despite a long history of broad and bipartisan support—and in the wake of the U.S. Supreme Court’s overturning of the constitutional right to abortion—the U.S. government’s signature global health effort in the fight against HIV has been drawn into a broader political debate about abortion, even though U.S. law prohibits the use of U.S. foreign assistance, including PEPFAR funding, for abortion.
In this new analysis, KFF provides an overview of the current debate and answers key questions about the role of the abortion debate in PEPFAR’s reauthorization, including:
What concerns about abortion have been raised?
What has been the response by PEPFAR and the U.S. government?
What U.S. government laws and policies regarding abortion apply to PEPFAR?
What are the implications if PEPFAR is not authorized?
Despite a long history of broad and bipartisan support, reauthorization of the President’s Emergency Plan for AIDS Relief (PEPFAR) is currently being held up by congressional debate around abortion. PEPFAR, first created in 2003 by President George W. Bush and reauthorized three times thus far, is the U.S. government’s signature global health effort in the fight against HIV. Widely regarded as one of the most successful programs in global health history, PEPFAR reports having saved 25 million lives due to its efforts, and KFF analyses have found a significant impact of the program beyond HIV, including large reductions in both maternal and child mortality and significant increases in some childhood immunization rates. Still, its fourth reauthorization has been drawn into broader U.S. political debate about abortion, in the wake of the Supreme Court’s Dobbs v. Jackson Women’s Health Organization decision (which overturned the nationwide right to obtain an abortion), even though U.S. law prohibits the use of U.S. foreign assistance, including PEPFAR funding, for abortion. This policy watch provides an overview of the current debate and issues.
What concerns about abortion have been raised?
Abortion was publicly raised as one of the discussion points in PEPFAR reauthorization in early May after a coalition of organizations opposed to abortion rights, a conservative think tank’s report, and a member of Congress raised their concerns that PEPFAR may be supporting abortion. Among the criticisms leveled were that the Biden administration had restored funding to the United Nations Population Fund (UNFPA), signaled its support for sexual and reproductive health and rights globally in the September 2022 Reimagining PEPFAR’s Strategic Direction strategy document and February 2023 PEPFAR operational guidance, and funded various recipients who expressed support for abortion generally. There was also a call for Congress to reinstate and apply the “Mexico City policy” to PEPFAR. The Mexico City policy – first instituted in 1984 but not currently in effect – is a policy that required foreign non-governmental organizations (NGOs) to certify that they would not perform or promote abortion as a method of family planning using funds from any source as a condition for receiving certain U.S. funding. Typically put in place through executive order, it first applied to PEPFAR in 2017 under an expanded version of the policy instituted by President Trump, which was rescinded by President Biden in 2021 (prior to that time, when it was in place, PEPFAR was not subject to this policy).
What has been the response by PEPFAR and the U.S. government?
There has been no evidence produced that PEPFAR has supported any prohibited abortion activities. In June, Ambassador John Nkengasong, the head of PEPFAR, publicly stated that PEPFAR does not provide a platform for abortion in Africa and that it is “implemented strictly within the context of the laws it was created [by].” PEPFAR also sent official communication to all its implementers regarding current law and policy in this area. Additionally, the PEPFAR program revised its earlier September 2022 document, Reimagining PEPFAR’s Strategic Direction, to clarify that “sexual and reproductive health services” has a specific meaning in the PEPFAR context and reiterated that “PEPFAR does not fund abortions, consistent with longstanding legal restrictions on the use of foreign assistance funding related to abortion.” The U.S. government also has training and compliance processes in place to monitor the adherence of funding recipients and sub-recipients with U.S. requirements.
What U.S. government laws and policies regarding abortion apply to PEPFAR?
PEPFAR is governed by several legal, policy, and programmatic requirements related to abortion (see the KFF fact sheet on these and other requirements), including:
theHelms Amendment (in place since 1973) – a legal ban on the direct use of U.S. funding overseas for the performance of abortion as a method of family planning or to motivate or coerce any person to practice abortion;
theLeahy Amendment (in place since 1994) – a legal requirement that clarifies the Helms Amendment language that uses the term “motivate” by stating that “motivate” shall not be construed to prohibit, where legal, the provision of information or counseling about all pregnancy options; and
theSiljander Amendment (in place since 1981) – a legal ban on the direct use of U.S. funding overseas to lobby for or against abortion.
In addition, while not currently in effect, the Mexico City policy was applied to PEPFAR for the first time during the Trump administration.
what are the implications if PEPFAR is not reauthorized?
If PEPFAR is not reauthorized this year, or in the near future, the program won’t end, but there are several practical and symbolic implications for the program and the people it serves.
PEPFAR is a permanent part of U.S. law and will continue, provided funds are appropriated. PEPFAR operates largely under permanent authorities of U.S. law that allow for ongoing funding and the continuation of the major structures of the program, such as the Office of the Global AIDS Coordinator at the Department of State as well as the position of Global AIDS Coordinator, U.S. participation in the Global Fund to Fight AIDS, Tuberculosis and Malaria (Global Fund), and annual reporting on PEPFAR efforts.
Some requirements, however, are time-bound and would “sunset.” There are eight requirements that will end (seven after FY 2023 and one after FY 2024) if not addressed through PEPFAR reauthorization or another legislative vehicle. These include requirements related to Global Fund support, a funding directive for orphans and vulnerable children (OVC), and others.
The lack of reauthorization would mark a significant departure from PEPFAR’s long-time bipartisan support. PEPFAR has enjoyed strong bipartisan support across multiple Congresses and administrations. This has enabled the program to operate outside some of the policy debates that have stalled agreement on other issues related to both health care and foreign assistance in Congress. Despite the fact that funding for PEPFAR could continue absent reauthorization, the program may be more vulnerable in future funding debates.
Failure to reauthorize the program could send a message to partner countries and the people served by PEPFAR. Despite vocal administration support for the program as well as former President Bush and others calling on Congress to reauthorize PEPFAR, the lack of a congressional reaffirmation of the program may undermine efforts to demonstrate the depth of the U.S. government’s commitment to the global fight to end AIDS and broader leadership role in global health. It could also weaken PEPFAR’s partnering and diplomatic efforts, particularly conversations with partners about longer-term planning, financial sustainability, and country leadership of efforts.
KFF Research Shows that Medicare Open Enrollment TV Ads Are Dominated by Medicare Advantage Plans Featuring Celebrities, Active and Fit Seniors, and Promises of Savings and Extra Benefits Without Fundamental Plan Information
Beneficiaries Say They Are Confused— “Medicare” Hotlines and Other Tactics Often Give Viewers False Impressions
The annual blitz of ads for Medicare Advantage plans has become a rite of fall, as health insurers, brokers and other third parties seek to court enrollees for these private plans, which are offered to the 65 million people with Medicare during the program’s open enrollment season.
In advance of the open enrollment period starting on October 15, KFF reviewed more than 1,200 unique television ads that aired more than 643,000 times last year to examine these marketing strategies in depth.
Based on its research, KFF found a heavy reliance on celebrity endorsers, liberal use of what appear to be official hotlines and images of government-issued Medicare cards, and suggestions that seniors who do not sign up for a plan could miss out on benefits to which they are entitled.
More than 85 percent of airings, or 9,500 ads per day, were for Medicare Advantage, the private plans that now enroll more than half of all eligible people with Medicare. Most of the remaining ads were for Medicare drug plans or Medicare supplemental insurance (Medigap).
Ads rarely mentioned traditional Medicare, or potential limitations with plan coverage, such as provider networks or prior authorization requirements, leaving beneficiaries with an incomplete view of their coverage options and the tradeoffs among them. Open enrollment runs annually from Oct. 15 to Dec. 7, with advertising permitted to begin on Oct. 1.
“There’s no question that Medicare has become a lot more complex. As enrollment in Medicare Advantage plans has grown, the annual marketing madness can create confusion for people who are trying to make difficult decisions about coverage,” said KFF President and CEO Drew Altman. “We heard directly from seniors in focus groups that the ads were often perceived as misleading and left them feeling overwhelmed. This isn’t a good basis on which to make a choice that will affect your health and pocketbook.”
Key insights from the research include:
More than a quarter of all airings of Medicare Advantage ads (27%), included an official Medicare card or an image that resembled it. Additionally, more than 80% of airings sponsored by brokers and other third parties urged viewers to call a toll-free number described as “Medicare” hotline. But the number was not the official 1-800-Medicare hotline, and the entities behind such messages did not represent the government. New CMS rules in effect for the upcoming open enrollment period prohibit misleading use of the Medicare name, logo, or card in private marketing and communication materials, or any use of the Medicare card without prior approval from CMS.
Some ads suggest that seniors may miss out on financial savings, or benefits to which they are entitled, if they don’t sign up for a Medicare Advantage plan. While Medicare Advantage plans do typically offer extra benefits, that can leave viewers with the impression that they have incomplete coverage if they have traditional Medicare, and that they have an entitlement to extra benefits under Medicare Advantage.
Nearly all Medicare Advantage ad airings emphasized extra benefits, such as dental, vision, and hearing (92%) or the potential for lower out-of-pocket spending (85%). Less than 4 percent of airings referenced quality star ratings, even though CMS created the ratings in part to help shoppers compare Medicare Advantage plans.
One-in-four Medicare Advantage ad airings (26%) showed physically robust seniors engaging in activities such as hiking, yoga, tennis, and even bouncing on a trampoline. This may suggest that they are targeting relatively healthy, lower cost enrollees. Few ads showed people with visible disabilities (4%) or the appearance of serious illness (1%), though one-fifth of Medicare beneficiaries are in fair or poor self-reported health.
Celebrity endorsers, including actor William Shatner, comedian J.J. Walker and former Arkansas governor Mike Huckabee, appear more often in Medicare Advantage ads sponsored by brokers and other third-party entities than in ads sponsored by insurers. The celebrity endorsers are almost always men. Ex-NFL star Joe Namath was the most prolific, appearing in ads that aired nearly 56,000 times over the period, or about 10 percent of all airings of Medicare Advantage ads that season. More than two-thirds of ad airings sponsored by brokers and other third parties mentioned getting money back in your Social Security check, even though just 17% of Medicare Advantage plans offered in 2023 include this benefit.
As part of this research, KFF also released a second report that was based on focus groups conducted in fall 2022, which confirms that many Medicare beneficiaries and their family members feel overwhelmed by the annual onslaught of TV ads and are sometimes confused about whether the government or private companies are behind them.
In the focus groups with beneficiaries and other Medicare plan shoppers, many participants thought TV advertisements were misleading and said they did not trust the content of the ads, particularly those that marketed a slew of “free” benefits. Many participants said they relied on agents and brokers when making coverage decisions. Few used government resources, such as the Medicare Handbook or 1-800 Medicare, but those who did generally found them helpful.
The two KFF reports come at a time when lawmakers in Congress, state insurance regulators and officials in the Biden administration are taking steps to address rising consumer complaints about deceptive marketing practices in Medicare ads. Such complaints, which numbered fewer than 16,000 in 2020, increased to nearly 40,000 in the first eleven months of 2021, according to the Centers for Medicare and Medicaid Services (CMS). The rise has coincided with an increase in advertising by third-party marketing organizations such as agents, brokers, lead generation businesses and media firms in recent years.
Finally, a third new KFF resource answers key questions about the Medicare open enrollment period. It addresses topics such as what sorts of changes beneficiaries can make during open enrollment; how features of traditional Medicare compare to Medicare Advantage; how supplemental coverage like Medigap plans or retiree health benefits factor into Medicare coverage decisions.
The Medicare ad study by KFF analyzed TV ad data that was compiled by the Wesleyan Media Project, which collaborated with KFF on the research. Ads were obtained from Vivvix (formerly Kantar) CMAG, a data analytics and consulting firm, and were coded by the Wesleyan Media Project and analyzed by KFF.
KFF also worked with PerryUndem to conduct focus groups with Medicare beneficiaries and other Medicare plan shoppers in the Fall of 2022, during the annual Medicare open enrollment period.
The full reports are available collectively here or individually at:
Most of the 65 million beneficiaries who receive health insurance coverage through the federal Medicare program are enrolled in some form of private plan. In 2023, 31 million Medicare beneficiaries are enrolled in Medicare Advantage (Medicare Part C) plans administered by private health insurers. The other 34 million beneficiaries are in traditional Medicare, including 22 million beneficiaries who are enrolled in a Medicare Part D prescription drug plan offered by private sponsors, and more than 14 million who have Medicare supplemental insurance (Medigap) offered by private insurers (traditional Medicare beneficiaries may be enrolled in a Part D plan, a Medigap plan, or both).
Private plan offerings have grown in recent years, most notably in the Medicare Advantage market. More Medicare Advantage plans are available in 2023 than in any prior year. Medicare Advantage enrollment has doubled since 2010, due in part to extensive marketing efforts and the draw of extra benefits and attractive cost features. Each year, beginning on October 1st, insurers, as well as brokers and other third-party entities, are permitted to begin marketing Medicare Advantage for the annual open enrollment period for coverage in the following year. The open enrollment period for Medicare Advantage and Medicare Part D plans runs from October 15th through December 7th. Television ads are one of many marketing activities used by insurers, brokers and other third-party entities to boost enrollment.
Recently, the Centers for Medicare and Medicaid (CMS) has reported a steep rise in beneficiary complaints related to the marketing of Medicare Advantage and Part D plans. Many of these complaints have centered on the activities of brokers and other third-party entities, referencing misleading claims and aggressive sales tactics. Concerns raised by the National Association of Insurance Commissioners and in a report released by the majority staff of the U.S. Senate Committee on Finance have also called attention to this issue. In response, CMS published updated regulations, effective June 2022, mandating stricter oversight of these third parties by the insurers they represent. Additional CMS requirements intended to curtail misleading marketing activities came into effect in June 2023, and will apply to the open enrollment period for 2024 coverage and beyond.
To capture the state of television marketing activities and consider the implications for people with Medicare, KFF analyzed ad data compiled by the Wesleyan Media Project, that were obtained from Vivvix (formerly Kantar) CMAG, a data analytics and consulting firm, and were coded by the Wesleyan Media Project in collaboration with KFF. The data set included all English-language TV ads that aired across national and local markets on broadcast television or national cable, from October 1st, 2022, through December 7th, 2022, the period that includes the Medicare open enrollment period for coverage in 2023. (see Methods).
Key Takeaways:
TV airways were flooded with ads for Medicare plans. Nearly 650,000 airings of Medicare ads appeared during the nine weeks of advertising, more than 9,500 airings per day. Most of these ads were aired in local media markets. While most TV ads were sponsored by health insurers, about one in every five TV ads were sponsored by brokers and other third-party entities, such as marketing firms.
TV ads for Medicare Advantage comprised more than 85% of all airings for the open enrollment period for 2023. The remaining ads focused on other types of plans, such as Medigap and stand-alone Part D prescription drug plans, or promoted the open enrollment period more generally. Medicare Advantage ads were disproportionately sponsored by health insurers who offer plans that comprise a relatively small share of Medicare Advantage enrollees.
TV ads for Medicare Advantage often showed images of a government-issued Medicare card or urged viewers to call a “Medicare” hotline other than the official 1-800-Medicare hotline. More than a quarter of all airings (27%) included a government-issued Medicare card or image that resembled it, including 28% of insurer-sponsored airings and 21% of airings sponsored by brokers and other third-party entities, a trend that CMS has flagged as potentially misleading to beneficiaries. Roughly 16% of airings featured a privately-run phone line described as a “Medicare” hotline, most of which were sponsored by brokers and other third-party entities.
Some ads suggested that people with Medicare miss out on benefits to which they are entitled if they are not enrolled in a Medicare Advantage plan. These TV ads were more common among ads sponsored by brokers and other third-party entities than those sponsored by health insurers, and used language that implied viewers were “missing out” on benefits they were “entitled to,” or receiving incomplete coverage under Medicare Parts A and B if they were not enrolled in a Medicare Advantage (Part C) plan
The vast majority of Medicare Advantage ad airings touted low costs and extra benefits, while few mentioned quality ratings. Nearly all Medicare Advantage ad airings emphasized extra benefits, such as dental, vision, and hearing (92%) or the potential for lower out-of-pocket spending (85%). Airings sponsored by brokers and other third-party entities often (67%) promoted the potential for enrollees to get money back in their Social Security check (or lower their Medicare Part B premium). Few airings (4%) mentioned quality star ratings.
Medicare Advantage ad airings often featured active seniors engaged in physical activities, but rarely showed people who appeared to have a serious health problem or visible disability. One in four Medicare Advantage ad airings (26%) showed seniors taking part in activities such as hiking or yoga, but few included people with visible disabilities (4%) or the appearance of serious illness (1%) for whom health insurance coverage and choice of providers may be a high priority.
TV ads sponsored by brokers and other third-party entities used celebrity endorsements more often than health insurers to promote Medicare Advantage. Celebrities, such as actors, athletes, and politicians, appeared in more than half of Medicare Advantage ad airings sponsored by brokers and other third parties (55%), but rarely appeared in airings sponsored by insurers (3%). Familiar figures included Joe Namath, Lionel Richie, William Shatner, and JJ Walker. Joe Namath was featured more than any other celebrity, appearing in nearly 56,000 airings.
Medicare beneficiaries have a wealth of choices for their health insurance coverage. While beneficiaries may appreciate the ability to select from multiple options, the variable costs, benefits, provider networks, and other characteristics of Medicare Advantage plans make the decision complex, especially in light of the barrage of advertising. Additionally, information about coverage under traditional Medicare is rarely included in television ads, leaving beneficiaries with an incomplete view of their coverage options and the tradeoffs among them. While CMS has issued new rules to address concerns about aggressive and misleading marketing tactics, ongoing monitoring and resources independent of commercial interests could help to improve beneficiary decision-making.
This work was supported in part by Arnold Ventures. KFF maintains full editorial control over all of its policy analysis, polling, and journalism activities.
Jeannie Fuglesten Biniek, Alex Cottrill, Nolan Sroczynski, Meredith Freed and Tricia Neuman are with KFF. Breeze Floyd, Laura Baum, and Erika Franklin Fowler are with the Wesleyan Media Project. We thank Markus Neumann, Jielu Yao (Wesleyan University) and Sarah Gollust (University of Minnesota). We also thank the numerous undergraduate student research assistants at Wesleyan University for their efforts on this project.
Report
Introduction
During the annual Medicare open enrollment period that runs from October 15th through December 7th, Medicare beneficiaries can review the coverage options available in their area and make changes for the upcoming year. Drawn by the prospect of strong financial performance, buoyed by generous payments from the federal government, many insurers have expanded their Medicare Advantage offerings in recent years. In 2023, Medicare beneficiaries can choose from an average of 43 Medicare Advantage plans, offered by 9 different insurers, the highest number ever available. Traditional Medicare beneficiaries selecting prescription drug coverage can choose from an average of 24 stand-alone Part D plans.
Plans rely on TV advertising, among other marketing activities, to attract and retain enrollees during the open enrollment period. Recent years have seen an increase in print and television ads from third-party marketing organizations, such as agents and brokers, lead generation businesses, and media firms. At the same time, the Centers for Medicare and Medicaid Services (CMS) has reported a steep rise in beneficiary complaints related to the marketing of private Medicare plans, from less than 16,000 in 2020 to nearly 40,000 in the first eleven months of 2021, many of them centered on the marketing activities of these third-party entities.
In May 2022, the National Association of Insurance Commissioners (NAIC) sent a letter to Congress urging action on this issue, citing concerns about misleading claims and aggressive sales tactics. The following November, the majority staff of the Senate Finance Committee released a report detailing complaints and associated marketing materials from key stakeholders across 14 states. In response, CMS released new regulations, effective June 2022 and June 2023, tightening restrictions on health insurers and third parties who market Medicare Advantage and Part D plans.
This report describes the content and characteristics of all English-language TV ads focused on Medicare that aired on broadcast television or national cable between October 1, 2022 and December 7, 2022. Ads were obtained by the Wesleyan Media Project from Vivvix (formerly Kantar) CMAG, a data analytics and consulting firm, and coded by trained undergraduate student coders using an instrument developed jointly by the Wesleyan Media Project and KFF. The KFF analysis includes 1,267 unique ads that aired 643,852 times during the advertising period and focuses mainly on Medicare Advantage ads, the dominant Medicare plan type advertised during the period (see Methods).
Background
Trends in Medicare Coverage
More than 65 million people receive health insurance coverage through the federal Medicare program. Increasingly, this coverage is provided by private companies who contract with the federal government to offer Medicare Part A and Part B covered services (Medicare Advantage or MA), Part D prescription drug plan coverage (PDP), or both (MA-PD). Medicare Advantage enrollment has doubled since 2010, covering over half (31 million people) of eligible Medicare beneficiaries in 2023. Among traditional Medicare beneficiaries, 22 million are enrolled in a stand-alone PDP and most have some form of private supplemental coverage, including more than 14 million who purchase a private Medigap supplement policy.
The growth in Medicare Advantage enrollment is due, in part, to the extra benefits and attractive cost features offered by most Medicare Advantage plans. Virtually all Medicare Advantage plans offer some benefits not included in traditional Medicare, such as coverage of dental, vision, or hearing services. Additionally, unlike traditional Medicare, which places no cap on out-of-pocket spending for hospital or physician services, Medicare Advantage plans are required to set out-of-pocket limits for services covered by Parts A and B. At the same time, Medicare Advantage plans often have restrictions, such as prior authorization and referral requirements, rarely used in traditional Medicare, and most include networks that set limits on which providers enrollees may see. Close to 60% of Medicare Advantage beneficiaries are enrolled in HMO plans that typically do not cover out-of-network services.
Marketing Complaints and Regulatory Response
The report from the majority staff of the Senate Finance Committee documents numerous examples of beneficiary complaints about marketing practices used by Medicare Advantage insurers, as well as brokers and other third-party entities, including false or misleading information about plan costs and available benefits, concerns which have been raised by the National Association of Insurance Commissioners as well. For example, advertisements promising lower Part B premiums or higher Social Security checks were a common source of complaints. States frequently reported incidents in which agents or brokers used this claim to attract potential enrollees, even when advertising in service areas where no such plans were available, or when enrolling beneficiaries in a plan that offered this benefit would be an otherwise poor fit for their needs. In 2023, just 17% of Medicare Advantage plans offer a rebate toward the Part B premium.
Likewise, CMS has raised concerns that the prominent use of the word “Medicare” in company names or headers and images of the Medicare card or logo in print and TV ads creates confusion for beneficiaries and may lead them to believe that these organizations are speaking on behalf of the Medicare program. Focus groups conducted by KFF in the fall of 2022, suggest that beneficiaries find these ads to be misleading, often reporting uncertainty about who had sponsored the ads they saw on TV and whether they were endorsed by the Medicare program or the federal government.
CMS has moved to address these issues in several ways. Regulations that went into effect in June 2022, and apply to all Medicare Advantage and Part D ads discussed in this analysis, broaden the definition of third-party marketing organizations, mandate greater oversight by health insurers of the third parties who represent them, and require third parties to include a standard disclaimer in all communications and marketing materials informing beneficiaries that they do not represent every plan available in their area and advising them to contact official CMS resources for a complete list of their options (though CMS does not specify whether or not this disclaimer may be featured in fine print). In April 2023, CMS finalized additional requirements to address misleading marketing practices that will apply to the upcoming Medicare open enrollment period that begins in October 2023, for coverage in 2024. (See Appendix for details.)
TV Ads For the 2023 Medicare Open Enrollment Period
TV ads for Medicare Advantage often showed images of a government-issued Medicare card or urged viewers to call a “Medicare” hotline other than the official 1-800-Medicare hotline.
Some ads suggested that people with Medicare miss out on benefits to which they are entitled if they are not enrolled in a Medicare Advantage plan.
TV ads sponsored by brokers and other third-party entities used celebrity endorsements more often than health insurers to promote Medicare Advantage.
TV airways were flooded with ads for Medicare plans.
There were 643,852 airings of English-language Medicare ads run on broadcast television and national cable between October 1, 2022, and December 7, 2022, an average of more than 9,500 airings per day, more than were seen for any individual Healthcare.gov open enrollment period between 2013 and 2018. Just over 40,000 Spanish-language airings (not included in our analysis) bring the total number of Medicare-related airings close to 690,000.
Medicare ads were most common during the weekday afternoons. Across the top 20 markets, viewers of programs aired on Fox affiliates saw an average of at least 6 ads per day, viewers of programs aired on ABC and NBC affiliates saw an average of at least 5 ads per day and viewers of programs aired on CBS saw an average of at least 4 ads per day each weekday afternoon between October 1, 2022 and December 7, 2022 (data not shown).
The most common television programs during which Medicare ads were aired included talk shows, reality court shows and game shows. For example, across the top 20 markets, regular viewers of Dr. Phil saw an average of 404 Medicare ads, or 8 ads per day that were directed at the open enrollment period. Regular viewers of Hot Bench saw 336 ads on average, or 7 ads per day, and regular viewers of Family Feud saw 281 ads on average, or 6 ads per day (Appendix Table 1).
Local news broadcasts also often included commercials for Medicare plans. On December 1st, the day with the highest number of airings, a person watching News 5 at 5pm on ABC in Cleveland would have seen nine Medicare ads during the one-hour broadcast. Likewise, a person watching WCCO Mid-Morning on CBS in Minneapolis would have seen seven ads during the hour, and a person watching Eyewitness News 4 at Midday on NBC in Albuquerque would have seen six in the hour (data not shown).
Most Medicare ads aired in local media markets rather than nationally. Of the 643,852 Medicare ad airings analyzed, the vast majority (86%) aired locally, while 14% aired nationally. The targeting of TV ads to local media markets likely reflects a strategy to compete and grow enrollment in specific regions and service areas. (See Appendix for details.)
While health insurers sponsored the majority of Medicare TV ad airings, brokers and other third-party entities had a significant presence, especially with ads that aired nationally. Roughly 73% of all Medicare ad airings (468,808) were sponsored by health insurers, while more than one in five (21%, 135,699) were sponsored by brokers and other third-party entities. Just 3% (18,321) were sponsored by the Department of Health and Human Services or other government agency (Figure 1). Brokers and other third parties relied more on national airings than local markets, accounting for 50% of national airings but just 16% of all local airings.
Roughly 3% (21,024) of all Medicare ad airings did not identify the organization who sponsored the ad. Among national airings, nearly one in ten did not include this information, a pattern that may reflect the larger share of national ads sponsored by brokers and other third parties, who may have less to gain from brand recognition.
TV ads for Medicare Advantage comprised more than 85% of all airings for the open enrollment period for 2023.
Of the 643,852 airings of Medicare ads that ran during the nine-week advertising period for open enrollment for coverage in 2023, 556,068 (86%) promoted Medicare Advantage. Many of these airings also mentioned Part D benefits, but a review of the top 150 most-frequently aired ads (representing more than 80% of all Medicare ad airings) showed that nearly all of these were marketing Medicare Advantage plans that included Part D coverage, rather than offering stand-alone Part D plans as a separate product. Of the remaining 87,784 airings, 7,790 (1%) promoted Medigap plans and 465 (less than 1%) promoted stand-alone Part D plans with no mention of Medicare Advantage. Another 32,692 airings (5%) promoted multiple types of plans, while 46,837 (7%) did not mention any type of plan, instead offering general information on the open enrollment period or counseling on Medicare plan choice (Figure 2).
The emphasis on Medicare Advantage matches trends in Medicare enrollment. As of 2023, just over half of all eligible Medicare beneficiaries receive their Medicare Part A and Part B benefits through a Medicare Advantage plan, a twofold increase in the past decade that has outpaced the more modest growth seen in Medigap enrollment. Likewise, enrollment in stand-alone Part D plans has declined as a growing share of beneficiaries enroll in Medicare Advantage plans that include prescription drug coverage. At the same time, a KFF analysis of private Medicare advertising for the 2008 open enrollment period demonstrated that insurers have devoted the largest share of their advertising resources to Medicare Advantage plans for some time.
The remaining discussion is focused on Medicare Advantage, as these ads made up the vast majority of Medicare ad airings for the open enrollment period.
Four of every five Medicare Advantage ad airings were sponsored by health insurers, with the remaining sponsored by brokers and other third-party entities, such as marketing companies. Among the 556,068 ads promoting Medicare Advantage, health insurers sponsored a majority (79%) of ad airings while brokers and other third-party entities sponsored 19%. The remaining 2% of sponsors were not readily identifiable. Ads sponsored by brokers and other third parties rarely listed the specific Medicare Advantage organizations they represented or the plans they offered, though many advertised specific benefits and plan features that might be available. Brokers may contract with multiple insurers, and offer plans with varying benefits and costs, across many service areas, which may lead to confusion if beneficiaries are unaware which of the plan features advertised are available where they live. Further, brokers have a financial incentive to steer people towards Medicare Advantage plans over other coverage options. In the 2023 plan year, brokers receive $601 per new enrollee in most Medicare Advantage plans, substantially higher than for new enrollees in most Part D plans ($92). Though comparable data do not exist for Medigap plans, brokers report substantially lower commissions for Medigap enrollment.
Though not applicable to these ads, new regulations from CMS came into effect in June 2023 which prohibit brokers and other third parties from advertising specific plans or plan features without clearly identifying the insurers that offer them. Further, all groups are prohibited from marketing benefits in service areas where those benefits are not available (see Appendix for details).
UnitedHealthcare and Humana comprise nearly half of Medicare Advantage enrollment but sponsored just 20% of insurer-sponsored ad airings. Many TV ad airings promoting Medicare Advantage were sponsored by health insurers that enroll a relatively small share of Medicare Advantage enrollees. While UnitedHealthcare and Humana together comprise nearly 50% of Medicare Advantage enrollment in recent years, these two insurers sponsored less than 20% of airings for Medicare Advantage plans. In contrast, three insurers accounted for a larger share of airings than enrollment: Blue Cross Blue Shield affiliates (26% of airings vs. 14% of enrollment), Centene (12% vs. 4%), and Cigna (9% vs. 2%). Roughly one in five airings (24%) came from insurers that account for less than 2% of Medicare Advantage enrollment each, and 16% as a group (Figure 3). Despite rapid growth, Medicare Advantage enrollment remains concentrated among a small group of firms, and insurers with a smaller footprint in the Medicare Advantage market may rely more heavily on TV advertising to promote their plans and expand market share.
TV ads for Medicare Advantage often showed images of a government-issued Medicare card or advertised a “Medicare” hotline other than 1-800-Medicare.
Over one in four ad airings (27%) promoting Medicare Advantage showed a government-sponsored Medicare card or an image that resembled it, and 16% included a phone number other than 1-800-Medicare that was described as a “Medicare” hotline. Both CMS and the Senate Finance Committee have expressed concern that the use of the Medicare name, logo, or card in private marketing materials could confuse beneficiaries and lead them to believe they are contacting an official government resource. New regulations from CMS aim to address this issue by prohibiting the use of the Medicare card, except for educational purposes (see Appendix for details).
The Medicare card or a similar image appears on screen in more than one-quarter of ad airings for Medicare Advantage. Images of the Medicare card, or something that closely resembles it, appeared in more than one-quarter (27%) of all ad airings for Medicare Advantage, including 28% of insurer-sponsored airings and 21% of airings sponsored by brokers and other third-party entities. Some of these framed the screen with a red, white, and blue border that resembles the Medicare card design, in some instances, for the duration of the airing.
Though not applicable to these ads, new regulations, which will apply to the upcoming open enrollment period in October 2023, prohibit misleading use of the Medicare name, logo, or card in private marketing and communication materials, or any use without prior approval from CMS. CMS has stated that it will approve use for educational purposes only, such as a graphic showing beneficiaries how to tell the difference between their federally-issued Medicare card and their insurer-issued Medicare Advantage plan card. However, it is unclear whether images that are similar, but not identical, to a Medicare card will still be permitted in marketing materials, such as the use of a Medicare card design to frame the screen.
Most Medicare Advantage ad airings sponsored by brokers and other third parties featured a “Medicare” hotline that is not the official government-sponsored 1-800-Medicare hotline. A large majority of Medicare Advantage airings sponsored by brokers and other third-party entities (83%) featured a “Medicare” hotline other than the 1-800-Medicare line run by the federal government (Figure 4). These were often described using general names such as a “Medicare Helpline,” “Medicare Benefits Support Line,” or “Medicare Benefits & Questions Line,” with no reference to a specific company name. In contrast, airings sponsored by health insurers rarely included this type of “Medicare” hotline, instead directing viewers to call their own agents (data not shown). Virtually no ad airings promoting Medicare Advantage mentioned 1-800-Medicare, the official Medicare phone number, outside of fine print.
Among airings sponsored by brokers and other third parties, 19% included both an image of the Medicare card and mention of a privately-run “Medicare” hotline, increasing the possibility that beneficiaries will believe that the ad and its contents were sponsored by an official government agency.
VIDEO: Medicare Advantage ads often showed images of a government issued Medicare card or urged viewers to call a “Medicare” hotline other than 1-800-Medicare.
Focus groups conducted by KFF in the fall of 2022 suggest that beneficiaries are often overwhelmed by the volume and complexity of choices available to them, yet few make use of official Medicare resources such as 1-800-Medicare. Airings sponsored by brokers and other third parties often referenced this volume of choices, encouraging beneficiaries who felt “overwhelmed” or “confused” by their coverage options to call their privately-operated “Medicare” hotline for advice.
Under current rules that became effective in June 2022, and are applicable to the period examined, ads sponsored by brokers and other third-party entities are required to include a disclaimer explaining that they do not represent every plan available in a service area and advising beneficiaries to call 1-800-Medicare for a complete list of their coverage options. While this disclaimer was included in the subset of third-party airings we reviewed, it was often shown for just a few seconds or written in small font, potentially making it difficult for viewers to read.
In some cases, ads advised callers against giving their personal information to national hotlines or “1-800 numbers,” suggesting that local experts were more trustworthy. While these messages may be aimed at other broker-sponsored hotlines that operate at the national level, they may also discourage viewers from calling 1-800-Medicare for additional information.
Some ads suggest that people with Medicare miss out on benefits to which they are entitled if they are not enrolled in a Medicare Advantage plan.
More than 50,000 Medicare Advantage ad airings used language that suggested people with Medicare are “missing out” on important benefits if they are not enrolled in a Medicare Advantage plan. Additionally, some ads tell viewers that they are “entitled” to receive supplemental benefits or cost savings offered by some Medicare Advantage plans. Language such as “missing” or “entitled” may give some viewers the impression that they have incomplete coverage or have overlooked a necessary enrollment step if they receive their Medicare coverage from traditional Medicare.
Medicare Advantage plans often include low or $0 supplemental premiums and extra benefits not included in traditional Medicare, such as coverage of dental, vision, and hearing services. The language used in the TV ads refers to these benefits by emphasizing that they are not covered by Medicare Parts A and B, and beneficiaries “do not get these benefits automatically” without enrolling in Medicare Advantage (also referred to as Medicare Part C). For example, some common phrases included:
“It’s a new year, and you may be entitled to new benefits.”
“If you only have Medicare Parts A and B, you may be missing out on extra benefits.”
“That’s right! There are people on Medicare that don’t have a Medicare Part C plan!”
“You are now entitled to eliminate copays.”
This messaging may be especially confusing when paired with references to the Medicare name, logo, or card. Ads with this messaging were more commonly sponsored by brokers and other third-party entities. These third-party sponsored ads also included a privately-run “Medicare” hotline in four out of every five airings, often alongside images of (and references to) the Medicare card. While these references may be intended to alert Medicare beneficiaries that these ads are directed at them, they may lead some viewers to believe the ads were produced by a government source, creating the impression that the government is endorsing the message that Medicare Advantage is “missing” from traditional Medicare coverage.
The vast majority of Medicare Advantage ad airings touted low costs and extra benefits, while few mentioned quality ratings.
More than 90% of airings for Medicare Advantage promoted extra benefits, such as dental, vision, and hearing, and 85% promoted cost features, such as $0 co-pays, no additional premiums, or reductions to the standard Part B premium (Figure 5). A KFF analysis of private Medicare advertising in 2008 also found extra benefits to be the most common message appearing in TV, print, and radio ads for Medicare Advantage.
By contrast, only one in five airings (22%) mentioned plan features that promote flexible access to providers and services, such as nationwide networks and out-of-network coverage, and fewer than 4% made any reference to a plan’s quality star rating.
Ads promoting Medicare Advantage touted a range of supplemental benefits. Mentions of dental, vision, hearing, and prescription drug benefits each appeared in more than 50% of all airings promoting Medicare Advantage. Dental coverage was included in 84% of airings, more often than any other type of supplemental benefit or any cost-related message (Figure 6).
Benefits that may appeal to people in poorer health were marketed substantially less often, including allowances for food or grocery spending (20%), transportation services (20%), and meals (10%), though these were somewhat more common in insurer-sponsored airings than broker or other third-party airings (Appendix Table 2). Other benefits that are valuable to people with serious illnesses or mobility impairments were uncommon regardless of sponsor. Caregiver support, such as respite care or custodial care, was included in just 2% of airings, and bathroom safety devices such as bathtub rails and grab bars were included in less than 1%.
Supplemental benefits are a common feature of Medicare Advantage plans. In 2023, virtually all Medicare Advantage plans offer some supplemental benefits, most often dental, vision, hearing, gym memberships or other fitness benefits, and telehealth services, all of which were offered in at least 97% of available plans. Just 43% of plans included coverage for transportation services, and fewer than 15% included coverage for in-home support services, caregiver support, or bathroom safety devices, consistent with the smaller share of airings that mentioned these benefits.
More than two-thirds of airings sponsored by brokers and other third parties mentioned money back in your Social Security check. Two in three (67%) Medicare Advantage airings sponsored by brokers and other third-party entities included messaging about Part B premium rebates, compared to just 7% of insurer-sponsored airings and 19% overall (Figure 7; Appendix Table 2). While all Medicare Advantage enrollees must continue to pay the Part B premium (or in the case of dual-eligible individuals, have it paid on their behalf), Medicare Advantage plans can offer a rebate against the Part B premium as a supplemental benefit. This is sometimes referred to as the “give back” benefit and results in beneficiaries receiving higher Social Security payments each month.
Airings that included this message often featured endorsements from national celebrities. Joe Namath was featured more than any other celebrity (appearing in nearly 56,000 airings) and mentioned Part B premium rebates in 100% of his appearances.
Few airings, regardless of sponsor, stated that Medicare Advantage enrollees were required to pay the standard Part B premium, which may lead to confusion when plans are advertised as having “no premium.” Frequency of this message could not be measured precisely, due to the very small number of airings in which it appeared (see Methods for details).
Part B premium rebates are less common than many other supplemental benefits, offered by just 17% of plans available in 2023, with an even smaller share of enrollees (10%) opting for plans with this benefit. Though not applicable to these ads, new CMS rules, effective June 2023, prohibit marketing of benefits that are not available in the service area where the ad is aired, which may lead to fewer mentions of this benefit during the upcoming open enrollment period.
Low or $0 supplemental premiums were frequently mentioned among airings sponsored by Medicare Advantage insurers. Roughly two-thirds (66%) of airings promoting Medicare Advantage mentioned low or $0 supplemental premiums. Two-thirds of Medicare Advantage plans available in 2023 do not have a premium (other than the Part B premium) and among all plans the average premium is $15 per month. Mentions of low or $0 premiums were more common in airings sponsored by health insurers (79%) than those sponsored by brokers and other third-party entities (13%) (Appendix Table 2).
By contrast, airings promoting low out-of-pocket spending, including low or $0 co-pays, low cost-sharing, and low deductibles, were common among insurers and third-party sponsors, appearing in half (50%) of all Medicare Advantage airings (Figure 7; Appendix Table 2).
Messages about low premiums were often presented in contrast to the cost of supplemental plans such as Medigap. Traditional Medicare places no cap on out-of-pocket spending for hospital or physician services, and supplement plans can help to insulate beneficiaries from financial risk, but Medigap plans can be costly, with premiums ranging from less than $100 to more than $300 per month. Traditional Medicare beneficiaries may choose to purchase a Medicare supplement to assist with cost-sharing for services covered under Medicare Parts A and B.
VIDEO: Nearly all Medicare Advantage ads touted low costs and extra benefits.
Messages about low out-of-pocket spending sometimes featured estimates of savings that beneficiaries could expect to retain by enrolling in a Medicare Advantage plan. While not applicable to these ads, new regulations from CMS include a prohibition against advertising unrealized “savings” that are calculated relative to the expenses borne by uninsured individuals, the unpaid costs of beneficiaries dually eligible for Medicare and Medicaid, or other unrealized costs of a Medicare beneficiary. According to CMS, these savings estimates can be misleading, as they do not reflect the out-of-pocket costs paid by most Medicare beneficiaries and may give an unrealistic impression of the cost difference between plans.
About one in five Medicare Advantage TV airings emphasized access to doctors. Roughly one in five (22%) Medicare Advantage airings mentioned plan features that reflect flexible access to providers and services, such as promises to “keep your doctor” (14%), nationwide networks (6%), no referrals or pre-approvals for covered services (3%), or coverage for out-of-network providers (1%) (Figure 8). These messages were less common among TV ad airings sponsored by health insurers (13%) than brokers and other third-party entities (59%) (Appendix Table 2).
Health insurers may not choose to advertise access to providers as often as supplemental benefits because most plans employ networks, which place restrictions on which providers enrollees may see or offer more limited coverage for out-of-network services. Further, virtually all Medicare Advantage enrollees are in a plan that requires prior authorization for at least some services.
In contrast, 59% of Medicare Advantage airings sponsored by brokers and other third-party entities include the promise to “keep your doctor” (Appendix Table 2). Many brokers offer a range of plans with different networks, and may feel confident that they can offer a plan that includes a beneficiary’s current doctor, but it is unlikely that most beneficiaries would be able to keep their doctor regardless of the plan they choose. In 2023, 58% of Medicare Advantage plans are HMOs, which typically do not cover out-of-network services
Less than 4% of Medicare Advantage ad airings reference quality star ratings. CMS regularly publishes quality ratings of Medicare Advantage plans to assist beneficiaries in comparing the options available in their area. Plans are rated on a 5-star scale, with 1 star indicating poor performance, 3 stars indicating average performance, and 5 stars indicating excellent performance. While these ratings are intended, in part, to help consumers select a plan, they are very rarely used in TV advertising. Fewer than 4% of Medicare Advantage airings made any reference to a plan’s star rating (Figure 5).
An exception was Kaiser Permanente, which promoted the quality star rating of their plans in 86% of airings, while no other single insurer mentioned star ratings in more than 5% (Appendix Table 3). This may be due to the high ratings received by most Kaiser Permanente plans. Virtually all Medicare Advantage beneficiaries enrolled in Kaiser Permanente were in a plan with a quality rating of at least four stars in 2022, the highest share of any major insurer.
Focus groups conducted by KFF in the fall of 2022 suggest that beneficiaries do not generally take star quality ratings into account when choosing a plan. In 2023, 7 in 10 (71%) Medicare Advantage beneficiaries were enrolled in plans with a rating of 4 or more stars, which may make the rating system less meaningful to beneficiaries looking to distinguish between plans with similar scores. MedPAC has raised concerns about the star rating system in recent years, noting, among other things, that star ratings are reported at the contract rather than the plan level, which may make them less useful to beneficiaries interested in the quality of a specific plan.
Medicare Advantage insurers varied in whether they promoted particular supplemental benefits, the potential for savings, access to providers, or quality most often. Medicare Advantage insurers differed in the plan features they chose to emphasize (Appendix Table 3). UnitedHealthcare, Blue Cross Blue Shield affiliates, and CVS all touted dental coverage more often than any other supplemental benefit, consistent with the overall trend. In contrast, Humana mentioned dental coverage in just 44% of airings, but included mentions of cost features such as low or $0 premiums and low or $0 co-pays in more than 80% of airings. Centene mentioned less common offerings more often than other insururers, including benefits such as meals, transportation, and vouchers for food and groceries or over-the-counter items in more than 50% of airings.
UnitedHealthcare mentioned plan features related to access to providers more often than other insurers, promoting a nationwide network in 27% of airings and lack of referrals or prior authorization requirements in 28% (compared to just 8% and 4% of insurer-sponsored Medicare Advantage airings overall).
Medicare Advantage ad airings often featured active seniors engaged in physical activities, but rarely showed people who appeared to have a serious health problem or visible disability.
Most Medicare Advantage airings (78%) featured people in some capacity. While ads were diverse in terms of the race, ethnicity, gender, and age of people shown (data not shown), people were generally shown to be in good health and free from serious illness. A prior KFF analysis of private Medicare advertising found a similar pattern among print, radio, and TV ads for Medicare Advantage plans in 2008, with one in ten showing seniors engaging in physical sports, just 3% showing people under 65 with a visible disability, and none showing people with visible signs of illness or frailty (such as a walker or a cane).
About one-quarter (26%) of Medicare Advantage airings show seniors participating in physical activity. One in four Medicare Advantage airings (26%) (Figure 9), including 32% of those sponsored by health insurers, showed seniors engaging in some form of physical activity. While some ads featured wellness activities, such as yoga or stretching, others showed seniors engaging in activities that demand much greater health and fitness, such as mountain biking, ziplining, trampoline jumping, and other forms of vigorous exercise. These ads may be targeting healthier seniors who might find these activities appealing or aspirational, and may promote the message that these plans ensure a certain standard of health, but they may also signal to those in poorer health that the plans promoted in these ads are not designed to meet more serious health needs.
VIDEO: Medicare Advantage ads often featured active seniors engaged in physical activity.
Fewer than 5% of airings include a person with a physical disability or someone receiving treatment for a serious illness. People with physical disabilities were shown in less than 4% of airings promoting Medicare Advantage, while just 1% showed a person receiving treatment for serious illness (Figure 9). Nearly all of these airings were sponsored by health insurers, as virtually no airings sponsored by brokers or other third-party entities featured people in either demographic. While this may represent an effort by insurers to associate their plans with good health, this pattern does not represent the demographics of Medicare beneficiaries as a whole. One-fifth (22%) of Medicare beneficiaries are in fair or poor self-reported health, and more than one-quarter (28%) have at least one functional impairment. Among beneficiaries under 65 and living with a permanent disability, these shares are much higher, 57% and 52% respectively.
Just over one-fifth (22%) of Medicare Advantage airings show a senior using technology. One in five Medicare Advantage airings (22%) (Figure 9), including 25% of those sponsored by health insurers, showed seniors using technology such as laptops, smartphones, or tablets. As with ads that show physical activity or exercise, this may be an attempt to appeal to a younger, more engaged group of beneficiaries, rather than those who struggle with serious health issues such as cognitive impairment.
TV ads sponsored by brokers and other third-party entities used celebrity endorsements more often than health insurers to promote Medicare Advantage.
More than half (55%) of all Medicare Advantage airings sponsored by brokers and other third-party entities featured endorsements from celebrities such as actors, athletes, and politicians. Most featured celebrities who were seniors themselves, and virtually all national celebrities featured in these ads were men. In contrast, just 3% of insurer-sponsored ads featured celebrities. Brokers and other third parties may feel more of a need to give viewers a familiar name to catch their attention, while insurers may have more of an interest in establishing their own brand.
Focus groups conducted by KFF in the fall of 2022 suggest that beneficiaries are not swayed by celebrity endorsements and frequently disregard them. Nonetheless, many reported encountering these ads, suggesting that they are memorable, and that celebrities may help draw attention and promote a brand, even if beneficiaries do not regard them as credible.
Joe Namath was featured more often than any other celebrity, appearing in nearly 10% of all Medicare Advantage airings (55,839). One ad in which he appeared aired more often than any other single Medicare ad during the advertising period, and a second was in the top ten, with 41,252 airings and 14,421 airings respectively. No other celebrity appeared in more than 1% of Medicare Advantage airings. Other familiar figures included former sports stars such as David Ortiz, Magic Johnson, and Joe Montana, musicians such as Lionel Richie, politicians such as Mike Huckabee, and popular actors such as William Shatner, J.J. Walker, and William Devane.
VIDEO: Ads sponsored by brokers and other third parties often used celebrity endorsements to promote Medicare Advantage.
Every fall, Medicare beneficiaries are flooded with TV ads during the nine-week marketing period for open enrollment, most of which promote Medicare Advantage plans. The open enrollment period for 2023 coverage saw an average of more than 9,500 Medicare ad airings each day, nearly all of them from health insurers and third-party entities, such as brokers. This volume of advertising has been accompanied by a rise in beneficiary complaints related to aggressive and misleading marketing tactics, leading to heightened attention from CMS, the NAIC, and other policymakers.
New rules from CMS, effective June 2022 and June 2023, aim to address these issues by strengthening oversight of third-party marketing organizations, requiring greater transparency pertaining to the availability of advertised benefits and plan features, and prohibiting the use of certain language and images, such as the Medicare name, logo, or card, in ways that may be misleading to beneficiaries. While not all of these regulations applied to the ads discussed in this analysis, all will be in effect for the open enrollment period that begins in October 2023. Some of the observations described in this report, such as the use of a government-issued Medicare card, which may lead viewers to think the ads are sponsored by the government rather than a private company, may occur less frequently, if at all, in the future. While the new rules may address some concerns about aggressive and misleading marketing tactics, ongoing monitoring and resources independent of commercial interests could help to improve beneficiary decision-making.
Few if any ads mentioned the traditional Medicare program, the alternative to private Medicare Advantage plans, except in the context of the small number of ads promoting supplemental coverage, such as Medigap and stand-alone Part D plans. This is not surprising, since TV ads are sponsored by health insurers and brokers selling private plans, although it may leave beneficiaries without a clear understanding of their coverage options, and the tradeoffs that arise from one choice over another. Many beneficiaries may find it helpful to have support when making decisions about their Medicare coverage, including from financially disinterested sources such as State Health Insurance Assistance Programs, Social Security Administration district offices, and 1-800-Medicare. A recent survey found that many people age 65 and older would like to know more about the out-of-pocket costs and benefits of their Medicare coverage options and felt that they would benefit from one-on-one help. Adequate resources to meet the demands for assistance – beyond brokers, who have a financial interest in steering people to certain options — may help ensure Medicare beneficiaries are choosing the coverage option that best meets their needs.
Appendix
Additional Data and Figures
Time Slots, Concurrent TV Programs, and Broadcast Networks of Medicare Ad Airings: Medicare advertisements appeared at all times of day, and throughout the week, but airings were most frequent on weekday afternoons (24%), weekday mornings (19%), and in the hours leading up to prime time (16%). Airings were most often shown during local news broadcasts (data not shown), while court shows, game shows, and talk shows were among the top single programs during which Medicare ads were aired (Appendix Table 1). The largest number of airings appeared on the four major broadcast networks: the Fox Broadcasting Company (16%), the American Broadcasting Company (ABC) (16%), Columbia Broadcasting System (CBS) (15%), and the National Broadcasting Company (NBC) (14%). Local advertising was more concentrated in some areas than others, with the top 20 local media markets comprising 27% of all local airings (Appendix Figure 1).
Common Messages Featured in Medicare Ad Airings by Sponsor Type and Insurance Firm:
CMS Regulations
Rules Effective June 2022:Current rules from CMS, which came into effect in June 2022 and applied to all Medicare Advantage and Part D ads discussed in this analysis, include several changes aimed at tightening oversight of third-party marketing activities. The rules introduce a broad definition of third-party marketing organizations, encompassing all organizations and individuals paid to perform lead generation, marketing, sales, or enrollment functions on behalf of a private Medicare plan, either directly or indirectly through another third party.
Health insurance companies that offer Medicare plans are now responsible for ensuring that third-party marketing organizations adhere to any CMS requirements that apply to plans themselves (previously only required for direct contractors). In the context of TV advertising, some examples include existing rules that forbid ads from using the term “free” to describe a $0 premium, implying that a plan is recommended or endorsed by CMS or another government office, or implying that a plan is only available to seniors rather than all eligible Medicare beneficiaries. Health insurers are also required to add certain monitoring and oversight provisions to any direct contract with a third-party marketing organization, and keep track of any downstream relationships that organization is using to represent their plans.
Finally, third-party marketing organizations are now required to include a standardized disclaimer in all communications and marketing materials informing beneficiaries that they do not represent every plan available in their service area and encouraging them to contact Medicare.gov or 1-800-MEDICARE for a complete list of their options.
Rules Effective June 2023:Additional rules from CMS, which came into effect in June 2023 and will apply to the upcoming open enrollment period that begins in October, introduce several more provisions aimed at curtailing misleading marketing practices. While some of these provisions go beyond the scope of TV advertising, several will have a direct impact on TV ads in the fall and in future periods.
Ads are now prohibited from mentioning any benefits or plan features that are not available in the service area where the ad appears. Ads that air in media markets that cross multiple service areas are required to list which benefits apply to each service area (Medicare Advantage and Part D service areas are defined at the county level). The Washington, DC market, for example, includes not only DC itself but also surrounding counties in Maryland and Virginia, representing several distinct service areas for which an insurer may offer plans with different premiums, cost-sharing, and benefits.
Ads are also prohibited from using the Medicare name, logo, or card in ways that could be misleading to beneficiaries. Any use requires prior approval from CMS, and CMS has stated that it will only grant this approval in cases where it is serving an educational (as opposed to marketing) purpose. CMS defines marketing as any material or activity that meets certain standards for both intent (to influence enrollment decisions or draw attention to plans) and content (any mention of specific plan features such as benefits, costs, or quality rankings), standards which would likely apply to any ad targeting open enrollment.
Third-party marketing organizations, such as agents and brokers, are prohibited from advertising specific plans or plan features without identifying the Medicare Advantage organizations or Part D sponsors that offer them. CMS requires these names to be displayed in the same font size, or read at the same pace, as any benefits included in the ad. Third parties are prohibited from airing ads without the plan sponsors promoted in the ads agreeing to their content, and sponsors may be subject to penalties for endorsing ads that do not comply with CMS regulations.
Additional regulations include prohibiting the mention of unrealized “savings” calculated relative to the expenses borne by uninsured individuals, the unpaid costs of beneficiaries dually eligible for Medicare and Medicaid, or other unrealized costs of a Medicare beneficiary; prohibiting the use of superlatives such as “best” and “most” in marketing materials, taglines, or logos; and revising the disclaimer required for all third-party ads (described in the section above) to include State Health Insurance Assistance Programs (SHIPs) alongside Medicare.gov and 1-800-MEDICARE as a resource that beneficiaries can turn to for more information about their coverage options.
File & Use: Health insurers and third parties must submit all marketing materials to CMS for review before they can be aired, or in the case of some third parties, have them submitted by the insurer they represent. Until recently, CMS permitted TV ads to be submitted through its File & Use framework. Materials designated as File & Use may be aired five days after submission to CMS, though CMS reserves the right to review these materials for compliance both during and after this five-day window. Marketing materials that do not qualify for File & Use must be submitted forty-five days before they are aired, prospectively approved or disapproved during this timeframe, or “deemed approved” if no decision is reached within forty-five days. Beginning January 1st, 2023, in light of ongoing concerns, CMS no longer allows TV ads to be submitted as File & Use. Ads slated to air on October 1st, 2023 must be submitted to CMS by mid-August, allowing a longer window for prospective review.
Methods
Our data consist of 1,267 unique ads and 643,852 total airings, representing all English-language TV ads focused on Medicare that aired on broadcast television or national cable between October 1st, 2022 and December 7th, 2022. While the open enrollment period does not begin until October 15th each year, sponsors are permitted to advertise beginning October 1st. Ads were supplied to the Wesleyan Media Project by Vivvix (formerly Kantar) CMAG along with additional information on the timing of the airing, the media market, TV station, and broadcast network where it was aired, and the TV programming shown on the same station during that time slot. The Wesleyan Media Project compiled and processed all data flagged by Vivvix CMAG as relevant to our study, including ads classified as “Medical & Dental Insurance” or “Insurance Agencies & Brokers,” ads sponsored by the Department of Health and Human Services or AARP, and any ad with Medicare in the title.
In the first phase of processing, the Wesleyan Media Project used optical character recognition (OCR) to extract the textual information on screen and automatic speech recognition (ASR) to extract the audio into text for each video. Ads that did not contain the word Medicare in either OCR or ASR were removed from the set. The Wesleyan Media Project then assessed the degree of text similarity from the ASR data to identify advertising that was greater than 90% matching in audio content. Ads with 90% or higher similarity were grouped and only one ad per group was flagged for human coding (described below), along with any ads that did not match with others. Finally, the Wesleyan Media Project identified and removed Spanish-language advertising that ran on Spanish-language networks Telemundo, Unimas, and Univision. A secondary step to filter out Spanish-language advertising was conducted in the human coding stage. This left us with a final analytical set of 1,267 unique ads.
KFF and the Wesleyan Media Project then developed a coding instrument to analyze ad content. Key variables included in the instrument were those relevant to the evolving policy context surrounding Medicare marketing, such as the sponsor, Medicare products, and plans represented in each ad, as well as messaging on plan features, slogans or repeated phrases, activities and characteristics of people shown in the ad, websites and contact information, and use of the Medicare name, logo, or card.
Ten undergraduate student coders received training and completed four sets of practice ads prior to beginning live coding. A random sample of ads (20%) were double coded to assess intercoder reliability, and all Krippendorff’s alpha statistics were calculated for each variable. All results described in this report all met the 0.7 threshold for acceptable levels of reliability, with some exceptions noted below. For ads that included fine print, coders were asked to indicate whether they could read the fine print without pausing. While coder impressions are noted where relevant, this variable is not scientific, as monitor sizes vary, which affects readability. Coders were also asked to flag any ads that stood out to them as surprising, misleading, or notable in some other way and offer their qualitative impressions.
KFF analyzed the frequency of ad characteristics in the data as a whole, as well as by sponsor type, advertised product, and media market. Insurer sponsored ads were also analyzed by firm. KFF further reviewed a sample of ads in their entirety, including ads for which coders had given qualitative comments, to identify relevant examples of common messages, elements, and themes. Messages related to in-home support services, caregiver support, and bathroom safety devices were categorized as “other supplemental benefits” by our coding instrument. These were identified by coders in a free text field and reviewed by KFF as described, but were not formally assessed for intercoder reliability. Likewise, some characteristics, such as the message that beneficiaries were required to pay the standard Part B premium, appeared too rarely to meet the 0.7 threshold for acceptable intercoder reliability. In these cases, we noted that the characteristic was rare, but were not able to report its frequency with precision.
We focused much of our analysis on the substantial majority of ads promoting Medicare Advantage, the most common product advertised during the period.