Medicare Part D in 2024: A First Look at Prescription Drug Plan Availability, Premiums, and Cost Sharing
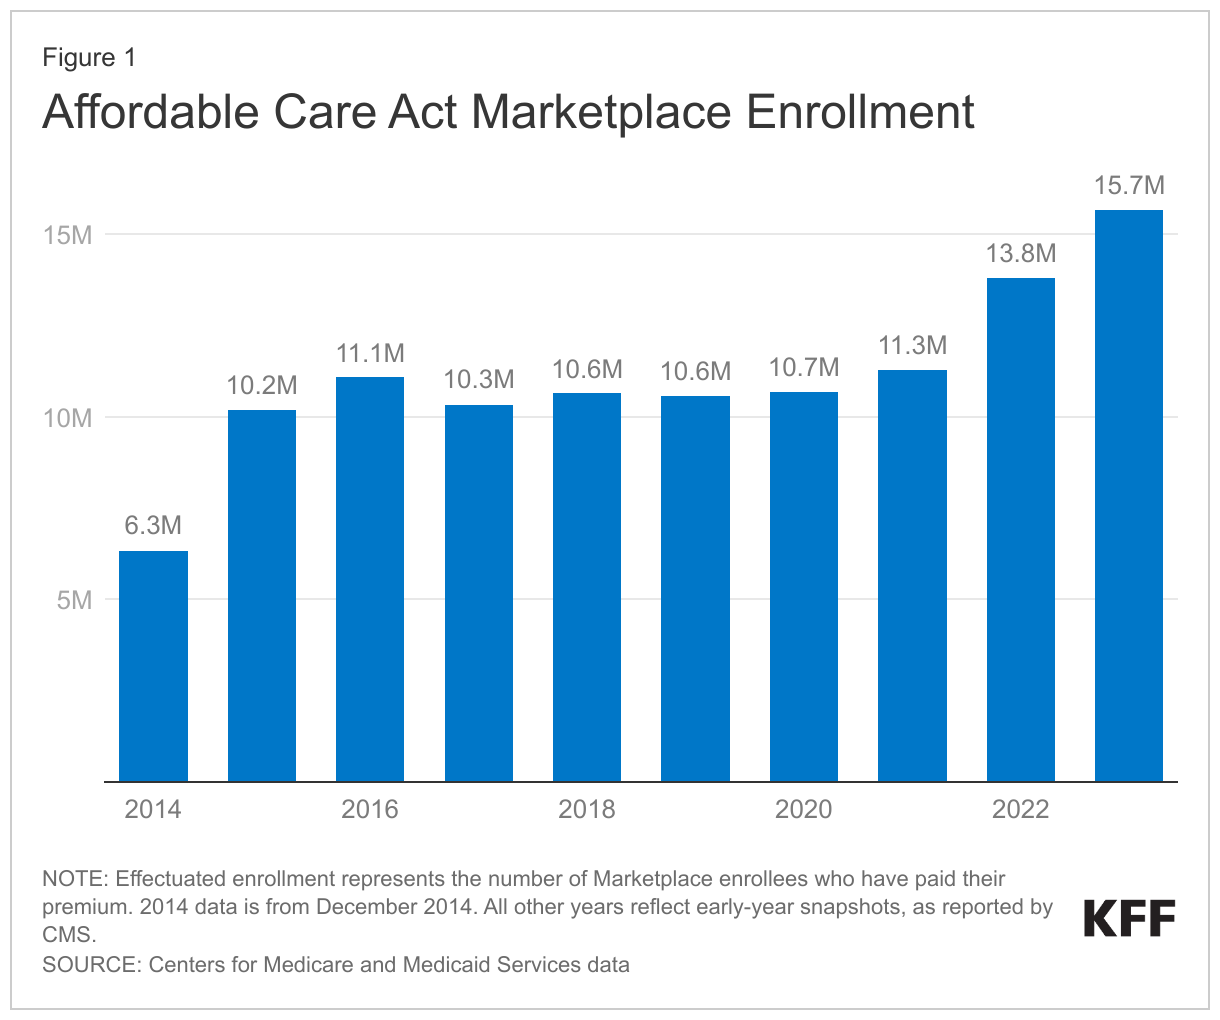
During the Medicare open enrollment period from October 15 to December 7 each year, people with Medicare can enroll in a plan that provides Part D prescription drug coverage, either a stand-alone prescription drug plan (PDP) for people in traditional Medicare, or a Medicare Advantage plan that covers all Medicare benefits, including prescription drugs (MA-PD). In 2023, 50.5 million of the 66 million people covered by Medicare are enrolled in Part D plans, with more than half (56%) enrolled in MA-PDs and 44% in PDPs. This issue brief provides an overview of Part D plan availability and premiums in 2024 and key trends over time. (An overview of the 2024 Medicare Advantage market is also available.) (See Methods box for details on the analysis).
Part D Highlights for 2024
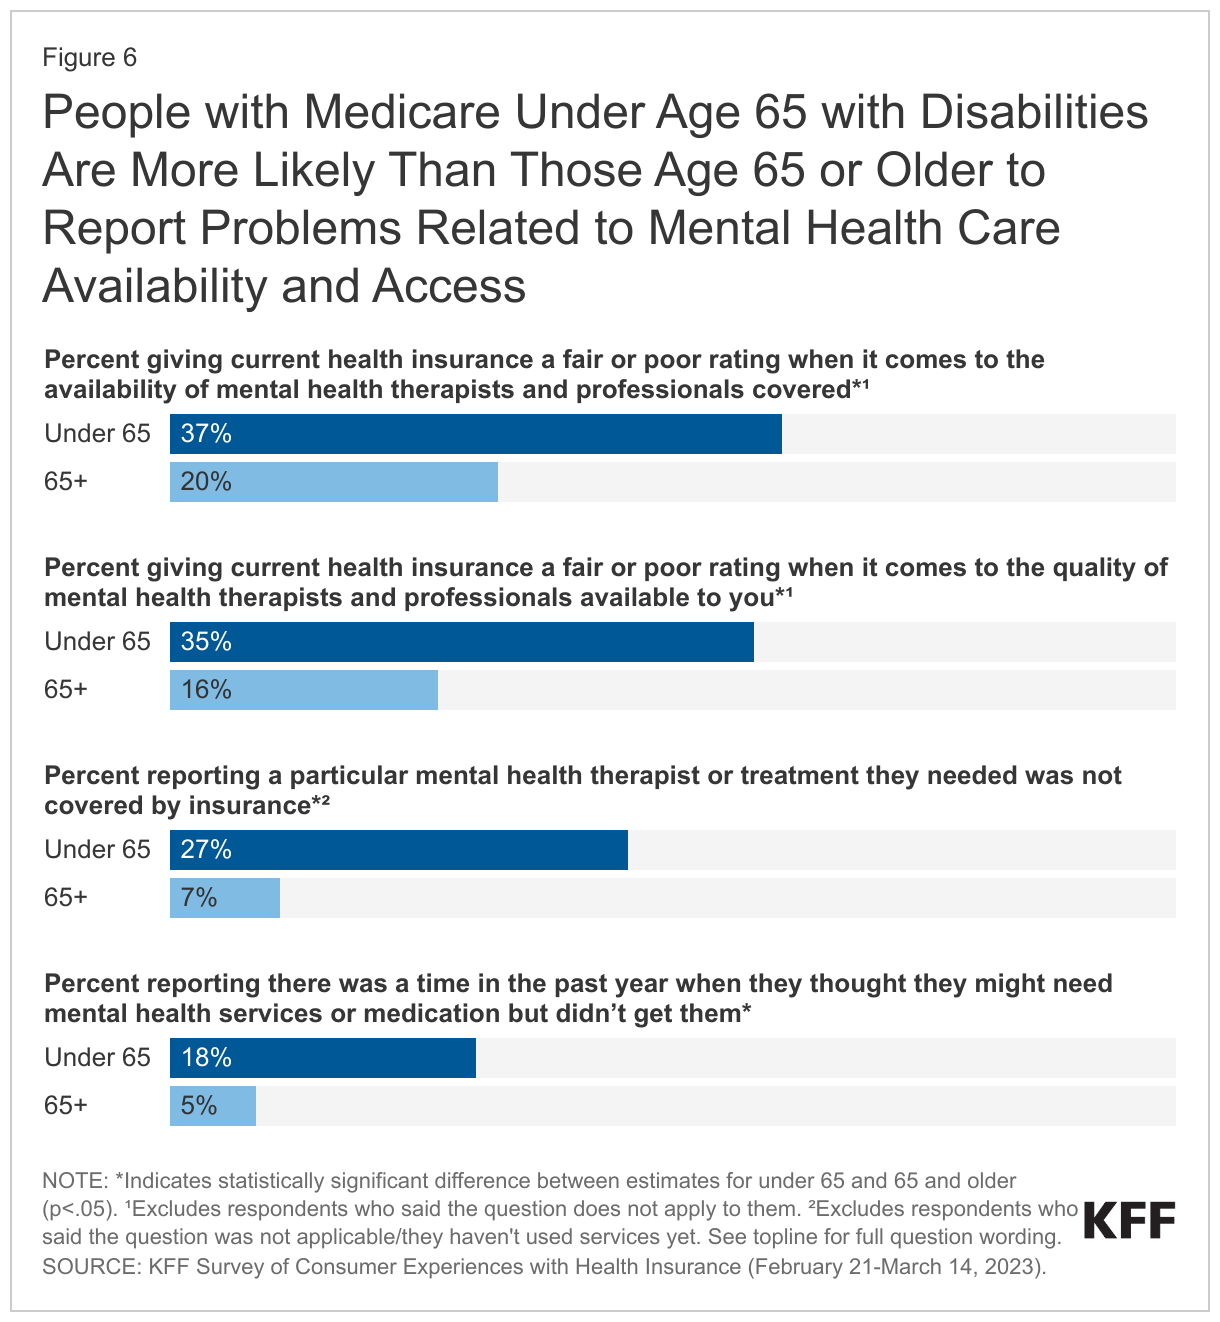
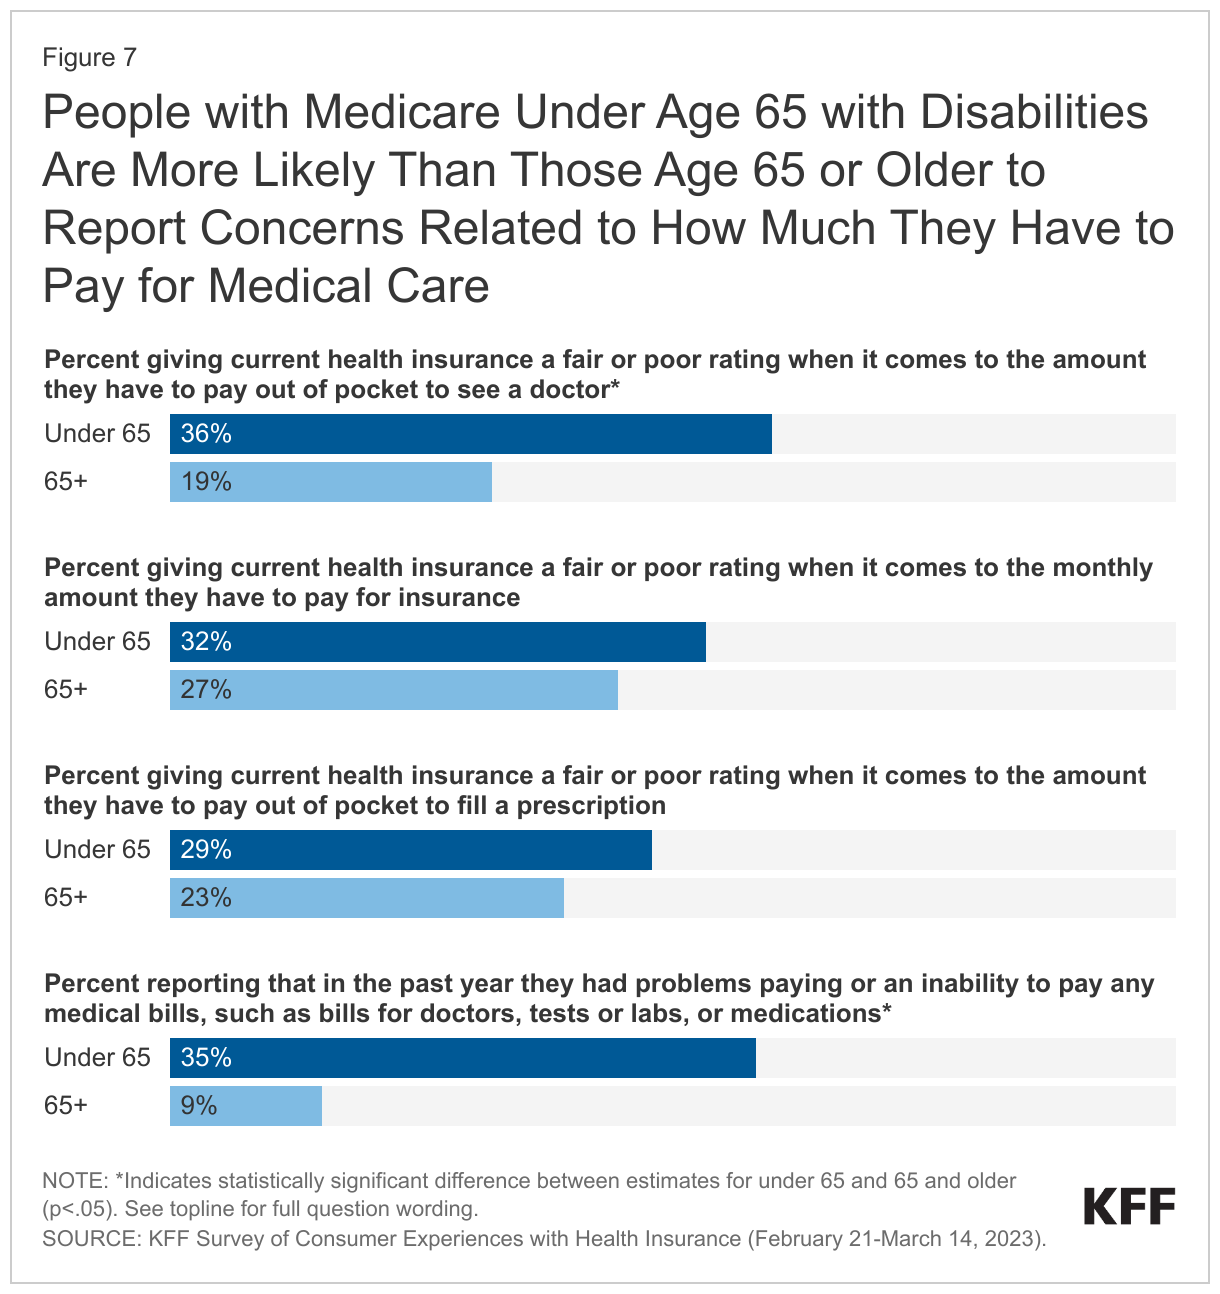
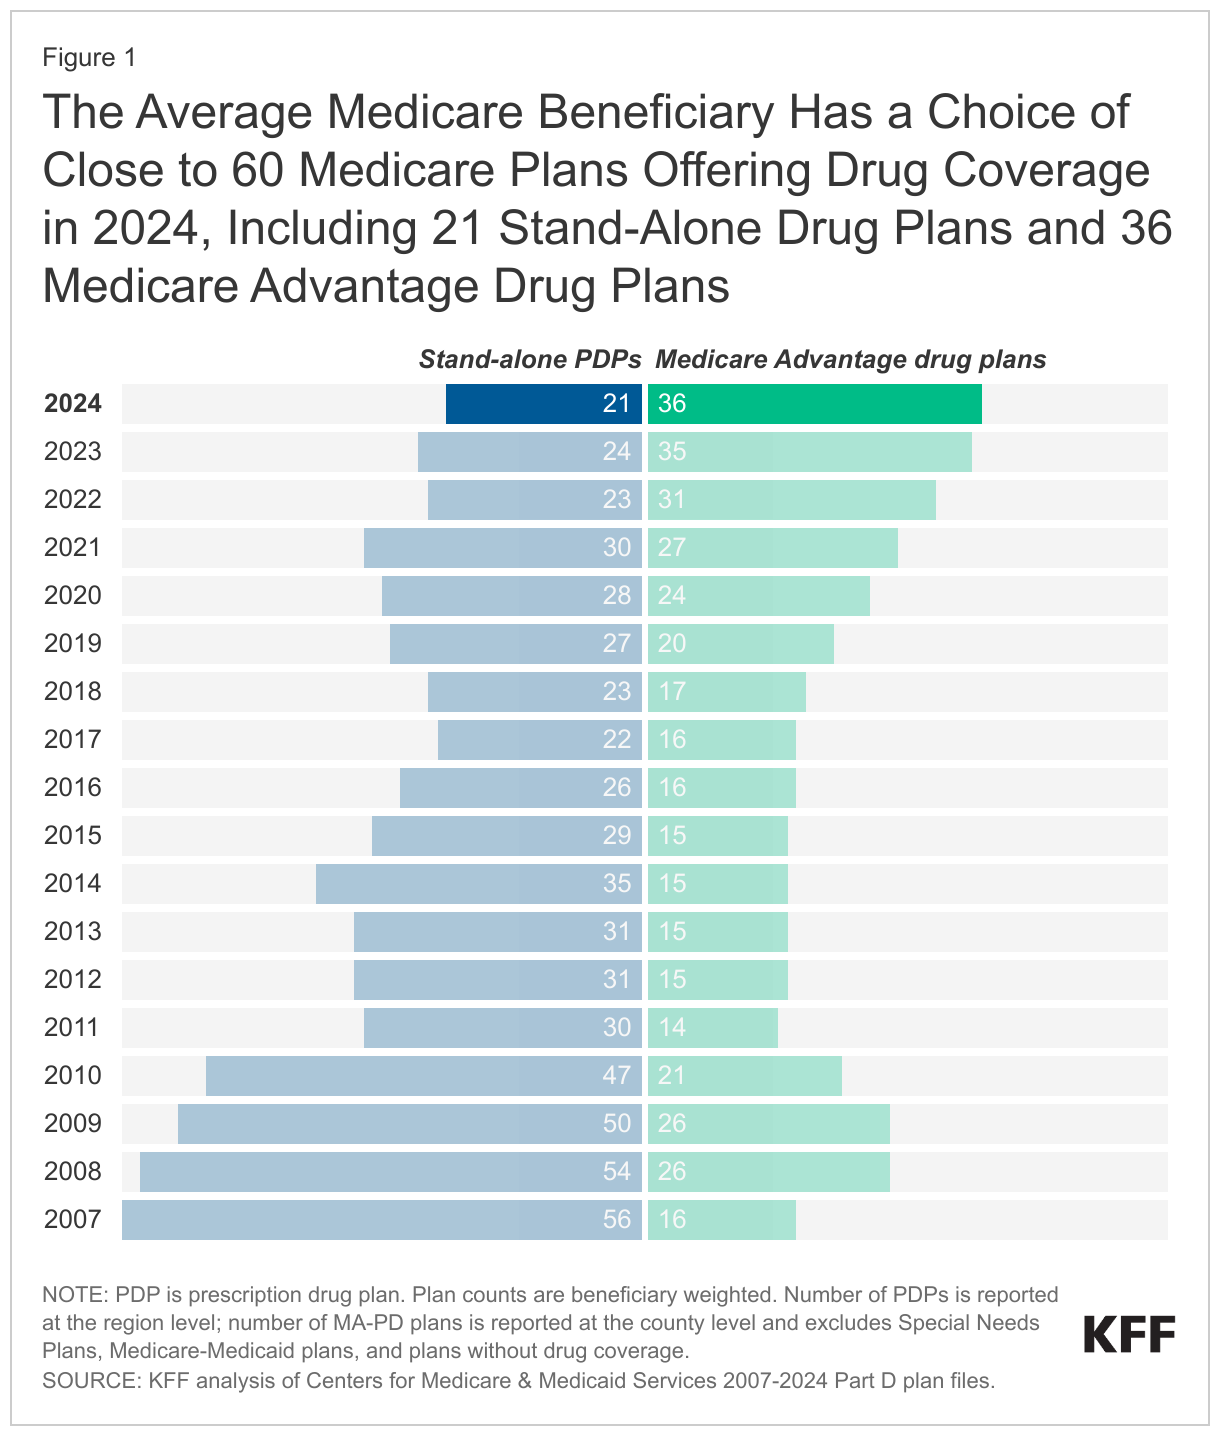
- The average Medicare beneficiary has a choice of close to 60 Medicare plans with Part D drug coverage in 2024, including 21 Medicare stand-alone drug plans and 36 Medicare Advantage drug plans. While the market for Part D coverage overall remains robust, the number of PDP options for 2024 is lower and the number of MA-PD options is higher than in any other year since Part D started. The total number of PDPs (709) and firms offering these plans (11) have decreased from 2023.
- Medicare beneficiaries who receive Part D Low-Income Subsidies (LIS) will have access to fewer so-called “benchmark” PDPs in 2024 than in any year since Part D started, with three benchmark plans available out of the average 21 PDPs available overall for 2024. Benchmark plans are PDPs available to LIS enrollees for no monthly premium. The reduction in the number of benchmark plans for 2024 is largely the result of PDPs offered by Cigna, Humana, and CVS Health qualifying as benchmark plans in far fewer regions in 2024 compared to 2023. An estimated 2.4 million LIS enrollees – half of all LIS enrollees in PDPs – need to switch plans during the 2023 open enrollment period if they want to be enrolled in a benchmark plan in 2024.
- Although the Inflation Reduction Act included a premium stabilizationprovision that capped annual growth in the Part D base beneficiary premium at 6%, the law did not apply this 6% cap to individual plan premiums that enrollees pay. The Part D base beneficiary premium of $34.70 for 2024 is based on standardized bids submitted by PDPs and MA-PDs to cover basic Part D benefits in 2024, while actual Part D plan premiums vary across plans and may be higher or lower than the base beneficiary premium, depending on several factors. The estimated average enrollment-weighted monthly premium for Medicare Part D stand-alone drug plans is projected to be $48 in 2024, based on current enrollment, up 21% from $40 in 2023. This increase is driven by higher expected plan costs to provide the Part D benefit in 2024, including a new cap on enrollees’ out-of-pocket spending above the catastrophic threshold rather than requiring them to pay 5% coinsurance, as in prior years. After accounting for enrollment choices by new enrollees and plan changes by current enrollees, the actual average weighted PDP premium for 2024 is likely to be lower than the estimated weighted average of $48.
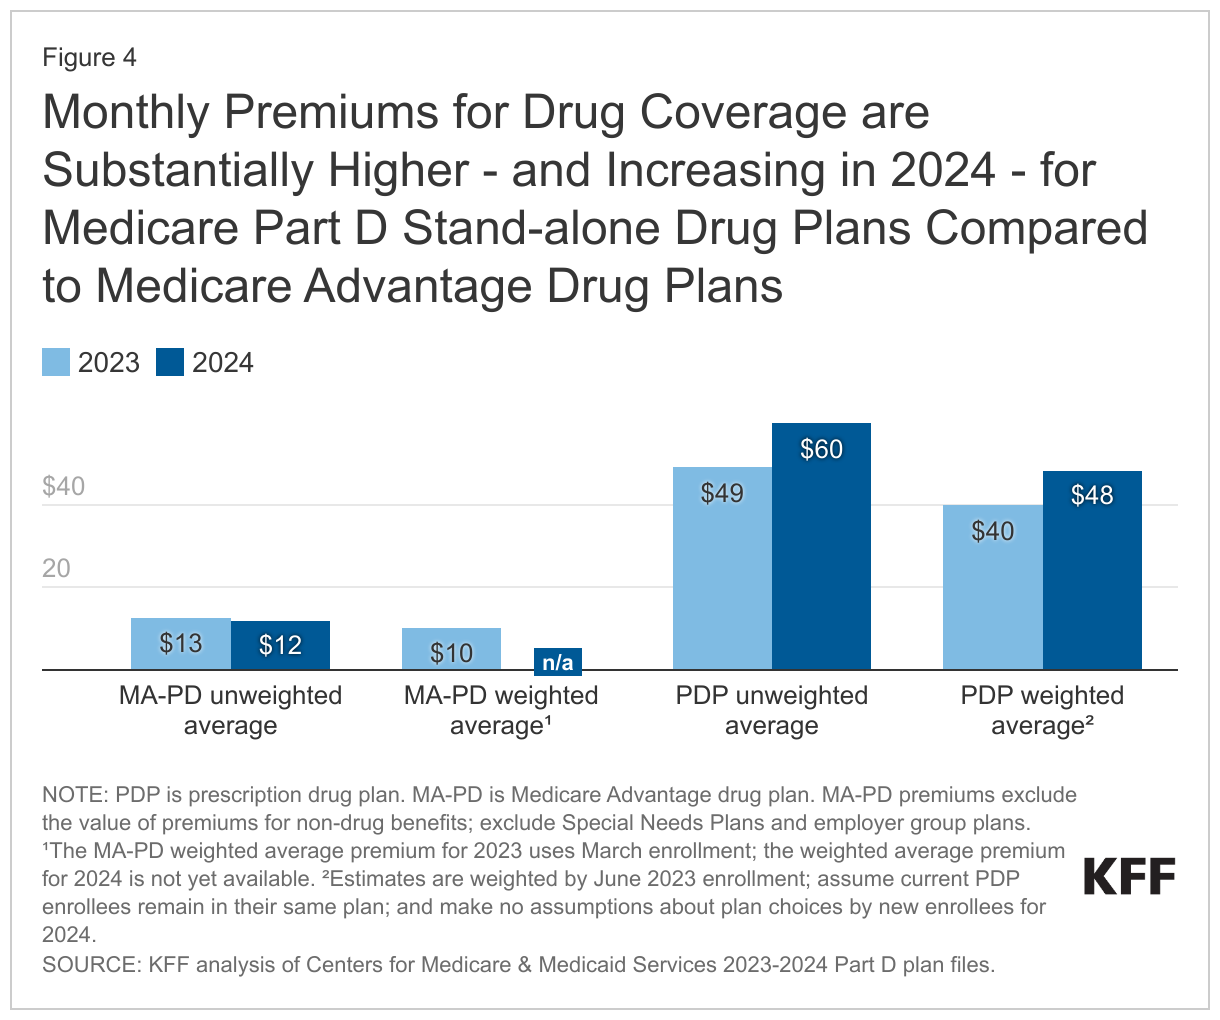
- Monthly premiums for drug coverage are substantially higher for PDPs compared to MA-PDs – five times higher, on average, in 2024 (based on unweighted amounts). While the average premium is projected to increase between 2023 and 2024 for PDPs, it is expected to remain stable (and low, or even zero) for MA-PDs. MA-PD sponsors can use rebate dollars from Medicare payments to lower or eliminate their Part D premiums, but there is no equivalent rebate system for PDPs.
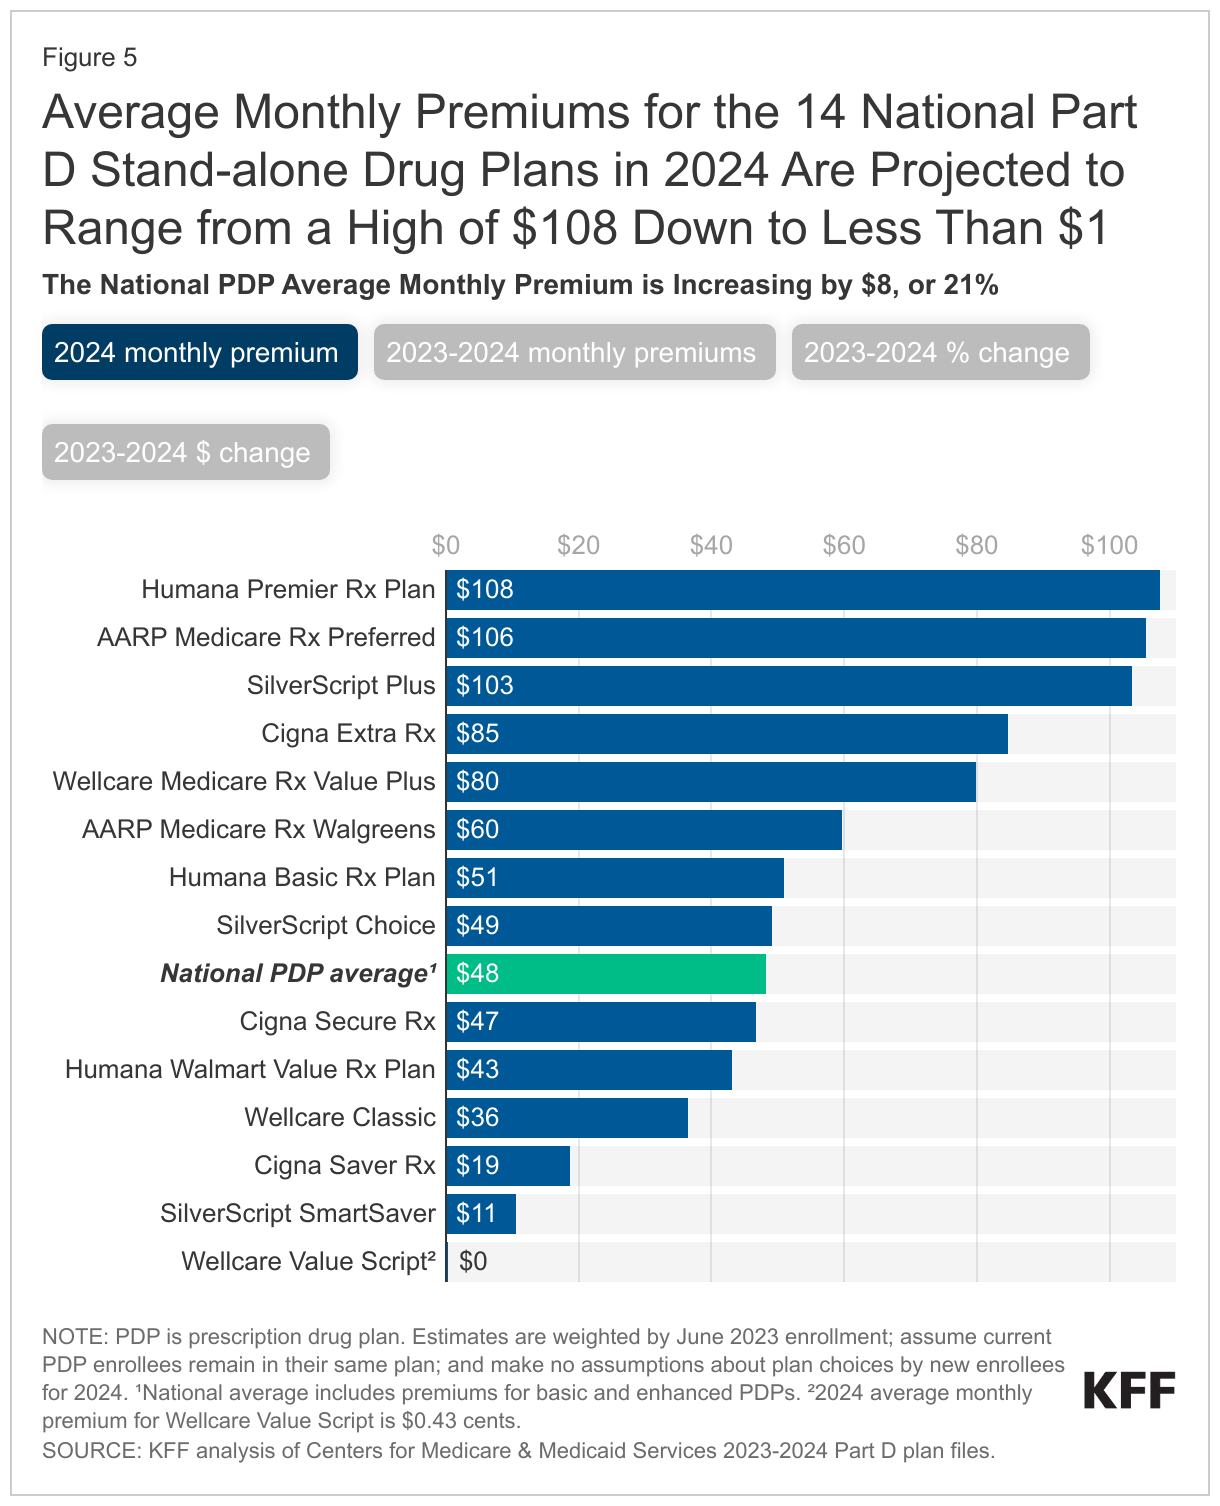
- Average monthly premiums for the 14 national PDPs are projected to range from under $1 to $108 in 2024. Premium variation across plans is in part related to whether plans offer basic or enhanced benefits and the value of benefits offered, as well as variation in the underlying costs that plans incur for their enrollees. Among the national PDPs, average monthly premiums are increasing for 12 PDPs, including 4 PDPs with increases greater than $20 and 3 with increases between $10 and $20.
- Most PDP enrollees will face much higher cost sharing for brands than for generic drugs in 2024, as in prior years, including coinsurance for non-preferred drugs of 50% (the maximum coinsurance rate allowed for the non-preferred drug tier) in 6 of the 14 national PDPs. PDP enrollees in 9 of the 14 national PDPs will also face coinsurance, rather than copays, for preferred brands, ranging from 15% to 25%, and coinsurance for specialty tier drugs ranging from 25% in 7 of the national PDPs to 33% in 2 national PDPs. Coinsurance can mean less predictable out-of-pocket costs than copayments. In a change from prior years, however, beneficiaries in 2024 will no longer be required to pay 5% coinsurance once they qualify for catastrophic coverage, due to a provision in the Inflation Reduction Act that eliminated this cost-sharing requirement.
Part D Plan Availability
For 2024, the Average Medicare Beneficiary Has Fewer Stand-alone Drug Plan Options Than in Prior Years but More Medicare Advantage Drug Plan Options
The Part D market for 2024 offers the average Medicare beneficiary fewer choices for drug coverage from stand-alone prescription drug plans than in prior years but more choices for coverage from Medicare Advantage drug plans. The average Medicare beneficiary has a choice of close to 60 options for Part D coverage in 2024, including 21 PDPs and 36 MA-PDs (Figure 1). Since 2020, the number of PDPs available to the average beneficiary has decreased by 25% while the number of MA-PDs has increased by 57%.
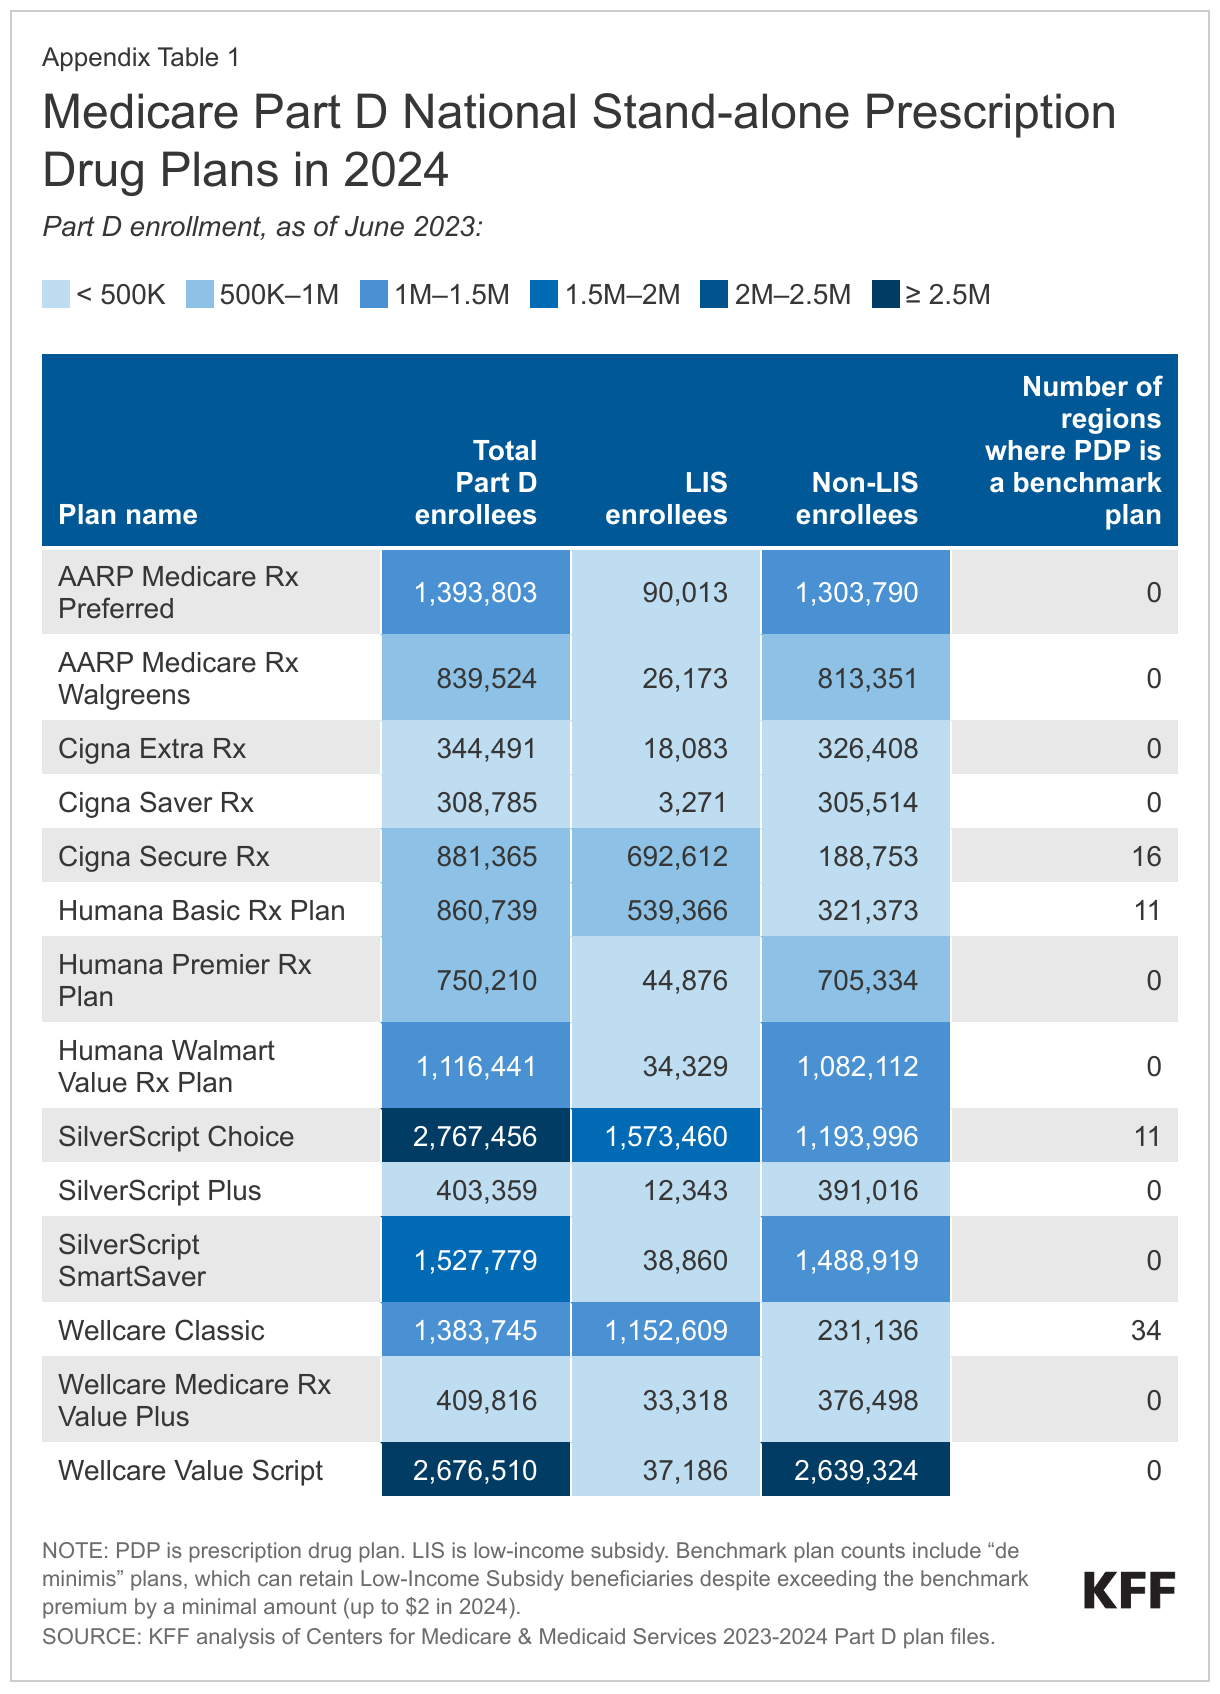
Of the 21 PDPs available to the average beneficiary in 2024, 14 are national PDPs – that is, available in all 34 PDP regions nationwide (Appendix Table 1). This is a reduction of two national PDPs from 2023, the result of one plan sponsor (Elixir Insurance) pulling out of the Part D market entirely and an AARP-branded PDP sponsored by UnitedHealthcare no longer being offered in all 34 regions in 2024. The 270,000 enrollees in Elixir’s PDPs (as of March 2023) will need to select a new Part D plan from a different plan sponsor during the 2023 open enrollment period if they want their Part D coverage to continue in 2024.
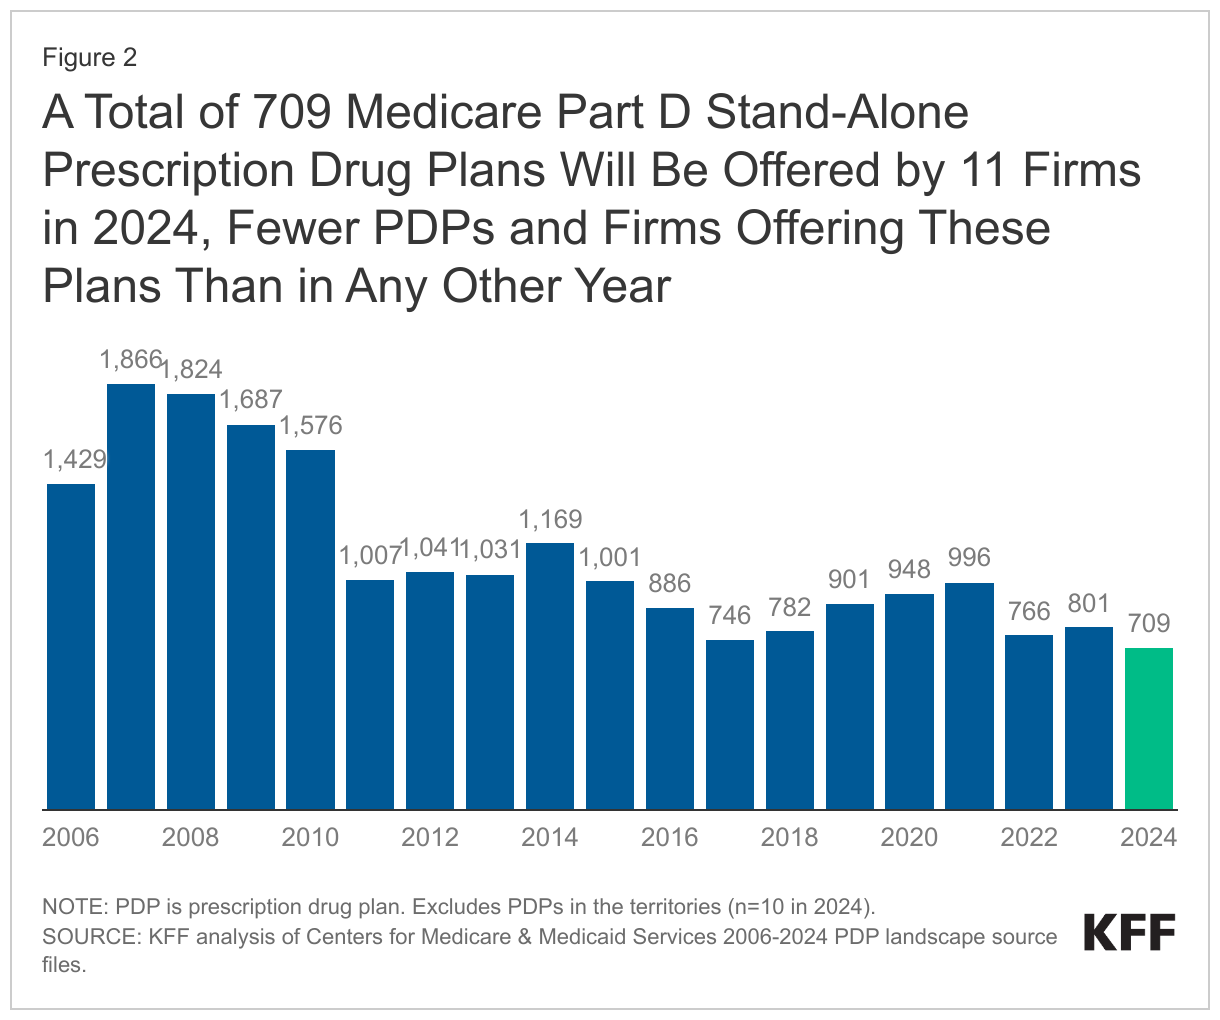
A Total of 709 Medicare Part D Stand-Alone Prescription Drug Plans Will Be Offered by 11 Firms in 2024, the Lowest Number of PDPs and Firms Offering These Plans Since Part D Started
In 2024, a total of 709 PDPs will be offered by 11 firms in the 34 PDP regions (plus another 10 PDPs in the territories), a decrease of 92 PDPs (-11%) from 2023, and the lowest number of PDPs available in any year since Part D started in 2006 (Figure 2). The number of firms sponsoring stand-alone drug plans is decreasing from 15 firms in 2023 to 11 firms in 2024, the smallest number since the Medicare benefit was launched in 2006.
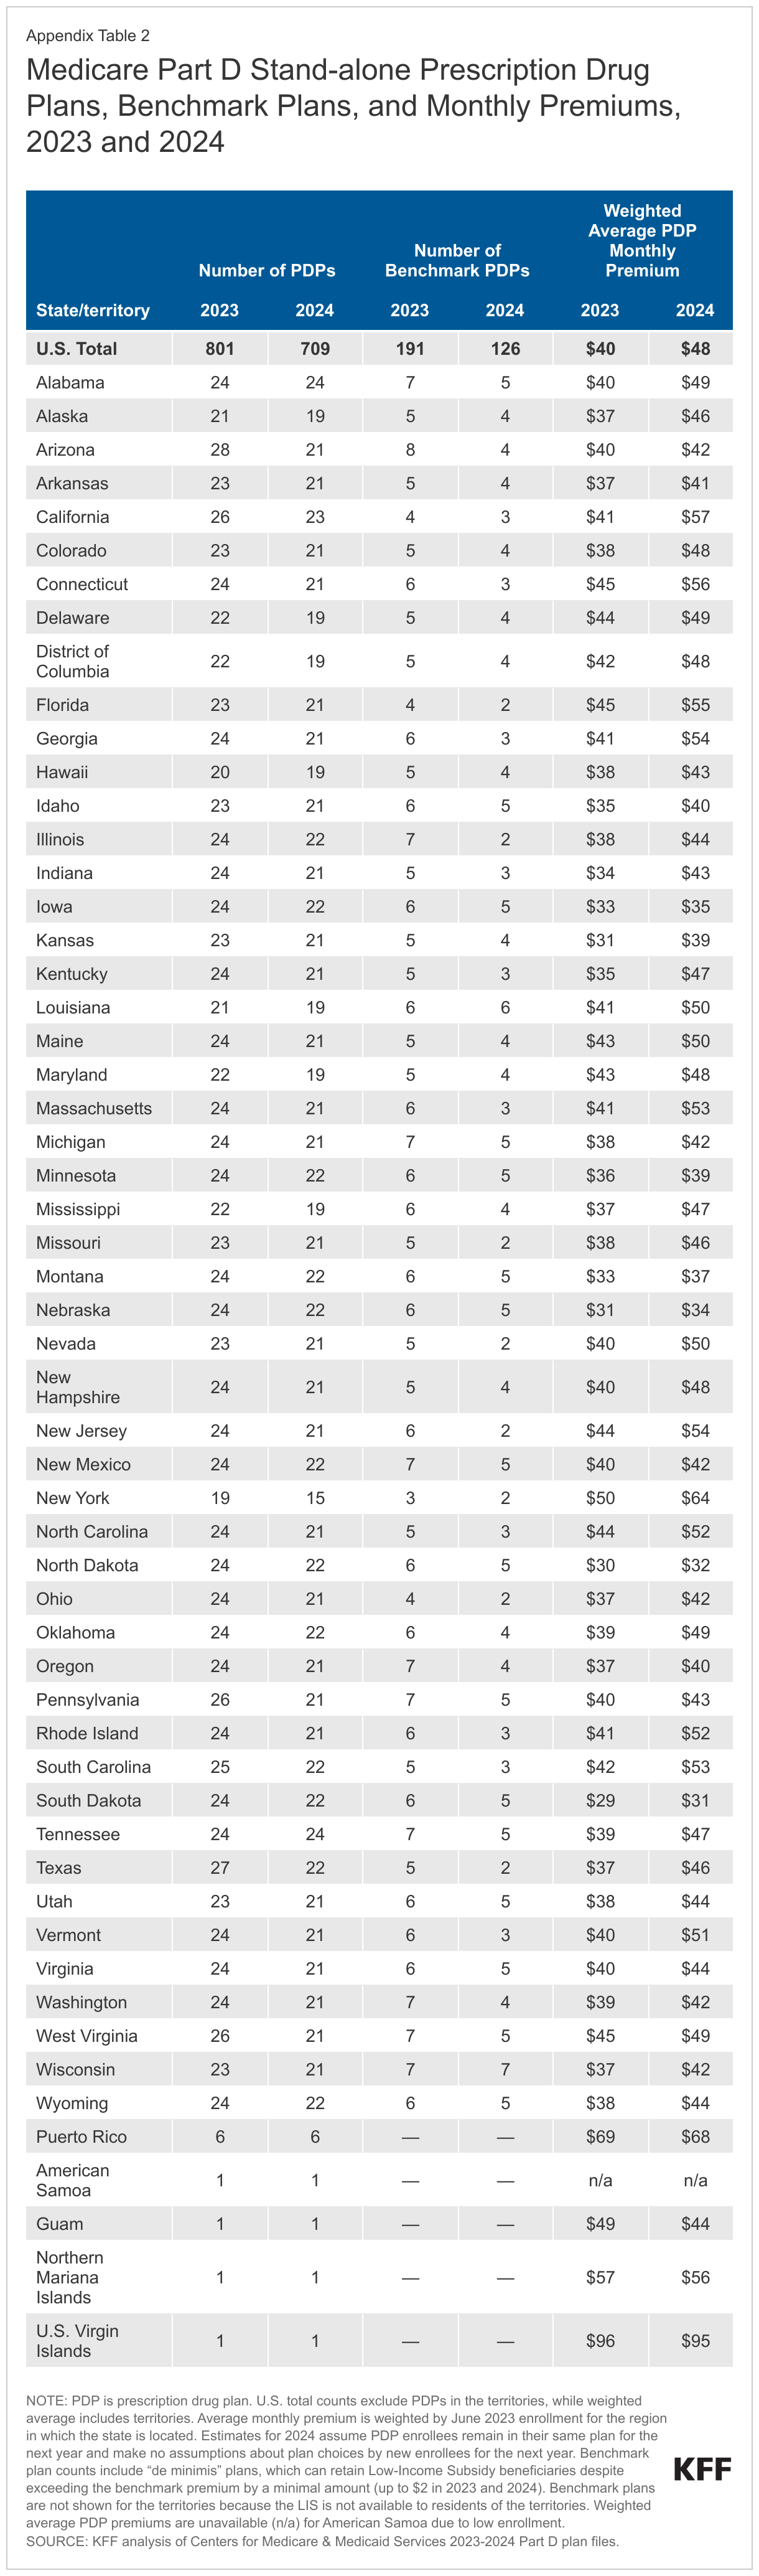
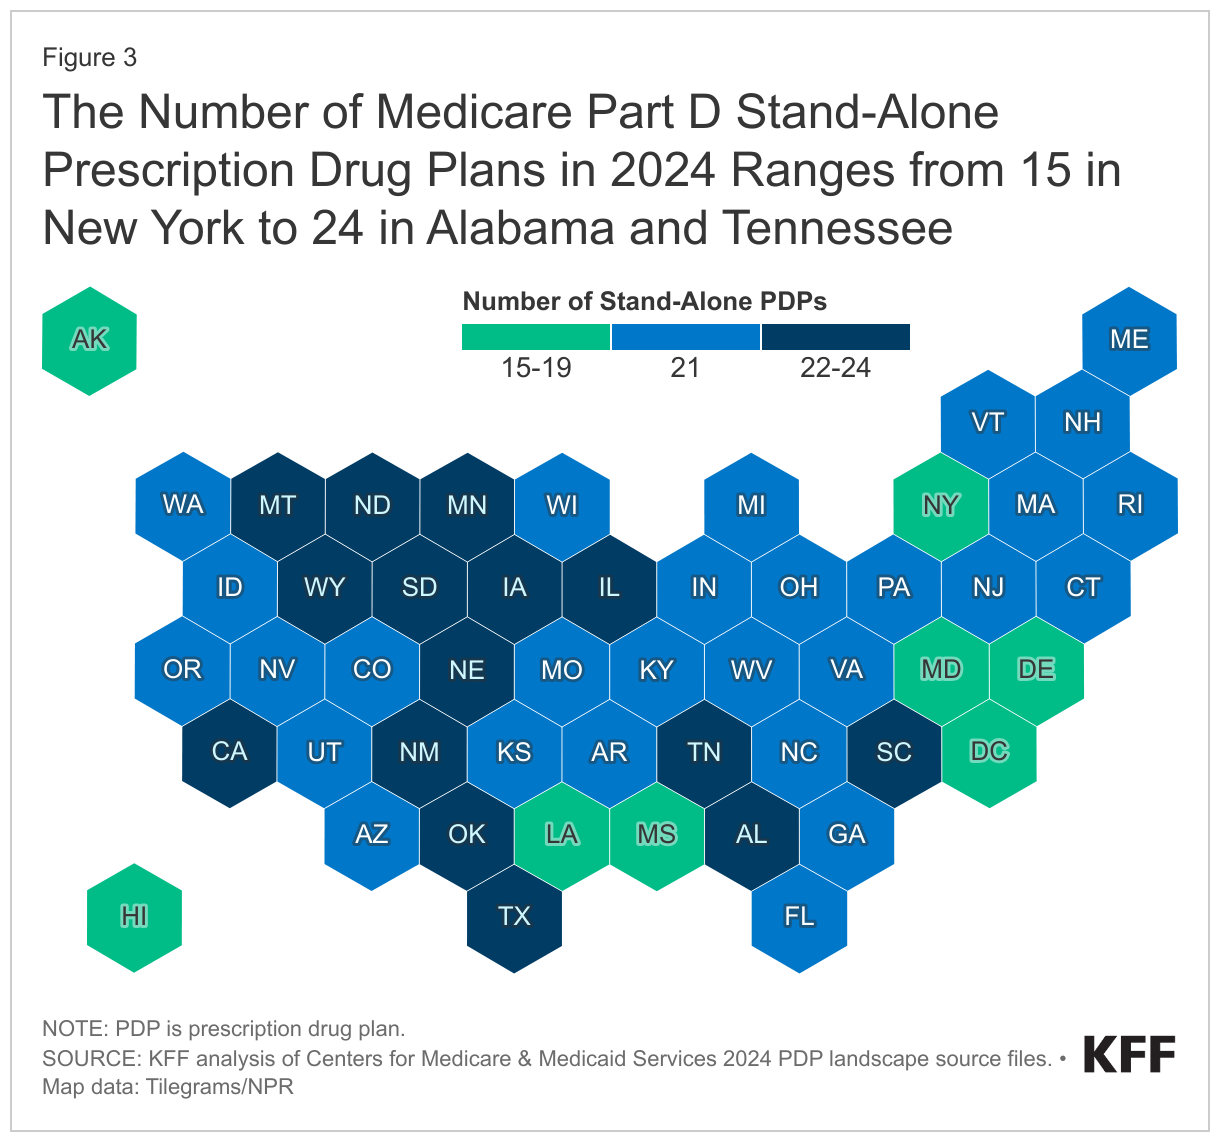
Despite the reduction in PDP availability overall, beneficiaries in each state will have a choice of multiple PDPs, ranging from 15 PDPs in New York to 24 PDPs in Alabama and Tennessee, plus multiple MA-PDs offered at the local level (Figure 3, Appendix Table 2).
Premiums
Although the Inflation Reduction Act included a premium stabilization provision that capped annual growth in the Part D base beneficiary premium at 6% beginning in 2024, the base beneficiary premium is not the same as the amount that Part D enrollees pay for coverage, and the law did not cap the growth in individual plan premiums to 6%. The Part D base beneficiary premium of $34.70 for 2024 is based on standardized bids submitted by PDPs and MA-PDs to cover basic Part D benefits in 2024. (Absent the premium stabilization provision, the 2024 base beneficiary premium would have increased by 20% to $39.35, reflecting a higher average plan bid for offering Part D coverage in 2024 compared to 2023.) Actual Part D plan premiums for 2024 vary across plans, may be higher or lower than the base beneficiary premium, and may be increasing by more or less than 6% (or even decreasing).
The estimated national average monthly PDP premium is projected to be $48 in 2024, a 21% increase from $40 in 2023, weighted by June 2023 enrollment. This higher average projected premium is driven by higher expected plan costs to provide the Part D benefit in 2024, including a new cap on enrollees’ out-of-pocket spending above the catastrophic threshold rather than requiring them to pay 5% coinsurance, as in prior years. This change is based on a provision in the Inflation Reduction Act.
Comparing monthly premiums for Part D coverage between stand-alone PDPs and MA-PDs shows the competitive advantage that MA-PDs have over PDPs when it comes to the premiums that enrollees pay for drug coverage. On an unweighted basis, monthly premiums for drug coverage are substantially higher for PDPs compared to MA-PDs – five times higher, on average in 2024 ($60 vs. $12) (Figure 4). Moreover, between 2023 and 2024, the unweighted average premium is increasing for PDPs, while remaining stable for MA-PDs. MA-PD sponsors can use rebate dollars from Medicare payments to lower or eliminate their Part D premiums and/or offer other extra benefits, but there is no equivalent rebate system for PDPs. According to MedPAC, Medicare Advantage monthly rebates per enrollee have more than doubled over the last five years, from $95 in 2018 to $196 in 2023.
It is likely that, after accounting for enrollment choices by new enrollees and plan changes by current enrollees, the actual average weighted PDP premium for 2024 will be lower than the estimated weighted average of $48 but well above the average MA-PD premium. In 2023, the enrollment-weighted average monthly portion of the premium for drug coverage in MA-PDs is $10, compared to $40 for PDPs.
Average Monthly Premiums for the 14 National PDPs Are Projected to Range from Less Than $1 to $108 in 2024
PDP premiums will vary widely across plans in 2024, as in previous years. Among the 14 national PDPs, there is a difference of more than $1,200 in average annual premiums between the highest-premium PDP and the lowest-premium PDP. At the high end, the monthly premium for Humana Premier Rx Plan (the 10th largest plan by overall enrollment) will be $108, totaling nearly $1,300 annually. At the low end, the monthly premium for Wellcare Value Script (the second largest plan) will average $0.40, or $5 annually (Figure 5). In addition to Humana Premier Rx Plan, two other national PDPs will charge monthly premiums of more than $100 in 2024: AARP Medicare Rx Preferred, the fourth largest plan ($106), and CVS Health’s SilverScript Plus, the 12th largest plan ($103).
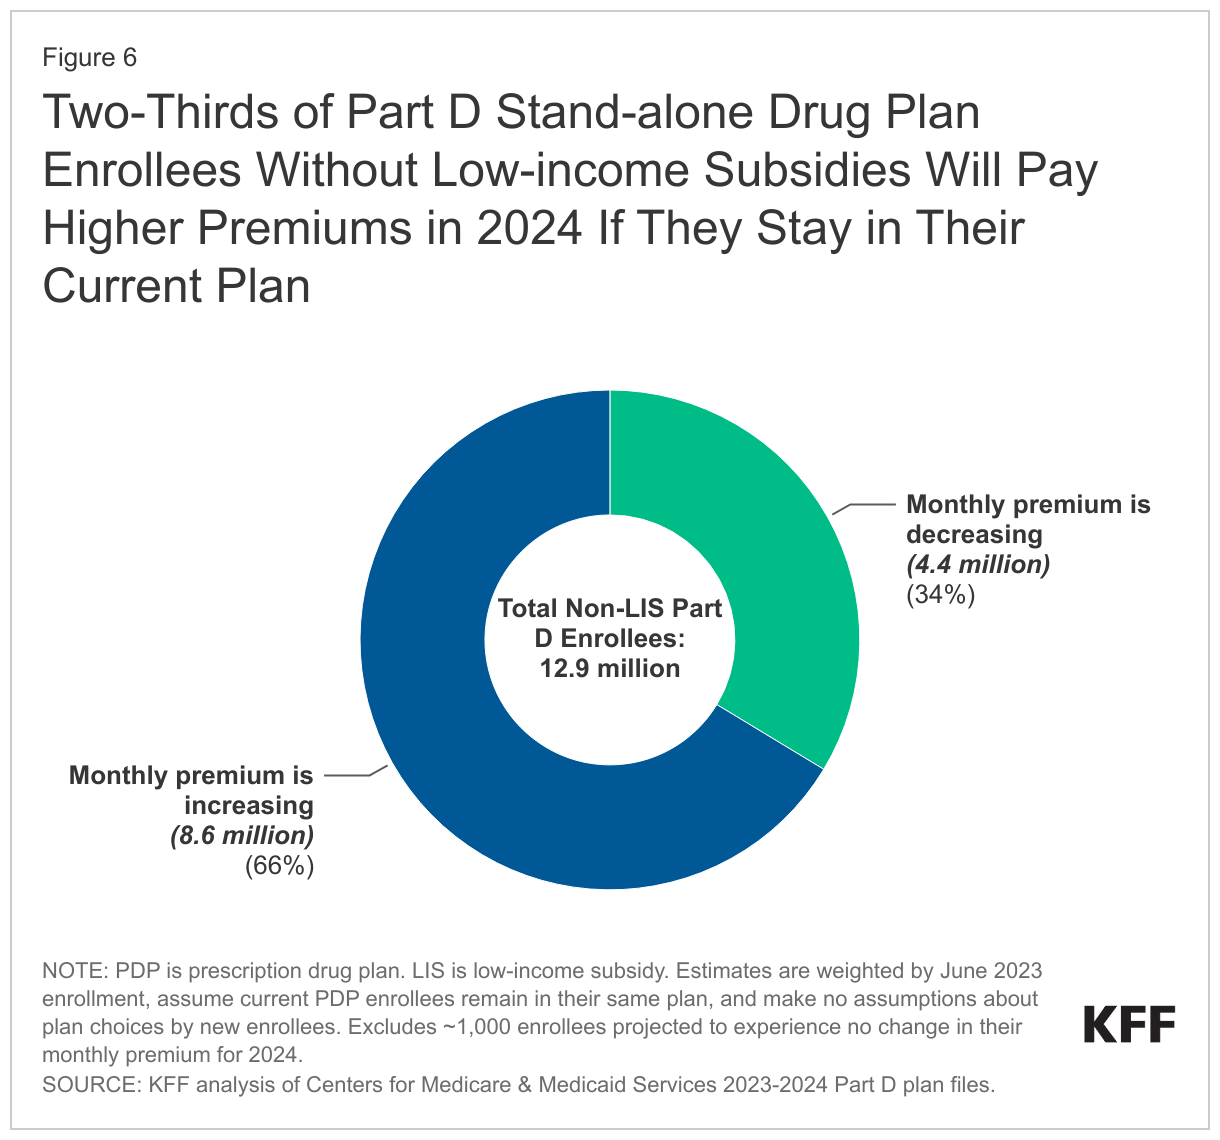
Two-Thirds of Part D Stand-alone Drug Plan Enrollees Without Low-income Subsidies Will Pay Higher Premiums in 2024 If They Stay in Their Current Plan
Two-thirds of Part D stand-alone plan enrollees (66%) – 8.6 million of the 12.9 million Part D PDP enrollees who are responsible for paying the entire premium (which excludes Low-Income Subsidy (LIS) recipients) – will see their monthly premium increase in 2024 if they stay in their current plan, while 4.4 million (34%) will see a premium reduction if they stay in their current plan (Figure 6).
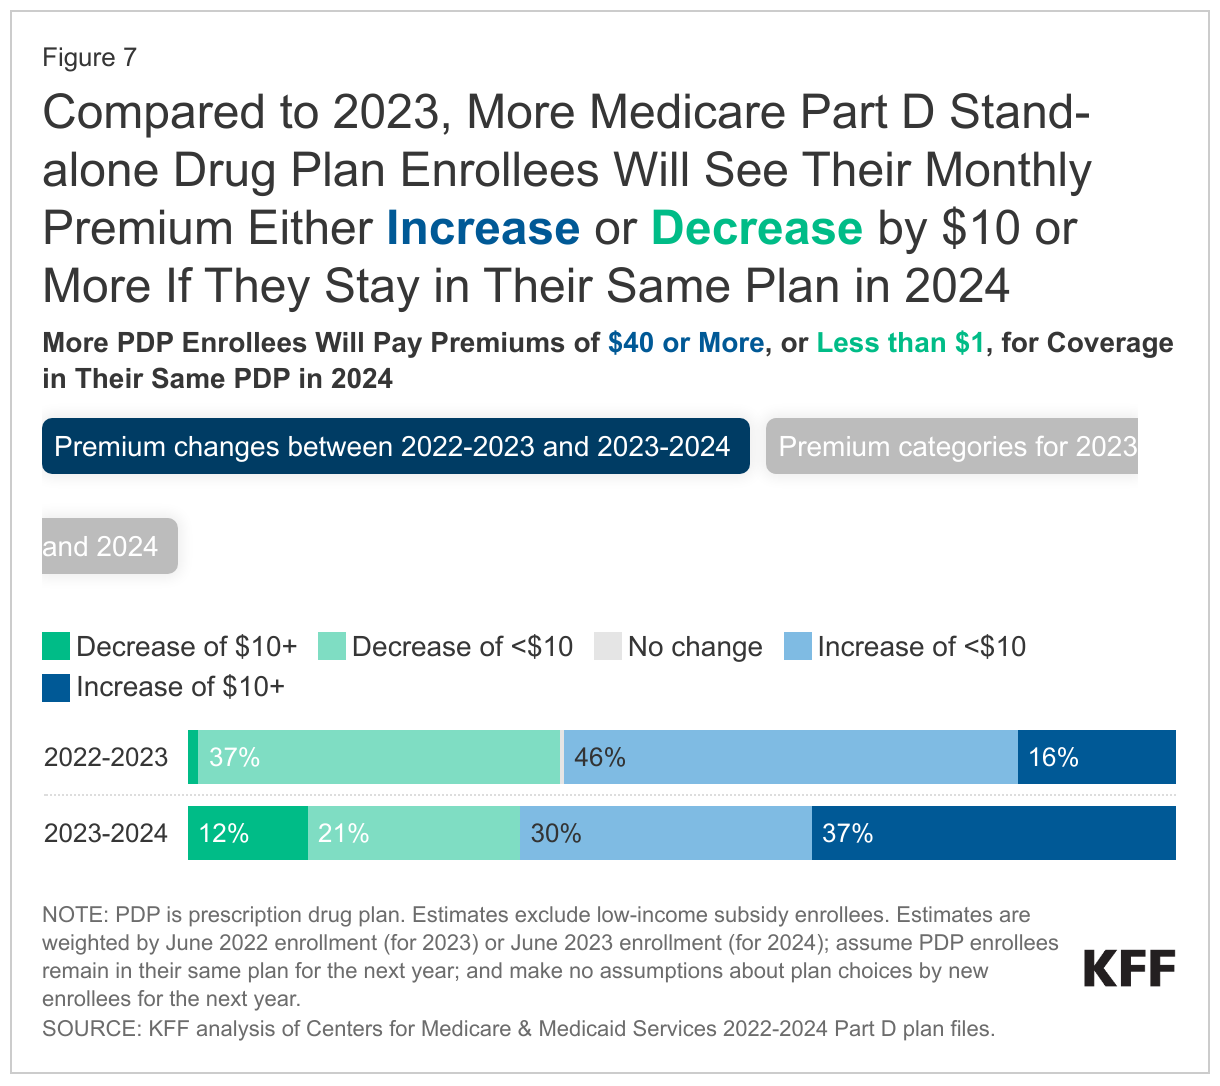
Compared to 2023, more Medicare Part D stand-alone drug plan enrollees will see their monthly premium either increase or decrease by $10 or more if they stay in their same plan in 2024 (Figure 7). For 2024, 4.8 million non-LIS PDP enrollees (37%) will see a premium increase of $10 or more per month – or at least $120 more annually if they remain in their current plan – compared to 2.1 million enrollees (16%) in 2023.
Among the 14 national PDPs, average monthly premiums are increasing for 12 PDPs, including 7 PDPs (having a combined 3.9 million non-LIS enrollees) with increases exceeding $10:
- AARP Medicare Rx Walgreens (+$30, from $30 to $60)
- SilverScript Plus (+$29, from $74 to $103)
- Humana Premier Rx (+$25, from $83 to $108)
- Cigna Extra Rx (+$22, from $63 to $85)
- SilverScript Choice (+$16, from $33 to $49)
- Cigna Secure Rx (+$14, from $33 to $47)
- Humana Basic Rx Plan (+$14, from $37 to $51)
Another 1.6 million non-LIS PDP enrollees (12%) will see a monthly premium reduction of $10 or more for 2024, compared to under 150,000 (1%) for 2023. This largely reflects a premium reduction for the second largest PDP, Wellcare Value Script, where the average monthly premium will decrease by $9, from $10 in 2023 to less than $1 in 2024. These amounts are averaged over the 34 PDP regions; enrollees in this plan in 16 of the 34 regions will see a premium reduction of $10 or more.
Over half (56%) of non-LIS enrollees (7.3 million) are projected to pay monthly premiums of at least $40 if they stay in their current plans, or nearly $500 annually, including 2.1 million (16% of non-LIS enrollees) projected to pay monthly premiums of at least $100, or at least $1,200 annually. These estimates are higher than the comparable estimates for 2023, when 40% of non-LIS PDP enrollees (5.3 million) were projected to pay at least $40 per month, including 1.6 million paying $100 or more, if they stayed in their plans.
Cost Sharing
Part D Enrollees Pay Much Higher Cost Sharing for Brands and Non-preferred Drugs Than for Generic-Tier Drugs, and a Mix of Copays and Coinsurance for Different Formulary Tiers
In 2024, as in prior years, Part D enrollees will face much higher cost-sharing amounts for brands and non-preferred drugs (which can include both brands and generics) than for drugs on a generic tier, and a mix of copayments and coinsurance for different formulary tiers. The typical five-tier formulary design in Part D includes tiers for preferred generics, generics, preferred brands, non-preferred drugs, and specialty drugs.
Among all PDPs, median standard cost sharing in 2024 for different types of drugs is (Figure 8):
- Generics: $0 for preferred generics and $5 for other generics
- Preferred brands: a copayment of $47 or coinsurance of 21% for preferred brands (up from $44/17% in 2023)
- Non-preferred drugs: 46% coinsurance for non-preferred drugs, which can include both brands and generics (an increase from 45% in 2023; the maximum allowed is 50%)
- Specialty drugs: 25% coinsurance for specialty drugs (the same as in 2023; the maximum allowed is 33%)
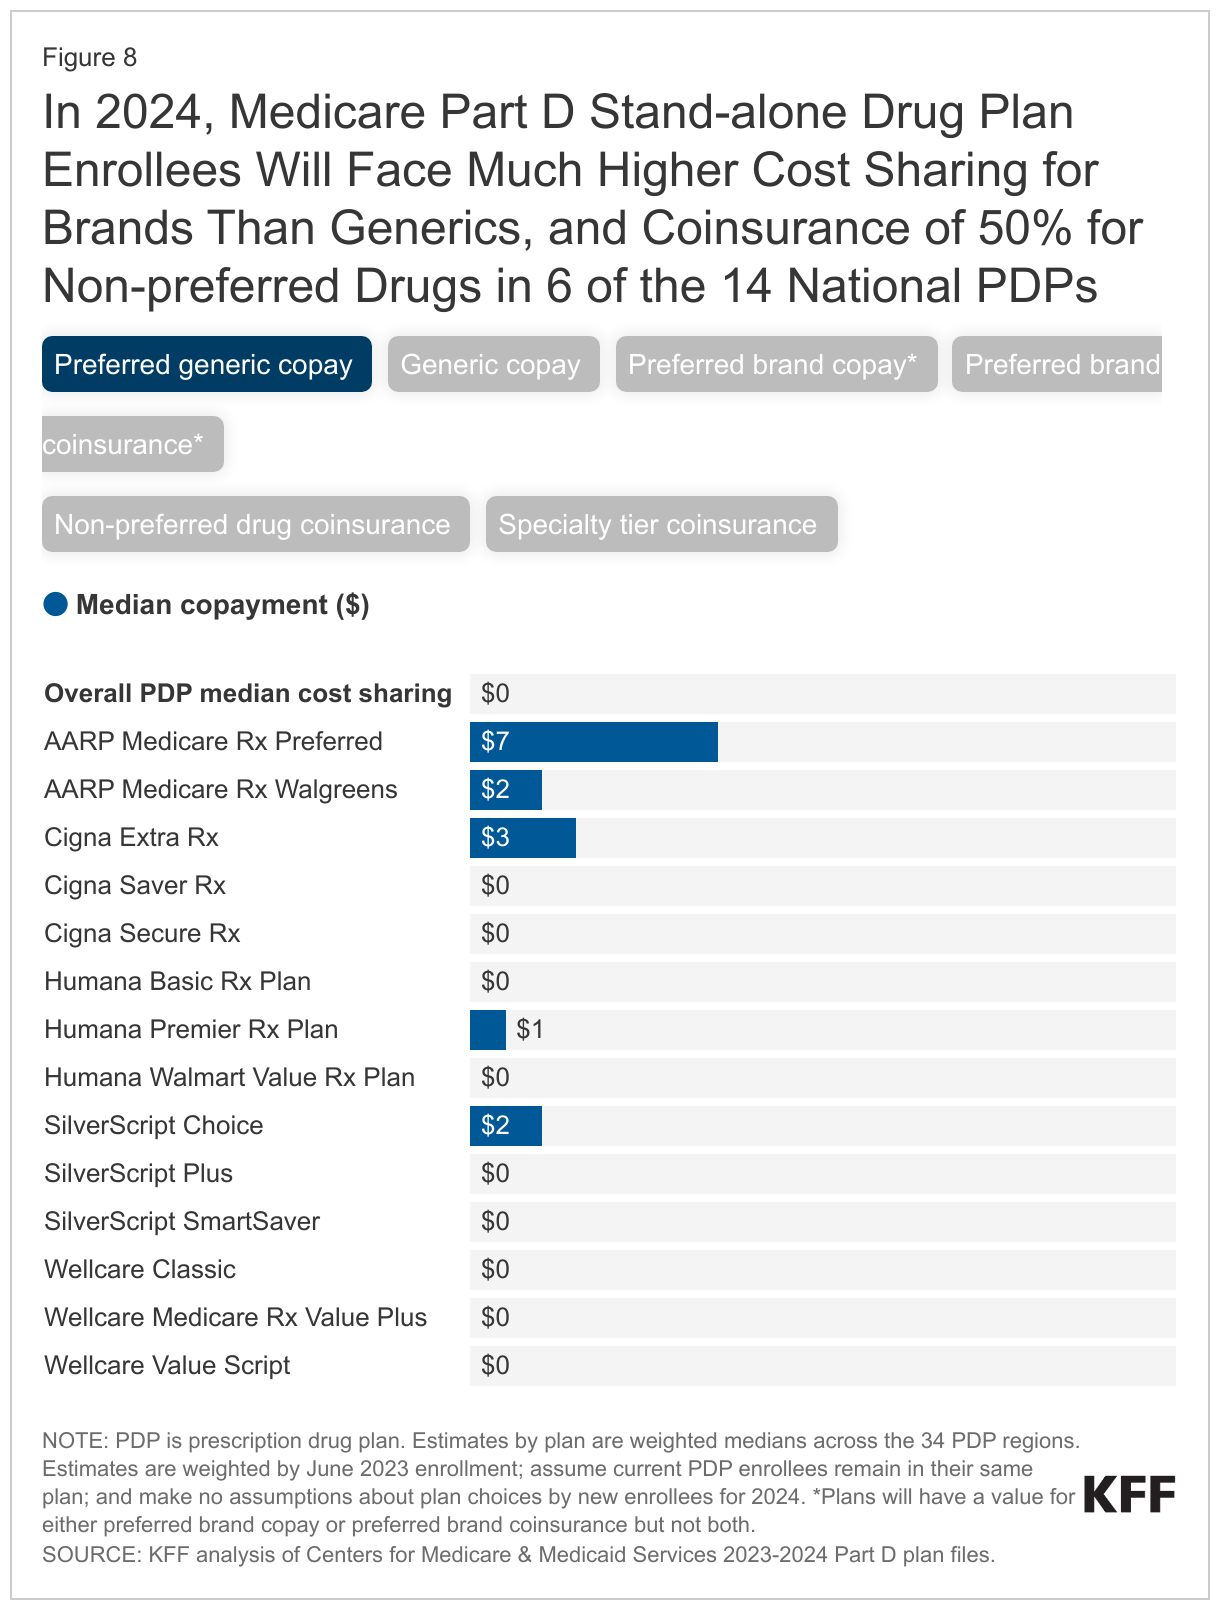
Among the 14 national PDPs, 9 PDPs will charge $0 for preferred generics in 2024, but copays of $40 to $47 or coinsurance of 16% to 25% for preferred brands, and coinsurance ranging from 39% to 50% for non-preferred drugs; 6 out of the 14 national PDPs are charging the maximum 50% coinsurance for non-preferred drugs. Coinsurance for specialty tier drugs ranges from 25% to 33% in these plans, with 7 of the 14 national PDPs charging 25% and 2 charging 33%. (Plans that charge the full deductible amount cannot charge more than 25% for specialty tier drugs.)
Low-Income Subsidy Plan Availability
In 2024, a Smaller Number of Part D Stand-Alone Drug Plans Will Be Premium-Free to Enrollees Receiving the Low-Income Subsidy Than in Any Year Since Part D Started
Through the Part D LIS program, enrollees with low incomes and modest assets are eligible for assistance with Part D plan premiums and cost sharing. More than 13 million Part D enrollees are receiving LIS, including 8.3 million (62%) in MA-PDs and 5.2 million (38%) in PDPs.
In 2024, a smaller number of PDPs will be premium-free benchmark plans – that is, PDPs available for no monthly premium to Medicare Part D enrollees receiving the Low-Income Subsidy (LIS) – than in any year since Part D started, with 126 premium-free benchmark plans, or less than 20% of all PDPs in 2024 (Figure 9). The number of benchmark plans available in 2024 will vary by region, from two to seven (Appendix Table 2).
PDPs offering basic benefits qualify to be benchmark plans if they have premiums below the benchmark amount in a given region. The benchmark is calculated as a weighted average of the beneficiary premiums for basic drug coverage offered by both PDPs and MA-PDs in a given region (calculated before taking MA rebates into account). (MA-PD premiums are included in this calculation even though MA-PDs do not qualify as benchmark plans.)
The reduction in the number of benchmark plans for 2024 is largely the result of PDPs offered by Cigna, Humana, and CVS Health qualifying as benchmark plans in far fewer regions in 2024 compared to 2023: Cigna Secure Rx (from 34 down to 16 regions); Humana Basic Rx Plan (from 27 down to 11 regions); and CVS Health’s SilverScript Choice (from 34 down to 11 regions).
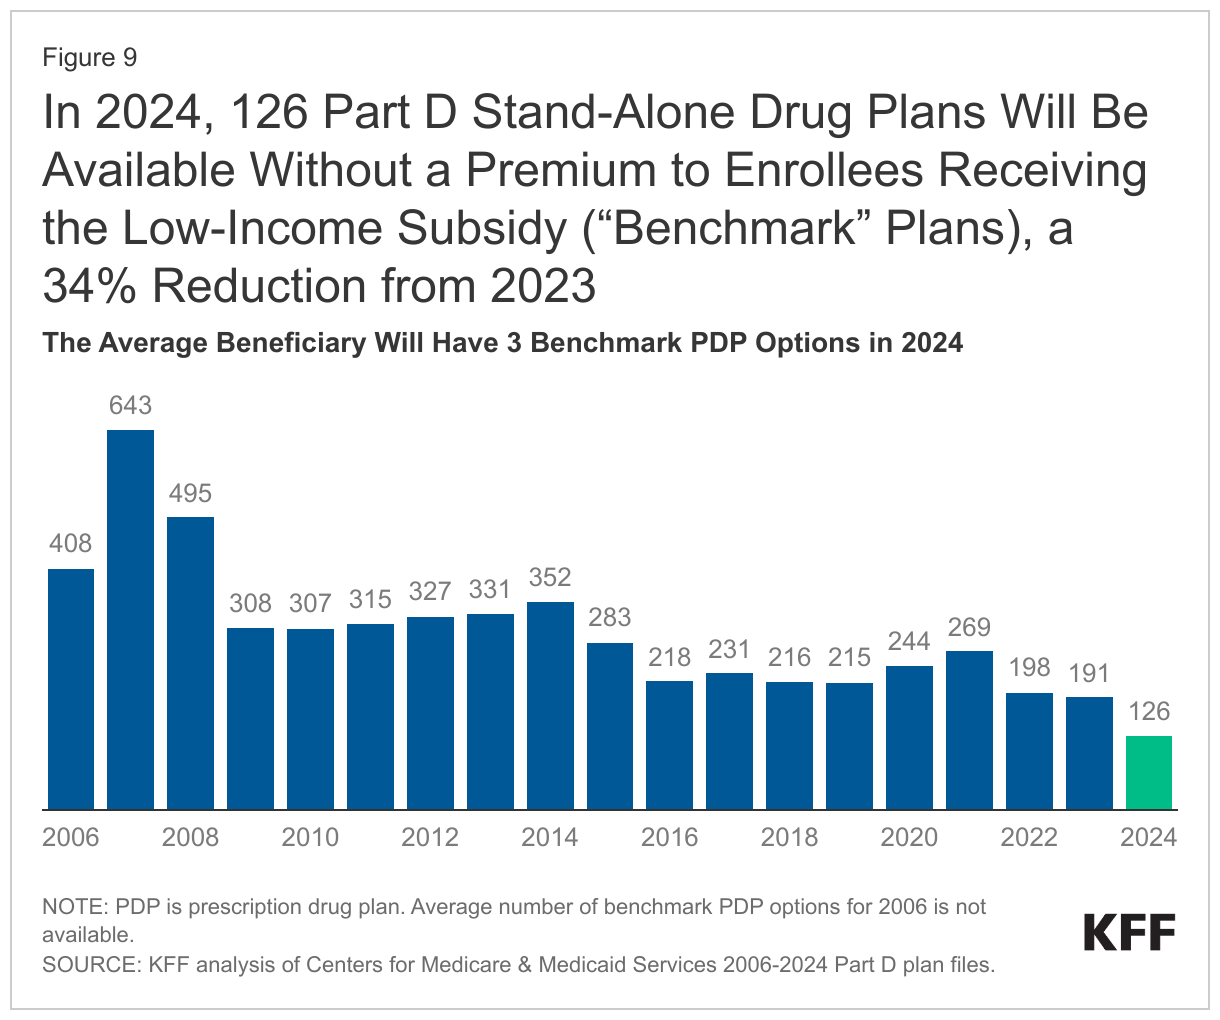
On average (weighted by 2023 Medicare enrollment), LIS beneficiaries have three benchmark plans available to them out of the average 21 PDPs available overall for 2024 – the lowest average number of benchmark plan options in any year since Part D started. All LIS enrollees can select any plan offered in their area, but if they enroll in a non-benchmark plan, they must pay some portion of their chosen plan’s monthly premium.
In 2024, half (49%) of all LIS PDP enrollees who are eligible for premium-free Part D coverage (2.4 million LIS enrollees) will pay Part D premiums averaging $15 per month unless they switch or are reassigned by CMS to premium-free plans. Among this group are the 1.9 million LIS enrollees in Cigna Secure Rx, Humana Basic Rx Plan, or CVS Health’s SilverScript Choice in the regions where these PDPs will no longer qualify as benchmark plans. These enrollees will need to switch plans for 2024 if they want to remain in a benchmark (premium-free) plan.
Discussion
The overall market for Part D coverage remains robust based on the overall number of plan options, but recent years have seen a growing divide in the Part D plan market between stand-alone PDPs, where the number of plans has generally been trending downward over time in conjunction with a reduction in PDP enrollment, and MA-PDs, where plan availability and enrollment have experienced steady growth.
The average weighted monthly premium for PDPs in 2024 will increase substantially over the 2023 amount (based on current enrollment), while premiums for drug coverage offered by MA-PDs are likely to remain stable (and low or zero). Provisions in the Inflation Reduction Act to make the Part D benefit more generous – such as the elimination of the 5% coinsurance requirement for catastrophic coverage taking effect in 2024 – will help lower out-of-pocket costs for enrollees, but with these changes, it could become harder for some Part D plan sponsors to offer low-priced coverage, particularly sponsors of stand-alone drug plans. MA-PD sponsors have a competitive advantage in this regard because they can use rebate dollars from Medicare payments to lower or eliminate their Part D premiums. The premium imbalance between PDPs and MA-PDs could be exacerbated as plans assume greater liability for high drug costs above the catastrophic threshold in 2025 with a $2,000 cap on out-of-pocket spending. To keep Part D premiums low in the face of rising costs for the basic Part D benefit, Medicare Advantage plans may end up using more of their rebate dollars to buy down the Part D premium. This could mean less rebate money available for other benefit enhancements or lower profits, depending on the amount of rebates plans receive in the future.
The increasing availability of low- or zero-premium MA-PDs, combined with the aggressive marketing of Medicare Advantage plans and the appeal of other features of these plans, such as supplemental benefits, could tilt enrollment even more towards Medicare Advantage plans in the future. Monitoring trends in Part D plan availability and enrollment could inform policymakers in considering whether or how to ensure continued availability of competitively priced stand-alone Part D drug plans for the millions of Medicare beneficiaries in traditional Medicare.
Juliette Cubanski is with KFF. Anthony Damico is an independent contractor.
Methods
This analysis focuses on the Medicare Part D stand-alone prescription drug plan marketplace in 2024 and trends over time. The analysis focuses on the 18.3 million enrollees in stand-alone PDPs (as of March 2023). The analysis excludes 24.8 million MA-PD enrollees (non-employer), and another 3.9 million enrollees in employer-group only PDPs and 3.5 million in employer-group only MA-PDs for whom plan premium and benefits data are unavailable.
Data on Part D plan availability, enrollment, and premiums were collected from a set of data files released by the Centers for Medicare & Medicaid Services (CMS):
- Part D plan landscape files, released each fall prior to the annual open enrollment period
- Part D plan and premium files, released each fall
- Part D plan crosswalk files, released each fall
- Part D contract/plan/state/county level enrollment files, released monthly
- Part D Low-Income Subsidy enrollment files, released each spring
- Medicare plan benefit package files, released periodically each year
In this analysis, premium and deductible estimates are weighted by June 2023 enrollment unless otherwise noted. Percentage and dollar differences are calculated based on non-rounded estimates and in some cases differ from percentages and dollar differences calculated based on rounded estimates presented in the text.
Appendix Tables